Article

An Indirect Method for Accurate Identification of Short-Pitch Rail Corrugation Using Vehicle Interior Noise and Vibration Measurements and Train–Track Transfer Functions

1
School of Urban Railway Transportation, Shanghai University of Engineering Science, Shanghai 201620, China
2
Railway Engineering Research Institute, China Academy of Railway Sciences Corporation Limited, Beijing 100081, China
*
Authors to whom correspondence should be addressed.
Appl. Sci. 2025, 15(22), 12262; https://doi.org/10.3390/app152212262
Submission received: 18 October 2025 / Revised: 10 November 2025 / Accepted: 13 November 2025 / Published: 19 November 2025
(This article belongs to the Special Issue Advances in Machinery Fault Diagnosis and Condition Monitoring)

Featured Application

The proposed method can be applied by railway operators, without physically entering track possessions, to efficiently and effectively identify rail corrugation location and dynamic characteristics to assist with track maintenances.

Abstract

Short-pitch rail corrugation is commonly found at curves or resilient track structures of the metro system, causing fatigue failure of key components of the train–track system. Currently, rail corrugation is detected via routine inspections during the possession period, with the compromise between inspection efficiency and data accuracy. A newly proposed indirect diagnosis method for rail corrugation has been proposed. Rail corrugation dynamic characteristics and location can be quantitatively identified by measuring train vehicle interior noise and vibration response of a running train under the normal operation conditions, without requiring track access, together with transfer functions—including receptance and accelerance of the wheel–rail system. This indirect method has been applied to and tested on a rail track section with severe corrugation at curves. Results from the indirect diagnosis method are then compared against direct rail roughness measurement using a standard Corrugation Analysis Trolley. Good agreements of peak magnitudes and corresponding frequency bands have been achieved. The indirect method has been successfully validated and can be used to assist track maintenances.

1. Introduction

1.1. Rail Corrugation

Wear on the rail surface is a common form of damage in wheel–rail systems. Rail corrugation is a periodic wear and plastic deformation that occurs along the longitudinal direction of the rail on the rail head tread, presented as a wavy rail surface irregularity, as shown in Figure 1.
Rail corrugation has been an intrinsic problem to all forms of railway systems. Scholars and practical engineers have been investigating and trying to understand rail corrugation since as early as the beginning of the twentieth century [2]. Research works in this area have been conducted using theoretical or experimental methods, or computational modelling. In the early 1990s, rail corrugation using friction-induced vibration theory was examined by assuming that corrugations are formed by torsional vibration of the drive wheels and by longitudinal vibration of the rails [3]. Site investigations on the Baltimore Metro have been carried out, where the rail corrugation problem is present, including trackside and on-board tests, in order to define the initiation and growth processes of rail corrugation [4]. A linear analytical model has been employed as a tool to design track modifications to prevent the growth of rail corrugations on the Paris Mass Transportation Authority network, followed by a full-scale test on a metro line [5]. Grassie and Kalousek [6,7,8] defined six types of rail corrugation according to their characteristics and formation mechanism; the components of a general corrugation mechanism have been first proposed herein. A considerable amount of work has been performed by ERRI and its predecessor ORE on topics related to wheel–rail contact in the areas of rolling contact fatigue, reduction in corrugation, and railway noise [9]. Computational models have been developed to predict rail head corrugation growth, with non-linear development of the rail head profile caused by millions of wheelset passages [10]. The influence of properties of different components of the track structure on rail corrugation has also been looked into, such as sleeper distance [11], sleeper pitch [12], and rail-pad stiffness [13,14]. Rail corrugation characteristics varied by other influential factors has also been studied, such as by weather and environmental effects [15], variation in train speed [16,17,18], and locomotive traction characteristics [19].
Rail corrugation on curved tracks also drew attention not only in academia, but also in industry [20,21,22,23,24,25].
Entering the millennium, as computation power began to develop, more scholars started to use computational simulations to study rail corrugation. A two-dimensional contact model was developed to investigate the formation of short-pitch corrugation on the rail head by combining wheel–track dynamics, contact mechanics, and wear [26]. Rail corrugation generated by three-dimensional wheel–rail interaction has been investigated using a time domain model, with the conclusion that a high corrugation growth at certain wavelengths is related to specific vibration modes of the coupled train–track system [27].
It has been well-established that rail corrugations are often found at curved rail track sections, especially those with small radii, and at resilient or ‘soft’ track structures. The effect of discrete track support by sleepers on rail corrugation at a curved track was examined using a numerical model with a combination of the Kalker’s rolling contact theory with non-Hertzian form, a linear frictional work model, and a dynamics model of a half railway vehicle coupled with a curved track. The conclusion was that the contact vibrating between the curved rails and the four wheels of the same bogie has different excitation frequencies, which initiate and develop corrugation at curves [28]. A comprehensive set of works comprising the establishment of numerical modelling using a non-Hertzian and non-steady wheel–rail contact model, field testing in sharp curves on a railway metro, and the comparison of outputs from the two methods were carried out. The findings showed that corrugation wavelengths observed on the curve are related to excitation of the first symmetric and first antisymmetric bending modes of the leading wheelsets [29,30,31]. The effect of non-uniform train speed distribution on rail corrugation growth in curves was examined, quantifying the relationship between the mean or skewness of the distributed set of passing speeds and the rate of corrugation growth [17].
Over time, railway forms change, e.g., track form, track components, and train vehicle features. The focus on corrugation has gradually expanded, from damages to rail tracks to railway noise, vibration nuisance, and environmental issues, as well as passengers and inhabitants along the railway route. The effects of rail corrugation on metro interior noise have been looked into, including the identification of the characteristics of in-car noise caused by the excitation from rail corrugation, and the recommendation of suitable rail grinding schemes [32].
Short-wavelength corrugation, as defined in [6], is most frequently seen in metro lines with sharp curves and resilient track structures, where the support of rails is of lower stiffness and the lateral stability is usually poor. It is caused by the discrete support form of the rail, such as every 0.6 m between two rail fasteners and sleepers. Pinned-pinned resonant frequency is the characteristic frequency of short wavelength corrugation.
Rail corrugation has long been an inevitable problem for track engineers and railway operators. Commonly adopted mitigation measures include (i) rail grinding [32,33], which significantly reduces the life-span of rails and tends to be expensive; (ii) lubrication [34], with limited effectiveness and potential safety hazards; and (iii) rail dampers [35,36,37,38], which is only effective when designed according to the system’s dynamic characteristics, e.g., tuned dampers at pinned-pinned frequency ranges. For mitigation measures to be applied appropriately and with noticeable effectiveness, the measurement and identification of the exact location and dynamic characteristics of rail corrugation along rail tracks are essential.

1.2. Conventional Diagnosis Methods for Rail Corrugations

There are mainly two categories in terms of conventional measurement methods for rail corrugation.
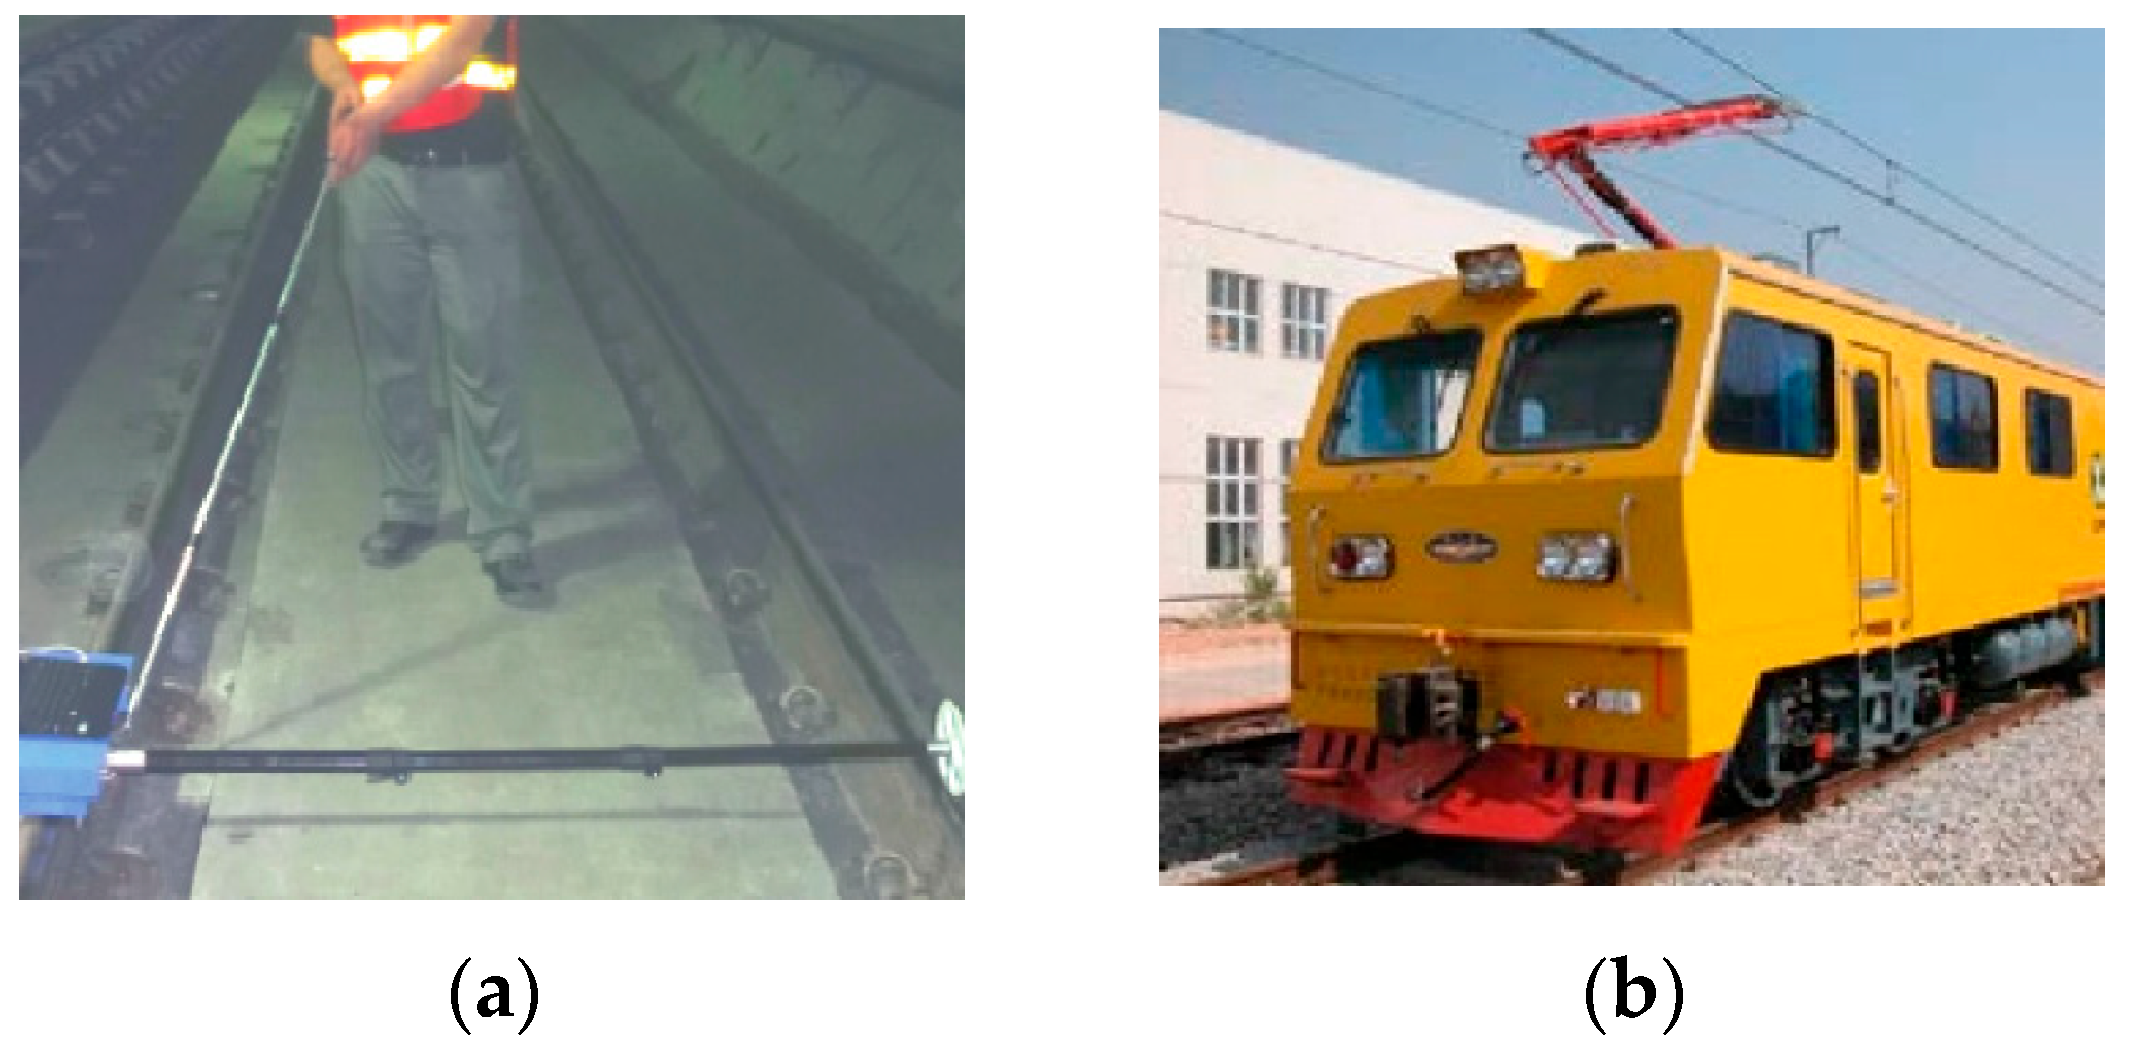
One category consists of hand-held measurement devices such as the Corrugation Analysis Trolley (CAT) (Figure 2a) [39], which collects rail roughness information at walking speeds, capable of achieving relatively high measurement accuracy, but with lower measurement efficiency.
On the other hand, track inspection vehicles (Figure 2b) travel at higher speeds, such as between 5 km/h and 35 km/h, but largely compromise measurement quality and accuracy. This is especially so in the case of urban rail systems such as metros, where short-pitch corrugation featuring short wavelengths, typically in the range of 30 to 100 mm, is more predominant over other types of rail corrugation.
Table 1 below summarises the pros and cons of the abovementioned direct measurement methods.
Moreover, all abovementioned direct measurement methods require access to the track area within limited possession time every night, typically no more than three hours per night; therefore resulting in an overall low efficiency.

2. Research Methodology

2.1. The Proposed Indirect Diagnosis Method

Wheel–rail interaction is one of the two complex dynamic coupling problems in railway engineering, the other one being the pantograph-and-catenary coupled system; both are multi-degree-of-freedom (MDOF) systems.
Wheel and rail roughness, especially irregularities such as rail corrugation, is a result of the unsteadiness in the dynamic system. Roughness of rail comprises a wide range of wavelengths, some being periodical while others are random. As mentioned, corrugation is a type of periodical roughness with fixed wavelengths. Usually, railway trains run at a fixed speed range at certain track sections as per requirements from scheduling and operations, so it is likely—at a rail corrugation track section—to find one or more characteristic frequencies with apparent corrugation depth, and these characteristic frequencies correspond to the superimposition of fixed wavelengths. On the other hand, at rail track sections without corrugation, it is more likely that rail roughness features wide-spread frequencies without apparent fixed wavelengths.
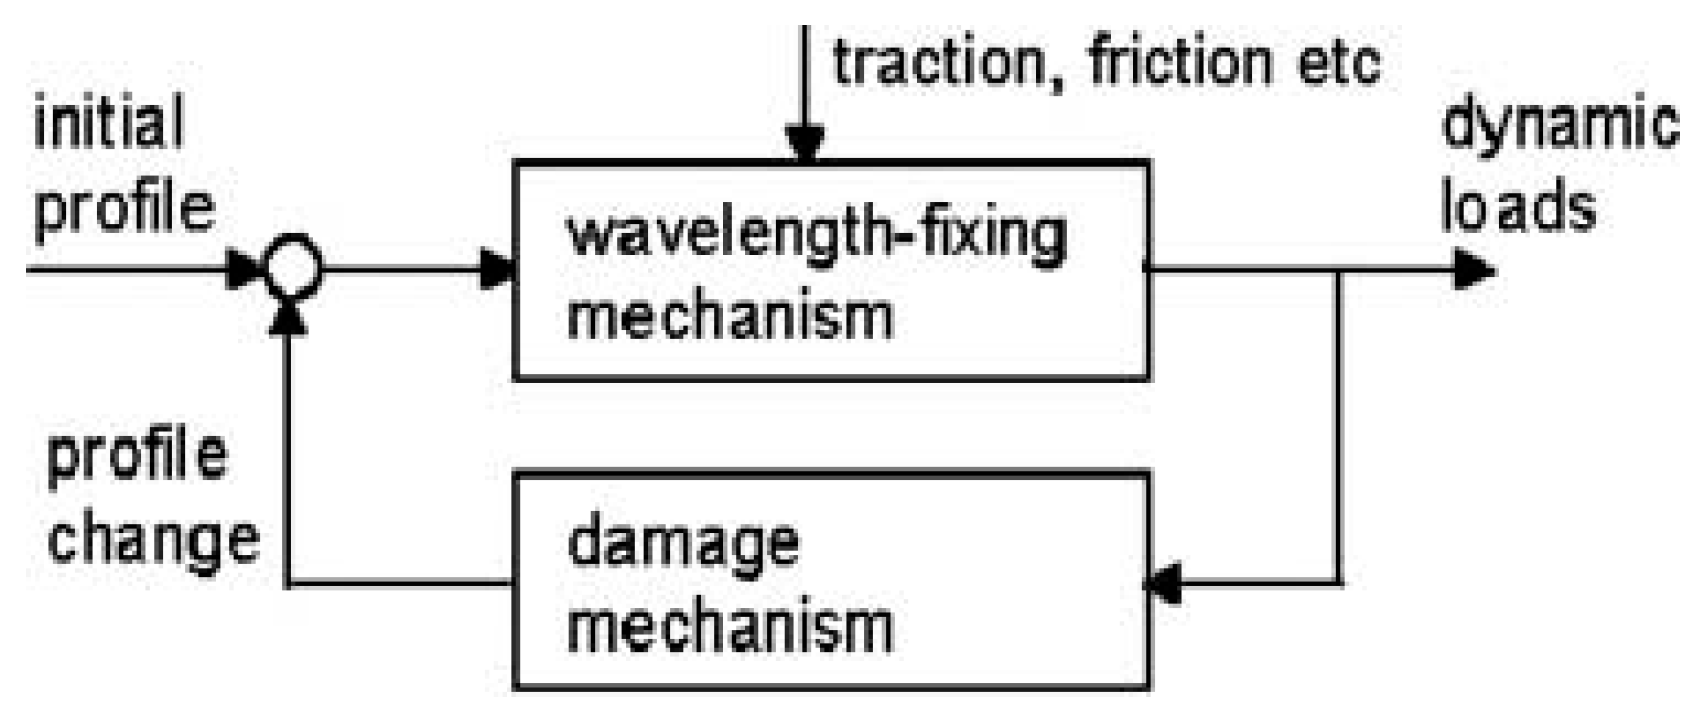
The classic rail corrugation mechanism for rail corrugation is a process defined in Figure 3 below. Rail corrugation is a result of the initial profile, which comprises built-in features of the wheel and rail system, and dynamic wheel–rail interaction forces.
For any dynamic coupling system, the system input to output is governed by the system transfer functions, which are intrinsic properties for a specific system. For instance, in the problem of rail corrugation and wheel polygonisation due to dynamic wheel–rail interaction, for a specific train vehicle on a specific rail track, the structure and conditions of the train–track system determine the transfer functions of this system. The essence of this newly proposed indirect method for the identification of short-pitch corrugation is to establish the relationship between the dynamic response, i.e., the output of the system, and the rail corrugation, which is a type of periodic excitation with salient characteristic frequencies in the roughness profile as the input, through transfer functions of the complex MDOF dynamic system.
System transfer functions in terms of accelerance can be used to establish the relationship between response measured inside running train vehicles and the instantaneous dynamic excitation forces at the wheel and rail interface. And the total wheel–rail roughness can be related to the instantaneous dynamic forces through receptance, which is the inverse of the dynamic stiffness of the wheel–rail system. So, roughness can be obtained through the measurement of interior dynamic response with transfer functions of the MDOF dynamic system.
Furthermore, it is reasonable to assume that the mechanical properties and structural conditions of bogies and wheels of a specific train remain unchanged during the trip when interior dynamic response measurement is undertaken; therefore, the location of rail corrugation can be identified along the rail track.
In practical terms, the train–track system is complex in the sense that there are many factors to consider when using in-car response signals to identify the roughness of the rail.
Firstly, track lines have both straight and curved sections, and the track consists of two rails. Particularly in curved sections, the outer rail and inner rail have different conditions due to the design of the cant. Therefore, it is necessary to consider the asymmetrical features of the inner and outer rails.
Secondly, for the train–track system in the operation condition, the interaction force between the wheels and the rails is the primary excitation source. Each interaction force between the wheels and the rail includes not only the normal contact force but also the longitudinal rolling/sliding force and the lateral sliding force. This means that the influence of different directions of wheel–rail force excitations on the in-car response needs to be considered, especially the vertical force and lateral force.
Also, in terms of the direction of the surface roughness of the rail, due to the complex curve of the wheel–rail tread and its worn section, the wear on the rail head also includes the top surface and side surfaces of the rail. Therefore, in addition to the vertical roughness, the lateral roughness of the rail needs to be the primary focus when considering the roughness of the track.
This indirect method is advantageous not only because it allows for rapid diagnosis using existing operational vehicles without the need to install any sensors outside the train vehicle or on the track, but also because it does not require entering the track or using specialised equipment or testing vehicles.
In the following sub-sections, the relationship between the multi-dimensional dynamic wheel–rail force as the input in an MDOF system, and the output—which are train vehicle interior responses—through the system’s transfer functions, is explained in detail.

2.1.1. The Relationship Between Roughness and Wheel–Rail Force

The interaction force between the wheel and rail is mainly dominated by the wheel–rail dynamic contact characteristics and the wheel–rail irregularities (i.e., roughness). The dynamic contact characteristics can be represented using rail receptance, wheel receptance, and wheel–rail contact receptance.
In the wheel–rail system, the small-scale irregularities (i.e., roughness) at the contact area between the wheel tread and the rail surface may cause relative displacement excitation, trigger the interaction between the wheel and the rail, and thus generate dynamic wheel–rail forces. The relationship between the total roughness R T , system receptance α, and the wheel–rail excitation force F is as per Equations (1) to (4).
R T = α F
R T = R r + R w
α = α r + α w + α c
α c = K H 1
where R r and R w denote the rail roughness and the wheel roughens, respectively; α r ,   α w , and α c denote the rail receptance, wheel receptance, and wheel–rail contact, receptance; and K H is the linearized contact spring stiffness between the wheel and the rail. Theoretically, when calculating total roughness from rail roughness and wheel roughness using Equation (2), a contact patch filter has to be applied.
Total receptance can also be obtained experimentally, through a standard impact hammer test. For a train–track dynamic system, due to the system with multi-degree-of-freedom, as mentioned for the proposed indirect diagnosis method, the total receptance can be written as Equation (5) in a matrix format, and this can be applied to the rail receptance, wheel receptance, and wheel–rail contact receptance as well.
α = α L L α L R α R L α R R   w h e r e α L L = α z z α z y α y z α y y L L ,   α L R = α z z α z y α y z α y y L R , α R L = α z z α z y α y z α y y R L ,   α R R = α z z α z y α y z α y y R R
where α L L   a n d   α R R denote the system’s direct receptance with sub-matrix at the left-hand side (LHS) and right-hand side (RHS) wheel–rail respectively; α L R   a n d   α R L denote the system’s cross receptance with sub-matrix between the left-hand side and right-hand side wheel–rail, and between the right-hand side and left-hand side wheel–rail, respectively. In the sub-matrix, subscripts z ,   y denote the z- and y-directions in a standard 3D Cartesian coordinate system in railway engineering. In a standard 3D Cartesian coordinate system in railway engineering, x is the longitudinal direction, which runs along the train; y is the lateral direction perpendicular to the track centre-line in the same plane as the x-direction; and z is the vertical direction, perpendicular to the rail tracks and track-bed. So, α z z , α y y are direct receptance with force and response in the same direction, and α z y , α y z are the cross receptance where either force exerts vertically with lateral response, or vice versa.

2.1.2. The Relationship Between the Wheel–Rail Force and Vehicle Interior Responses

Assuming that the roughness and interior noise and vibration are generally stationary stochastic processes, for a multi-degree-of-freedom system, a linear relationship by the accelerance matrix H can be expressed through the wheel–rail excitation force vector F and the vehicle interior noise and vibration response vector A , as per Equation (6) below:
A = H F
In the above equation, interior response A includes three-dimensional parameters: vertical vibration acceleration, A z , lateral vibration acceleration, A y , and noise p , measured on both sides inside the train carriage. The response vectors A L and A R can be presented as per Equation (7) below:
A = A L A R   w h e r e A L = A z A y p L   a n d   A R = A z A y p R
Likewise, excitation forces from both sides of the wheel–rail interaction include two directions (namely vertical excitation in the z-direction and lateral excitation in the y-direction) on the left-hand side, FL, and right-hand side, FR, respectively:
F = F L F R   w h e r e F L = F z F y L   a n d   F R = F z F y R
The accelerance matrices H consist of transfer function components from either the left- or the right-wheel–rail excitation, and either side of the interior response is calculated as per Equation (9):
H = H L L H L R H R L H R R   w i t h H L L = H z z H z y H z p H y z H y y H y p L L ,   H L R = H z z H z y H z p H y z H y y H y p L R , H R L = H z z H z y H z p H y z H y y H y p R L ,   H R R = H z z H z y H z p H y z H y y H y p R R .
In Equations (7)–(9), subscripts z   a n d   y denote the z- and y-directions, i.e., vertically and laterally, respectively; p denotes noise response; subscripts in capital L   a n d   R denote the left-hand side (LHS) and right-hand side (RHS) of both excitations and responses of the train–track system.
Equation (6) can then be re-written in the following form to show the complex wheel–rail excitation in vertical and lateral directions on both sides of the train–track system, and responses in terms of vertical and lateral accelerations and noise:
A L A R = H L L H L R H R L H R R F L F R

2.1.3. Rail Corrugation Diagnosis Using Interior Response and Transfer Functions

From Section 2.1.1 and Section 2.1.2, the roughness for both sides can be related to interior responses through Equation (11):
R T = α F = α F d
where R T is the total roughness matrix for both rails, which are in both vertical and lateral directions, and can be written as
R T = R T L R T R   w h e r e R T L = R T z R T y L   a n d   R T R = R T z R T y R
Once again, subscripts z ,   y denote the vertical and lateral directions, and L ,   R denote the left- and the right-hand rail.
F d in Equation (11) is the dynamic train–track interaction force and can be obtained by interior noise and vibration measurements from the running test train, A d , and the accelerance, H , according to Equation (13).
F d = H 1 A d
F d and A d , similarly to F and A , both contain components in the vertical and lateral directions on both sides along the track direction, as shown in Equations (14) and (15).
F d = F d L F d R   w h e r e F d L = F d z F d y L   a n d   F d R = F d z F d y R
A d = A d L A d R   w h e r e A d L = A d z A d y p d L   a n d   A d R = A d z A d y p d R
Again, subscripts z and y denote the z- and y-directions, i.e., vertically and laterally; L   a n d   R denote LHS and RHS.
Therefore, Equation (11) can be re-written in the form of Equation (16), in terms of interior measurements and system transfer functions, i.e., accelerance H , as per Equation (9) and wheel–rail receptance α , as per Equation (5).
R T = α F d = α H 1 A d
Both the receptance and the accelerance are intrinsic features of a dynamic system. In other words, for the combination of a fixed track structure and a specific train vehicle, receptance α and accelerance H are both fixed and can be obtained by numerical simulation, or by a standard impact hammer test on the test train–track system.

2.1.4. Separation of Wheel and Rail Roughness

In the low vibration track section, rail roughness can be considered as negligible comparing to that at corrugation sections. It can therefore be assumed that wheel roughness is dominant at the straight-line section, and is equivalent to the total roughness between the two curved rail track sections in this case. The wheel roughness is unchanged throughout the test along the rail direction, and the rail roughness can be deducted using Equation (2). The rail roughness at a certain position is the totality of components of different wavelengths, wherein the roughness fixed at a certain wavelength is referred to as rail corrugation.

2.2. Implementation of the Proposed Indirect Method and Validation

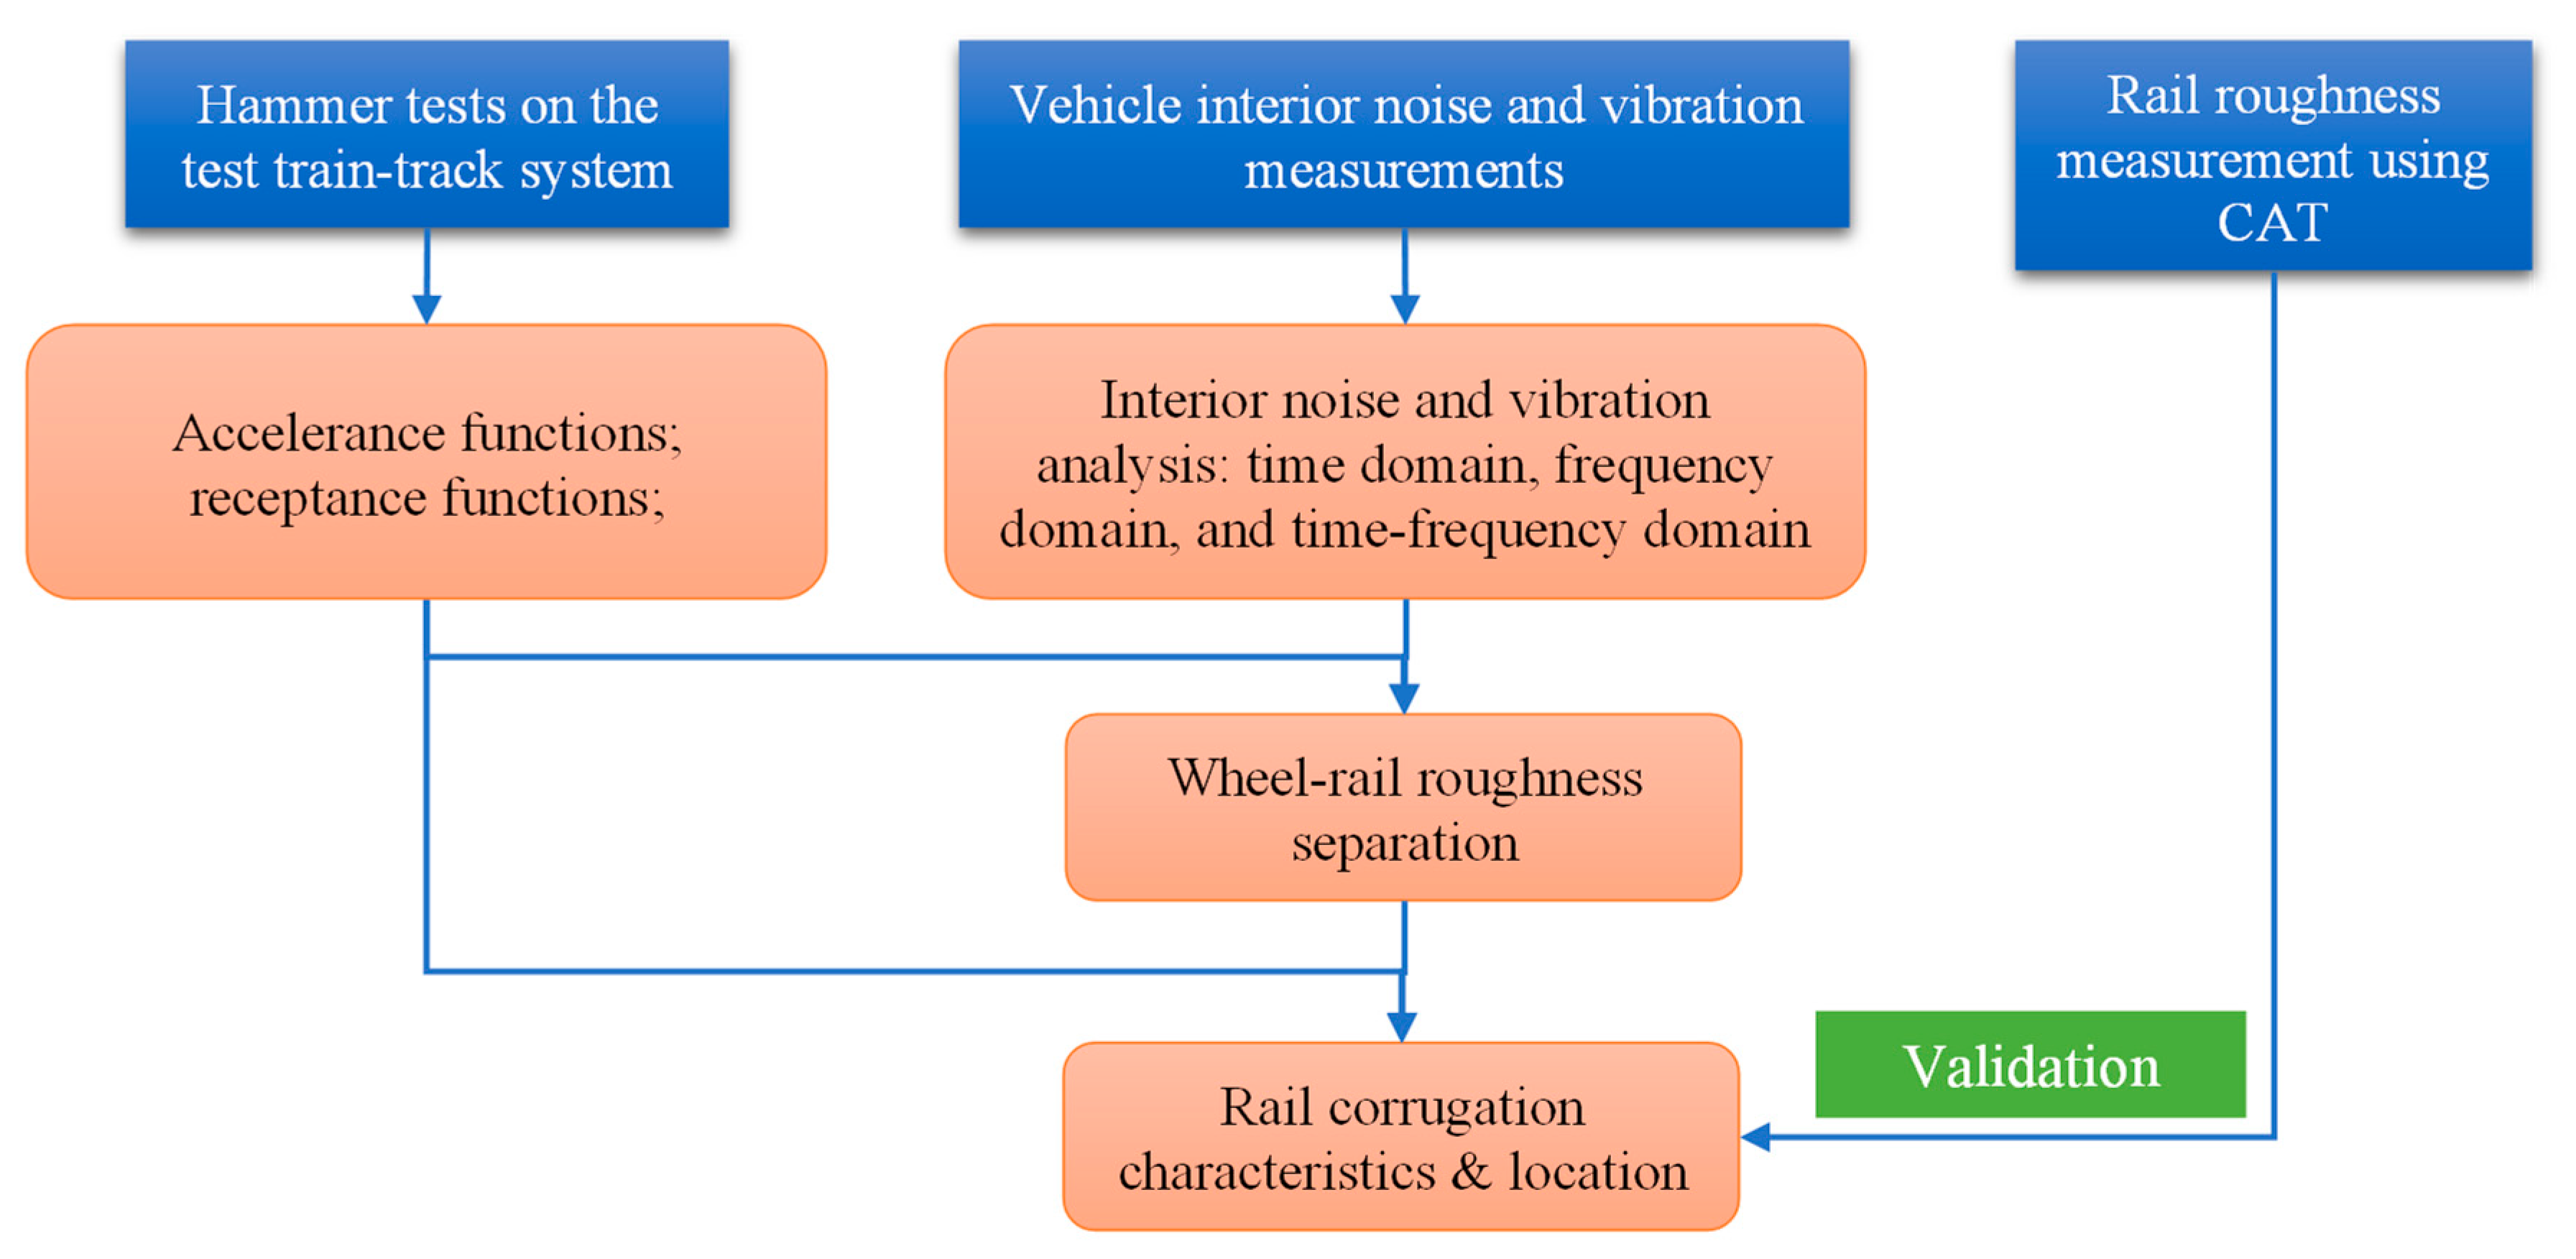
In this study, discontinuous rail corrugation has been found by a visual inspection on a 1.861 km track section of a busy metro line. Based on the indirect method proposed herein, a set of measurements have been carried out, including interior noise and vibration measurements and analysis, hammer impact tests for the accelerance functions and receptance functions of the test wheel–rail system, as well as rail roughness measurements using CAT and its own analysis software CAT 5.1.1, for the use of validation. A schematic of the proposed indirect method is shown in Figure 4 below.

3. The Test Train–Track System

The test rail track section, Line A in Figure 5, includes three curves, one right-curve named C1 and two left-curves, C2 and C3. C1 and C2 at the bend form an S-curve. From small mileage to large mileage, the plan radius of the S-curve and C3 are 550 m and 1200 m, respectively, and the exact location of the S-curve and C3 are from K0.313 to K0.565, and from K1.597 to K1.745, respectively. Cologne egg rail fasteners, which is a type of vibration isolation rail fastening system with low supporting stiffness, are used from K0.313 to K0.780 and from K1.410 to K1.745. For easier references, the test track A is redefined according to its geometry and type of fasteners in nine sub-sections (Table 2).
The train vehicle is the standard type A vehicle in the Chinese metro system, with a nominal axle load of 16 T.

4. Transfer Functions of the Test Wheel–Rail System

4.1. Experimental Setup

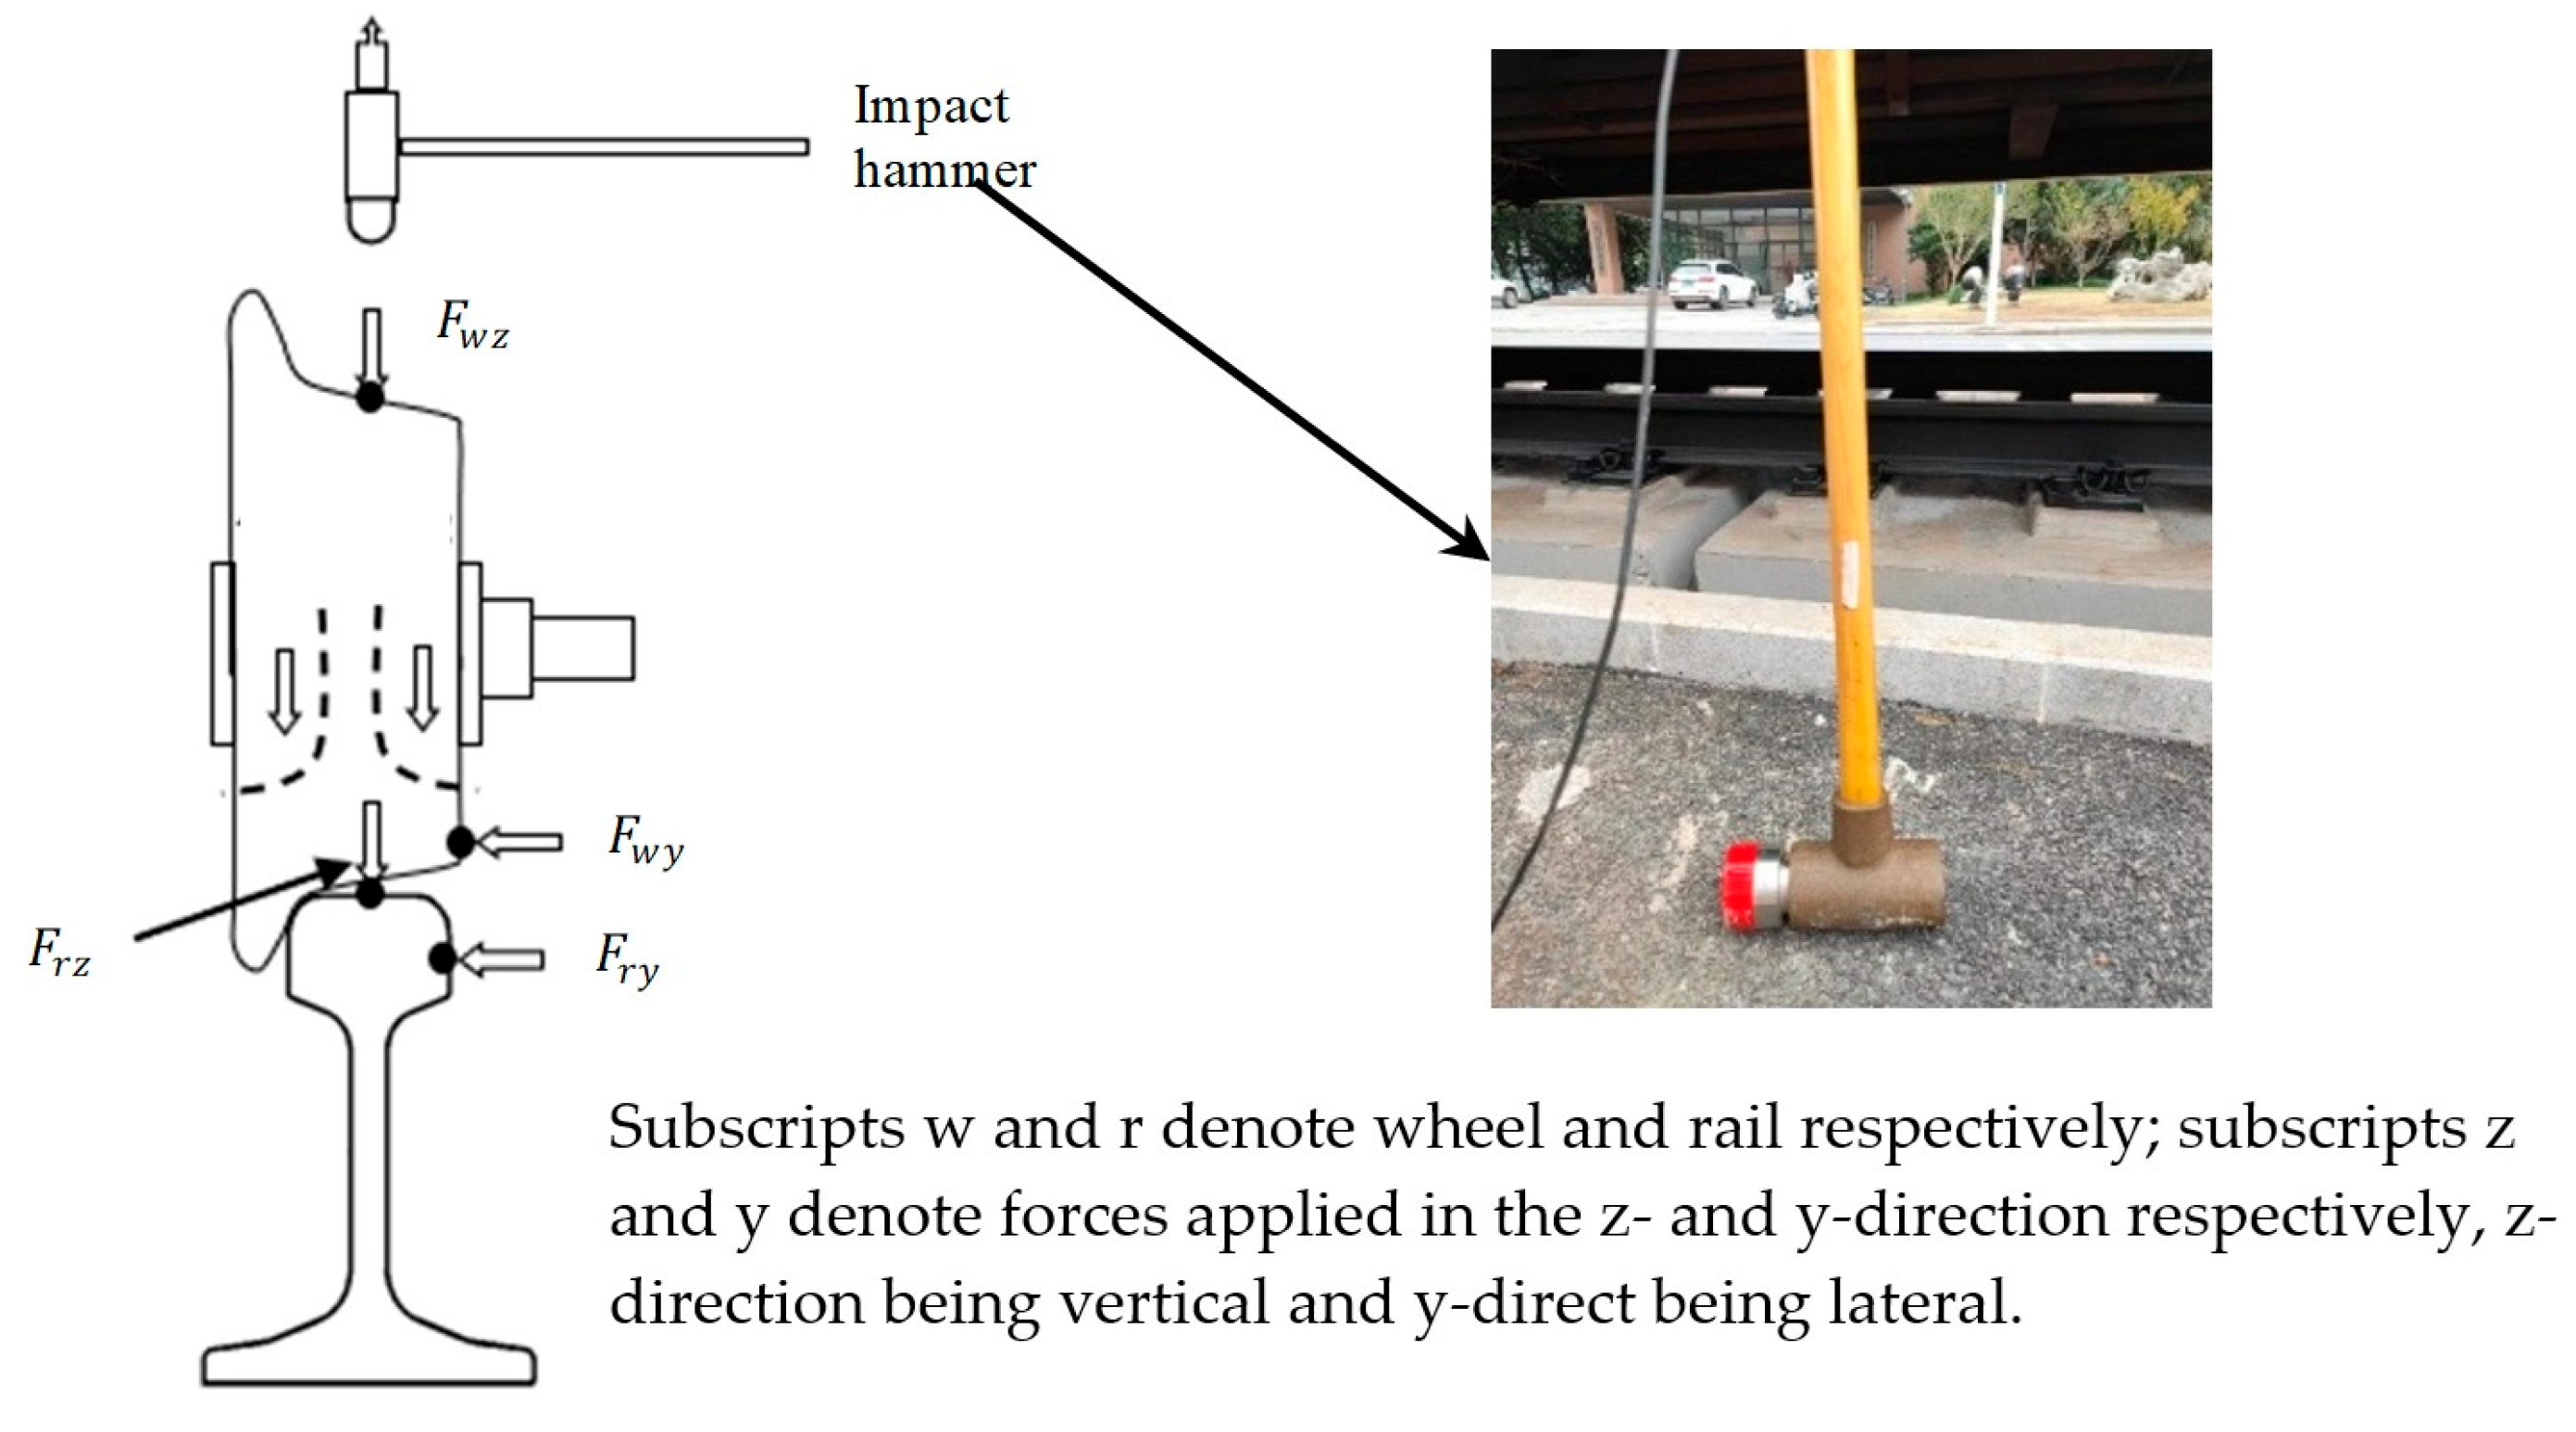
A set of standard impact hammer tests have been undertaken on the test train of the type A vehicle to establish the transfer functions of the wheel–rail interaction force and vehicle interior response measurements. A 5 kN impact hammer was used for the wheel as the input force (Figure 6). Accelerometers and microphones were installed on both sides inside the train carriage above the excitation points (Figure 7).
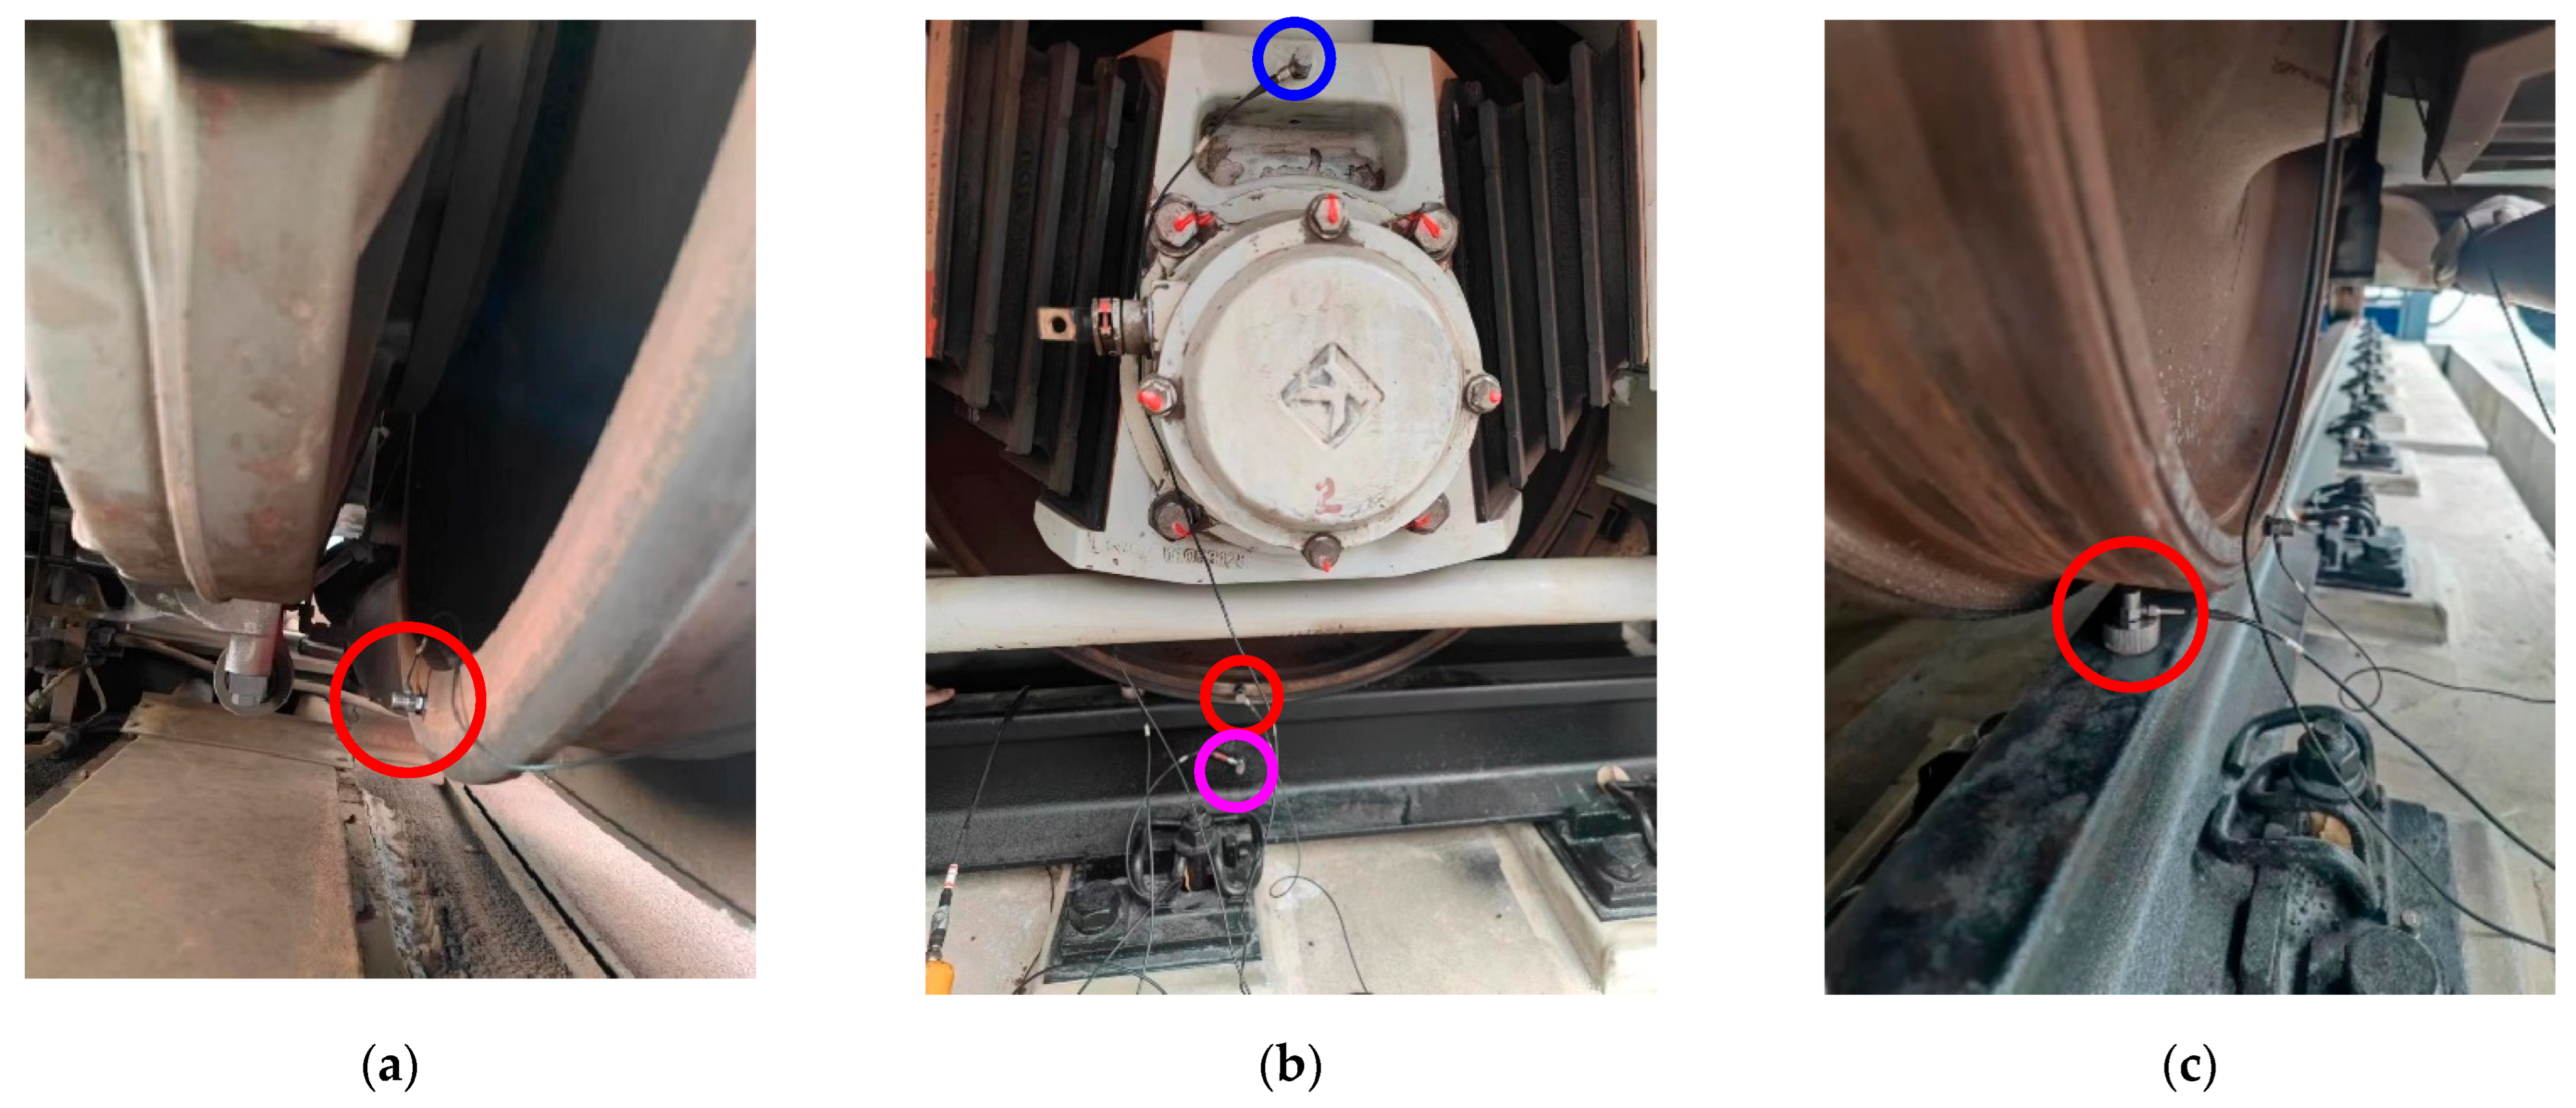
For receptance functions, accelerometers were installed on the right rail, in both vertical and lateral directions, as shown in Figure 8c and circled in magenta in Figure 8b respectively; and on the RHS wheel, as shown in Figure 8a and circled in red in Figure 8b. Appropriate types of sensors are chosen at relevant measurement points. For example, where high-frequency response is important at the wheel–rail interface, accelerometers with measurement range up to ±500 g pk were selected. On the other hand, where relatively low frequency range is expected on the train carriage floor, accelerometers with lower measurement range, up to ±5 g pk, were selected in order to achieve higher measurement accuracy. Key property parameters of sensors are summarised in Table 3.
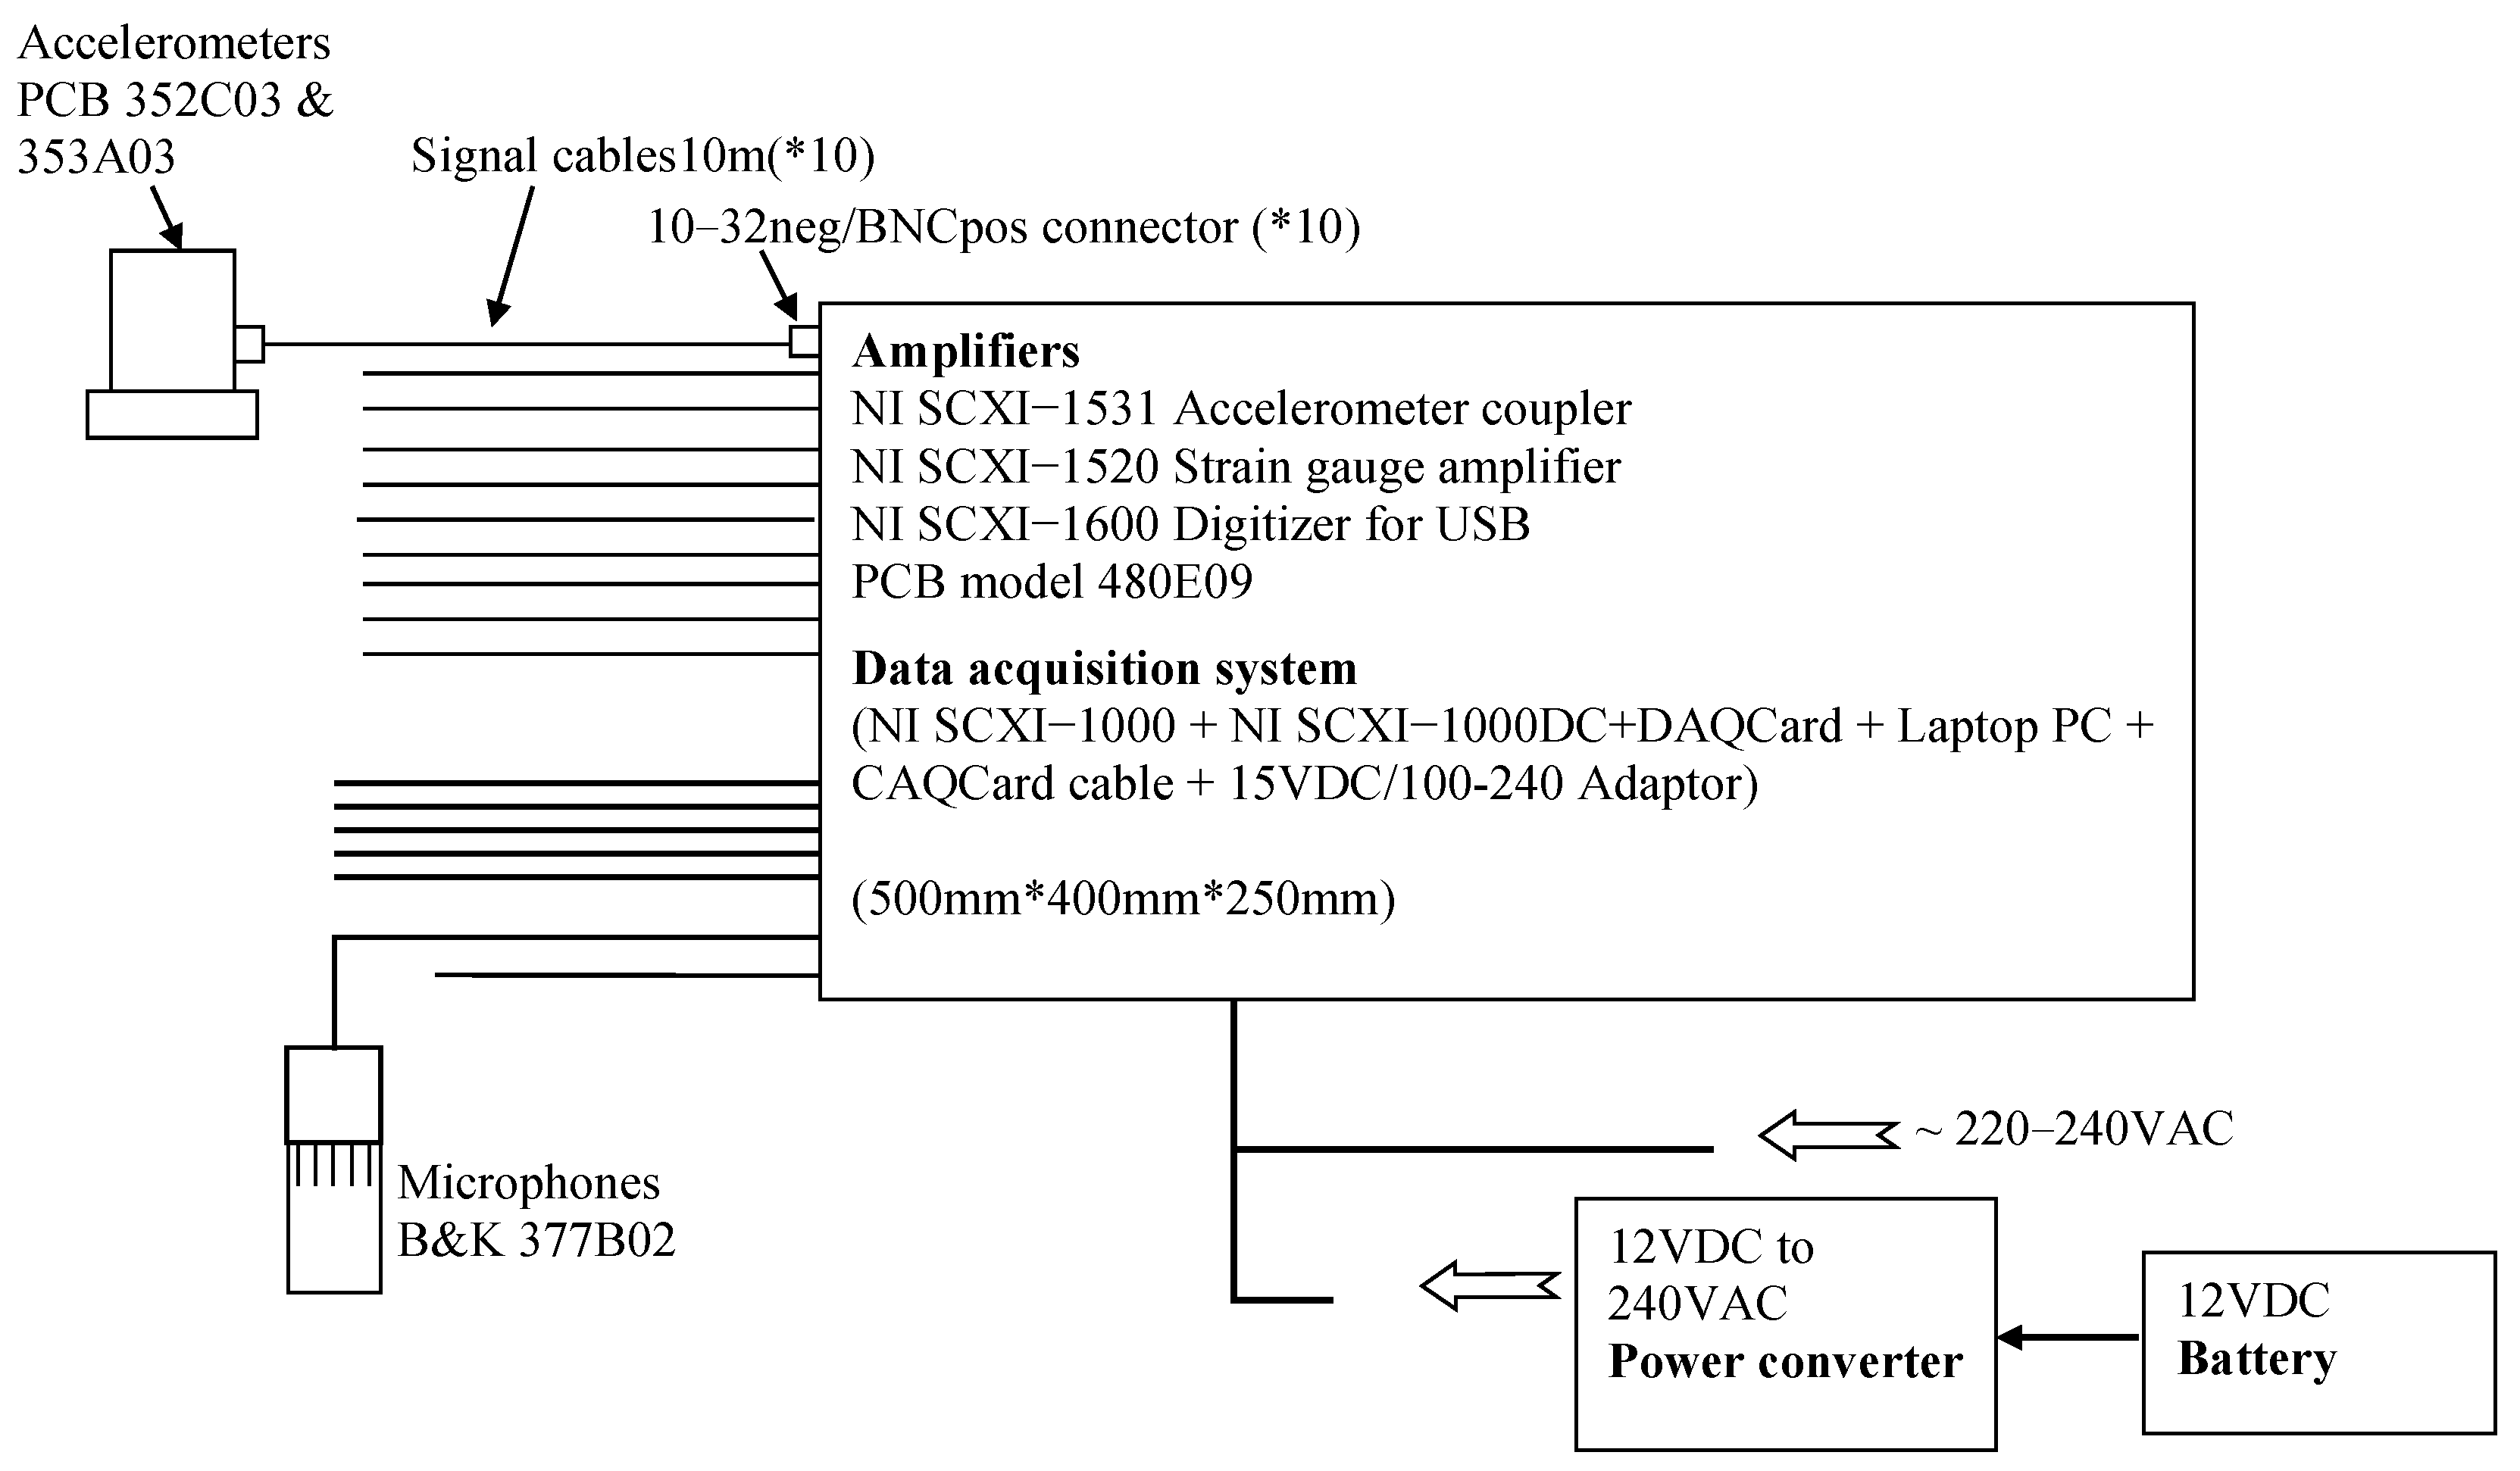
Measurement data are collected according to the setup shown in Figure 9.

4.2. Accelerance

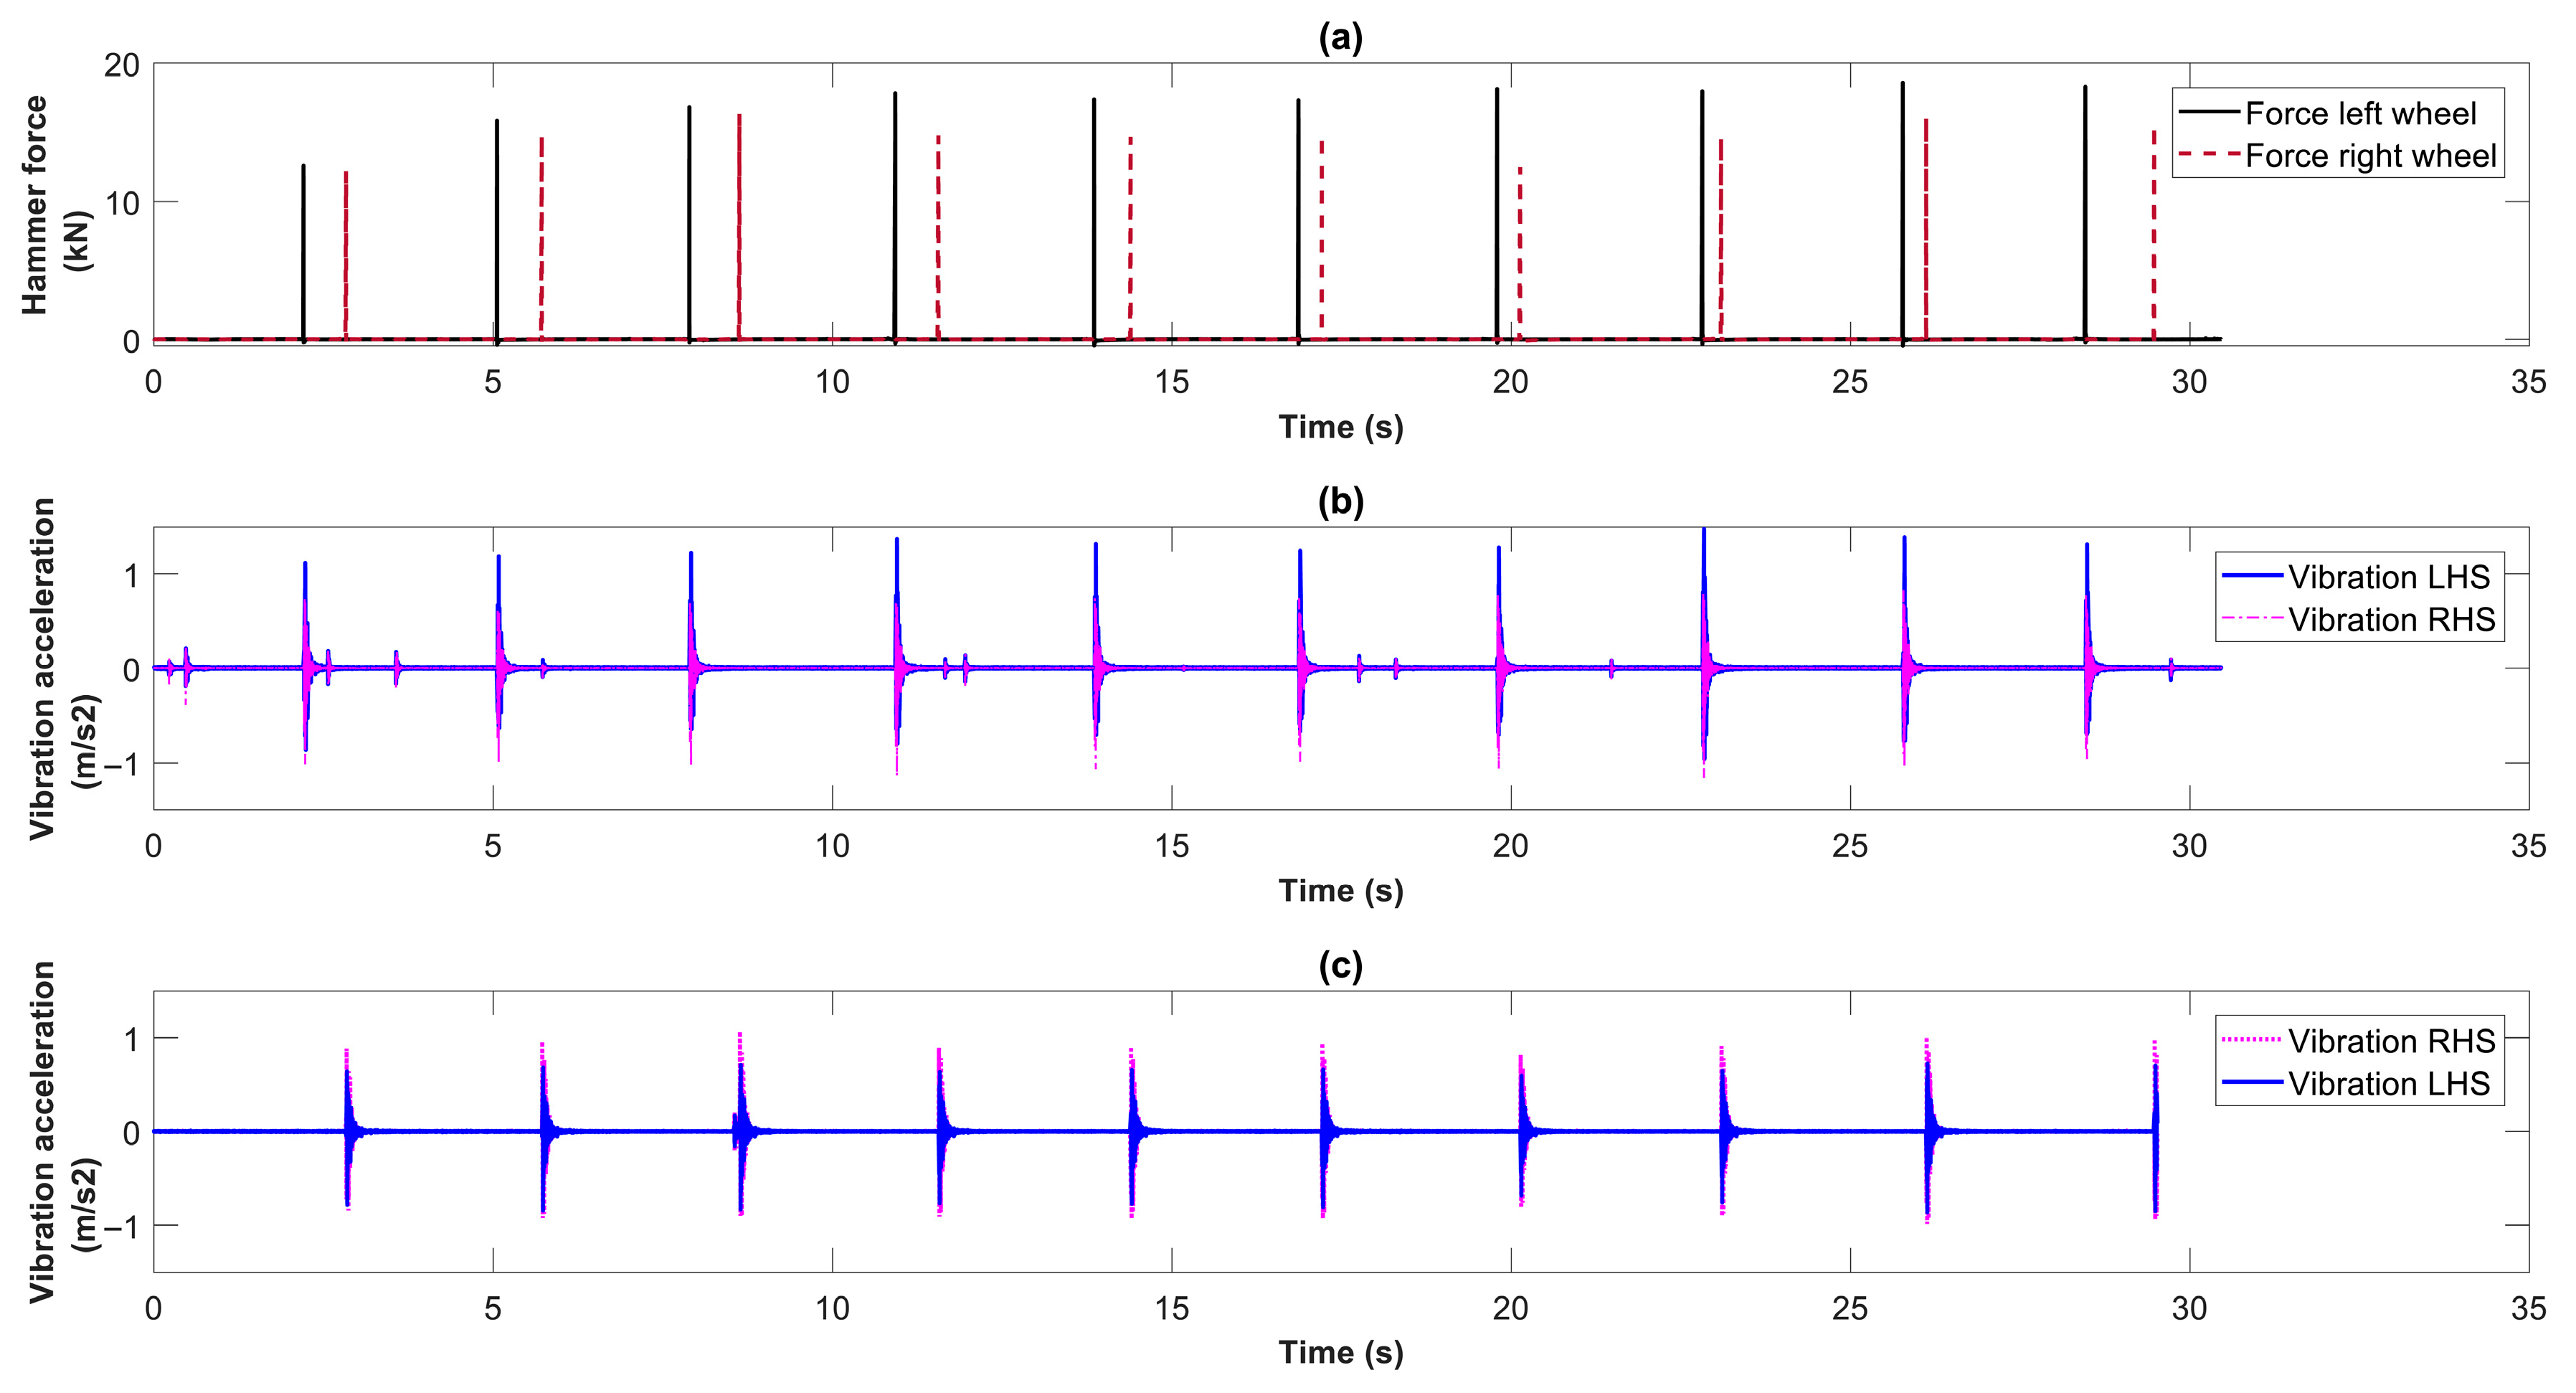
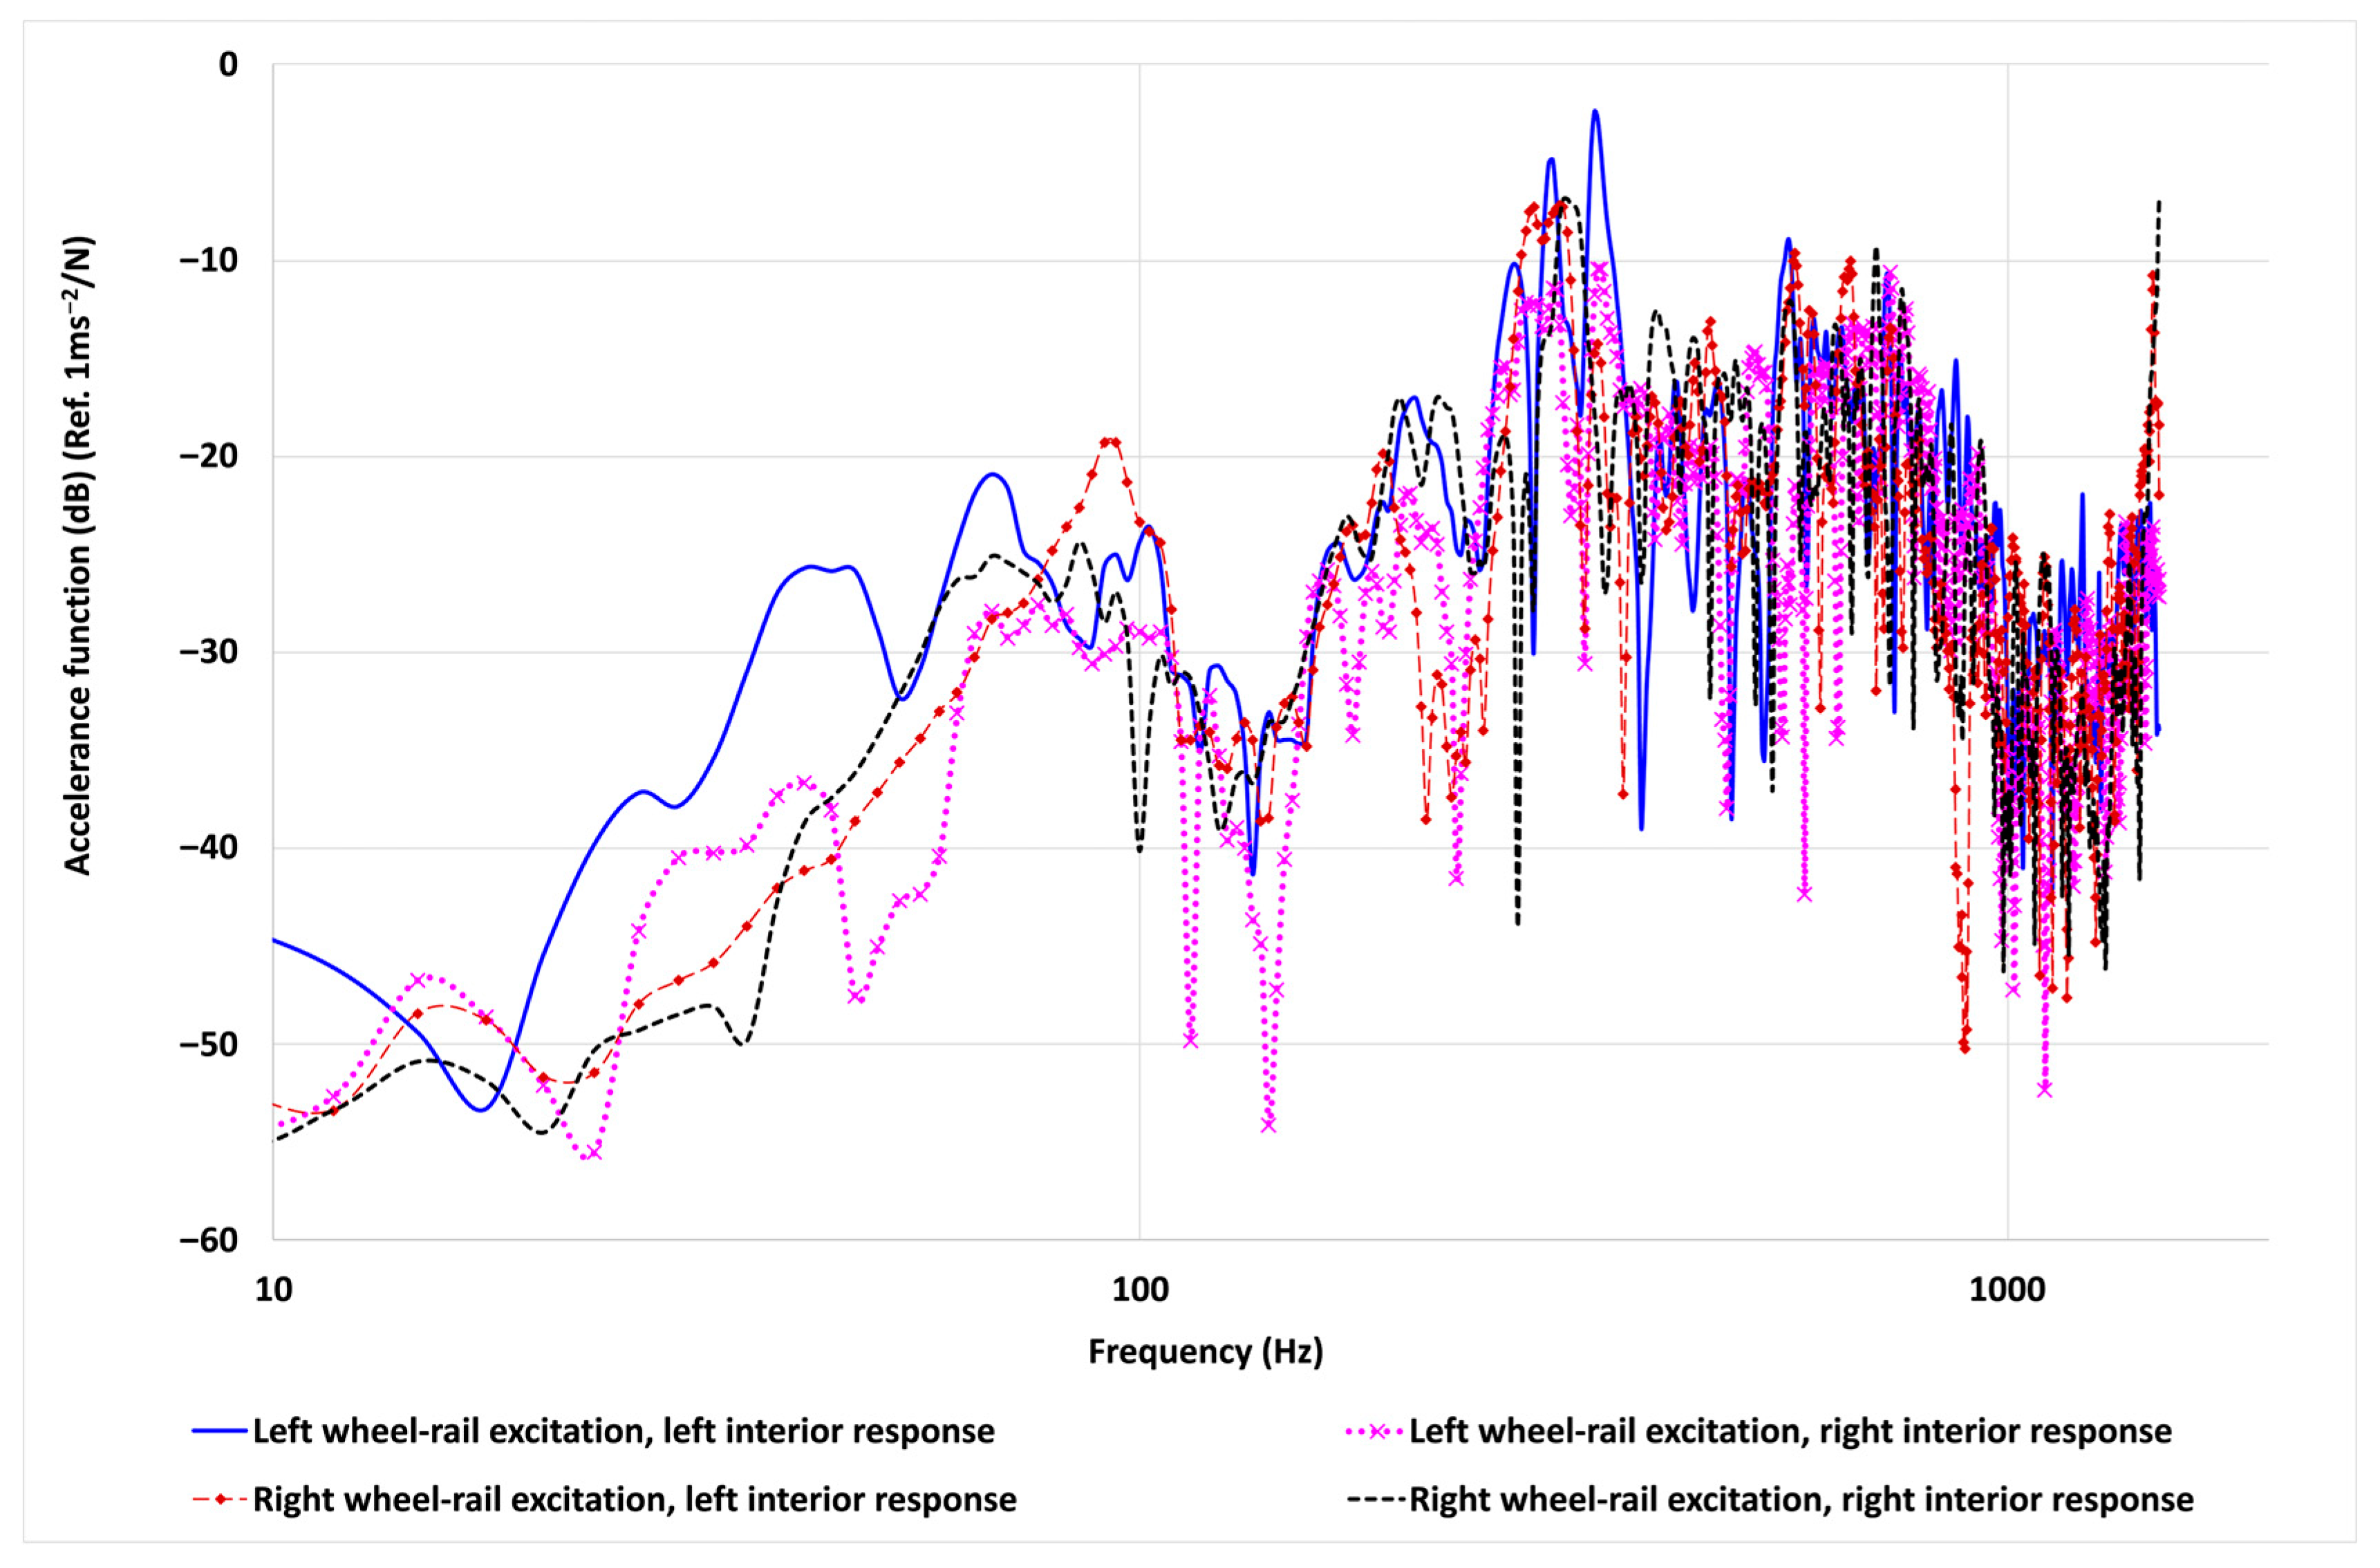
Wheel–rail excitations on both sides and interior noise and vibration acceleration measured on both sides in the train carriage have all been recorded. Hammer impact force on both wheels and interior response in terms of vertical vibration on both sides are plotted in Figure 10. When the hammer force exerts on the left wheel, interior response on the left-hand side (LHS) accelerometer is larger than that on the right-hand side (RHS) vibration, and likewise for force on the right wheel. The accelerance from the input force and interior vertical vibrations are plotted in Figure 11. This was then used to obtain dynamic wheel–rail forces, as per Equation (13).

4.3. Receptance

For the receptance functions, vibration acceleration of rails and wheels was measured and integrated twice for vibration displacement, together with the hammer impact force to compute rail receptance α r and wheel receptance α w using Equation (1).
Because the dynamic displacement between wheels and rails is rather small, the contact receptance function, α c , between the wheel and rail is almost constant, which can be obtained by the Hertzian contact theory using the wheel–rail preload force and the wheel geometries. In this study, the contact receptance is 8.77 × 10⁻¹⁰ mN−1 [40].
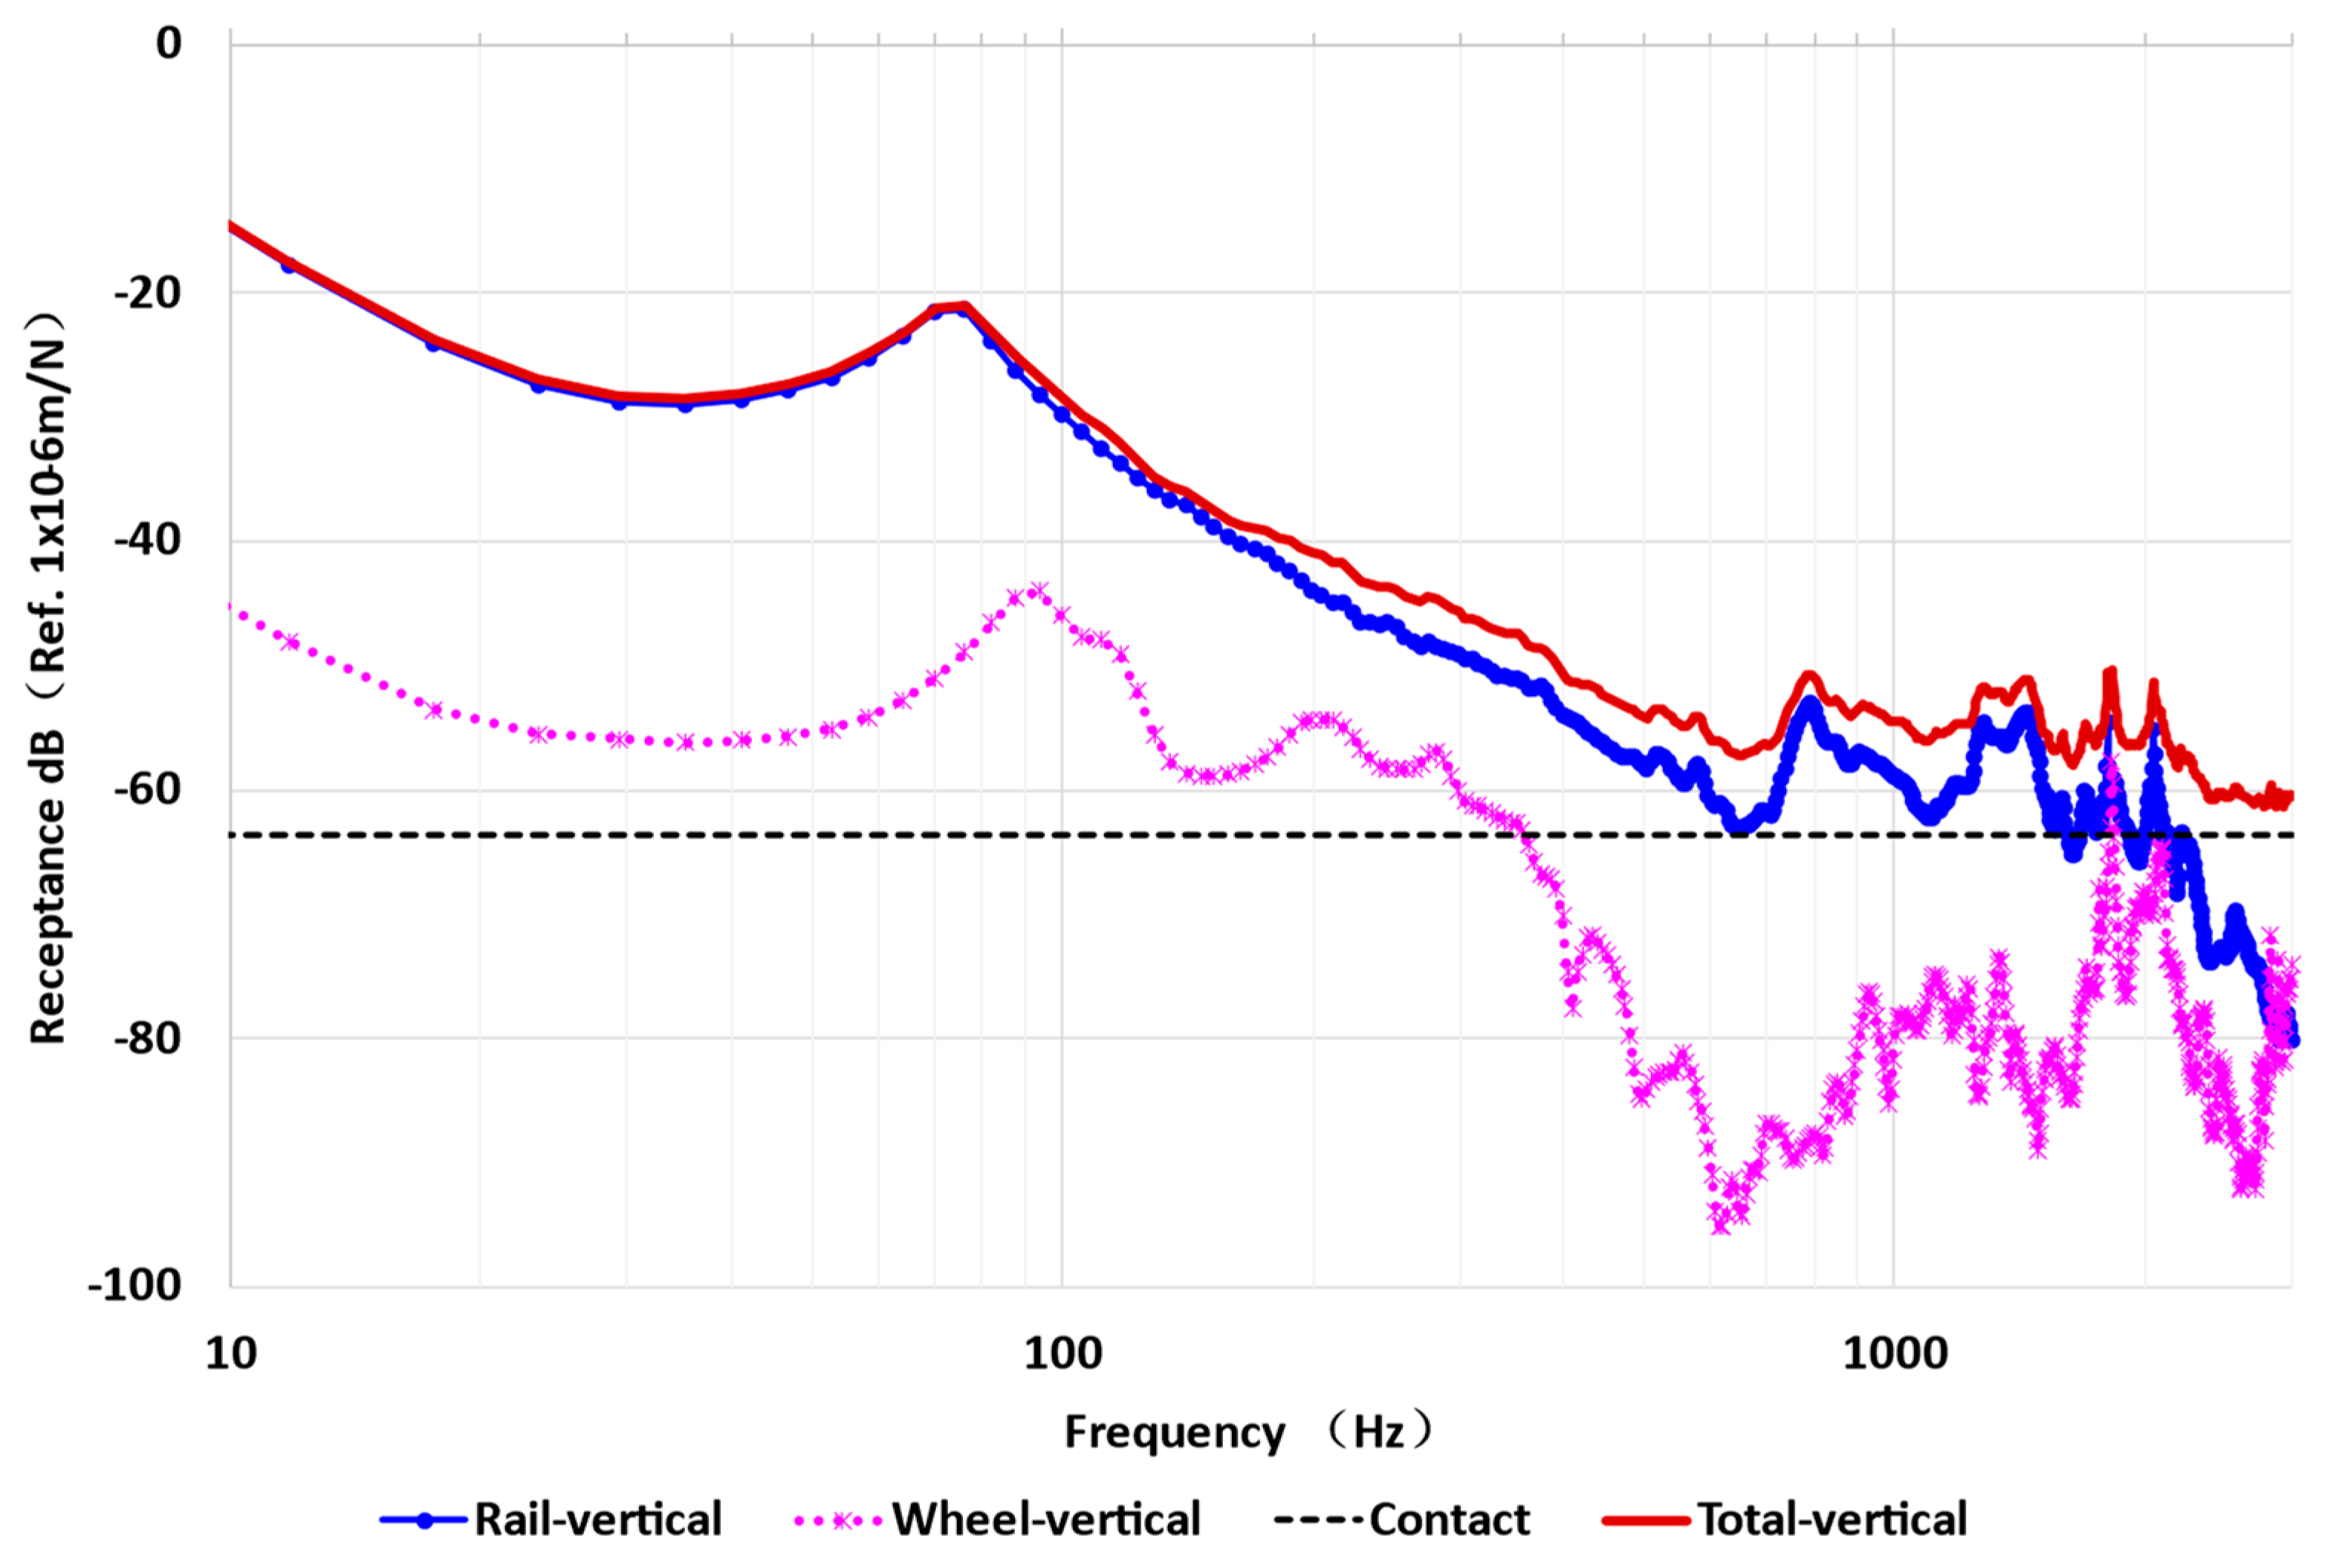
Figure 12 below shows the measured rail receptance and wheel receptance, wheel–rail contact receptance, and the total receptance, for a track with 60 kg/m rail (standard mainline rail for metro in China), fastener with a stiffness of 30 kN/mm, a supporting space of 0.6 m, and a type A metro vehicle.

5. Train Vehicle Interior Noise and Vibration Measurements

5.1. Site Inspection

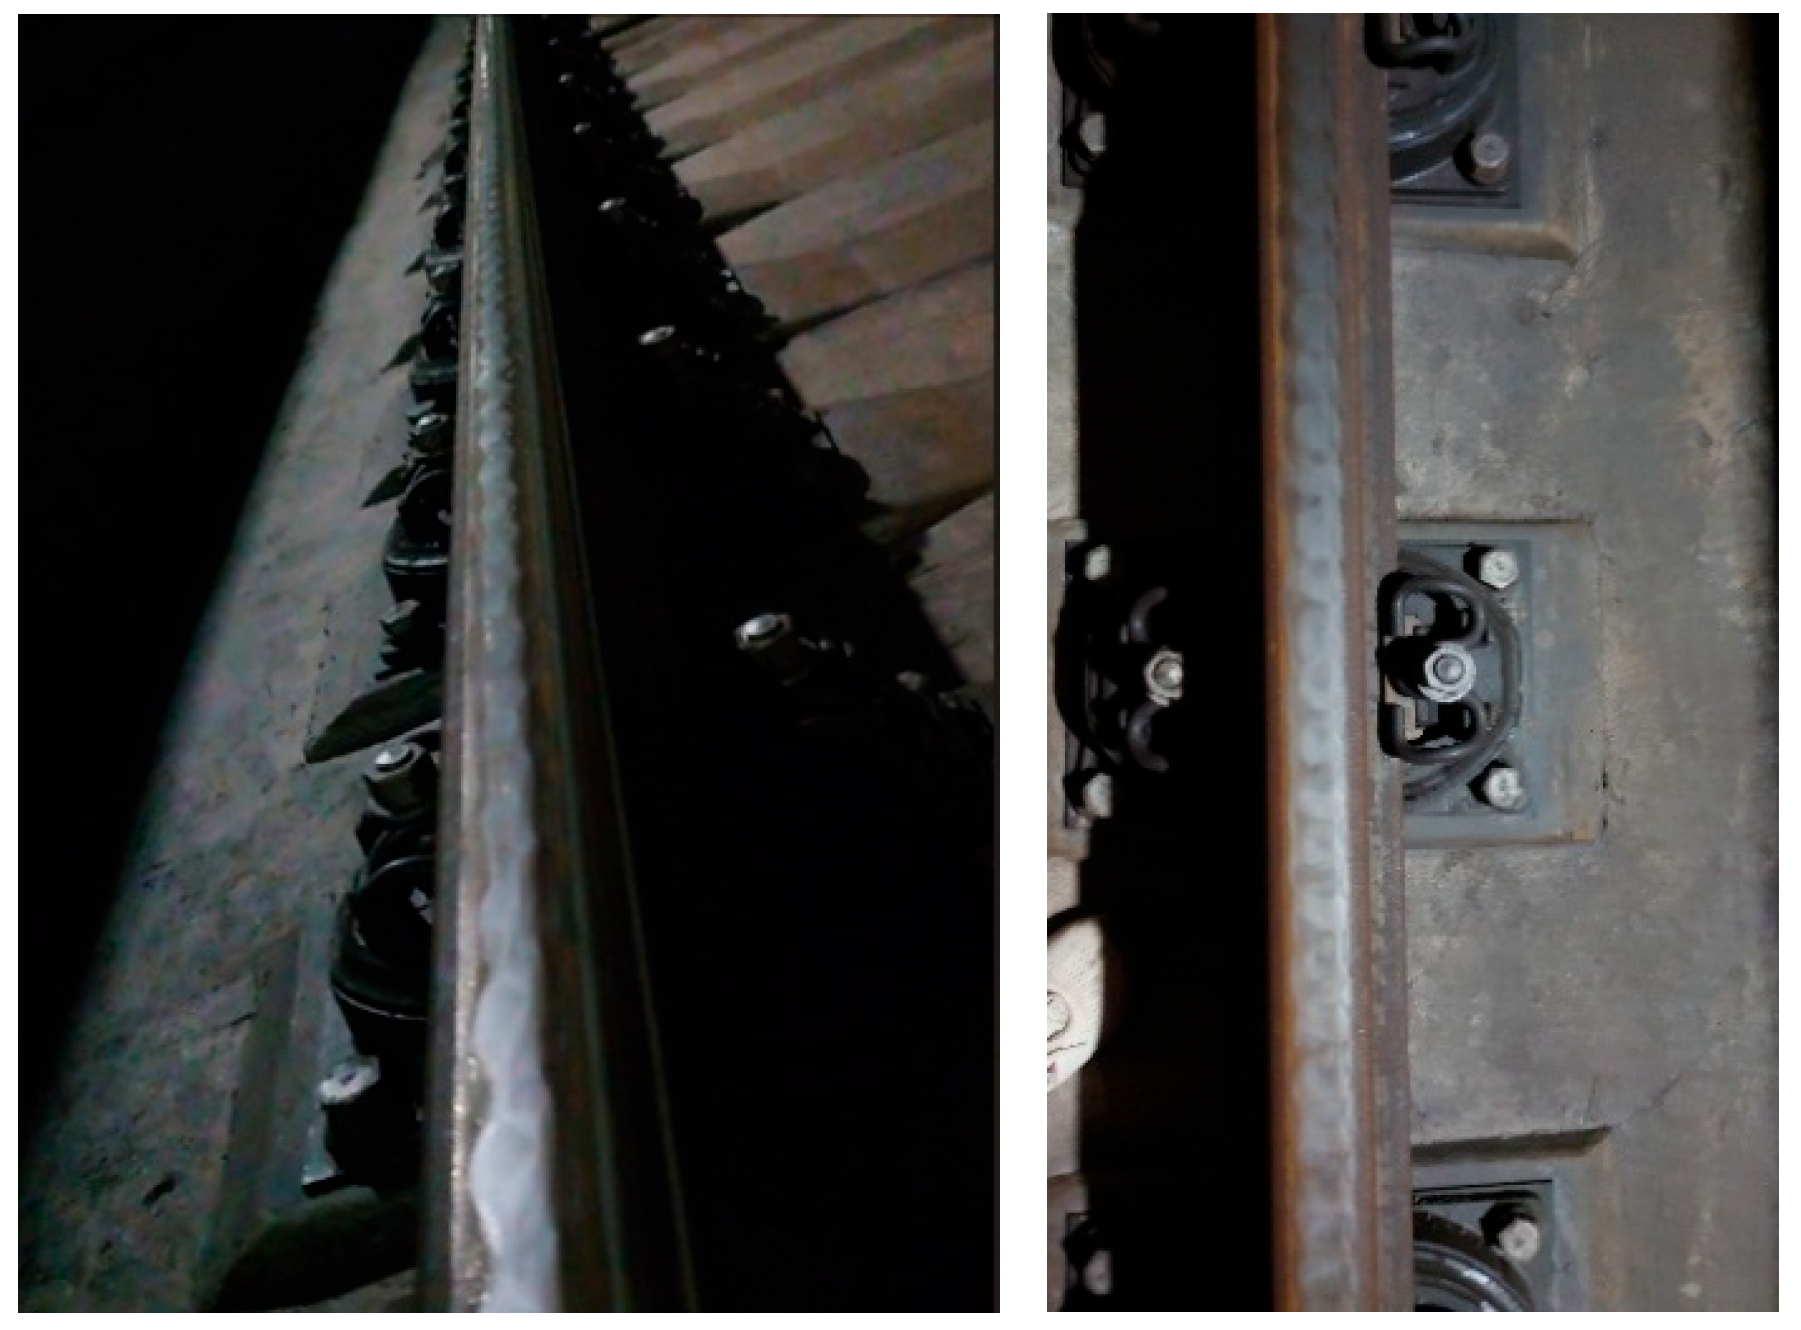
A visual site inspection was performed prior to on-site tests. Corrugation on rails at the curved and resilient track sections can be found in Figure 13.

5.2. Experimental Setup

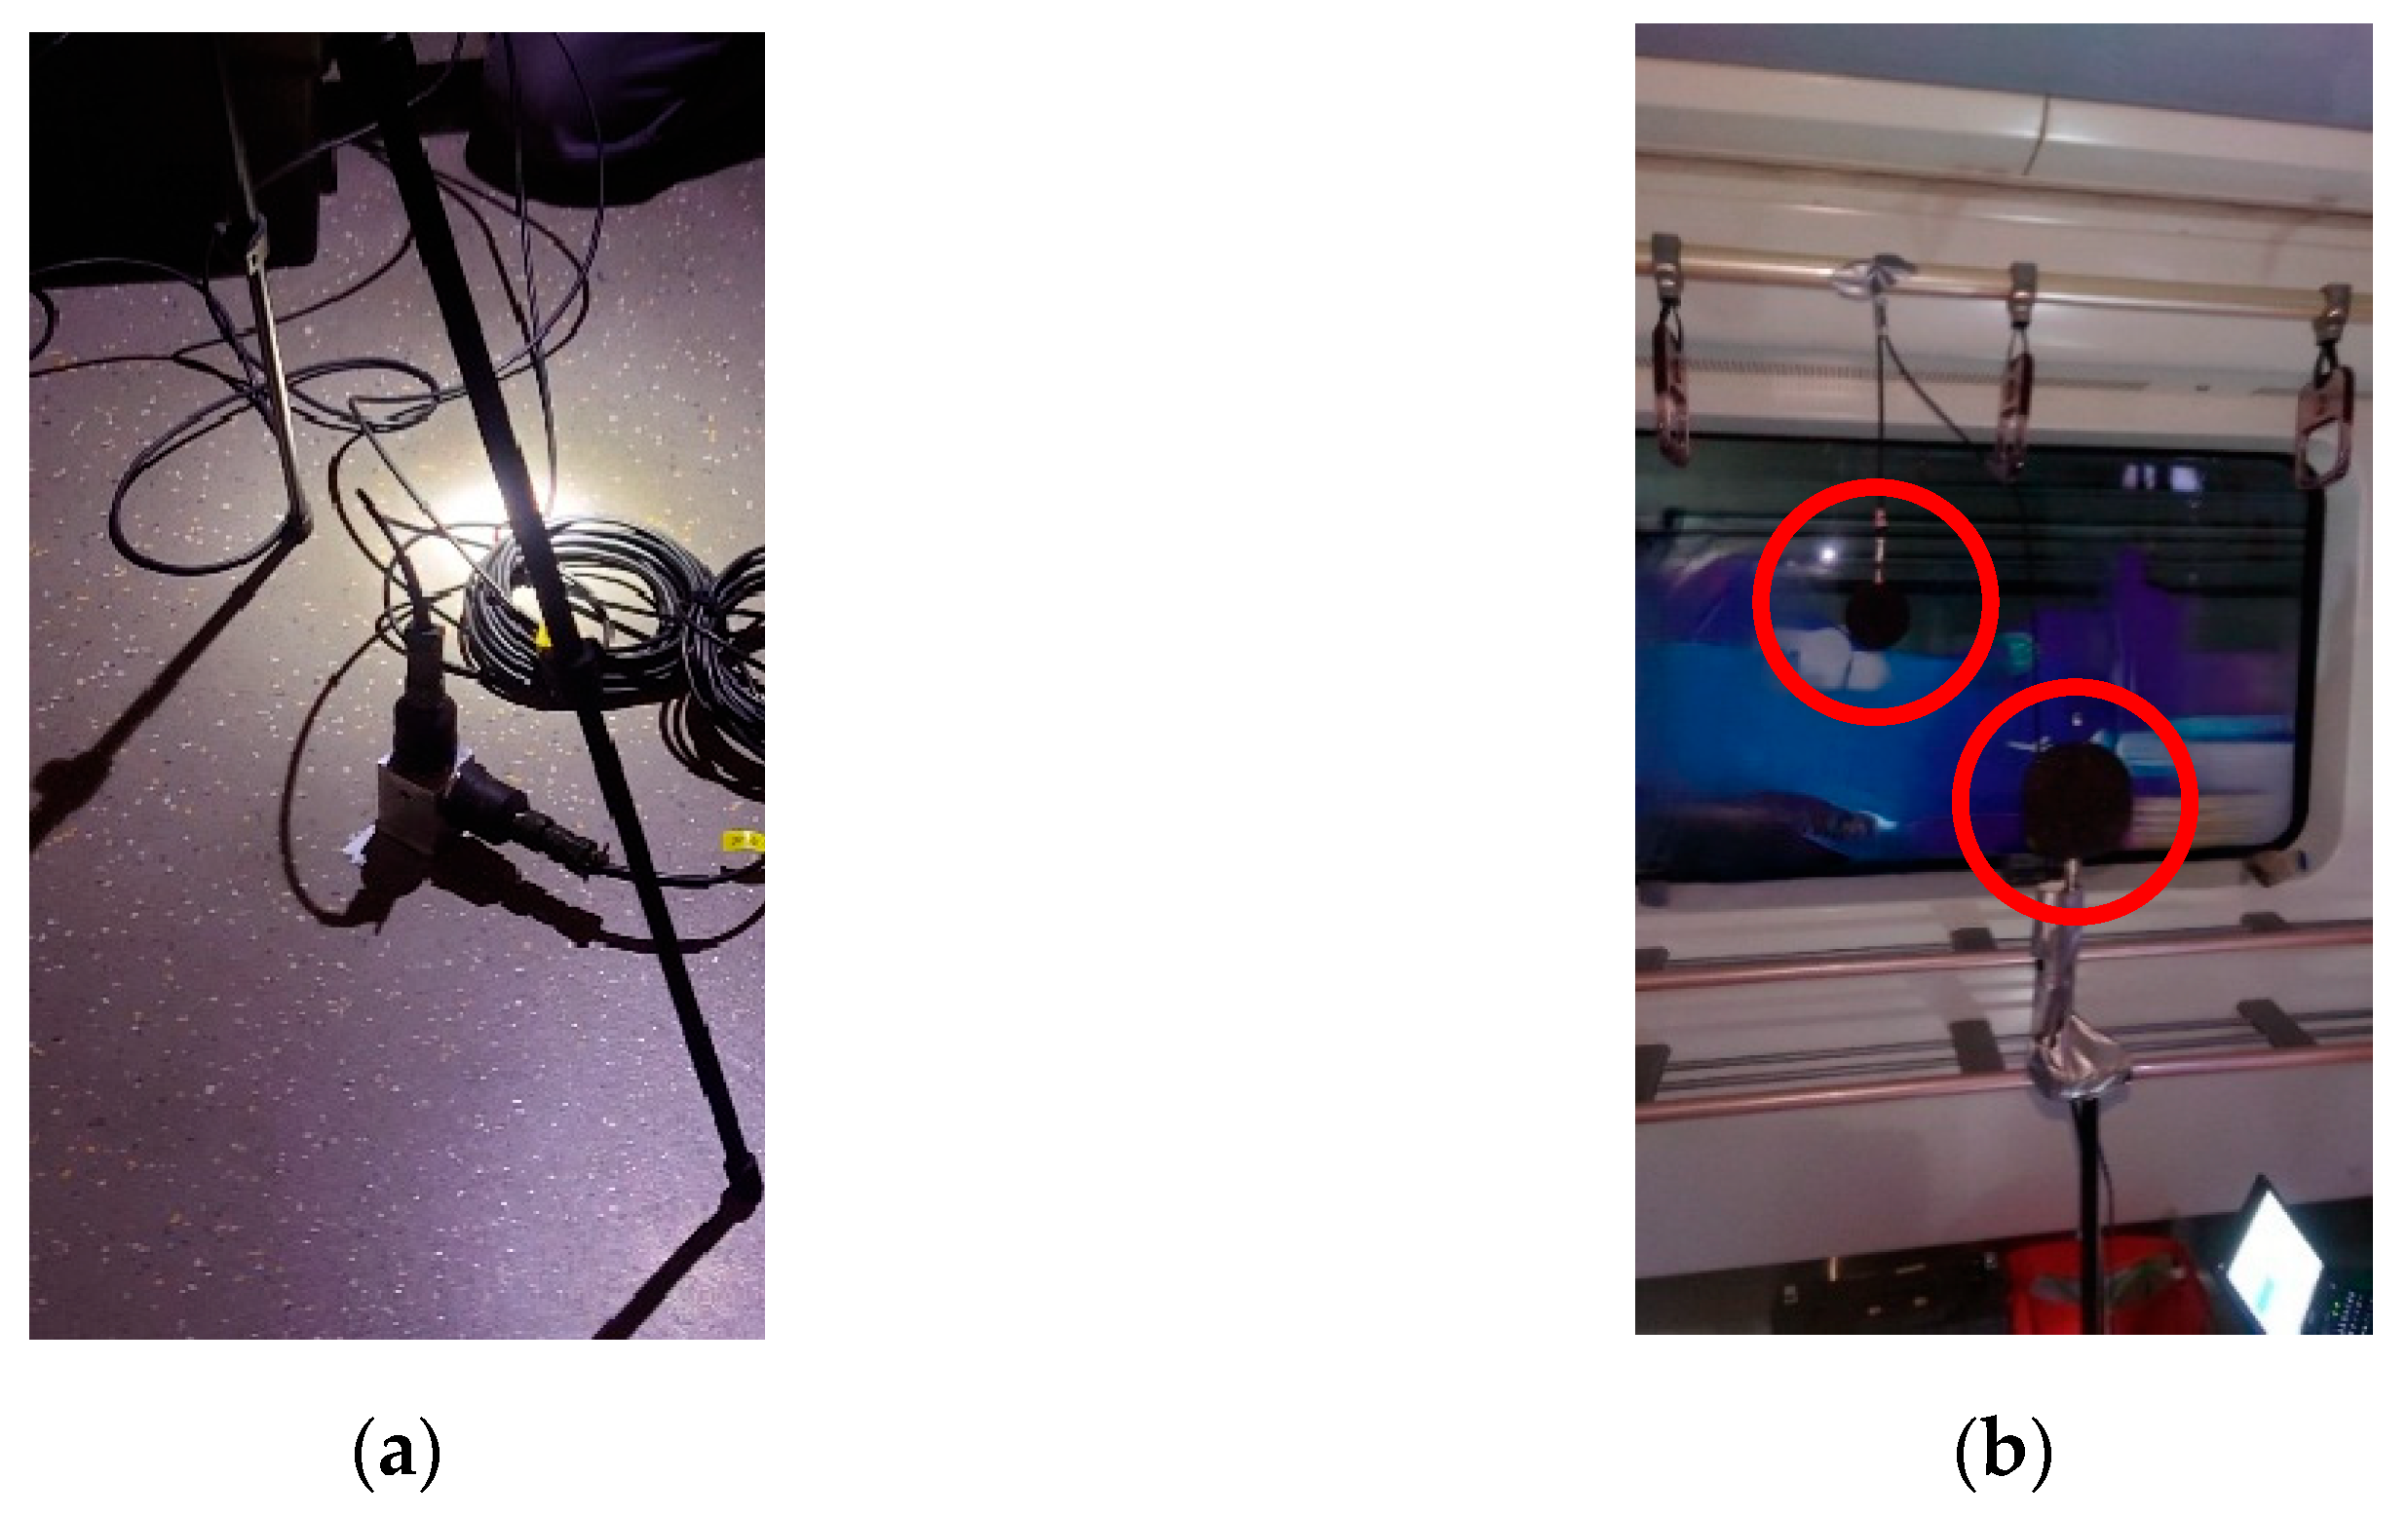
A test train was specifically arranged for this test, so there were no passengers onboard during the test to minimise disruptions. On-site photos can be found in Figure 14. Two microphones, one at 1.2 m above the ground and the other at 1.5 m above the ground, were both set up for comparison for validating data integrity.
An in-depth analysis was performed on interior noise and vibration measurements, as follows.

5.3. Time and Frequency Domain Analysis of Interior Responses

Interior noise and vibration data were analysed; time history and frequency domain contents are plotted in Figure 15. The two response peaks in time histories correspond to the test train traveling through the curved sections, the S-curve comprising sub-sections C1 and C2, and C3 towards the end of the rail track. The S-curves C1 and C2, and C3 can be easily recognised from 40 s to 60 s and from 100 s to 120 s as the train travels southbound, which is from small to large mileage.
Response data are split up into three groups before transformation from the time domain to frequency domain, as the dynamic characteristics of curved tracks and straight-line tracks are expected to be rather different. The three data groups for the frequency domain analysis are as follows: (i) the S-curve comprising C1 and C2 (blue circle lines), (ii) S-curve C3 (magenta triangle lines), and (iii) straight-line track sections (red star lines). The peak magnitude of vertical vibration is at 500 Hz, which is the peak noise level; this is often found as the characteristic frequency of short-pitch corrugation, known as the pinned-pinned frequency [7]. In the lateral direction, at 200 Hz, there is also a large magnitude response. As expected, 1/3 octave band noise and vibration levels at the straight-line section are much lower than those at the two curves, with a maximum difference of more than 30 dB, in the frequency range of 200 Hz and 800 Hz, which is the typical range of pinned-pinned frequency in metro.
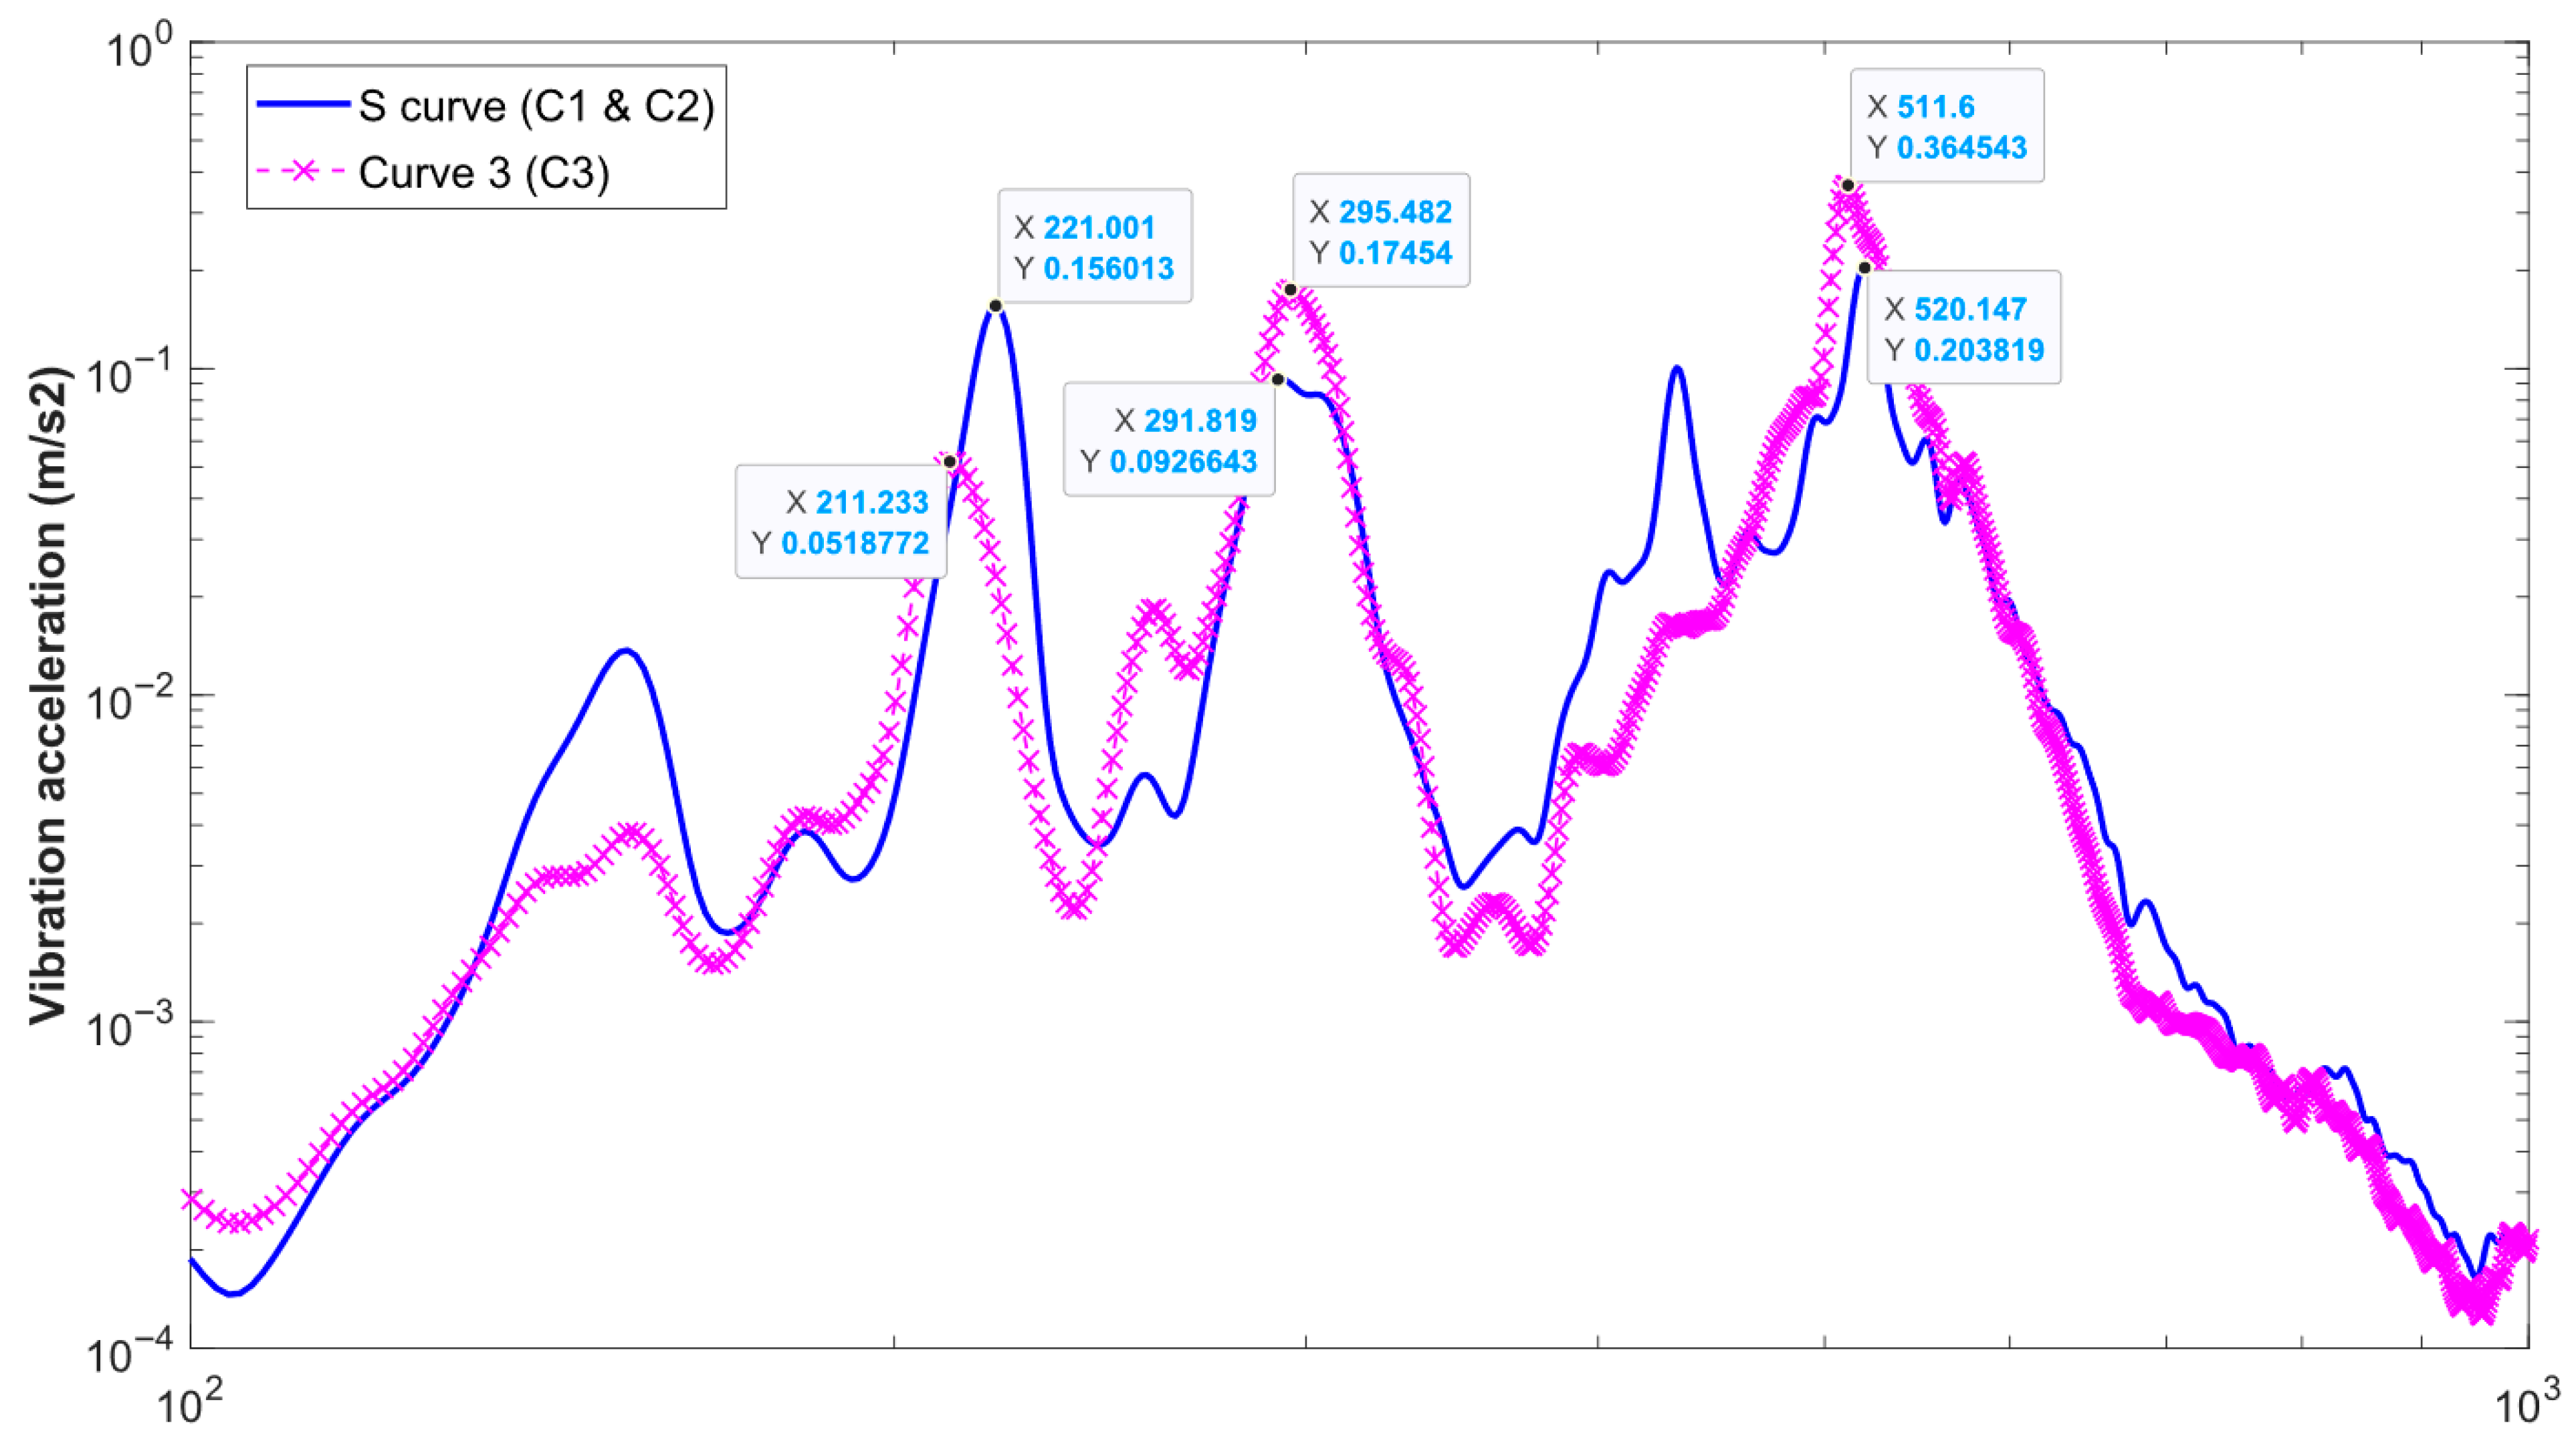
In this study for the verification and validation of the diagnosis method, only analysis from interior vertical vibration acceleration is presented hereafter. Figure 16 shows the time history and corresponding spectrogram of interior measurement records to show the energy contribution from different modes. Figure 17 shows the power spectrum of the curved sections only. For the S-curve section, two of the highest energy concentrations, presented in maroon in the spectrogram, can be found at around 45 s and 60 s; these correspond to peak magnitude frequencies of 221 Hz and at 520 Hz, respectively, in the power spectrum. Similarly, for the C3 sub-section, the highest energy concentrates from 100 s to 110 s, with a peak frequency of 512 Hz in the power spectrum. In addition, for both the S1/S2 curves and C3, there is a peak frequency around 295 Hz; this frequency can be seen almost throughout the entire time history, with less intensity at the straight-line track sections, qhich could be due to both rail and wheel irregularities.
The train speeds at curves vary between 63 km/h and 67 km/h, so an average of 65 km/h is used for this analysis. Using the peak magnitude frequency for short-pitch corrugation, together with the train speed, fixed wavelength can be computed theoretically, and is summarised in Table 4 below.

6. Direct Measurement of Rail Roughness Using CAT

Direct measurement of rail roughness using Corrugation Analysis Trolley (CAT) has been conducted to provide accurate data to validate the indirect diagnosis method.
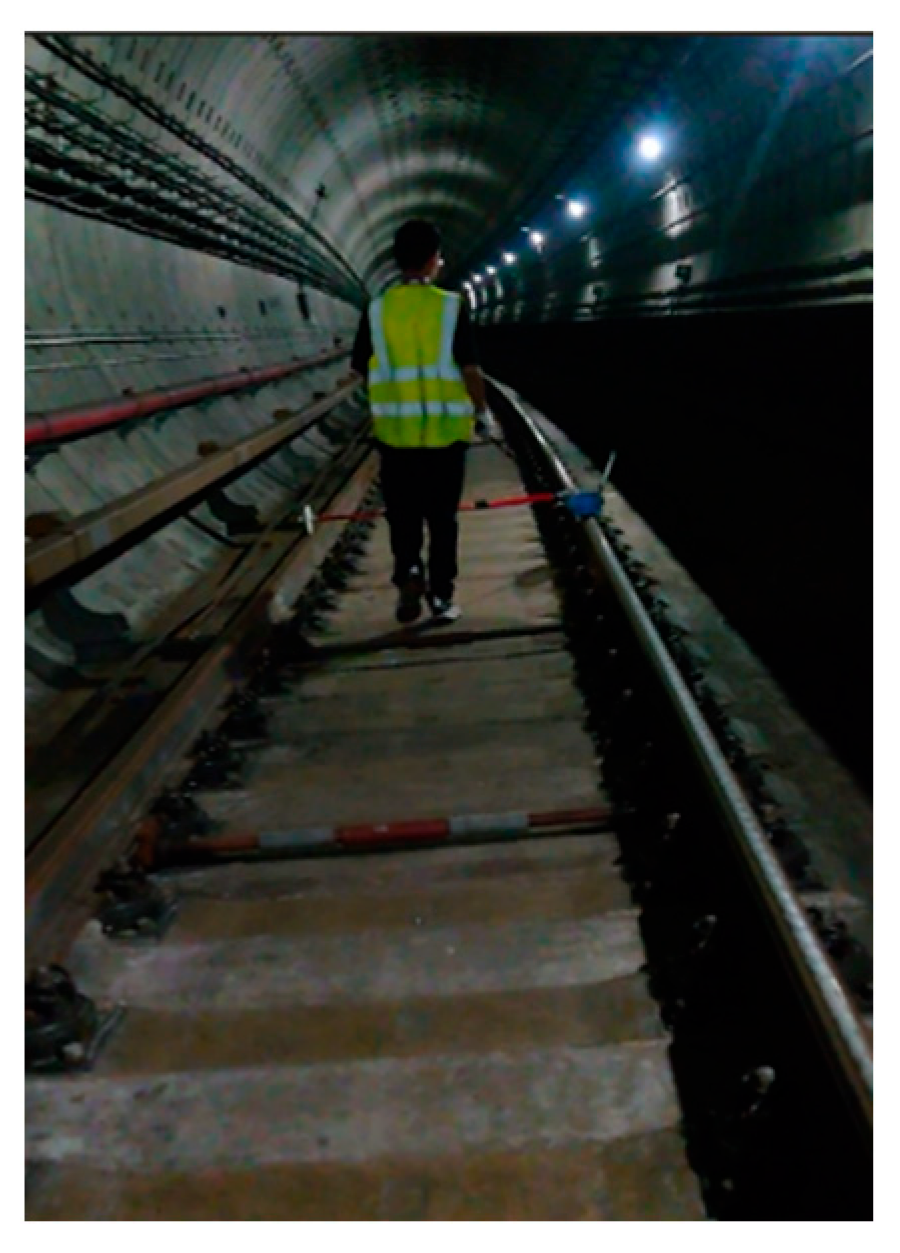
During night-time possession hours, rail roughness data of the entire test track was collected using a single-sided CAT (Figure 18). A single-sided CAT requires the engineer to test one rail at a time, then the other rail by walking back along the track.
Rail roughness of the left and the right rails is plotted in Figure 19. The left and right rails are defined when facing the increasing mileage along the track, so the inner rail and outer rail for each of the curves are different. For curve C1, the left rail is the inner rail, and vice versa for curves C2 and C3. It can be seen that the rail roughness on the left rail approximately from 0.313 km to 0.473 km, which is curve C1, is large in terms of trough depth and becomes almost negligible at straight-line sub-sections. On the right rail, high roughness can be found between 0.449 km and 0.561 km, i.e., curve C2, and between 1.61 km and 1.72 km, which is C3. Again, at straight-line sub-sections, rail roughness is very small.
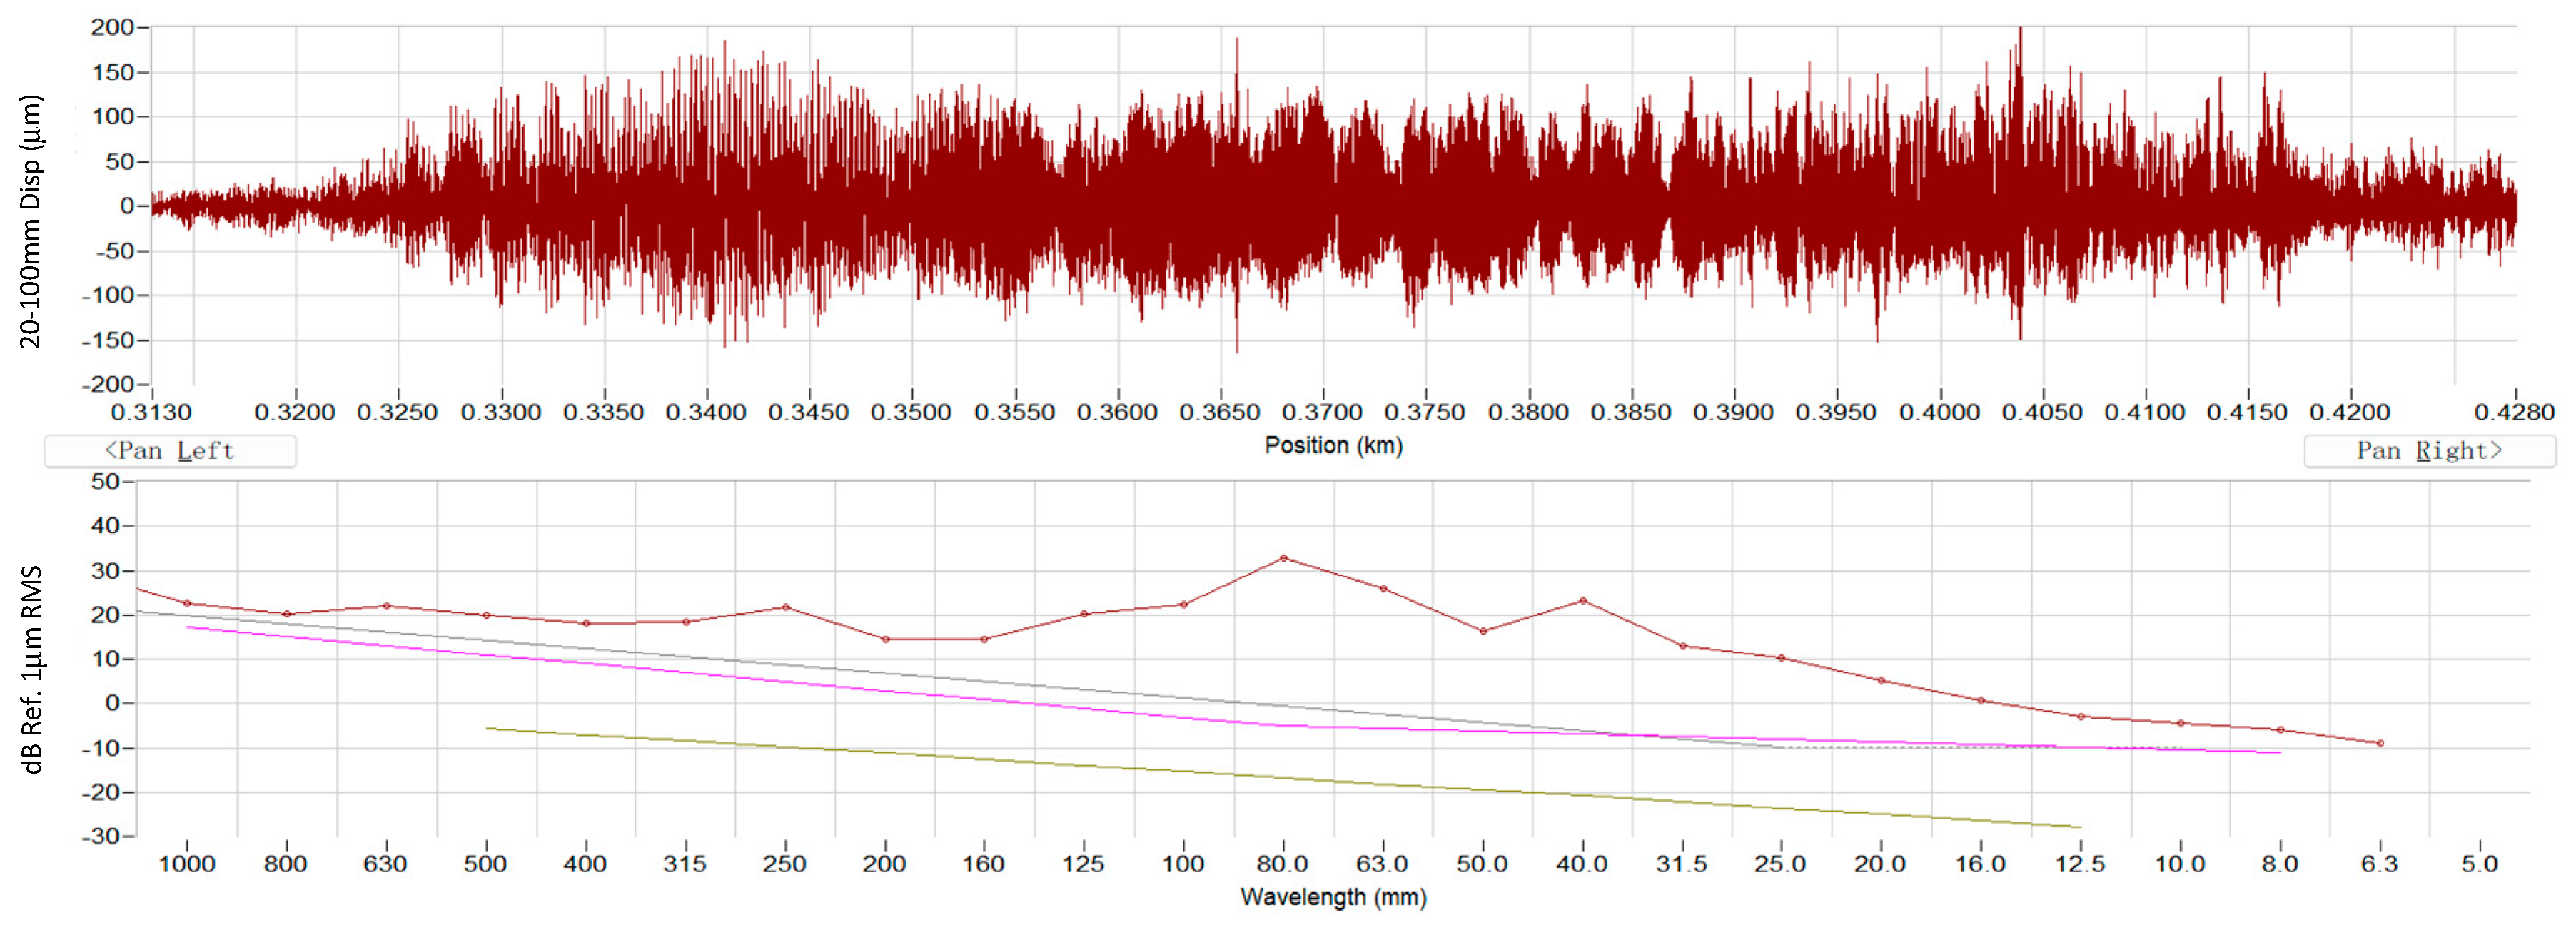
CAT has its own built-in software for the analysis of rail roughness measurement in both the mileage (related to time by train speed) and the frequency domain. Plotted in Figure 20 is the rail roughness of the inner rail at C1 in increasing mileage along the rail track, and its corresponding frequency domain contents. The maroon-coloured lines are CAT-measured data, both in the time and frequency domain. The lines in grey and magenta are the thresholds from ISO 3095-2013 [41] and ISO 3095-2005 [42]. The newest version of ISO 3095 is ISO 3095-2025 [43], which has yet to be updated in the CAT software. Nevertheless, for this study, none of the standards are used as no compliance is required in this study. The yellow line is from EN 13231-2:2020 [44]. At sharp curves, corrugation on the inner rail tends to be more intensive due to centripetal force and increased lateral wheel–rail interaction forces, so the corrugation depth at the inner rail reaches a peak of 33 dB (Ref. 1 μm RMS), with the fixed wavelength of 80 mm.
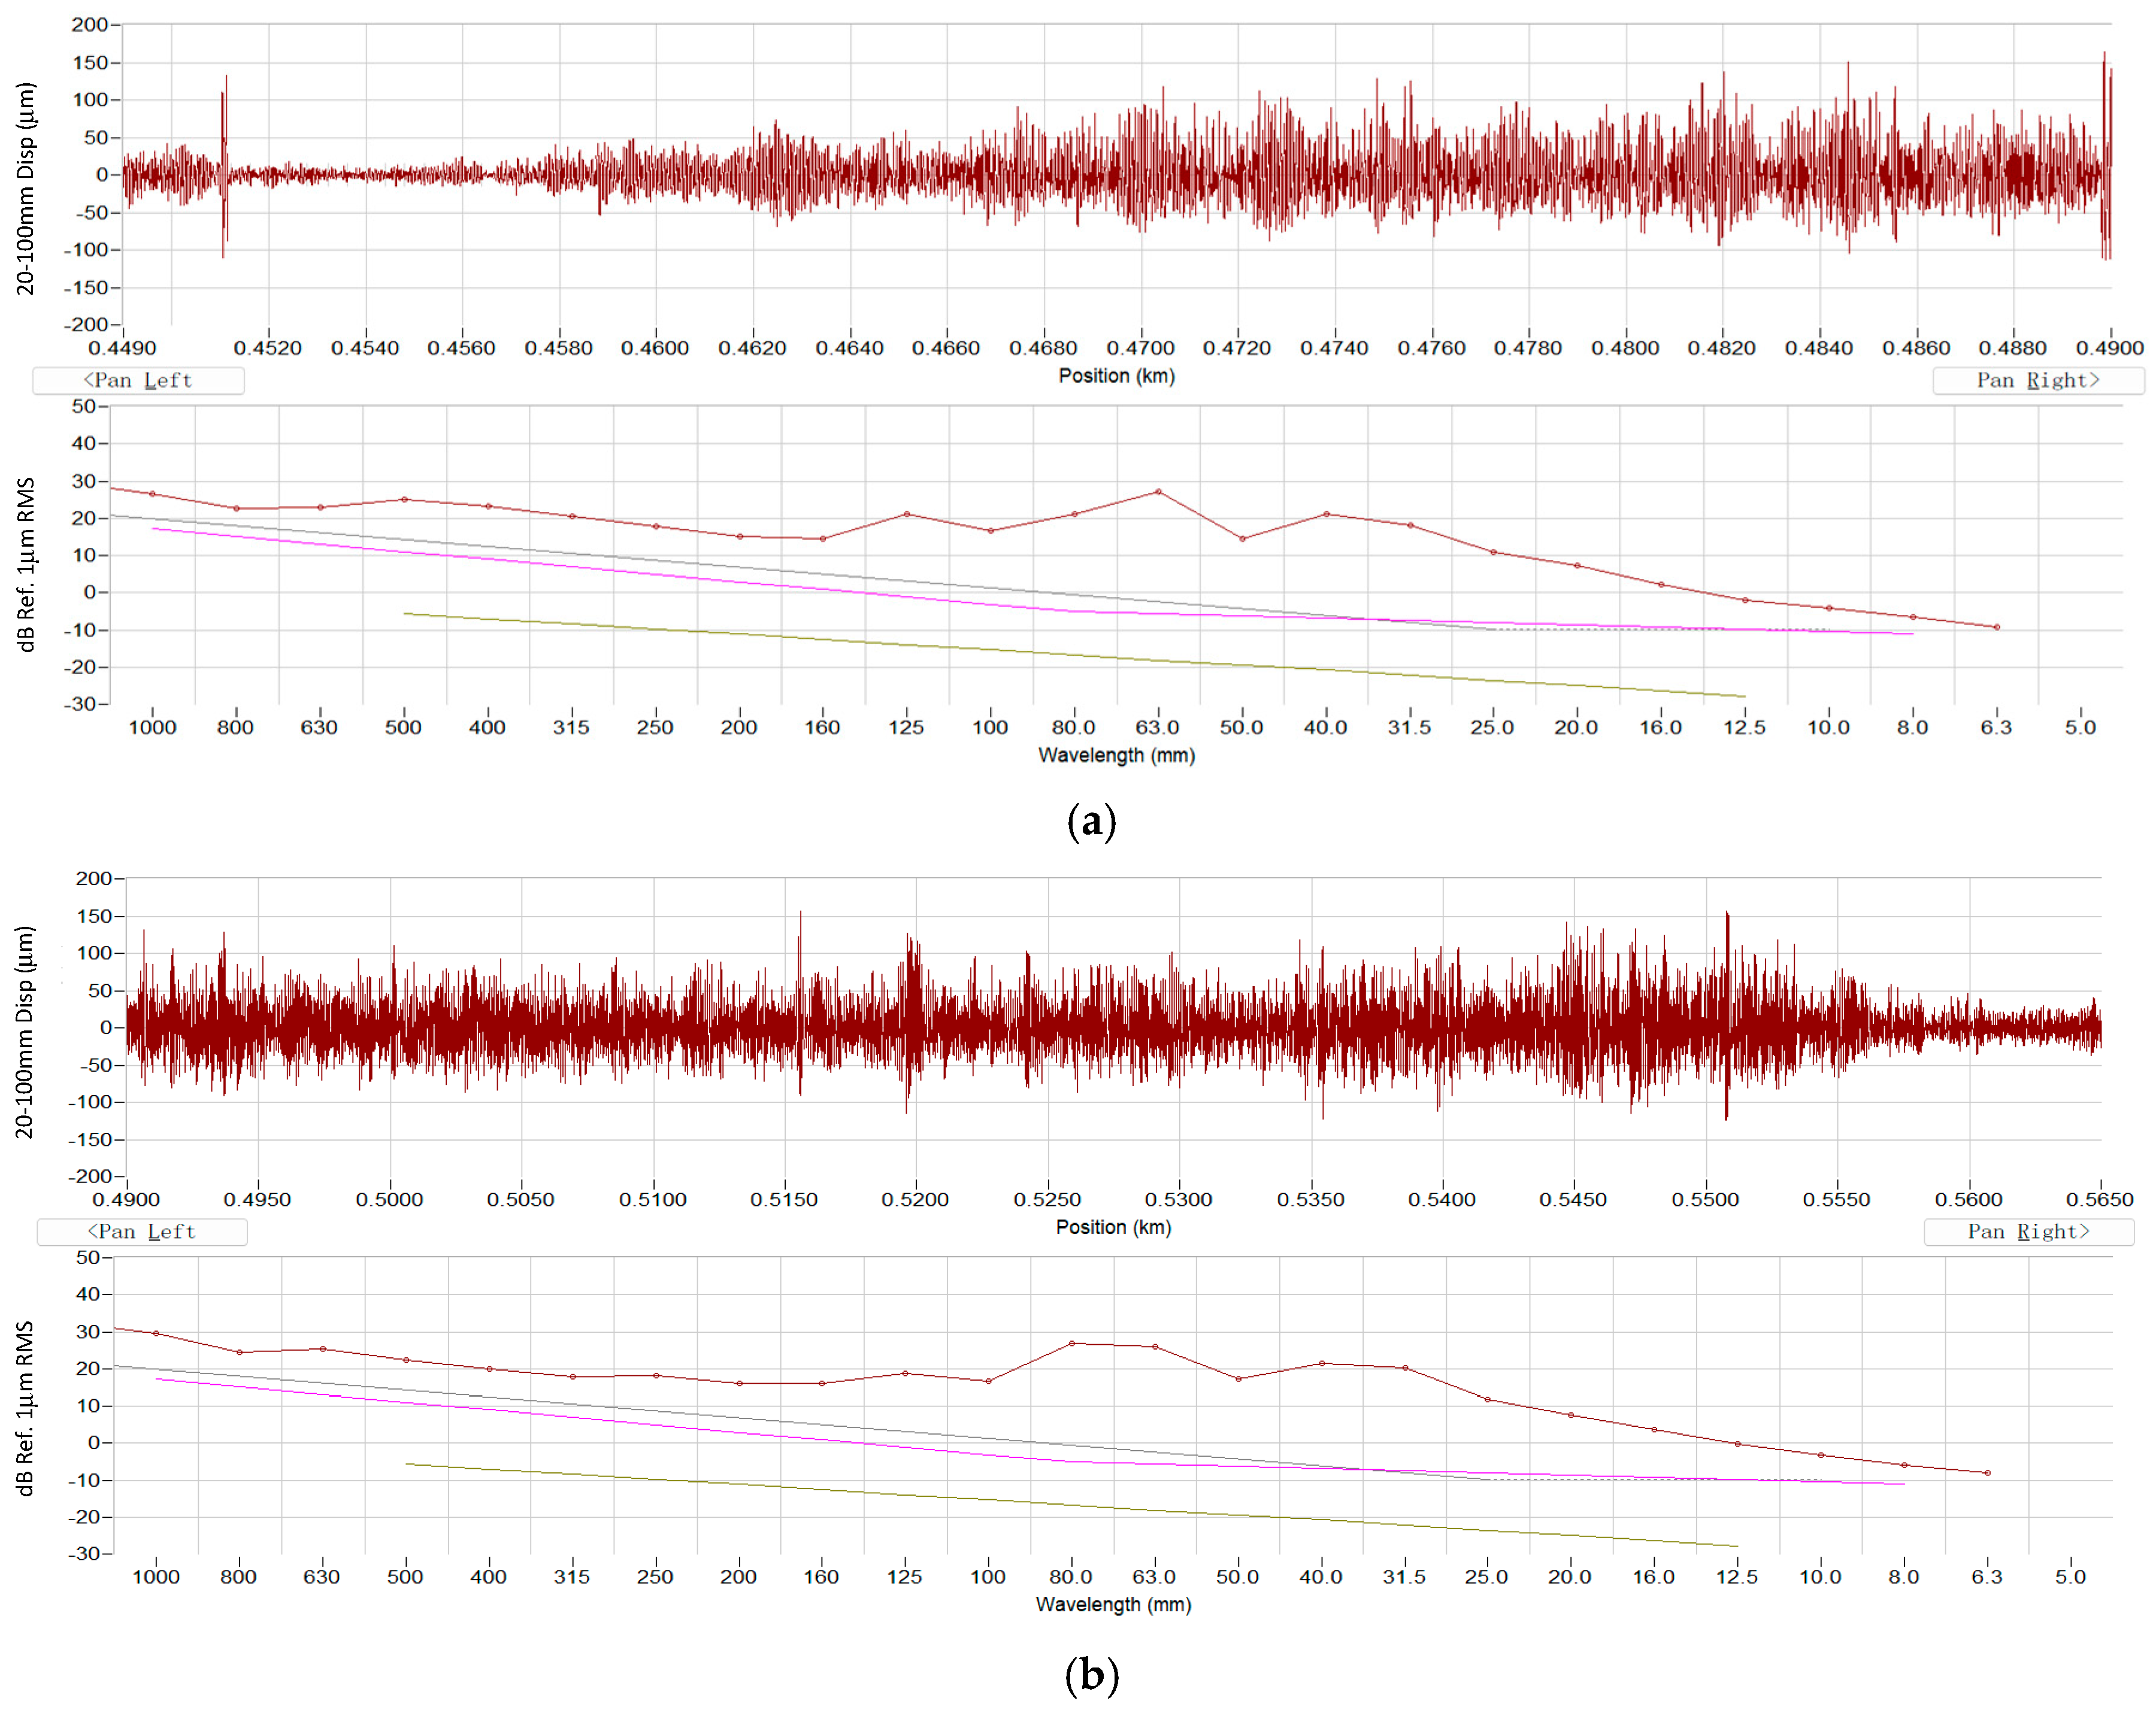
For sub-section C2 shown in Figure 21, the maximum corrugation depth is of 28 dB, with the fixed wavelength of 80 mm (Figure 21b). A 63 mm fixed wavelength is also found for the corrugation depth of no less than 26 dB throughout sub-section C2 (Figure 21a,b). There is also a fixed wavelength of 40 mm with a minimum 21 dB corrugation depth in both the C1 and C2 curves.
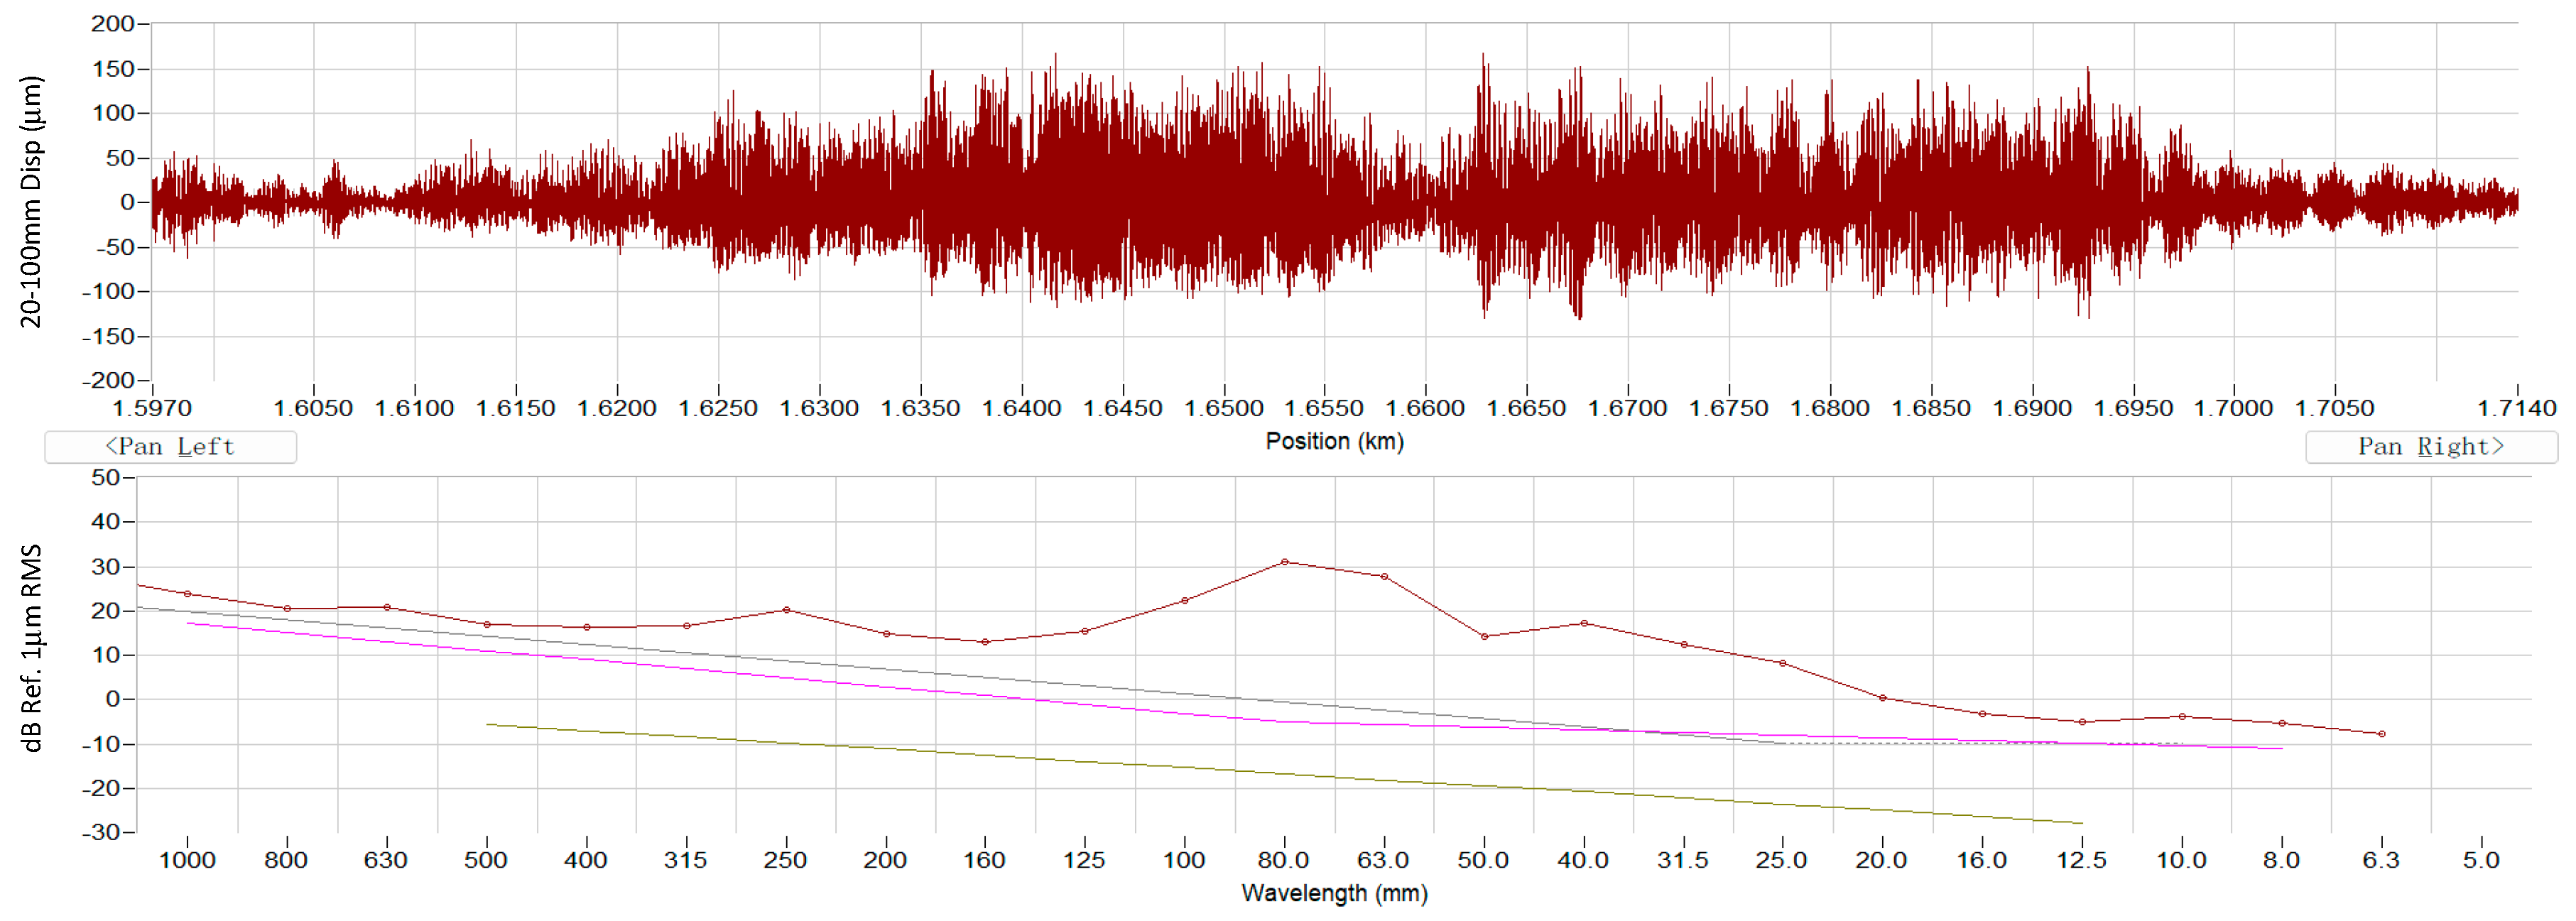
Similarly, for sub-section C3, the maximum corrugation depths at the inner rail is 31 dB, with a fixed wavelength of 80 mm, as per Figure 22.

7. Validation and Discussions of the Indirect Diagnosis Method

7.1. Validation Using Direct CAT Measurement

To validate the proposed indirect method, rail roughness computed by the indirect method has been compared to direct roughness measurement using CAT. For the purpose of demonstrating the comparison, only rail corrugation on the inner rail and interior vertical vibration measured above the inner rail on the vehicle floor of sub-section C1 are presented herein.
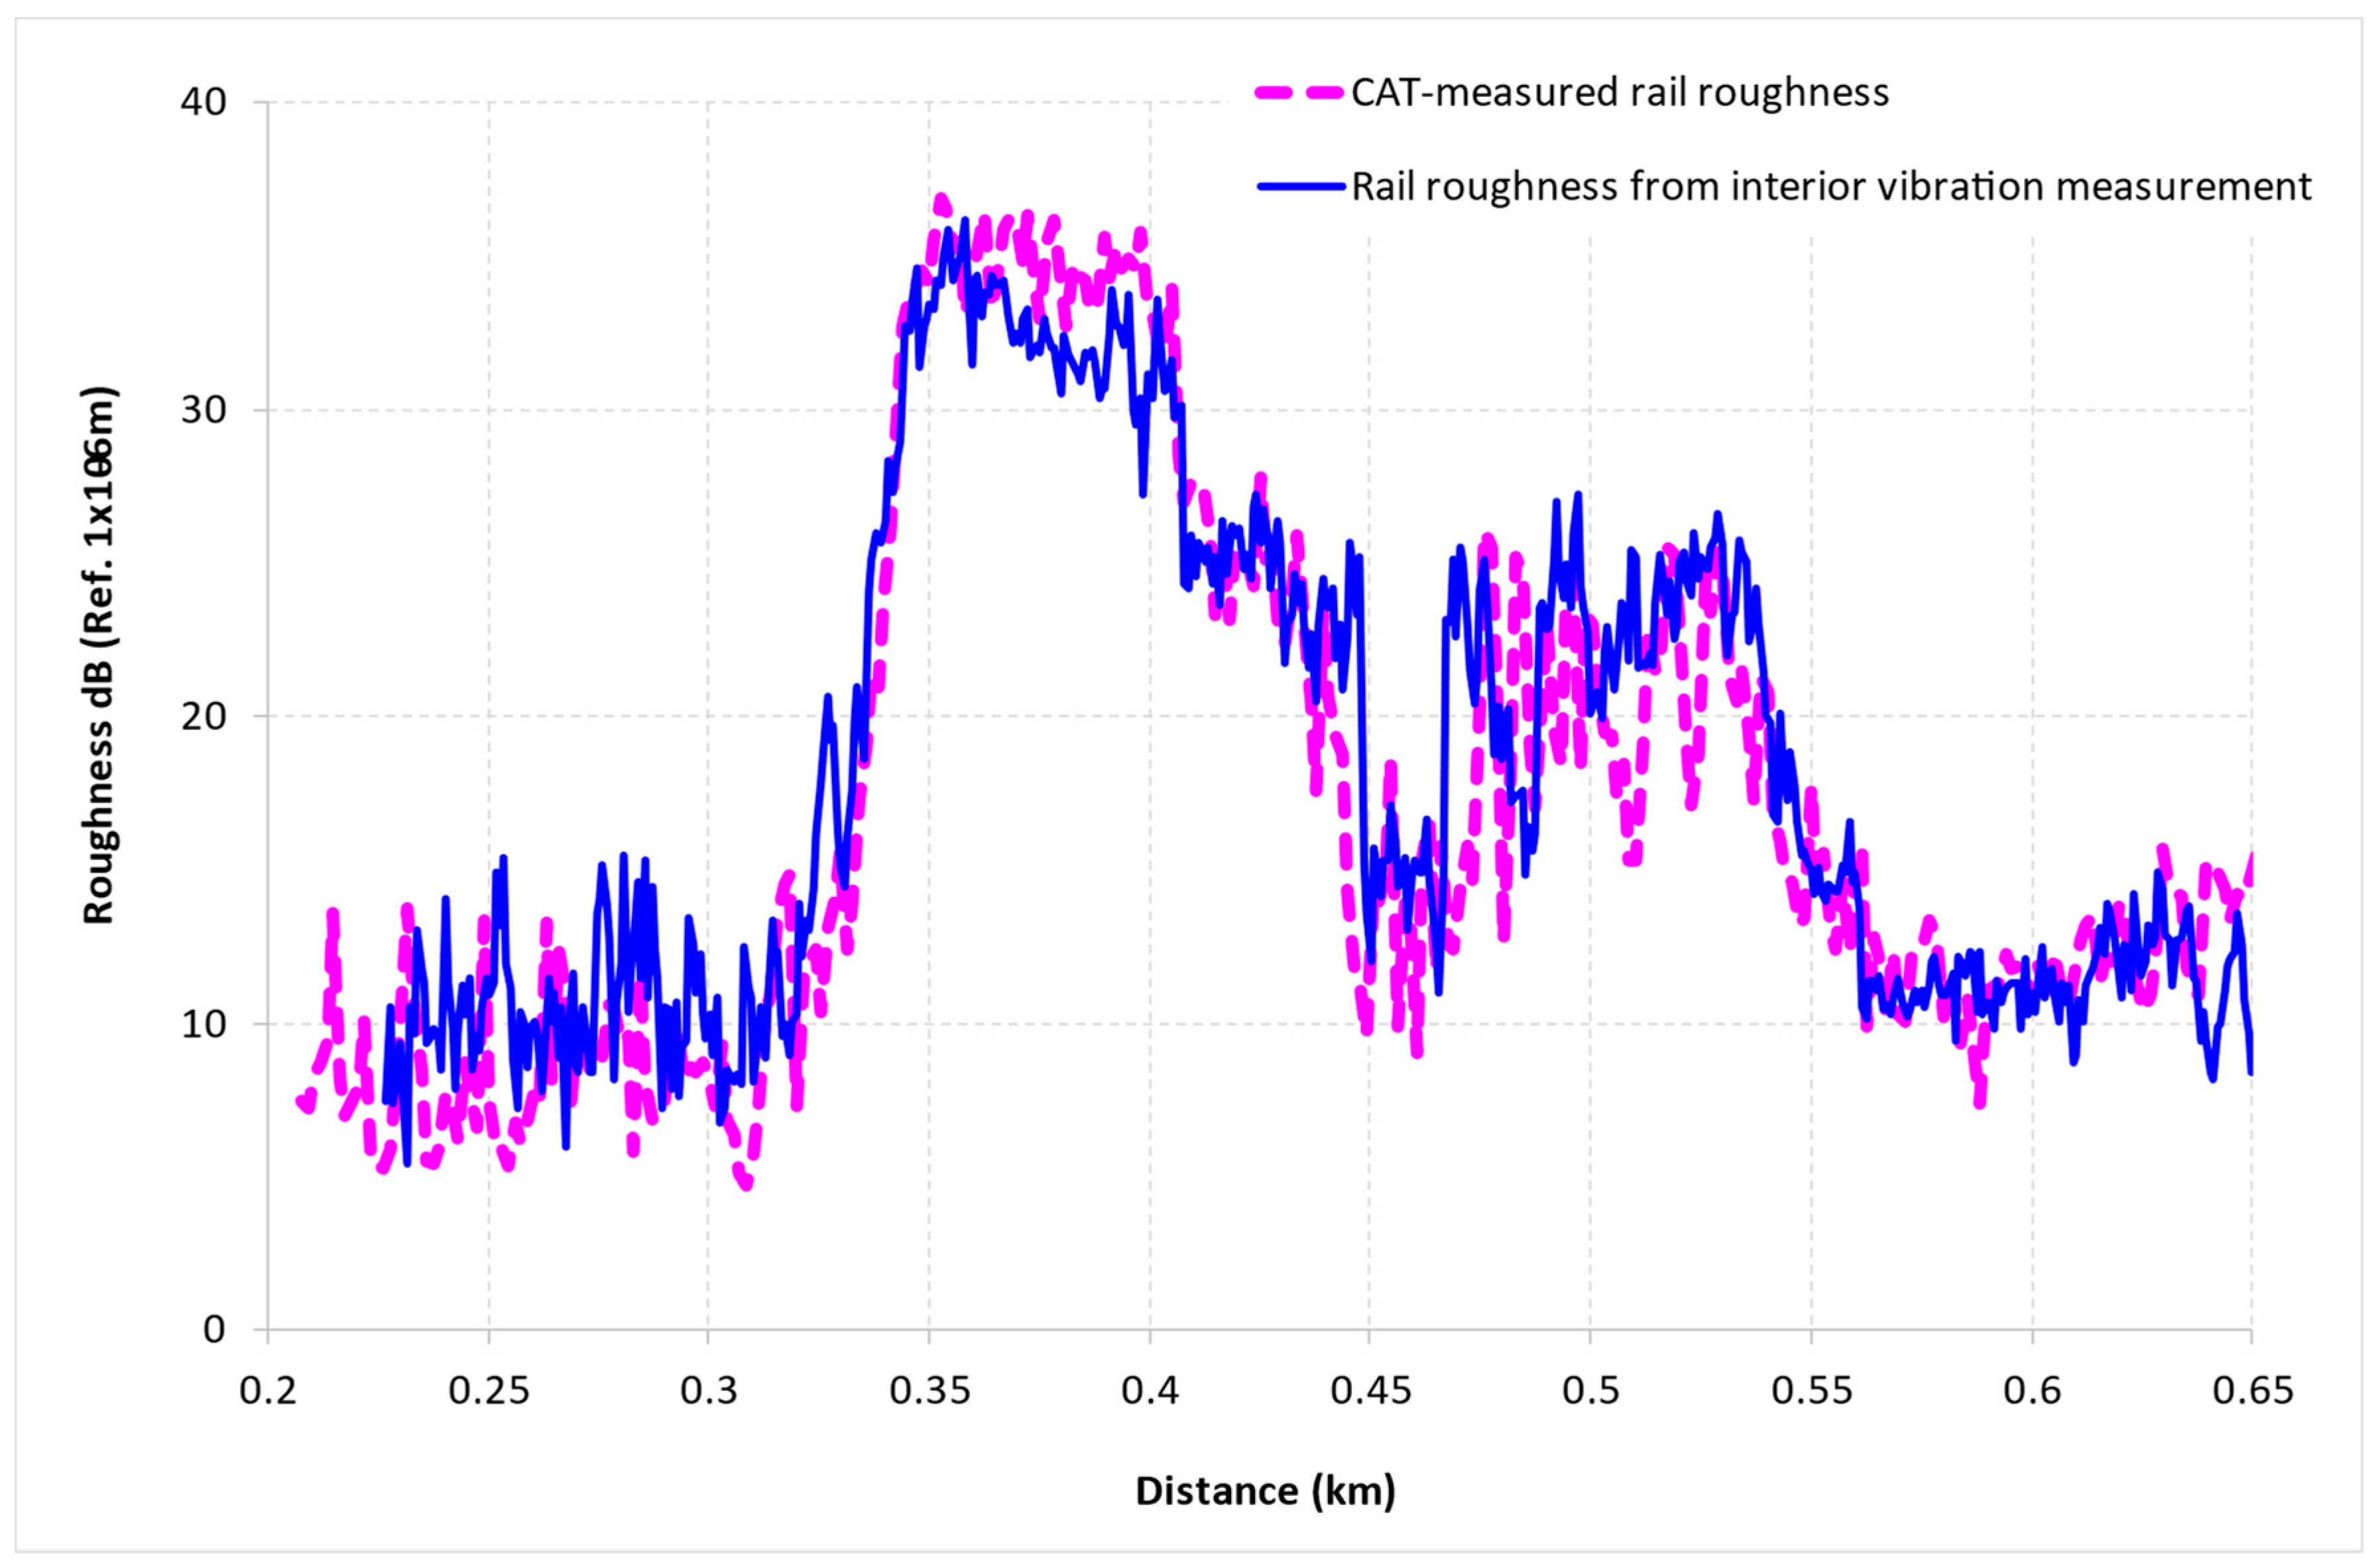
Rail roughness from both the indirect method interior vibration response and CAT measurement at curve C1 are plotted in Figure 23. CAT data are in magenta, and roughness computed from the indirect method is plotted in blue. Both sets of data agree well in terms of location in mileage along the track, and magnitude as the depth of the corrugation trough.
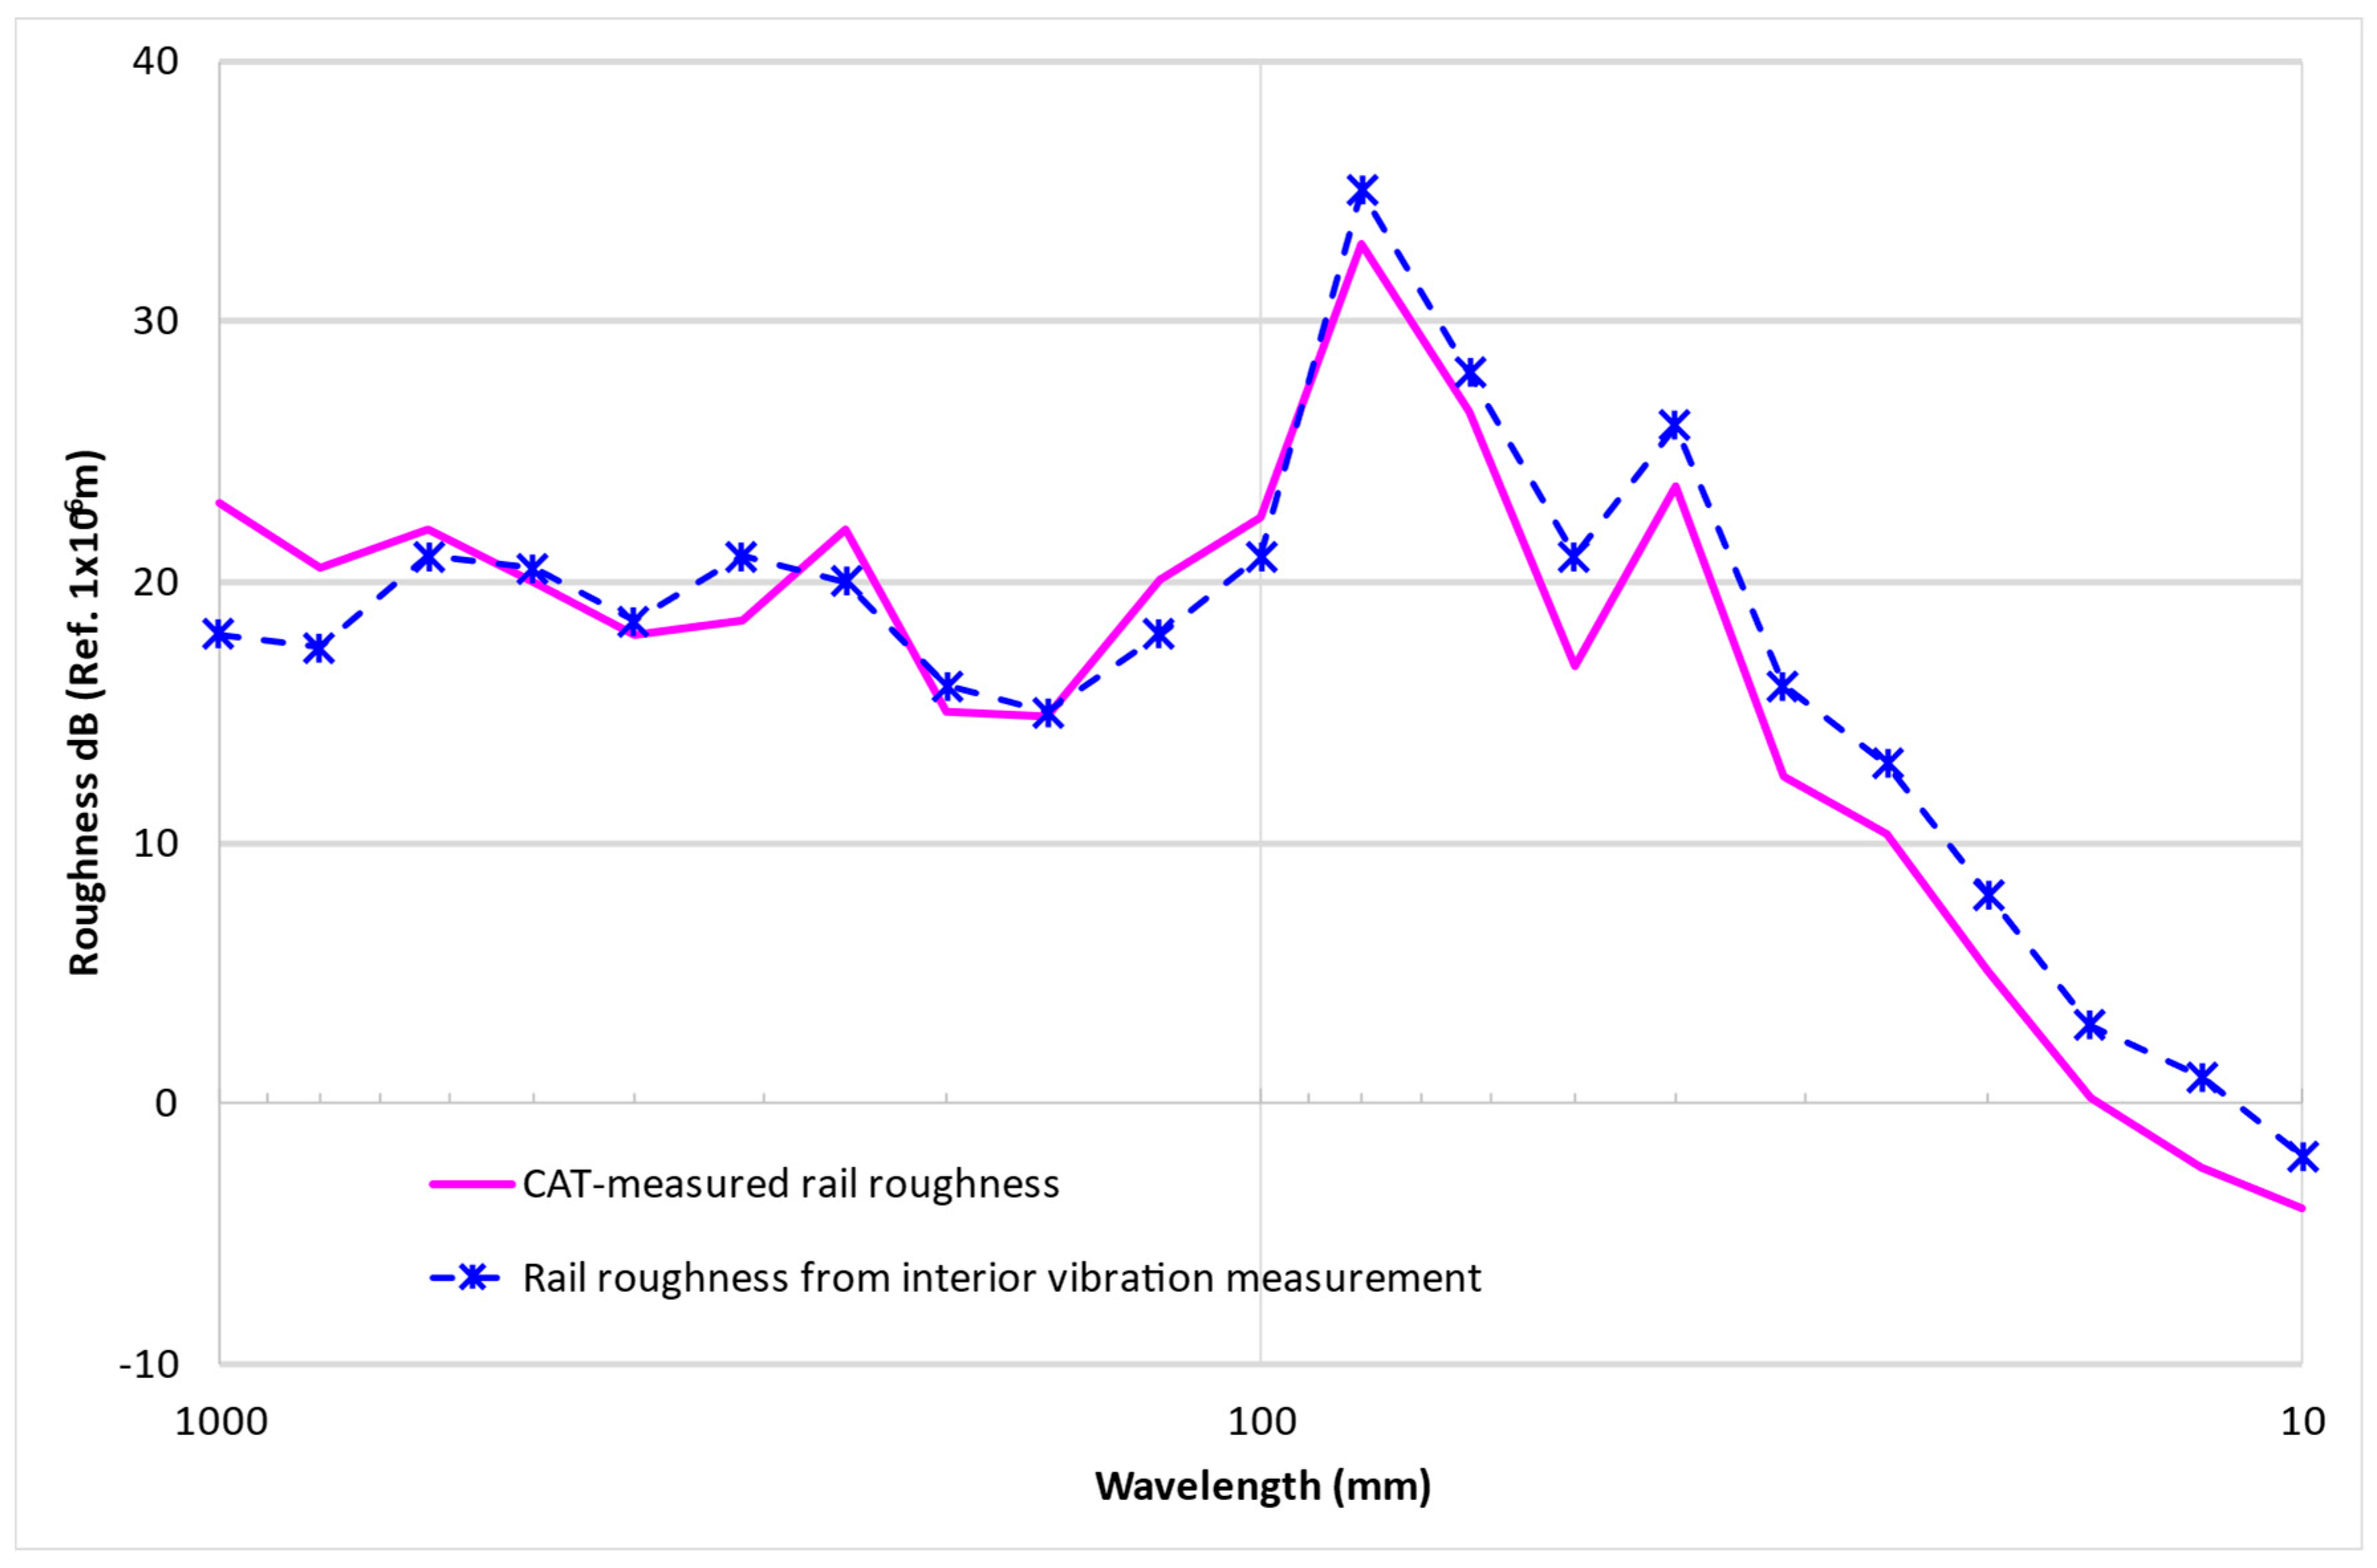
Frequency domain roughness at curve C1 from 0.313 km to 0.428 km, where corrugation is salient, is plotted in Figure 24. The magenta line is the 1/3 octave band spectrum of CAT-measured rail roughness. The blue line is the rail roughness computed using the newly proposed indirect method. The characteristic wavelengths of corrugation at C1 are 80 mm and 40 mm as per Figure 20, which are well-captured by using the indirect method, with the magnitude of trough depths consistent with CAT measurements. The peaks of vibration magnitude match well with CAT-measured peaks at the corresponding frequency bands, which are summarised in Table 5.
A Pearson Correlation analysis was performed for the two sets of data, namely rail roughness computed using the indirect method and direct CAT measurement data. According to Equation (17), correlation coefficients r of 1.0 and 0.9964 for peak magnitude frequencies and corrugation depth, respectively, are obtained. As a general rule of thumb, strong correlation is achieved if r is greater than 0.5. So the correlation between the two datasets is considered strong, and the validation is successful; the new method is thus considered satisfactory in terms of accuracy.
r = n x y x y n x 2 x 2 n y 2 y 2
wherein x   a n d   y are the two datasets for which the correlation is to be evaluated.

7.2. Discussions

Train vehicle interior noise and vibration signals have been analysed in both the time and frequency domains. To capture dynamic characteristics, frequency domain analyses are of importance. In Section 5, dynamic characteristics distinguishing the curved sections from straight-line tracks and specifically focusing on the curved-sections have been analysed.
Direct measurement using a held-held Corrugation Analysis Trolley (CAT), which is used as the validation dataset, have also been analysed in-depth, in both the time and frequency domains. Characteristic frequencies, which are often referred to as the pinned-pinned frequencies in the industry for the short-pitch corrugation, have been identified, together with the amplitude of corrugation, as the depth of the trough.
So, through our method, interior noise and vibration data as the output of a dynamic system have been analysed, transfer functions in terms of wheel–rail receptance and train–track accelerance have been measured and established, and short-pitch corrugation dynamic characteristics using the method have been obtained.
Finally, the indirect diagnosis method of using the train vehicle interior noise and vibration signals, and transfer functions of the dynamic system, is capable of recognising the rail roughness amplitude with all characteristic such as wavelength details along the track.

8. Conclusions

This paper presents an indirect method for the diagnosis of short-pitch rail corrugation, enabling the accurate identification of its location and dynamic characteristics, using noise and vibration responses measured inside a running train vehicle, and the system transfer functions of the train–track system. The proposed method has been applied to a test train–track system, where corrugation is severe at curves. Time domain and frequency domain analyses have been undertaken for both directly measured rail roughness using CAT, and interior noise and vibration signals. Computed rail roughness using interior measurement data are compared against directly measured rail roughness at the first small radius curve C1. The comparison shows good agreements, both in terms of rail roughness and peak magnitude frequency bands, between the indirect method and CAT data. The proposed indirect method therefore has been successfully validated with a high accuracy, overcoming the compromise between measurement speed and accuracy; thus, our findings can be used to assist railway operators for the detection of rail corrugation and maintenance planning.

Author Contributions

Conceptualization, A.W. and Z.Y.; methodology, A.W. and X.P.G.; software, X.P.G.; validation, A.W. and X.P.G.; formal analysis, X.P.G. and A.W.; investigation, X.P.G. and L.S.; resources, A.W. and Z.Y.; data curation, X.P.G. and A.W.; writing—original draft preparation, X.P.G.; writing—review and editing, A.W.; visualisation, X.P.G. and L.S.; supervision, A.W.; project administration, X.P.G., L.S. and Z.Y.; funding acquisition, A.W. and Z.Y. All authors have read and agreed to the published version of the manuscript.

Funding

This research received no external funding.

Institutional Review Board Statement

Not applicable.

Informed Consent Statement

Not applicable.

Data Availability Statement

Data supporting the findings of this study are available from the corresponding author upon reasonable request.

Acknowledgments

The work was supported by the National Natural Science Foundation of China, Natural Science Foundation General Project no. 52178441.

Conflicts of Interest

Author Ziquan Yan and Linlin Sun were employed by Railway Engineering Research Institute, China Academy of Railway Sciences Corporation Limited. The remaining authors declare that the research was conducted in the absence of any commercial or financial relationships that could be construed as a potential conflict of interest.

References

  1. Jeong, W. Spectral characteristics of rail surface by measuring the growth of rail corrugation. Appl. Sci. 2021, 11, 9568. [Google Scholar] [CrossRef]
  2. Oostermeijer, K.H.H. Review on short pitch rail corrugation studies. Wear 2008, 265, 1231–1237. [Google Scholar] [CrossRef]
  3. Brockley, C.A.; Ko, P.L. An investigation of rail corrugation using friction-induced vibration theory. Wear 1988, 128, 99–106. [Google Scholar] [CrossRef]
  4. Ahlbeck, D.R.; Daniels, L.E. Investigation of rail corrugations on the Baltimore Metro. Wear 1991, 144, 197–210. [Google Scholar] [CrossRef]
  5. Tassilly, E.; Vincent, N. Rail corrugations: Analytical model and field tests. Wear 1991, 144, 163–178. [Google Scholar] [CrossRef]
  6. Grassie, S.L.; Kalousek, J. Rail Corrugation: Characteristics, Causes and Treatments. Proc. Inst. Mech. Eng. F J. Rail Rapid Transit. 1993, 207, 57–68. [Google Scholar] [CrossRef]
  7. Grassie, S.L. Rail corrugation: Characteristics, causes, and treatments. Proc. Inst. Mech. Eng. F J. Rail Rapid Transit. 2009, 223, 581–596. [Google Scholar] [CrossRef]
  8. Grassie, S.L. Rail corrugation: Advances in measurement, understanding and treatment. Wear 2005, 258, 1224–1234. [Google Scholar] [CrossRef]
  9. Korpanec, I.; Pradier, H.P. Practical implementation of results of ORE-ERRI research on wheel-rail contact interaction on the European railways. Wear 1996, 191, 121–125. [Google Scholar] [CrossRef]
  10. Igeland, A.; Ilias, H. Rail head corrugation growth predictions based on non-linear high frequency vehicle/track interaction. Wear 1997, 213, 90–97. [Google Scholar] [CrossRef]
  11. Vadillo, E.G.; Tárrago, J.A.; Zubiaurre, G.G.; Duque, C.A. Effect of sleeper distance on rail corrugation. Wear 1998, 217, 140–145. [Google Scholar] [CrossRef]
  12. Jin, X.; Xiao, X.; Wen, Z.; Zhou, Z. Effect of sleeper pitch on rail corrugation at a tangent track in vehicle hunting. Wear 2008, 265, 1163–1175. [Google Scholar] [CrossRef]
  13. Ilias, H. The influence of railpad stiffness on wheelset/track interaction and corrugation growth. J. Sound Vib. 1999, 227, 935–948. [Google Scholar] [CrossRef]
  14. Egana, J.I.; Vinolas, J.; Seco, M. Investigation of the influence of rail pad stiffness on rail corrugation on a transit system. Wear 2006, 261, 216–224. [Google Scholar] [CrossRef]
  15. Meehan, P.A.; Bellette, P.A.; Horwood, R.J. “Does god play dice with corrugations?”: Environmental effects on growth. Wear 2014, 314, 254–260. [Google Scholar] [CrossRef]
  16. Bellette, P.A.; Meehan, P.A.; Daniel, W.J.T. Effects of variable pass speed on wear-type corrugation growth. J. Sound Vib. 2008, 314, 616–634. [Google Scholar] [CrossRef]
  17. Meehan, P.A.; Batten, R.D.; Bellette, P.A. The effect of non-uniform train speed distribution on rail corrugation growth in curves/corners. Wear 2016, 366–367, 27–37. [Google Scholar] [CrossRef]
  18. Batten, R.D.; Bellette, P.A.; Meehan, P.A.; Horwood, R.J.; Daniel, W.J.T. Field and theoretical investigation of the mechanism of corrugation wavelength fixation under speed variation. Wear 2011, 271, 278–286. [Google Scholar] [CrossRef]
  19. Brockley, C.A. The influence of track support structure and locomotive traction characteristics on short wavelength corrugations. Wear 1992, 153, 315–322. [Google Scholar] [CrossRef]
  20. Ishida, M.; Moto, T.; Takikawa, M. The effect of lateral creepage force on rail corrugation on low rail at sharp curves. Wear 2002, 253, 172–177. [Google Scholar] [CrossRef]
  21. Saulot, A.; Descartes, S.; Desmyter, D.; Levy, D.; Berthier, Y. A tribological characterization of the “damage mechanism” of low rail corrugation on sharp curved track. Wear 2006, 260, 984–995. [Google Scholar] [CrossRef]
  22. Suda, Y.; Hanawa, M.; Okumura, M.; Iwasa, T. Study on rail corrugation in sharp curves of commuter line. Wear 2002, 253, 193–198. [Google Scholar] [CrossRef]
  23. Suda, Y.; Komine, H.; Iwasa, T.; Terumichi, Y. Experimental study on mechanism of rail corrugation using corrugation simulator. Wear 2002, 253, 162–171. [Google Scholar] [CrossRef]
  24. Matsumoto, A.; Sato, Y.; Ono, H.; Tanimoto, M.; Oka, Y.; Miyauchi, E. Formation mechanism and countermeasures of rail corrugation on curved track. Wear 2002, 253, 178–184. [Google Scholar] [CrossRef]
  25. Sato, Y.; Matsumoto, A.; Knothe, K. Review on rail corrugation studies. Wear 2002, 253, 130–139. [Google Scholar] [CrossRef]
  26. Wu, T.X.; Thompson, D.J. An investigation into rail corrugation due to micro-slip under multiple wheel/rail interactions. Wear 2005, 258, 1115–1125. [Google Scholar] [CrossRef]
  27. Andersson, C.; Johansson, A. Prediction of rail corrugation generated by three-dimensional wheel-rail interaction. Wear 2004, 257, 423–434. [Google Scholar] [CrossRef]
  28. Jin, X.S.; Wen, Z.F. Effect of discrete track support by sleepers on rail corrugation at a curved track. J. Sound Vib. 2008, 315, 279–300. [Google Scholar] [CrossRef]
  29. Torstensson, P.T.; Schilke, M. Rail corrugation growth on small radius curves-Measurements and validation of a numerical prediction model. Wear 2013, 303, 381–396. [Google Scholar] [CrossRef]
  30. Torstensson, P.T.; Nielsen, J.C.O. Monitoring of rail corrugation growth due to irregular wear on a railway metro curve. Wear 2009, 267, 556–561. [Google Scholar] [CrossRef]
  31. Torstensson, P.T.; Pieringer, A.; Nielsen, J.C.O. Simulation of rail roughness growth on small radius curves using a non-Hertzian and non-steady wheel-rail contact model. Wear 2014, 314, 241–253. [Google Scholar] [CrossRef]
  32. Han, J.; Xiao, X.; Wu, Y.; Wen, Z.; Zhao, G. Effect of rail corrugation on metro interior noise and its control. Appl. Acoust. 2018, 130, 63–70. [Google Scholar] [CrossRef]
  33. Gu, X.P.; Ma, Z.; Wang, A.; Ju, L.; Chai, X.; Gao, X. Cost Effectiveness of Noise and Vibration Mitigation Measures Using Life-Cycle Cost Analysis. In Noise and Vibration Mitigation for Rail Transportation Systems; Springer: Cham, Switzerland, 2021; pp. 214–221. [Google Scholar] [CrossRef]
  34. Egana, J.I.; Vinolas, J.; Gil-Negrete, N. Effect of liquid high positive friction (HPF) modifier on wheel-rail contact and rail corrugation. Tribol. Int. 2005, 38, 769–774. [Google Scholar] [CrossRef]
  35. Maes, J.; Sol, H. A double tuned rail damper—Increased damping at the two first pinned–pinned frequencies. J. Sound Vib. 2003, 267, 721–737. [Google Scholar] [CrossRef]
  36. Thompson, D.J.; Jones, C.J.C.; Waters, T.P.; Farrington, D. A tuned damping device for reducing noise from railway track. Appl. Acoust. 2007, 68, 43–57. [Google Scholar] [CrossRef]
  37. Croft, B.E.; Jones, C.J.C.; Thompson, D.J. Modelling the effect of rail dampers on wheel–rail interaction forces and rail roughness growth rates. J. Sound Vib. 2009, 323, 17–32. [Google Scholar] [CrossRef]
  38. Ma, Z.; Wang, A.; Gao, X.; Gu, X.; Ju, L.; Wang, Z. Rail Vibration and Rolling Noise Reduction Using Tuned Rail Damper for Vulcanized Bonded Baseplate. In Noise and Vibration Mitigation for Rail Transportation Systems; Springer: Cham, Switzerland, 2021; pp. 671–679. [Google Scholar] [CrossRef]
  39. RailMeasurement, Corrugation Analysis Trolley (CAT). Available online: https://www.railmeasurement.com/ (accessed on 21 August 2024).
  40. Gu, X.P.; Han, Y.; Shi, J.; Wang, A. Rail Corrugation Characteristics Deduced from a Wavelet Analysis of High-Speed Train Interior Noise and Vibration. Shock. Vib. 2024, 2024, 8810338. [Google Scholar] [CrossRef]
  41. ISO 3095-2013; Acoustics—Railway Applications—Measurement of Noise Emitted by Railbound Vehicles. International Organization for Standardization: Geneva, Switzerland, 2013.
  42. ISO 3095-2005; Railway Applications—Acoustics—Measurement of Noise Emitted by Railbound Vehicles. International Organization for Standardization: Geneva, Switzerland, 2005.
  43. ISO 3095:2025; Railway Applications—Acoustics—Measurement of Noise Emitted by Railbound Vehicles. International Organization for Standardization: Geneva, Switzerland, 2025.
  44. EN 13231-2:2020; Railway Applications—Track—Acceptance of Works—Part 2: Acceptance of Reprofiling Rails in Plain Line, Switches, Crossings and Expansion Devices. European Committee for Standardization (CEN): Brussels, Belgium, 2020.
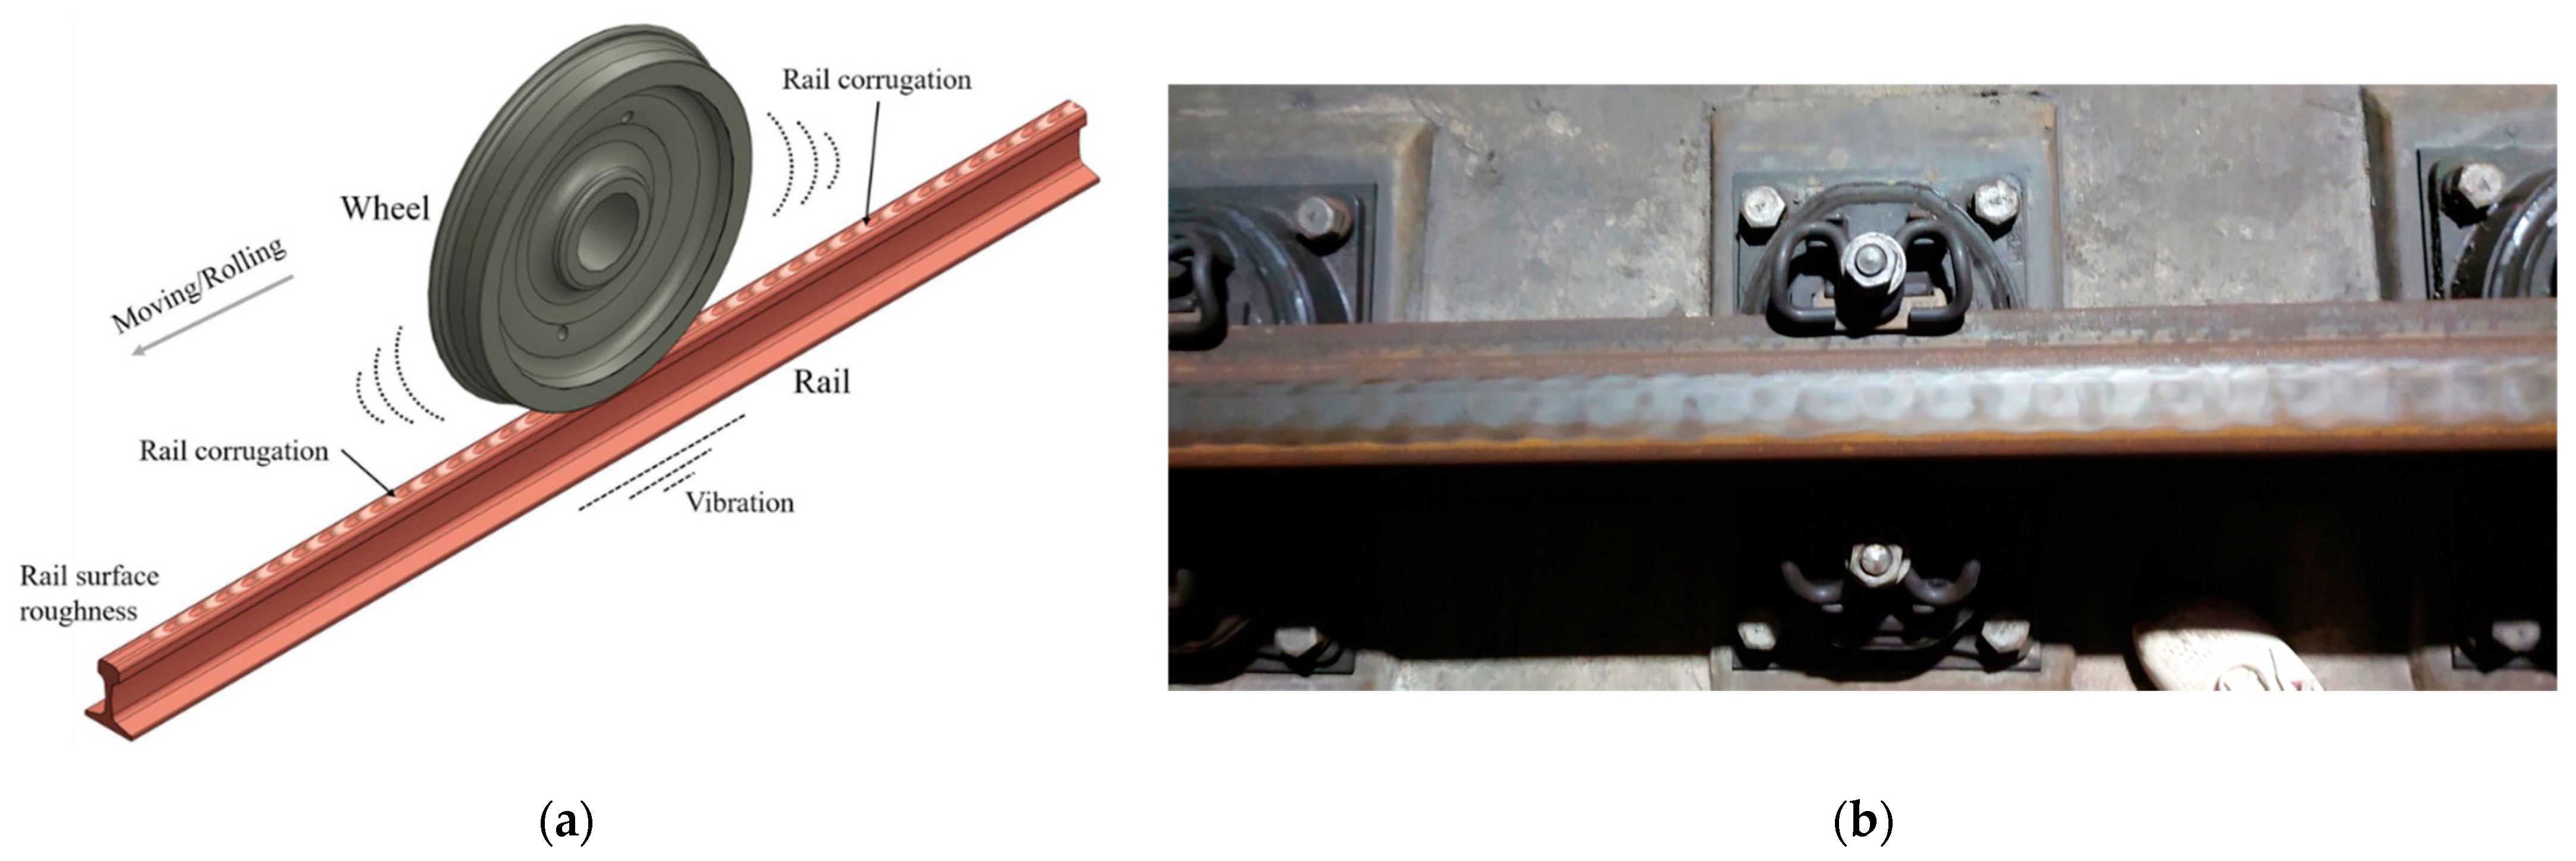
Figure 1. Rail corrugation: (a) An illustration of rail corrugation [1]; (b) a site picture of short-pitch corrugation.
Applsci 15 12262 g001
Figure 2. Conventional rail corrugation measurement devices: (a) CAT; (b) a track inspection vehicle.
Applsci 15 12262 g002
Figure 3. The schematics of a general corrugation mechanism from [6].
Applsci 15 12262 g003
Figure 4. A schematic diagram of the implementation of the indirect diagnosis method.
Applsci 15 12262 g004
Figure 5. Layout of the test tracks.
Applsci 15 12262 g005
Figure 6. Schematic diagram of the excitation points on the wheel–rail system and the impact hammer used in the test.
Applsci 15 12262 g006
Figure 7. Measurement devices inside the train carriage: (a) Accelerometers on the right-hand side (RHS). (b) Microphones on the right-hand side (RHS). (c) Accelerometers and microphones on both sides.
Applsci 15 12262 g007
Figure 8. Accelerometers on the right-hand side (RHS) rail, wheel and axle box: (a) Accelerometers on wheel. (b) Accelerometers on rail, wheel and axle box. (c) Accelerometer on rail in the vertical direction.
Applsci 15 12262 g008
Figure 9. A schematic diagram of the data collection system.
Applsci 15 12262 g009
Figure 10. Excitation force and interior vertical vibration: (a) Impact hammer forces on both wheels. (b) Interior vibration response with the hammer force exerted on the left wheel. (c) Interior vibration response with the hammer force exerted on the right wheel.
Applsci 15 12262 g010
Figure 11. Accelerance of the vertical components of the wheel–rail testing system.
Applsci 15 12262 g011
Figure 12. Receptance of the vertical components of the wheel–rail testing system.
Applsci 15 12262 g012
Figure 13. Rail corrugation on the test rail track found during visual inspection.
Applsci 15 12262 g013
Figure 14. Interior noise and vibration measurement device setup inside the train carriage: (a) Accelerometers on the left side. (b) Two microphones on the right side.
Applsci 15 12262 g014
Figure 15. Interior noise and vibration response: (a) Time histories; (b) spectra.
Applsci 15 12262 g015
Figure 16. Time domain and time–frequency domain contents of interior vertical vibration acceleration.
Applsci 15 12262 g016
Figure 17. Power spectrum of vibration acceleration at the S–curve and the C3.
Applsci 15 12262 g017
Figure 18. CAT measurement on–site.
Applsci 15 12262 g018
Figure 19. Rail roughness of the left and right rails.
Applsci 15 12262 g019
Figure 20. CAT–measured rail roughness of the inner rail at C1.
Applsci 15 12262 g020
Figure 21. CAT–measured rail roughness of the inner rail at C2: (a) mileage from K0.449 to K0.490; (b) mileage from K0.490 to K0.565.
Applsci 15 12262 g021
Figure 22. CAT–measured rail roughness of the inner rail at C3.
Applsci 15 12262 g022
Figure 23. Time histories of CAT–measured roughness vs. roughness using indirect method.
Applsci 15 12262 g023
Figure 24. Spectrum of CAT–measured roughness vs. roughness using indirect method.
Applsci 15 12262 g024
Table 1. Comparison of measurement time and cost input and level of accuracy by direct methods.
Direct MethodLevel of AccuracyTime and Cost
CATGood for short-pitch corrugationMeasurement speed: walking speed, typically 4–6 km/h;
using less expensive hand-held devices.
Inspection vehicleInsufficient for short-pitch corrugationMeasurement speed: 5–35 km/h; need to hire inspection vehicles.
Table 2. Sub-sections of the test track.
Section CodeStarting MileageEnd MileageGeometryFastener Type
S1K0.0K0.313Straight line leaving the stationNon-resilient
C1K0.313K0.428Right-curveCologne eggs
T1K0.428K0.449Transition between 2 curvesCologne eggs
C2K0.449K0.565Left-curveCologne eggs
T2K0.565K0.780Transition from curve to straight lineCologne eggs
S2K0.780K1.410Straight lineNon-resilient
T3K1.410K1.597Transition from straight line to curveCologne eggs
C3K1.597K1.745Left-curveCologne eggs
S3K1.745K1.861Straight line entering the stationNon-resilient
Table 3. Measurement sensor properties.
Sensor TypeMeasurement PointsMeasurement RangeSensitivityFrequency Range
PCB 352C03Wheels and rails (Figure 8)±500 g pk(±10%) 10 mV/g(±5%) 0.5 to 10,000 Hz
PCB 353A03Floor inside train carriage (Figure 7a)±5 g pk(±5%) 1000 mV/g(±5%) 0.5 to 2000 Hz
B&K 377B02All noise measurement points146 dB48.4 mV/Pa(±5%) 20 to 20,000 Hz
Table 4. Fixed wavelength computed from peak frequencies at a train speed of 65 km/h.
Mode IDModal Frequency (Hz)Fixed Wavelength (mm)
122182
229561
352035
Table 5. Comparison of CAT–measured rail corrugation and from interior vibration.
Mode IDFixed Wavelength (mm)
(1/3 Octave Band)
Corrugation Depth (dB)
(Ref. 1 × 10⁻⁶ m)
CAT–MeasuredComputed from Interior VibrationCAT–MeasuredComputed from Interior Vibration
180803335
2636326.528
3404023.726
Disclaimer/Publisher’s Note: The statements, opinions and data contained in all publications are solely those of the individual author(s) and contributor(s) and not of MDPI and/or the editor(s). MDPI and/or the editor(s) disclaim responsibility for any injury to people or property resulting from any ideas, methods, instructions or products referred to in the content.