Article

Multidimensional Maintenance Maturity Modeling: Fuzzy Predictive Model and Case Study on Ensuring Operational Continuity Under Uncertainty

by
Lech Bukowski
1 and
Sylwia Werbinska-Wojciechowska
2,*
1
Department of Management Engineering, WSB University, 1c Zygmunta Cieplaka Street, 41-300 Dabrowa Gornicza, Poland
2
Faculty of Mechanical Engineering, Wroclaw University of Science and Technology, Wyspianskiego 27, 50-370 Wroclaw, Poland
*
Author to whom correspondence should be addressed.
Appl. Sci. 2025, 15(22), 12236; https://doi.org/10.3390/app152212236
Submission received: 7 October 2025 / Revised: 11 November 2025 / Accepted: 12 November 2025 / Published: 18 November 2025

Featured Application

The proposed Integrated Maintenance Maturity Model (IMMM), enhanced with fuzzy logic, can be applied in industrial practice to assess and improve maintenance strategies under uncertainty. By integrating resilience, sustainability, and predictive analytics, the model supports organizations in identifying maturity gaps, prioritizing improvements, and ensuring operational continuity. Its applicability has been demonstrated in the automotive sector but can be extended to other industries such as mining, energy, and logistics, where high system reliability and adaptability are essential.

Abstract

Ensuring operational continuity in modern industrial systems requires maintenance strategies that are both mature and adaptive to uncertainty. This study introduces and validates the Integrated Maintenance Maturity Model (IMMM), a multidimensional framework that combines reliability, safety, resilience, flexibility, and sustainability into a structured maturity assessment approach. Building on the conceptual foundations of maintenance maturity modeling, the IMMM is enhanced with fuzzy logic to address uncertainty, incorporate expert knowledge, and enable nuanced evaluations. A fuzzy inference system based on Mamdani logic was developed to integrate linguistic variables, apply rule-based reasoning, and defuzzify results into maturity scores. The model also includes additional parameters, such as technology adaptability and resource efficiency, to reflect real-world operational complexity. The applicability of the proposed framework was demonstrated through a case study in the automotive sector, where the fuzzy IMMM identified maturity gaps, supported decision-making, and provided strategic recommendations for advancing maintenance practices. Results confirm the model’s effectiveness in enhancing system dependability, adaptability, and sustainability under uncertainty. This work contributes to the development of predictive, uncertainty-aware maintenance maturity models and offers a practical tool for organizations seeking to strengthen operational resilience while aligning with long-term sustainability goals.

1. Introduction

In modern industrial systems, maintenance maturity is crucial for operational efficiency, asset longevity, and cost-effectiveness [1]. In recent years, maintenance has evolved from a purely operational function toward a strategic capability that integrates reliability, adaptability, and sustainability. However, traditional maturity models have not kept pace with this evolution, often evaluating only single aspects, such as cost, reliability, or efficiency, without accounting for interdependencies among system, human, and environmental factors. However, the growing complexity of production systems and sustainability requirements demand adaptive, data-driven maintenance strategies capable of operating under uncertainty [2]. A mature maintenance system enhances reliability, minimizes downtime, optimizes resources, and ensures regulatory compliance while aligning with sustainability goals such as energy efficiency and waste reduction [3].
Recently, technological advancements, including Internet of Things (IoT) and Artificial Intelligence (AI)-driven analytics, require rethinking traditional maintenance models [4]. Additionally, interdependencies between production, logistics, and maintenance introduce cascading risks, while aging infrastructure and workforce shortages necessitate smarter strategies balancing efficiency. At the same time, regulatory and Environmental, Social, and Governance (ESG) pressures require continuous adaptation and transparent performance tracking [5]. However, traditional maintenance maturity models remain deterministic assessments that fail to capture real-world uncertainties, such as unexpected failures and supply chain disruptions [6,7].
Resilient maintenance enables sustained performance by anticipating, monitoring, and responding to disruptions [6,8]. Resilience-oriented maintenance emphasizes the system’s ability to anticipate and adapt to disturbances while maintaining operational continuity. Yet, resilience alone is insufficient without sustainability, which ensures the long-term balance between technical performance, environmental responsibility, and economic viability [9,10,11,12].
While resilience focuses on system adaptability, sustainable maintenance integrates environmental and economic responsibility, ensuring long-term viability [13,14]. Sustainable practices aim to reduce energy use, optimize resources, and minimize emissions while maintaining technical reliability [13,15,16,17]. Together, resilience and sustainability create a dual foundation for modern maintenance—balancing operational continuity with environmental responsibility.
The synergy between resilience and sustainability in maintenance is becoming increasingly important in industrial systems [18]. A resilient system without sustainability may recover but at high cost, whereas a sustainable system without resilience may fail under pressure. Integrating these two concepts allows organizations to develop adaptive, long-term maintenance strategies that balance economic efficiency, environmental responsibility, and operational stability [15,19].
However, despite their recognized importance, existing maintenance maturity frameworks rarely integrate resilience and sustainability within a unified assessment structure. Most models remain one-dimensional and deterministic, limiting their ability to support proactive decision-making under uncertainty. This gap creates a strong rationale for an integrated and uncertainty-aware model.
Recent studies highlight the growing importance of resilience and sustainability in maintenance management. Although advanced tools such as digital twins and AI-driven predictive analytics are increasingly used, they are not embedded in holistic maturity frameworks that reflect resilience, flexibility, and sustainability simultaneously. This limitation motivates the development of a new multidimensional, fuzzy-based model that explicitly integrates these aspects [18,19].
Maintenance maturity refers to the progressive development of maintenance strategies, transitioning from reactive to optimized practices [3]. Established models such as PAS 55, ISO 55000, and Reliability Centered Maintenance (RCM) focus on reliability and cost-efficiency but often neglect broader industrial dynamics [20]. Most models are deterministic, relying on rigid scoring schemes (e.g., checklist or binary assessments) that fail to capture modern challenges such as adaptability and proactive capabilities [21,22,23]. This inherent rigidity is a major practical shortcoming, as it cannot accurately assess the nuanced, subjective, and data-scarce conditions prevalent in many real-world industrial settings.
In addition, most existing maintenance maturity models do not directly address the inherent uncertainty in modern industrial systems. These models also lack sufficient flexibility to effectively deal with unexpected failures, supply chain disruptions, or changing regulations. Moreover, current models rarely articulate how maturity assessment can support strategic foresight, long-term planning, and cross-sectoral adaptability. Therefore, the IMMM thus redefines maintenance maturity as an integrated, strategic capability to maintain dependability, adaptability, and sustainability despite uncertainty. By combining multidimensional modeling with fuzzy inference, the model enables predictive and prescriptive assessment—providing actionable insights for continuous improvement and operational continuity.
Following this, the article presents the Integrated Maintenance Maturity Model (IMMM)—a multidimensional framework that incorporates five key maturity potentials: reliability, safety, resilience, flexibility, and environmental impact. The IMMM’s fundamental advantage is that it shifts the paradigm from deterministic diagnosis to flexible, prescriptive assessment. Using a fuzzy logic-based inference system, IMMM enables nuanced assessment under uncertain conditions by effectively transforming qualitative expert knowledge into a precise, quantitative score. This overcomes the practical barrier faced by data-hungry models and provides a more accurate reflection of maintenance performance.
In this study, maintenance maturity is defined as the degree to which a maintenance system is systematically structured, managed, and continuously improved to ensure reliability, safety, resilience, and sustainability under uncertain conditions. It reflects not only technical performance (availability, failure rates, costs) but also strategic capabilities to anticipate, adapt, and recover effectively.
Therefore, maintenance maturity represents a long-term capability perspective, distinguishing it from short-term performance metrics. Within the proposed Integrated Maintenance Maturity Model (IMMM), this maturity is operationalized through five interrelated potentials, i.e., Reliability and Availability (P1), Safety and Security (P2), Resilience and Recovery (P3), Flexibility and Agility (P4), and Sustainability (P5), and evaluated along three overarching system dimensions: Dependability, Adaptability, and Sustainability.
This work is a continuation of the authors’ previous study [24], expanding it with a practical methodology for quantitative maturity evaluation. The proposed model also introduces two new assessment parameters—Technology Adoption Capability and Energy-Aware Maintenance Level, to better capture digitalization and environmental performance.
Although the fuzzy inference method applied in this study follows the classical Mamdani framework, its novelty lies in its hierarchical integration of multiple maturity potentials and its quantitative linkage to resilience and sustainability outcomes. The proposed IMMM extends beyond traditional fuzzy maintenance applications by:
(i)
Embedding fuzzy reasoning into a hierarchical, multi-potential maturity structure that jointly evaluates dependability, adaptability, and sustainability, integrating strategic dimensions (P3: Resilience and P5: Sustainability) often neglected by established frameworks (e.g., M-SCOR, M3);
(ii)
Introducing two new fuzzy input parameters, Technology Adoption Capability and Energy-Aware Maintenance Level, to reflect the digitalization and sustainability dimensions of modern maintenance;
(iii)
Linking fuzzy outputs directly to strategic decision-support insights that identify maturity gaps and prioritize resilience-enhancing actions, a capability absent in purely diagnostic, deterministic models.
This methodological integration makes IMMM not only a diagnostic tool but also a predictive and prescriptive framework for continuous improvement under uncertainty. Unlike traditional maturity assessments, IMMM combines multidimensional modeling with fuzzy-based inference, providing a robust and holistic approach to maintenance development. Unlike traditional maturity assessment approaches, the proposed Integrated Maintenance Maturity Model (IMMM) introduces a multidimensional structure supported by fuzzy inference logic. The model not only integrates dependability, adaptability, and sustainability dimensions but also incorporates two additional assessment factors, technology adoption capability and energy-aware maintenance level, allowing the evaluation of maintenance maturity. This combination of multidimensional modeling and fuzzy-based inference provides a new, practical way to identify maturity gaps and prioritize strategic improvements that is demonstrably superior in its robustness under uncertainty and its holistic scope. Indeed, the objectives of this study are to:
(1)
Define a hierarchical maturity framework integrating resilience and sustainability;
(2)
Identify input parameters based on key knowledge areas;
(3)
Develop a fuzzy inference system for evaluation under uncertainty;
(4)
Validate the model through an industrial case study.
Therefore, the paper is organized as follows. Section 2 reviews the theoretical foundations of maintenance maturity modeling and highlights the research gap. Section 3 introduces the conceptual framework of the Integrated Maintenance Maturity Model (IMMM) and defines the main maturity potentials. It also presents the fuzzy logic-based methodology used for qualitative and quantitative assessment. Section 4 describes a case study that validates the model in an industrial context. Section 5 discusses the results and implications for maintenance management, while Section 6 concludes with future research directions.

2. Theoretical Background

In this section, the authors comprehensively review existing studies on maintenance maturity models, resilience in maintenance, sustainable maintenance, and fuzzy logic applications in maintenance management. The review highlights research gaps and justifies the need for an Integrated Maintenance Maturity Model (IMMM) incorporating resilience and sustainability principles.

2.1. One-Dimensional Maintenance Maturity Models

Maintenance Maturity Models (MMMs) are frameworks used to assess and measure the progression of maintenance strategies within organizations, helping them evolve from basic reactive practices to more advanced, optimized methods [3]. These models typically define various maturity levels and provide a structured approach for organizations to improve their maintenance capabilities over time. Several prominent MMMs exist, each with a specific focus and set of criteria. Standards like PAS 55 (now integrated into ISO 55000) provide a comprehensive framework for asset management, with maintenance maturity being a crucial component. These standards emphasize the strategic alignment of maintenance activities with broader organizational objectives, ensuring the long-term health and sustainability of assets [20]. Reliability-Centered Maintenance Maturity Models offer another perspective, evaluating maintenance effectiveness through the lens of system reliability and risk management. These models guide organizations in developing proactive maintenance strategies based on understanding asset functions and the consequences of their failure, prioritizing maintenance efforts according to asset criticality [25]. Total Productive Maintenance (TPM) Maturity Models take a different approach, focusing on maximizing equipment effectiveness by engaging all employees in proactive maintenance practices. TPM emphasizes principles like autonomous maintenance, planned maintenance, and the elimination of major losses to foster a culture of continuous improvement across the entire organization [26].
These models established the foundation for structured maintenance evaluation but remain essentially one-dimensional, focusing on operational excellence, reliability, and cost efficiency. Despite their widespread use, they do not sufficiently address adaptability, resilience, or sustainability—dimensions increasingly critical in dynamic industrial environments. Moreover, their deterministic assessment schemes are too rigid to capture the uncertainty and interdependence inherent in modern maintenance systems. Recent research confirms this limitation [27], emphasizing the need for a new multidimensional approach that integrates resilience and sustainability while maintaining practical adaptability. Such integration requires a reasoning framework, such as fuzzy inference, that can capture subjective expert knowledge and uncertainty in maintenance decision-making without relying solely on extensive data.

2.2. Two-Dimensional Maintenance Perspective

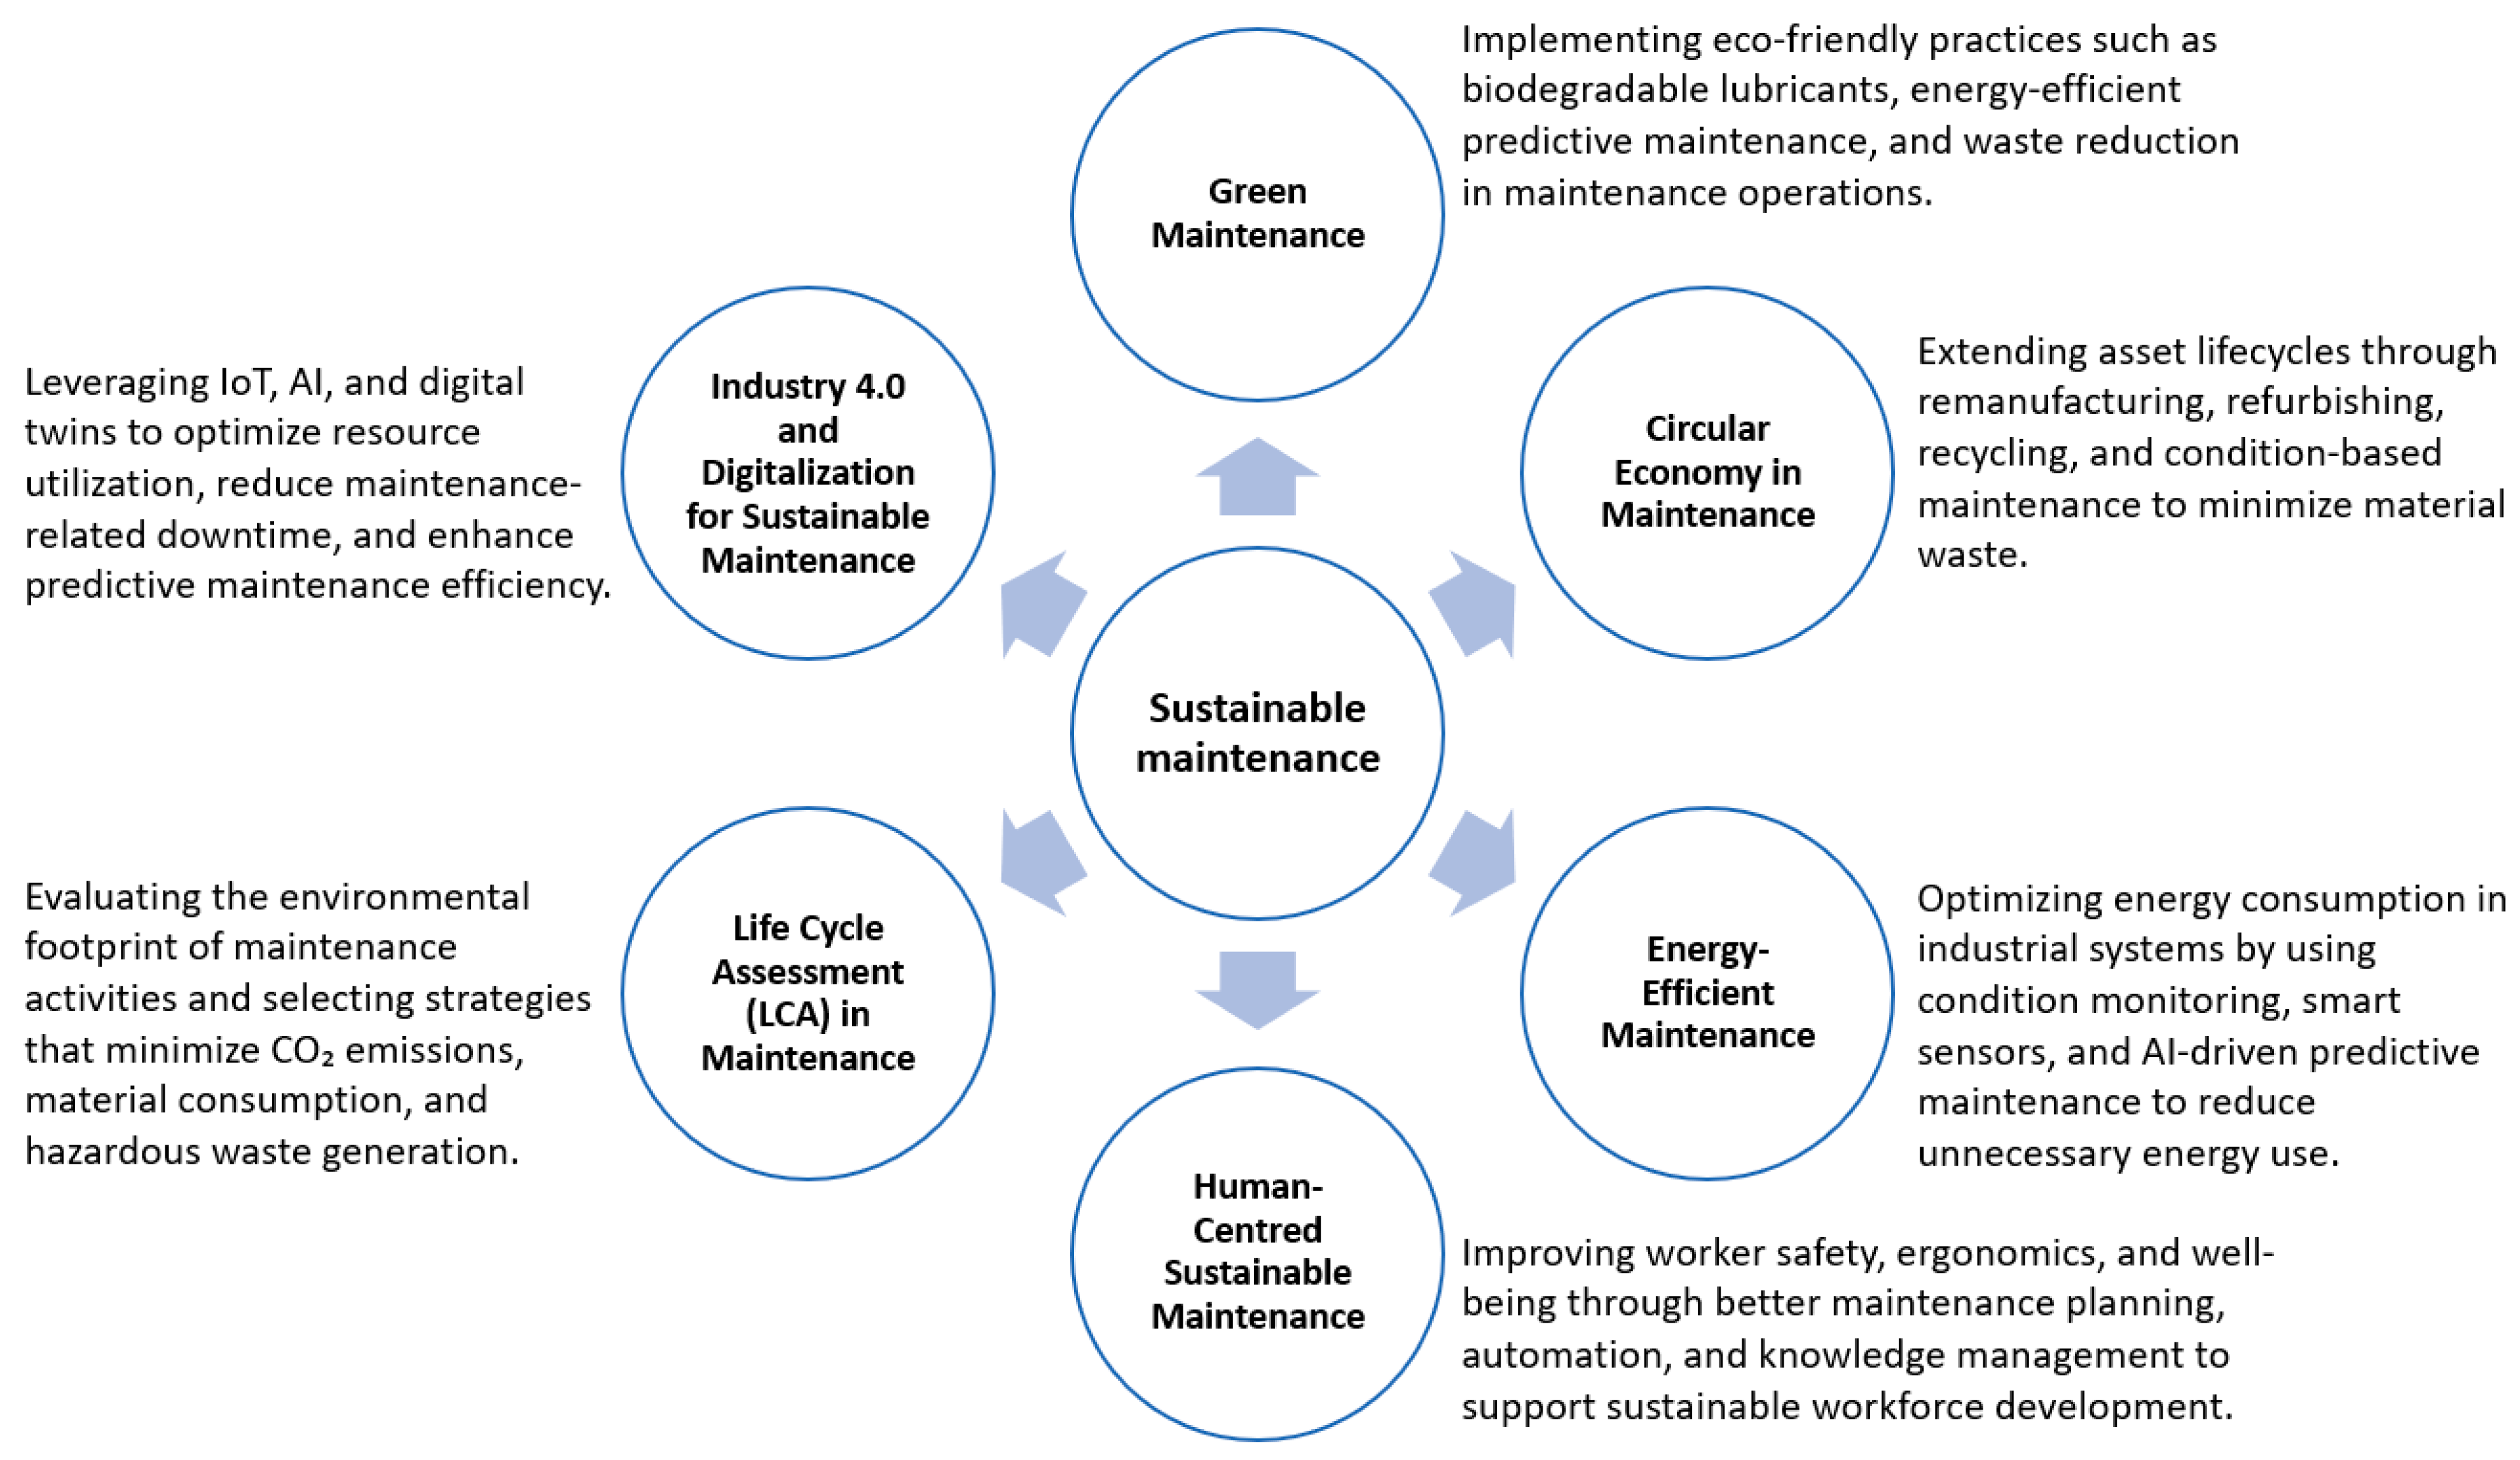
Ensuring operational continuity in industrial systems requires a maintenance approach that integrates resilience, sustainability, and strategies for managing uncertainty. Traditional maintenance maturity models primarily emphasize reliability and cost efficiency but fail to address these dimensions comprehensively. This section explores the role of resilience, sustainability, and uncertainty in maintenance and highlights gaps in relation to maturity modeling. Within this perspective, we can distinguish several key approaches that incorporate resilience and sustainability, addressing both adaptability to disruptions and long-term environmental, economic, and social impacts. These approaches have been summarized in Figure 1 and Figure 2.
Resilience in maintenance extends beyond traditional reliability-focused approaches by incorporating adaptability, failure recovery, and system robustness. Existing frameworks primarily emphasize reliability, efficiency, and cost reduction, yet they often neglect the dynamic nature of industrial environments and the increasing uncertainty affecting maintenance decision-making. Theoretical foundations, such as Hollnagel’s resilience potentials—Respond, Monitor, Anticipate, and Learn—offer a structured way to integrate resilience into maintenance strategies, ensuring operational continuity and adapting to unforeseen disruptions [28,29].
Despite efforts to develop resilience-oriented maintenance strategies, the field still struggles to balance cost efficiency and system adaptability [6]. While resilience-based maintenance expands beyond reliability-centered approaches by emphasizing system recovery and flexibility, challenges remain in implementing adaptive maintenance strategies that adjust dynamically based on evolving system conditions [30,31]. Maturity models for maintenance assessment have also been slow to integrate resilience factors, as most frameworks focus on linear, deterministic progressions that fail to capture the complexity of modern industrial systems. Recent research explores fuzzy-based models to address this gap, allowing for more nuanced evaluations of resilience maturity. However, existing models still lack comprehensive methodologies for quantifying resilience in a structured manner [32,33,34].
Uncertainty remains a central challenge in resilient maintenance. Aleatory uncertainty, driven by random failures and variable operating conditions, and epistemic uncertainty, stemming from incomplete predictive models and diagnostic data, complicate decision-making. Current risk-based maintenance models do not fully account for resilience-enhancing mechanisms such as redundancy, adaptability, and proactive recovery measures [9]. Additionally, while digital technologies, including digital twins and AI-driven predictive analytics, have the potential to strengthen maintenance resilience, their integration into existing maintenance frameworks remains limited [19].
Despite advancements in resilience-oriented maintenance, significant gaps remain. There is a notable lack of quantitative methodologies for assessing resilience, as most existing models provide only qualitative insights without structured measurement frameworks. Additionally, the interplay between sustainability and resilience in maintenance is underexplored, with limited research addressing how organizations can simultaneously enhance both dimensions. Moreover, maintenance decision-making often relies on simplistic cost and reliability trade-offs, failing to incorporate resilience as a key factor.
On the other hand, sustainable maintenance integrates two core dimensions—the environmental and the socio-economic—aspects that together enhance long-term operational efficiency while minimizing negative impacts [14,35] (Figure 2). These two dimensions form the basis of the sustainable maintenance perspective illustrated in Figure 2, where maintenance strategies are linked with Industry 4.0 technologies, energy efficiency, circular economy practices, and human-centered approaches.
Recent surveys on sustainable maintenance problems are presented, e.g., in [13,17,36,37]. Key issues include six main research areas investigated: green maintenance circular economy approach, energy efficiency, human-centered approach, Life Cycle Assessment (LCA) principles implementation, and Industry 4.0 technologies, including IoT, AI, and digital twins development. Additionally, regulatory and policy compliance ensures maintenance aligns with environmental regulations and corporate sustainability goals [14].
The theoretical framework for assessing and improving sustainable maintenance practices has recently focused on robust, multi-criteria methodologies. Jasiulewicz-Kaczmarek and Antosz [38] defined key criteria for sustainable maintenance, emphasizing that its assessment requires a structured, multi-dimensional approach rather than reliance on single indicators. Further advancing this methodological rigor, Jasiulewicz-Kaczmarek and Żywica [39] proposed integrating the Balanced Scorecard with the non-additive fuzzy integral, demonstrating the need for sophisticated, non-linear aggregation techniques to accurately capture the interdependencies among sustainability performance metrics. This line of research continued with the development of comprehensive assessment models utilizing fuzzy set theory to handle the inherent imprecision and subjectivity of sustainability criteria [40]. These studies highlight that Fuzzy Logic is a theoretically proven and necessary tool for building robust sustainability performance models.
Despite these advancements, traditional maintenance maturity models rarely integrate sustainability systematically, highlighting the need for frameworks that assess sustainability performance using measurable indicators such as carbon footprint reduction, resource efficiency, and workforce well-being (see, e.g., [41]). Moreover, the integration of Maintenance 4.0 technologies (like IoT and AI) must be viewed through the lens of sustainability. As demonstrated in [42], these technologies offer new opportunities to drive sustainability-oriented maintenance, linking technological adoption directly to measurable environmental and social outcomes. As highlighted by Madreiter et al. [43], ensuring sustainable maintenance requires identifying and leveraging key technology drivers—such as digitalization, data-driven decision-making, and human-centric approaches—that contribute to manufacturing industries’ positive environmental and social impact. Furthermore, Franciosi et al. [41] propose a comprehensive Maintenance Maturity and Sustainability Assessment Model, which integrates sustainability aspects into maintenance practices through a multi-criteria approach, enabling organizations to align their maintenance strategies with broader sustainability goals.
As a result, future maturity models should integrate sustainability indicators, such as carbon footprint reduction, resource efficiency, and workforce well-being, to ensure alignment with long-term operational and environmental goals.

2.3. Unified Multidimensional Maintenance Perspective

The concept of maintenance maturity has evolved from a purely technical assessment of maintenance capabilities to a more comprehensive, multidimensional construct. Contemporary research emphasizes that effective maintenance should ensure asset availability and reliability and align with broader organizational goals such as sustainability and resilience. However, existing maturity models focus on isolated aspects—operational excellence, sustainability, or resilience—without offering an integrated perspective.
Several studies have highlighted this fragmentation. For example, Franciosi et al. [41] propose a Maintenance Maturity and Sustainability Assessment Model that considers environmental, social, and economic dimensions yet does not explicitly address system resilience. Conversely, Madreiter et al. [43] identify key technology drivers to promote sustainable maintenance but emphasize the need for integrating these drivers with resilience strategies to maintain operational continuity under uncertainty.
This view aligns with Fiksel [44], who argued that resilience and sustainability, while often treated separately, should be approached as interconnected system properties essential for long-term industrial viability. Similarly, Thomas et al. [45] emphasized the need to profile and quantify manufacturing systems’ resilience and sustainability performance, identifying that a lack of integration between these concepts limits strategic planning and response capabilities.
Moreover, Briatore and Braggio [19] highlight the potential of Maintenance 4.0 technologies—such as IoT, Digital Twins, and Cyber-Physical Systems—as key enablers of resilience and sustainability. However, their proposed implementation roadmap still lacks an embedded maturity model to measure the progression and effectiveness of these technologies in supporting both dimensions simultaneously.
Recent research also demonstrates that the transition toward predictive maintenance is increasingly supported by artificial intelligence (AI) and data-driven decision-making frameworks. Machine learning and deep learning algorithms can process heterogeneous sensor data to predict failures, optimize maintenance scheduling, and enhance operational resilience [46]. Similarly, a comprehensive review by Ucar et al. [47] in Applied Sciences highlights that trustworthy AI and explainable predictive models are becoming critical for ensuring sustainable and resilient maintenance ecosystems.
Despite these advancements, no existing maturity model holistically integrates the dual dimensions of resilience, focusing on adaptability, anticipation, recovery, and sustainability, encompassing resource efficiency, environmental impact, and human well-being. This lack of hybrid models becomes especially critical in increasingly volatile operating environments, where organizations must cope with unpredictable disruptions while meeting sustainability targets.
Sagharidooz et al. [18] underscore the value of sustainability-informed maintenance optimization in their work on power transmission networks. Yet, their reliability-based models do not address system adaptability or continuity under disturbance. Similarly, Vimal et al. [48] advocate for frameworks that balance resilience and sustainability in circular and sharing systems, highlighting the urgent need for models capable of managing trade-offs and uncertainty across dynamic industrial networks.
Furthermore, resilience in maintenance is often treated as a reactive capability rather than a structured, measurable element of maturity. This limits its practical implementation and the ability to benchmark progress over time. The summary of the recent maturity models is presented in Table 1.
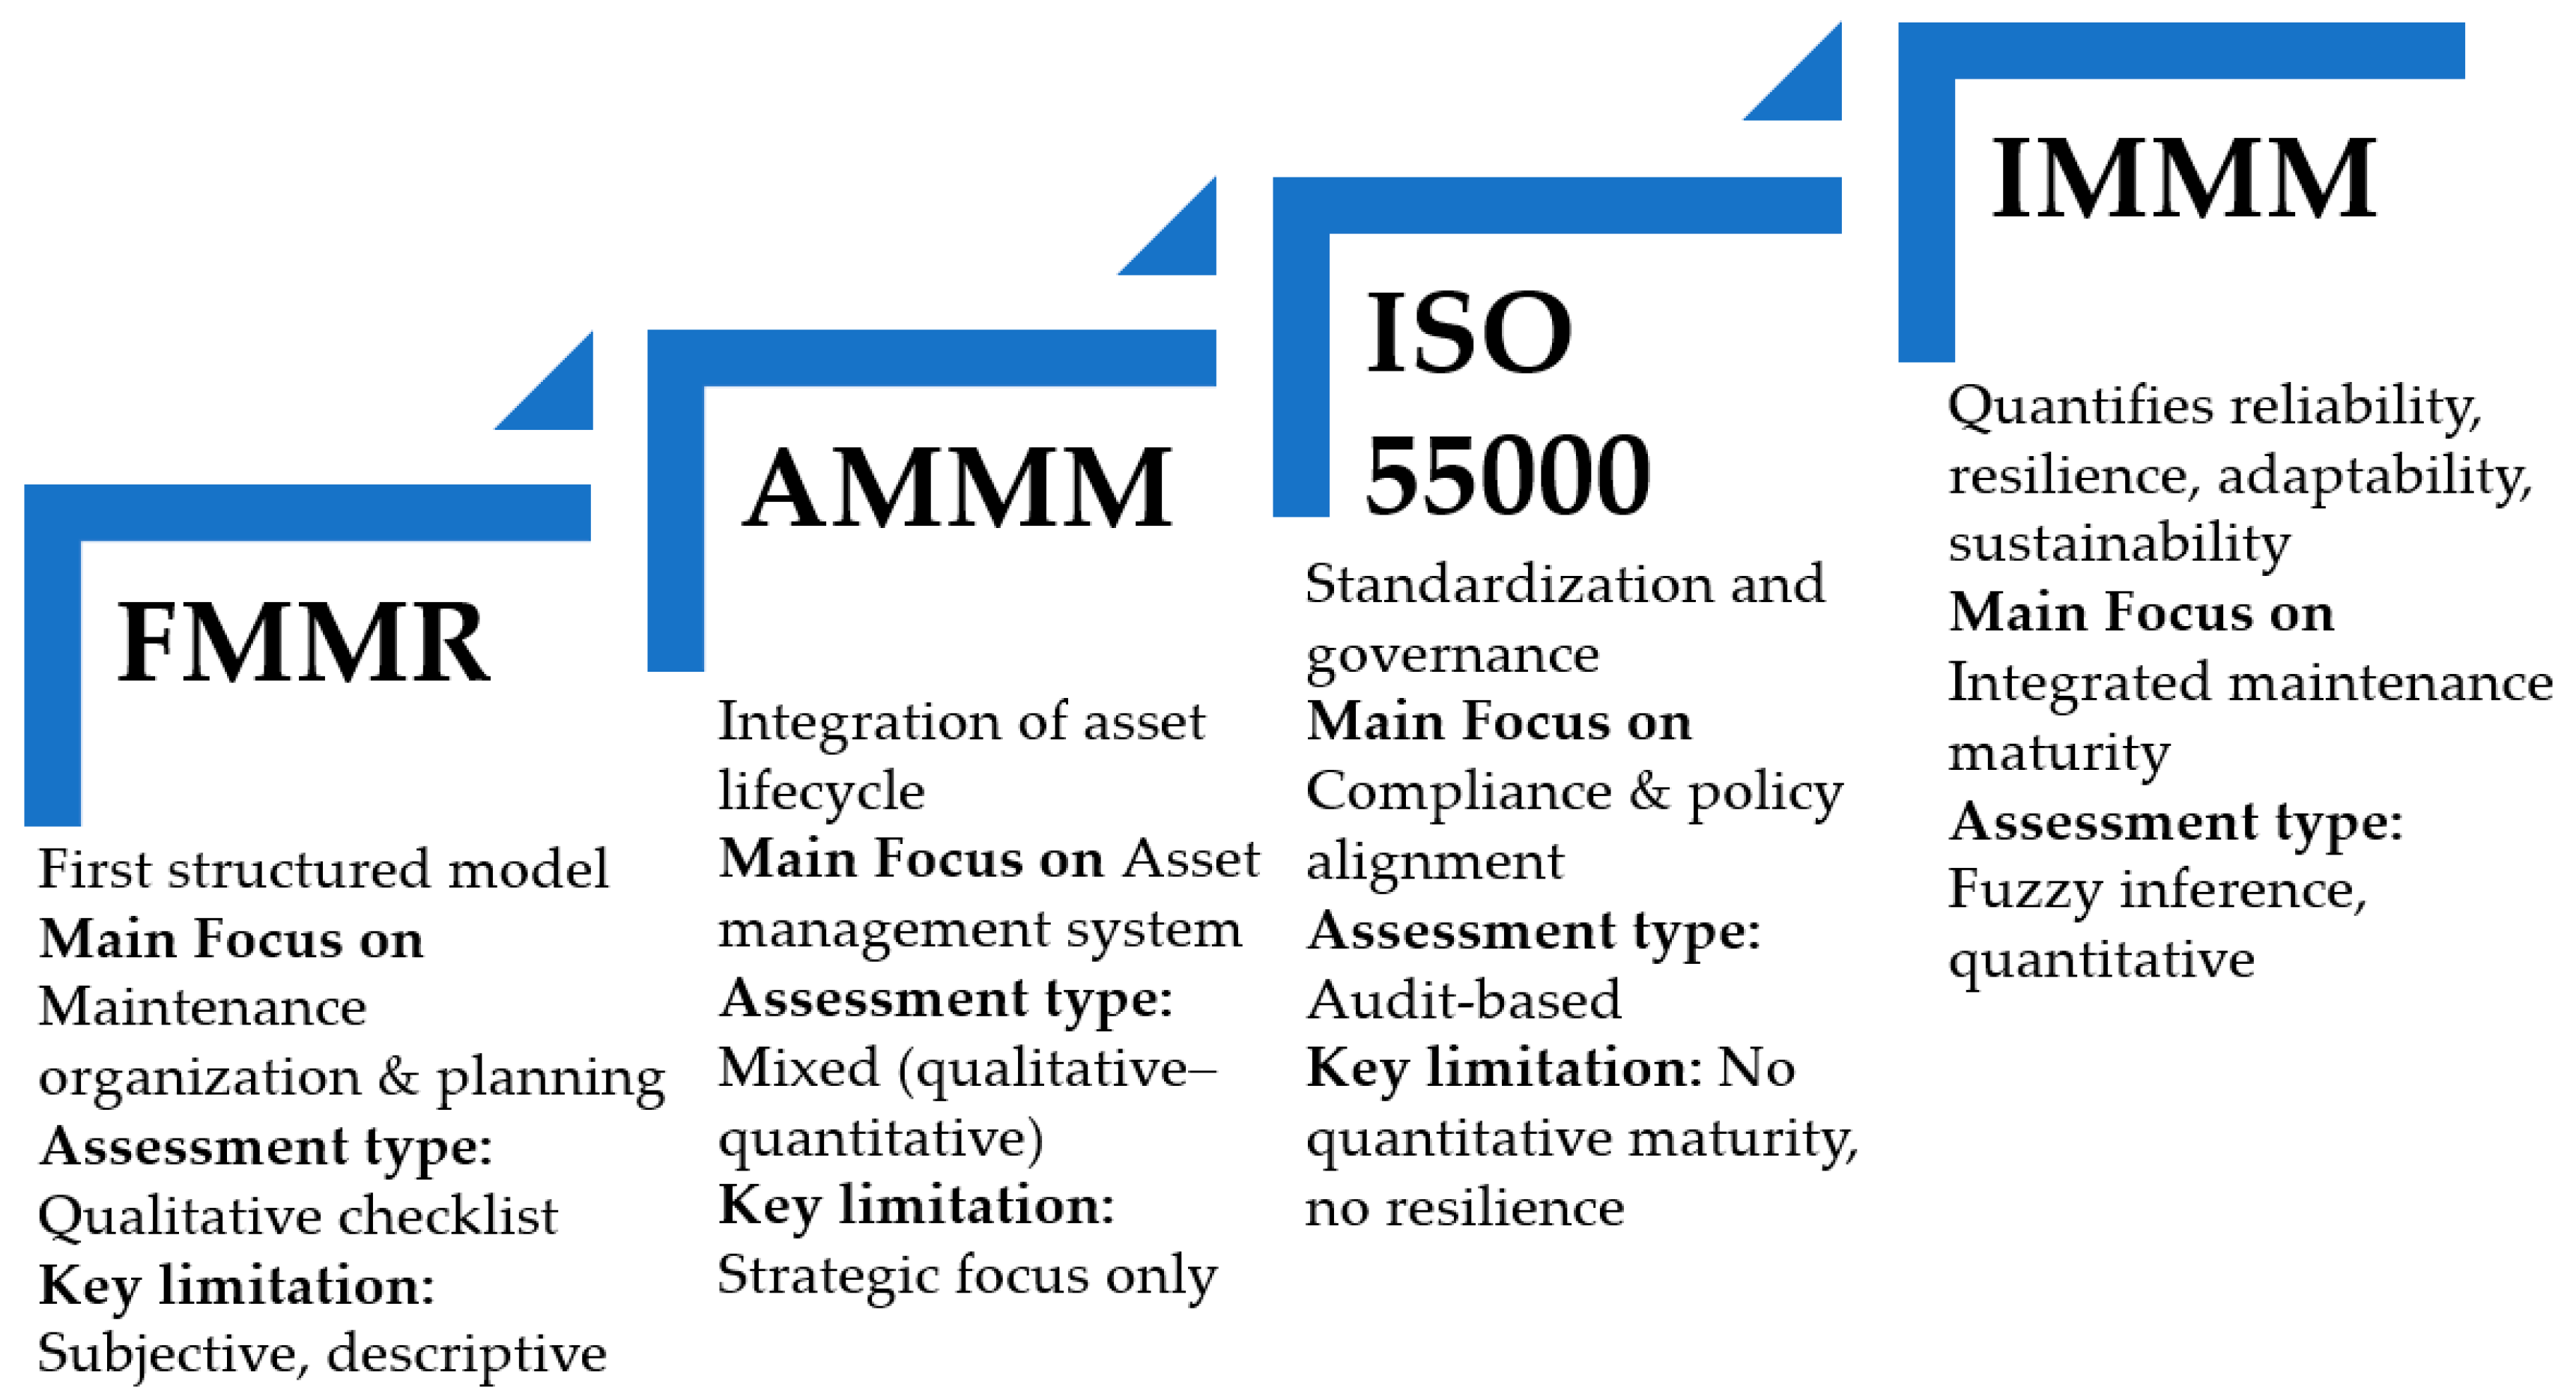
A comparative analysis of the current state-of-the-art in maintenance maturity modeling (Table 1) reveals significant limitations that the IMMM is specifically designed to overcome. First, the vast majority of existing models (13 out of 16 listed) are fundamentally One-dimensional. These models assess maturity in isolated silos, failing to capture the complex interdependencies required for modern strategic planning. While some recent models, such as [3,6,41], adopt a Multi-dimensional approach, they still exhibit key shortcomings. Second, regarding scope, even the multi-dimensional models fail to holistically integrate the dimensions critical for today’s dynamic environment. For instance, Sustainability is only a core focus in [41], and models explicitly integrating Resilience are rare [6]. The IMMM uniquely combines the five strategic potentials, Reliability, Safety, Resilience, Flexibility, and Sustainability, to provide a truly comprehensive assessment of an organization’s future-readiness. Finally, in terms of methodology, most models rely on deterministic approaches. Only the Fuzzy Maintenance Maturity Rating (FMMR) [6] uses Fuzzy Logic. The IMMM leverages this methodology not only for assessment but also to achieve a crucial practical advantage: it transforms subjective, linguistic expert knowledge (necessary in data-scarce environments like SMEs) into a precise, quantitative score.
The empirical contribution of the proposed IMMM differs from existing fuzzy maturity models, such as FMMR [6], in several key aspects. While FMMR primarily focuses on resilience and risk performance within a multi-dimensional framework, the IMMM uniquely integrates five strategic maintenance potentials, Reliability, Safety, Resilience, Flexibility, and Sustainability, providing a more comprehensive, holistic assessment of organizational maintenance maturity. Moreover, unlike FMMR, which relies heavily on expert input and deterministic measurement data, the IMMM employs fuzzy logic to systematically transform qualitative, linguistic expert knowledge into quantitative scores, making it robust and applicable in data-scarce environments. The IMMM further distinguishes itself through a hierarchical, multi-level fuzzy inference structure that captures interdependencies among potentials and system dimensions, enabling predictive scenario analysis and supporting strategic decision-making. Empirically, this allows IMMM to offer actionable insights not only on current maturity levels but also on improvement pathways and resilience strategies, a capability that existing models, including FMMR, do not fully provide.
Recent theoretical advances in asset management have shifted from deterministic prognosis to robust, uncertainty-aware modeling of system health, particularly addressing issues where measurement data is imprecise or noisy. This trend is exemplified by sophisticated research focusing on overcoming data limitations, such as robust degradation analysis with non-Gaussian measurement errors [49] and methods for handling measurement errors in degradation-based burn-in procedures [50]. This work acknowledges that advanced data-driven maintenance models (characteristic of Maturity Levels 4 and 5) often fail when faced with real-world complexities such as sensor faults, environmental noise, or human subjectivity, which lead to non-linear, non-Gaussian uncertainties. While these advanced statistical methods offer powerful diagnostic capabilities, their complexity often limits their practical adoption in conventional industrial settings (Maturity Levels 2–3) and they require massive, clean data sets.
This creates a distinct theoretical gap: few maturity models successfully bridge the highly complex analytical methods needed to manage non-Gaussian uncertainty with the practical need for interpretability and resilience in data-scarce industrial environments. Therefore, the primary theoretical contribution of the (IMMM is the deployment of Fuzzy Logic as a robust, non-statistical framework to explicitly operationalize the management of non-Gaussian uncertainty and linguistic ambiguity. The IMMM provides a transparent mechanism to systematically integrate expert judgment, which itself acts as a non-linear filter for noisy, incomplete, or non-Gaussian data, into the strategic maintenance decision-making process, a capability currently lacking in both purely deterministic and overly specialized prognostic models.
Following the literature review, there is a clear research gap in developing tools that support proactive, uncertainty-aware decision-making while ensuring operational continuity and long-term sustainability performance. In this context, the integration of AI-enhanced analytics and fuzzy logic reasoning becomes a promising direction for advancing maintenance maturity assessment. Building upon the literature review, one promising direction to address the identified research gap is the application of fuzzy logic in maintenance decision-making. Fuzzy logic provides a robust framework for dealing with uncertainty, imprecision, and subjectivity—characteristics that are inherent to real-world industrial environments [51]. Maintenance systems often operate under incomplete or ambiguous data conditions, such as expert estimations, imprecise measurements, or unpredictable disturbances. Traditional binary or crisp decision models are limited in their ability to accommodate these complexities [52].
In summary, the comparative analysis presented in Table 1 demonstrates that existing maintenance maturity frameworks provide valuable methodological and conceptual foundations for structured assessment, continuous improvement, and alignment of maintenance with strategic objectives. However, their advantages, such as clear maturity level definition, alignment with standards (e.g., ISO 55000), or inclusion of specific aspects like reliability or sustainability, are counterbalanced by notable limitations. Most models remain deterministic and narrowly focused, lacking the ability to jointly capture the multidimensional nature of modern maintenance systems. Resilience is typically addressed as an auxiliary concept rather than a measurable capability, and sustainability aspects are often fragmented or qualitative. Furthermore, the absence of robust mechanisms to handle uncertainty and linguistic subjectivity restricts their applicability in real industrial environments, particularly in Small and Medium-sized Enterprises (SMEs). These gaps collectively justify the development of an integrated, fuzzy logic-based maturity framework capable of unifying reliability, safety, resilience, flexibility, and sustainability within a single, interpretable model. The proposed IMMM directly responds to these identified limitations and offers a comprehensive foundation for proactive, uncertainty-aware maintenance decision-making.
Fuzzy logic enables the modeling of expert knowledge through rule-based systems (e.g., IF-THEN rules), allowing qualitative insights and experience to be systematically integrated into the decision-making process. It also supports the aggregation of multiple evaluation criteria—such as reliability, flexibility, resilience, and sustainability—without oversimplifying them into deterministic scores. Unlike previous multi-dimensional maturity models, the proposed Integrated Maintenance Maturity Model integrates fuzzy logic with multidimensional assessment under uncertainty, providing a unified, adaptive, and explainable approach to supporting strategic maintenance decisions. This is particularly important when assessing multidimensional maturity and planning maintenance strategies that must simultaneously ensure operational continuity and long-term environmental and social responsibility [51].
In addition, a significant limitation of many contemporary maintenance maturity models is their reliance on extensive historical data or advanced monitoring systems (characteristic of Maturity Levels 4 and 5). This reliance on Big Data renders them practically irrelevant for SMEs or organizations in initial maturity stages (L1/L2), which typically operate in less data-rich environments. Our proposed Fuzzy Logic-based approach directly addresses this challenge. Fuzzy inference systems are designed to process linguistic variables and expert knowledge rather than precise numerical data, making the model inherently more robust when data is incomplete, imprecise, or unavailable. This flexibility ensures that the IMMM remains a powerful diagnostic and predictive tool, even when relying on the subjective judgment (tacit knowledge) of maintenance experts and managers within SMEs.
By embedding fuzzy inference mechanisms into maturity assessment models, organizations can better quantify their current capabilities and evaluate improvement paths even in the presence of uncertainty. Thus, fuzzy logic emerges as a valuable tool to support proactive, informed, and uncertainty-aware maintenance decisions, effectively bridging the gap between resilience and sustainability in dynamic industrial contexts [53,54].
In the following sections of this paper, a descriptive model for the Maintenance Maturity approach is presented. This model outlines the conceptual foundation for assessing maturity across key dimensions such as reliability, safety, resilience, agility, and sustainability.
Table 1. Summary of the recent maintenance maturity models available in the literature.
Ref.Model NamePubl. Year Dimension TypeKey Dimensions Covered Number of Maturity LevelsMethodological Basis Assessment Approach Application Context
[25]Reliability Centred Maintenance Maturity2003One-dimensionalMaintenance 5RCM-based approachConceptual Various industries
[55]Software Maintenance Capability Maturity Model (SMCMM)2004One-dimensionalMaintenance4Capability maturity modeling Model architecture Software
[56]The House of Maintenance-based Capability maturity model2009One-dimensionalMaintenance 5Capability maturity modelingWorkshop, questionnaireVarious industries
[57]Maintenance Management Information Maturity model2012One-dimensionalMaintenance 2IT-maturity basedNot specifiedVarious industries
[1]Organization maturity level for maintenance management2012One-dimensionalMaintenance 3Maintenance strategyInterviewVarious industries
[58]Maintenance Maturity Assessment method2013One-dimensionalMaintenance 5Capability maturity modelingMaturity assessment based on scorecardsManufacturing industry
[59]PriMa-X Reference Model2018One-dimensionalMaintenance 3 layersPrescriptive maintenance strategyReference model based on MLVarious industries
[60]Knowledge-based Maintenance Maturity model2019One-dimensionalMaintenance 4Knowledge-based maintenance strategyPerformance indicators-based assessmentCyber-physical production systems
[26]Maintenance Maturity Level based on TPM Pillars2020One-dimensionalMaintenance8TPM-based approachMulti-attributive Border Approximation methodPublic service sector
[61]Organization performance maturity level for maintenance management2020One-dimensionalMaintenance 5World-class concept basedSelf-assessment based on reading the tables’ contentVarious industries
[62]Asset Management Maturity model2022One-dimensionalMaintenance 6ISO 55001:2014-basedInterviews, direct observation, correlation index, scoring methodHeavy equipment
[63]M3AIN4SME2022One-dimensionalMaintenance 5Literature review, expert validationSurvey-based assessmentSMEs
[3]Asset maintenance maturity model (AMMM)2013Multi-dimensionalPeople and environment, functional and technical aspects, maintenance budget3Capability maturity modelingPerformance measurement, ANP method Asset maintenance domain
[6]FMMR (Fuzzy Maintenance Maturity Rating)2021Multi-dimensionalResilience, risk, maintenance performance5Fuzzy logic, expert inputFuzzy assessment modelIndustrial systems
[41]Maintenance Maturity and Sustainability Assessment Model2023Multi-dimensionalEnvironmental, social and economic dimensions of maintenance; sustainability 5Literature, expert opinion, analytical assessmentSurvey research, mathematical formulations for maturity evaluationManufacturing companies
Our modelIMMM (Integrated Maintenance Maturity Model)2025Multi-dimensionalReliability, Safety, Resilience, Flexibility, Sustainability5Fuzzy Logic, Multi-Potential FrameworkQuantitative Score from Linguistic Input, Predictive Scenario AnalysisIndustrial Systems (Cross-sectoral applicability)

3. Proposed Maintenance Maturity Model

This section outlines the Integrated Maintenance Maturity Model (IMMM), which integrates reliability, safety, flexibility, resilience, and sustainability principles into a comprehensive maturity assessment framework. The model is designed to provide a flexible, quantitative, and adaptive approach to evaluate the maturity of maintenance systems under uncertainty. It uses fuzzy logic to capture the subjectivity and imprecision inherent in maintenance decision-making.

3.1. Conceptual Framework for IMMM

The Integrated Maintenance Maturity Model (IMMM) development is grounded in a systemic and risk-informed asset management approach, integrating operational continuity concepts, proactive risk mitigation, and sustainability. As a foundation, the proposed model draws on a multi-layered perspective that conceptualizes maintenance as a technical function and a strategic enabler of organizational resilience, operational agility, and sustainability.
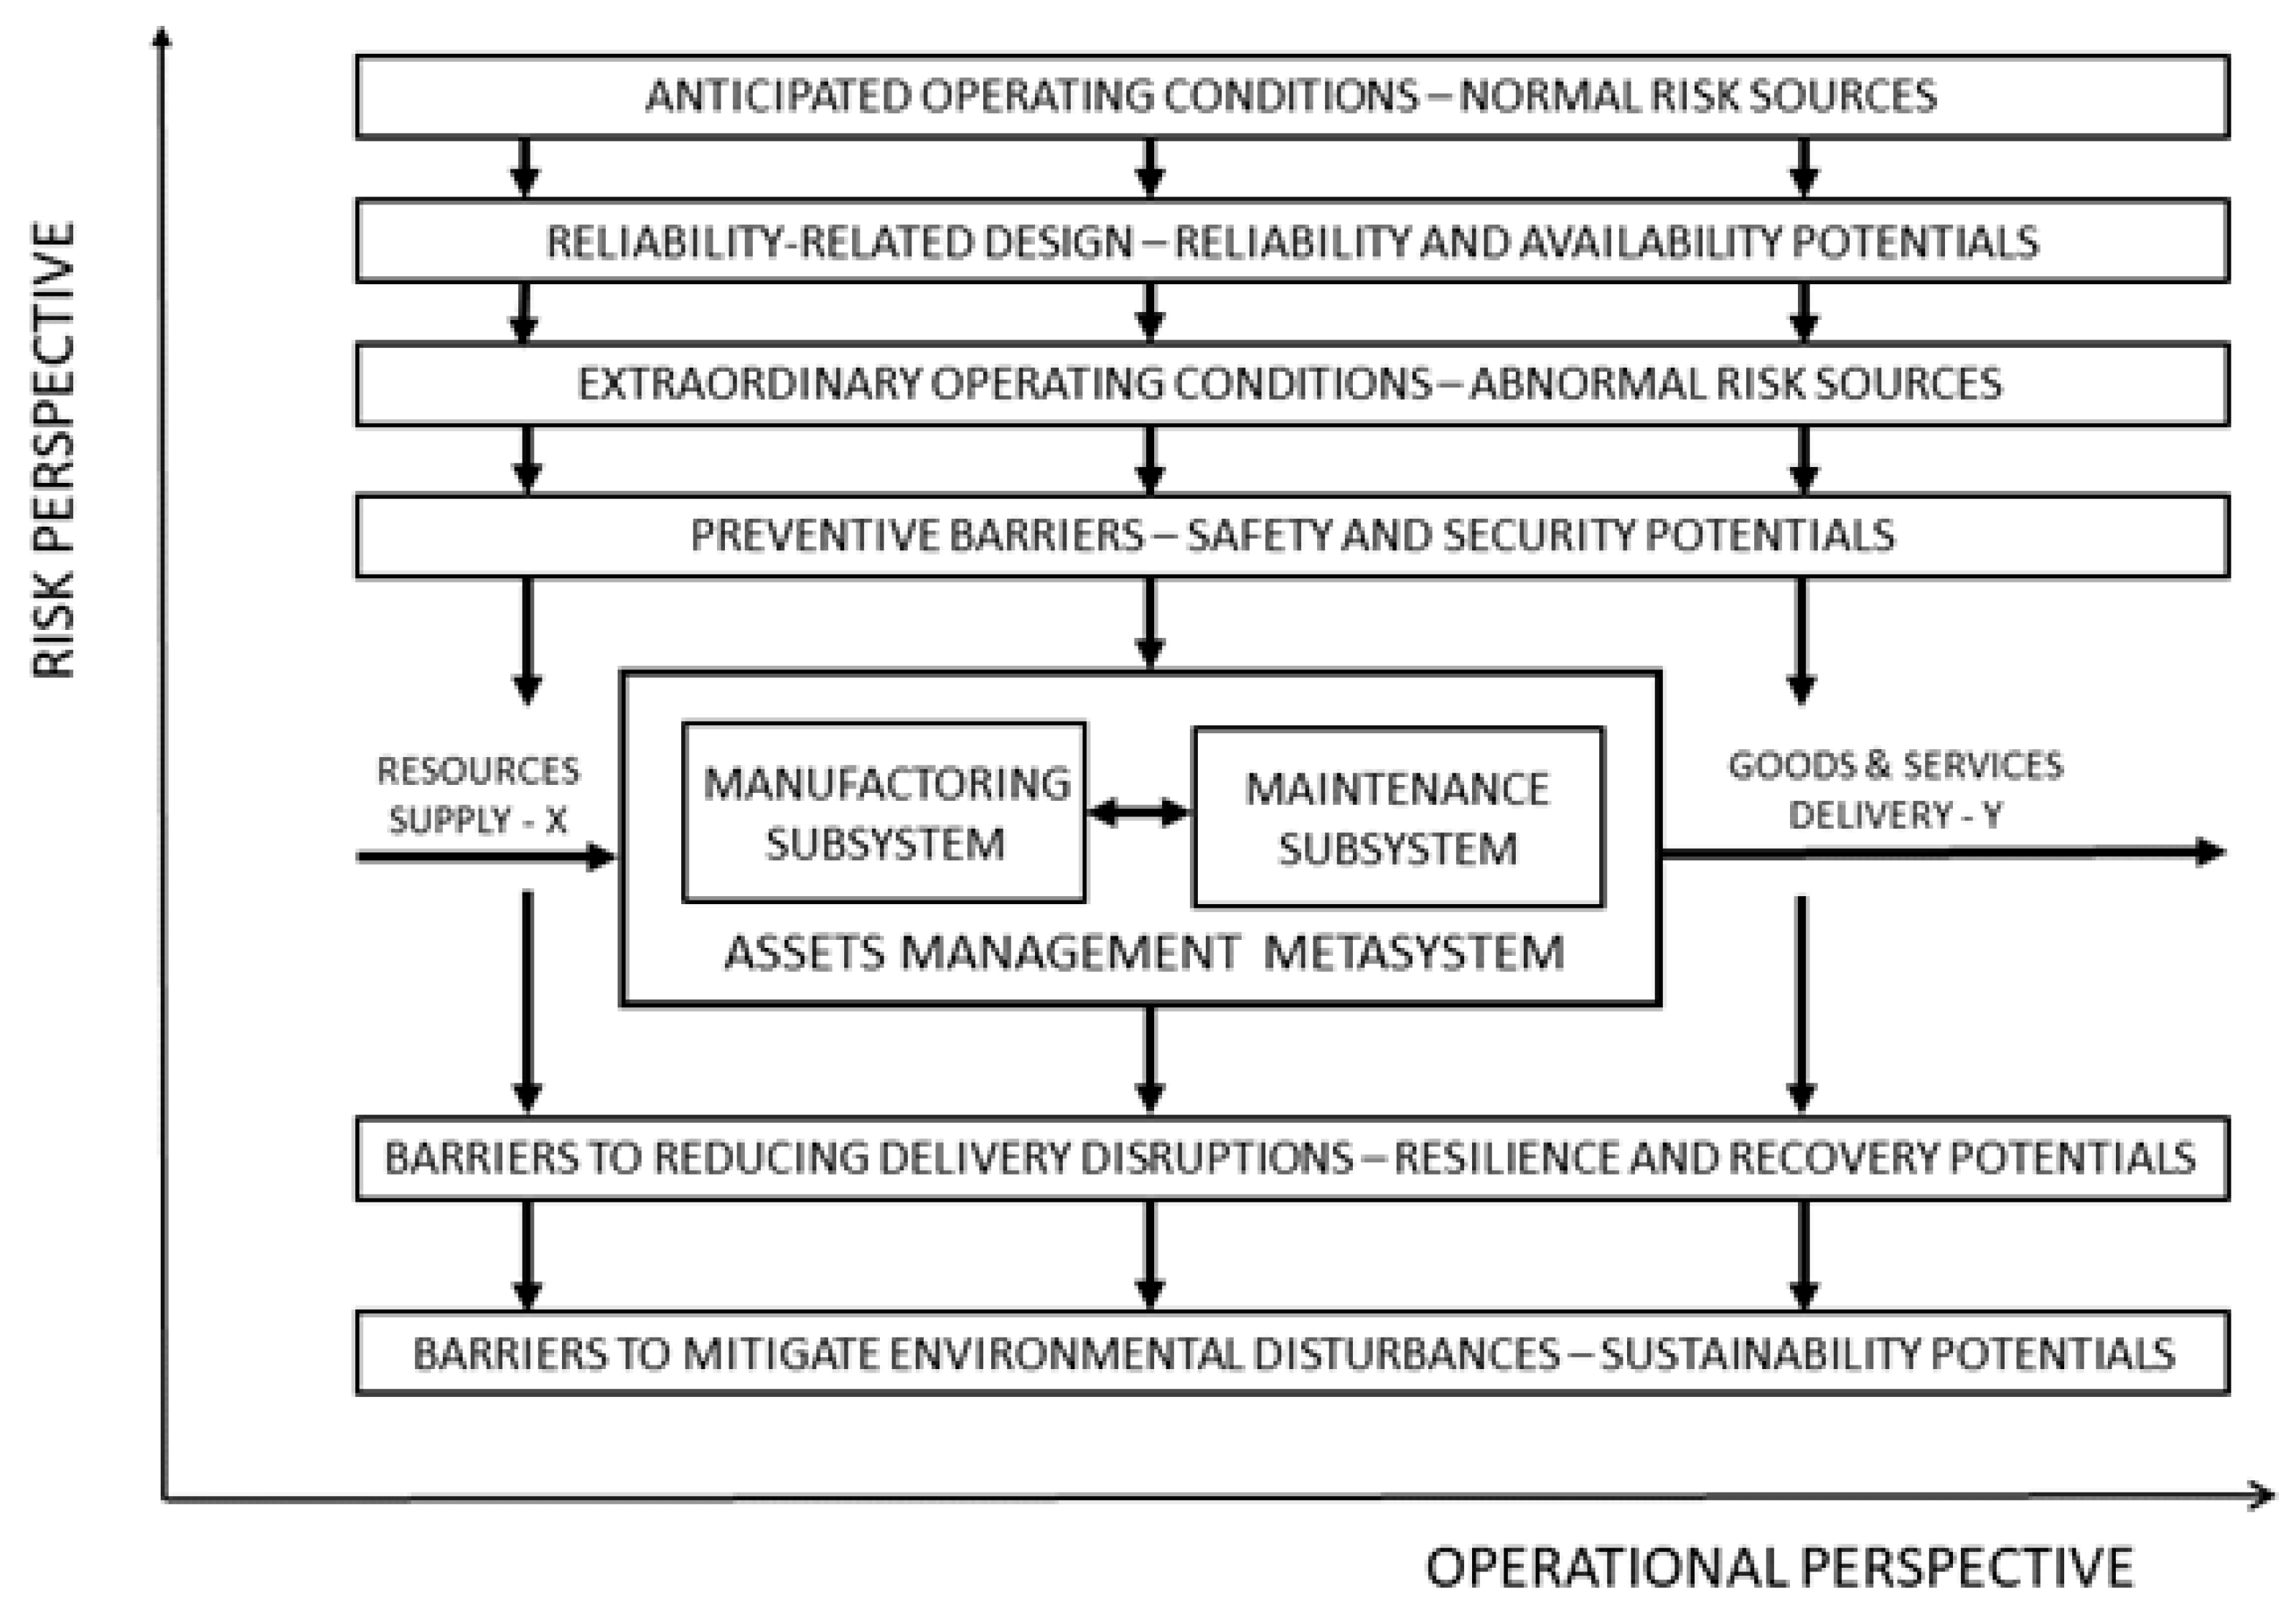
The proposed approach adopts a layered barrier model along the vertical risk perspective, representing escalating levels of defense against operational, environmental, and systemic disturbances (Figure 3).
From the operational perspective, a well-functioning production or service system efficiently transforms inputs (X) into outputs (Y), relying on stability, reliability, and performance optimization. Within this steady-state scenario, maintenance management typically focuses on reliability-related activities, such as preventive inspections, scheduled servicing, and condition-based monitoring, ensuring that assets perform their intended functions without failure. However, despite rigorous operational planning and asset management, real-world systems are inevitably exposed to disturbances, uncertainties, and abnormal events, ranging from internal component failures to external shocks or unpredictable environmental conditions.
This reality necessitates the consideration of a second, risk-informed perspective, complementing the operational viewpoint. This perspective is grounded in risk analysis and introduces an integrated framework of barrier-based defense layers designed to ensure operational reliability, resilience, and long-term sustainability. These layers support the system’s ability to maintain continuity, adapt to disturbances, and evolve in the face of emerging risks.
To address the multidimensional nature of uncertainty, the model introduces three interconnected protective layers:
  • Preventive barriers—safety and security potentials: representing the system’s first line of defense, this layer encompasses proactive maintenance strategies to anticipate and avoid failures before they occur. Examples include condition-based maintenance, safety inspections, digital diagnostics, and security protocols. These activities form the foundation of a resilient operation by enhancing predictability and reducing the likelihood of incidents, tightly coupling maintenance with reliability engineering and preventive risk management.
  • Disruption mitigation barriers—resilience and recovery potentials: when disturbances do occur, this second layer enables the system to absorb shocks and quickly recover. Key mechanisms include contingency planning, emergency maintenance procedures, flexible resource allocation, workforce cross-training, and redundancy in critical components. Maintenance plays a central role here as an enabler of adaptive capacity, facilitating real-time decision-making, repair prioritization, and recovery orchestration without significant performance degradation.
  • Environmental disturbance mitigation barriers—sustainability potentials: the third layer embeds sustainability into maintenance practices, supporting the system’s long-term economic and ecological performance. Current analysis focuses primarily on energy and material usage, lifecycle extension, waste reduction, and circular economy principles. Due to data availability constraints, full life-cycle aspects of equipment, including procurement, decommissioning, and remanufacturing, are not directly assessed. Future research and model applications should integrate life-cycle assessment (LCA) metrics and circular economy indicators, such as remanufacturing rates or material recovery rates, to more comprehensively capture sustainability performance. Maintenance here acts as both an operational function and a strategic lever contributing to eco-efficiency, regulatory compliance, and alignment with ESG goals.
These layered defense mechanisms operate across the same operational flow of inputs and outputs, yet they add depth and robustness to the system’s capability. The maturity of the maintenance system, especially its ability to integrate reliability, resilience, and sustainability dimensions, determines how effectively an organization can maintain continuity in the face of uncertainty while also achieving long-term performance objectives.
The proposed structure of the Integrated Maintenance Maturity Model (IMMM) follows a five-level maturity hierarchy (L1–L5) that is consistent with established standards such as Capability Maturity Model Integration (CMMI), PAS 55, and ISO 55000. These frameworks commonly define five progressive stages, from ad-hoc to optimized and continuously improving, reflecting the natural evolution of organizational learning and process formalization. This structure ensures comparability with recognized asset management and reliability maturity frameworks while maintaining clarity and interpretability for practitioners.
Similarly, the definition of five maintenance maturity potentials (P1–P5) is grounded in a comprehensive synthesis of literature and expert validation. The selected potentials -Reliability and Availability, Safety and Security, Resilience and Recovery, Flexibility and Agility, and Sustainability—jointly capture the full spectrum of technical, organizational, and environmental performance dimensions. Together, these five domains represent the essential enablers of operational continuity and sustainable performance under uncertainty, forming a balanced and practically manageable assessment structure.
From this conceptual baseline, the IMMM structures maintenance maturity around five interdependent potentials, each rooted in a specific engineering knowledge domain and tied to measurable system attributes. These maintenance maturity potentials (P1–P5) reflect both short-term adaptability and long-term sustainability objectives (see [24]).
This five-potential structure enables a holistic assessment of maintenance systems, bridging the traditionally fragmented domains of reliability, safety, resilience, flexibility, and sustainability. It reflects the layered conceptual foundations described earlier, where:
  • Reliability and safety align with preventive barriers.
  • Resilience and flexibility support disruption recovery and short-term adaptation.
  • Sustainability addresses long-term environmental and resource concerns. It should be noted that the current quantitative assessment primarily focuses on energy consumption and carbon emissions. Due to limited operational data availability, a full life-cycle perspective, covering procurement, decommissioning, and remanufacturing, is not included. Future applications of the IMMM may incorporate life-cycle assessment (LCA) metrics or circular economy indicators, such as remanufacturing rates or material recovery rates, to more comprehensively evaluate sustainability performance.
A five-level Maintenance Maturity Matrix is proposed to assess each potential’s development in practical settings. This matrix captures the progression of an organization’s maintenance capabilities across the defined five maturity levels (Table 2).
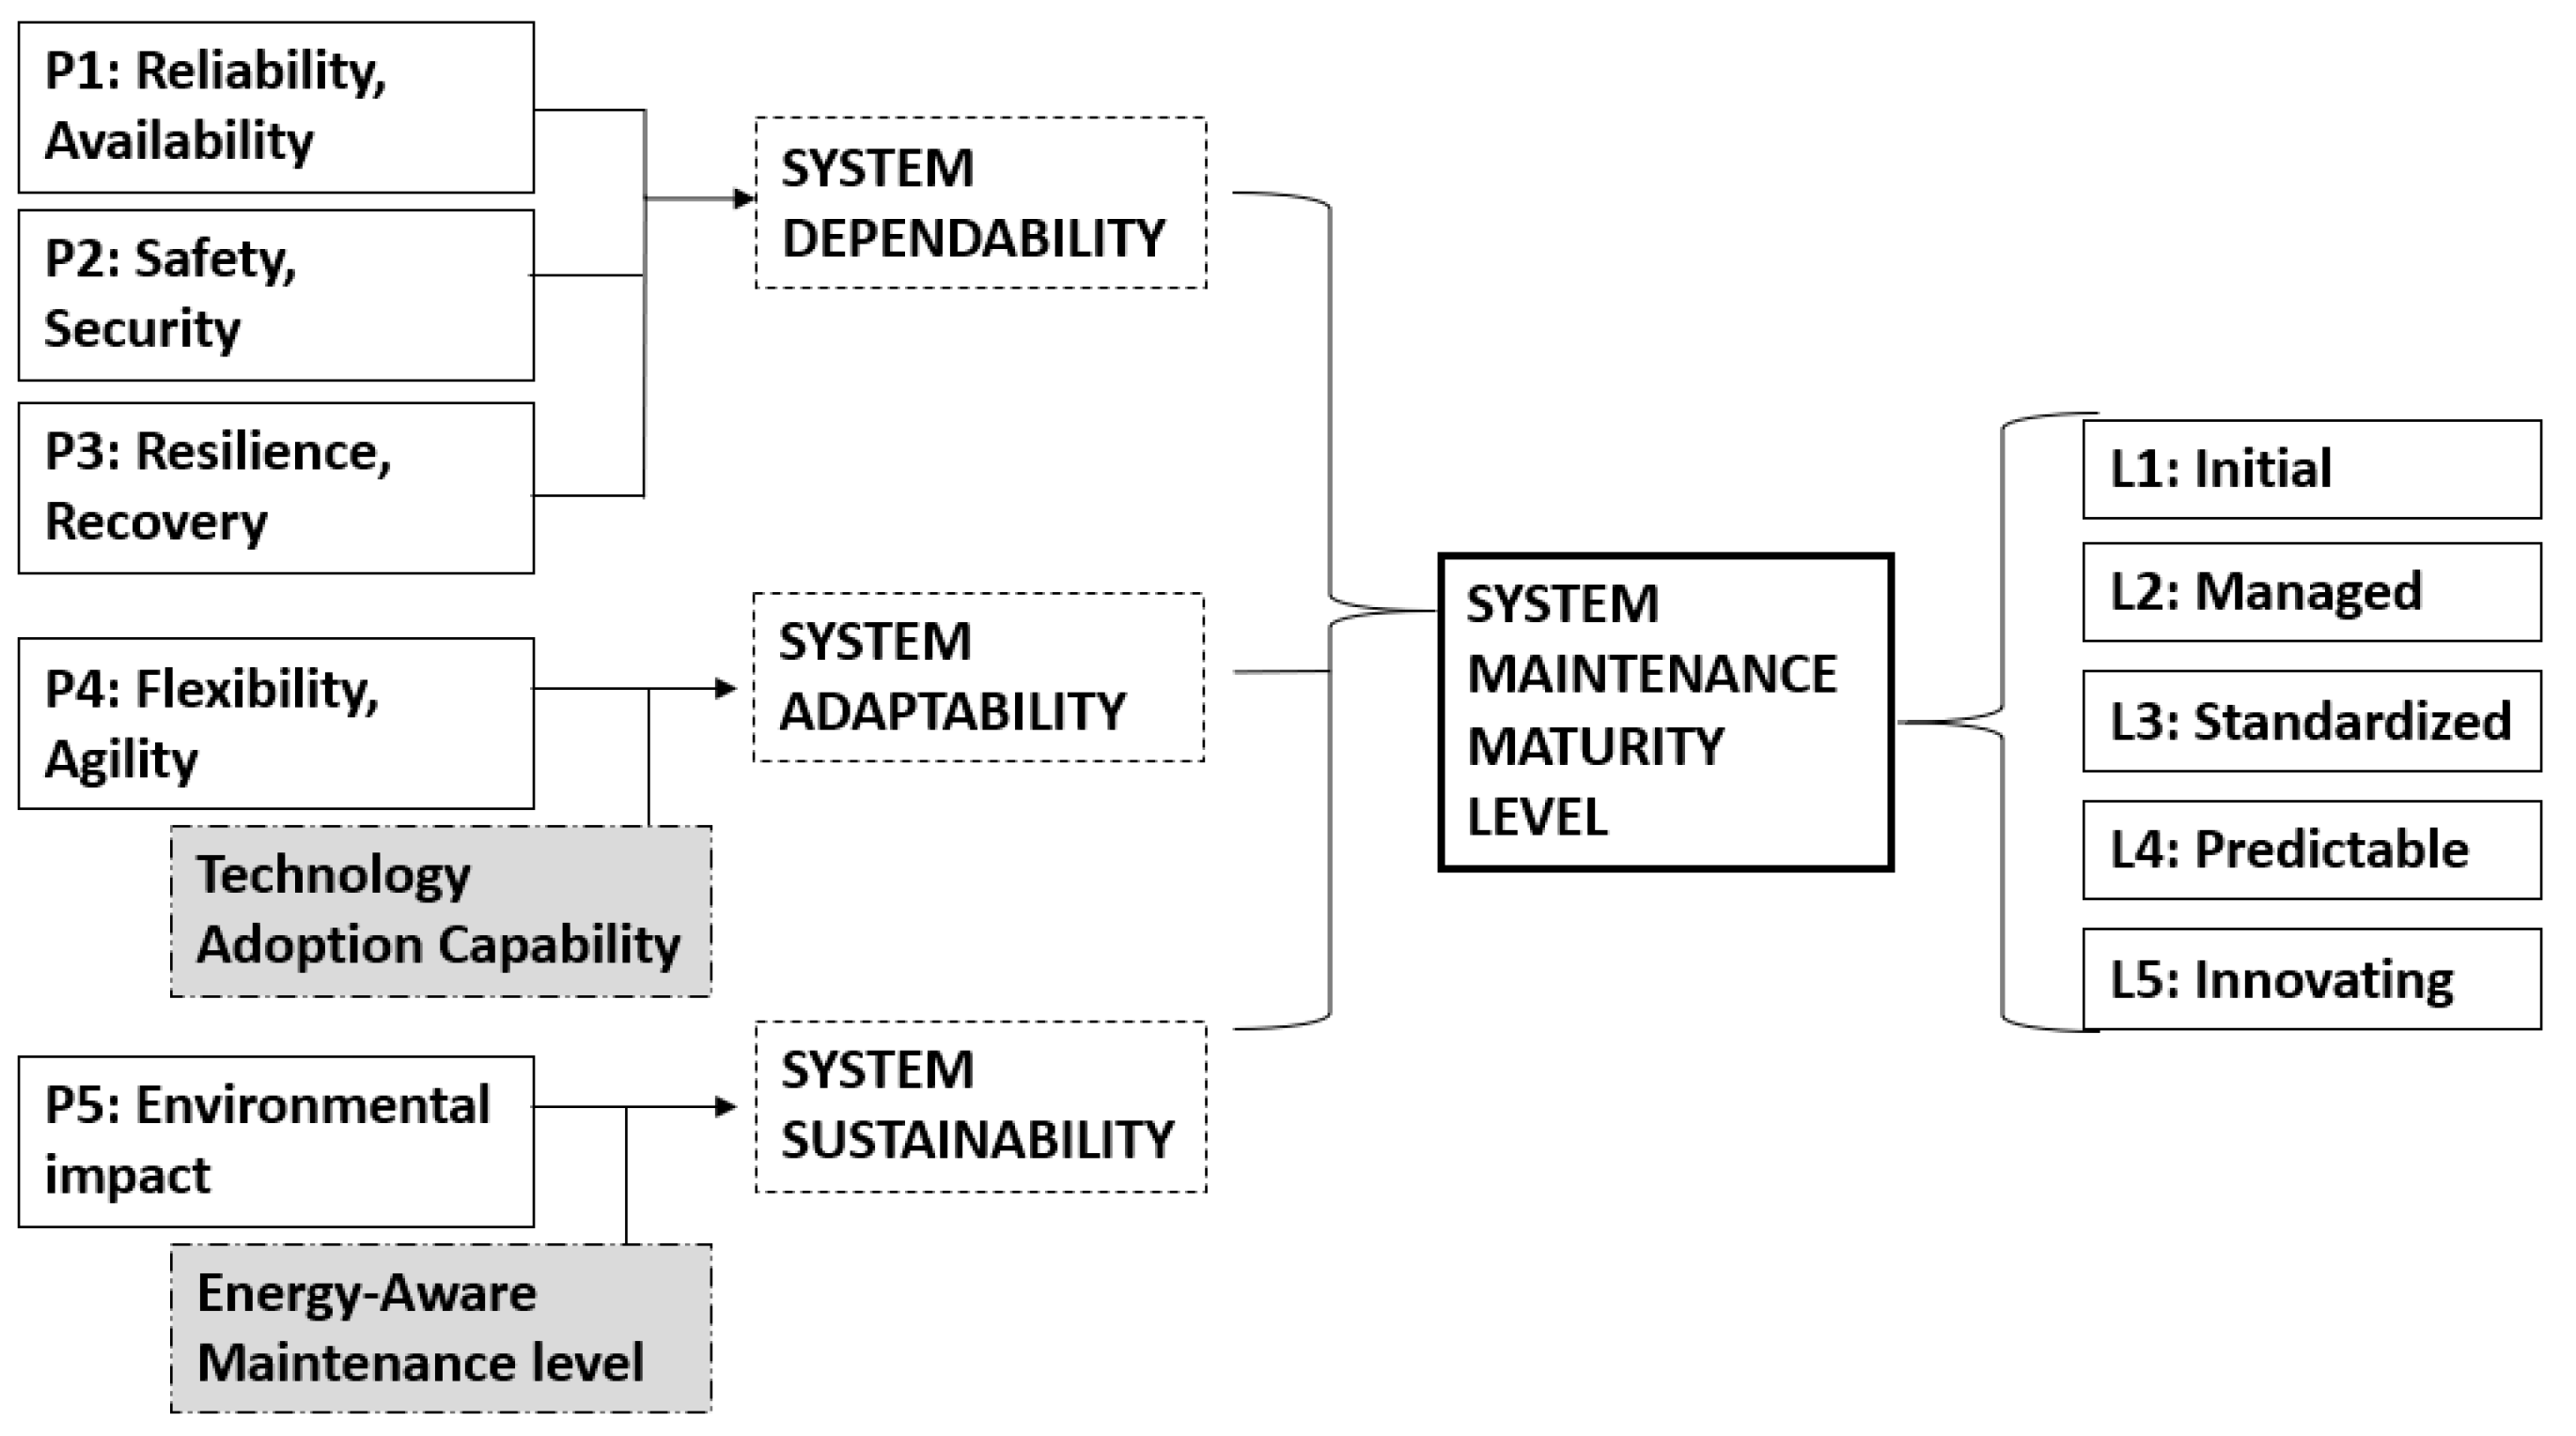
Following this, the proposed diagram illustrates the IMMM framework for assessing and improving maintenance function maturity (Figure 4). It links five core Potentials (P1–P5)—Reliability/Availability, Safety/Security, Resilience/Recovery, Flexibility/Agility, and Environmental Impact—to three higher-level System Maturity Dimensions: System Dependability, System Adaptability, and System Sustainability. These dimensions collectively determine the organization’s overall System Maintenance Maturity Level, progressing through five stages (L1–L5): Initial, Managed, Standardized, Predictable, and Innovating.
To provide a more realistic and system-oriented evaluation, the model integrates two additional input variables to enrich the assessment of specific dimensions:
  • Technology Adoption Capability (TAC), introduced as an additional input to the System Adaptability dimension, reflects the organization’s capability to adopt, integrate, and scale new technologies (e.g., digital tools, automation, AI). While Flexibility/Agility (P4) measures operational adaptability in maintenance, Technology Adaptability captures the infrastructure and cultural readiness for change, thus ensuring a more comprehensive view of adaptive potential.
  • Energy-Aware Maintenance level (EAML), added as a complementary input to the System Sustainability dimension, evaluates how effectively the organization incorporates energy efficiency considerations in its maintenance processes. This includes adopting energy-efficient technologies, scheduling maintenance in energy-optimized windows, and reducing energy consumption during maintenance activities. While Environmental Impact (P5) focuses on the outcome side (e.g., emissions, waste), EAML addresses the organization’s internal practices aimed at minimizing energy consumption, further strengthening the sustainability pillar from both operational and strategic perspectives.
By incorporating these additional input parameters, the IMMM provides a more holistic and fine-grained perspective on maintenance maturity, enabling organizations to understand their current state and identify strategic levers for progress toward greater efficiency, resilience, and sustainability in maintenance systems.
To sum up, the IMMM’s strength lies in its ability to integrate technical and strategic maintenance dimensions within a coherent, flexible assessment structure. By combining the proposed framework with fuzzy logic inference mechanisms (elaborated in Section 3.2), the model enables nuanced evaluations under uncertainty, reflecting real-world complexities in industrial environments.

3.2. Fuzzy Logic-Based Assessment Methodology

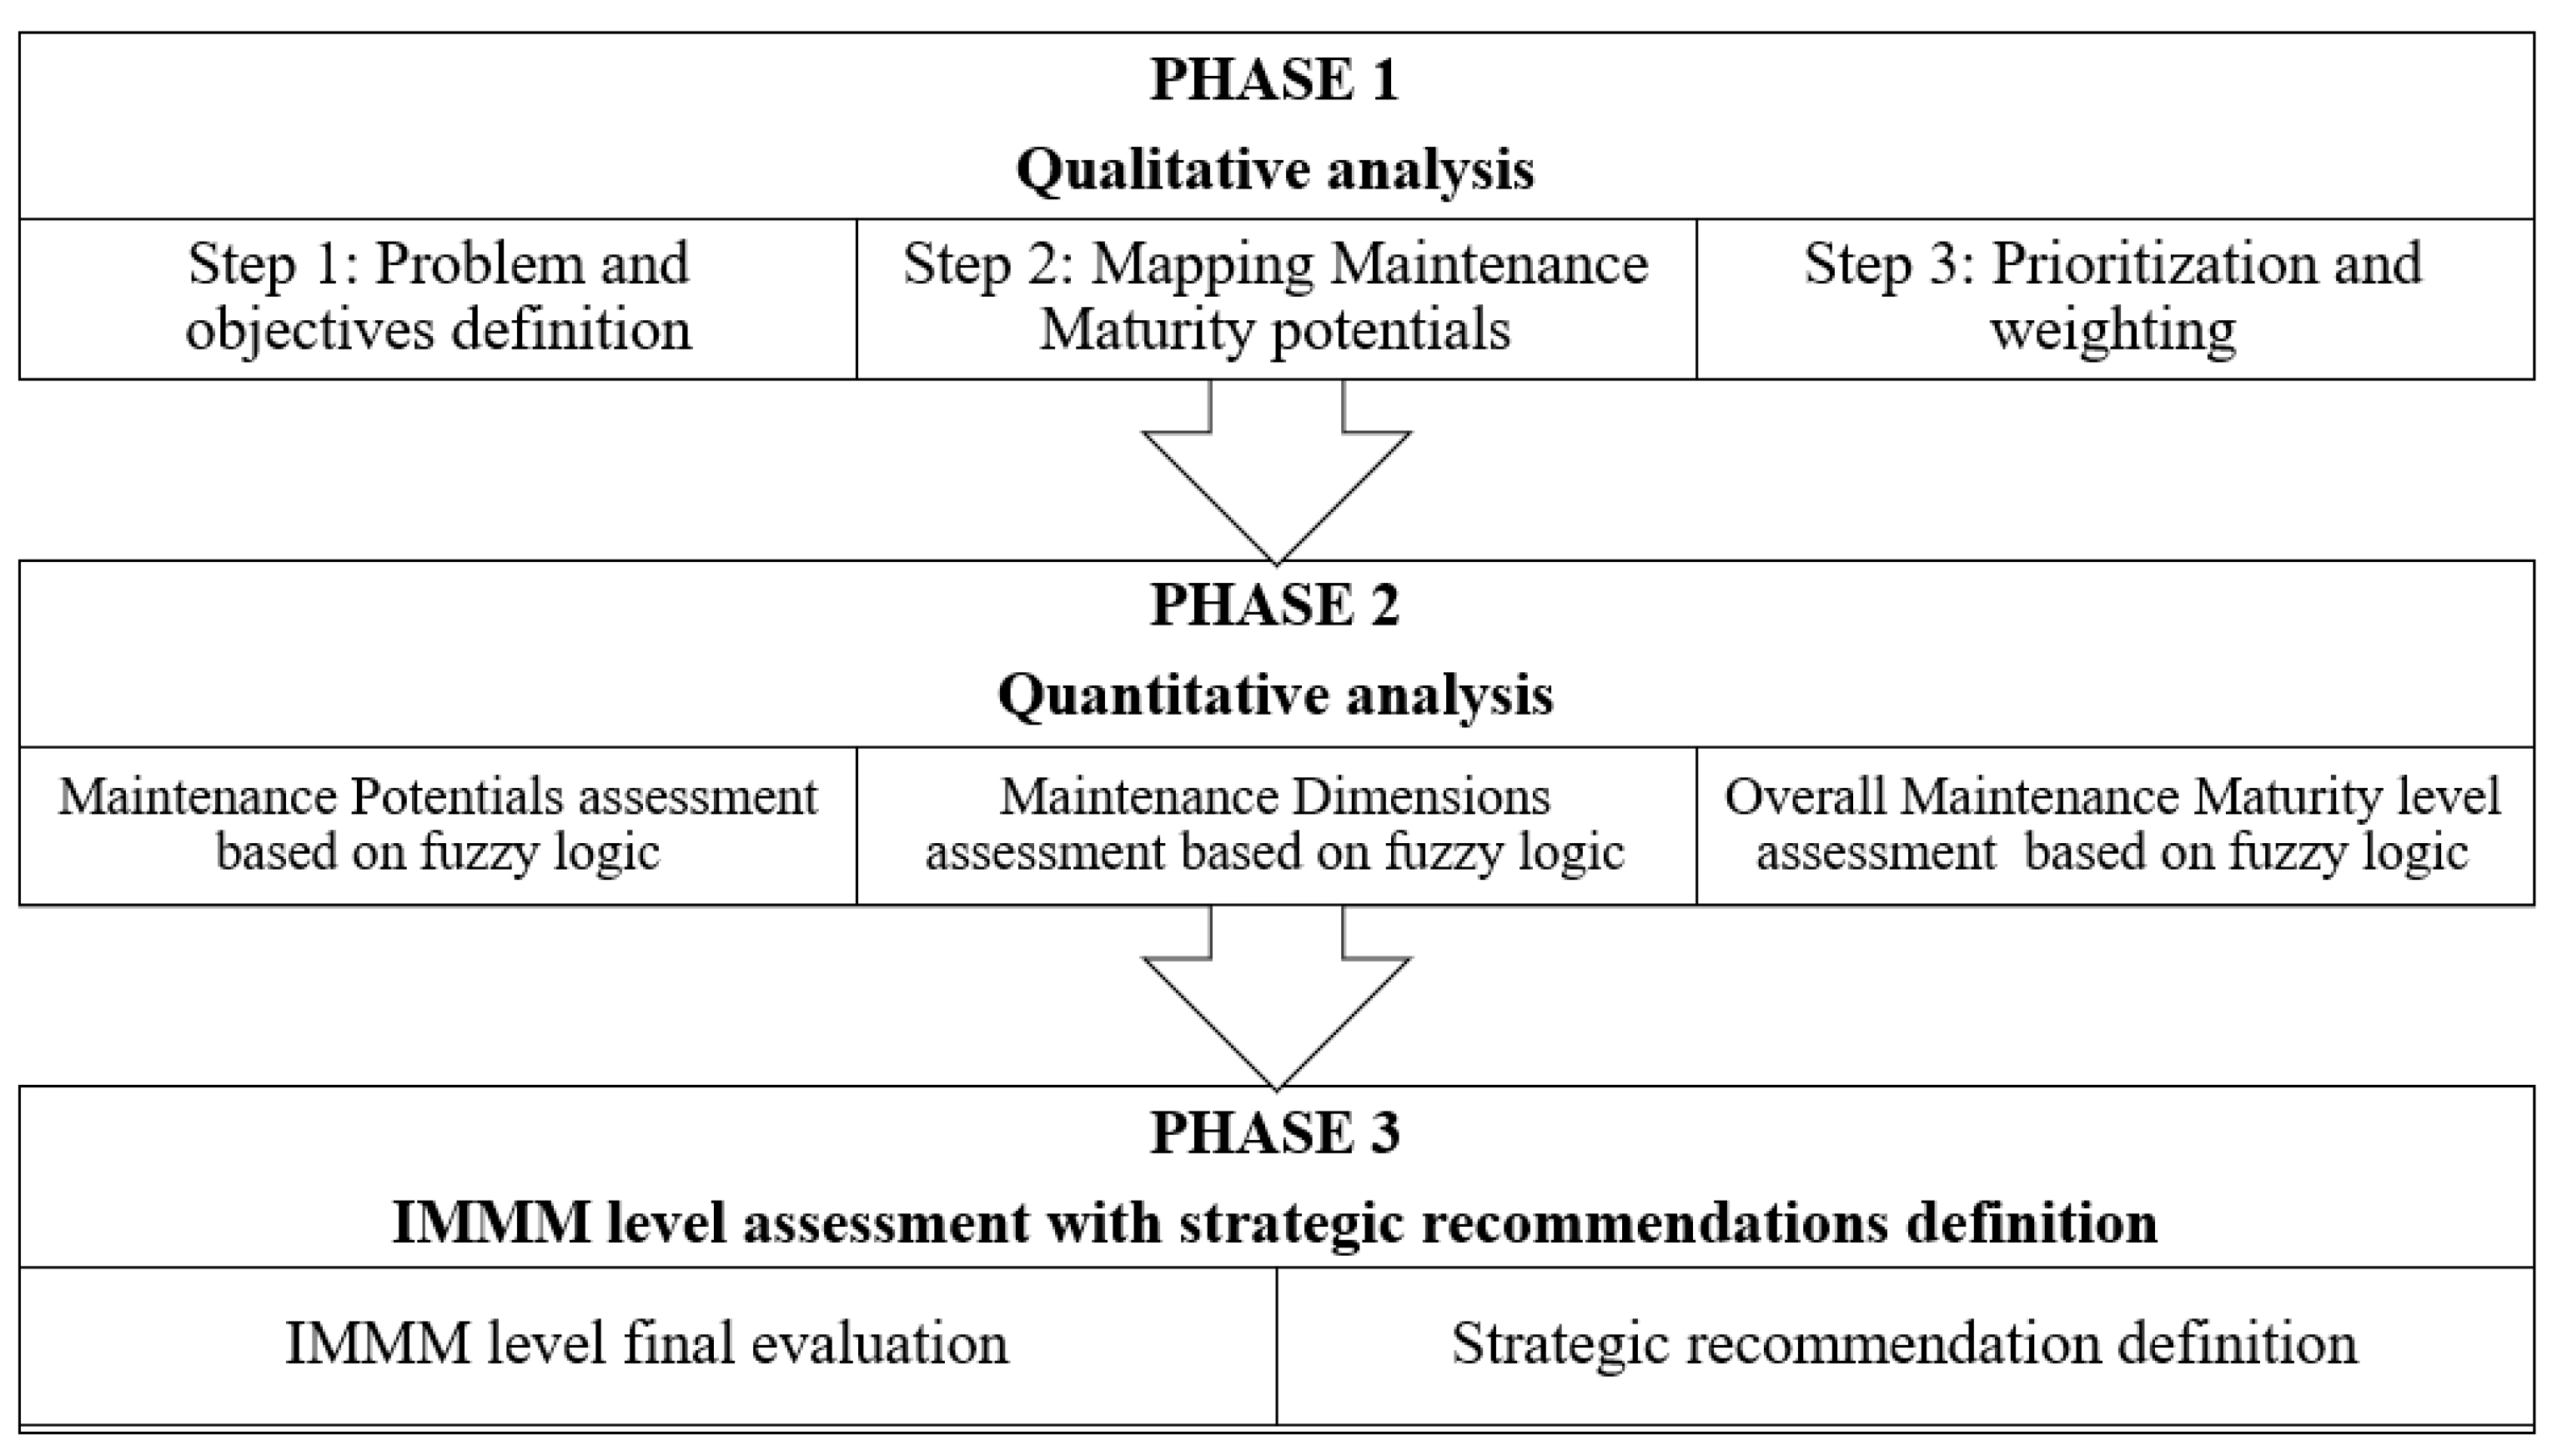
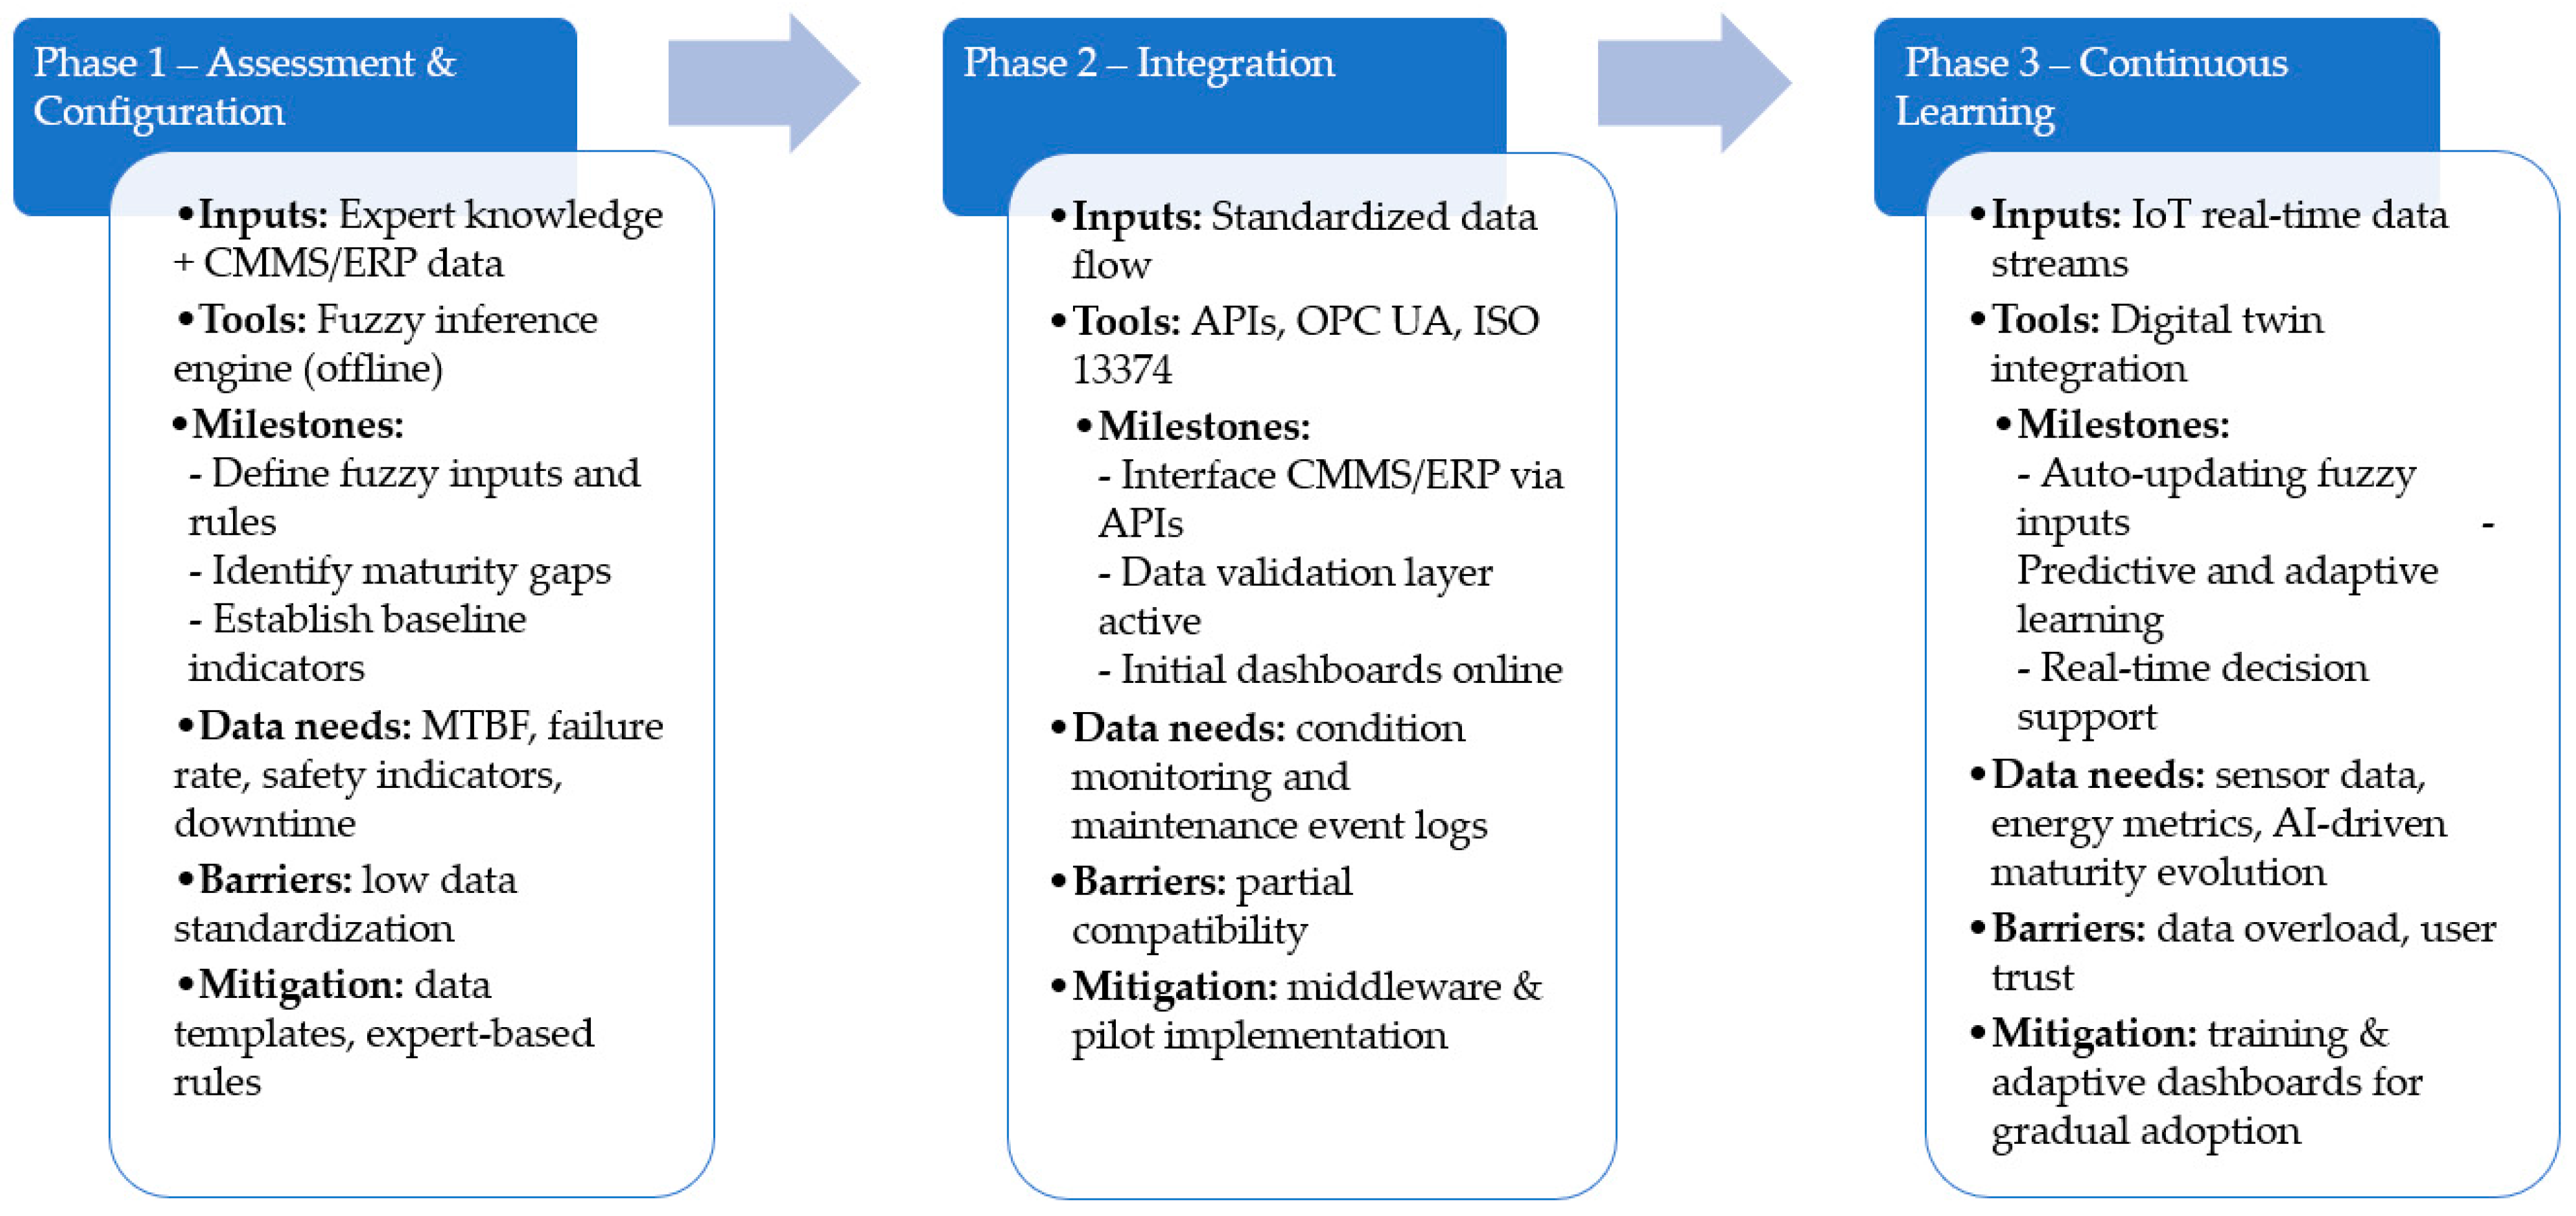
The proposed approach is based on fuzzy logic and the Integrated Maintenance Maturity Model (IMMM) structure for the developed maintenance maturity assessment methodology. e approach combines expert knowledge, linguistic reasoning, and quantitative evaluation to assess five core maintenance maturity potentials (P1–P5) (according to Table 1). Each potential is assessed individually, considering its performance level and relative importance in the organization. The methodology follows a three-phase procedure, which is presented in Figure 5.

3.2.1. Qualitative Analysis—Identification and Structuring of Maintenance Maturity Potentials

In the first phase, a qualitative framework is developed to identify, structure, and prioritize the key Maintenance Maturity Potentials (P1–P5). This foundational phase defines what is measured and how it reflects the organization’s current and desired maintenance capability.
  • Step 1: Problem and objectives definition
The process begins by analyzing the organization’s current maintenance system. This includes identifying present challenges, performance gaps, and strategic objectives related to reliability, safety, resilience, responsiveness, and sustainability. The industrial context, technology level, and regulatory environment determine which maturity indicators are most relevant.
  • Step 2: Mapping Maintenance Maturity potentials (P1–P5)
This step defines the five core potentials of the Integrated Maintenance Maturity Model (IMMM), which serve as pillars for evaluating the comprehensiveness and advancement of a maintenance function. These potentials include (according to Table 2):
  • P1: Reliability and Availability—potential that captures the system’s ability to perform its required functions under stated conditions over a defined period.
  • P2: Safety and Security—the dimension that protects personnel, assets, and data. It includes occupational health and safety performance, incident rates, risk mitigation strategies, and cybersecurity readiness in maintenance activities.
  • P3: Resilience and Recovery—potential assesses the system’s ability to absorb disturbances, adapt to changing conditions, and recover quickly from failures or disruptions. It involves redundancy strategies, emergency procedures, and continuity plans.
  • P4: Flexibility and Agility—a potential related to how quickly and efficiently the maintenance system can respond to internal and external changes, such as shifts in production priorities or unexpected breakdowns. It includes responsiveness, reconfigurability, and decision-making agility.
  • P5: Environmental impact—potential that reflects the environmental and social responsibility of the maintenance system. It includes energy consumption, resource efficiency, waste reduction, and alignment with ESG (Environmental, Social, Governance) goals.
Each potential is supported by three key components: knowledge areas, measurement indicators, and performance objectives. Knowledge areas define the competencies and practices necessary for maturity development (e.g., condition monitoring, RCM, predictive maintenance for P1). Measurement indicators translate qualitative insights into quantifiable metrics, enabling systematic assessment and later fuzzy logic-based evaluation. Performance objectives set the direction for improvement and should align with the organization’s strategic priorities.
The selection of relevant parameters can follow two complementary approaches. The expert-driven approach gathers insights through expert panels, interviews, or Delphi studies [64], capturing tacit and context-specific knowledge. Alternatively, structured decision-making methods such as Analytic Hierarchy Process (AHP), Decision-Making Trial and Evaluation Laboratory (DEMATEL), Best–Worst Method (BWM), Technique for Order Preference by Similarity to Ideal Solution (TOPSIS), or Preference Ranking Organization Method for Enrichment Evaluation (PROMETHEE) [65] support the objective prioritization of parameters. In data-rich environments, machine learning or clustering methods (e.g., Principal Component Analysis PCA) may be applied for evidence-based selection. Hybrid approaches combining expert judgment with analytical techniques often yield the most balanced and context-sensitive outcomes.
Ultimately, the selection approach depends on the organization’s decision-making culture, availability of expertise, and the level of granularity desired in the assessment. Combining methods may offer comprehensive results, balancing expert intuition with analytical rigor. In addition to supporting identifying and selecting appropriate indicators, practitioners may refer to structured indicator frameworks, such as ISO 55000 series [66], standard EN 15341 [67], or other relevant industry-specific standards or benchmarking databases.
  • Step 3: Prioritization and weighting
The final step in the qualitative phase involves assigning priority weights to the five maintenance maturity potentials and their associated indicators. This step ensures that the model reflects the relative importance of different aspects of maintenance maturity within a given organizational context. Weighting is a foundational input for the fuzzy inference system used in the next phase of the methodology, influencing how the maturity level is ultimately scored and interpreted.
The weighting process can follow one of two general approaches: expert-based or structured weighting methods. Expert-based weighting relies on the insights of domain experts, maintenance managers, and other key stakeholders familiar with the organization’s operational goals and strategic priorities. Weights can be assigned through direct estimation (e.g., allocating percentages across the five potentials), pairwise comparisons, or structured interviews. Consensus-building techniques, such as the Delphi method, may also be applied to reduce bias and improve the reliability of expert-derived weights.
For greater rigor and reproducibility, the second approach is recommended. Here, formal multi-criteria decision-making techniques can be applied to generate the weights. The Analytic Hierarchy Process (AHP) is particularly effective for this task, as it allows decision-makers to perform pairwise comparisons and derive a consistent weight distribution [68]. Other methods include the Best-Worst Method (BWM) for lower cognitive load or entropy-based weighting, which leverages available data to quantify the information contribution of each indicator. DEMATEL can also be used to understand causal relationships among indicators, helping prioritize those with the most influence.
In both approaches, the weights should be normalized (e.g., sum to 1 or 100%) to ensure consistency in aggregation during the fuzzy logic evaluation. It is also recommended that the final weights be validated with stakeholders to ensure alignment with the organization’s risk tolerance, regulatory obligations, and long-term maintenance objectives.
The result of this step is a complete, weighted framework that reflects qualitative expert insights and, optionally, quantitative decision-structuring. These weights will be used in the fuzzy aggregation logic to ensure that more critical aspects of maintenance maturity exert greater influence on the final maturity assessment outcome.
To ensure methodological transparency, expert workshops are to be organized to support the weighting and rule-base construction. A panel of eight experts was formed, including maintenance managers, reliability engineers, and academic researchers with a minimum of 10 years of experience in maintenance management or asset reliability. Experts were selected based on three main criteria: (1) professional experience in industrial maintenance systems, (2) familiarity with predictive and sustainable maintenance practices, and (3) involvement in reliability or resilience-focused projects. The workshops followed a Delphi-like structure comprising three iterative rounds. In the first round, individual experts provided preliminary weight estimations and rule proposals. In the second round, anonymized feedback was shared to highlight divergences and promote convergence. In the third round, final weights and rule adjustments were consolidated once a consensus threshold (standard deviation < 10%) was reached. This structured approach minimized cognitive bias and ensured consistent expert input across the IMMM potentials and indicators.

3.2.2. Qualitative Analysis—Expert Evaluation and Fuzzy Aggregation

The main goal of this phase is to determine the overall maintenance maturity level of the organization and provide actionable recommendations for improvement based on the results of the fuzzy evaluation.
At the initial stage of this phase, expert opinions are collected regarding the assessment of each maintenance maturity potential within the IMMM framework (Figure 4). Experts evaluate the values of key parameters, such as reliability, safety, resilience, agility, and environmental impact, based on observed practices and system characteristics. These evaluations use linguistic scales to reflect the inherent uncertainty and subjectivity in maintenance performance assessment. The workshops described earlier also should serve to validate the consistency of linguistic term interpretation among experts. Before aggregation, an inter-rater consistency check should be performed, and individual fuzzy evaluations should be compared using the Mean Absolute Deviation (MAD) method. Cases where deviation exceeded 15% are to be revisited collectively to ensure semantic alignment of expert judgments. Furthermore, a simple sensitivity analysis should be conducted by varying assigned weights ±10% across the five maturity potentials to evaluate the robustness of the final maturity score. It is expected that such variation led to less than ±0.03 change in the global maturity level, confirming the model’s stability and low sensitivity to individual expert bias.
The appropriate definition of linguistic variables is grounded in expert knowledge and is tailored to the characteristics of the maintenance domain and the type of industrial system under consideration. In the subsequent step, the linguistic terms are modeled using fuzzy set theory to enable systematic and transparent reasoning under uncertainty.
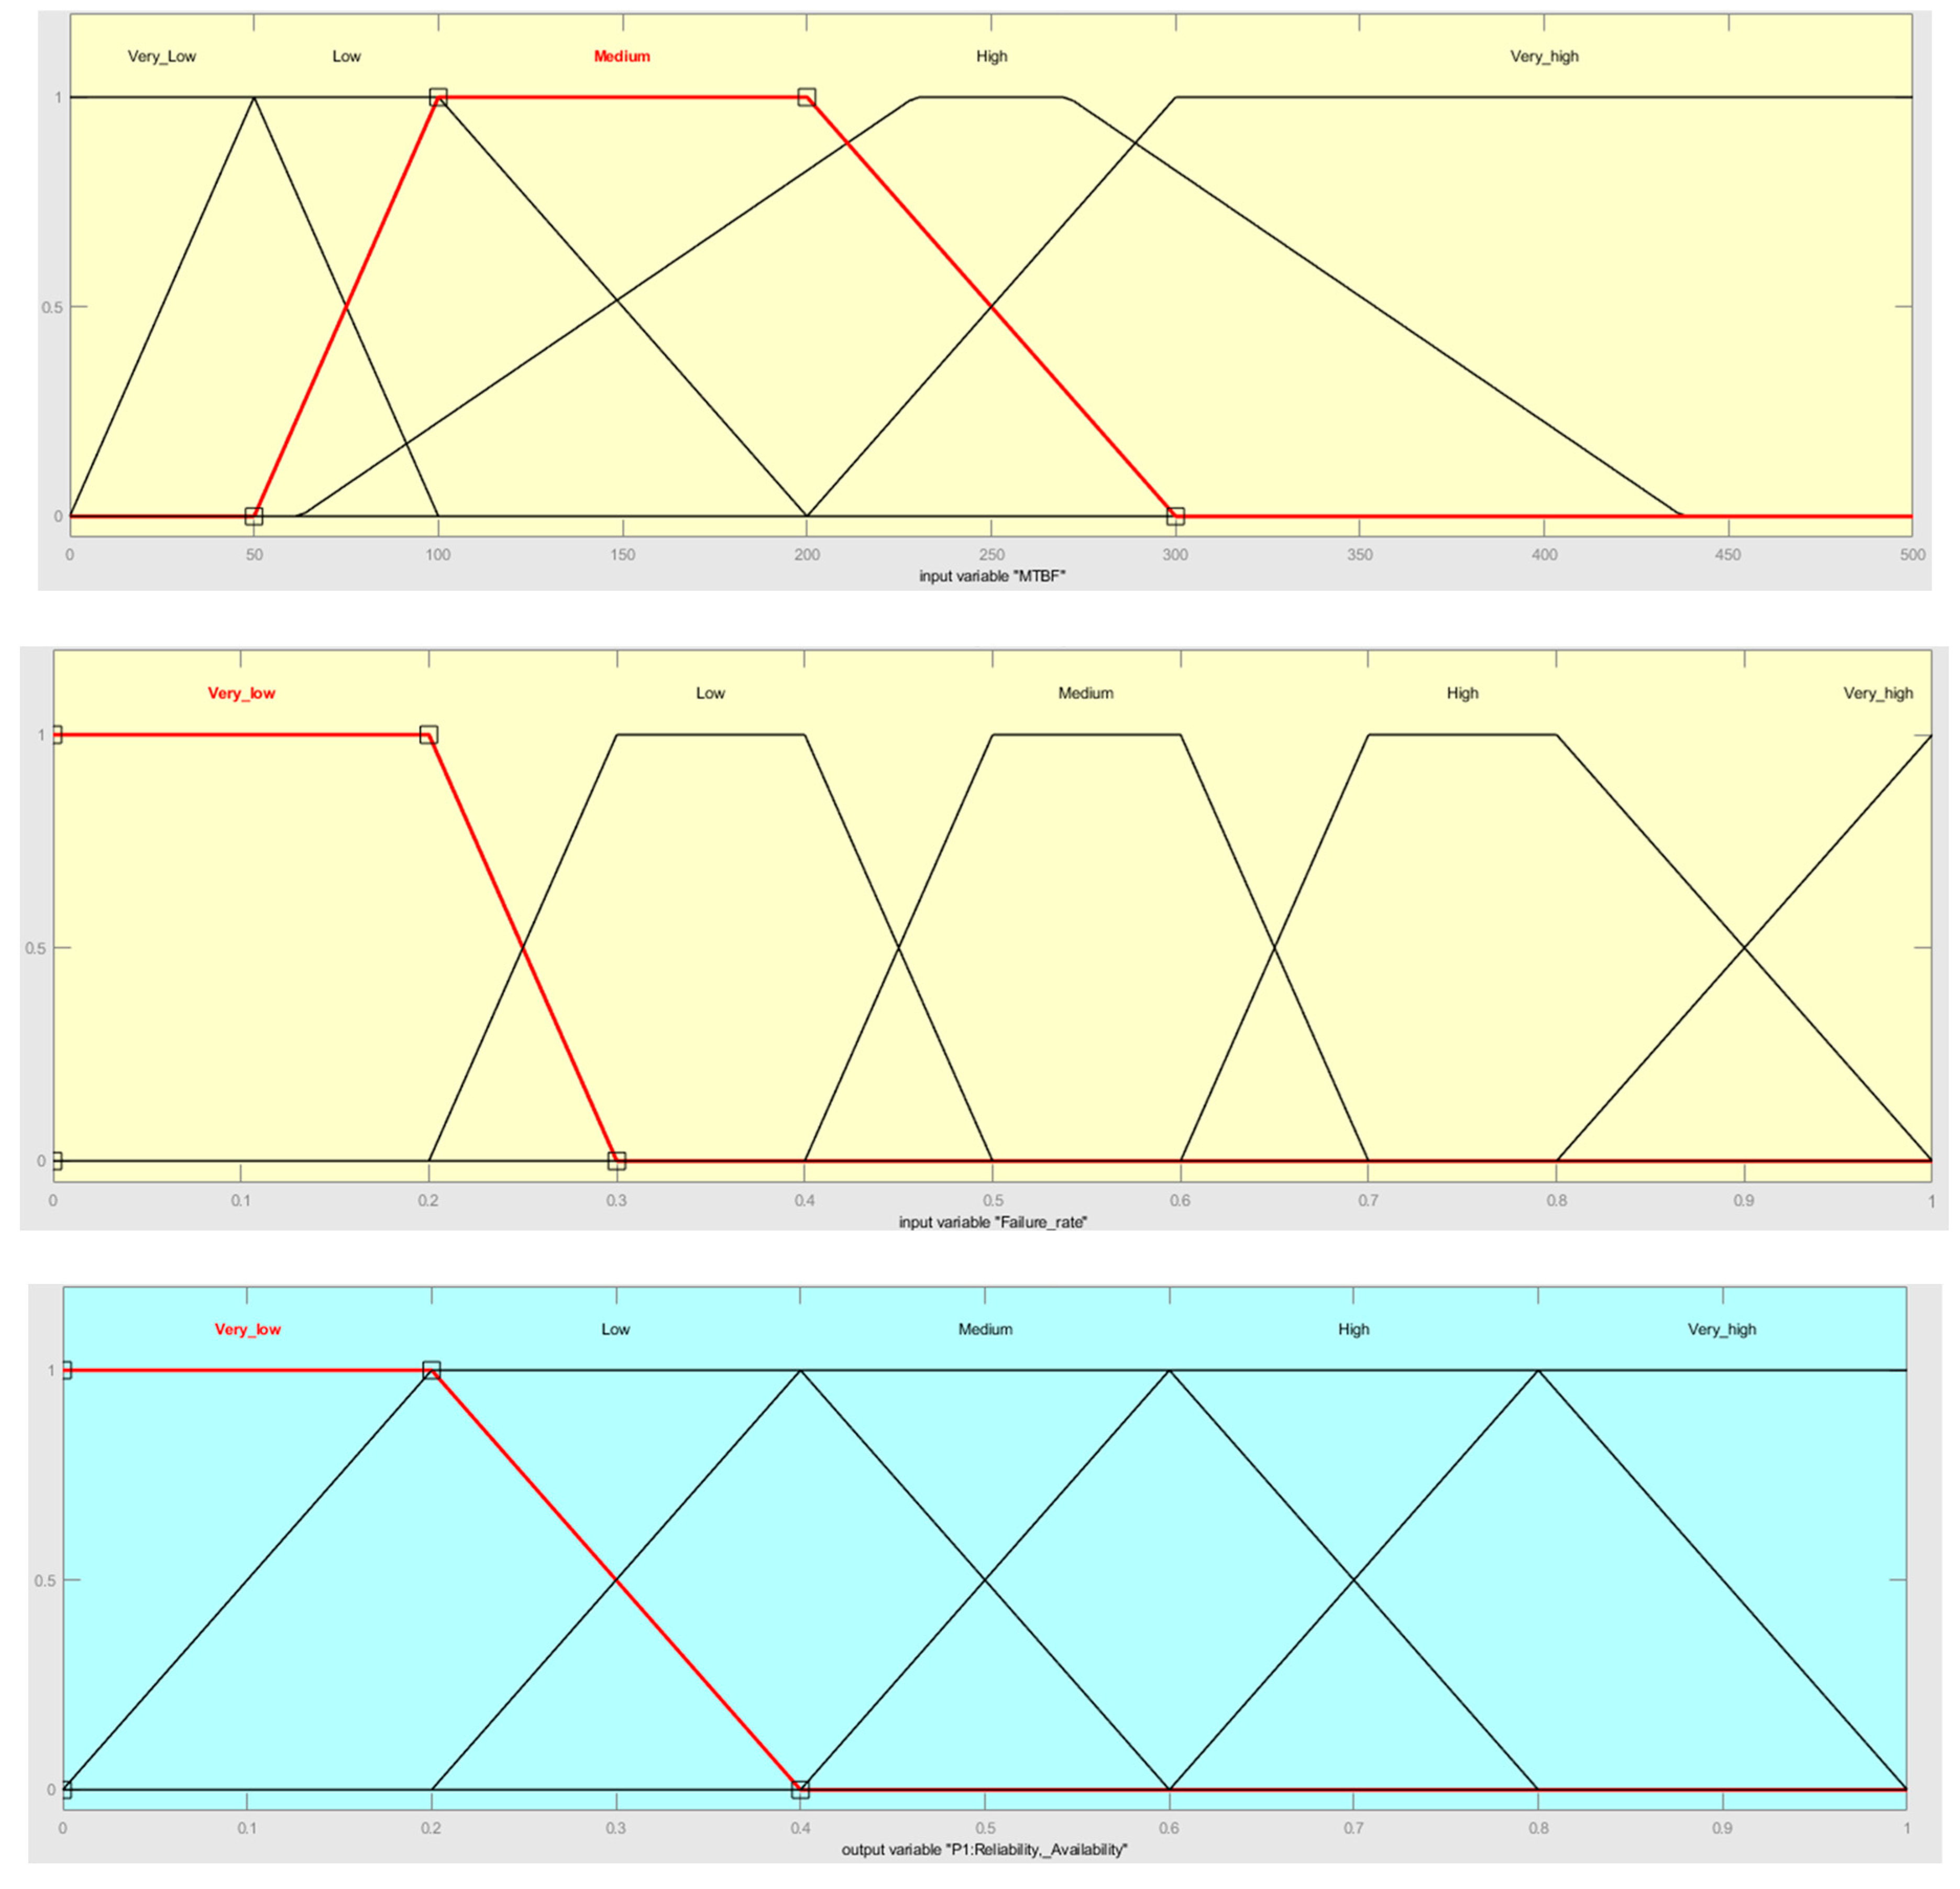
Fuzzy set theory enhances comparative analysis’s consistency and improves expert reasoning’s transparency under uncertainty [69]. Accordingly, in the context of maintenance maturity assessment, the modeled parameters are represented using trapezoidal fuzzy numbers, facilitating the aggregation and interpretation of fuzzy outputs.
A trapezoidal fuzzy number is defined as Az = (a, b, c, d), where a and d represent the lower and upper bounds of the FN, and b and c define the core (i.e., the interval of full membership). The corresponding membership function is given by [70]:
μ z ( x ) = 0                   f o r   x < a x a b a         f o r   a x b 1             f o r   b x   c d x d c         f o r   c x d 0                     f o r   x > d
Consequently, the linguistic variables associated with input indicators (maturity-related attributes) and output evaluations (maturity levels) are defined using triangular and trapezoidal membership functions, respectively. These fuzzy representations allow for a nuanced and robust assessment of maintenance maturity within the IMMM framework.
Although the present approach utilizes Triangular Fuzzy Numbers (TFNs), it is worth noting that multiple methods exist for constructing membership functions for fuzzy variables, each depending on the application context and availability of data (see [71] for further discussion).
In practice, defining membership functions in environments with limited or estimated data poses a challenge, as the parameters (a, b, c, d) may reflect subjective expert judgment rather than empirical distributions. To ensure the correctness and robustness of the membership functions, several measures may be applied. First, the linguistic boundaries and core intervals will be established through iterative expert calibration during workshops, ensuring that different experts share a consistent interpretation of linguistic terms (e.g., “medium” or “high”). Second, sensitivity testing are to be conducted by slightly varying the membership parameters and observing the resulting impact on maturity scores, confirming that the model remained stable within acceptable ranges.
In future applications, hybrid calibration methods can be used to further improve precision—for example, combining expert-based fuzzy sets with data-driven tuning techniques such as adaptive neuro-fuzzy inference systems (ANFIS) or genetic optimization algorithms. These methods allow empirical data (e.g., from CMMS or condition monitoring systems) to refine membership function parameters, thereby reducing subjectivity and increasing replicability in different industrial contexts.
Once expert assessments of individual maturity indicators are gathered using linguistic terms, these must be aggregated to evaluate each maturity potential. In line with [72], a common and effective method for aggregating expert input is the arithmetic mean operator applied to TFNs. These aggregated fuzzy evaluations serve as the basis for determining the maturity level within each potential.
The weights defined in Phase 1 (qualitative analysis), both for indicators within a potential and for the potentials themselves, are applied to the fuzzy values. These weights reflect the relative importance of each aspect of maturity and ensure the aggregation process aligns with the organization’s strategic priorities.
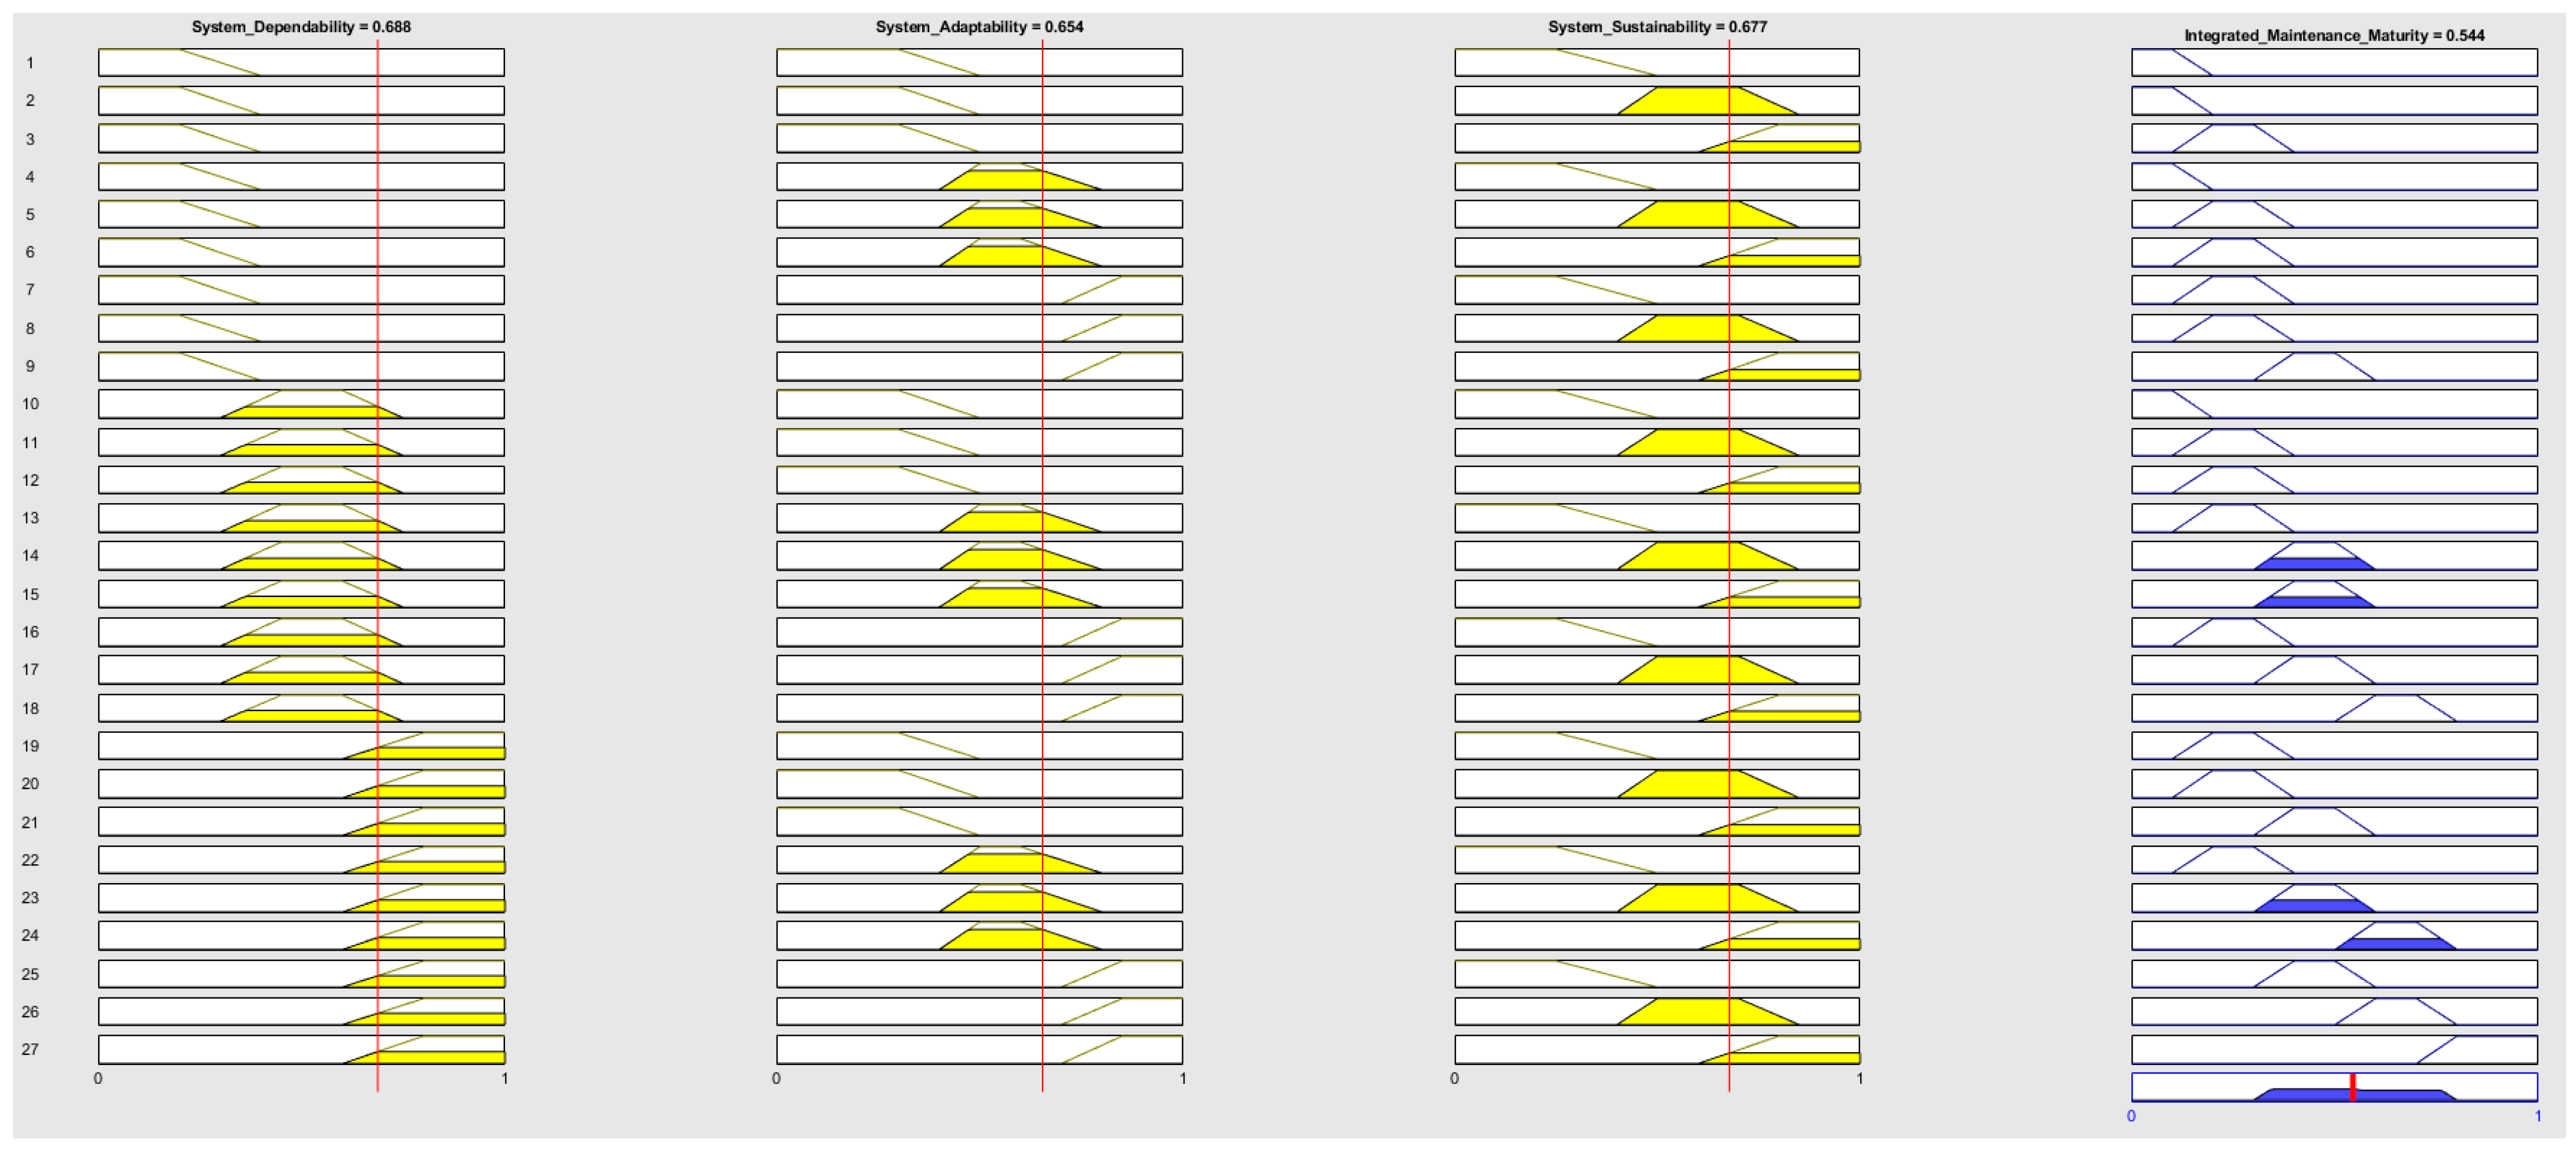
Subsequent analysis follows the structure of a Mamdani-type fuzzy inference system (FIS), which has proven to be a widely accepted model for fuzzy reasoning under uncertainty [73]. The Mamdani framework, grounded in Zadeh’s compositional rule of inference [74], quantifies maturity performance levels based on expert-driven fuzzy inputs. The Mamdani fuzzy inference model was selected due to its interpretability, transparency, and suitability for expert-based decision environments. It allows experts to express linguistic judgments in a natural way (e.g., low, medium, high) and ensures that the reasoning process remains explainable. This approach bridges quantitative computation and qualitative understanding—crucial for maintenance decision-making under uncertainty.
The selection of the FIS architecture and Membership Functions (MFs) was justified through an evaluation against alternative methods to ensure optimal performance for a linguistic, expert-driven maturity assessment application.
Alternative FIS architectures, such as the Sugeno (Takagi-Sugeno) model, were considered but rejected. While Sugeno systems offer computational efficiency because their output is a crisp function rather than a fuzzy set, they sacrifice the interpretability necessary for a management diagnostic tool. The Mamdani model’s fuzzy output is inherently easier for maintenance experts to validate and understand, making it superior for achieving organizational acceptance and transparency in decision-support systems [75].
Similarly, the use of Triangular and Trapezoidal Membership Functions was prioritized over smooth functions like Gaussian or Bell curves. For a maturity model based on expert consensus, the simple, piecewise linear boundaries of the Triangular/Trapezoidal MFs are easier for maintenance professionals to define and agree upon linguistically. Smooth MFs, while better for approximating noisy empirical data, introduce unnecessary mathematical complexity and ambiguity when converting qualitative expert knowledge into fuzzy sets, which is the primary data source in this application. This choice ensures high fidelity between the tacit knowledge gathered in workshops and the final model definition [76].
The implementation of the Mamdani fuzzy model in this assessment consists of four primary components:
  • Fuzzification—Converts linguistic variables provided by experts into fuzzy numbers (in this case, TFNs), enabling a representation of values on a normalized scale from 0 to 1.
  • Knowledge base—Comprises a set of IF-THEN rules and corresponding membership functions for each input indicator across the five maturity potentials (e.g., reliability, safety, resilience).
  • Fuzzy Inference Mechanism (FIS)—Employs fuzzy logic operations to process the rules. Specifically, the MIN operator is used to model logical conjunctions and implications. In contrast, the MAX operator aggregates fuzzy results from multiple rules.
  • Defuzzification—Converts the final aggregated fuzzy output into a crisp value using the Centroid of Area method [77,78]. This crisp value reflects the estimated maturity level for a given potential.
The defuzzified output z is computed using the following formula [77,78]:
C e n t r o i d   o f   a r e a , z * = μ A z · z d z μ A z d z
where z*—the crisp value for the z output (defuzzified output); μ A z —the aggregated output membership function; z—universe of discourse.
This process ultimately delivers a quantified maturity score for each of the IMMM’s five key potentials, supporting the interpretation of strengths and improvement areas in a maintenance strategy under uncertainty.
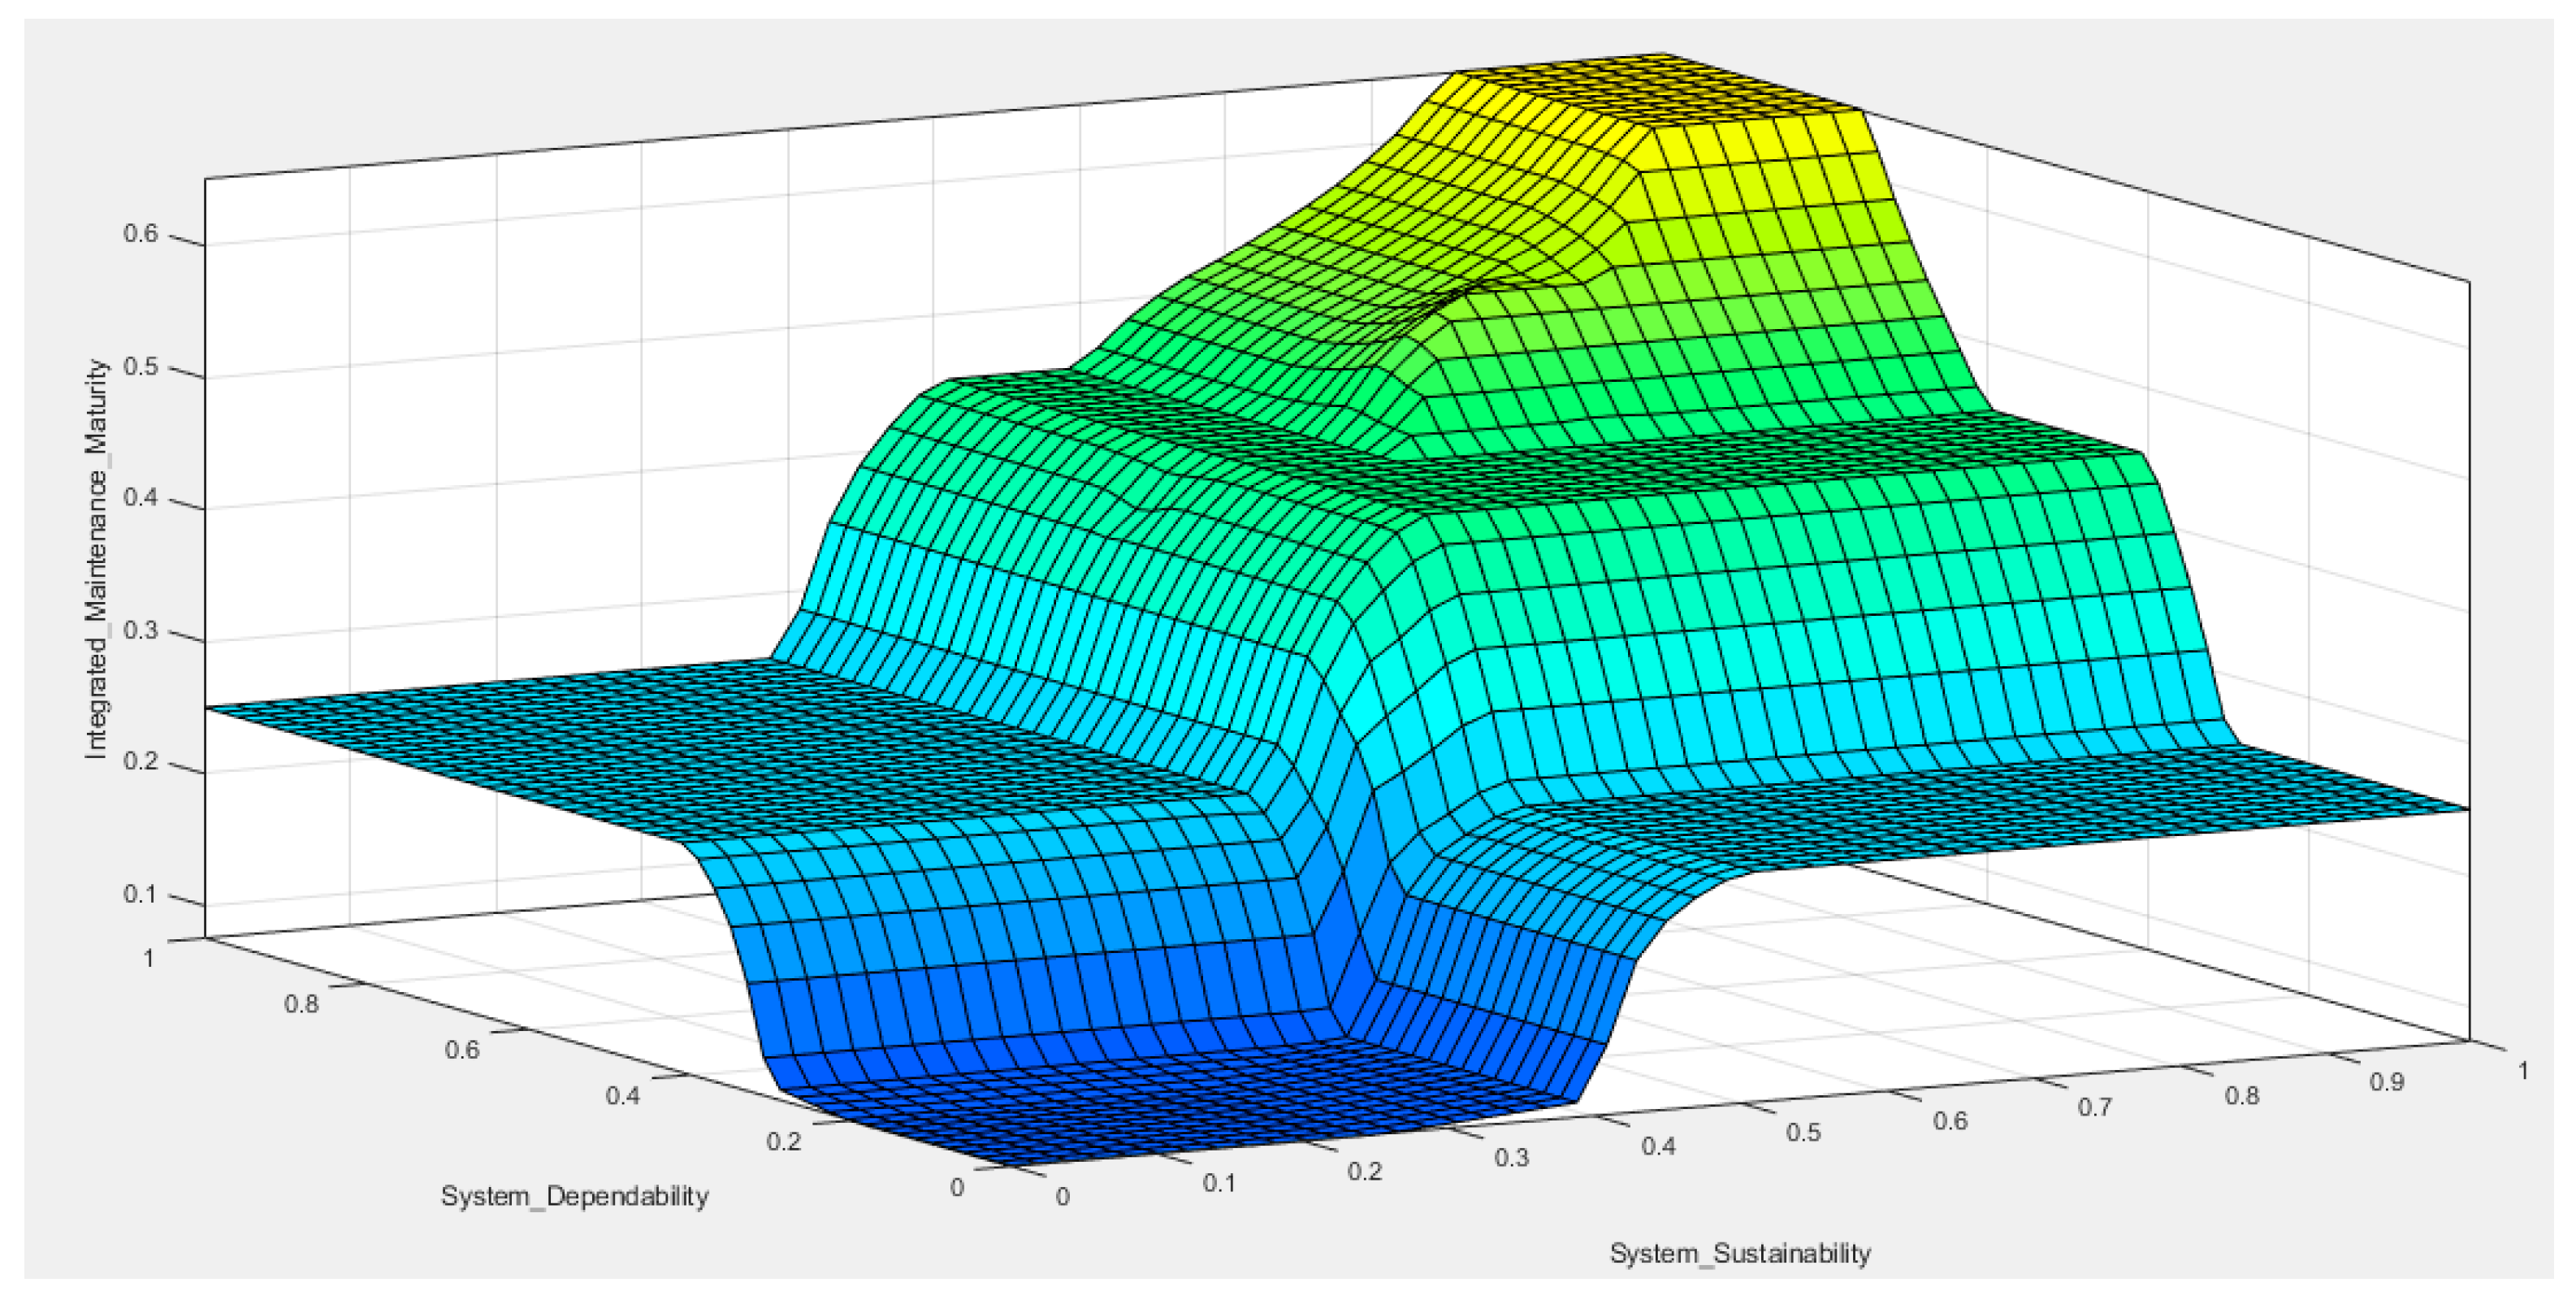
The second step in the IMMM framework regards assessing the three system maturity dimensions. The fuzzy logic approach is similar to the developed one for P1–P5 maintenance potential evaluation. Each dimension is assigned a composite fuzzy score based on the weighted aggregation of its underlying potentials. The fuzzy results may be defuzzified or maintained in linguistic form, depending on the intended granularity of analysis.
The last step in this area is the maturity level assignment. The dimension scores are then positioned within the five levels’ predefined IMMM maturity matrix (Table 2). Based on the position of each dimension, an overall Maintenance Maturity Level is determined based on the fuzzy logic approach described above in this subsection.
At the end of the quantitative phase, the defuzzification process provides the crisp output value of the Maintenance Maturity level, an input to the last phase—the Output phase.

3.2.3. Integrated Maintenance Maturity Level Assessment with Strategic Recommendations Definition

Once the overall maintenance maturity level has been assessed, the next step involves designing tailored improvement actions to support advancement toward more advanced levels (Levels 4–5). These actions should prioritize areas with the lowest maturity scores, strategically significant potentials (e.g., critical to safety, reliability, or sustainability goals), and the readiness and capacity of the organization to implement change.
Organizations should first conduct a gap analysis between their current and desired maturity levels to ensure the recommendations are actionable and effective. Based on this, priorities should be established, focusing on critical business risks and strategic goals. Actions offering significant impact with limited resource requirements—so-called ‘quick wins’—should be considered early in the process. Each recommendation should be accompanied by measurable indicators (KPIs) for tracking and evaluation. For organizations implementing advanced solutions such as AI or digital twins, it is advisable to begin with pilot implementations in selected areas to evaluate value before full-scale deployment. These steps will help align the maintenance improvement strategy with operational realities and long-term ambitions.

4. Case Study

To illustrate the applicability of the proposed Integrated Maintenance Maturity Model (IMMM), a case study was conducted in a manufacturing company operating in the automotive sector. The selected enterprise is a key production facility in Lower Silesia, Poland, and plays a strategic role in the company’s global operations. With over 100 years of innovation in mobility technologies, the company specializes in developing and producing safety- and efficiency-critical systems for commercial vehicles. It operates across four continents with 28 production plants and three advanced test centers, including one in Poland. The Polish branch employs approximately 3000 people, making it the largest employment hub of the company in Europe.
The site contributes nearly 35% of the company’s global output, supplying a wide range of braking systems, suspensions, stabilization modules, and aerodynamic control systems to major Original Equipment Manufacturer (OEM) clients, including brands like Daimler, Scania, and Mercedes. Its operations are supported by a broad supplier base of over 500 entities worldwide. Internally, the facility is divided into seven departments, each focused on a distinct set of final products, with production involving technologically advanced processes like high-precision assembly, calibration, and functional testing under safety-critical conditions.
Given the manufacturing operations’ scale, complexity, and safety relevance, the maintenance function is pivotal in ensuring production continuity, minimizing operational risks, and aligning with sustainability expectations. Therefore, this company was selected as an ideal candidate for testing the IMMM methodology in a real-world industrial environment. Indeed, the main steps of the adopted approach for the case company are presented below.

4.1. Qualitative Analysis

  • Step 1: Problem and Objectives Definition
The case study began with a qualitative analysis aimed at identifying and structuring the key potentials that determine the maturity of the maintenance system in the examined company. The primary problem addressed was the need to ensure operational continuity and production reliability under conditions of increasing complexity and uncertainty. Despite the company’s high technological advancement and well-established preventive maintenance practices, several internal and external disruptions have exposed vulnerabilities in system resilience and sustainability performance.
A deeper investigation revealed specific challenges, such as variability in machine availability, occasional delays in critical component deliveries, and the environmental impact of intensive maintenance operations. Moreover, the company’s ambition to align its practices with global sustainability standards and to prepare for the next wave of digital transformation highlighted the need for a more integrated and strategic approach to maintenance maturity assessment.
Accordingly, the main objective of the analysis was to evaluate the company’s current state across five defined maintenance maturity potentials—(P1) Reliability and Availability, (P2) Safety and Security, (P3) Resilience and Recovery, (P4) Flexibility and Agility, and (P5) Sustainability—and to identify specific improvement directions. The goal was to assess maturity levels and understand how the maintenance system could evolve to support better strategic objectives such as risk resilience, production continuity, and environmental responsibility.
Implementing the IMMM aimed to structure the decision-making process in a way that would support evidence-based prioritization of maintenance improvements, taking into account both expert knowledge and the fuzzy nature of industrial uncertainties. This approach was expected to provide actionable recommendations tailored to the organization’s operational context, maturity ambitions, and available resources.
  • Step 2: Mapping Maintenance Maturity Potentials (P1–P5)
In this step, the five Maintenance Maturity Potentials of the Integrated Maintenance Maturity Model (IMMM) were mapped to the context of the analyzed company operating in the automotive sector. The purpose was to identify the key strategic areas of maintenance performance relevant to the organization and to structure the foundation for subsequent assessment and prioritization. These maturity potentials are grounded in theoretical insights and the specific operational characteristics of the selected company.
The mapping was carried out based on the theoretical framework presented in Table 1, adapted to the studied plant’s technological, organizational, and strategic profile. The company under analysis, located in Lower Silesia, Poland, plays a critical role in the global production network by delivering over one-third of the organization’s worldwide output. It operates several technologically advanced production departments, each responsible for different high-value systems for commercial vehicles. Maintenance in such a context is essential to ensure technical availability and support safety, rapid recovery, and sustainability in a highly automated and quality-driven environment.
The five identified Maintenance Maturity Potentials include:
  • P1: Reliability and Availability: This potential reflects the company’s ability to ensure uninterrupted operation of production equipment through predictive maintenance, real-time condition monitoring, and optimization of preventive activities. The company’s reliance on high-precision machining and safety-critical assemblies makes uptime and reliability a top priority. Knowledge areas include reliability-centered maintenance (RCM), sensor-based diagnostics, and predictive analytics.
  • P2: Safety and Security: Given the organization’s focus on safety-related components such as braking and stabilization systems, maintenance must ensure strict compliance with safety protocols for operators and end-products. This includes occupational safety, risk mitigation procedures, and cybersecurity readiness. Key knowledge areas include risk assessment methodologies, human–machine interface (HMI) safety, and maintenance cybersecurity protocols.
  • P3: Resilience and Recovery: The company’s exposure to supply chain fluctuations and the complexity of its production setup demand high resilience. Quick recovery from breakdowns, availability of critical spares, and structured emergency procedures are essential. This potential includes knowledge areas such as failure mode analysis, recovery time optimization, and emergency scenario planning.
  • P4: Flexibility and Agility: Due to high product diversity and changing client requirements, maintenance systems must be agile enough to adapt to evolving production schedules and machine configurations. The ability to shift resources quickly and adjust maintenance plans is critical. Related knowledge areas include modular maintenance planning, digital work order systems, agile resource scheduling.
  • P5: Environmental impact: As the company aligns with global ESG objectives, it seeks to improve energy efficiency, minimize waste, and reduce emissions from maintenance activities. Efforts are made to integrate circular economy principles into equipment lifecycle management. Knowledge areas include energy monitoring systems, green maintenance practices, and environmental impact assessment.
A hybrid approach was used to identify and refine the elements of each maturity potential. A series of structured interviews with maintenance engineers and continuous improvement managers provided expert input into current practices and perceived priorities. Following this, thematic knowledge areas were identified for each potential to guide specific capabilities and practices. These areas were refined based on a combination of expert consultations with site engineers and a literature-based reference to relevant standards such as EN 15341 and ISO 55000. For example, in the case of P1, the focus included real-time vibration monitoring and predictive diagnostics using AI-enabled tools already piloted at the site.
Simultaneously, selected indicators were verified using an AHP-based multi-criteria decision-making framework, ensuring traceable weighting of factors and alignment with strategic directions. Measurement indicators were proposed to provide an objective, data-driven evaluation. These included both lagging indicators and leading indicators. Indicator selection considered technical feasibility (availability of internal data) and strategic relevance (alignment with corporate goals). An example of AHP-based prioritization of measurement indicators for P1 is given in Appendix A.1. Due to the performance of AHP-based prioritization of measurement indicators, for each maturity potential, two indicators with the highest rank were selected as input data for quantitative analysis.
In the end, performance objectives were set to guide improvement targets. For example, in P4, the plant aims to reduce maintenance response time by 20% within two years by expanding mobile access to work order systems. In P5, a specific goal was to reduce waste oil consumption by 15% through improved filtration and fluid analysis programs.
A reference table (Table 3) presents indicators for each of the five maintenance maturity potentials, associated knowledge areas, and performance objectives. This table can guide organizations aiming to develop or adapt their measurement sets in line with the IMMM framework.
  • Step 3: Prioritization and Weighting
In this step, the five Maintenance Maturity Potentials (P1–P5) and their associated measurement indicators were prioritized and assigned weights to reflect their relative importance within the organizational context. This process ensures that the final maturity assessment accurately emphasizes the most strategically relevant areas.
A structured expert-based approach was applied, involving a panel of eight experts, including two maintenance managers, one reliability engineer, two production planners, and one academic specialist in maintenance maturity modeling. Each expert had at least ten years of industrial experience and direct knowledge of predictive or resilience-oriented maintenance.
Experts individually rated the relative importance of each maintenance potential on a five-point linguistic scale (from “very low importance” to “very high importance”). The collected evaluations were converted into numerical scores and aggregated using the arithmetic mean operator to ensure representativeness and mitigate individual bias. Following aggregation, the results were normalized so that the sum of all weights equaled 1.0.
A follow-up discussion was held to validate the results and confirm consensus. The final weighting scheme (Table 4) reflects both the empirical agreement among experts and the strategic priorities of the case company, emphasizing reliability as the dominant maturity driver.
Based on the consensus from expert inputs, the following normalized weights were assigned to the five maintenance maturity potentials (Table 4, see Appendix A.1 for details of the weighting procedure and aggregation method).
Following this, it was possible to proceed to the next phase—quantitative analysis.

4.2. Quantitative Analysis

The quantitative analysis represents a crucial phase of implementing the Integrated Maintenance Maturity Model (IMMM). Building upon the qualitative insights, this step transforms the mapped maintenance maturity potentials (P1–P5) into measurable indicators. These indicators are then analyzed through a fuzzy logic-based framework to quantify the maturity levels, providing a more objective and data-driven evaluation. This process ensures that the strategic relevance of each maintenance potential is reflected in the final assessment. Additionally, a sensitivity analysis is performed to evaluate the robustness and flexibility of the model under varying conditions.
Following this, the first step of the quantitative analysis, according to Figure 2, is the evaluation of maintenance maturity potentials (P1–P5). In this first stage of the quantitative analysis, the primary goal is to assess the maturity of the maintenance system using a fuzzy aggregation approach.
The fuzzy logic approach is adopted to quantify the maturity of each potential by incorporating expert knowledge and subjective evaluations. This allows for a more nuanced and flexible interpretation of the variables involved instead of a strict binary assessment. The fuzzy membership functions and linguistic terms used in this analysis enable the translation of expert assessments into quantitative scores, providing a comprehensive view of the system’s maturity level.
For each potential, linguistic terms are defined for the overall potential (e.g., Reliability, Availability) and the individual input indicators (e.g., MTBF, Failure Rate for P1). These terms represent different maturity levels, ranging from Very Low (VL) to Very High (VH), and are mapped to fuzzy membership functions. The choice of fuzzy sets reflects expert judgment on the importance and behavior of the respective indicators within the maintenance system. Table 5 and Table 6 present the linguistic terms and fuzzy membership functions for the first potential P1: Reliability, Availability, and its associated input variables. The assessments of potentials P2–P5 and their input variables are given in Appendix A.2. The defined values are based on expert evaluations and theoretical foundations, aiming to reflect real-world scenarios in the maintenance of complex systems. The fuzzy membership functions for the input variables provide a way to quantify the system’s maturity for each potential. The membership functions are trapezoidal and calculated according to Equation (1).
The selection of linguistic variables and corresponding fuzzy membership functions for P1: Reliability, Availability is based on the need to reflect varying levels of system performance clearly and intuitively. The linguistic terms (from Very Low to Very High) cover the full spectrum of system reliability and availability, from poor performance with frequent failures to exceptional performance with minimal disruptions. These terms were selected to represent the common states of system operation, from extremely unreliable systems to highly dependable ones. The fuzzy membership functions were defined to model gradual transitions between these levels, acknowledging the inherent uncertainty and imprecision in real-world system performance. This allows the model to capture the complexity of system behavior more flexibly and accurately, enabling a more detailed quantitative analysis of reliability and availability. In addition, by utilizing trapezoidal fuzzy sets, the system’s performance can be assessed with a smooth progression between the different levels, accommodating continuous and discrete variations in reliability and availability. This approach provides a comprehensive basis for evaluating P1: Reliability, Availability in the broader context of maintenance maturity analysis.
Once we have defined the linguistic variables for the Maintenance Maturity potentials, we must evaluate the system’s maturity across three key dimensions: System Dependability, System Adaptability, and System Sustainability. These dimensions are integral to understanding the overall performance and resilience of a system, especially in complex, dynamic environments (according to Figure 1 and Figure 2). Each of these dimensions, as MMPs, is assessed using fuzzy logic-based linguistic variables, which help in quantifying the system’s behavior and maturity level. The linguistic variables for each dimension are defined by three categories: Low, Medium, and High, allowing for a nuanced assessment of the system’s capabilities. This approach provides a holistic evaluation, considering the system’s reliability, adaptability to change, and environmental sustainability. The descriptions for linguistic variables are given in Table 7, Table 8 and Table 9. In addition, to evaluate the defined three dimensions, we need to include two additional input variables: Technology adaptability and Resource efficiency. Indeed, these linguistic variables are also defined in Appendix A.2.
To comprehensively assess the maintenance system’s development, it is crucial to determine the System Maintenance Maturity Level (MML). The MML integrates the evaluations of System Dependability (derived from P1, P2, and P3), System Adaptability (derived from P4), and System Sustainability (derived from P5). The maturity levels are expressed through five linguistic variables: Initial (L1), Managed (L2), Standardized (L3), Predictable (L4), and Innovating (L5). System Dependability predominantly determines lower maturity levels. Achieving higher maturity levels (L3 and above) requires additionally demonstrating adequate System Adaptability and System Sustainability. The final maturity level is determined through fuzzy inference based on the aggregated evaluation of the potentials, with defuzzification allowing the assignment of a specific crisp maturity level. The linguistic scale for MML is given in Table 10.
The assignment of a maintenance maturity level is based on the following considerations:
  • At a basic level, L1 and L2 levels emphasize the presence or absence of System Dependability features (reliability, safety, resilience).
  • L3 is reached when Dependability is standardized, and Adaptability begins to emerge systematically.
  • L4 requires high Dependability complemented by proactive Adaptability and evolving Sustainability.
  • L5 demands excellent performance across all three dimensions, where innovation and continuous improvement are embedded into maintenance practices.
The maturity level can be determined reliably by applying fuzzy set theory and defuzzification techniques, reflecting gradual transitions and uncertainty in expert assessments.
Following the adopted methodology, the authors analyze whether the evaluated company, focusing on reliability, safety, resilience, adaptability, and sustainability issues, achieves the defined maintenance maturity potentials. This approach enables a comprehensive evaluation of the system’s current state and offers guidance for further development within a resilience- and sustainability-oriented maintenance strategy. A fuzzy rule-based maintenance maturity estimation method was also implemented using the Fuzzy Logic Toolbox of MATLAB version R2020a.
Although the fuzzy rule base in this study was constructed primarily using expert knowledge, several steps were taken to minimize subjective bias. The rules and weights were developed collaboratively by a multidisciplinary expert panel (maintenance, production, and safety engineers). Individual inputs were aggregated through the arithmetic mean operator, followed by iterative validation sessions to ensure consistency and convergence.
The entire inference process was implemented in the MATLAB R2020a environment using the Fuzzy Logic Toolbox. The workflow followed four computational stages: (1) data preprocessing and normalization of expert inputs, (2) fuzzification of variables using trapezoidal membership functions, (3) rule-based inference and aggregation through the Mamdani-type FIS (min–max composition), and (4) defuzzification using the centroid method to obtain a crisp maturity score. The graphical tools of MATLAB (Rule Viewer and Surface Viewer) were used to visualize the influence of input parameters on the resulting maturity level, facilitating validation and interpretability.
This implementation allows maintenance practitioners to input either measured performance data or linguistic expert evaluations directly into the fuzzy interface. The system automatically performs the inference and produces a numerical maturity score together with its corresponding linguistic level (L1–L5). The modular design enables quick recalculation of results when new operational data or expert opinions become available.
The proposed fuzzy system thus acts not only as an analytical model but also as a decision-support tool, providing a transparent and reproducible mechanism for translating expert knowledge into actionable maintenance improvement insights.
This approach reflects the real-world industrial context, where historical data are often incomplete or heterogeneous. Nevertheless, future extensions of the IMMM could incorporate historical operational data, sensor measurements, or machine learning methods (e.g., ANFIS) to calibrate fuzzy membership functions and rule weights. Such hybrid approaches would enhance objectivity, reduce potential deviations, and further increase the predictive capability of the model, while still leveraging expert insights for qualitative assessment.
To improve the clarity and reproducibility of the model, a concise overview of the fuzzy membership functions and representative fuzzy rules has been added below (Table 11). This summary complements the detailed linguistic definitions in Table 5, Table 6, Table 7, Table 8, Table 9 and Table 10 and Appendix A.2, providing a compact view of the fuzzy inference structure used in the Integrated Maintenance Maturity Model (IMMM).
The IMMM employs triangular and trapezoidal membership functions to model gradual transitions between maturity levels, reflecting uncertainty in expert evaluations. The fuzzy rule base contains 25 rules for each potential (P1–P5), 125 rules for System Dependability, and 27 rules for the overall maintenance maturity level. This hierarchical structure allows the model to capture interdependencies between maintenance potentials and systemic dimensions while ensuring transparency and interpretability of the inference process.
First, a quantitative expert-based assessment was performed. For each maintenance maturity potential (P1–P5), experts provided real operational data related to system performance and estimated the input data for the proposed model based on it. Table 12 summarizes the input parameters collected for the five analyzed potentials.
Each potential was assessed based on specific technical indicators, ensuring objectivity and reflecting the real operational conditions of the company’s maintenance system. Based on the consensus from expert inputs, the following normalized weights were assigned to the maintenance maturity potentials (Table 4).
In the next step, the proposed fuzzy model was implemented. The collected quantitative data were fuzzified by mapping numerical values onto predefined fuzzy linguistic terms. This transformation used trapezoidal membership functions (Table 5 and Table 6, and Appendix A.2), as Figure 6 illustrates for the first maintenance potential.
The fuzzified values were processed using a fuzzy inference system (FIS). A set of IF-THEN rules was formulated based on expert knowledge, linking the input conditions to the corresponding evaluation of each maintenance maturity potential (for each potential 25 rules). For example:
  • Rule P1.1 (sample):
IF MTBF is Very High AND Failure Rate is Very Low, THEN Reliability and Availability potential is High.
To account for rare but high-impact events, additional constraint rules were incorporated in the fuzzy inference structure. These rules capture scenarios where infrequent failures (very high MTBF) may still result in a low reliability or safety evaluation if their potential consequences are severe. For instance, rules such as:
  • Rule P1.2 (sample):
IF MTBF is Very High AND Failure Rate is High THEN Reliability and Availability potential is Medium
The rules were included to prevent overestimation of maturity in systems where low-frequency but high-consequence failures exist. This ensures that the IMMM framework remains sensitive to both the frequency and criticality of maintenance-related events.
Similar fuzzy rules were developed for P2–P5 potentials. As a result, Table 13 summarizes the evaluated Maintenance maturity potentials. The results were calculated using the fuzzy aggregation and defuzzification procedures defined in Section 3.2.2 (Equations (1) and (2)).
The next step is to estimate the system’s maturity dimensions. The approach is similar and also based on fuzzy logic (Figure 1 and Figure 2).
The fuzzified values were processed using a fuzzy inference system (FIS) as in the first step. A set of IF–THEN rules was formulated based on expert knowledge, linking the input conditions to the corresponding evaluation of the maintenance dimension (125 rules for the System dependability dimension). For example:
  • Rule SD.1 (sample):
IF P1: Reliability, Availability is Very low AND P2: Safety, Security is Very low AND P3: Resilience, Recovery is Very Low, THEN System dependability is Very low.
The results for the given case company (based on the estimations given in Table 12) determine the level of System dependability at 0.6875 value Medium level).
The final stage in our model is the determination of System Maintenance Maturity. Similarly to the previous stages, this is based on the Mamdani-type Fuzzy Inference System (FIS). By incorporating three key input variables—System Dependability (SD), System Adaptability (SA), and System Sustainability (SS)—we assess the overall maintenance maturity for the case company (following Figure 6). The inputs are categorized into three fuzzy levels: Low (L), Medium (M), and High (H), and the output, System Maintenance Maturity, is derived using fuzzy logic rules to capture the complex relationships between the inputs and their impact on maintenance maturity. Indeed, there will be 27 rules in total for the fuzzy inference system based on the given inputs and output. For example:
  • Rule IMM.1 (sample):
IF System Dependability is Low AND System Adaptability is Low AND System Sustainability is Low, THEN System Maintenance Maturity is L1—Initial.
The linguistic variables of inputs and output parameters are defined in Table 7, Table 8, Table 9 and Table 10. Following this, the integrated Maintenance Maturity level for the case company is 0.544. Figure 7 presents the adopted rules in the used MATLAB software for the chosen maintenance maturity level assessment. The maturity levels were obtained using the Mamdani-type fuzzy inference model with centroid defuzzification, as described in Equation (2).
To enhance the interpretability and reproducibility of the obtained results, additional explanatory details and a concise numerical summary have been included. Two supplementary indicators were integrated into the IMMM framework to better reflect technological readiness and sustainability-oriented capabilities of the analyzed company: (1) the Technology Adaptation Capability, representing the ability to integrate digital tools and condition monitoring solutions into maintenance processes, and (2) the Energy-Aware Maintenance Level, reflecting the degree of energy optimization achieved during maintenance activities. These parameters were used as auxiliary inputs for evaluating the Flexibility & Agility (P4) and Environmental Impact (P5) potentials, respectively.
Table 14 summarizes the complete IMMM outcomes for the analyzed company, presenting the defuzzified scores for all five maintenance maturity potentials (P1–P5), the additional parameters, the aggregated results for the three system dimensions, and the overall maturity index. This consolidated view facilitates a holistic comparison of maturity performance across the evaluated areas and supports reproducibility of the presented results. All values were obtained using the fuzzy aggregation and defuzzification procedures defined in Section 3.2.2 (Equations (1) and (2)), based on the Mamdani-type FIS approach described earlier.
The obtained results indicate that the analyzed company demonstrates a relatively high level of dependability and satisfactory performance in reliability and safety. However, moderate results in adaptability and sustainability dimensions suggest the need to strengthen flexibility, recovery capacity, and environmental efficiency to achieve a higher maturity level (L4—Predictable). The additional indicators confirm that the company exhibits a medium capability to adopt modern maintenance technologies and a relatively high level of energy-aware practices, both of which contribute positively to future maturity progression.

4.3. Integrated Maintenance Maturity Level Assessment and Definition of Strategic Recommendations for the Case Company

The integrated Maintenance Maturity Level of 0.544 places the organization at the transition between Level 3 (Standardized) and Level 4 (Predictable). This result indicates that while the company has already implemented consistent and formalized maintenance processes, it is now entering a more advanced stage characterized by data-driven, proactive strategies aimed at minimizing unplanned downtime and optimizing performance.
Once the Integrated Maintenance Maturity level has been assessed using the weighted fuzzy evaluation model, the next step is to define targeted improvement strategies to support progression toward higher maturity levels—especially Levels 4 and 5, which reflect advanced, resilient, and sustainable maintenance practices.
Improvement actions should be prioritized according to three key criteria:
  • Areas with the lowest maturity scores;
  • Potentials of strategic relevance (e.g., safety, dependability, sustainability);
  • Organizational availability in terms of resources, infrastructure, and change management capacity.
To support this process, a set of exemplary recommendations is proposed for each maturity potential (e.g., dependability, adaptability, sustainability, digitalization), considering organizational context, desired maturity level, and resource capabilities. These recommendations serve as a structured guide to help organizations select and implement the most impactful improvement pathways. The Table 15 presents strategic recommendations categorized by maturity potential and refined by contextual factors.

4.4. Comparative Analysis of Maintenance Maturity Frameworks and Case Study Evaluation

To strengthen the contextual understanding of the proposed Integrated Maintenance Maturity Model (IMMM), this section presents a comparative analysis of selected maintenance maturity assessment frameworks. The comparison covers three widely recognized approaches, Facility Maintenance Maturity Review (FMMR), Asset Management Maturity Model (AMMM), and the ISO 55000-based maturity structure, followed by an in-depth case study-based comparison between ISO 55000 and IMMM. The purpose is to illustrate how IMMM extends traditional frameworks by introducing resilience, adaptability, and sustainability dimensions supported by fuzzy quantitative reasoning.
Maintenance maturity assessment has evolved significantly over the past three decades, moving from qualitative checklists toward quantitative and data-driven frameworks. The early FMMR (Facility Maintenance Maturity Review), developed in the 1990s, provided a descriptive structure for assessing maintenance organization and planning. It focused on operational practices, workforce management, and process standardization, but relied heavily on subjective judgment and qualitative scoring.
Subsequently, the AMMM (Asset Management Maturity Model) introduced in the early 2000s extended this approach to the asset lifecycle perspective. It emphasized reliability-centered maintenance (RCM), risk management, and strategic alignment between maintenance and corporate objectives. However, AMMM still maintained a semi-qualitative nature, focusing on managerial dimensions rather than measurable operational indicators.
The publication of the ISO 55000 standard series in 2014 marked a major milestone, providing a globally accepted framework for asset management maturity. ISO 55000 focuses on governance, lifecycle planning, risk and compliance management, and continuous improvement. Nevertheless, it remains largely qualitative, using compliance-based audits and gap analyses rather than quantitative indicators.
Finally, the proposed Integrated Maintenance Maturity Model (IMMM) represents a new generation of frameworks that quantitatively assess maintenance maturity under uncertainty. Using fuzzy logic, IMMM integrates five Maintenance Maturity Potentials (P1–P5: Reliability, Safety, Resilience, Flexibility, Sustainability) and three overarching system dimensions (Dependability, Adaptability, Sustainability). The model aligns with Industry 5.0 principles by promoting proactive, data-driven, and human-centric maintenance.
Figure 8 illustrates the evolution and methodological progression of these frameworks.
Table 16 summarizes the main features of these approaches compared with the proposed Integrated Maintenance Maturity Model (IMMM).

4.4.1. Conceptual Alignment of IMMM and ISO 55000

While IMMM integrates features of earlier models, its closest conceptual reference is ISO 55000, as both frameworks pursue systematic asset management improvement. However, ISO 55000 primarily defines what needs to be achieved (policy, governance, risk control), whereas IMMM specifies how to quantify and improve it in practice. IMMM therefore complements ISO 55000 by translating its qualitative principles into measurable indicators through fuzzy inference and expert-based reasoning.
Figure 9 presents the conceptual alignment of IMMM with ISO 55000 domains.
The core ISO 55000 elements, policy, leadership, planning, support, operation, performance evaluation, and improvement, are mapped against the IMMM system dimensions (Dependability, Adaptability, Sustainability). IMMM expands the ISO framework by embedding resilience assessment, operational adaptability, and sustainability metrics, thus enabling continuous monitoring and predictive decision-making.
Typical inputs for ISO 55000-based maturity assessment are given in Table 17.
The evaluation is mostly discrete (ordinal)—maturity levels are assigned (1–5) based on expert judgment or checklists. The process ensures compliance but does not model uncertainty or dynamic relationships among indicators.
Indeed, the proposed Integrated Maintenance Maturity Model (IMMM) builds on ISO 55000’s foundation but extends it in three key directions (Table 18).
Thus, the IMMM operationalizes maintenance maturity as a dynamic system property, rather than a static compliance score. This methodological shift allows continuous improvement and resilience-building under uncertain operational conditions.

4.4.2. Comparative Case Study: IMMM vs. ISO 55000

To highlight the added value of the IMMM approach, a comparative assessment was conducted using the same case company data. The ISO 55000 maturity structure was applied as a reference framework, assessing compliance across six domains: leadership, policy, risk management, planning, operational control, and improvement. Scoring followed a standard five-level maturity scale (L1–L5).
The IMMM used identical input data (MTBF, failure rate, safety events, recovery time, agility, energy efficiency) but integrated them into a fuzzy inference system, generating quantitative maturity scores across five Maintenance Maturity Potentials (P1–P5) (Table 19).
The comparative analysis reveals that the studied company achieves an overall Level 3 (Standardized) maturity according to ISO 55000, consistent with its structured maintenance processes and compliance culture. However, the IMMM provides quantitative differentiation between maturity dimensions and identifies specific improvement areas—most notably in sustainability and safety performance.
The comparative analysis demonstrates that while ISO 55000 provides a robust framework for asset management governance and risk control, it lacks the operational resolution necessary for predictive and adaptive maintenance management. IMMM bridges this gap by integrating quantitative fuzzy evaluation and resilience-based reasoning. The key advantages of IMMM include:
  • Quantitative assessment of maintenance performance and maturity potentials;
  • Explicit inclusion of resilience, adaptability, and sustainability as measurable dimensions;
  • Integration capability with CMMS, IoT, and digital twin systems for continuous maturity tracking;
  • Compatibility with ISO 55000 governance principles, enabling dual implementation.
From a practical perspective, the IMMM allows companies to complement ISO 55000 audits with continuous quantitative feedback, thereby transforming compliance-oriented maturity assessment into a proactive, data-driven process aligned with Industry 5.0 standards.

5. Results and Discussion

The presented case study enables the analysis of how the developed fuzzy-based evaluation method can be applied to assess the maintenance maturity level within an organization. This approach incorporates linguistic expert knowledge and engineering judgment, providing a more realistic and granular assessment of the System’s Maintenance maturity compared to rigid, deterministic models (e.g., those based on checklists or binary scores). The complete results of the fuzzy inference system (FIS) for maintenance maturity assessment are shown in Figure 10 and Figure 11.
These 3D plots present the resultant values of maintenance maturity parameters, particularly focusing on the relationships between System Dependability, System Adaptability, and Maintenance Maturity. In contrast to models based on rigid, deterministic assessments that provide only discrete results (e.g., 3.0 or 4.0), these 3D plots visually demonstrate the fundamental methodological advantage of the IMMM. The surfaces show how complex, nuanced changes in input variables (Dependability, Adaptability, Sustainability) translate into a highly precise, continuous maturity score. This fine-grained accuracy, unattainable in traditional maturity frameworks, is critical for managers to accurately track incremental improvements and justify investments.
In the first plot (Figure 10), System Dependability and System Sustainability are compared with the overall maintenance maturity level. The plot illustrates that higher levels of dependability and sustainability correlate with higher maturity scores. The dark blue regions of the plot represent low maintenance maturity levels, typically resulting from insufficient system reliability or sustainability practices. The yellow regions, indicating high maturity levels, show the ideal scenario where both dependability and sustainability are well-integrated into the maintenance processes. The presented surface corresponds to the output of the Mamdani-type fuzzy inference system described in Section 3.2.2, calculated according to the fuzzy aggregation and defuzzification procedures (Equations (1) and (2)).
In the second plot (Figure 11), the relationship between System Adaptability and System Dependability with Maintenance Maturity is depicted. This plot reveals that higher adaptability combined with strong dependability leads to an increase in overall maturity. The low maturity zones in this plot are associated with limited system flexibility and slow response times, leading to lower adaptability in maintenance operations. Conversely, the high maturity regions reflect a mature organization with adaptable systems that are also dependable, demonstrating proactive approaches to operational challenges. The surface visualization was generated using the same fuzzy inference rules and computational scheme (Equations (1) and (2)) applied for estimating the integrated maintenance maturity level.
These plots provide a quantified basis for decision-making regarding the progression of maintenance maturity. They enable managers to observe how various dimensions (dependability, adaptability, sustainability) interact with maintenance practices, thus facilitating the identification of areas that require improvement. The plots also help prioritize actions for enhancing the maturity levels in the most critical areas, such as improving system adaptability or enhancing dependability and sustainability through targeted strategies.
In addition, the inclusion of Technology Adoption Capability and Energy-Aware Maintenance Level proved particularly relevant in the analyzed case study. The fuzzy evaluation indicated that limited technological adaptability constrained the organization’s ability to achieve higher maturity levels in the adaptability dimension. Conversely, the relatively strong energy-awareness performance enhanced the sustainability dimension, highlighting how digital readiness and energy-conscious practices jointly shape the overall maturity profile. These findings confirm that the two new parameters enrich the diagnostic capability of the IMMM, linking maintenance maturity more explicitly with the principles of Industry 5.0 and sustainable operational management.
For the case organization, the overall calculated maintenance maturity level is approximately 0.544 (L3/L4). This precise, non-integer score (a key output advantage of the fuzzy methodology) places the organization between Level 3 (Standardized) and Level 4 (Predictable). This result indicates that while the organization has formalized and standardized many of its maintenance processes, there is still significant room for improvement, particularly in areas related to adaptability, dependability, and sustainability.

5.1. IMMM Integration Roadmap and Enterprise System Alignment

Based on the obtained maturity profile, the IMMM results can also serve as an implementation roadmap for gradual digital integration. The proposed roadmap includes three progressive stages that guide the practical embedding of IMMM into enterprise systems:
  • Phase 1—Assessment and Configuration: Fuzzy inputs and rule bases are defined using available CMMS or ERP maintenance data together with expert evaluations. This step enables the identification of maturity gaps and the establishment of baseline indicators.
  • Phase 2—Integration: IMMM outputs are connected to existing enterprise dashboards or digital twins, enabling real-time visualization of maturity indicators alongside performance metrics such as downtime, MTBF, and energy use. Integration can be achieved using standard data protocols (e.g., OPC UA).
  • Phase 3—Continuous Monitoring and Learning: The IMMM is linked to IoT-enabled monitoring systems that update fuzzy inputs dynamically as new operational data become available. This phase supports adaptive maintenance management and continuous improvement under uncertainty.
This roadmap ensures that the IMMM is not limited to a one-time diagnostic tool but can evolve into a continuously learning system integrated with the organization’s digital maintenance infrastructure. Such integration facilitates proactive decision-making and supports the transition toward data-driven, resilient, and sustainable maintenance systems aligned with Industry 5.0 principles.
While the proposed integration roadmap outlines the conceptual flow from assessment to continuous learning, its real-world implementation requires overcoming several technical and organizational barriers. In practice, data heterogeneity, legacy CMMS or ERP infrastructures, and the absence of standardized data formats may lead to data silos and limited interoperability between systems. The lack of harmonized communication protocols and incompatible data models often prevents smooth information exchange across maintenance, production, and energy-management platforms. Ensuring consistency between IMMM inputs and enterprise data therefore requires data standardization procedures, middleware interfaces, and validation layers that translate heterogeneous data into a common semantic framework.
Another critical aspect concerns human and organizational factors. Maintenance and production staff often have limited digital literacy or experience with AI-based decision-support systems, leading to a steep learning curve during digital integration. Personnel training, gradual familiarization with fuzzy-based dashboards, and participatory implementation approaches can significantly improve adoption and trust in the IMMM framework.
To address these challenges, a phased implementation strategy is recommended. During the initial phase, the IMMM can be deployed as a stand-alone analytical layer that uses offline data exported from CMMS or ERP systems. In the second phase, standardized data interfaces, such as OPC UA, ISO 13374, or RESTful APIs, can be progressively configured to enable semi-automatic synchronization. The final phase should focus on real-time data integration through IoT and condition monitoring systems, supported by automated data validation and user training sessions. This stepwise approach minimizes integration risks, reduces initial costs, and allows gradual development of the organization’s digital competence.
The roadmap illustrates the progressive integration path of the IMMM into enterprise digital environments. Each phase specifies the main data sources, enabling technologies, expected milestones, and potential barriers with mitigation measures. The transition from expert-based assessment to IoT-enabled, self-learning maturity evaluation supports realistic implementation in heterogeneous industrial contexts and reduces risks associated with full-scale digital transformation (Figure 12).
Several technical and organizational barriers must be addressed before full integration can be achieved. Technically, heterogeneous data formats, legacy systems, and limited automation readiness often hinder smooth interoperability. On the organizational side, challenges include limited digital literacy among maintenance staff, low data quality assurance, and cultural resistance to adopting automated decision-support tools.
Overcoming these barriers requires phased digital transformation, supported by employee training, data governance frameworks, and clear change management policies.
To further enhance practical applicability, the integration roadmap can be operationalized through a modular implementation approach. In the first stage, the IMMM fuzzy inference engine can be deployed as an independent decision-support layer connected to CMMS databases through APIs, allowing the automatic extraction of maintenance indicators such as MTTR, MTBF, and energy usage. In the second stage, real-time data streams from IoT sensors or condition monitoring systems can feed directly into the fuzzy inference module, updating maturity indicators dynamically. Finally, coupling the IMMM with a digital twin of the maintenance system would enable scenario-based simulation and predictive analysis of maturity evolution under various operational or environmental conditions.
Organizationally, such integration requires establishing data governance protocols, defining clear ownership of maturity indicators, and developing competence in data-driven maintenance decision-making. Pilot implementation within selected production lines can serve as a testbed for refining the interoperability architecture and assessing user acceptance. These steps would transform the IMMM from a diagnostic framework into an interactive, continuously learning system supporting adaptive maintenance management.
To sum up, to further enhance of the practical applicability of the IMMM integration roadmap, Table 20 summarizes the main technical and organizational barriers identified during the analysis, along with representative examples and mitigation actions. The proposed measures are intended to support practitioners in planning a stepwise and realistic implementation of the IMMM framework in heterogeneous enterprise environments.
By explicitly addressing these implementation barriers and introducing a phased deployment strategy, the IMMM integration roadmap becomes more realistic and adaptable to heterogeneous industrial environments. This practical perspective enhances the applicability of the model as both a strategic and operational enabler of digital maintenance transformation. Furthermore, the combination of the schematic roadmap (Figure 12) and the structured barrier analysis (Table 20) provides a holistic view of the technical, organizational, and human dimensions influencing successful IMMM implementation.

5.2. Generalizability and Cross-Sectoral Applicability

The findings from the case study, while derived from a large organization in the automotive sector, are not inherently industry-specific. Generalizability is ensured by focusing on maintenance potentials (P1–P5) that represent universal organizational capabilities rather than specific technical processes.
  • Universal Potentials: The five potentials (Reliability, Safety, Resilience, Flexibility, Sustainability) are strategic, top-level objectives essential to any asset-intensive industry (e.g., Energy, Logistics, Mining, and Manufacturing). For example, Resilience (P3) is equally critical for a power plant facing grid instability as it is for an automotive plant facing supply chain shocks.
  • Flexible Implementation: The IMMM is agnostic to the underlying technical metrics (KPIs) used for data input. While a pharmaceutical plant might prioritize regulatory compliance data (feeding P2 and P5), a mining operation might prioritize machine utilization and hazard reporting (feeding P1 and P2). The fuzzy inference engine remains valid as long as the inputs accurately map to the linguistic variables (Low, Medium, High), regardless of the input data source (CMMS, MES, or expert opinion).
Despite the focus on a single automotive enterprise, the IMMM is conceptually applicable across diverse industrial sectors due to its reliance on universal maintenance potentials (Reliability, Safety, Resilience, Flexibility, Sustainability). The fuzzy inference mechanism allows adaptation to different input metrics, which can be sourced from various operational data (CMMS, MES) or structured expert evaluations, ensuring that the model can be extended to SMEs and other industries while maintaining its diagnostic and predictive capabilities.
Therefore, the IMMM serves as a cross-sectoral strategic diagnostic tool. Its results provide insights into how an organization manages uncertainty and sustainability, which are universally applicable concerns in modern industrial systems, making the model valuable beyond the direct context of the case study.
The practical limitations and methodological constraints associated with expert input, data availability, and integration with enterprise systems are summarized in Section 5.5.

5.3. Model Scalability and Scaling Challenges

The scalability of the IMMM has been checked and is inherently supported by the Fuzzy Logic methodology, allowing it to be effectively applied across companies of vastly different sizes and data maturity levels.
Scaling Down (Application in SMEs/Less Data-Rich Environments):
  • Mechanism: When scaling down, the model relies on its core strength: expert-driven linguistic input. This flexibility directly addresses the problem of data scarcity, making the model highly practical for SMEs.
  • Potential Problem: The main challenge when scaling down is the subjectivity bias of expert input. If the maintenance manager’s judgment is overly optimistic or lacks critical objectivity, the maturity score may be inflated.
  • Mitigation: This is mitigated by the structured multidimensionality of the IMMM and its clear rule base, which forces experts to assess distinct potentials based on defined criteria, increasing accountability and transparency compared to single-dimensional checklist models.
Scaling Up (Application in Large, Data-Rich Corporations):
  • Mechanism: When scaling up to large corporations (like the one in the case study), the model seamlessly integrates with Big Data streams from CMMS/EAM systems. Fuzzification simply becomes the process of converting complex, precise KPIs (e.g., MTBF = 450 h) into the required linguistic variables (High).
  • Potential Problem: The primary challenge is computational complexity and system integration overhead. As the number of input variables and the size of the rule base grow (to account for increasing complexity at Maturity Levels 4 and 5), the computational load of the fuzzy inference system increases.
  • Mitigation: This is managed by implementing the IMMM fuzzy core as a dedicated, decoupled software layer (as detailed in Section 5.2) that operates independently from legacy ERP/CMMS systems, ensuring that performance bottlenecks are isolated and minimized. Furthermore, the hierarchical structure of the IMMM limits the exponential growth of the rule base by grouping lower-level indicators under five main potentials, ensuring computational efficiency.
For a concise discussion of methodological limitations and cross-sectoral applicability, see Section 5.5.

5.4. Prescriptive Findings and Strategic Guidance

Based on the results of the fuzzy evaluation, several key insights were identified:
  • The organization has achieved a moderate level of dependability and sustainability, but its adaptability is somewhat lacking, suggesting that further work is needed in integrating adaptive systems and processes.
  • There is a need for more robust predictive maintenance strategies to ensure better forecasting of disruptions and to develop proactive measures to mitigate their impact.
  • The current maintenance practices could be enhanced by focusing more on sustainability and environmental impact, which could further increase the overall system resilience.
As a result, we may define the recommendations for the investigated organization:
  • Strengthen adaptability: Implement systems that enhance the organization’s ability to adapt to changing conditions and disruptions. This could include improving response times to changes in operational conditions and investing in flexible maintenance processes.
  • Focus on sustainability: Integrate more sustainable practices into maintenance activities, such as reducing energy consumption, minimizing waste, and increasing resource efficiency.
  • Develop predictive maintenance capabilities: Enhance forecasting and predictive maintenance capabilities to improve readiness for potential failures and reduce unplanned downtime.
  • Improve system dependability: Further develop the organization’s maintenance practices to improve reliability and uptime. This can be achieved by enhancing preventive maintenance strategies and ensuring that spare parts and resources are available when needed.
These recommendations should guide the organization toward higher maintenance maturity levels (L4 and L5), ensuring a more resilient, adaptable, and sustainable maintenance system in the future.
Additionally, the following findings and recommendations are not generic advice, but are direct, prescriptive outputs of the fuzzy evaluation, which constitutes a key advantage of the IMMM over traditional, purely diagnostic models.
Detailed discussions on methodological limitations, potential bias, data requirements, and integration challenges are presented in Section 5.5.

5.5. Methodological Limitations and Applicability

The IMMM provides a robust and flexible framework for assessing maintenance maturity, yet several methodological limitations and practical considerations should be acknowledged. First, the model relies on expert-based inputs and fuzzy rule construction, which allows operation in data-scarce environments such as SMEs but introduces potential subjectivity bias. Individual experts may overestimate or underestimate certain capabilities, which can affect the calculated maturity score. Mitigation strategies include the use of multi-expert aggregation methods, structured interviews, and iterative consensus-building to improve reliability and reduce individual bias.
The second key limitation of the IMMM is its dependence on the availability of sufficient data for the selected input variables. In large, data-rich organizations, detailed CMMS or IoT data can be used, but in SMEs or organizations at initial maturity stages, such data may be sparse or imprecise. The fuzzy logic framework partially addresses this issue by transforming qualitative expert judgments into quantitative scores, but model accuracy may still be influenced by the quality and completeness of the input.
Another limitation concerns the assessment of the sustainability (P5) potential. While the model currently captures energy and emissions-related metrics, it does not fully address the entire equipment life cycle, including procurement, decommissioning, and remanufacturing. The absence of operational data from the case study organization limits the possibility to implement full life-cycle indicators at this stage. Future research should integrate LCA-based or circular economy indicators to provide a more comprehensive sustainability evaluation within the IMMM framework.
Next, scalability in large organizations can pose computational challenges due to the increasing size of the rule base. Without proper hierarchical structuring, the system could become inefficient and slow in generating real-time outputs. This challenge is addressed in the IMMM by grouping lower-level indicators under the five strategic potentials (P1–P5), which limits exponential growth and ensures computational efficiency.
Fifth, integration with enterprise systems (CMMS, ERP, IoT platforms) may be constrained by heterogeneous data formats, legacy infrastructure, and organizational barriers such as low digital literacy or resistance to procedural change. Achieving real-time maturity monitoring requires standardized data exchange protocols such as OPC UA or ISO 13374. Organizational barriers, including low digital literacy and resistance to change, can further hinder smooth integration. These challenges must be addressed through phased digital transformation, training, and clear change management policies.
Sixth, although the IMMM was applied in the automotive sector, its design is based on universal maintenance potentials, i.e., Reliability, Safety, Resilience, Flexibility, and Sustainability, supporting cross-sector applicability. However, the empirical validation in this study is limited to a single large automotive enterprise, which may not fully capture variability across different industries or organizational scales. Differences in KPI priorities, regulatory requirements, and operational practices across sectors may require adaptation of input variables and rule weighting. The model remains flexible, but careful alignment with each sector’s operational context is recommended for reliable results, and future multi-case studies across industries and SMEs are needed to empirically confirm its broader applicability.
Seventh, in SMEs, the model must operate primarily on linguistic inputs and structured expert judgments due to limited sensor data and CMMS coverage. While the fuzzy approach allows effective assessment under these conditions, it is inherently more sensitive to expert judgment quality. Mitigation includes structured protocols for expert input, simplified indicator sets for initial assessments, and iterative refinement as more operational data become available.
Finally, while the current implementation relies on expert-based fuzzy reasoning, it is recognized that incorporating historical operational data, IoT sensor measurements, or machine learning techniques could improve calibration and reduce subjectivity. Such hybrid approaches represent a promising direction for future research, although the present expert-based assessment provides a robust and practical evaluation of maintenance maturity in SMEs and data-limited contexts.
Overall, the IMMM provides a practical, flexible, and scalable tool for maintenance maturity assessment, balancing methodological rigor with real-world applicability. The highlighted limitations do not preclude its use but indicate areas where caution, adaptation, or future enhancement is necessary. By explicitly recognizing these constraints, the model can support informed decision-making while remaining robust across diverse industrial environments.
To sum up, it should also be noted that the current case study focused exclusively on a large, data-rich automotive organization. While the IMMM is conceptually applicable to other industrial sectors and SMEs, empirical verification in these contexts is necessary. Future research should include multi-industry and multi-size organizational case studies to validate the model’s effectiveness, scalability, and robustness under diverse operational conditions.

6. Conclusions and Future Research Directions

This study presents the fuzzy logic-based Integrated Maintenance Maturity Model, which combines resilience and sustainability principles to assess maintenance maturity. The model offers a structured, flexible framework that supports organizations in evaluating and enhancing their maintenance strategies across five key maturity potentials. The integration of fuzzy logic allows for the processing of expert judgment under uncertainty, providing a more nuanced and robust assessment than conventional binary or deterministic methods. The IMMM implementation roadmap proposed in this study supports gradual integration with enterprise maintenance systems (CMMS, ERP, IoT) and enables real-time maturity monitoring as part of the digital transformation process toward Industry 5.0.
The case study results demonstrate that the dual focus on resilience and sustainability significantly enhances maintenance decision-making, particularly under conditions of uncertainty or operational stress. Resilience-related indicators help identify vulnerabilities in response and recovery capacities, while sustainability criteria ensure that environmental, social, and economic dimensions are systematically addressed. It should be noted that the current assessment of the sustainability potential (P5) primarily considers energy consumption and carbon emissions, due to limited access to detailed operational data from the company. A full life-cycle perspective, including procurement, decommissioning, and remanufacturing, was not feasible in this study. Future research should incorporate life-cycle assessment (LCA) metrics or circular economy indicators, such as remanufacturing rates and material recovery rates, to provide a more comprehensive evaluation of sustainability performance across the entire equipment lifecycle. This holistic approach will enable more adaptive, responsible, and forward-looking maintenance practices.
In contrast to traditional maturity models that emphasize linear growth in technical capabilities, the proposed model incorporates the strategic complexity of modern industrial environments. The inclusion of resilience and sustainability provides added value through long-term risk mitigation and resource optimization and aligns maintenance practices with broader organizational goals, such as ESG compliance and operational continuity. The fuzzy logic mechanism further enhances interpretability and flexibility, accommodating the imprecision inherent in expert-based assessments.
From a strategic standpoint, the proposed IMM model guides organizations toward more proactive and balanced maintenance strategies. Recommendations are tailored to maturity level gaps across five key potentials and consider internal capacities and external challenges. The model encourages organizations to invest in predictive and condition-based maintenance, enhance employee competencies, and adopt circular economy practices, especially as they progress toward higher maturity levels.
While the case study focused on a large, data-rich organization in the automotive sector, the scalability of the IMMM is one of its core strengths. The applicability of the IMMM to other industrial sectors or small- and medium-sized enterprises (SMEs) remains to be confirmed. Future research should focus on multi-case studies across different industries and organizational scales to empirically test and refine the model, ensuring its robustness and practical utility beyond the automotive context. For SMEs, the model can be tailored in two key ways:
  • Indicator reduction: SMEs can initially prioritize the fundamental dimensions, such as P1: Reliability/Availability and P2: Safety/Compliance, while temporarily excluding advanced indicators related to complex Predictive Analytics (Level 4/5) until their underlying processes mature. The fuzzy structure remains functional even with a reduced set of critical inputs.
  • Expert-driven data collection: In a data-scarce environment, all input variables can be sourced entirely from structured interviews with a limited number of subject matter experts (SMEs), rather than relying on automated data streams. This eliminates the heavy investment required for IoT sensors or full-scale CMMS implementation, providing a low-cost, high-value diagnostic tool for small businesses to start their maintenance improvement journey.
Despite its strengths, the proposed model has limitations discussed in detail in Section 5.5. One limitation of the present approach is its reliance on expert-based fuzzy rule construction, which may introduce subjectivity. However, the application of a multi-expert aggregation method and iterative consensus-building helped to mitigate potential bias. Future extensions could incorporate historical operational data, sensor measurements, or machine learning methods (e.g., ANFIS) to calibrate fuzzy membership functions and rule weights, enhancing objectivity and reducing potential deviations. Future research should focus on hybridizing expert-based and data-driven inference, for example, by integrating historical condition monitoring, CMMS, or sensor data and adaptive learning methods to validate and refine fuzzy rule structures. This hybrid approach would further improve the model’s predictive capability while maintaining expert-guided assessments. Indeed, future work will aim to validate and refine the IMMM using data-driven benchmarks. Combining expert-based fuzzy reasoning with machine learning-supported parameter tuning (e.g., ANFIS, genetic algorithms, or Bayesian calibration) will reduce subjective bias and improve generalization. This hybrid approach would allow the IMMM to evolve into an adaptive decision-support system capable of continuous learning from historical maintenance and sensor data.
Another issue is to automate these elements and validate the model across diverse industrial sectors. In particular, combining expert input with historical and sensor-based data would allow for adaptive calibration of fuzzy rules, reducing subjectivity and improving repeatability across contexts. Empirical testing with broader datasets would further solidify its reliability and generalizability. Such hybridization would enhance the model’s reliability and replicability across different industrial contexts.
Additionally, to validate the model’s inherent adaptability, future research will focus on a multi-case study application of the IMMM within the SME sector. This will involve empirically testing the hypothesis that the Fuzzy Logic framework is a sufficiently robust and practical methodology for assessing and improving maintenance maturity in data-scarce environments where reliance on expert knowledge outweighs the availability of Big Data analytics.
From an implementation perspective, the integration of IMMM with CMMS, ERP, and IoT platforms is technically feasible but requires addressing several key challenges. Real-time maturity monitoring demands interoperability between heterogeneous data sources and the fuzzy inference engine, achievable through standardized data exchange formats such as OPC UA or ISO 13374. However, technical barriers, including legacy systems, inconsistent data quality, and limited automation readiness, may constrain seamless integration. Organizationally, adoption can be slowed by low digital literacy, inadequate data governance, and resistance to procedural changes. Overcoming these obstacles requires a phased digital transformation strategy supported by employee training, data standardization, and gradual automation. Addressing these barriers will enable IMMM to function as a core element of an intelligent maintenance ecosystem, providing continuous feedback and supporting human–machine collaboration consistent with Industry 5.0 principles.
In practical terms, the IMMM provides industries with a comprehensive tool to evaluate and evolve their maintenance functions in alignment with the demands of resilient and sustainable production systems. It fosters a shift from reactive maintenance practices toward strategic, knowledge-driven approaches that support operational excellence.
Future development of the model should therefore focus not only on hybridizing fuzzy and data-driven learning but also on deepening integration with digital enterprise systems. In addition, conducting multi-industry and SME-focused case studies will strengthen the model’s generalizability and provide empirical evidence for its cross-sector applicability. This will allow the IMMM to offer validated guidance for organizations of varying sizes and operational contexts, enhancing confidence in its deployment as a strategic maintenance assessment tool.

Author Contributions

Conceptualization, L.B. and S.W.-W.; methodology, L.B. and S.W.-W.; formal analysis, L.B. and S.W.-W.; resources, S.W.-W.; data curation, S.W.-W.; writing—original draft preparation, L.B. and S.W.-W.; writing—review and editing, L.B. and S.W.-W.; visualization, L.B. and S.W.-W.; supervision, L.B. All authors have read and agreed to the published version of the manuscript.

Funding

This research received no external funding.

Institutional Review Board Statement

Not applicable.

Informed Consent Statement

Not applicable.

Data Availability Statement

Data is contained within the article where the original contributions presented in this study are included. Further inquiries can be directed to the corresponding author.

Acknowledgments

The authors would like to thank the reviewers for their insightful comments.

Conflicts of Interest

The authors declare no conflicts of interest.

Abbreviations

The following abbreviations are used in this manuscript:
AHPAnalytic Hierarchy Process
AIArtificial Intelligence
AMMMAsset Maintenance Maturity Model
ANFISAdaptive Neuro-Fuzzy Inference Systems
ANPAnalytic Network Process
APIApplication Programming Interface
BWMthe Best-Worst Method
CBMCondition-based Maintenance
CMMSComputerized Maintenance Management System
CSRCorporate Social Responsibility
DEMATELDEcision-Making Trial and EVALuation Lab
EAMEnterprise Asset Management
EAMLEnergy-Aware Maintenance level
ERPEnterprise Resource Planning
ESGEnvironmental, Social, and Governance
FISFuzzy Interference System
FMEAFailure Mode and Effect Analysis
FMMRFuzzy Maintenance Maturity Rating
HMIHuman–Machine Interface
IMMMIntegrated Maintenance Maturity Model
IoTInternet of Things
ITInformation Technology
KPIsKey Performance Indicators
LCALife Cycle Assessment
MADMean Absolute Deviation
MESManufacturing Execution System
MFsMembership functions
MLMachine Learning
MMMsMaintenance Maturity Models
M-SCORMaintenance Supply Chain Operations Reference
MTBFMean Time Between Failures
MTTRMean Time To Recovery
OPC UAOpen Platform Communications Unified Architecture
PCAPrincipal Component Analysis
PMPreventive Maintenance
PROMETHEEPreferences Ranking Organisation Method for Enrichment Evaluation
RCARoot Cause Analysis
RCMReliability-Centered Maintenance
RESTfulREpresentational State Transfer
RTORecovery Time Objective
SMEsSmall and Medium Enterprises
TACTechnology Adoption Capability
TFNsTriangular Fuzzy Numbers
TOPSISTechnique for Order Preference by Similarity to an Ideal Solution
TPMTotal Productive Maintenance
TRIRTotal Recordable Incident Rate

Appendix A

Appendix A.1. AHP-Based Prioritization of Measurement Indicators for P1: Reliability and Availability

To enable a structured and objective selection of the most relevant measurement indicators for evaluating P1—Reliability, Availability, the Analytic Hierarchy Process (AHP) was applied. This analysis aimed to prioritize the indicators based on their strategic relevance, feasibility of measurement, and impact on reliability-driven maintenance decisions.
  • Step 1: Hierarchical Structure Definition
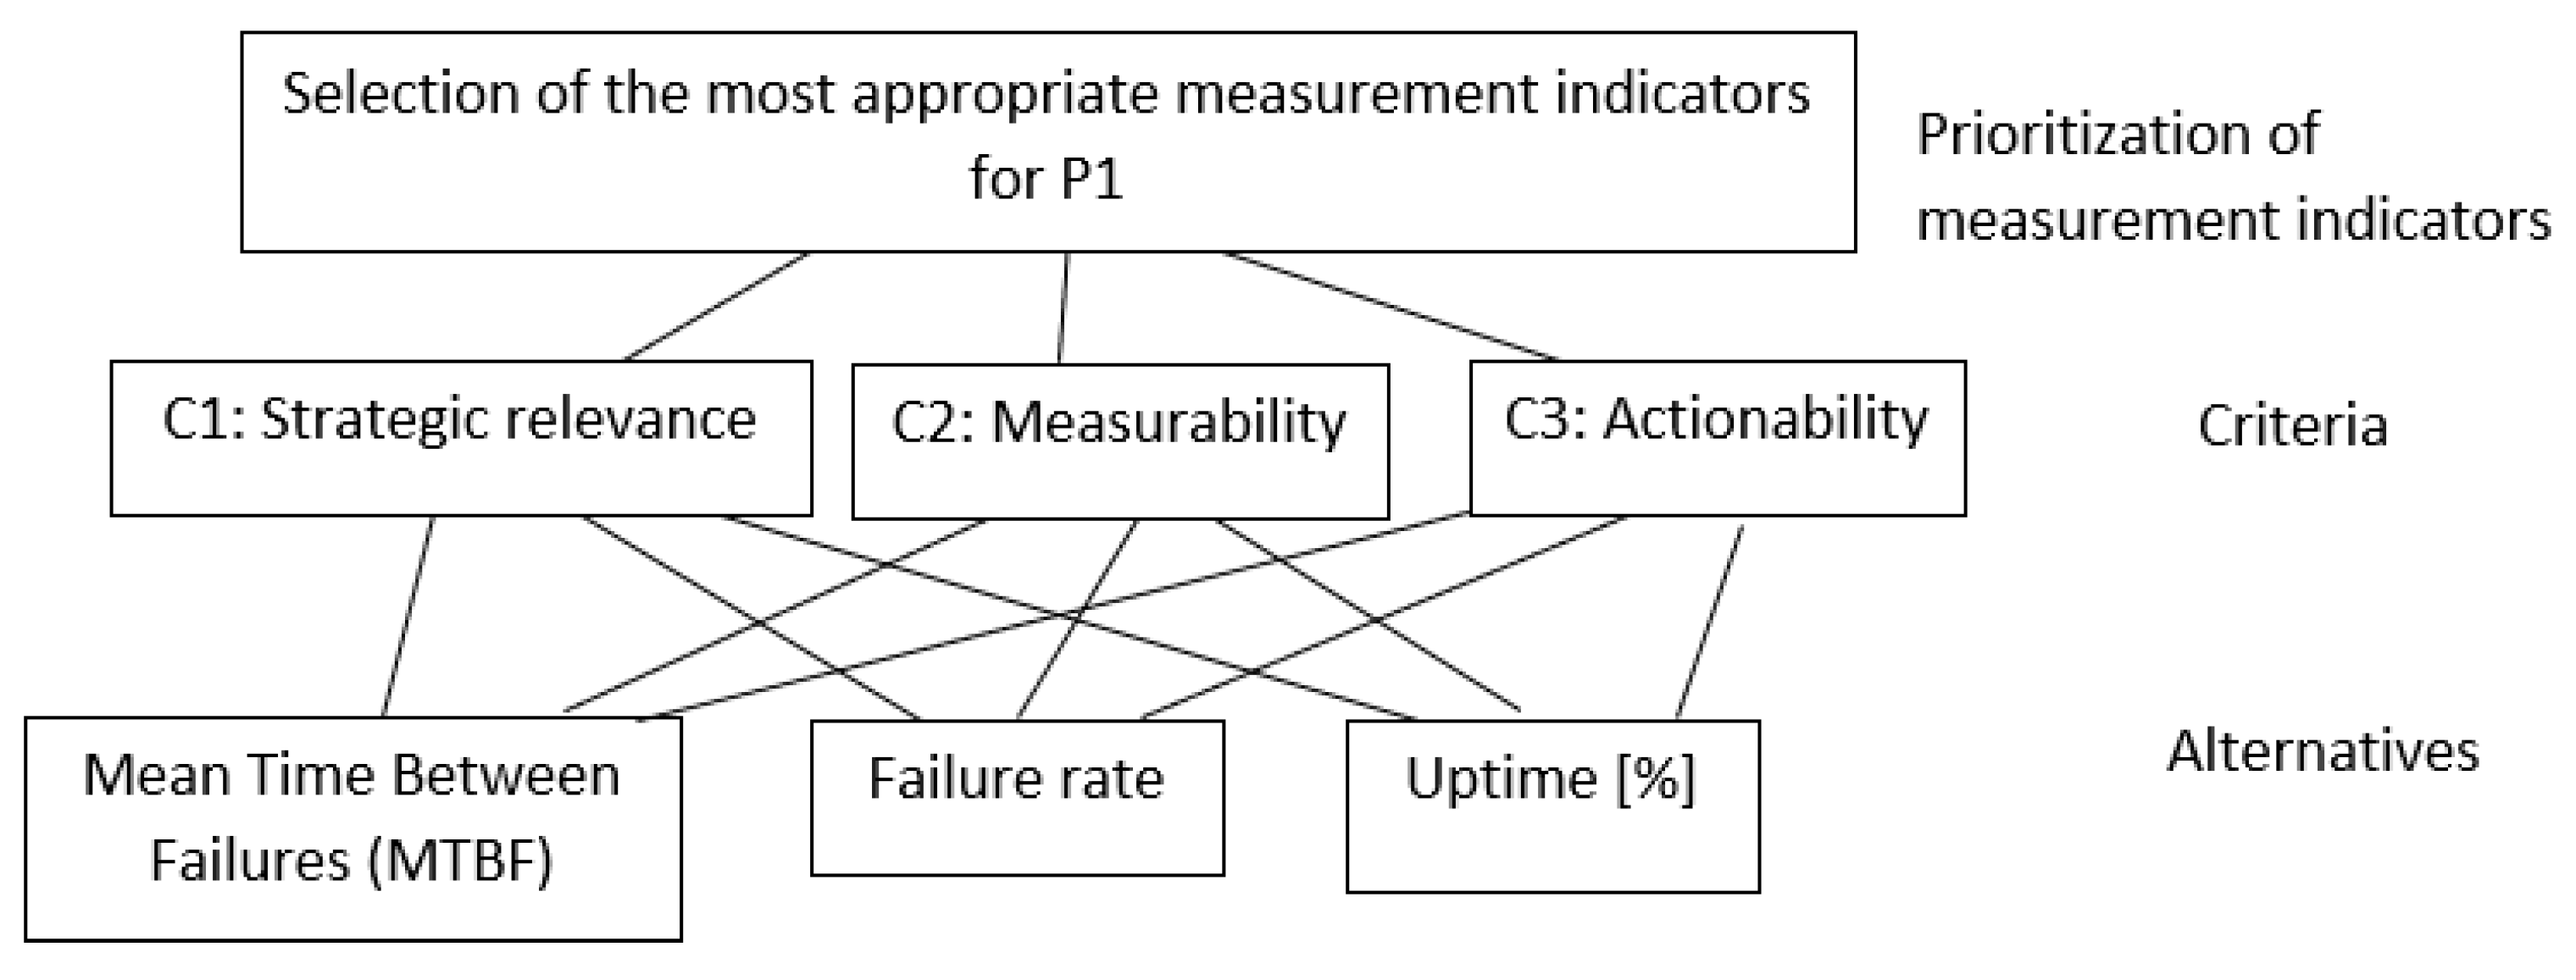
The decision problem was decomposed into a hierarchical model with three levels (Figure A1).
Figure A1. Problem statement for AHP method.
Applsci 15 12236 g0a1
  • Step 2: Pairwise Comparisons and Judgement Matrices
Expert input was collected through a structured survey using Saaty’s fundamental scale (1–9). Below is the pairwise comparison matrix for the criteria:
C1C2C3
C1123
C21/212
C31/31/21
Calculated criteria weights:
  • C1 (Strategic relevance): 0.54
  • C2 (Measurability): 0.29
  • C3 (Actionability): 0.17
Pairwise comparison under C1 (Strategic relevance):
I1I2I3
I1123
I21/212
I31/31/21
Local priorities under each criterion:
  • Under C1: I1: 0.54, I2: 0.29, I3: 0.17
  • Under C2: I1: 0.30, I2: 0.50, I3: 0.20
  • Under C3: I1: 0.40, I2: 0.30, I3: 0.30
  • Step 3: Synthesis of Priorities
Global priority scores:
  • I1 (MTBF): 0.4716
  • I2 (Failure rate): 0.3511
  • I3 (Uptime [%]): 0.1773
  • Step 4: Consistency Check
The consistency ratio (CR) was computed for each matrix and found below 0.10, indicating acceptable judgment consistency.
  • Step 5: Result Interpretation
The analysis reveals the following priority order:
  • MTBF (Mean Time Between Failures)—most relevant indicator due to its strategic alignment and strong predictive capability in reliability assessment
  • Failure rate—valuable for short-term monitoring and reactive decision-making
  • Uptime [%]—useful as a general performance indicator but less actionable and specific for reliability engineering.
The results guide the indicator selection for fuzzy modeling and future performance benchmarking in the P1 domain, ensuring that evaluation efforts are focused on the most impactful metrics.

Appendix A.2. Linguistic Variables for Maintenance Maturity Potentials P2–P5 and Two Input Variables: Technology Adaptability and Resource Efficiency

Table A1. Linguistic variables for P2: Safety, Security.
Linguistic TermDescriptionRange of Fuzzy Membership Function
Very Low (VL)System exhibits poor safety and security performance. Frequent safety incidents and very low compliance with safety standards.[0, 0, 0.4, 0.6]
Low (L)System has below-average safety and security performance. Noticeable safety events occur, and compliance is insufficient.[0.4, 0.6, 0.7, 0.8]
Medium (M)System shows moderate safety and security performance. Some incidents occur, but basic compliance is maintained.[0.6, 0.75, 0.85, 0.9]
High (H)System is mostly safe and secure with rare events. Compliance is high, and safety culture is effective.[0.8, 0.9, 0.95, 0.98]
Very High (VH)System achieves excellent safety and security. Virtually no incidents; compliance is near-perfect or perfect.[0.95, 0.98, 1.0, 1.0]
Table A2. Linguistic variables for inputs for the P2: Safety, Security.
Number of Safety Events
Linguistic TermDescriptionRange of Fuzzy Membership Function
Very High (VH)The number of safety events is extremely high. The system is unsafe, with frequent accidents, near misses, or violations, indicating severe safety management deficiencies.[20, 25, 30, 30]
High (H)The number of safety events is above acceptable levels, suggesting elevated risk. There are recurring safety incidents, requiring urgent attention.[15, 18, 22, 26]
Medium (M)A moderate number of events occur. Some incidents happen, but they are not severe or systemic. Safety practices are partially effective.[8, 12, 15, 18]
Low (L)Few safety events occur. The system generally performs safely, with only minor, isolated cases.[3, 5, 8, 12]
Very Low (VL)The number of safety events is negligible or zero. The system is highly safe, with proactive safety culture and strong incident prevention.[0, 0, 2, 4]
Safety Compliance Rate (%)
Linguistic TermDescriptionRange of Fuzzy Membership Function
Very Low (VL)Compliance with safety standards is critically low (<40%). The system neglects essential safety protocols, and non-conformities are common.[0, 0, 30, 40]
Low (L)The system meets some safety requirements but still shows significant gaps. Compliance is insufficient for safe operations.[30, 45, 55, 65]
Medium (M)The system shows average compliance (~60–80%). Most safety regulations are followed, but occasional lapses or documentation issues persist.[60, 70, 80, 90]
High (H)The system generally complies with safety rules (>80%), and audits confirm adherence, with only minor corrective actions needed.[80, 90, 95, 98]
Very High (VH)Compliance is near perfect (≥95%). All safety protocols are well documented, implemented, and verified. Audits show full conformance.[95, 98, 100, 100]
Table A3. Linguistic variables for P3: Resilience, Recovery.
Linguistic TermDescriptionRange of Fuzzy Membership Function
Very Low (VL)System has extremely poor resilience and recovery capabilities. Failures cause prolonged downtime and critical disruptions.[0, 0, 0.2, 0.4]
Low (L)System shows below-average resilience. Recovery after failure is slow and resource-intensive.[0.2, 0.4, 0.5, 0.6]
Medium (M)System demonstrates moderate resilience. Some failures cause moderate downtime, but recovery processes exist.[0.4, 0.5, 0.7, 0.8]
High (H)System is resilient, with quick and effective recovery from failures.[0.6, 0.7, 0.85, 0.95]
Very High (VH)System has excellent resilience. Failures have minimal impact, and recovery is almost immediate.[0.85, 0.95, 1.0, 1.0]
Table A4. Linguistic variables for inputs for the P3: Resilience, Recovery.
Mean Time to Recovery (MTTR)
Linguistic TermDescriptionRange of Fuzzy Membership Function
Very High (VH)Recovery is extremely slow. The system takes a very long time to resume operation after a failure, indicating poor recovery capacity and low resilience.[16, 20, 30, 30]
High (H)Recovery is slow. Although the system eventually resumes operations, the delays are significant and impact availability.[10, 14, 18, 22]
Medium (M)Recovery time is moderate. The system shows acceptable ability to bounce back, though there may be room for improvement.[5, 8, 12, 16]
Low (L)Recovery is fast. The system resumes operation relatively quickly, minimizing downtime and maintaining workflow.[2, 4, 6, 10]
Very Low (VL)Recovery is immediate or near-immediate. The system demonstrates excellent resilience and quick restoration of function.[0, 0, 2, 4]
Downtime After Failure
Linguistic TermDescriptionRange of Fuzzy Membership Function
Very High (VH)The downtime after failure is very long, causing major disruptions. The system lacks robustness and flexibility to continue or quickly resume operations.[12, 16, 20, 24]
High (H)Downtime is extended. Failures result in substantial operational delays and indicate inefficient recovery procedures.[8, 12, 16, 20]
Medium (M)Downtime is moderate. Failures cause noticeable, but not critical, delays. System resilience is average.[4, 6, 10, 14]
Low (L)Downtime is short. The system recovers efficiently, and the impact of failures is limited.[1, 2, 4, 6]
Very Low (VL)Downtime is minimal or nonexistent. The system is highly resilient, with redundancy or quick recovery strategies that mitigate failure effects.[0, 0, 1, 2]
Table A5. Linguistic variables for P4: Flexibility, Agility.
Linguistic TermDescriptionRange of Fuzzy Membership Function
Very Low (VL)System is extremely rigid. It reacts very slowly or not at all to changes. Adaptation to new conditions is ineffective or absent, often leading to severe delays and inefficiencies.[0, 0, 0.2, 0.4]
Low (L)System shows low agility. Changes are possible but require significant effort and time. Reconfigurations are rarely seamless and often disrupt workflow.[0.2, 0.4, 0.5, 0.6]
Medium (M)System has moderate flexibility. It can adapt to changes with a reasonable degree of effort. Adjustments are usually planned but not immediate.[0.4, 0.5, 0.7, 0.8]
High (H)System is agile and responsive. It adjusts rapidly to new requirements, allowing reconfiguration with minimal delay and overhead.[0.6, 0.7, 0.85, 0.95]
Very High (VH)System is extremely flexible and agile. It responds to changes immediately and effortlessly, maintaining continuity and performance even under dynamic conditions.[0.85, 0.95, 1.0, 1.0]
Table A6. Linguistic variables for inputs for the P4: Flexibility, Agility.
Response Time to Changes
Linguistic TermDescriptionRange of Fuzzy Membership Function
Very High (VH)The system reacts very slowly to changes. It may take weeks to adjust processes, technologies, or workforce. This indicates very low agility.[10, 15, 20, 25]
High (H)Response to changes is slow. Adjustments require significant planning and time, which affects operational flexibility.[7, 10, 14, 18]
Medium (M)The system adapts at a moderate speed. Response to change is adequate, but still leaves room for optimization.[3, 5, 8, 12]
Low (L)The system reacts quickly to changes. Minor disruptions occur, but the organization adapts with relative ease.[1, 2, 4, 6]
Very Low (VL)The system responds almost immediately. It is highly flexible and agile, with structures in place to absorb and implement changes quickly.[0, 0, 1, 2]
Maintenance Agility Index
Linguistic TermDescriptionRange of Fuzzy Membership Function
Very High (VH)Maintenance processes are rigid and highly reactive. The system struggles to plan or execute changes efficiently.[0.0, 0.0, 0.2, 0.3]
High (H)Maintenance exhibits limited agility. There is some capability to respond to change, but it’s slow and inefficient.[0.2, 0.3, 0.4, 0.5]
Medium (M)Maintenance agility is moderate. The system can handle change with some effort, showing both planned and reactive elements.[0.4, 0.5, 0.6, 0.7]
Low (L)Maintenance teams are agile. They respond quickly to changes and implement adaptations effectively with minimal delay.[0.6, 0.7, 0.8, 0.9]
Very Low (VL)Maintenance processes are highly agile and proactive. The system anticipates changes and reacts seamlessly with minimal impact on operations.[0.8, 0.9, 1.0, 1.0]
Table A7. Linguistic variables for P5: Environmental impact.
Linguistic TermDescriptionRange of Fuzzy Membership Function
Very Low (VL)The system operates with minimal environmental awareness. Emissions and waste are poorly managed, and no environmental goals are pursued. System lacks environmental control [0.0, 0.0, 0.2, 0.3]
Low (L)Some basic environmental controls exist, but performance remains below acceptable levels. Limited tracking of environmental indicators.[0.25, 0.35, 0.45, 0.55]
Medium (M)Environmental performance is average. The system complies with basic standards, but lacks proactive strategies.[0.50, 0.60, 0.70, 0.78]
High (H)The system demonstrates good environmental stewardship. Emissions and waste are actively monitored and reduced.[0.75, 0.82, 0.90, 0.95]
Very High (VH)The system achieves excellent environmental performance. Operations are optimized for sustainability with near-zero environmental footprint.[0.90, 0.95, 1.00, 1.00]
Table A8. Linguistic variables for inputs for the P5: Environmental impact.
Carbon Emissions from Maintenance Activities
Linguistic TermDescriptionRange of Fuzzy Membership Function
Very High (VH)Maintenance generates extremely high CO2 emissions, indicating unsustainable practices and high environmental burden.[350, 400, 500, 600]
High (H)Emissions are high, suggesting inefficient practices, frequent energy-intensive repairs, or lack of green planning.[250, 300, 400, 500]
Medium (M)Emissions are at a moderate level. Some sustainable efforts are visible, but there’s room for optimization.[150, 200, 300, 400]
Low (L)Maintenance activities are relatively efficient with low carbon impact due to optimized processes and energy-conscious actions.[50, 100, 150, 200]
Very Low (VL)The system is extremely environmentally friendly. Emissions are minimal, indicating use of green technologies and preventive strategies.[0, 0, 50, 100]
Resource Efficiency Index
Linguistic TermDescriptionRange of Fuzzy Membership Function
Very Low (VL)The system wastes significant resources. Processes are inefficient, leading to overuse of materials, energy, and time.[0.0, 0.0, 0.2, 0.3]
Low (L)Some efficiency exists, but many processes still consume excess resources or produce waste.[0.2, 0.3, 0.4, 0.5]
Medium (M)Resource use is moderate. The system makes some effort to optimize but lacks full integration of sustainable practices.[0.4, 0.5, 0.6, 0.7]
High (H)The system uses resources effectively with minimal waste. It shows conscious management and lean operations.[0.6, 0.7, 0.8, 0.9]
Very High (VH)Resource efficiency is excellent. Operations are highly optimized, eco-friendly, and sustainable.[0.8, 0.9, 1.0, 1.0]
Table A9. Linguistic variables for Technology Adoption Capability.
Linguistic TermDescriptionRange of Fuzzy Membership Function
Very Low (VL)System is extremely resistant to the adoption or integration of new technologies. Updates are rare, legacy systems dominate, and digital transformation is absent.[0, 0, 0.2, 0.4]
Low (L)System has limited ability to adapt to technological change. New tools and solutions are adopted slowly and often with significant implementation issues.[0.2, 0.4, 0.5, 0.6]
Medium (M)System shows moderate adaptability to new technologies. Adoption occurs gradually with some integration effort and moderate efficiency.[0.4, 0.5, 0.7, 0.8]
High (H)System effectively adopts and integrates new technologies. Transition processes are well-managed, and digital tools are used proficiently.[0.6, 0.7, 0.85, 0.95]
Very High (VH)System is fully adaptive to new technologies. Innovations are rapidly absorbed, enabling cutting-edge performance and seamless digital evolution.[0.85, 0.95, 1.0, 1.0]
Table A10. Linguistic variables for Energy-Aware Maintenance level.
Linguistic TermDescriptionRange of Fuzzy Membership Function
Very Low (VL)Energy awareness in maintenance is practically non-existent. There is no energy-saving policy, no actions aimed at minimizing energy consumption. Old, energy-intensive equipment is used, and maintenance schedules do not consider energy optimization.[0, 0, 0.1, 0.3]
Low (L)The organization takes small steps toward energy savings in maintenance, but these efforts are sporadic and incomplete. Inefficient equipment may still be in operation, and maintenance schedules are only partially optimized.[0.1, 0.3, 0.4, 0.6]
Medium (M)Maintenance activities demonstrate a moderate level of energy awareness. The organization plans maintenance in an energy-conscious manner, and some equipment and processes have been modernized to improve energy efficiency. Energy consumption is monitored, but significant improvements are still possible.[0.3, 0.5, 0.6, 0.8]
High (H)The organization has a well-developed energy-saving policy within maintenance management. Modern, energy-efficient technologies are applied. Maintenance schedules are well optimized, and energy consumption is regularly monitored and controlled.[0.6, 0.7, 0.8, 0.9]
Very High (VH)The organization has a comprehensive energy-saving strategy, using state-of-the-art technologies and methods to minimize energy use. Energy-efficient equipment is employed, maintenance schedules are fully optimized, and regular energy consumption analyses are conducted, ensuring minimal environmental impact.[0.8, 0.9, 1.0, 1.0]

References

  1. Oliveira, M.A.; Lopes, I.; Figueiredo, D.L. Maintenance Management Proposal Based on Organization Maturity Level. In Proceedings of the International Conference on Industrial Engineering and Operations Management, Istanbul, Turkey, 3–6 July 2012; p. ID328.1-10. [Google Scholar]
  2. Werbińska-Wojciechowska, S.; Winiarska, K. Maintenance Performance in the Age of Industry 4.0: A Bibliometric Performance Analysis and a Systematic Literature Review. Sensors 2023, 23, 1409. [Google Scholar] [CrossRef]
  3. Chemweno, P.; Pintelon, L.; Van Horenbeek, A.; Muchiri, P.N. Asset Maintenance Maturity Model: Structured Guide to Maintenance Process Maturity. Int. J. Strateg. Eng. Asset Manag. 2015, 2, 119. [Google Scholar] [CrossRef]
  4. Silvestri, L.; Forcina, A.; Introna, V.; Santolamazza, A.; Cesarotti, V. Maintenance Transformation through Industry 4.0 Technologies: A Systematic Literature Review. Comput. Ind. 2020, 123, 103335. [Google Scholar] [CrossRef]
  5. Bukowski, L.A. Cognitive Dependability Engineering: Managing Risks in Cyber-Physical-Social Systems Under Deep Uncertainty; CRC Press: Boca Raton, FL, USA, 2023; ISBN 9781000919004. [Google Scholar]
  6. Bukowski, L.; Werbińska-Wojciechowska, S. Using Fuzzy Logic to Support Maintenance Decisions According to Resilience-Based Maintenance Concept. Eksploat. Niezawodn. Maint. Reliab. 2021, 23, 294–307. [Google Scholar] [CrossRef]
  7. Mollentze, F.J. Asset Management Auditing—The Roadmap to Asset Management Excellence; University of Pretoria: Pretoria, South Africa, 2005. [Google Scholar]
  8. Moerman, J.; Braaksma, J.; Van Dongen, L. Resilient Performance in Maintenance Operations: Managing Unexpected Failures. In Proceedings of the Event 24th International Annual EurOMA Conference 2017: Inspiring Operations Management, Edinburgh, UK, 1–5 July 2017; pp. 1–10. [Google Scholar]
  9. Okoh, P.; Haugen, S. Improving the Robustness and Resilience Properties of Maintenance. Process Saf. Environ. Prot. 2015, 94, 212–226. [Google Scholar] [CrossRef]
  10. Abdul-Nour, G.; Gauthier, F.; Diallo, I.; Komljenovic, D.; Vaillancourt, R.; Côté, A. Development of a Resilience Management Framework Adapted to Complex Asset Systems: Hydro-Québec Research Chair on Asset Management. In 14th WCEAM Proceedings, Proceedings of the 14th World Congress on Engineering Asset Management (WCEAM), Singapore, 28–31 July 2019; Lecture Notes in Mechanical Engineering; Springer: Berlin/Heidelberg, Germany, 2021; pp. 126–136. [Google Scholar] [CrossRef]
  11. Tazi, D.; Amalberti, R. Resilience of Maintenance Organization in a Refining Plant. In Proceedings of the Second Resilience Engineering Symposium, Antibes-Juan-les-Pins, France, 8–10 November 2006; Ecole des mines de Paris: Paris, France; 2006. [Google Scholar]
  12. Sun, H.; Yang, M.; Wang, H. Resilience-Based Approach to Maintenance Asset and Operational Cost Planning. Process Saf. Environ. Prot. 2022, 162, 987–997. [Google Scholar] [CrossRef]
  13. Jasiulewicz-Kaczmarek, M.; Voisin, A.; Franciosi, C.; Roda, I.; Bocewicz, G. Recent Advances in Smart and Sustainable Maintenance. In Proceedings of the 10th International Federation of Automatic Control (IFAC) Conference, Austin, TX, USA, 24–27 October 2021; p. 2021. [Google Scholar]
  14. Franciosi, C.; Roda, I.; Voisin, A.; Miranda, S.; Franciosi, C.; Roda, I.; Voisin, A.; Miranda, S.; Macchi, M. Sustainable Maintenance Performances and EN 15341:2019: An Integration Proposal. In Proceedings of the FIP International Conference on Advances in Production Management Systems, APMS 2021, Nantes, France, 5–9 September 2021; pp. 401–409. [Google Scholar]
  15. Cox, R.A.; Nielsen, S.B. Sustainable Resilience in Property Maintenance: Encountering Changing Weather Conditions. In Proceedings of the CIB Facilities Management Conference, Denmark, Copenhagen, 21–23 May 2014; pp. 329–339. [Google Scholar]
  16. Sandu, G.; Varganova, O.; Samii, B. Managing Physical Assets: A Systematic Review and a Sustainable Perspective. Int. J. Prod. Res. 2023, 61, 6652–6674. [Google Scholar] [CrossRef]
  17. Jasiulewicz-Kaczmarek, M.; Gola, A. Maintenance 4.0 Technologies for Sustainable Manufacturing–An Overview. IFAC-PapersOnLine 2019, 52, 91–96. [Google Scholar] [CrossRef]
  18. Sagharidooz, M.; Soltanali, H.; Farinha, J.T.; Raposo, H.D.N.; de-Almeida-e-Pais, J.E. Reliability, Availability, and Maintainability Assessment-Based Sustainability-Informed Maintenance Optimization in Power Transmission Networks. Sustainability 2024, 16, 6489. [Google Scholar] [CrossRef]
  19. Briatore, F.; Braggio, M. Resilience and Sustainability Plants Improvement through Maintenance 4.0: IoT, Digital Twin and CPS Framework and Implementation Roadmap. IFAC-PapersOnLine 2024, 58, 365–370. [Google Scholar] [CrossRef]
  20. Wireman, T. Benchmarking Best Practices for Maintenance, Reliability and Asset Management; Industrial Press: New York, NY, USA, 2015; ISBN 2013206534. [Google Scholar]
  21. Deepak Prabhakar, P.; Jagathy Raj, V.P. CBM, TPM, RCM and A-RCM—A Qualitative Comparison of Maintenance Management Strategies. Int. J. Manag. Bus. Stud. 2014, 4, 49–56. [Google Scholar]
  22. Helgesson, Y.Y.L.; Host, M.; Weyns, K. A Review of Methods for Evaluation and Maturity Models for Process Improvement. J. Softw. Maint. Evol. Res. Pract. 2012, 24, 436–454. [Google Scholar] [CrossRef]
  23. Tubis, A.A.; Werbińska-Wojciechowska, S. Risk Management Maturity Model for Logistic Processes. Sustainability 2021, 13, 659. [Google Scholar] [CrossRef]
  24. Bukowski, L.; Werbinska-Wojciechowska, S. Towards Maintenance 5.0: Resilience-Based Maintenance in AI-Driven Sustainable and Human-Centric Industrial Systems. Sensors 2025, 25, 5100. [Google Scholar] [CrossRef]
  25. Hauge, B.S.; Mercier, B.A. Reliability Centered Maintenance Maturity Level Roadmap. In Proceedings of the Annual Reliability and Maintainability Symposium, Tampa, FL, USA, 27–30 January 2003; pp. 226–231. [Google Scholar] [CrossRef]
  26. Alidrisi, H. Maintenance Maturity Level Identification Using MABAC Method: An Adaptation of TPM Pillars in a Public Service Sector. J. Sci. Ind. Res. 2020, 79, 914–917. [Google Scholar] [CrossRef]
  27. Albliwi, S.A.; Antony, J.; Arshed, N. Critical Literature Review on Maturity Models for Business Process Excellence. In Proceedings of the 2014 IEEE International Conference on Industrial Engineering and Engineering Management, Selangor, Malaysia, 9–12 December 2014; pp. 79–83. [Google Scholar] [CrossRef]
  28. Hollnagel, E. Safety-II in Practice: Developing the Resilience Potentials; Routledge, Taylor & Francis Group: London, UK; New York, NY, USA, 2018; ISBN 9781138708921. [Google Scholar]
  29. Hollnagel, E. Resilience Engineering: A New Understanding of Safety. J. Ergon. Soc. Korea 2016, 35, 185–191. [Google Scholar] [CrossRef]
  30. Durán, O.; Vergara, B. Maintenance Strategies Definition Based on Systemic Resilience Assessment: A Fuzzy Approach. Mathematics 2022, 10, 1677. [Google Scholar] [CrossRef]
  31. Asadzadeh, S.M.; Maleki, H.; Tanhaeean, M. A Resilience Engineering-Based Approach to Improving Service Reliability in Maintenance Organizations. Int. J. Syst. Assur. Eng. Manag. 2020, 11, 909–922. [Google Scholar] [CrossRef]
  32. Sincorá, L.A.; de Oliveira, M.P.V.; Zanquetto-Filho, H.; Alvarenga, M.Z. Developing Organizational Resilience from Business Process Management Maturity. Innov. Manag. Rev. 2023, 20, 147–161. [Google Scholar] [CrossRef]
  33. Pilanawithana, N.M.; Feng, Y.; London, K.; Zhang, P. Framework for Measuring Resilience of Safety Management Systems in Australian Building Repair and Maintenance Companies. J. Saf. Res. 2023, 85, 405–418. [Google Scholar] [CrossRef]
  34. Pilanawithana, N.M.; Feng, Y.; London, K.; Zhang, P. Developing Resilience for Safety Management Systems in Building Repair and Maintenance: A Conceptual Model. Saf. Sci. 2022, 152, 105768. [Google Scholar] [CrossRef]
  35. Bredebach, C. Is Sustainable Maintenance A Support-Or Standalone Function? A Definition. In Proceedings of the 4th Conference on Production Systems and Logistics (CPSL 2023-1), Santiago de Querétaro, Mexico, 28 February–2 March 2023; pp. 23–33. [Google Scholar] [CrossRef]
  36. Franciosi, C.; Iung, B.; Miranda, S.; Riemma, S. Maintenance for Sustainability in the Industry 4.0 Context: A Scoping Literature Review. IFAC-PapersOnLine 2018, 51, 903–908. [Google Scholar] [CrossRef]
  37. Saihi, A.; Ben-Daya, M.; As’ad, R.A. Maintenance and Sustainability: A Systematic Review of Modeling-Based Literature. J. Qual. Maint. Eng. 2023, 29, 155–187. [Google Scholar] [CrossRef]
  38. Jasiulewicz-Kaczmarek, M.; Antosz, K. The Concept of Sustainable Maintenance Criteria Assessment. In Proceedings of the IFIP International Conference on Advances in Production Management Systems (APMS), Nantes, France, 5–9 September 2021; pp. 427–436. [Google Scholar]
  39. Jasiulewicz-Kaczmarek, M.; Żywica, P. The Concept of Maintenance Sustainability Performance Assessment by Integrating Balanced Scorecard with Non-Additive Fuzzy Integral. Eksploat. Niezawodn. 2018, 20, 650–661. [Google Scholar] [CrossRef]
  40. Jasiulewicz-Kaczmarek, M.; Żywica, P.; Gola, A. Fuzzy Set Theory Driven Maintenance Sustainability Performance Assessment Model: A Multiple Criteria Approach. J. Intell. Manuf. 2021, 32, 1497–1515. [Google Scholar] [CrossRef]
  41. Franciosi, C.; Tortora, A.M.R.; Miranda, S. A Maintenance Maturity and Sustainability Assessment Model for Manufacturing Systems. Manag. Prod. Eng. Rev. 2023, 14, 137–155. [Google Scholar] [CrossRef]
  42. Jasiulewicz-Kaczmarek, M.; Legutko, S.; Kluk, P. Maintenance 4.0 Technologies—New Opportunities for Sustainability Driven Maintenance. Manag. Prod. Eng. Rev. 2020, 11, 74–87. [Google Scholar] [CrossRef]
  43. Madreiter, T.; Trajanoski, B.; Martinetti, A.; Ansari, F. Sustainable Maintenance: What Are the Key Technology Drivers for Ensuring Positive Impacts of Manufacturing Industries? IFAC-PapersOnLine 2024, 58, 616–621. [Google Scholar] [CrossRef]
  44. Fiksel, J. Sustainability and Resilience: Toward a Systems Approach. Sustain. Sci. Pract. Policy 2006, 2, 14–21. [Google Scholar] [CrossRef]
  45. Thomas, A.; Byard, P.; Francis, M.; Fisher, R.; White, G.R.T. Profiling the Resiliency and Sustainability of UK Manufacturing Companies. J. Manuf. Technol. Manag. 2016, 27, 82–99. [Google Scholar] [CrossRef]
  46. Simion, D.; Postolache, F.; Fleacă, B.; Fleacă, E. AI-Driven Predictive Maintenance in Modern Maritime Transport—Enhancing Operational Efficiency and Reliability. Appl. Sci. 2024, 14, 9439. [Google Scholar] [CrossRef]
  47. Ucar, A.; Karakose, M.; Kırımça, N. Artificial Intelligence for Predictive Maintenance Applications: Key Components, Trustworthiness, and Future Trends. Appl. Sci. 2024, 14, 898. [Google Scholar] [CrossRef]
  48. Vimal, K.E.K.; Shaikh, M.F.; Chouhan, A.P.; Kandasamy, J. Developing a Framework for Achieving Optimal Sustainability and Resilience in Circular Sharing Network. Environ. Dev. Sustain. 2024, 26, 18267–18295. [Google Scholar] [CrossRef]
  49. Zhai, Q.; Ye, Z.S. Robust Degradation Analysis with Non-Gaussian Measurement Errors. IEEE Trans. Instrum. Meas. 2017, 66, 2803–2812. [Google Scholar] [CrossRef]
  50. Zhai, Q.; Ye, Z.S.; Yang, J.; Zhao, Y. Measurement Errors in Degradation-Based Burn-In. Reliab. Eng. Syst. Saf. 2016, 150, 126–135. [Google Scholar] [CrossRef]
  51. Faiz, R.B.; Edirisinghe, E.A. Decision Making for Predictive Maintenance in Asset Information Management. Interdiscip. J. Inf. Knowl. Manag. 2009, 4, 23–36. [Google Scholar] [CrossRef]
  52. Lu, K.Y.; Sy, C.C. A Real-Time Decision-Making of Maintenance Using Fuzzy Agent. Expert Syst. Appl. 2009, 36, 2691–2698. [Google Scholar] [CrossRef]
  53. Ross, T.J. Fuzzy Logic with Engineering Application, 3rd ed.; John Wiley & Sons: Hoboken, NJ, USA, 2010; ISBN 9780470743768. [Google Scholar]
  54. Wu, H.; Xu, Z.S. Fuzzy Logic in Decision Support: Methods, Applications and Future Trends. Int. J. Comput. Commun. Control 2021, 16, 4044. [Google Scholar] [CrossRef]
  55. April, A.; Hayes, J.H.; Abran, A.; Dumke, R. Software Maintenance Maturity Model (SMmm): The Software Maintenance Process Model. J. Softw. Maint. Evol. 2005, 17, 197–223. [Google Scholar] [CrossRef]
  56. Schuh, G.; Lorenz, B.; Winter, C.P.; Gudergan, G. The House of Maintenance-Identifying the Potential for Improvement in Internal Maintenance Organisations by Means of a Capability Maturity Model. In Engineering Asset Lifecycle Management, Proceedings of the 4th World Congress on Engineering Asset Management (WCEAM 2009), Athens, Greece, 28–30 September 2009; Springer: Berlin/Heidelberg, Germany, 2009; pp. 15–24. [Google Scholar] [CrossRef]
  57. Kans, M.; Ehsanifard, K.; Moniri, A. Criteria and Model for Assessing and Improving Information Technology Maturity within Maintenance. J. Phys. Conf. Ser. 2012, 364, 012097. [Google Scholar] [CrossRef]
  58. Macchi, M.; Fumagalli, L. A Maintenance Maturity Assessment Method for the Manufacturing Industry. J. Qual. Maint. Eng. 2013, 19, 295–315. [Google Scholar] [CrossRef]
  59. Nemeth, T.; Ansari, F.; Sihn, W.; Haslhofer, B.; Schindler, A. PriMa-X: A Reference Model for Realizing Prescriptive Maintenance and Assessing Its Maturity Enhanced by Machine Learning. Procedia CIRP 2018, 72, 1039–1044. [Google Scholar] [CrossRef]
  60. Nemeth, T.; Ansari, F.; Sihn, W. A Maturity Assessment Procedure Model for Realizing Knowledge-Based Maintenance Strategies in Smart Manufacturing Enterprises. Procedia Manuf. 2019, 39, 645–654. [Google Scholar] [CrossRef]
  61. Oliveira, M.; Andrade, W.; Dos Santos, I.; Amaral, M.; Cintra, G. Evaluation of Maintenance Management of a Thermoplastic Industry Using a Maintenance Maturity Model: A Case in Manaus Industrial Pole. Proc. Eng. Sci. 2022, 4, 543–550. [Google Scholar] [CrossRef]
  62. Siswantoro, N.; Priyanta, D.; Gautama, S.; Zaman, M.B.; Pitana, T.; Prastowo, H.; Ratu Balqis, F.; Yulianto, A.N. The Evaluation of Maturity Level on Heavy Equipment Maintenance Management According to ISO 55001:2014. IOP Conf. Ser. Earth Environ. Sci. 2022, 972, 012033. [Google Scholar] [CrossRef]
  63. Tortora, A.M.R.; Di Pasquale, V.; Iannone, R. A Maintenance Maturity Model for Assessing Information Management Practices for Small and Medium Enterprises (M3AIN4SME). Appl. Sci. 2022, 12, 9282. [Google Scholar] [CrossRef]
  64. Liao, S.H. Expert System Methodologies and Applications-a Decade Review from 1995 to 2004. Expert Syst. Appl. 2005, 28, 93–103. [Google Scholar] [CrossRef]
  65. Sabaei, D.; Erkoyuncu, J.; Roy, R. A Review of Multi-Criteria Decision Making Methods for Enhanced Maintenance Delivery. Procedia CIRP 2015, 37, 30–35. [Google Scholar] [CrossRef]
  66. ISO 55000:2014; Asset Management—Overview, Principles and Terminology. ISO: Geneva, Switzerland, 2014.
  67. BS EN 15341:2007; Maintenance—Maintenance Key Performance Indicators. British Standard: Milton Keynes, UK, 2007.
  68. Vaidya, O.S.; Kumar, S. Analytic Hierarchy Process: An Overview of Applications. Eur. J. Oper. Res. 2006, 169, 1–29. [Google Scholar] [CrossRef]
  69. Kruse, R.; Doell, C. Fuzzy Systems. Fuzzy Sets and Fuzzy Logic; University Magdeburg: Magdeburg, Germany, 2020. [Google Scholar]
  70. Savitha, M.T.; George, M. New Methods for Ranking of Trapezoidal Fuzzy Numbers. Adv. Fuzzy Math. 2017, 12, 1159–1170. [Google Scholar]
  71. Zimmermann, H.J. Fuzzy Set Theory. Wiley Interdiscip. Rev. Comput. Stat. 2010, 2, 317–332. [Google Scholar] [CrossRef]
  72. Vaníček, J.; Vrana, I.; Aly, S. Fuzzy Aggregation and Averaging for Group Decision Making: A Generalization and Survey. Knowl. Based Syst. 2009, 22, 79–84. [Google Scholar] [CrossRef]
  73. Mamdani, E.H.; Assilian, S. An Experiment in Linguistic Synthesis with a Fuzzy Logic Controller. Int. J. Man. Mach. Stud. 1975, 7, 1–13. [Google Scholar] [CrossRef]
  74. Zadeh, L.A. Fuzzy Sets. Inf. Control 1965, 8, 338–353. [Google Scholar] [CrossRef]
  75. Dongre, J.K.; Raundale, A.R. Examining the Fuzzy Inference on Mamdani Fuzzy Inference System and Takagi-Sugeno Fuzzy Model. J. Harbin Eng. Univ. 2023, 44, 291–299. [Google Scholar]
  76. Kozlov, O. Optimal Selection of Membership Functions Types for Fuzzy Control and Decision Making Systems. In Proceedings of the CEUR Workshop Proceedings, Naples, Italy, 4–5 October 2021; Volume 2853, pp. 238–247. [Google Scholar]
  77. Chi, H.T.X.; Yu, V.F. Ranking Generalized Fuzzy Numbers Based on Centroid and Rank Index. Appl. Soft Comput. J. 2018, 68, 283–292. [Google Scholar] [CrossRef]
  78. Chu, T.C.; Tsao, C.T. Ranking Fuzzy Numbers with an Area between the Centroid Point and Original Point. Comput. Math. Appl. 2002, 43, 111–117. [Google Scholar] [CrossRef]
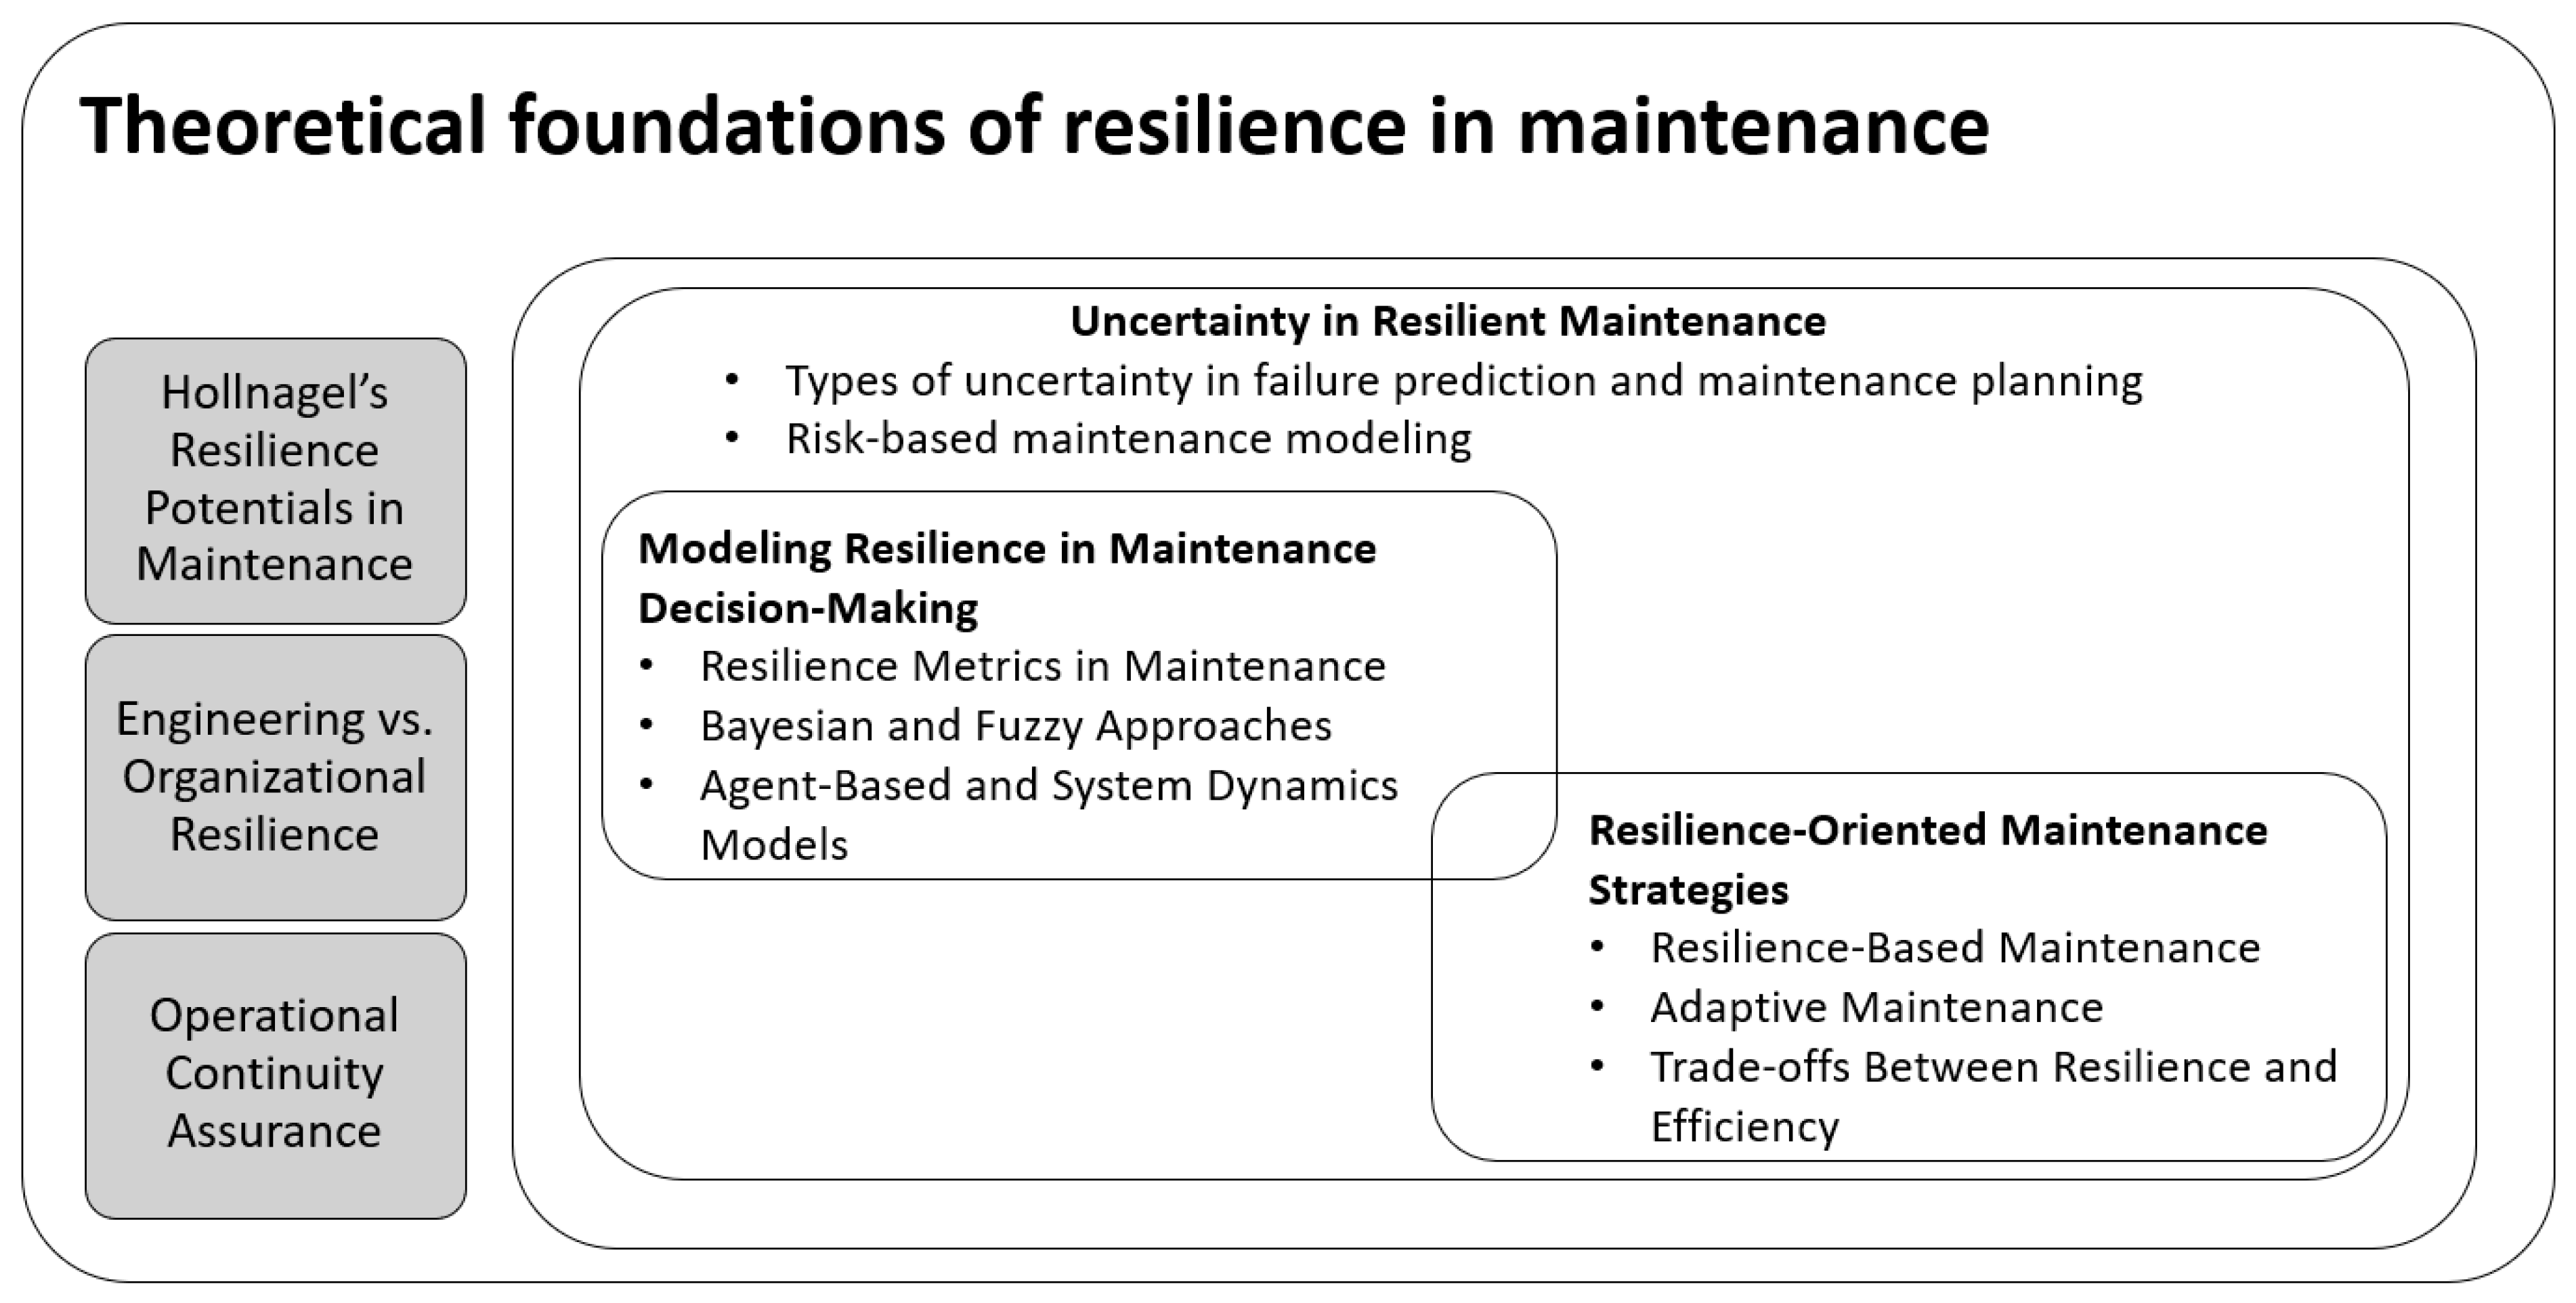
Figure 1. Two-dimensional maintenance perspective—resilience approach. Source: Own contribution.
Applsci 15 12236 g001
Figure 2. Two-dimensional maintenance perspective—sustainability approach (environmental and socio-economic dimensions). Source: Own contribution.
Applsci 15 12236 g002
Figure 3. A multi-layered approach to risk, resilience, and sustainability in asset lifecycle management. Source: Own contribution.
Applsci 15 12236 g003
Figure 4. Integrated Maintenance Maturity Model (IMMM) framework. Source: Own contribution.
Applsci 15 12236 g004
Figure 5. Fuzzy Integrated Maintenance Maturity assessment methodology proposed in this study. Source: Own contribution.
Applsci 15 12236 g005
Figure 6. Membership functions for input parameters and output of the P1: Reliability, Availability potential (according to Equation (1)).
Applsci 15 12236 g006
Figure 7. Sample rule base for Integrated Maintenance Maturity level assessment (based on centroid defuzzification, described in Equation (2). The red lines represent the values of parameters (given on the top of graphs).
Applsci 15 12236 g007
Figure 8. Evolution of Maintenance Maturity Assessment Frameworks.
Applsci 15 12236 g008
Figure 9. Conceptual alignment between ISO 55000 and IMMM.
Applsci 15 12236 g009
Figure 10. Surface view of the proposed fuzzy inference system: System Dependability/System Sustainability vs. Maintenance Maturity.
Applsci 15 12236 g010
Figure 11. Surface view of the proposed fuzzy inference system: System Adaptability/System Dependability vs. Maintenance Maturity.
Applsci 15 12236 g011
Figure 12. Phased IMMM integration roadmap with data flow and implementation milestones.
Applsci 15 12236 g012
Table 2. Maintenance maturity matrix in the developed approach.
Li\PiP1: Reliability, AvailabilityP2: Safety, SecurityP3: Resilience, RecoveryP4: Flexibility, AgilityP5: Sustainability
L1: InitialFailures are logged, but no predictive or preventive measures exist. Downtime tracking is inconsistent.Safety incidents are logged ad hoc, with no systematic analysis or response strategies.Recovery times are inconsistent, with no clear RTOs or contingency plans. Systems often experience prolonged downtime after incidents. Changes are addressed reactively, leading to inefficiencies and delays; processes are slow and often reactive.Environmental impact is not systematically tracked, and no formal sustainability initiatives exist.
L2: ManagedRegular maintenance stabilizes uptime, MTBF is tracked at a basic level, and failure rates are analyzed post-mortem.Some safety protocols are established, but there are inconsistencies in implementation across units; response times to threats vary significantly.Recovery protocols are established for local units, but recovery times are still unpredictable; RTOs are loosely defined.Basic adaptability measures exist, but response times are inconsistent across different units.Some environmental initiatives exist, but sustainability efforts are not fully integrated into maintenance workflows.
L3: StandardizedStandard processes for preventive maintenance are established and utilized across all units, improving consistency in MTBF and reducing failure rates.Safety procedures are standardized, with routine training, safety incident reporting, and structured risk mitigation.Recovery procedures are standardized, with defined RTOs and downtime reduction strategies in place.Standardized processes improve response times to operational changes, but adaptation is still slow in unpredictable conditions.Sustainability goals (e.g., carbon footprint reduction, waste management) are integrated into maintenance practices, with measurable goals.
L4: PredictableDowntime events are statistically analyzed, predictive maintenance models are developed, and real-time failure trends are monitored.Data analysis proactively manages safety risks, leading to faster response times and reduced incident frequency.Recovery strategies are optimized based on statistical analysis, ensuring predictable RTOs and minimal disruptions.Processes are dynamically adjusted based on statistical models, improving response times and flexibility.Sustainability metrics (e.g., resource efficiency, CO2 reduction) are actively tracked, with consistent improvements in resource efficiency and waste reduction.
L5: InnovatingProactive reliability improvement programs using real-time data analytics, AI-driven predictive maintenance, and reliability optimization to reduce failures and maximize system availability.Advanced safety technologies (e.g., AI-based threat detection) continuously improve security and risk mitigation.Continuous improvement of recovery strategies, integrating real-time monitoring and analysis to reduce RTO and downtime and enhance system resilience.Highly flexible systems capable of rapid adaptation, with continuous feedback loops to optimize response to changes.
Self-optimizing processes dynamically adjust based on AI-driven analytics, ensuring rapid adaptation.
Innovative sustainability practices are continuously implemented, focusing on achieving long-term environmental goals and reducing the organization’s carbon footprint.
Table 3. Proposed main knowledge areas, measurement indicators, and performance objectives for maintenance maturity potentials.
Maintenance PotentialKnowledge AreasMeasurement Indicators (Inputs)Performance Objectives
P1: Reliability, AvailabilityReal-time condition monitoring
Reliability-Centered Maintenance (RCM)
Predictive analytics and diagnostics
MTBF (Mean Time Between Failures)
Failure rate per asset class
Equipment Uptime [%]
Improve technical availability
Reduce unplanned downtime
Enhance system reliability
P2: Safety, SecurityOccupational risk and hazard analysis
Maintenance safety management systems
Data protection & cybersecurity protocols
Number of safety events linked to maintenance
TRIR (Total Recordable Incident Rate)
Safety Compliance Rate
Eliminate maintenance-related incidents
Comply with safety and regulatory standards
Protect technical systems from threats
P3: Resilience, RecoveryEmergency and corrective maintenance planning
Business continuity protocols
Spare parts redundancy and backup planning
RTO (Recovery Time Objective)
Downtime After Failure
MTTR (Mean Time To Recovery)
Recover from disruptions rapidly
Maintain service continuity
Limit operational losses
P4: Flexibility, AgilityAgile maintenance planning and scheduling
Modular equipment configuration
Workforce multi-skilling and redeployment
Response Time to Changes in Production Needs
Maintenance Agility Index
% of personnel trained for multiple stations
Rapidly adapt to production changes
Minimize the time required for system reconfiguration
Increase organizational responsiveness
P5: Environmental impactEnergy consumption and waste management
Circular maintenance and asset lifecycle strategies
Compliance with ESG and environmental policies
Carbon emissions from maintenance activities
Resource Efficiency index
% reduction in hazardous waste
Minimize environmental impact
Increase eco-efficiency of maintenance actions
Align maintenance with sustainability goals
Table 4. Evaluated weights for the Maintenance Maturity Potentials (according to procedure from Appendix A.1).
Maintenance PotentialWeight
P1: Reliability, Availability0.30
P2: Safety, Security0.20
P3: Resilience, Recovery0.20
P4: Flexibility, Agility0.15
P5: Environmental impact0.15
Table 5. Linguistic variables for inputs for the first potential P1: Reliability, Availability.
MTBF (Mean Time Between Failures)
Linguistic TermDescriptionRange of Fuzzy Membership Function
Very Low (VL)MTBF is extremely short, and the system fails very often. This means the system is highly unreliable and has frequent breakdowns, leading to operational interruptions.[0, 0, 50, 100]
Low (L)MTBF is below average, and the system experiences failures more frequently. This may result in decreased performance and increased downtime.[0, 50, 100, 200]
Medium (M)MTBF is average, and failures occur at a manageable rate. The system operates with an acceptable level of reliability, with periodic but manageable interruptions.[50, 100, 200, 300]
High (H)MTBF is above average, and failures are rare. The system is considered reliable, with few breakdowns or interruptions, contributing to stable operations.[100, 200, 300, 400]
Very High (VH)MTBF is very long, and the system experiences very few failures. The system is extremely reliable, with prolonged uptime and minimal disruptions to operations.[200, 300, 500, 500]
Failure Rate
Linguistic TermDescriptionRange of Fuzzy Membership Function
Very High (VH)The failure rate is extremely high, meaning the system is unreliable and often fails. A high failure rate leads to continuous disruptions in operations, poor system performance, and frequent maintenance.[0.8, 1.0, 1.0, 1.0]
High (H)The failure rate is above average, and the system fails frequently. The system experiences noticeable performance issues due to the relatively high number of breakdowns and disruptions.[0.6, 0.7, 0.8, 1.0]
Medium (M)The failure rate is moderate, and the system performance is average. While there are occasional failures, they do not significantly disrupt the system. The overall reliability is acceptable, but there may still be room for improvement.[0.4, 0.5, 0.6, 0.7]
Low (L)The failure rate is below average, and the system is relatively reliable. The system experiences few failures, and its performance remains stable, with only rare interruptions.[0.2, 0.3, 0.4, 0.5]
Very Low (VL)The failure rate is minimal, and the system is extremely reliable. The system operates with few failures, ensuring consistent performance and limited downtime.[0, 0, 0.2, 0.3]
Table 6. Linguistic variables for the first potential P1: Reliability, Availability.
Linguistic TermDescriptionRange of Fuzzy Membership Function
Very Low (VL)The system exhibits poor reliability and availability. The system frequently experiences failures and downtime, making it unreliable and unavailable most of the time.[0, 0, 0.2, 0.4]
Low (L)The system shows below-average reliability and availability. The system experiences frequent failures and extended downtime, affecting its overall performance.[0, 0.2, 0.4, 0.6]
Medium (M)The system has moderate reliability and availability. Failures and downtime are manageable and may occur occasionally, but the system performs adequately overall.[0.2, 0.4, 0.6, 0.8]
High (H)The system is mostly reliable and available with occasional issues. The system experiences rare failures and minimal downtime and generally meets performance expectations.[0.4, 0.6, 0.8, 1.0]
Very High (VH)The system is highly reliable and available with minimal issues. The system rarely experiences failures, and downtime is extremely low, ensuring optimal performance.[0.6, 0.8, 1.0, 1.0]
Table 7. Linguistic variables for the first dimension: System Dependability.
Linguistic TermDescriptionRange of Fuzzy Membership Function
Low (L)The system is highly unreliable, with frequent failures and significant downtime. Low performance in reliability (P1), safety (P2), and resilience (P3) leads to a high risk of operational disruptions, poor recovery from failures, and frequent safety incidents.[0, 0, 0.2, 0.4]
Medium (M)The system is moderately dependable. There are occasional failures and some downtime, but recovery is generally fast. The system has reasonable reliability, safety measures, and resilience, with a moderate risk of disruptions.[0.3, 0.45, 0.6, 0.75]
High (H)The system is highly dependable, with minimal downtime and failures. Reliability (P1), safety (P2), and resilience (P3) are well-optimized, resulting in smooth operations with rare interruptions or safety incidents.[0.6, 0.8, 1, 1]
Table 8. Linguistic variables for the second dimension: System Adaptability.
Linguistic TermDescriptionRange of Fuzzy Membership Function
Low (L)The system is not very adaptable, showing resistance to change. It struggles to respond to shifting conditions and is slow to adjust to new requirements, as reflected by low agility (P4). Changes in operational or market demands lead to delays and inefficiencies.[0, 0, 0.3, 0.5]
Medium (M)The system can moderately adapt to changes. Agility (P4) is acceptable, allowing adjustments that take time and resources. While change is manageable but not always seamless, improvements are still possible.[0.4, 0.5, 0.6, 0.8]
High (H)The system is highly adaptable and can quickly and efficiently respond to changes. It demonstrates strong agility (P4), allowing it to adjust swiftly to new requirements or external changes, ensuring minimal disruption and continuous improvement.[0.7, 0.85, 1, 1]
Table 9. Linguistic variables for the last dimension: System Sustainability.
Linguistic TermDescriptionRange of Fuzzy Membership Function
Low (L)The system has a significant environmental impact. Resource efficiency (P5) is low, resulting in high energy consumption, waste production, and carbon emissions. This leads to sustainability concerns and long-term operational inefficiencies.[0, 0, 0.25, 0.5]
Medium (M)The system demonstrates moderate sustainability. Resource efficiency (P5) is acceptable, with some efforts made to minimize environmental impact. However, there is room for improvement in reducing the carbon footprint and optimizing resource usage.[0.4, 0.5, 0.7, 0.85]
High (H)The system is highly sustainable, with excellent resource efficiency (P5), low environmental impact, and minimal waste and emissions. It contributes to long-term environmental and operational sustainability with reduced operational costs and ecological footprint.[0.75, 0.9, 1, 1]
Table 10. Linguistic variables for the System Maintenance Maturity.
Linguistic TermDescriptionRange of Fuzzy Membership Function
L1—InitialThe system operates reactively. Failures and safety incidents are logged inconsistently. Recovery and change responses are slow and uncoordinated. Sustainability is virtually absent. Maintenance processes are largely corrective with minimal structure.[0.0, 0.0, 0.1, 0.2]
L2—ManagedMaintenance activities and reliability measures are partially formalized. Some safety and recovery procedures exist, but inconsistencies remain. Minor adaptability measures and limited sustainability initiatives are observable. Maintenance still reacts primarily to problems but with an improving organization.[0.1, 0.2, 0.3, 0.4]
L3—StandardizedPreventive maintenance, standardized safety procedures, and structured recovery plans are applied consistently. Early stages of system adaptability and sustainability are integrated. Maintenance processes are standardized across units and processes.[0.3, 0.4, 0.5, 0.6]
L4—PredictablePredictive maintenance practices, proactive safety management, optimized recovery strategies, and dynamic change adaptation are evident. Sustainability metrics are systematically monitored and improved. Maintenance is becoming predictive and data-driven.[0.5, 0.6, 0.7, 0.8]
L5—InnovatingMaintenance is fully strategic and innovation-driven. Advanced technologies (AI, real-time analytics) continuously optimize reliability, safety, adaptability, and sustainability. The organization demonstrates self-optimizing, highly resilient, and sustainable maintenance practices aligned with long-term goals.[0.7, 0.8, 1.0, 1.0]
Table 11. Overview of membership functions and fuzzy rules applied in the IMMM.
Variable/PotentialType of Membership FunctionLinguistic TermsExample of Fuzzy Rule
MTBF (Mean Time Between Failures)TrapezoidalVery Low (VL), Low (L), Medium (M), High (H), Very High (VH)-
Failure Rate
Number of safety events
Safety Compliance Rate
MTTR (Mean Time to Recovery)
Downtime After Failure
Response Time to Changes
Maintenance Agility Index
Carbon Emissions from Maintenance Activities
Resource Efficiency Index
Technology Adoption Capability
Energy-Aware Maintenance level
System Potentials (P1, P2, P3, P4, P5)VL, L, M, H, VHIF MTBF is High AND Failure Rate is Low THEN P1 = High
System Dimensions (Dependability, Adaptability, Sustainability)Low, Medium, HighIF P1, P2, P3 are High THEN System Dependability = High
Output: Maintenance Maturity Level (MML)L1–Initial, L2–Managed, L3–Standardized, L4–Predictable, L5–InnovatingIF System Dependability is High AND System Sustainability is Medium THEN System MML = L4 (Predictable)
Table 12. Input parameters for maintenance maturity potentials based on expert data.
Potential Input 1Input 2
DefinitionValueDefinitionValue
P1: Reliability, AvailabilityMean Time Between FailuresHigh Failure RateLow
P2: Safety, SecurityNumber of safety eventsLow Safety Compliance RateHigh
P3: Resilience, RecoveryMTTR (Mean Time To Recovery)MediumDowntime After Failure Medium
P4: Flexibility, AgilityResponse Time to ChangesMediumMaintenance Agility Index Medium
P5: Environmental impactCarbon emissions from maintenance activitiesLowResource Efficiency IndexHigh
Table 13. Evaluated maintenance potentials for the case company.
PotentialFuzzified EvaluationScore
P1: Reliability, AvailabilityHigh0.847
P2: Safety, SecurityMedium0.645
P3: Resilience, RecoveryMedium0.723
P4: Flexibility, AgilityMedium0.743
P5: Environmental impactMedium0.689
Table 14. Summary of IMMM results for the analyzed company.
Additional ParameterFuzzified EvaluationScore
Technology Adaptation CapabilityMedium0.70
Energy-Aware Maintenance LevelHigh0.75
System DimensionAggregated ScoreMaturity Level
Dependability0.687L3—Standardized
Adaptability0.654L3—Standardized
Sustainability0.677L3—Standardized
Overall IMMM index 0.544L3—Standardized
Table 15. Proposed exemplary recommendations for overall maintenance maturity level improvement.
Maturity DimensionPossible RecommendationsOrganizational ContextMaturity AmbitionResource Capabilities
DependabilityImplement condition-based and predictive maintenance (CBM/PM)Industrial systems with high failure impactLevel 3 → 4 or 4 → 5Medium to High (IoT, sensors required)
Apply FMEA, bow-tie, or fault tree analyses for critical assetsRegulated/high-risk industries (e.g., mining, energy)Level 2 → 3Medium
Enhance root cause analysis (RCA) and incident reporting cultureOrganizations with repeated failures or poor diagnosticsLevel 2 → 4Low to Medium
Introduce maintenance standardization across departmentsMulti-site organizations or siloed structuresLevel 3 → 4Medium
AdaptabilityDevelop and test business continuity and emergency maintenance plansDynamic environments or service-critical operationsLevel 2 → 3 or 3 → 4Medium
Implement flexible scheduling and resource sharing (e.g., modular shifts)Environments with fluctuating workloadsLevel 3 → 5Low to Medium
Introduce cross-functional training programs for maintenance staffOrganizations seeking workforce agilityLevel 2 → 4Low
Integrate real-time decision support systems (e.g., digital twins)Digitally advanced or innovation-driven firmsLevel 4 → 5High
SustainabilityTrack and reduce energy and material use in maintenance tasksOrganizations with high ESG exposure or energy-intensive assetsLevel 3 → 4Medium
Implement remanufacturing, reuse, and recycling programsCircular economy-aligned organizationsLevel 2 → 4Medium
Align with GRI, or ESG frameworks in maintenance reportingCompanies under ESG (Environmental, Social, and Governance) scrutiny or with sustainability KPIsLevel 3 → 5Medium to High
Introduce green maintenance practices (e.g., biodegradable lubricants, eco-spares)Organizations in environmentally sensitive sectorsLevel 2 → 3Low to Medium
Promote employee well-being and safety through ergonomic and psychosocial risk programsLabor-intensive or high-risk maintenance environmentsLevel 2 → 4Medium
Optimize cost-effectiveness of maintenance through life-cycle cost analysis and lean practicesOrganizations with cost pressures or seeking efficiencyLevel 3 → 5Medium
Digitalization PathwaysImplement CMMS or EAM (Enterprise Asset Management) systems to support data-driven decision-makingAny context aiming for structured maintenanceLevel 2 → 3Medium
Use IoT for real-time condition monitoringAsset-intensive industries with high downtime costsLevel 3 → 5Medium to High
Adopt AI/ML tools for failure prediction and diagnosticsInnovation-driven or research-intensive organizationsLevel 4 → 5High
Table 16. Comparison of main maintenance maturity frameworks.
FrameworkFocus AreaAssessment MethodKey DimensionsLimitationsIMMM Extension
FMMRMaintenance organization and process standardizationQualitative checklistOrganization, process controlLacks quantification; subjectiveAdds measurable performance indicators
AMMMAsset lifecycle managementMixed qualitative–quantitativeReliability, cost, lifecycleNo direct link to real-time dataAdds real-time adaptability, recovery focus
ISO 55000Governance and risk-based asset managementCompliance-based auditRisk, lifecycle, policy, improvementStatic evaluation; qualitativeIntroduces fuzzy quantification, resilience, sustainability
IMMMMulti-dimensional maintenance maturityFuzzy quantitative modelReliability, Safety, Resilience, Agility, SustainabilityFully quantitative, adaptive, resilience-oriented
Table 17. Data requirements and inputs in ISO-based maturity evaluation.
CategoryData/Information RequiredSource
Maintenance process dataMTBF, MTTR, number of failures, maintenance backlogCMMS reports
Asset management policiesmaintenance procedures, risk assessment reportsinternal documentation
Organizational datacompetence, training, responsibilitiesHR records
Compliance dataaudits, safety certificationsmanagement systems
Sustainability aspects (optional)energy consumption, waste generationenvironmental reports
Table 18. Comparative methodological analysis: IMMM vs. ISO 55000.
AspectISO 55000 FrameworkIntegrated Maintenance Maturity Model (IMMM)Added Value of IMMM
Core philosophyAsset management and compliance orientationSystem maturity and performance orientationFocus on evolution and learning capacity of maintenance systems
Evaluation logicQualitative checklist or audit gridFuzzy logic inference and defuzzificationQuantitative, uncertainty-aware evaluation
Maturity dimensionsLeadership, Risk, Lifecycle, Performance, ImprovementSystem Dependability, Adaptability, SustainabilityAdds resilience and flexibility potentials
Data requirementsStatic process and policy dataReal-time or expert-based technical indicators (e.g., MTBF, energy use)Enables dynamic data linkage (IoT, CMMS)
Output typeOrdinal (1–5 levels)Continuous (0–1 scale, defuzzified maturity value)Higher diagnostic resolution
IntegrationDocumentation- and audit-drivenDigitally integrable with ERP/CMMS/IoTSupports automation and feedback learning
Improvement pathPeriodic audit and gap analysisAdaptive, feedback-based learning cycleEnables predictive and self-improving systems
Table 19. Comparative maturity assessment—IMMM vs. ISO 55000 (case study results).
Dimension/PotentialISO 55000 AssessmentIMMM AssessmentKey Differences/Added Value
Reliability/AvailabilityLevel 3—processes partially standardized; MTBF tracked; preventive maintenance appliedLevel 4 (score = 0.847)—predictive maintenance integrated; downtime statistically analyzed; real-time monitoring implementedIMMM adds quantitative tracking and predictive features, enabling continuous evaluation of reliability trends
Safety/SecurityLevel 3—formal safety procedures and compliance monitoring; incident tracking reactiveLevel 4 (score = 0.645)—safety incidents monitored in real time; AI-assisted risk detection; proactive safety auditsIMMM supports dynamic risk assessment and continuous improvement beyond compliance
Resilience/RecoveryNot explicitly assessed (partly covered under “risk management”)Level 3 (score = 0.723)—recovery strategies standardized; recovery time objectives (RTOs) defined and monitoredIMMM explicitly evaluates recovery capacity and operational continuity—absent in ISO 55000
Flexibility/AgilityNot explicitly assessedLevel 3 (score = 0.743)—adaptive maintenance workflows; resource reallocation capabilityIMMM quantifies adaptability, allowing measurement of responsiveness to production changes
Sustainability/Environmental ImpactLevel 2—energy use and emissions tracked but limited process integrationLevel 3 (score = 0.689)—resource efficiency tracked; ESG-aligned maintenance and circular economy practices in placeIMMM embeds sustainability indicators into operational decision-making and life-cycle management
Table 20. Technical and organizational barriers to IMMM integration and proposed mitigation actions.
CategoryIdentified BarrierPractical ExampleRecommended Mitigation/Implementation Action
Data StandardizationInconsistent data structures and formats across CMMS, ERP, and IoT systemsMTBF stored as hours in CMMS, while ERP uses cycles; missing semantic metadataAdopt data normalization procedures; apply OPC UA or ISO 13374 schema; define data validation layers
Data Interfaces and InteroperabilityLack of common APIs and integration middlewareLegacy CMMS without RESTful API supportDevelop middleware connectors or ETL scripts; implement RESTful or MQTT-based gateways for interoperability
Data Quality and CompletenessIncomplete, outdated, or inconsistent maintenance recordsMissing failure timestamps or duplicate asset IDsIntroduce automated data cleaning and version control; set up data governance framework
System CompatibilityLegacy software versions incompatible with modern integration protocolsERP or CMMS without IoT connectorsGradual software updates; pilot integration using parallel systems or digital shadow approach
Cybersecurity and Data AccessSecurity restrictions limit real-time data sharing between systemsMaintenance data not accessible for AI modulesDefine clear access policies; apply encryption and role-based authorization
Personnel CompetenceLimited digital literacy and lack of trust in AI-supported decision systemsMaintenance staff unaware of fuzzy logic principlesConduct targeted training and workshops; provide user-friendly visualization dashboards
Organizational ResistanceCultural and procedural resistance to digital transformationStaff prefer manual reporting and local spreadsheetsApply change management principles; use pilot implementations to demonstrate value
Phased Implementation ChallengeAttempt to deploy full integration too earlyResource constraints or lack of readinessAdopt phased deployment (offline → semi-automatic → real-time integration) with evaluation checkpoints
Disclaimer/Publisher’s Note: The statements, opinions and data contained in all publications are solely those of the individual author(s) and contributor(s) and not of MDPI and/or the editor(s). MDPI and/or the editor(s) disclaim responsibility for any injury to people or property resulting from any ideas, methods, instructions or products referred to in the content.