Article

Numerical Simulation and Mechanism Study of Liquid Nitrogen Flow Instability in a Sudden Expansion–Contraction Channel

College of Engineering Science and Technology, Shanghai Ocean University, Shanghai 201306, China
*
Author to whom correspondence should be addressed.
Appl. Sci. 2025, 15(22), 12211; https://doi.org/10.3390/app152212211
Submission received: 9 September 2025 / Revised: 23 October 2025 / Accepted: 24 October 2025 / Published: 18 November 2025
(This article belongs to the Special Issue Nonlinear Dynamics in Mechanical Engineering and Thermal Engineering)

Abstract

Sudden expansion–contraction channels are critical components in engineering systems. Understanding fluid flow within this geometry is essential for predicting jet mixing characteristics, holding significant scientific and practical value. This paper employs numerical simulation methods to investigate the flow and heat transfer characteristics of liquid nitrogen jets. The analysis of flow and heat transfer evolution under varying structural parameters reveals that the internal flow transitions from a steady state to periodic oscillations and, ultimately, to chaos as the Re increases. Further investigation of the mechanism behind this nonlinear phenomenon, through velocity spectrum analysis, velocity phase diagrams, and Poincaré section analysis, verifies the existence of multiple solutions in nonlinear systems. The results provide theoretical foundations for studying similar nonlinear systems and for the design and application of engineering installations.

1. Introduction

The rapid advancement of ultra-low temperature processing technologies has elevated the nonlinear flow characteristics of cryogenic fluids, such as liquid nitrogen (LN2), to a significant scientific problem. This study directly impacts the performance enhancement of engineering systems, particularly fluid flows in a sudden expansion–contraction channel. LN2 cooling, valued for its high heat flux density and environmental benefits, is widely used in industrial applications [1,2,3,4,5], including food freezing, medical device freezing treatment, electronic product cooling, and material deep cooling. The fluid flows through a sudden expansion and contraction structure, where the fluid flow significantly affects the physical properties (e.g., viscosity and density). This distinct flow state exhibits three characteristic instability mechanisms:
(i)
Vortex-induced flow separation and reattachment.
(ii)
High-amplitude pressure fluctuations.
(iii)
Strong thermo-hydrodynamic coupling.
These mechanisms collectively govern critical performance metrics: cooling uniformity, thermal efficiency, and operational stability. There are still obvious deficiencies in the unsteady flow mechanism of cryogenic fluids, such as LN2, under such special geometrical structures, especially in the study of flow field instability threshold prediction and active control strategies for engineering applications.
Recent advances in flow and heat transfer in nonlinear systems can be categorized into three themes.
(1)
Jet dynamics and phase-change phenomena
Accurately predicting transient two-phase flow under high-speed conditions is crucial for enhancing the performance of advanced thermal management systems. However, computational modeling in this field still faces challenges in transitioning from low-speed, simplified models to high-speed, three-dimensional scenarios. Cen et al. [6] pioneered a gas-phase model for moving droplet evaporation, yet their sub-0.5 m/s velocity limit neglects high-speed impact scenarios. While Moosavian [7] quantified jet impingement angles under pressure variations, the absence of geometric parameterization (e.g., ER and AR) limits design applicability. Cai et al. [8] confirmed water-jet similarity in LN2 potential cores, but their 2D model cannot resolve 3D vortex detachment at high Re. To overcome the limitations of these low-dimensional and simplified models, a deeper understanding of the interaction between turbulent flow and three-dimensional vortex structures within complex channels is required. Banerjee S [9], Gao Y [10], and others studied the flow phenomena of two-phase flow in channels and analyzed flow and heat transfer under pressure drop conditions, providing an essential research reference for calculating two-phase flow in channels. Xu Z et al. [11] investigated extensive eddy simulations on sharkskin surfaces with different Re in a fully turbulent channel. They found that the flow pattern was driven by periodic emission of hairpin vortices, which formed a strong shear layer and exacerbated the shear stresses and momentum exchange. This finding not only underscores the central role of 3D vortex structures but also highlights, conversely, the fundamental inadequacy of 2D or simplified models that neglect such mechanisms when predicting complex, high-Reynolds-number flows.
(2)
Turbulence–thermal coupling in a constrained channel
Building upon the understanding of vortex dynamics and three-dimensional effects, research on cryogenic fluids in confined geometries further reveals complex thermo-hydraulic phenomena. However, these often occur under specific conditions that limit their broader applicability. Cai, HB et al. [12] associated an analytical solution for the freezing temperature field of a single pipe, and then applied this solution to LN2 freezing engineering, and the computational results showed that the radius of the LN2 freezing front is proportional to the square root of the freezing time; at the channel scale, the influence of geometry on flow patterns and heat transfer becomes paramount. A study of the fluid oscillator device on the velocity field and temperature field found that increasing Re leads to strong vortices and increases the oscillation frequency [13]. Microchannel studies (Jia et al. [14], Zhang et al. [15]) have revealed boiling hysteresis effects; however, their sub-millimeter scales diverge from industrial sudden expansion–contraction channel systems. Sun et al. [16] researchers have found that in vertical annular two-phase flow within a circular channel, both the pressure drop and heat transfer coefficient increase as the mass flux rises and the channel gap decreases. Sun Bing et al. [17] investigated the flow and heat transfer characteristics of transcritical methane in the regenerative cooling channel of a liquid oxygen methane engine, and summarized the internal flow and temperature laws of the abruptly expanding and contracting cooling flow channel; Wang L [18] studied and analyzed the phenomenon of cooling acceleration and the cooling principle of LN2 channels using conductivity coating technology and microfin tubes. Chen’s [19] study on cavitation evolution in shrinking–expansion channels revealed throat blockage effects, which are directly relevant to our contraction zone analysis. The abrupt expansion and contraction structures within microchannels significantly influence the flow characteristics of droplets, including velocity fields and vorticity. It was observed that when the cross-sectional area of the cavity undergoes abrupt changes, the droplet’s velocity fluctuates, leading to pulsating flow within the cavity-shaped microchannel. Furthermore, the vorticity values within the cavity consistently exceed those in straight microchannels, indicating that the microcavity structure effectively enhances fluid mixing within the microchannel [20]. Collectively, these studies affirm that abrupt expansion–contraction structures profoundly influence flow mixing and heat transfer by promoting vortex generation. However, a comprehensive model that integrates these geometric effects with the unique thermo-physical properties of cryogenic fluids like LN2 under high-speed, high-Re conditions remains an open challenge.
(3)
Nonlinear instability mechanisms
In studying bifurcation phenomena in solutions to the N-S equations, the bifurcation Res for different aspect ratios and multiple solutions at various Res are presented in detail [21]; Trefethen L N [22] used the linear stability method to give stability conditions for the classical Bénard system, but for some flows the values provided by the linear stability method do not coincide with the experimental results, and it is a necessary condition for stability; Straughan [23] and Rionero [24] applied energy methods to problems related to fluid dynamics and used energy methods to study the stability of flows; Guan F [25] proved that the elementary flow is globally nonlinear and exponentially stable by defining a generalized energy generalization of the fluid concentration as a stabilizing effect on the elementary flow. Roshchin [26] et al. identified non-monotonic resistance in shear-thinning fluids through abrupt contractions, providing a benchmark for bifurcation analysis. However, their isothermal assumptions fail to capture cryogenic thermal–fluid coupling. Kumar’s [27] boiling instability model neglects vortex-driven pressure pulsations, a critical gap for LN2 systems. This nonlinear multi-solution phenomenon reflects the system’s internal stability and underscores the necessity of bifurcation multi-solution research. Chaotic behavior arises from the system’s nonlinear nature, which renders it extremely sensitive to initial conditions, thereby generating complex behavior that appears random and unpredictable on the surface.
Although previous studies have characterized fundamental vortex dynamics in cryogenic flows, the quantitative relationship between velocity–thermal coupling and geometric parameters (the ER and AR) remains unestablished. This paper investigates the variation in fluid mixing characteristics under different Re through numerical simulations. First, this paper quantifies nonlinear flow phenomena through vortex evolution analysis and temperature field diagnostics. Then, this paper systematically examines geometric effects by varying the ER from 1.5 to 4.0 and the AR from 5 to 20. We research and analyze the general characteristics and mechanisms underlying nonlinear phenomena in sudden expansion–contraction channels. The results provide research references for general characteristic analysis and engineering application design in nonlinear systems.

2. Physical and Mathematical Model

2.1. Physical Model

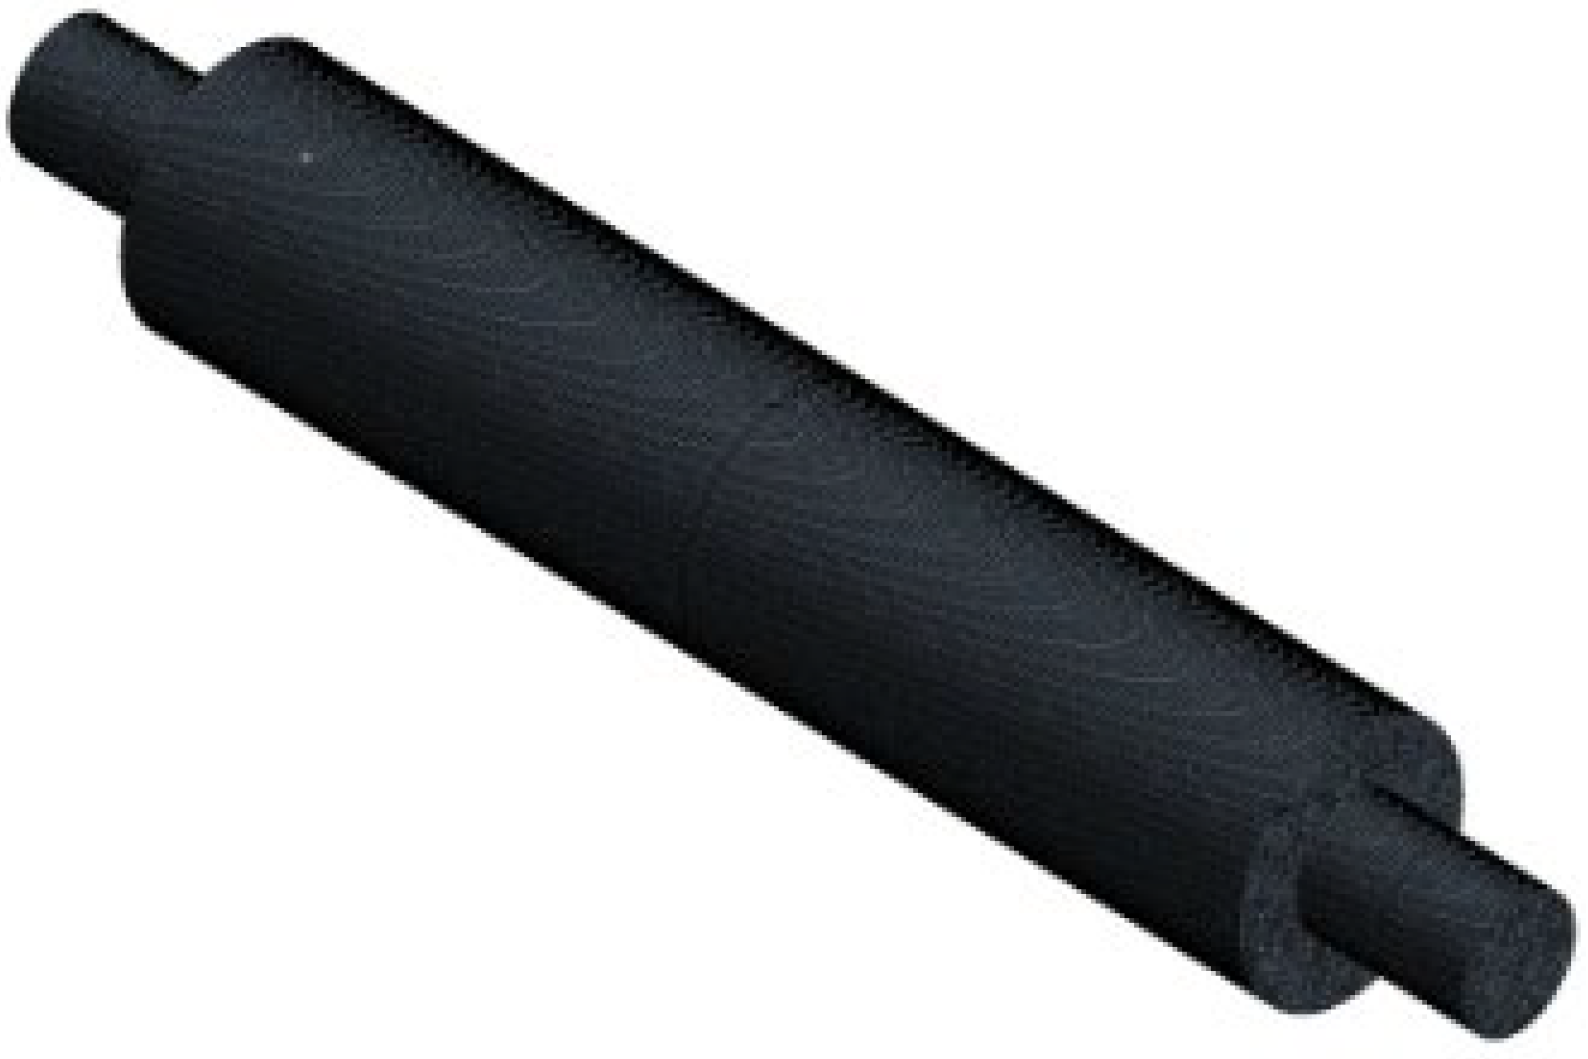
This paper examined the impact of the sudden expansion–contraction channel on the fluid flow state and the uniformity of the exit jet mixing. This channel is located within the LN2 jet freezing engineering application device (Figure 1). To analyze the flow characteristics, the paper simplified the industrial device geometry while preserving key features, and a model of LN2 flow in the sudden expansion–contraction channel was constructed. The model geometry references the main features of commonly used LN2 injection devices (e.g., nozzle-diffuser–constrictor throat combinations). It contains three main sections: the inlet channel, the expansion zone, which simulates the critical mixing region, and the outlet channel.
To precisely simulate the core fluid flow characteristics under actual operating conditions, the model design ensures that the inlet and outlet channels have geometrically identical diameters and adequate length. This design stems from practical engineering considerations. Specifically, the inlet section is sufficient to ensure that LN2 attains a fully developed laminar or turbulent flow state before entering the critical sudden expansion–contraction mixing zone. This effectively eliminates interference from the inlet section on the flow structure and mixing characteristics. Accordingly, the simulation outcomes can more accurately represent the flow behavior within the sudden expansion–contraction channel.
Figure 2 denotes the geometric parameters of the model, where L1 refers to the length of the inlet channel, L2 to the length of the internal channel, and L3 to the length of the outlet channel. The channel features a symmetric geometry, wherein the inlet height h1 is equal to the outlet height h2. This fundamental height h1 serves as the reference dimension for defining the expansion ratio, ER = H/h1, and the aspect ratio, AR = L2/h1. The fluid inlet temperature is T0, and the wall temperature is TW. Specific structural parameters are provided in Table 1.

2.2. Mathematical Model

This study simulates three-dimensional, transient, viscous fluid flow. Considering the potential low-Mach-number compressibility of liquid nitrogen under high-velocity jets. We employ the governing equations in the following form:
Law of Conservation of Mass:
ρ t   +   ρ u   =   0
Momentum Conservation Equation:
ρ u t   +   ρ uu   =   p   +   τ   +   ρ g
Here, τ denotes the shear stress tensor.
To capture the intense heat exchange between liquid nitrogen and the 300 K wall surface, we solved the energy equation. Given our focus on heat transfer and temperature distribution, we adopted an equation form based on enthalpy (h) or temperature (T):
( ρ h ) t   + ( ρ u h ) = ( k T ) + τ : u
where ρ is fluid density, u is the velocity vector, h is the sensible enthalpy, k is the thermal conductivity, T is the temperature, and τ: ∇u is the viscous dissipation term.
To simulate the liquid nitrogen jet and its interaction with the surrounding air, we employed a volume-of-fluid (VOF) multiphase flow model. This model captures the two-phase interface by solving a single set of momentum equations and tracking the volume fraction of each fluid throughout the domain. The transport equation for the volume fraction (α) is as follows:
F t + F u = 0
where F is a volume fraction equation ranging from 0 to 1. Its physical meaning is the volume fraction occupied by the target fluid within a grid cell.
For high Re, fully developed turbulence generated by sudden expansion–contraction structures requires reliable turbulence models to capture their separation and reattachment behavior. This study employs the standard k-ε turbulence model, which is based on the eddy viscosity hypothesis and closes the RANS equations by solving two transport equations for turbulent kinetic energy (k) and turbulent dissipation rate (ε):
k t + u ¯ m k x m = μ t ρ S 2 ε + x m 1 ρ μ + μ t σ k k x m
The character in this formula, k, is the turbulent kinetic energy, and S is the magnitude of the average strain rate tensor. σk turbulent kinetic energy’s turbulent Prandtl number for k.
The Reynolds number is a crucial dimensionless parameter used to determine whether a flow is laminar or turbulent. The Re calculation formula is shown in the following (6):
R e = ρ ν d μ
where ρ is fluid density, ν is the average velocity of the fluid in the channel, d is the channel diameter, and μ is the dynamic viscosity.
To validate the accuracy of the numerical methods employed in this study, we simulated the two-dimensional sudden expansion–contraction channel experiment reported by Liquan Y et al. [28]. The results demonstrate that as the Re increases, the numerical solutions evolve from periodic and multiple periodic solutions to chaotic solutions. This confirms that our numerical methodology can effectively investigate flow regimes within sudden expansion–contraction channels.

3. Grid Division and Condition

3.1. Grid-Independent Verification

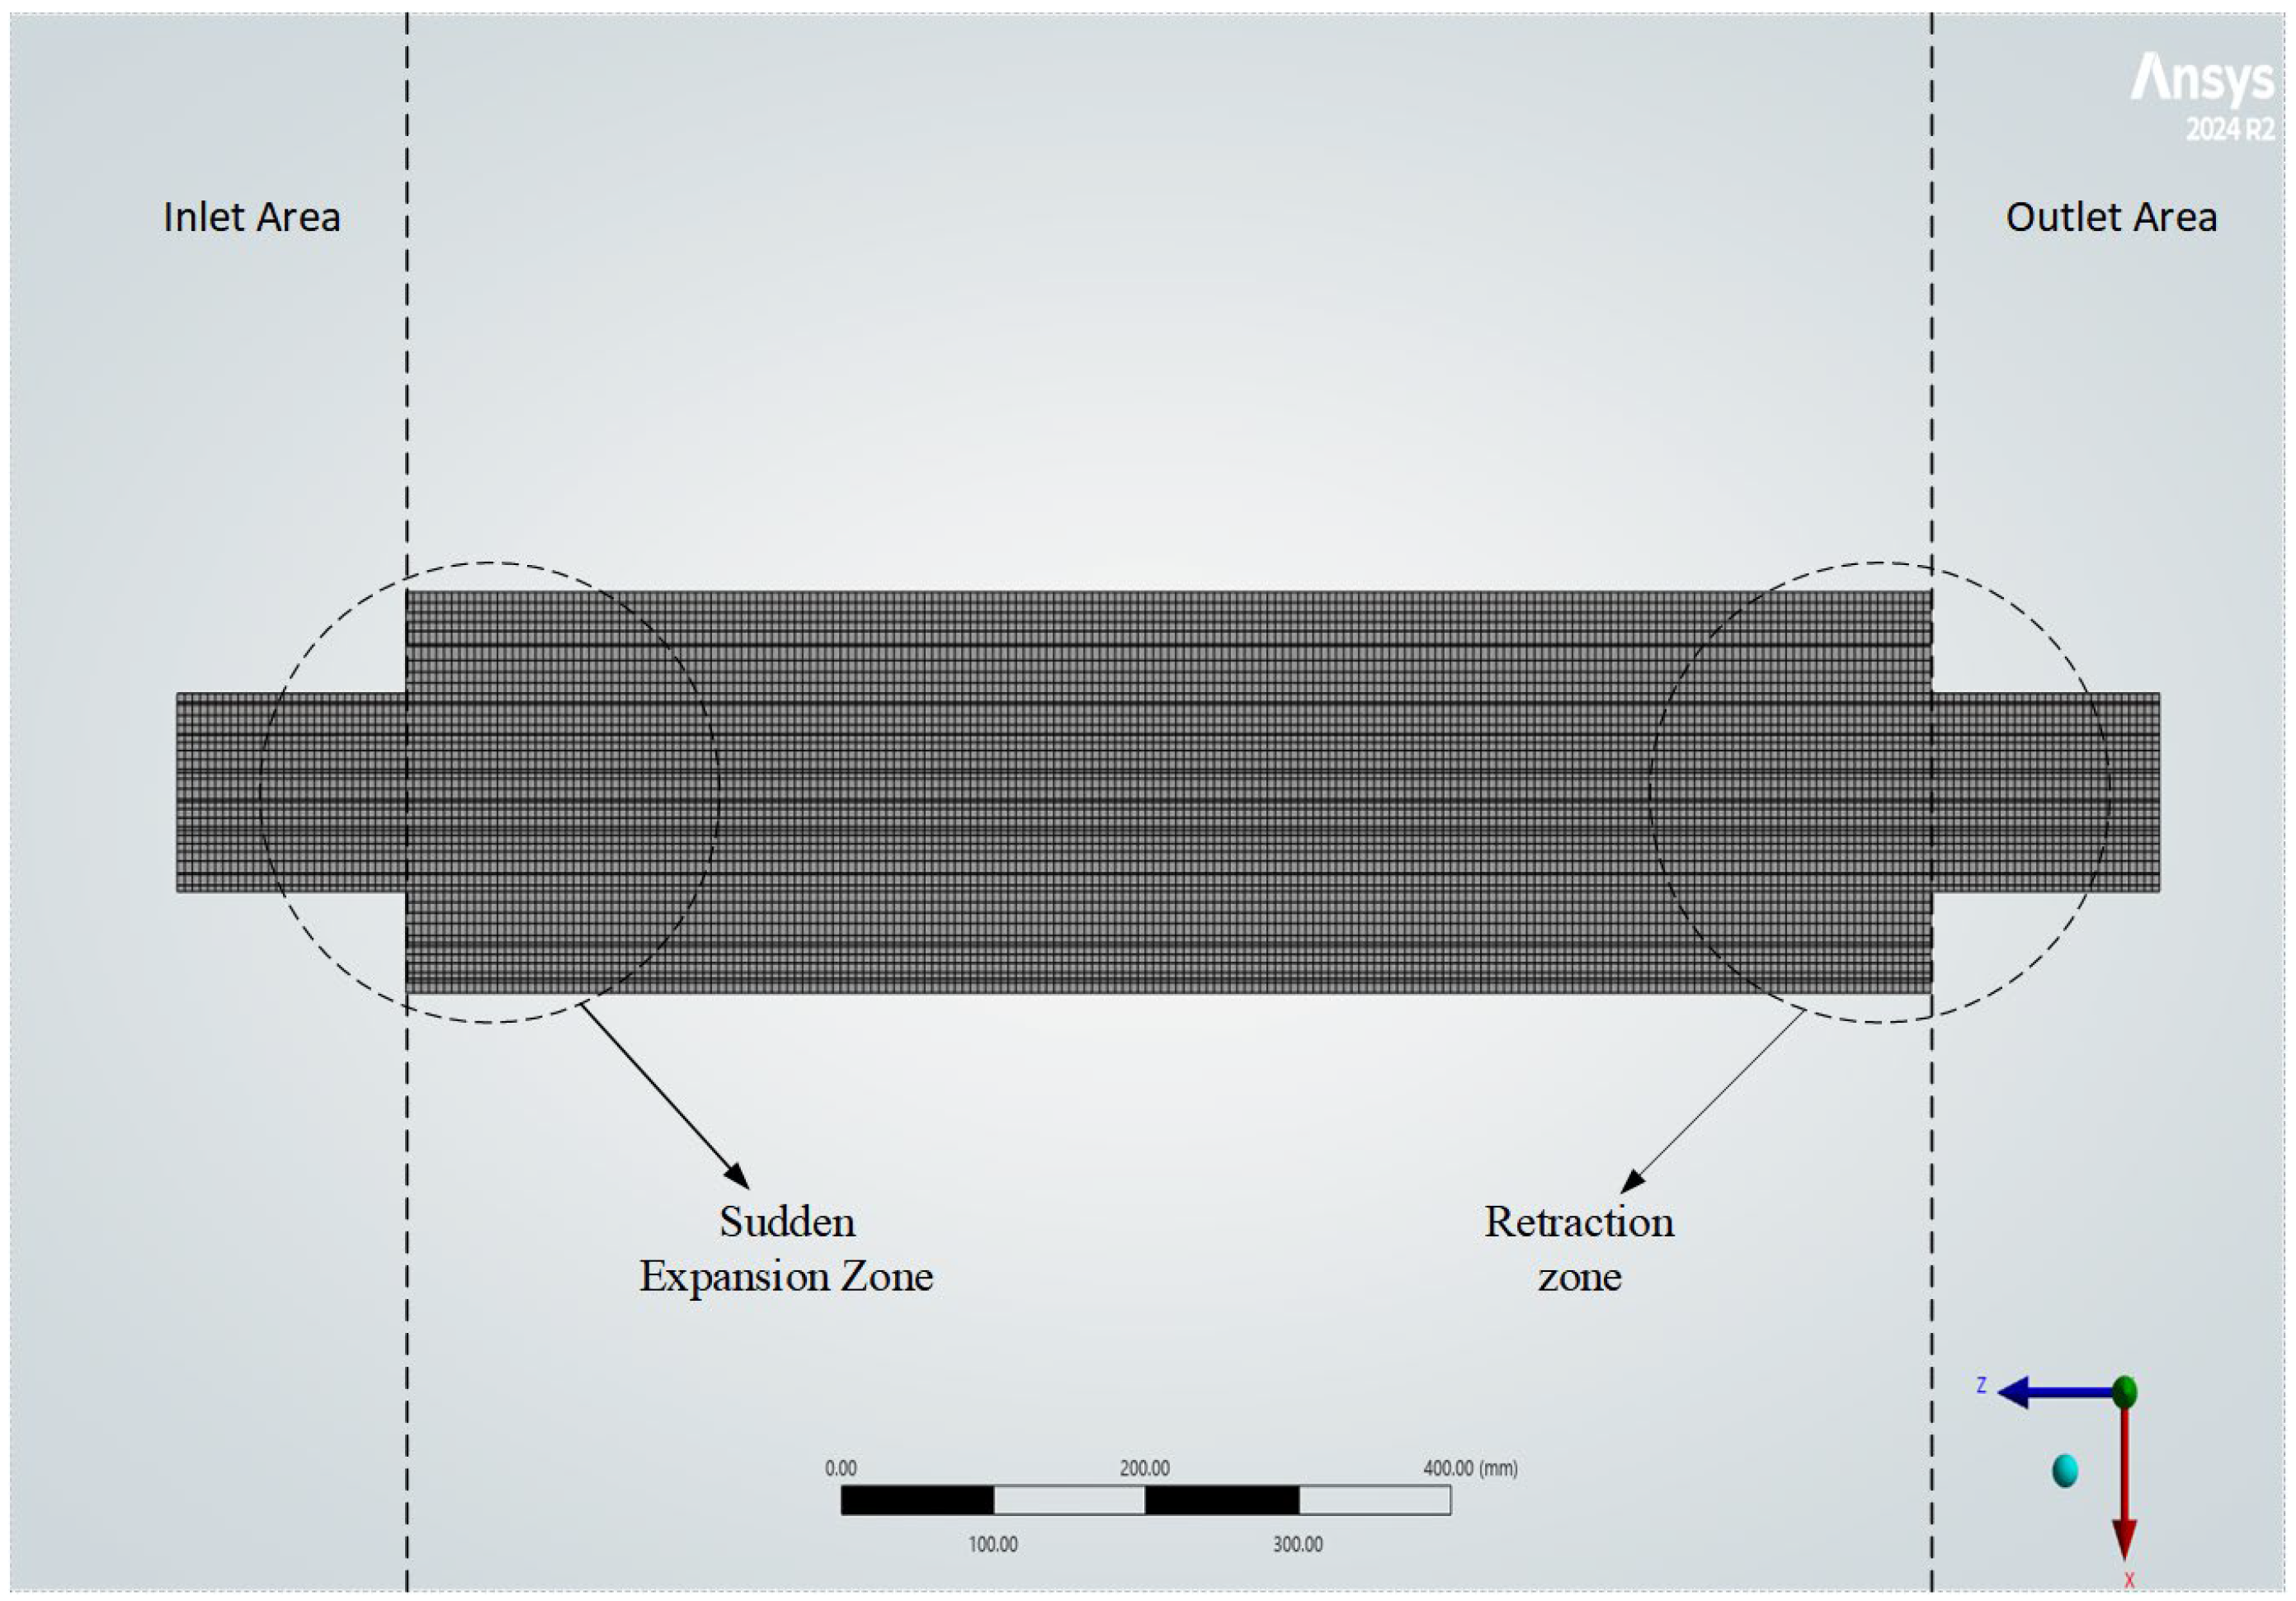
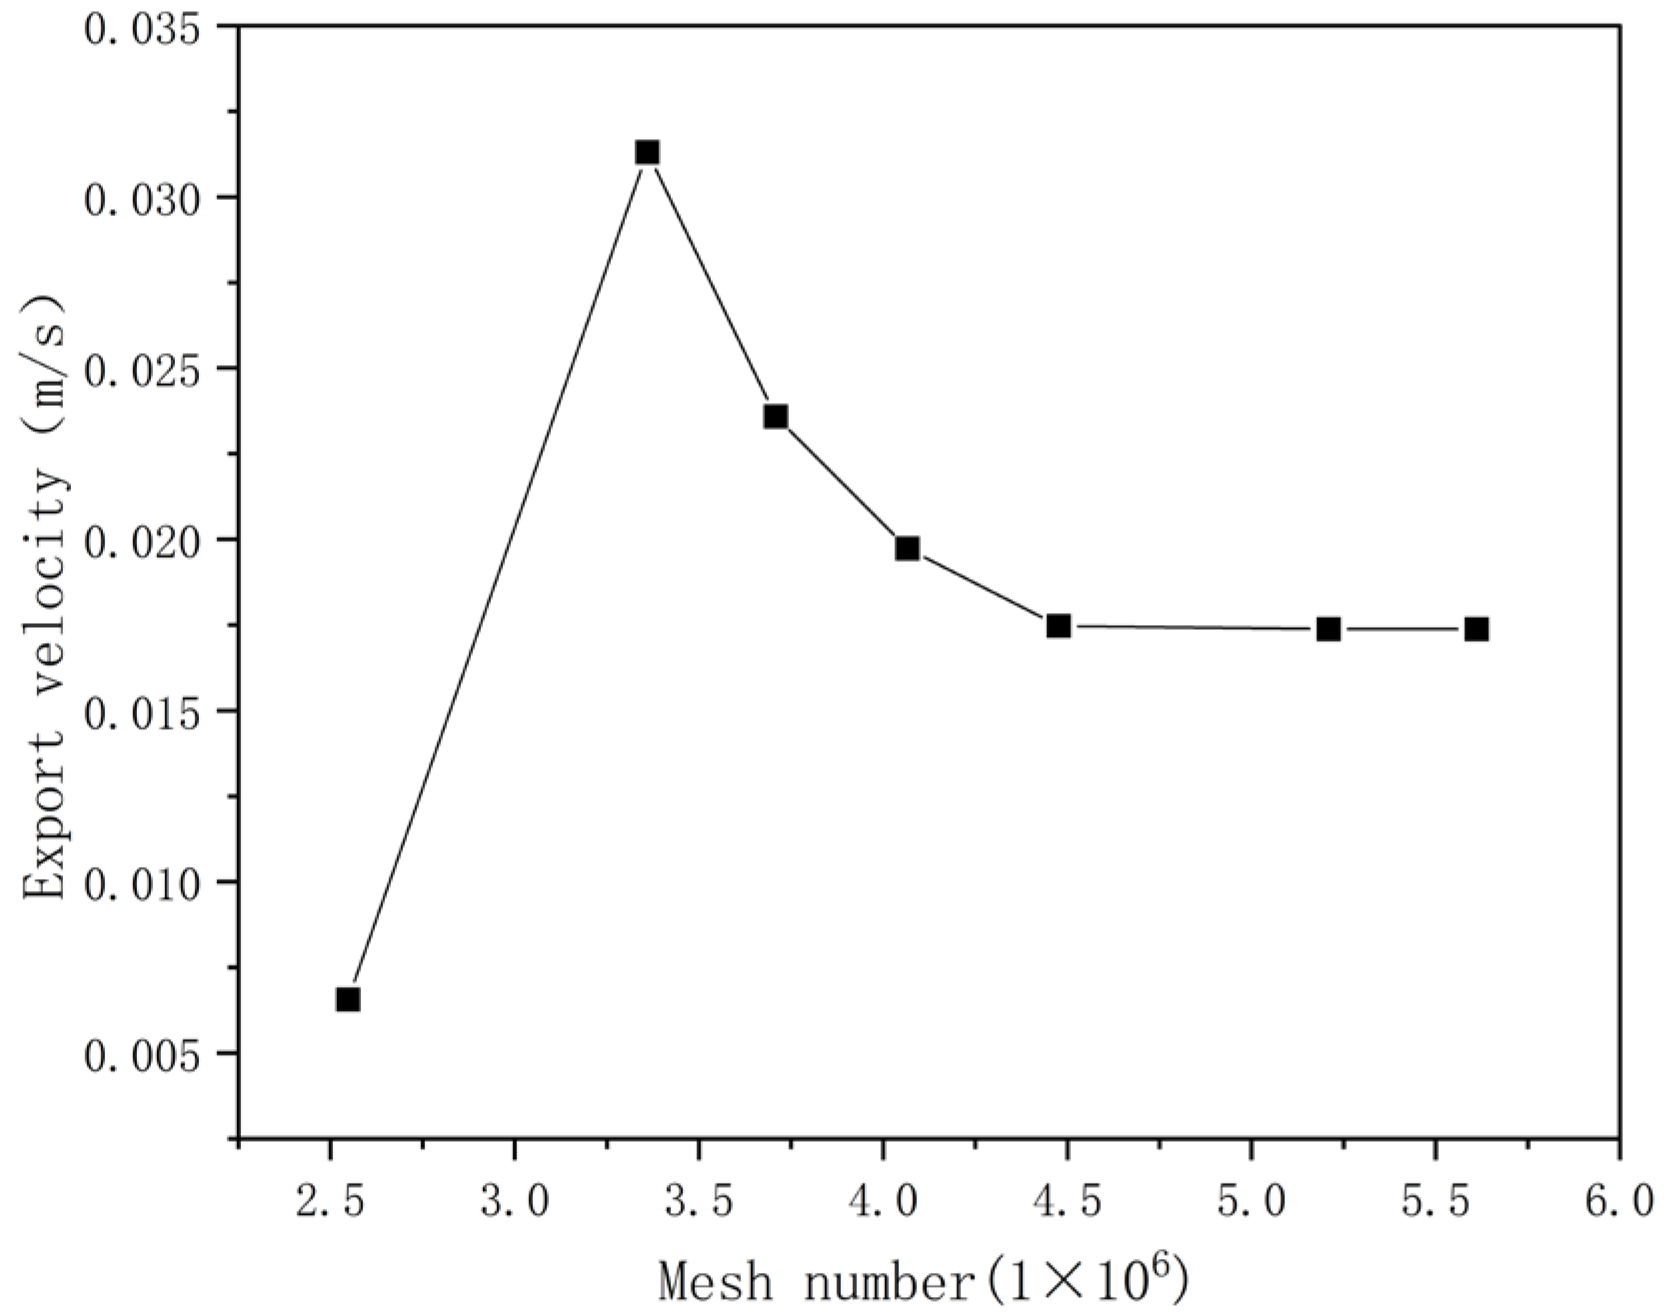
In numerical simulation, the quality of the computational grid is typically assessed by cell skewness and aspect ratio, both of which must be minimized. The computational domain grid is modeled, as illustrated in Figure 3. The average skewness in the grids used in this study is 0.085, with 95% of the grids having a skewness less than 0.7; the average aspect ratio is 4, with 95% of the grids having an aspect ratio less than 5, and the cell mass averages 0.86. The selected model was subjected to a proper near-wall treatment to capture the boundary layer region—Figure 3: Grid modelling for watersheds. The areas corresponding to each section of the grid are shown in Figure 4, for the number of grids 2.5 × 10⁶, 3 × 10⁶, 3.5 × 10⁶, 4 × 10⁶, 4.5 × 10⁶, 5 × 10⁶, 5.5 × 10⁶. Dividing the unstructured grid and verified by grid-independence, the exit velocity was used as the basis of judgment, and its calculation results are shown in Figure 5. When the number of grids was around 4.47 million, the trend of exit velocity tended to stabilize and was no longer affected by the number of grids, so the number of grid divisions was determined to be 4.47 million.

3.2. Boundary Conditions

All numerical simulations presented in this work were performed using a commercial finite-volume-based CFD solver, ANSYS Fluent (version 2024 R2). For the study on the three-dimensional fluid flow in the sudden expansion–contraction channel, a transient model was adopted to solve the entire flow field within the channel. The computational domain was divided using a structured mesh to ensure grid uniformity. The volume-of-fluid (VOF) multiphase model was employed, with LN2 and air as the two working fluids. The coupled algorithm was utilized to process the velocity–pressure coupling. All simulation calculations were performed using fluid simulation software (Fluent 2024 R2). The inlet boundary condition of the computational model is a velocity inlet with an inlet wall temperature of 77 K, and the turbulence intensity is 5%, and the hydraulic diameter = h1. The initial volume fraction of LN2 is 0.5, with the outlet boundary condition prescribed as a pressure outlet and the wall temperature set at 300 K. All boundary conditions are listed in Table 2. Numerical simulations are performed for the computational sudden expansion–contraction channel model defined by ER = 2 and AR = 10.

4. Analysis and Results

4.1. Flow Characteristics of the Sudden Expansion–Contraction Channel in Different Re

4.1.1. Analysis of Fluid Flow Under Different Re

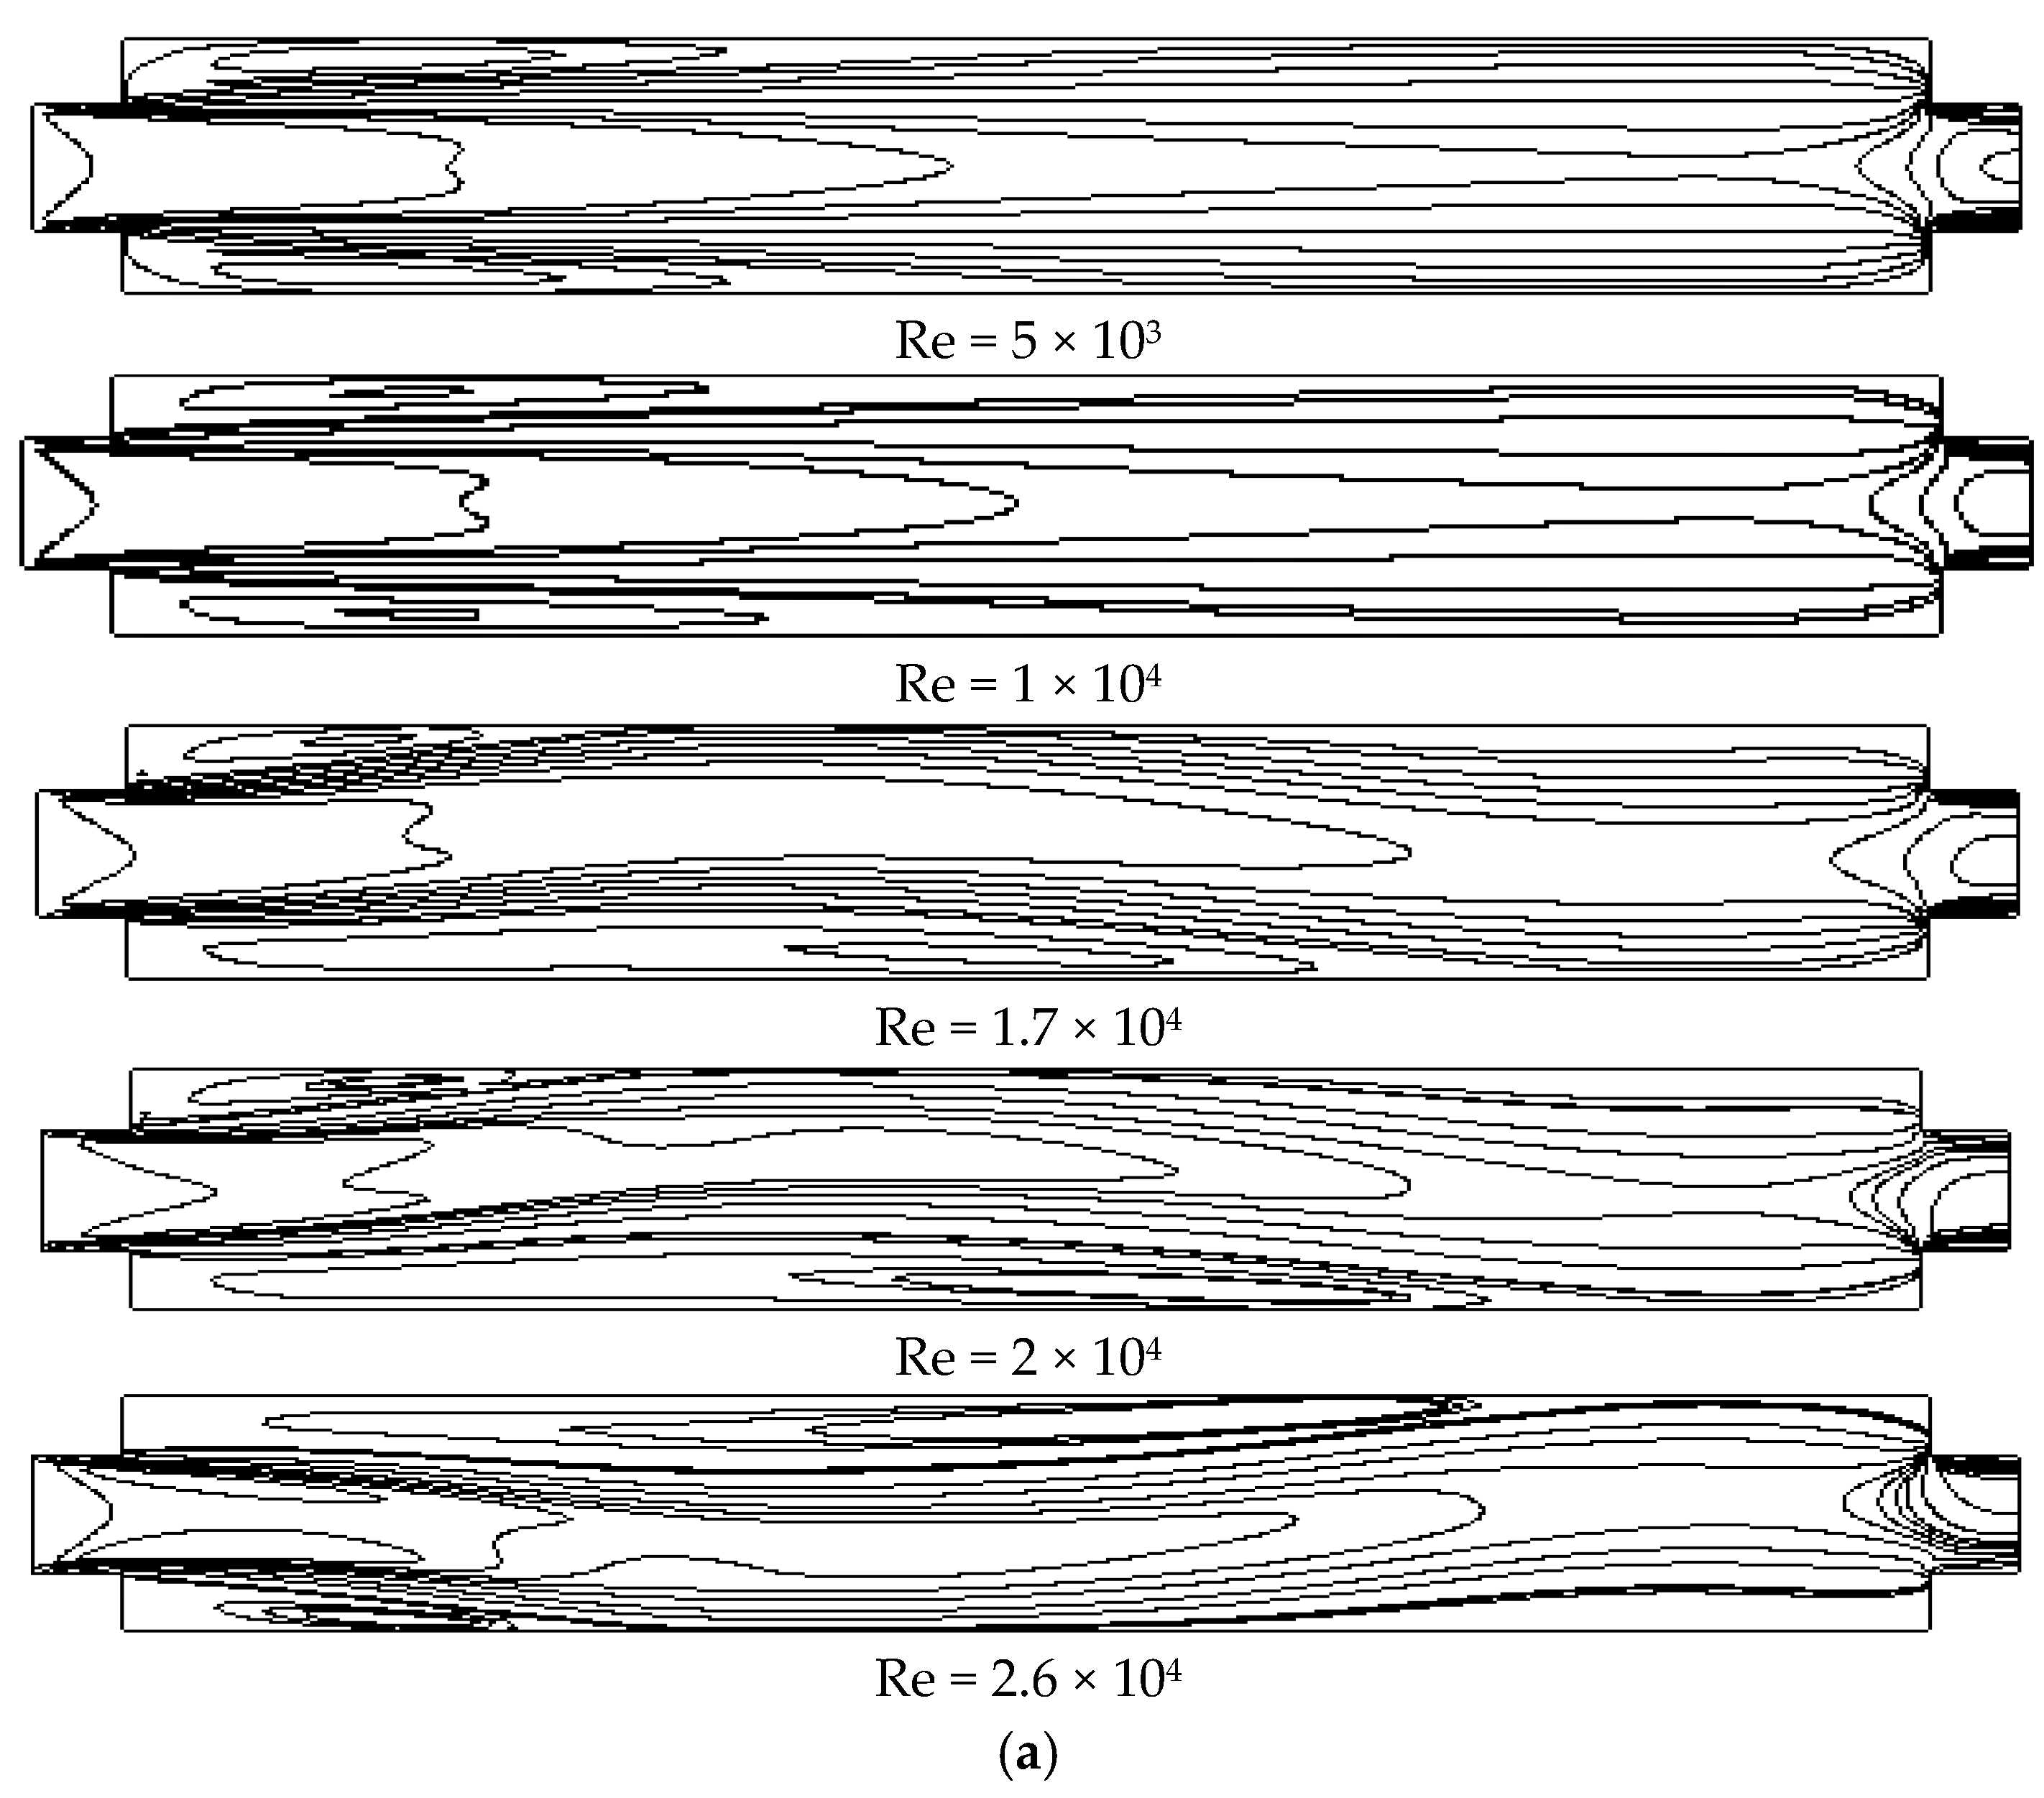
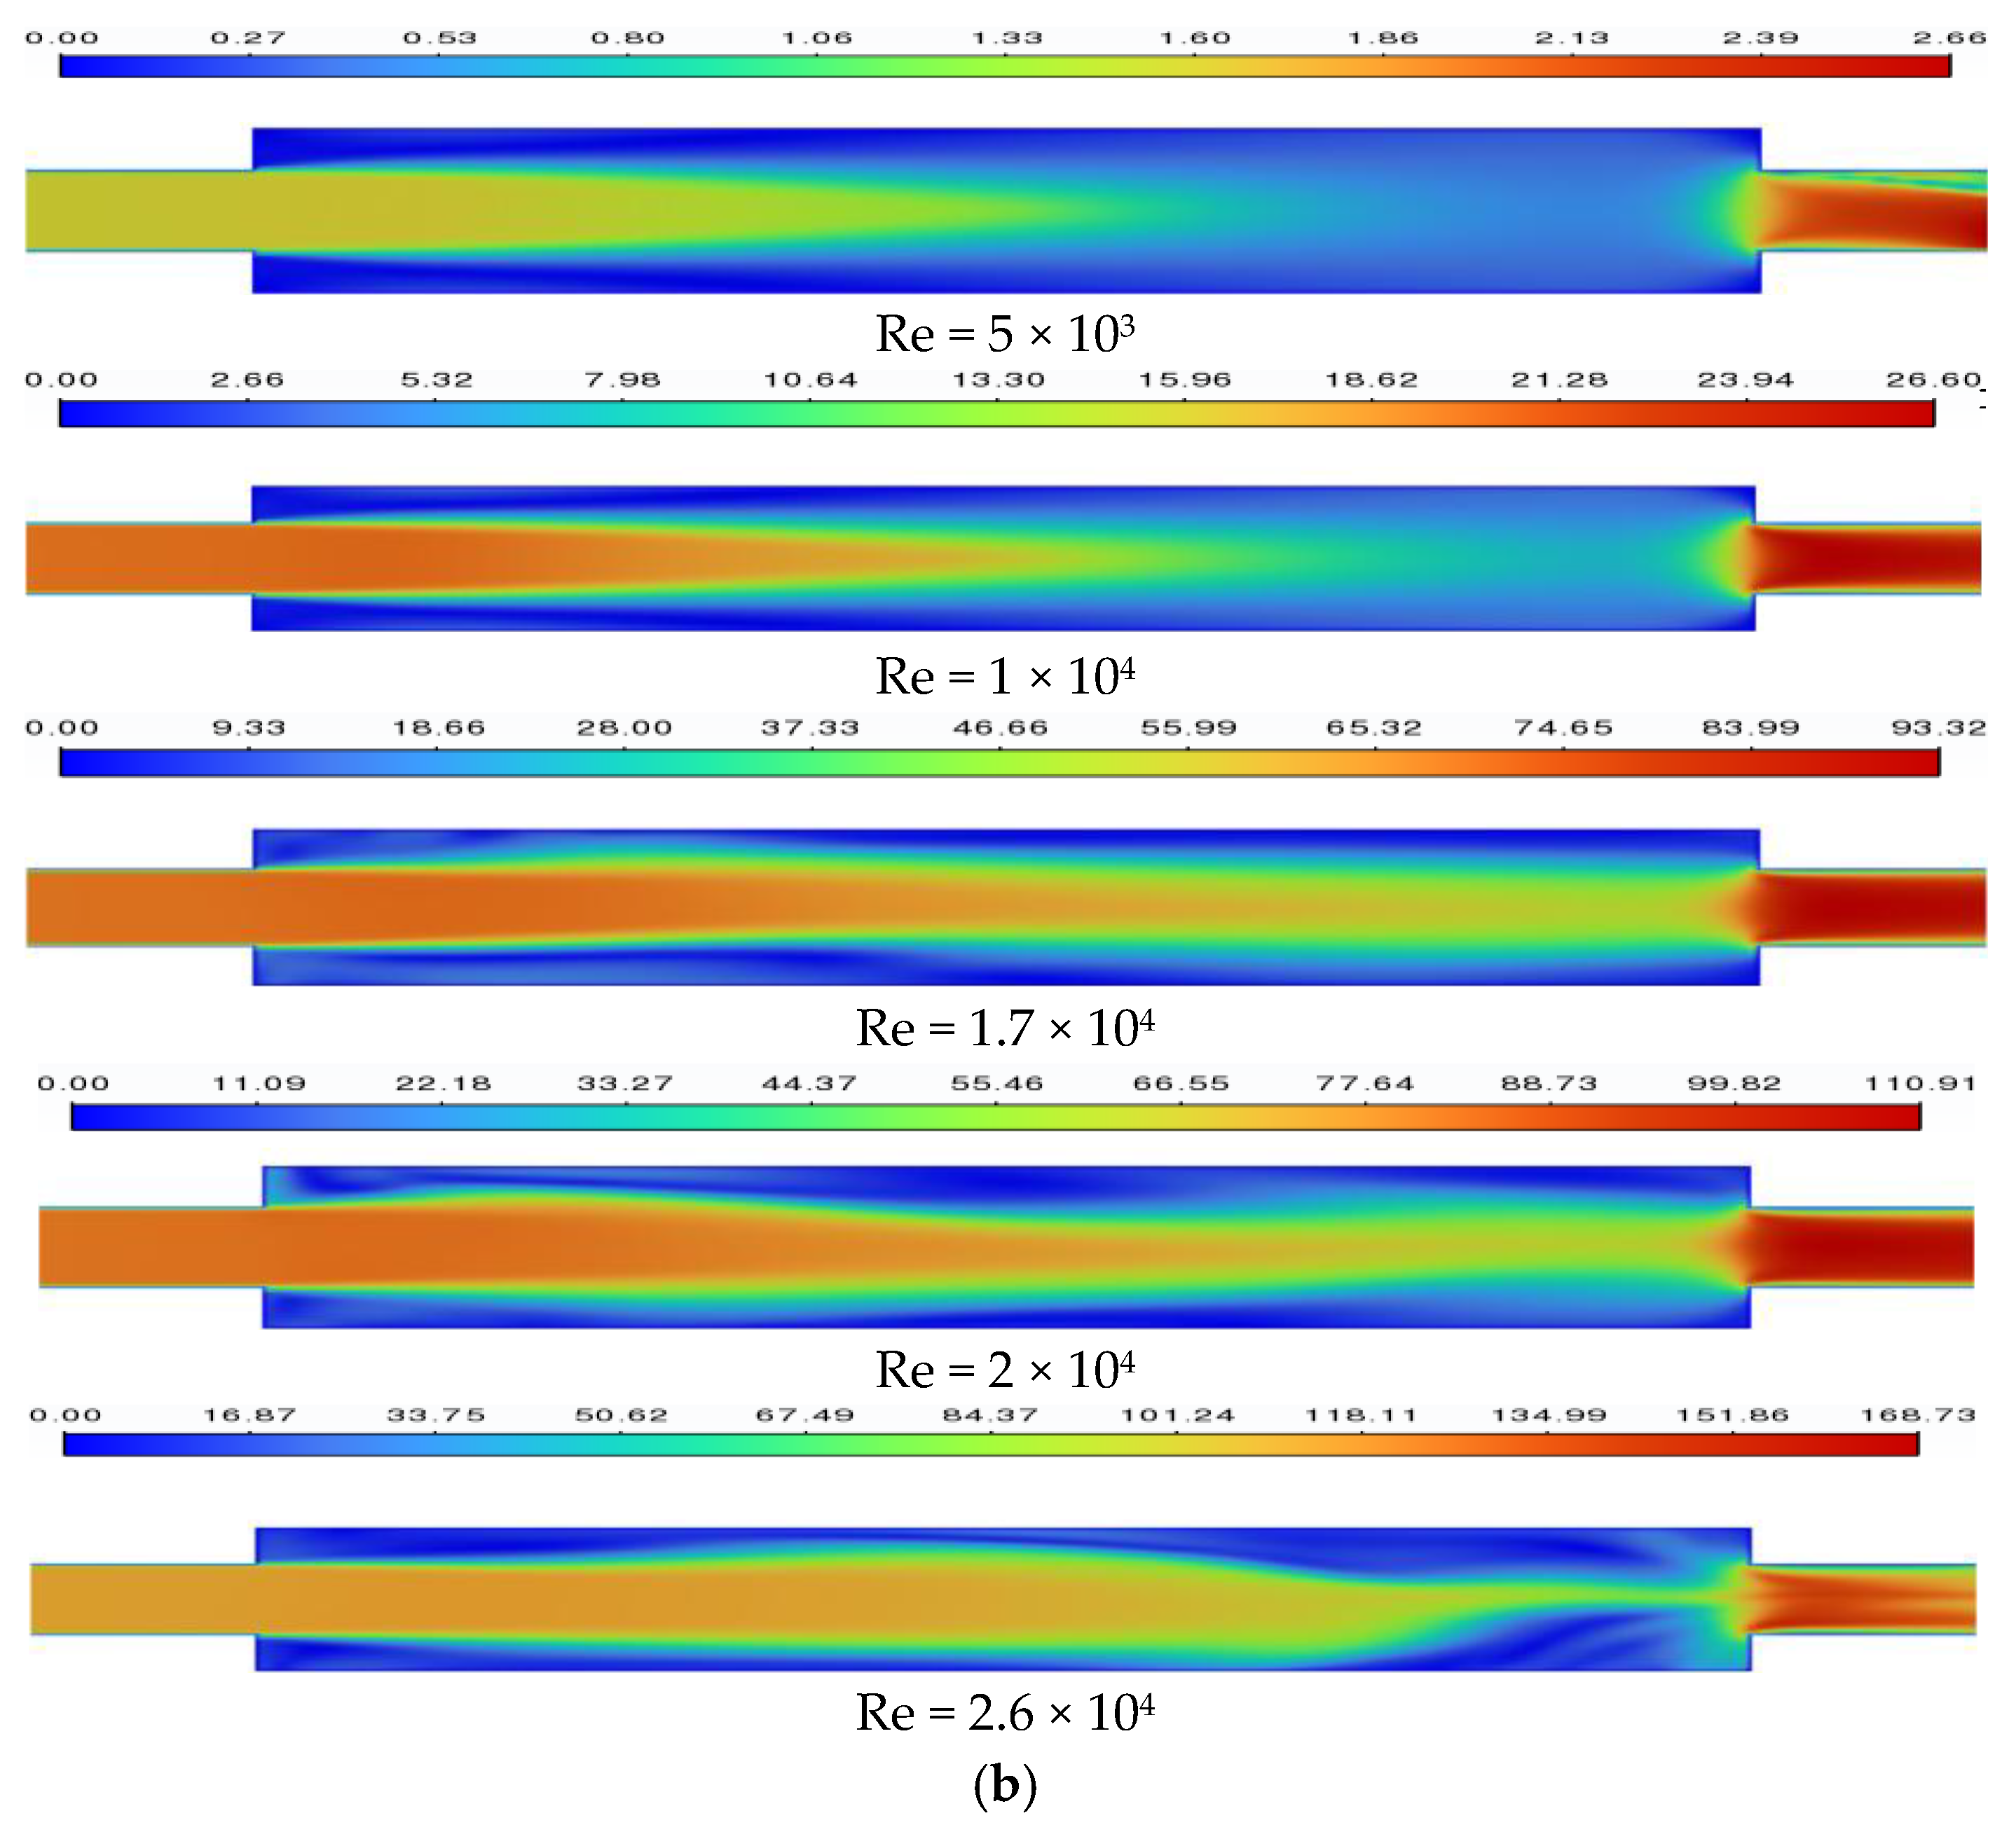
This paper analyzes the fluid flow in a sudden expansion–contraction channel under different Re. When the Re is below 1.7 × 10⁴, the flow field exhibits a steady state under symmetry constraints, as indicated by the streamlines and velocity contour lines at Re = 5 × 10³ and 1 × 10⁴. When the Re exceeds 1.7 × 10⁴, the flow field loses axisymmetry. Streamlines significantly deviate from the central axis and tend toward the wall, as shown in Figure 6 for Re = 1.7 × 10⁴ and 2 × 10⁴. This transition indicates the system undergoes the Hopf bifurcation, shifting from a steady-state solution to a periodically oscillating solution. The flow develops quasi-periodic structures with definite frequencies.
When increasing the Re beyond 2.5 × 10⁴, the fluid flow evolves into a highly disordered state, as depicted in Figure 6 for Re = 2.6 × 10⁴. At this point, both the velocity distribution and streamline structure lose spatial coherence, exhibiting the typical characteristics of chaotic solutions. This indicates that the system has entered a chaotic state through further bifurcations. As Re increases, the flow exhibits nonlinear behavior.
Set up monitoring points at the midpoint of the channel to detect velocity changes at different Re. The specific locations of the monitoring points are shown in Figure 7. The monitoring point is situated within the core region of the dominant vortex dynamics. It is also isolated from disruptive boundary effects.
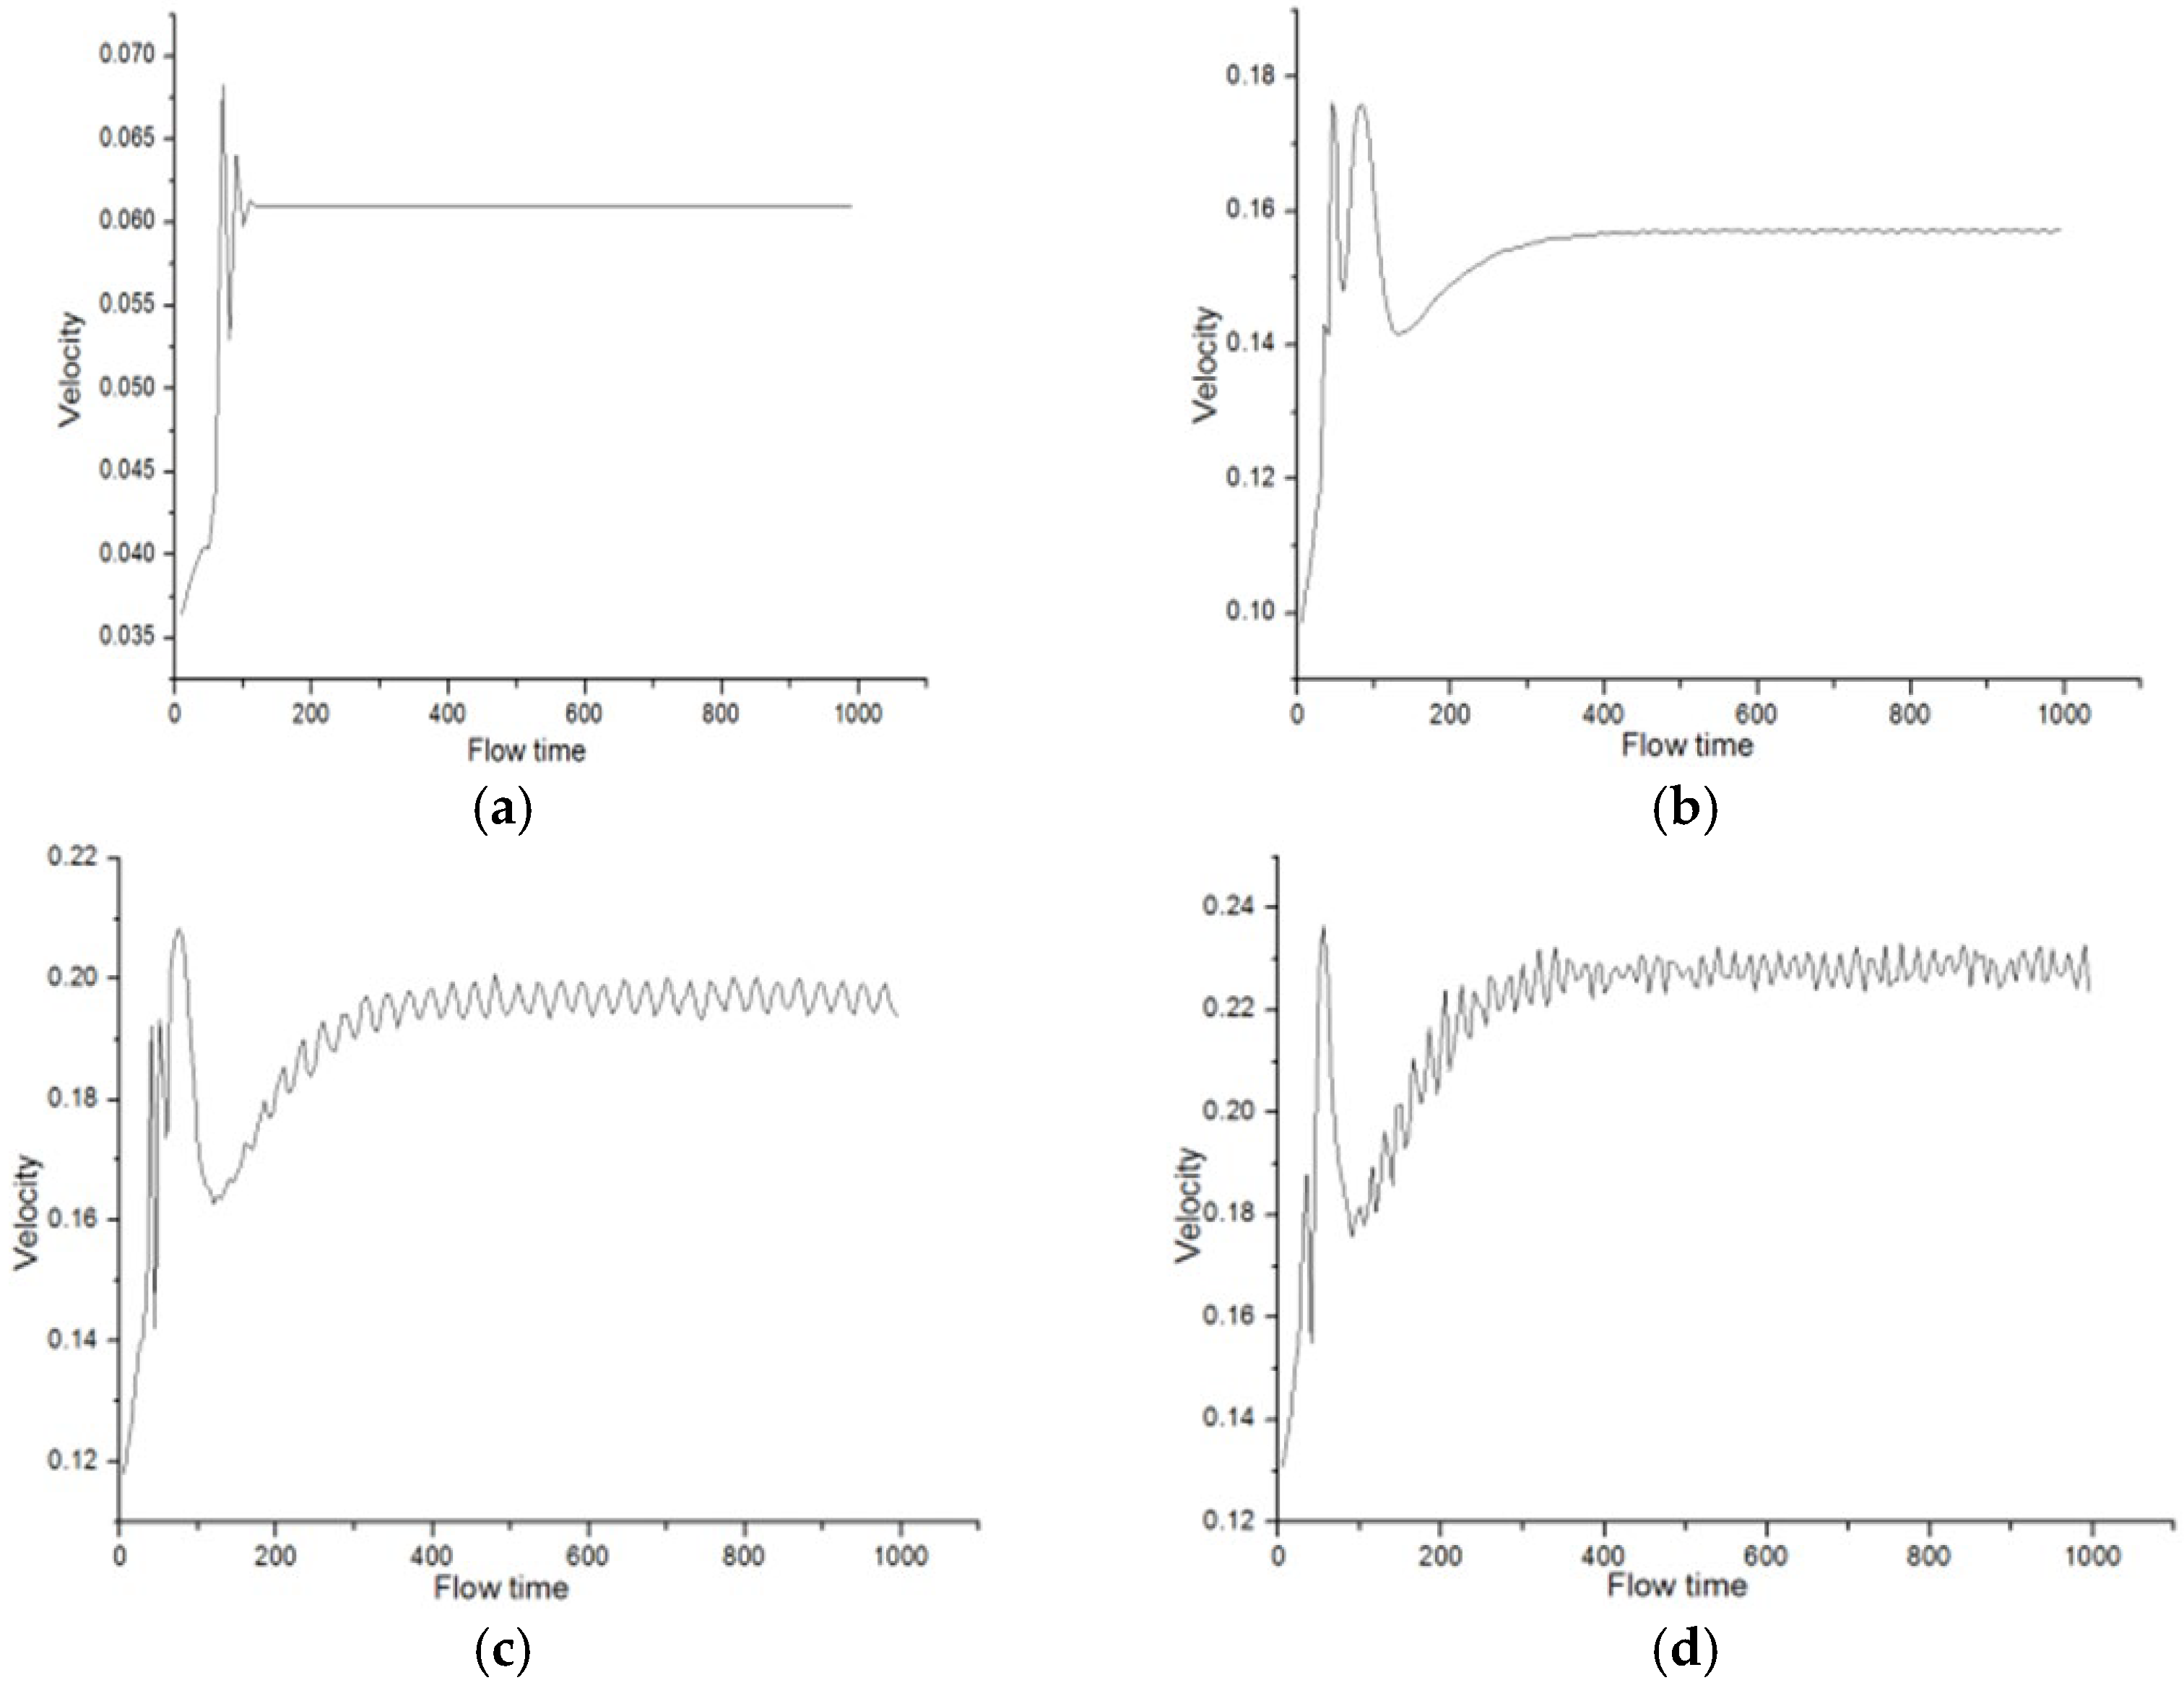
Streamline diagrams and velocity contour lines at different Re reveal distinct flow states. These flow phenomena reflect the characteristics of the fluid. Therefore, monitoring points were established to track velocity changes at these points under varying Re. Under specific structural parameters, the velocity–time curve in Figure 8 exhibits pronounced variations with Re. At Re = 5 × 10³, velocity rapidly stabilizes to a constant value. At Re = 1.5 × 10⁴, the velocity exhibits minor fluctuations and a gradual evolution toward periodic deviation. At Re = 2 × 10⁴, the monitoring point corresponds to the onset of significant velocity oscillations. Compared to fluctuations observed at earlier Re values, a marked increase in the amplitude of velocity oscillations is observed. Over time, the stability of the velocity monitoring point is compromised; oscillations persist. As Re continued to increase, reaching Re = 2.6 × 10⁴, the velocity monitoring point oscillated and gradually entered a chaotic state. The variation in velocity gradient across different Re values demonstrates the occurrence of nonlinear state transitions. Such changes can significantly alter the internal state of the system.
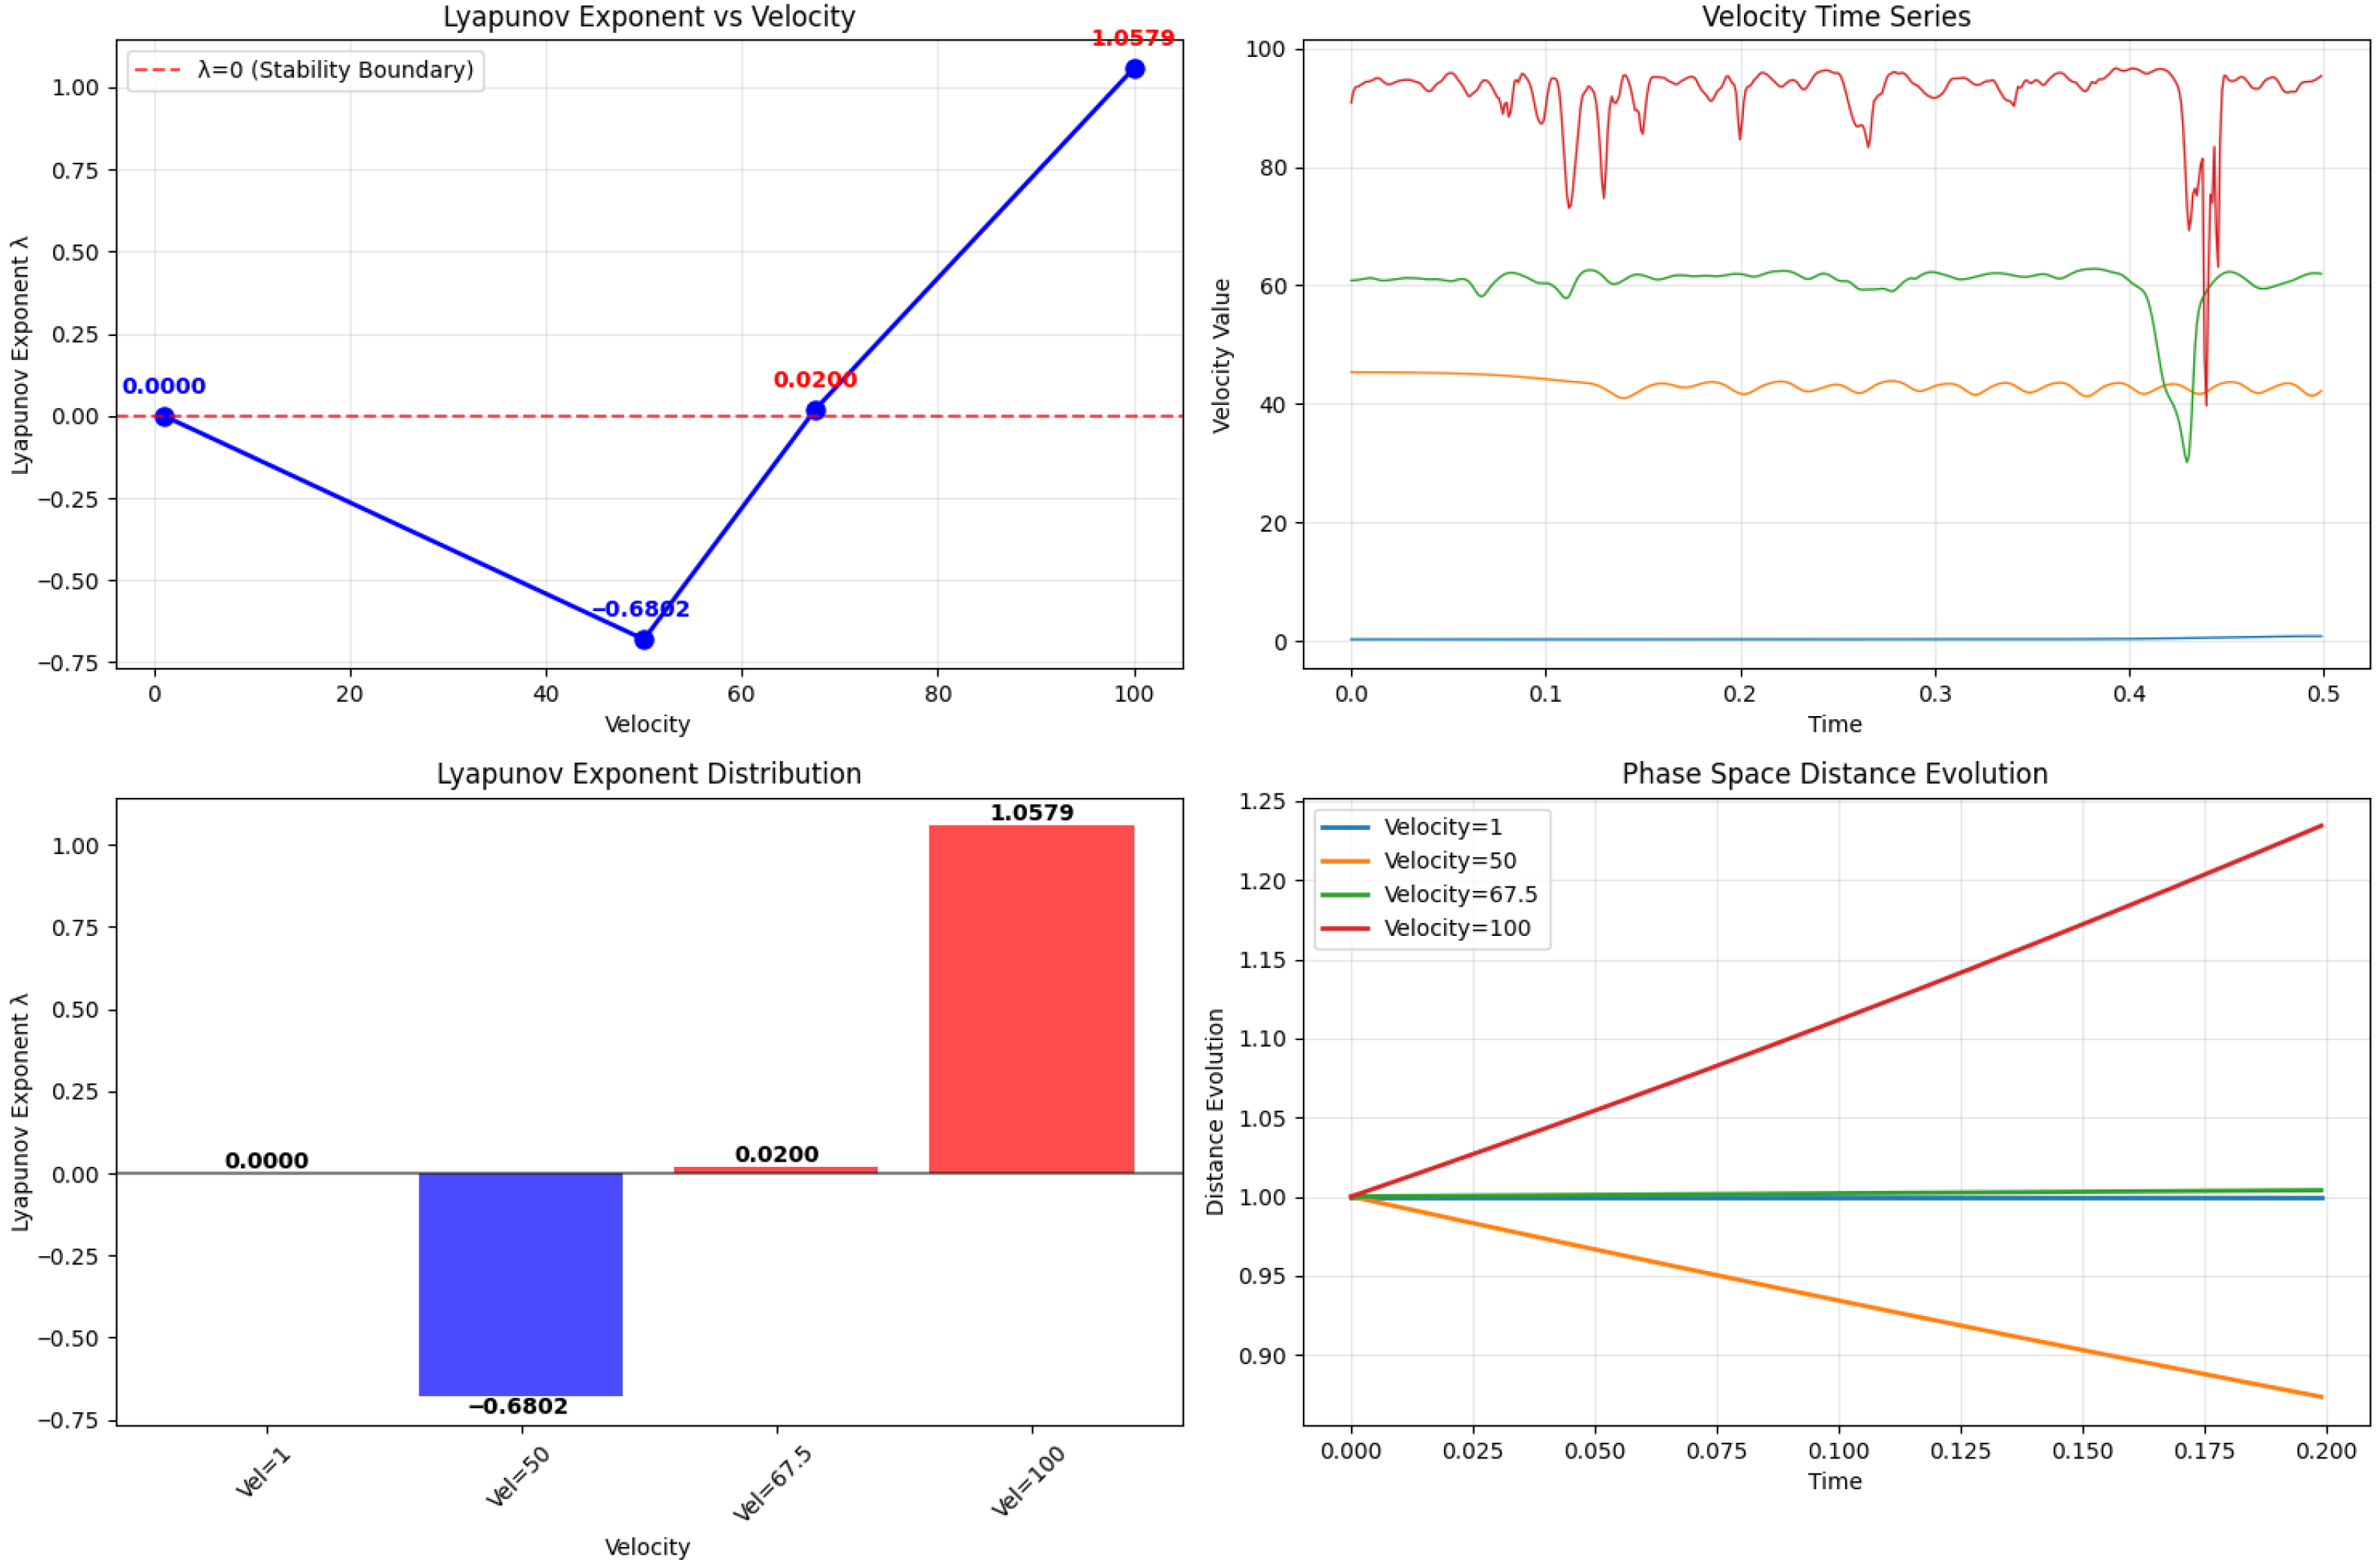
Lyapunov exponent analysis of velocity time series quantifies the divergence degree of neighboring trajectories in phase space, directly characterizing the flow field’s sensitivity to initial conditions. The Lyapunov exponent in Figure 9 clearly illustrates the state of the system under different Re. Analysis of the Lyapunov exponent confirms system stability at a velocity of 1 m/s, where the exponent value approaches zero. As the input speed increases further, the exponent becomes negative, indicating that the system has entered a quasi-stable periodic state. However, when the speed exceeds the critical threshold, the exponent turns positive, indicating that the system state has entered chaos. In the Lyapunov exponent distribution, blue indicates the system is approaching a stable state, while red signifies the system has entered a chaos.

4.1.2. Evolution of Fluid Temperature Under Different Re

The evolution of the fluid temperature field with increasing Re, detailed in Figure 10, demonstrates that the underlying flow state dynamically governs heat transfer in the sudden expansion–contraction channel. At Re below 1.6 × 10 4 , the temperature distribution maintains symmetry and kinematic constraints, leading to consistent and stable thermal exchange with the walls. As Re increases, the fluid flow undergoes the Hopf bifurcation, entering a periodic oscillatory. This instability disrupts the thermal boundary layer and introduces alternating flow deflections, which periodically shift the core cooling region and cause the temperature field to exhibit bistable upward and downward patterns. Heat removal is dominated by the periodic advection of large-scale coherent structures, which enhance local convective heat flux in an oscillatory manner at Re = 2.0 × 10⁴. When Re exceeds 2.6 × 10⁴, the transition to chaos destroys all spatial and temporal coherence in the temperature field. The evolution of temperature and the flow state transition process exhibit consistent patterns. These nonlinear hydrodynamic instabilities directly dictate both the macroscopic thermal patterns and the localized wall–fluid heat exchange mechanisms.
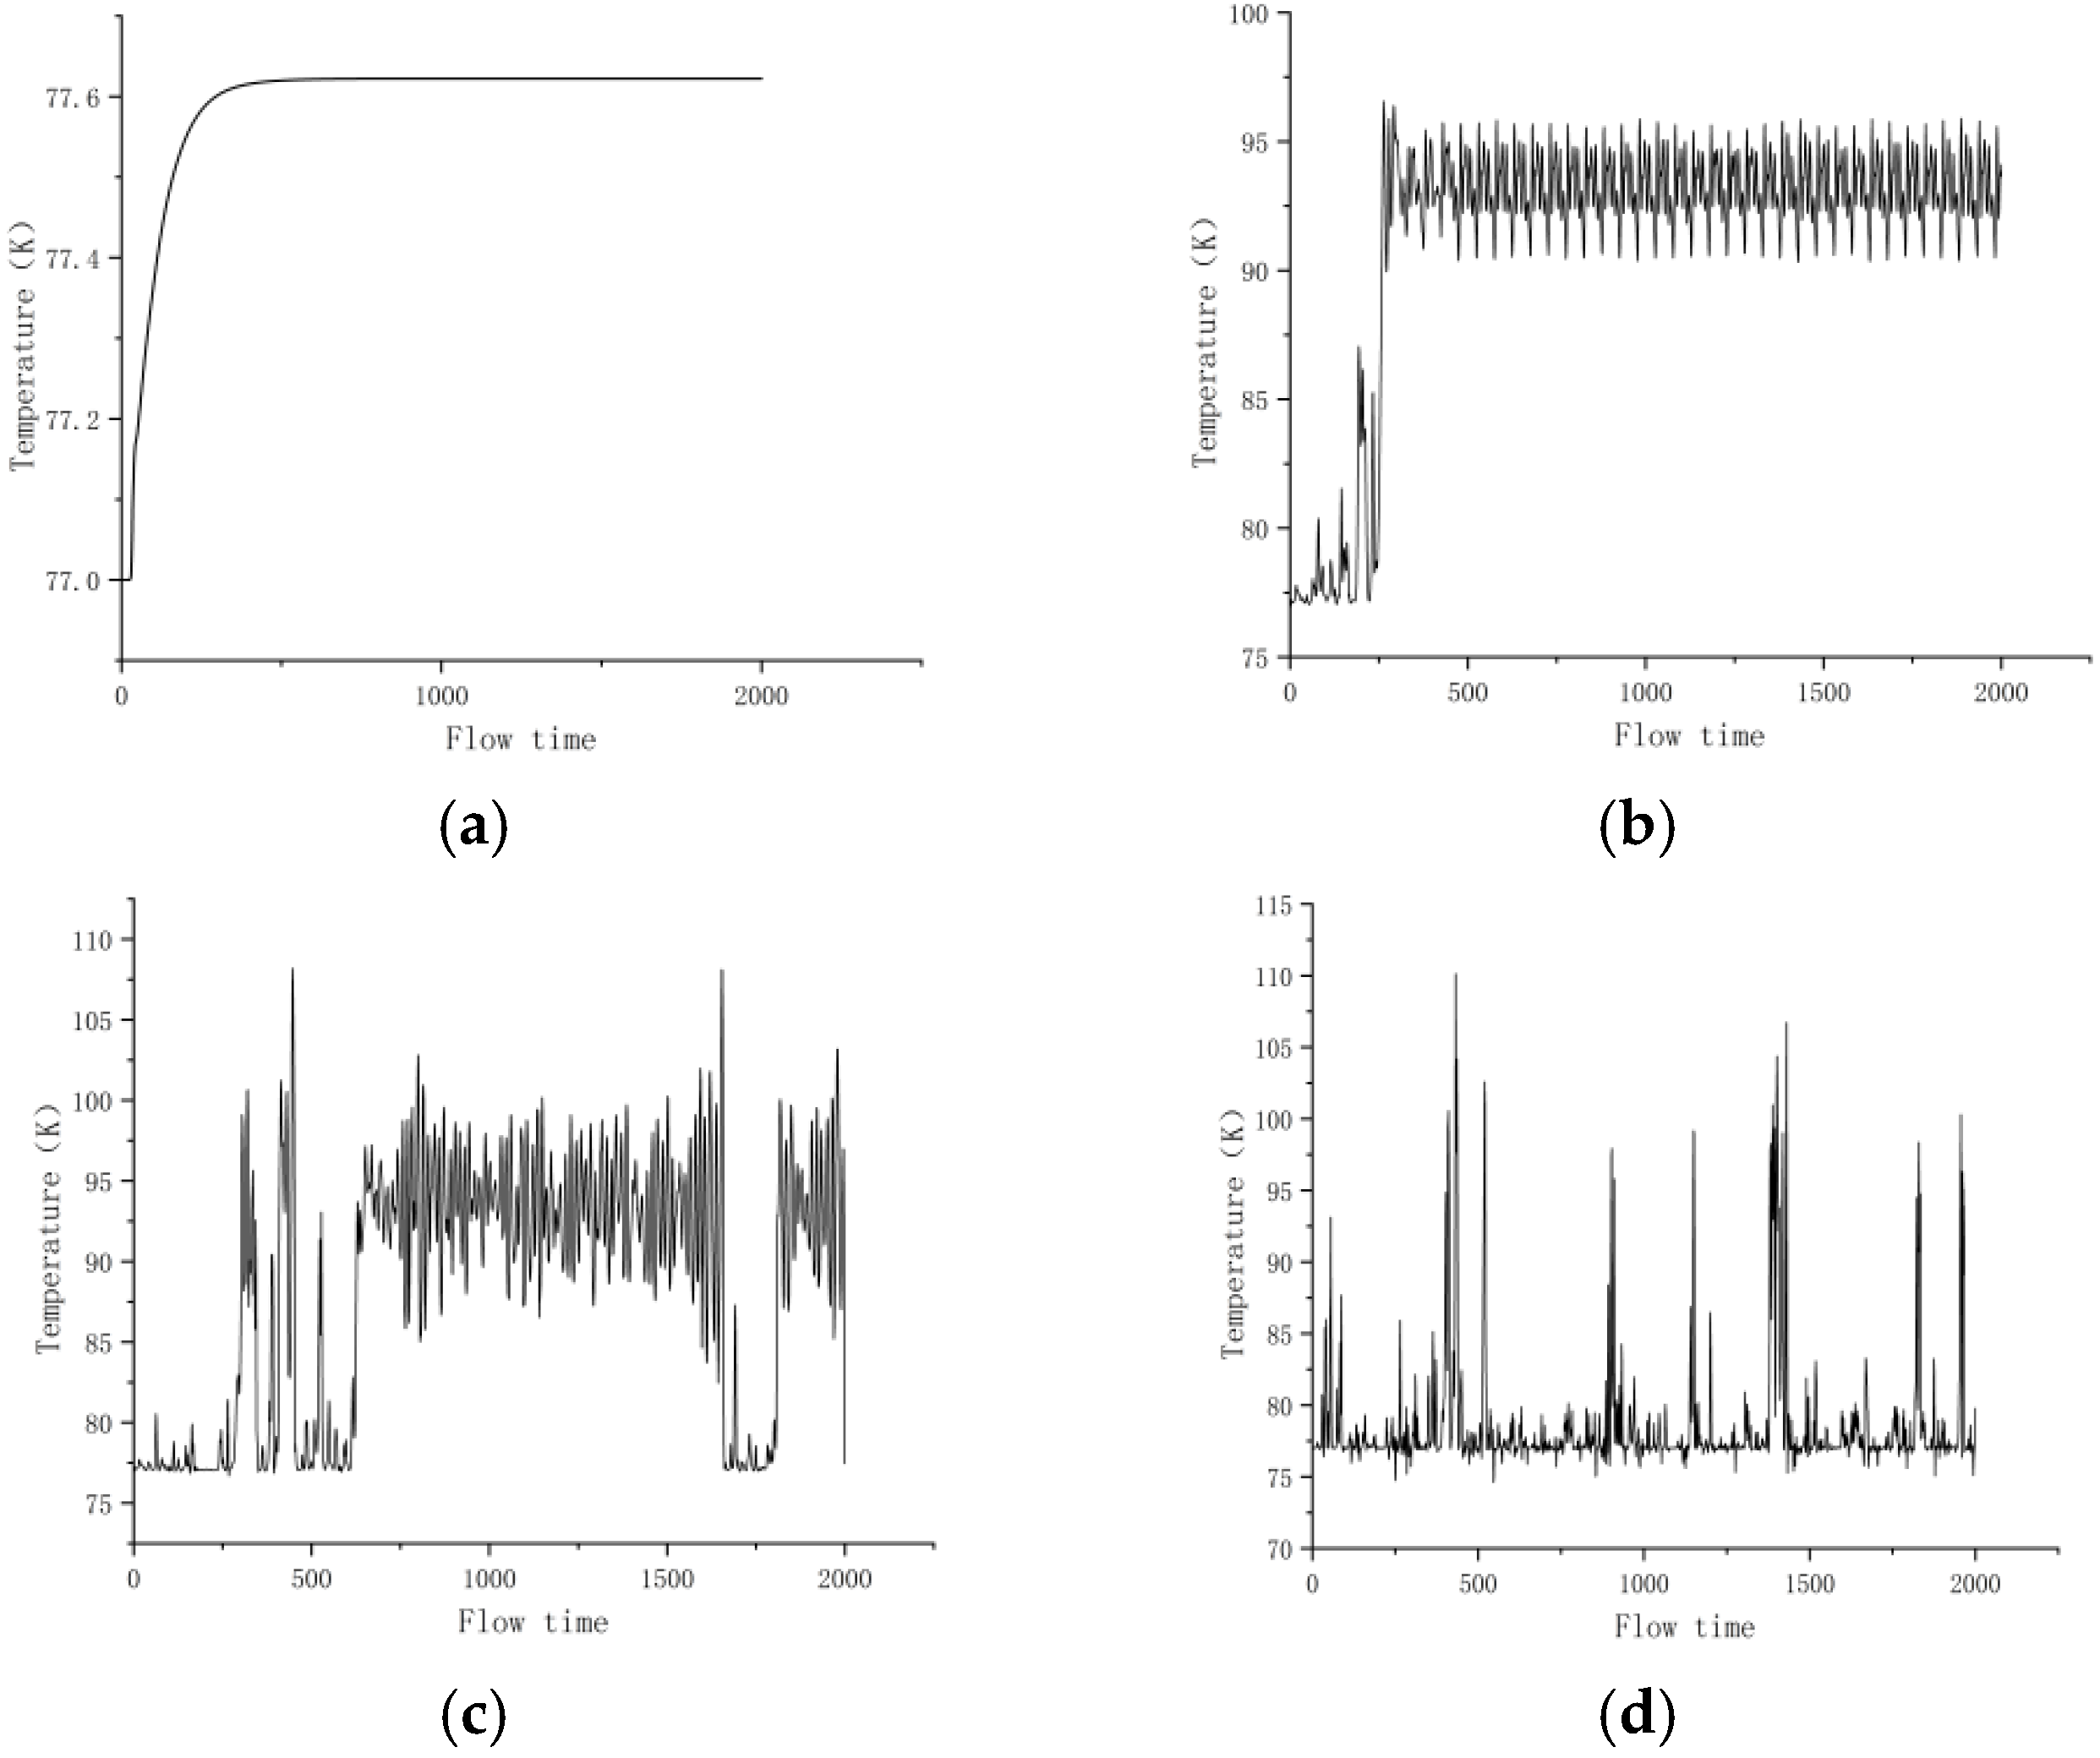
The transformation of the quantified temperature field under different Re is shown in Figure 11. The amplitude quantification of temperature fluctuations reveals a clear correlation with flow conditions. Under stable flow at Re = 5 × 10³ (approximately 0.6 K), the temperature field is centrally symmetric with respect to the geometric structure. Transitioning to periodic flow induces coherent temperature oscillations with amplitudes around 7 K. This indicates heat transfer is now governed by periodic advection of large-scale vortex structures. As Re approaches 2.6 × 10⁴, periodic behavior collapses. The temperature signal exhibits fully developed chaotic broad-spectrum characteristics, with significant amplification of fluctuations. This evolution from weak fluctuations to regular oscillations and, ultimately, chaotic dynamics conclusively demonstrates that internal heat transfer undergoes a parallel transition driven by underlying fluid-dynamic instabilities.

4.2. Analysis of Fluid Flow with Different Structural Parameters

4.2.1. Fluid Flow of the Expansion–Contraction Channel with the Different ER

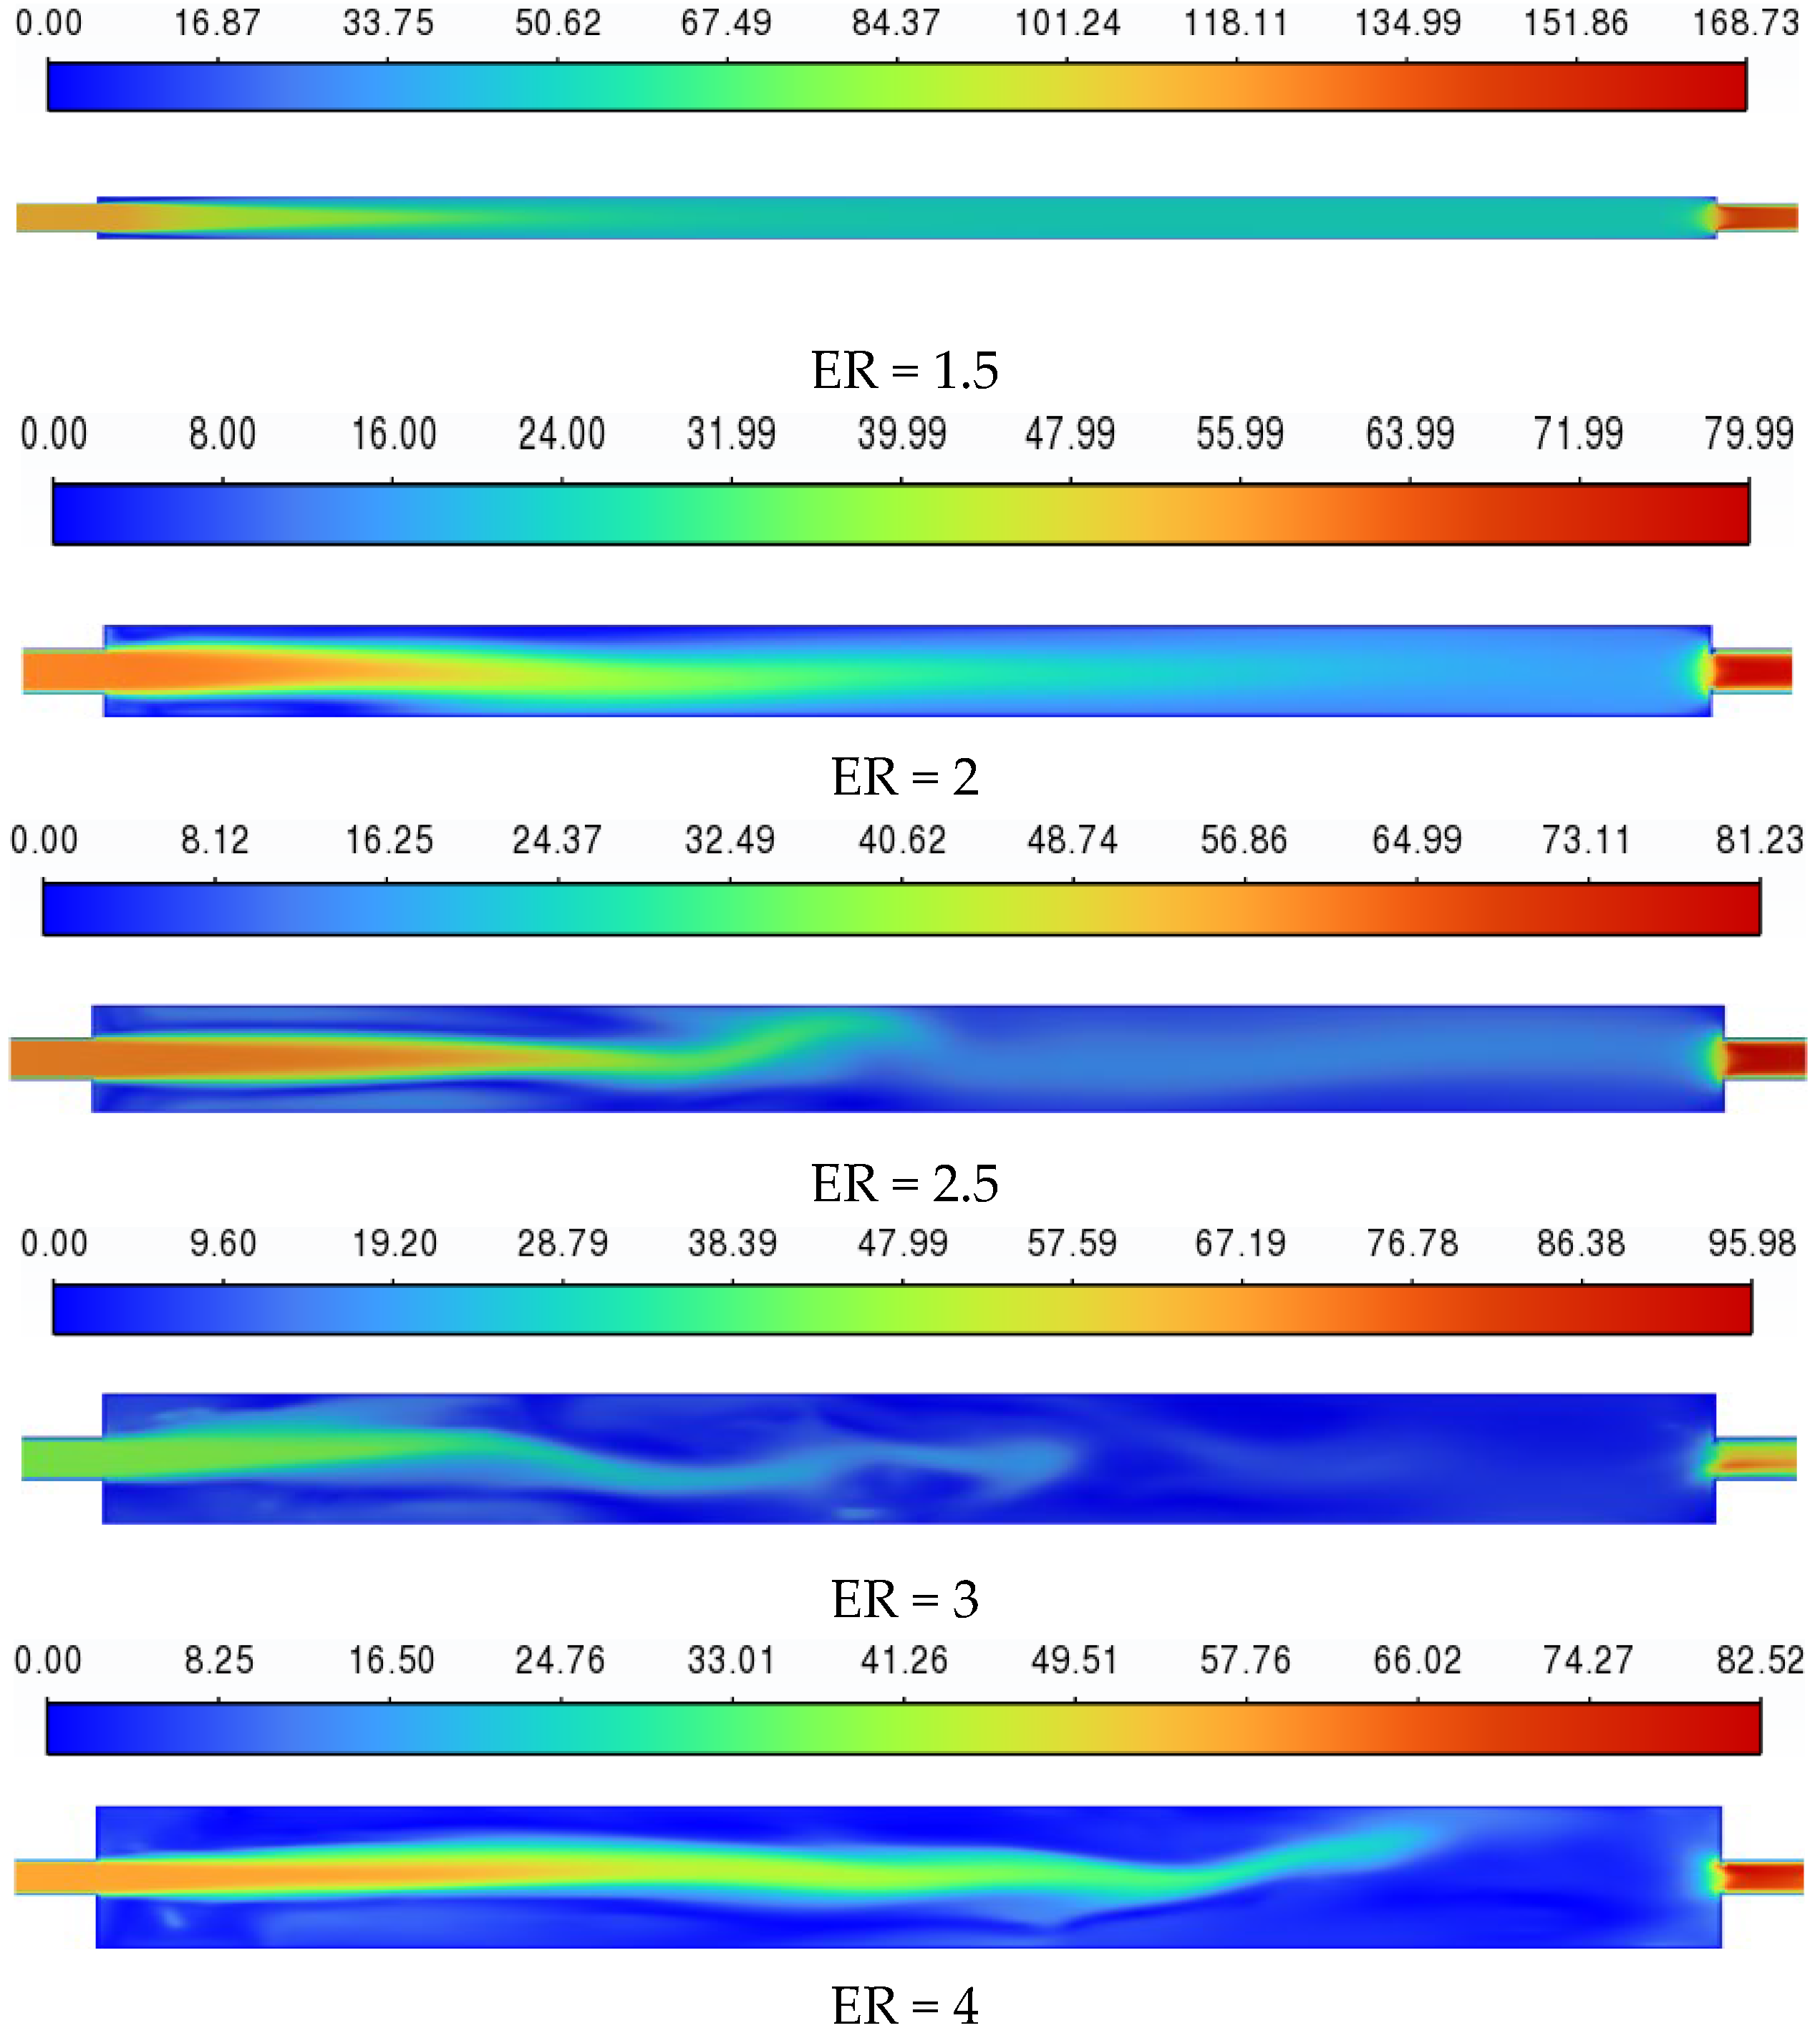
The study above analyzed the effects of varying Re on flow and heat transfer, and the changes in channel structural parameters (e.g., at varying ER, AR = 30) will influence the critical conditions for flow transition. The flow state under different structural parameters (channel expansion ratio ER) is shown in Figure 12. The flow state of fluid within the channel becomes increasingly intense as ER increases. Specifically, the ER increases the vertical oscillations of the fluid within the channel. At ER = 1.5, the flow is axisymmetric. As ER increases to 2, a distinct upward bias develops in the flow. Further increasing ER to 2.5 results in an alternating pattern between upward and downward biases. With subsequent increases in ER to 3 and 4, the amplitude of these vertical oscillations becomes more significant.
Under different Re, the fluid flow exhibits different states, with the Rec marking the transition from symmetric to asymmetric flow. Rec is the threshold at which the fluid flow transitions from a symmetric state to one where an asymmetric solution emerges. The flow state undergoes two transitions: from a symmetric state to periodic skewness and chaos. The two changes in flow state correspond to two Rec: the first essential Reynolds number (Recf) and the second critical Reynolds number (Recs).
The relationship between Rec and ER is depicted in Figure 13. While Rec drops sharply as ER increases from 1.5 to 2.5, the rate of decrease diminishes significantly at higher ER values (3.0 to 4.0), eventually approaching a stable asymptote. These results indicate that Rec decreases with increasing ER and eventually stabilizes. The ER of the sudden expansion–contraction channel primarily influences flow and heat transfer characteristics through its effect on the Rec for flow transition. Specifically, the ER increase leads to a decrease in Rec, which denotes the threshold for the transition from symmetric to asymmetric flow and heat transfer. The trend observed in the data indicates that increasing ER promotes the onset of flow skewing, oscillation, and chaotic dynamics in the flow and heat transfer processes.

4.2.2. Fluid Flow of the Expansion–Contraction Channel with Different Ars

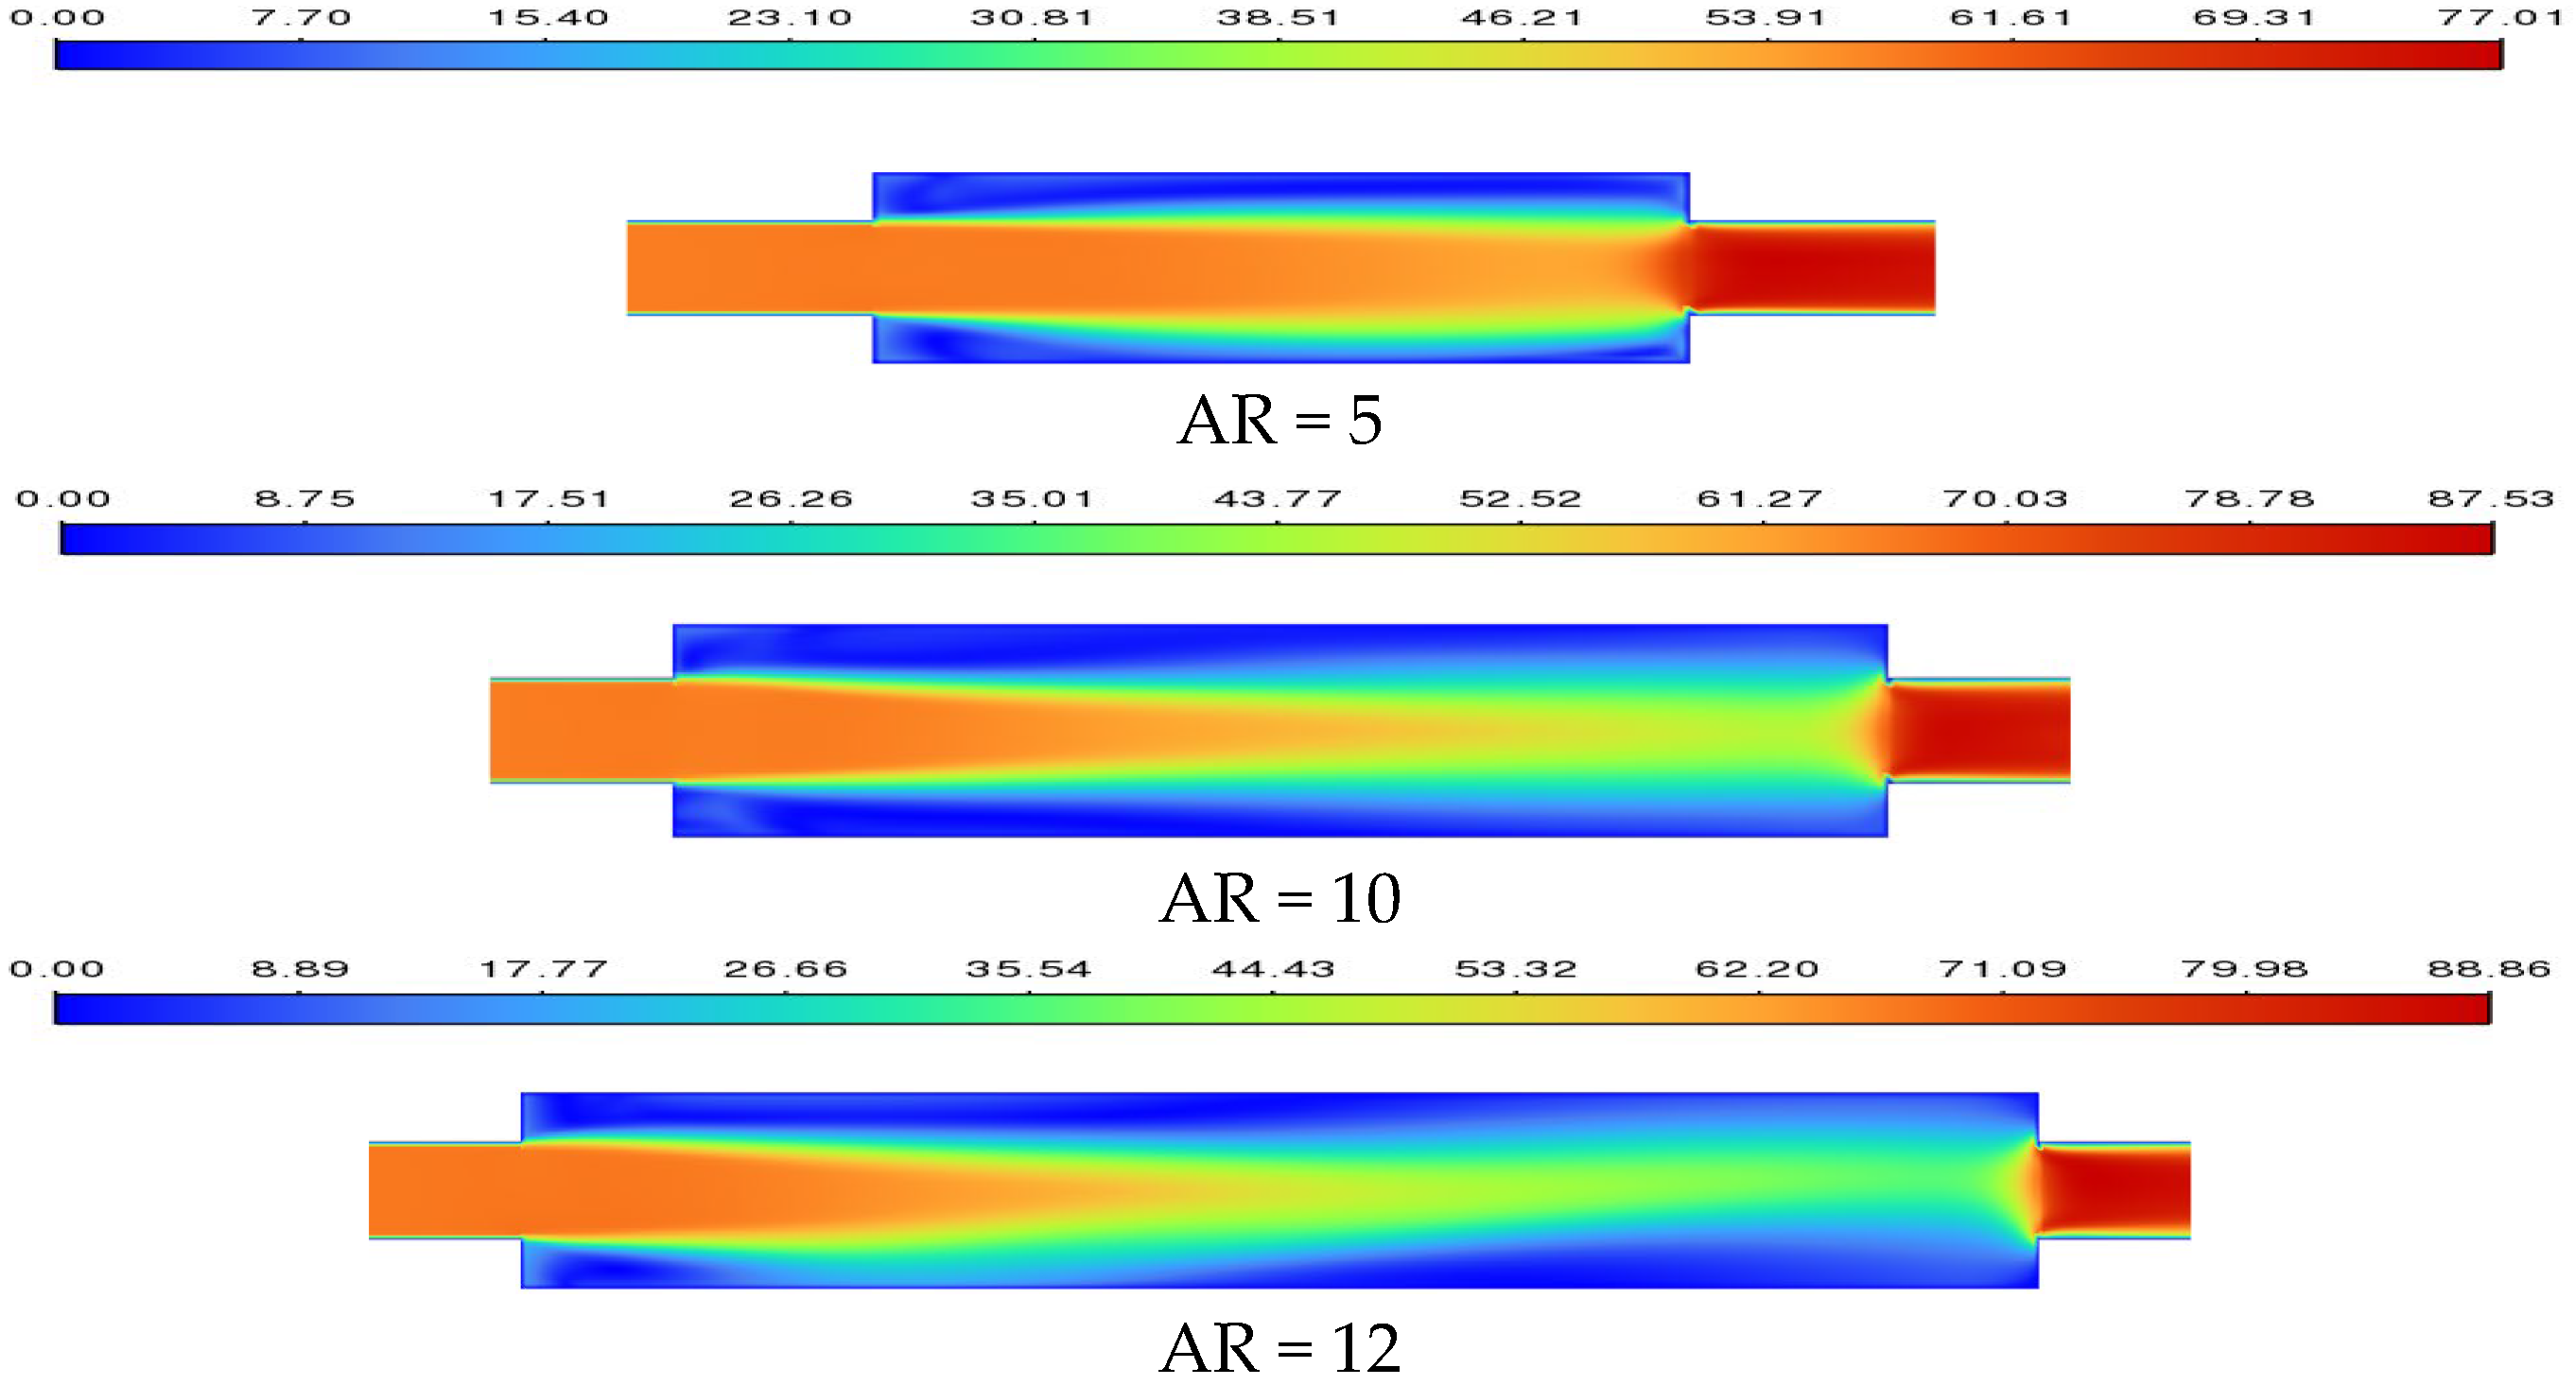
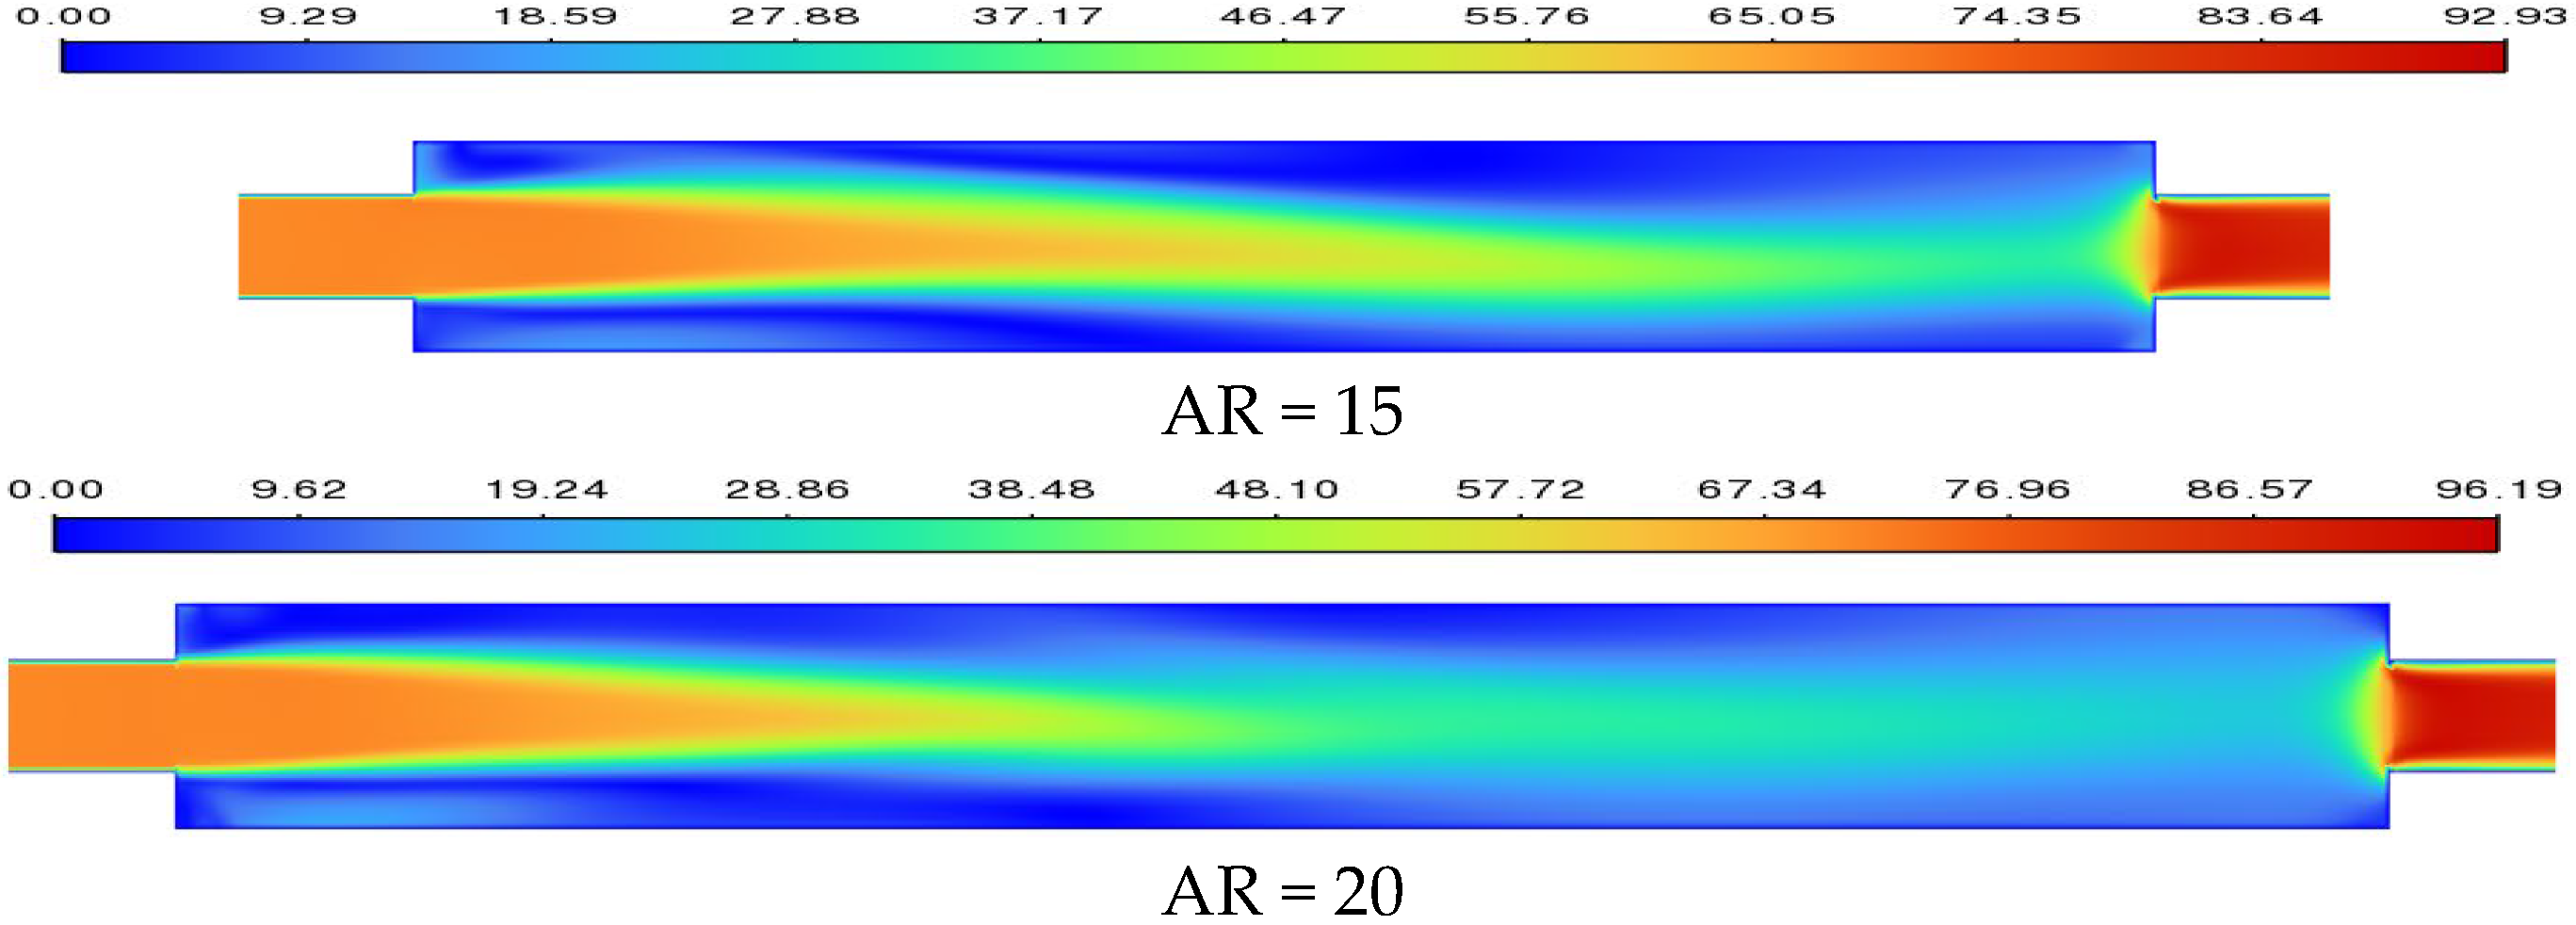
Additionally, this study examines the influence of the channel’s AR on the fluid’s flow state. The flow state changes simulated under structural parameters (AR variation, ER = 2) are shown in Figure 14. Analysis of the velocity contours reveals a symmetric flow pattern at AR = 5, 10, and 20, while asymmetric fluctuations emerge within the internal flow at AR = 12 and 15.
The data demonstrate that at constant Re, the channel AR exerts a significant influence on flow symmetry, with the flow state undergoing a transition from symmetric to asymmetric before reverting to a symmetric pattern. This multi-stage flow evolution underscores the complex dependence of the system’s flow characteristics on AR. The variation pattern of the Rec under AR parameters is illustrated in Figure 15. A clear trend emerges where Recf decreases significantly with increasing AR. Specifically, when AR increases from 5 to 10, Recf drops sharply from 4 × 10⁴ to 2 × 10³. This demonstrates that increasing the aspect ratio significantly reduces the system’s stability. With a further increase in AR to 15, Recf continues to decline, reaching 1.7 × 10⁴. However, as AR increases beyond this point, Recf gradually rises and converges to a stable value. The Recs decreases with increasing AR and eventually stabilizes. The influence of geometric parameter AR on flow and heat transfer characteristics exhibits non-monotonic variation, with its variation pattern depending on the specific range of AR under investigation. Consequently, analysis of the structural parameters uncovers substantial variations in Rec. These characteristics hold reference value for the study and regulation of nonlinear phenomena.

4.3. Analysis of Flow Characteristics and Nonlinear Characteristics

4.3.1. Physical Mechanisms of Parameters

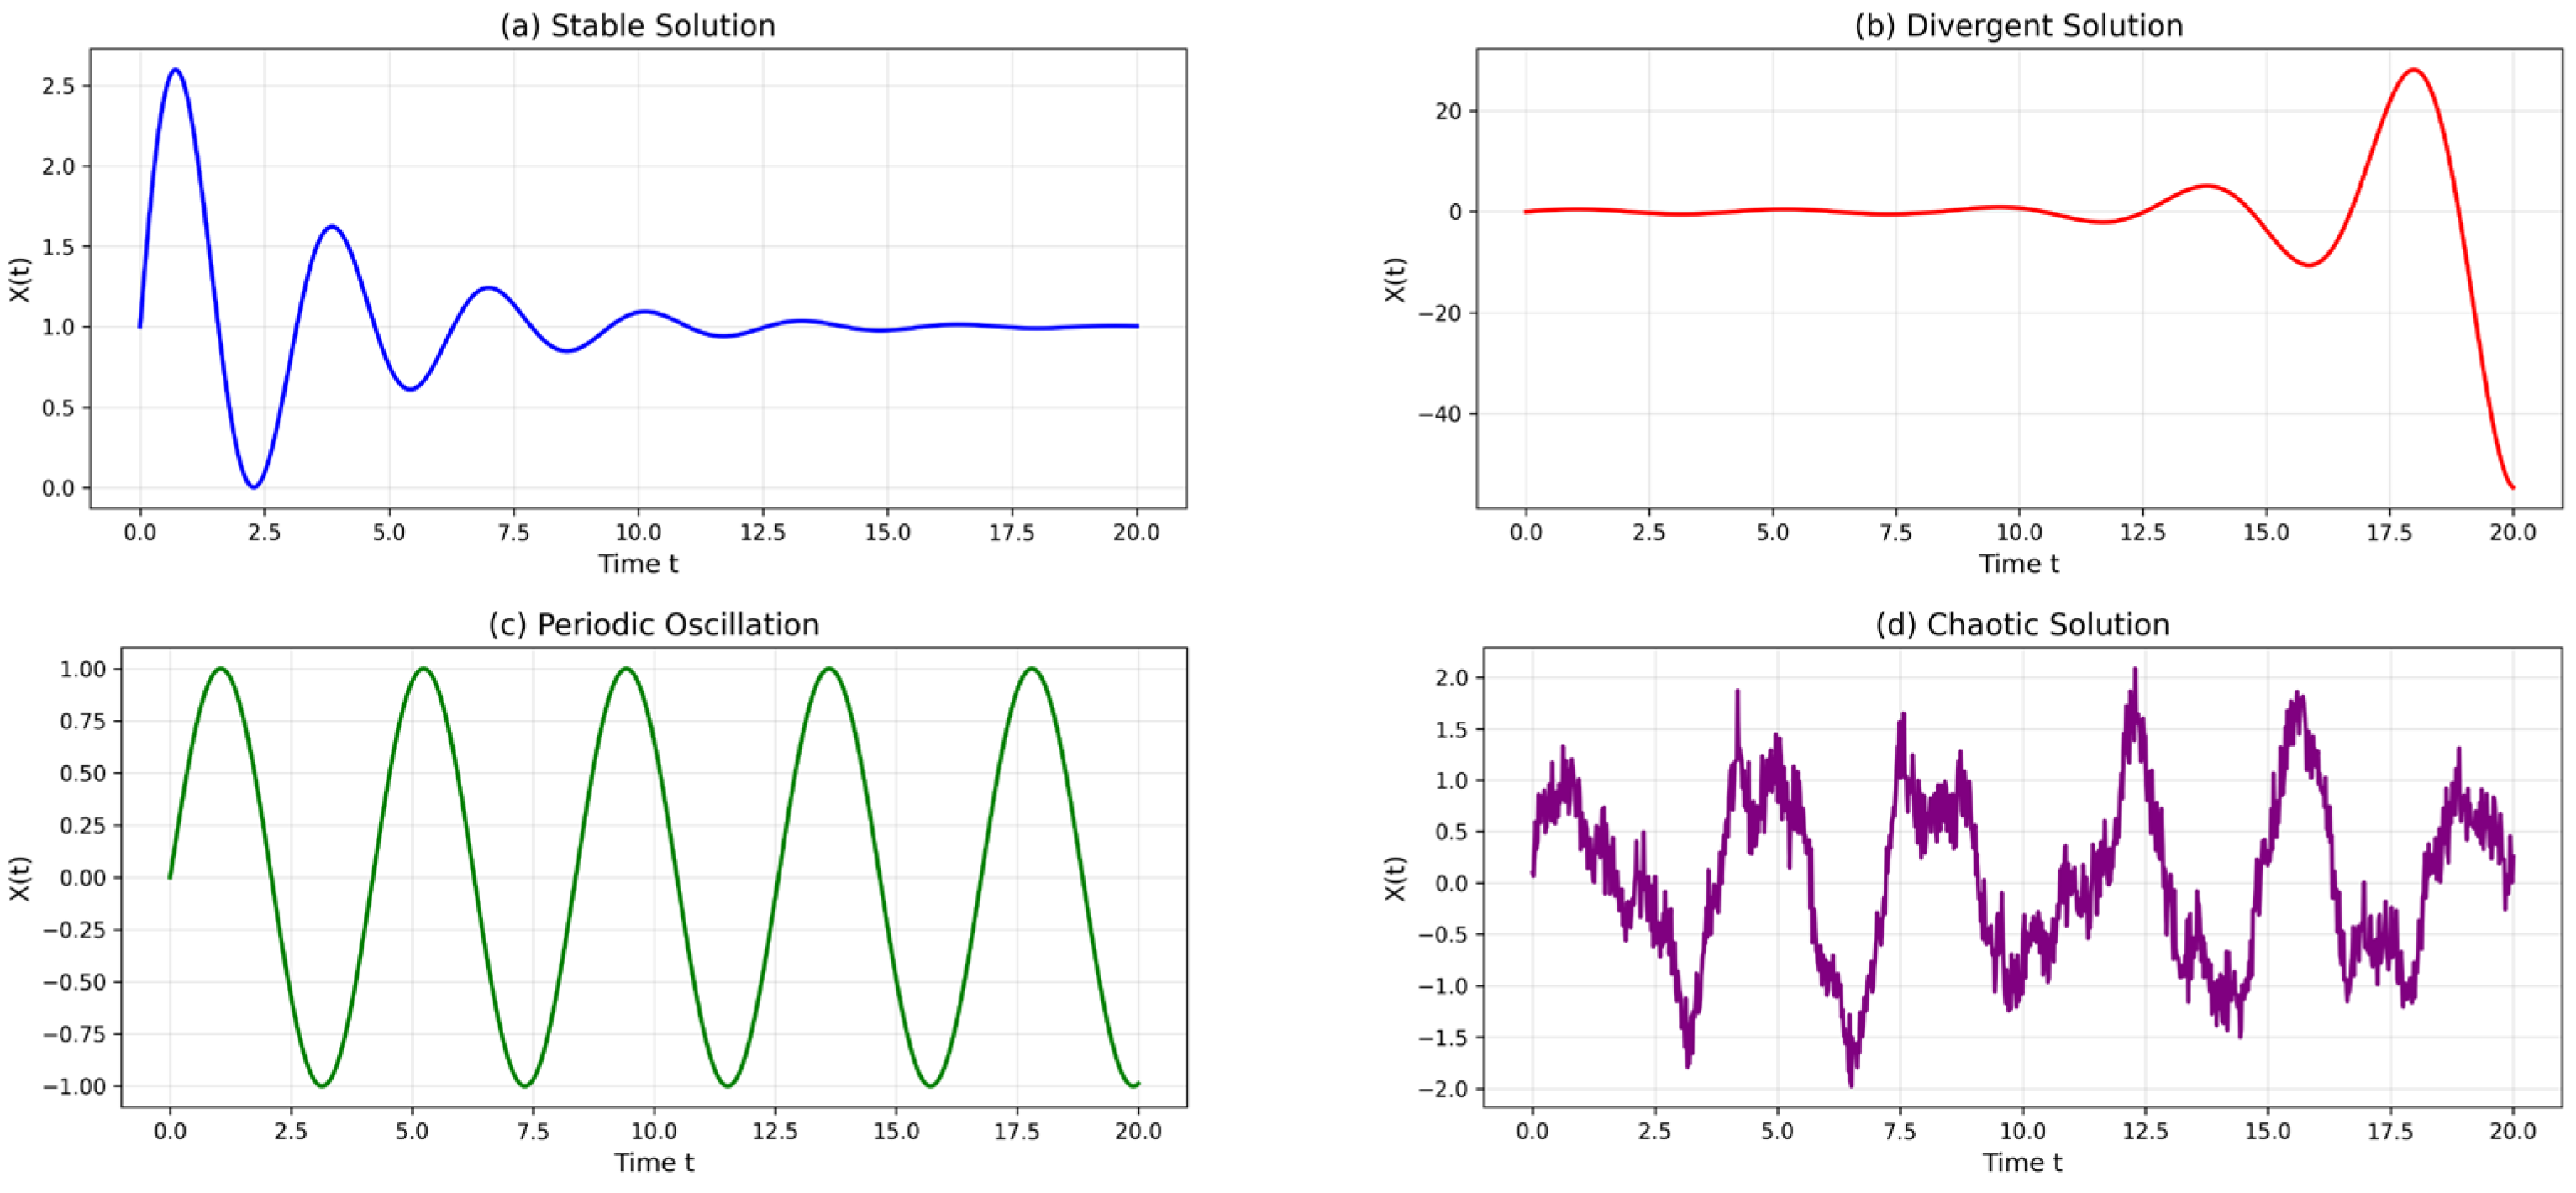
The investigation demonstrates that increasing Re induces a consistent state transition phenomenon across variations in structural parameters. The underlying physical mechanism can be attributed to the multi-solution nature of nonlinear systems: as parameters vary, the system’s “stability landscape” evolves, leading to different stable flow states (such as steady flow, periodic oscillations, and chaos) that alternately dominate or coexist. Detailed state curves for various solutions in nonlinear systems are shown in Figure 16.
The geometric parameters (ER and AR) influence the threshold for flow and heat transfer conditions. The ER primarily controls the intensity of flow separation and the strength of the primary recirculation vortex. A larger ER creates a more significant adverse pressure gradient, intensifying vortex shedding and promoting early transition to asymmetry, thereby monotonically reducing the Recf. In contrast, the AR exhibits a non-monotonic influence by modulating the development space for these vortical structures. An intermediate AR (e.g., 12–15) provides an optimal length for vortex growth and periodic shedding, minimizing Recf. Conversely, both shorter (low AR) and excessively longer (high AR) channels suppress this instability mechanism—through physical confinement and vortex decay, respectively—leading to an increase in Recf.
The observed flow transitions—from steady symmetry to periodic oscillation and finally to chaos—demonstrate that the system exhibits multiple solutions for a given geometry, with the dominant solution shifting as the Re increases. This progression from order to disorder is not random but follows a deterministic pathway intrinsic to the nonlinear Navier–Stokes equations.

4.3.2. Spectral Analysis and Velocity Phase Diagram Analysis

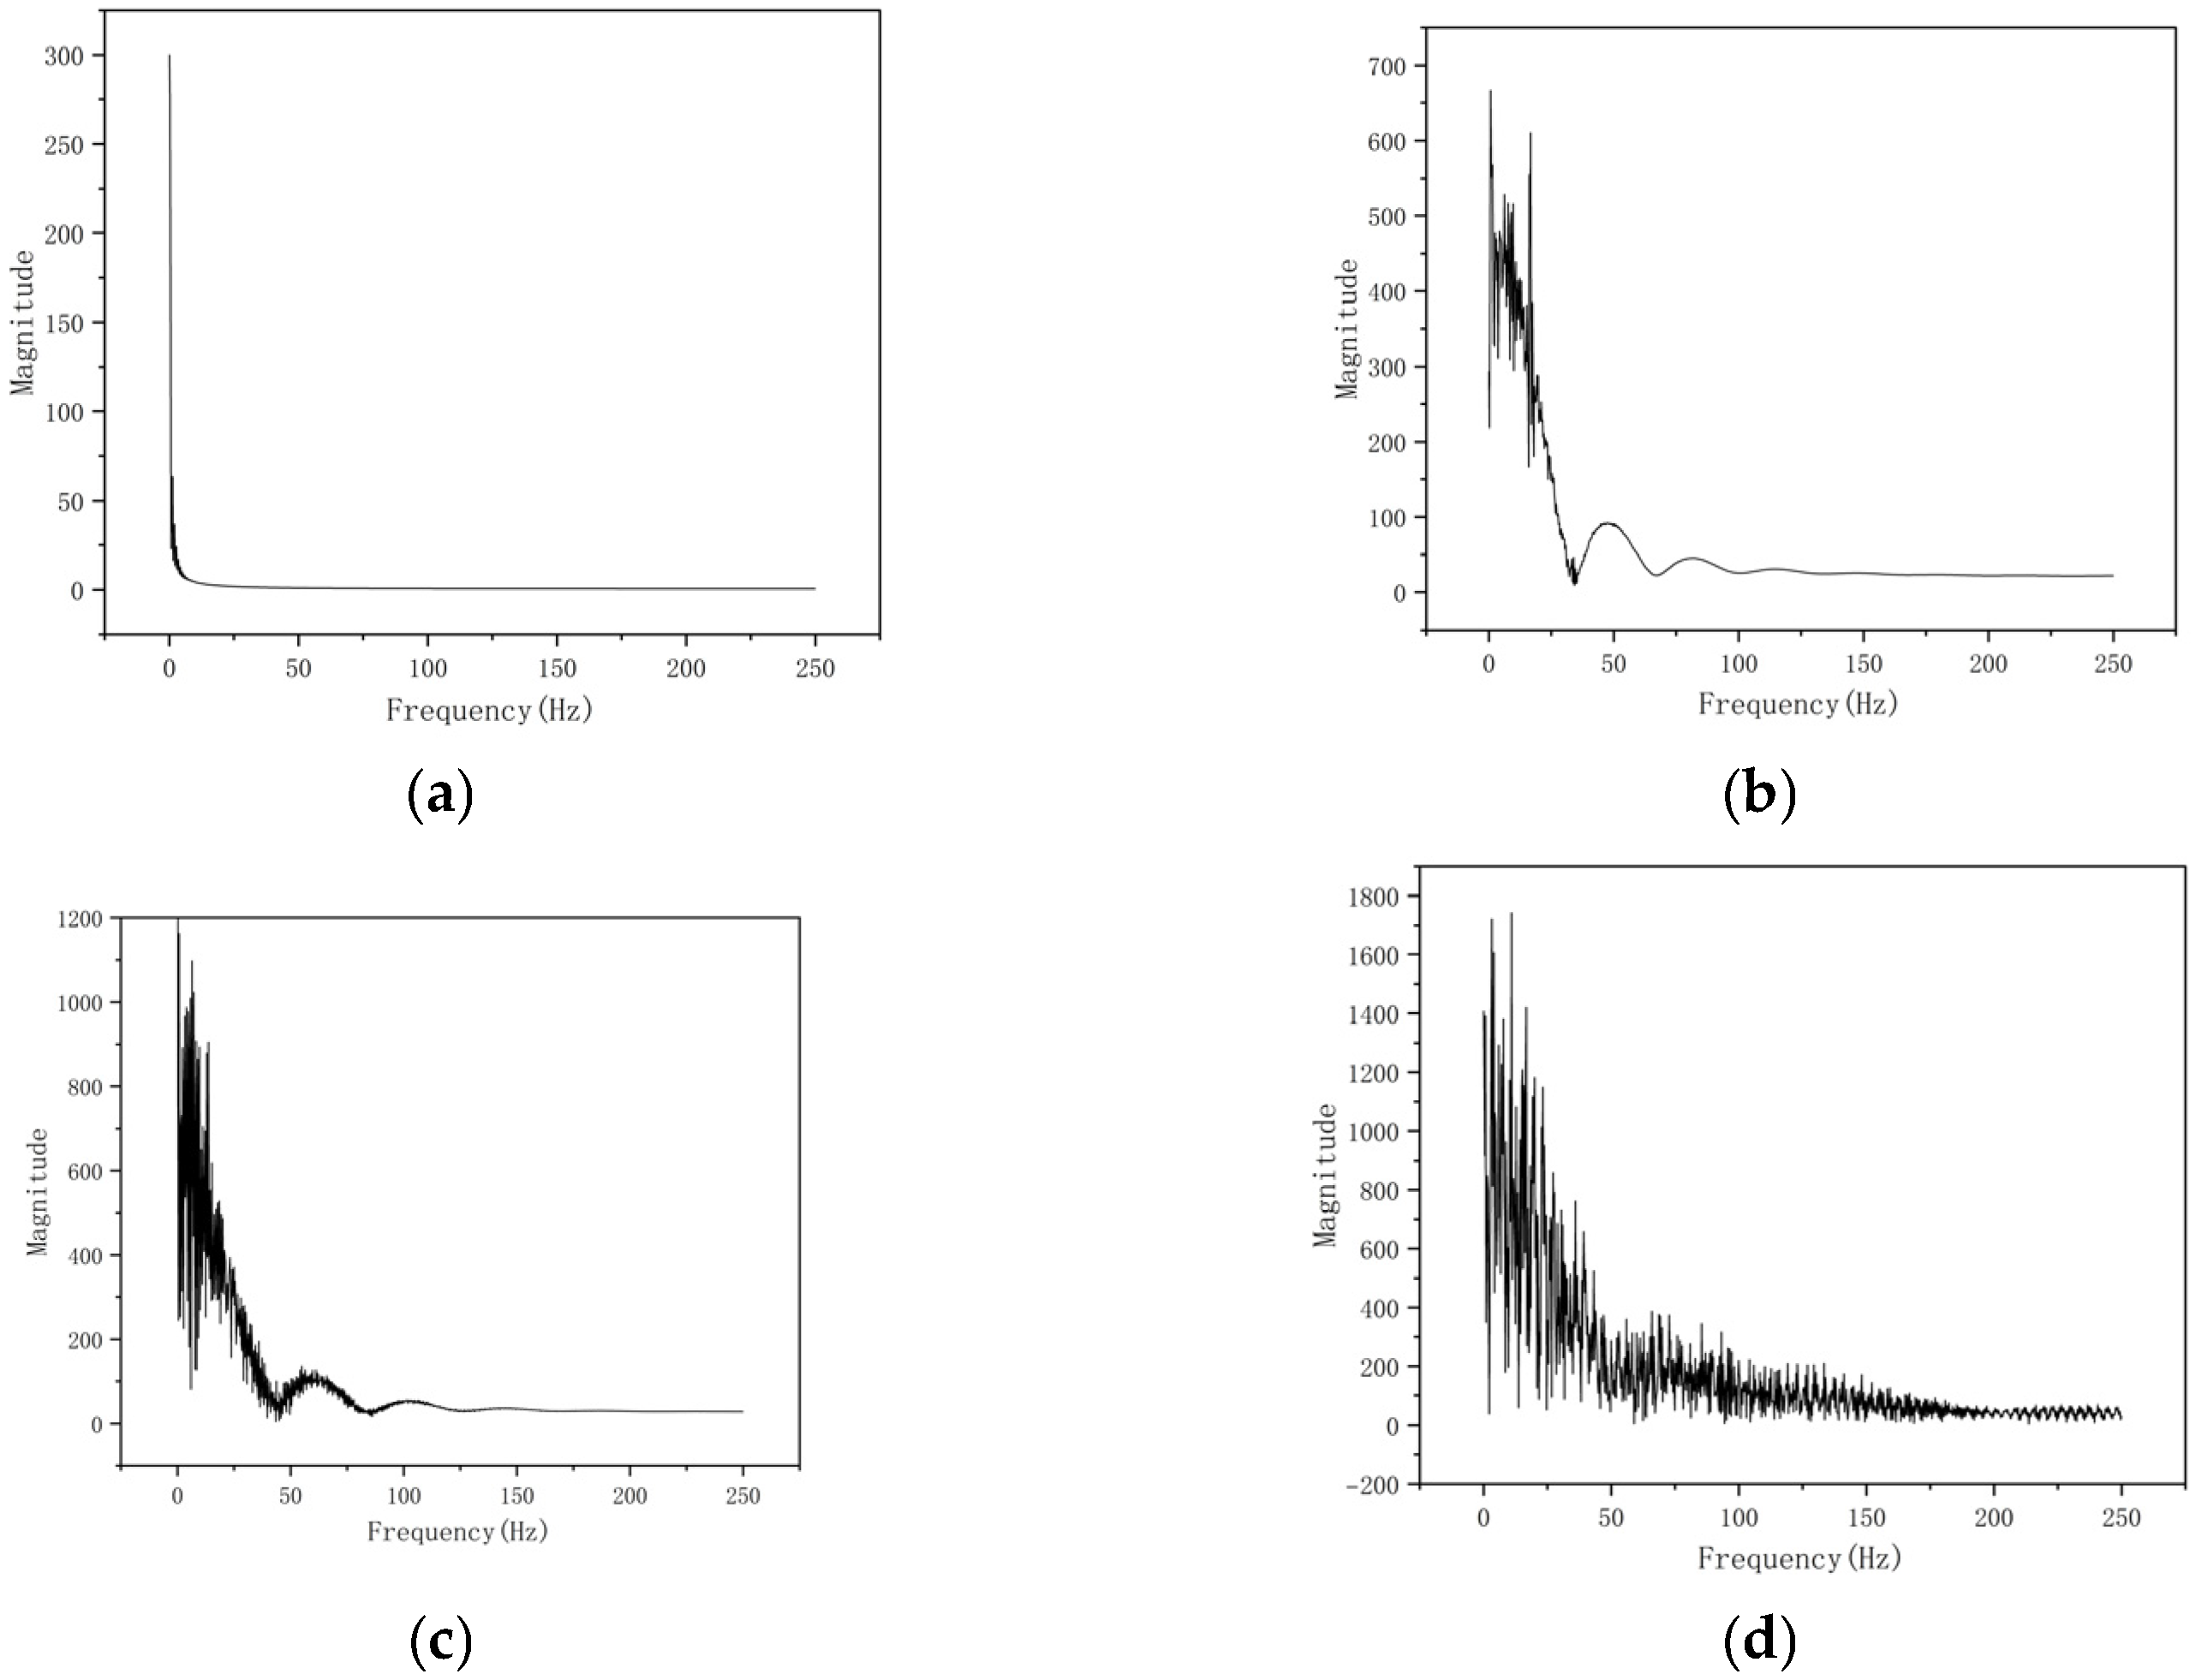
The foregoing study indicated that, as the channel Re increases, the flow and temperature field exhibit a distinct evolutionary sequence: from stable to periodic, then to aperiodic, and, ultimately, to a chaotic state. Perform a Fourier transform on the velocity time series and analyze its spectrum to investigate amplitude variations across frequencies. At low Re, the spectral curve remains relatively smooth, with zero amplitude across all frequencies, indicating stable flow conditions. As Re increases, significant fluctuations begin to appear in the spectrum. At low frequencies, the amplitude peaks at 670, indicating internal instability and a transition to periodic flow dynamics. When parameters continue to increase beyond the Re = 2.6 × 10⁴, spectral fluctuations intensify and background noise levels rise. Amplitudes range from a maximum of 1750 to a minimum of 50, until discrete spectral peaks gradually subside into a continuous broadband spectrum. Ultimately, as shown in Figure 17d, the spectrum fully exhibits continuous broadband characteristics, a clear indicator of the flow entering a chaotic state. This method enables the precise determination of the critical parameters at which the system undergoes a chaotic transition.
The nonlinear phenomena observed were further validated through phase diagram analysis of the velocities at monitoring points within the channel. As the Figure shows, the velocity phase diagram at this location undergoes a gradual transition. At low Re, the velocity distribution exhibits a two-dimensional pattern (as shown in Figure 18a). When the Re reaches 1.5 × 10⁴, the flow evolves into a periodic velocity loop in Figure 18b. As the Re further increases to 2.6 × 10⁴, the flow field ultimately grows into a highly disordered chaotic state, as shown in Figure 18c.
This complex flow evolution process is fundamentally rooted in the flow-induced nonlinear dynamics triggered by the sudden expansion and contraction geometry. This is because nonlinear solutions of dynamical systems typically exhibit a multi-solution phenomenon. The stable, symmetric flow observed at low Re represents one solution branch. However, as Re increases, this solution loses stability, creating new solution branches characterized by periodic oscillations or chaos.

4.3.3. Poincaré Section

Further insight into nonlinear phenomena within the flow process is gained through the application of the Poincaré section method. First, the autocorrelation function method determines the time delays for the velocity (V). For the three selected Re, the corresponding time delays are 0.5, 0.3, and 0.1, respectively. These values are then utilized to reconstruct the three-dimensional phase space of velocity (V). A cross-section is appropriately selected within the velocity phase space; among them, a specific point of a variable pair (e.g., p1 and p2) is designated as a fixed point. This cross-section is defined as the Poincaré section, and the intersections between the Poincaré section and trajectories formed by consecutive points in the phase space reflect the nonlinear properties of the system. The nonlinear characteristics of the system are determined by analyzing the distribution of points on the Poincaré section: a single, unique point indicates a steady-state flow; a small number of discrete points correspond to periodic behavior; irregularly distributed points forming contiguous bands signify chaotic motion. The results of the Poincaré section velocity phase diagram established in this paper are shown in Figure 19. At Re = 5 × 10³, the Poincaré section exhibits a discrete point. When Re = 1.5 × 10⁴, it shows two discrete points, while at Re = 2.6 × 10⁴, this region displays a continuous banded area, indicating that the velocity state within the system exhibits chaos.
The Poincaré sections in the velocity phase diagram reveal solution transitions at different Re. These unstable solutions drive dynamic evolution within the system, leading to unstable flow and heat transfer processes. This process exhibits nonlinear phenomena within the sudden expansion–contraction channel.

5. Conclusions

This paper investigates fluid flow in a sudden expansion–contraction channel through numerical simulation and computational analysis. The effects of flow and heat transfer during parameter variations are examined. Observed nonlinear phenomena are summarized and analyzed, exploring their underlying physical mechanisms and implications for engineering applications.
(1)
As the Re increases, the fluid flow transitions from a stable symmetric flow state to the gradual emergence of oscillations and eventually to a chaotic state. Specifically, when Re is less than 1.7 × 10⁴, the flow exhibits higher stability, characterized by a uniform and symmetric jet flow. When Re exceeds 2.6 × 10⁴, turbulence significantly intensifies, accompanied by pronounced oscillatory behavior, resulting in entirely irregular flow within the channel. Lyapunov exponent analysis of the velocity time series validates the system’s transition from stable to chaotic states.
(2)
Alterations in structural parameters influence the Rec for flow heat transfer. An increase in ER leads to a monotonically decreasing Rec, eventually saturating; under different parameter evolutions, the system consistently exhibits the same transition from a stable state to a chaotic state. Therefore, in nonlinear dynamical systems with structural symmetry, the result is independent of variations in geometric parameters.
(3)
Nonlinear phenomena in flow heat transfer are investigated using spectral analysis, velocity phase space, and Poincaré sections. The analysis elucidates the general characteristics and underlying mechanisms of nonlinearity, demonstrating how the existence of multiple solutions in nonlinear systems influences heat transfer within fluid flows. Analysis of critical state transitions in flow heat transfer provides new insights and data references for solving practical engineering problems.
(4)
Subsequent research will construct an experimental apparatus featuring a sudden expansion–contraction channel and employ particle image velocimetry (PIV) and laser-induced fluorescence temperature measurement techniques to obtain precise measurements of velocity and temperature fields. These measurements can then be directly compared with current numerical simulation results to further validate the model’s accuracy. The nonlinear characteristics will be analyzed from the perspectives of thermofluid dynamics or fluid–structure interaction, employing more precise parameters to assess the nonlinear state quantitatively.

Author Contributions

Methodology, C.Y.; Software, Z.Z. and C.S. (Chengxuan Su); Formal analysis, Z.T.; Investigation, C.Y. and J.Z.; Data curation, C.Y., J.Z. and C.S. (Chengxuan Su); Writing—original draft, C.Y.; Writing—review & editing, C.S. (Chunyun Shen) and Z.T.; Supervision, C.S. (Chunyun Shen). All authors have read and agreed to the published version of the manuscript.

Funding

This research was funded by the 2024 Shanghai University Teachers Industry-University-Research Practice Program (A1-2007-24-000405).

Institutional Review Board Statement

Not applicable.

Informed Consent Statement

Not applicable.

Data Availability Statement

The data presented in this study are available on request from the
corresponding author. The data are not publicly available due to privacy.

Conflicts of Interest

The authors declare no conflicts of interest.

Nomenclature

The following abbreviations are used in this manuscript:
UStreamwise velocity
VTransverse velocity
WVertical velocity
TTemperature
ARAspect ratio
ERExpansion ratio
ReReynolds number
RecCritical Reynolds number
RecfFirst critical Reynolds number
RecsSecond critical Reynolds number
Hexpansion diameter
hshrinkage diameter
LLength
ωVorticity
μDynamic viscosity
kTurbulent kinetic energy
εTurbulent dissipation rate

References

  1. Tilton, D.E.; Kearns, D.A.; Tilton, C.L. Liquid nitrogen spray cooling of a simulated electronic chip. In Advances in Cryogenic Engineering; Springer: Berlin/Heidelberg, Germany, 1994; pp. 1779–1786. [Google Scholar]
  2. Wei, A.; Qiu, L.; Zhang, X. On the unsteady cavitation characteristics of compressible liquid nitrogen flows through a venturi tube. Int. J. Multiph. Flow 2024, 170, 104630. [Google Scholar] [CrossRef]
  3. Wei, A.; Wang, W.; Hu, Y.; Feng, S.; Qiu, L.; Zhang, X. Numerical and experimental analysis of the cavitation and flow characteristics in liquid nitrogen submersible pump. Phys. Fluids 2024, 36, 042109. [Google Scholar] [CrossRef]
  4. Sehmbey, M.S.; Chow, L.C.; Hahn, O.J.; Pais, M.R. Effect of spray characteristics on spray cooling with liquid nitrogen. J. Thermophys. Heat Transf. 1995, 9, 757–765. [Google Scholar] [CrossRef]
  5. Sehmbey, M.S.; Chow, L.C.; Hahn, O.J.; Pais, M.R. Spray cooling of power electronics at cryogenic temperatures. J. Thermophys. Heat Transf. 1995, 9, 123–128. [Google Scholar] [CrossRef]
  6. Cen, K.; Li, Y.; Wei, L.; Li, W.; Wang, Y.; Dai, M. Evaporation of single moving liquid nitrogen droplet: Experimental study and numerical simulation. Int. J. Heat Mass Transf. 2023, 201, 123584. [Google Scholar] [CrossRef]
  7. Moosavian, D.; Ghassemi, H.; Mostofizadeh, A. Experimental study of atomization of liquid nitrogen jet impingement. J. Braz. Soc. Mech. Sci. Eng. 2023, 45, 302. [Google Scholar] [CrossRef]
  8. Cai, C.; Ren, K.; Li, Q. Numerical simulation of the flow field structure of liquid nitrogen jet. Therm. Sci. 2019, 23, 1337–1343. [Google Scholar] [CrossRef]
  9. Banerjee, S.; Banik, A.; Rajak, V.K.; Bandyopadhyay, T.K.; Nayak, J.; Jasinski, M.; Kumar, R.; Jeon, B.-H.; Siddiqui, M.R.; Khan, M.A. Two-Phase Crude Oil–Water Flow Through Different Pipes: An Experimental Investigation Coupled with Computational Fluid Dynamics Approach. ACS Omega 2024, 9, 11181–11193. [Google Scholar] [CrossRef]
  10. Gao, Y.; Wang, Z.; Li, Y.; Ma, E.; Yu, H. Flow boiling of liquid nitrogen in a horizontal macro-tube at low pressure: Part I-flow pattern, two-phase flow instability, and pressure drop. Int. J. Heat Fluid Flow 2024, 107, 109335. [Google Scholar] [CrossRef]
  11. Zhang, X.; Zeng, X.; He, C.; Liu, Y. Large-eddy simulation of turbulent channel flows with antifouling-featured bionic microstructures. Int. J. Heat Fluid Flow 2023, 104, 109228. [Google Scholar] [CrossRef]
  12. Cai, H.; Xu, L.; Yang, Y.; Li, L. Analytical solution and numerical simulation of the liquid nitrogen freezing-temperature field of a single pipe. AIP Adv. 2018, 8, 055119. [Google Scholar] [CrossRef]
  13. Mohammadshahi, S.; Samsam-Khayani, H.; Cai, T.; Kim, K.C. Experimental and numerical study on flow characteristics and heat transfer of an oscillating jet in a channel. Int. J. Heat Fluid Flow 2020, 86, 108701. [Google Scholar] [CrossRef]
  14. Jia, H.W.; Zhang, P.; Guo, T.; Fu, X.; Jiang, S. Flow-boiling heat transfer experiments with liquid nitrogen in microchannel heat sinks. J. Shanghai Jiao Tong Univ. 2014, 48, 1274–1278. [Google Scholar]
  15. Zhang, P. Flow boiling of liquid nitrogen in narrow annular channels. J. Korean Inst. Supercond. Cryog. 2008, 10, 1–5. [Google Scholar]
  16. Sun, S.; Wu, Y.; Zhao, R. The numerical calculation of heat transfer performance for annular flow of liquid nitrogen in a vertical annular channel. Cryogenics 2001, 41, 231–237. [Google Scholar] [CrossRef]
  17. Sun, B.; Song, J.W. Coupled heat transfer characteristics of stepped cooling channels in liquid oxygen/methane engines. J. Aeronaut. Propuls. 2016, 31, 2972–2978. [Google Scholar]
  18. Wang, L.; Shi, S.; Qu, M.; Ni, Y.; Ma, Y.; Li, Y. Variation of Leidenfrost temperature in liquid nitrogen pipe chilldown process and its application in chilldown performance analysis. Int. J. Multiph. Flow 2022, 156, 104225. [Google Scholar] [CrossRef]
  19. Chen, J.C.; Chen, T.R.; Liang, W.D.; Tan, S.L.; Geng, H. Experimental study on the evolution of cavitation flow process of liquid nitrogen in systolic dilatation tubes. J. Mech. 2022, 54, 1242–1256. [Google Scholar]
  20. Zhang, J.; Lei, L.; Li, H.; Xin, G.; Wang, X. Experimental and numerical studies of liquid-liquid two-phase flows in microchannel with sudden expansion/contraction cavities. Chem. Eng. J. 2022, 433, 133820. [Google Scholar] [CrossRef]
  21. Erturk, E.; Allahviranloo, T. Bifurcation and Multiplicity of Solutions of the Navier–Stokes Equations in Driven Semi-Elliptical Cavity Flow. Mathematics 2022, 10, 4242. [Google Scholar] [CrossRef]
  22. Trefethen, L.N.; Trefethen, A.E.; Reddy, S.C.; Driscoll, T.A. Hydrodynamic stability without eigenvalues. Science 1993, 261, 578–584. [Google Scholar] [CrossRef] [PubMed]
  23. Straughan, B. The Energy Method, Stability, and Nonlinear Convection; Springer Science & Business Media: Berlin/Heidelberg, Germany, 2013; Volume 91. [Google Scholar]
  24. Rionero, S.; Mulone, G. On the non-linear stability of parallel shear flows. Contin. Mech. Thermodyn. 1991, 3, 1–11. [Google Scholar] [CrossRef]
  25. Guan, F. Nonlinear Stability Study of Two Classical Flow Problems in Fluid Mechanics; Beijing University of Chemical Technology: Beijing, China, 2024. [Google Scholar]
  26. Roshchin, D.; Kravchenko, I.; Fu, T.; Patlazhan, S. Effect of flow bifurcation transitions of shear-thinning fluids on hydrodynamic resistance of channels with sudden contraction and expansion. Chem. Eng. Sci. 2023, 281, 119169. [Google Scholar] [CrossRef]
  27. Kumar, R.; Das, A.K. Numerical study of boiling of liquid nitrogen at solid and liquid contact planes. Int. J. Heat Mass Transf. 2022, 183, 122075. [Google Scholar] [CrossRef]
  28. Yang, L.; Yang, M.; Huang, W. Nonlinear Phenomena of Fluid Flow in a Bioinspired Two-Dimensional Geometric Symmetric Channel with Sudden Expansion and Contraction. Mathematics 2024, 12, 553. [Google Scholar] [CrossRef]
Figure 1. Nitrogen liquefaction jet device.
Applsci 15 12211 g001
Figure 2. (a) Channel 3D Model; (b) Structural Parameters.
Applsci 15 12211 g002aApplsci 15 12211 g002b
Figure 3. Channel grid partitioning.
Applsci 15 12211 g003
Figure 4. Mid-section of the grid.
Applsci 15 12211 g004
Figure 5. Grid-independent verification.
Applsci 15 12211 g005
Figure 6. Streamlines and velocity contour under different Re. (a) Program Flowchart; (b) Velocity contour.
Applsci 15 12211 g006aApplsci 15 12211 g006b
Figure 7. Velocity and temperature monitoring point locations.
Applsci 15 12211 g007
Figure 8. Velocity variation at the monitoring point under different Re. (a) Re = 5 × 10³; (b) Re = 1.5 × 10⁴; (c) Re = 2 × 10⁴; (d) Re = 2.6 × 10⁴.
Applsci 15 12211 g008
Figure 9. Lyapunov exponent curve.
Applsci 15 12211 g009
Figure 10. Temperature contour variations under different Re.
Applsci 15 12211 g010aApplsci 15 12211 g010b
Figure 11. Temperature profiles under different Re. (a) Re = 5 × 10³; (b) Re = 1.5 × 10⁴; (c) Re = 2 × 10⁴; (d) Re = 2.6 × 10⁴.
Applsci 15 12211 g011
Figure 12. The velocity contour in the different ER.
Applsci 15 12211 g012
Figure 13. The variation in Rec with the different ER.
Applsci 15 12211 g013
Figure 14. The simulation contour under the different AR.
Applsci 15 12211 g014aApplsci 15 12211 g014b
Figure 15. The variation in Rec at the different AR.
Applsci 15 12211 g015
Figure 16. Forms of solutions for nonlinear systems.
Applsci 15 12211 g016
Figure 17. Spectrum analysis curve. (a) Re = 5 × 10³; (b) Re = 1.5 × 10⁴; (c) Re = 2 × 10⁴; (d) Re = 2.6 × 10⁴.
Applsci 15 12211 g017
Figure 18. Phase diagrams of different Re velocities. (a) Re = 5 × 10³; (b) Re = 1.5 × 10⁴; (c) Re = 2.6 × 10⁴.
Applsci 15 12211 g018
Figure 19. Velocity phase space corresponds to the Poincaré section.
Applsci 15 12211 g019
Table 1. Structural parameters table.
ParametersValues
(mm)
Entry channelDiameter h1100
Length L1150
Exit channelDiameter h2100
Length L3150
Internal channelDiameter H200
Length L21000
wall thickness h35
Table 2. Boundary condition parameters.
DomainBoundary Condition TypeParameters and Values
inletVelocity InletVelocity: Varied to achieve target Re (5 × 10³–2.6 × 10⁴)
Temperature: 77 K
outletPressure OutletTemperature: 300 K
Channel WallsNo-Slip Wallwall temperature: 300 K
Two-Phase ModelVolume-of-Fluid (VOF)Phases: Primary Phase—LN2
Secondary Phase—Air
Volume Fraction (LN2): 0.5
Disclaimer/Publisher’s Note: The statements, opinions and data contained in all publications are solely those of the individual author(s) and contributor(s) and not of MDPI and/or the editor(s). MDPI and/or the editor(s) disclaim responsibility for any injury to people or property resulting from any ideas, methods, instructions or products referred to in the content.