Article

Techno-Economic Feasibility Analysis of Biomethane Production via Electrolytic Hydrogen and Direct Biogas Methanation

by
Davide Lanni
1,*,
Gabriella Di Cicco
1,
Mariagiovanna Minutillo
2 and
Alessandra Perna
1,*
1
Department of Civil and Mechanical Engineering, University of Cassino and Southern Lazio, 03043 Cassino, Italy
2
Department of Industrial Engineering, University of Salerno, 84084 Fisciano, Italy
*
Authors to whom correspondence should be addressed.
Appl. Sci. 2025, 15(22), 12170; https://doi.org/10.3390/app152212170
Submission received: 13 October 2025 / Revised: 10 November 2025 / Accepted: 12 November 2025 / Published: 17 November 2025

Abstract

Biomethane plays a key role in the green transition, offering a renewable, carbon-neutral substitute for natural gas while enabling the storage and use of intermittent renewable energy. This work presents a techno-economic assessment of biomethane production through the Power-to-Biomethane concept, which combines electrolytic hydrogen from renewable electricity with the direct catalytic methanation of raw biogas from anaerobic digestion. The main objective of this study is to identify the optimal plant size and configuration, taking into account the different operational management strategies of the system’s constituting units. The analysis integrates thermochemical modeling with a techno-economic optimization procedure. Three different configurations for renewable energy production, photovoltaic-based, wind-based, and hybrid photovoltaic–wind, were evaluated for a case study in Southern Italy. Results show that the hybrid configuration provides the best techno-economic balance, achieving the highest annual biomethane output (≈2288 t) and the lowest levelized cost of biomethane (EUR 97.4/MWh). While current biomethane production costs exceed natural gas prices, the proposed pathway represents a viable long-term solution for renewable integration and climate-neutral gas supply.

1. Introduction

Achieving climate neutrality is a primary objective for the European Union. To progress in this direction, a greater integration of renewable sources such as wind and solar energy is necessary. However, their intermittency and variability in production pose challenges in maintaining a balance between supply and demand, rendering large-scale storage technologies essential [1]. A promising strategy involves converting renewable electricity into synthetic energy carriers, commonly referred to as electro-fuels, via Power-to-Fuel processes. If compared to hydrogen, these fuels are more convenient to transport and store [2], enabling a wider incorporation of renewables into energy systems and supporting the transition towards a low-carbon or carbon-free energy panorama.
Power-to-gas (PtG) is a promising method for producing electro-fuels. In PtG plants, electricity generated from renewable sources is transformed into hydrogen or methane. This improves system flexibility and energy security while reducing the system’s sensitivity to intermittency [3,4,5]. The power-to-methane (PtM) pathway has attracted significant interest due to methane’s compatibility with the current natural gas infrastructure, thus enabling its immediate application across various sectors [6]. The PtM concept’s core step is the Sabatier reaction, which involves electrolytic hydrogen and carbon dioxide [7]. When hydrogen is generated from renewable sources and CO2 is biogenic (carbon dioxide released from the combustion or decomposition of organic matter), the resulting methane is classified as a green fuel. Although the production of renewable hydrogen is technically feasible, securing sustainable sources of CO2 remains a major challenge. The utilization of CO2 captured from fossil fuel-based processes merely postpones its eventual release into the atmosphere. In contrast, extracting CO2 from biogas offers a renewable and biogenic alternative, as the carbon originates from recent biological activity rather than fossil reserves. This pathway can therefore be considered effectively carbon neutral, resulting in no net increase in atmospheric CO2, and the produced methane is referred to as biomethane, in accordance with ISO 20675:2018 [8].

1.1. European Policies and Strategies for Biomethane Development

The Power-to-Biomethane (PtBM) concept holds particular relevance in the context of the European energy transition because it directly addresses several of the continent’s structural challenges in moving towards a climate-neutral and resilient energy system. As Europe expands its share of renewable electricity, particularly from wind and solar sources, managing variability and surplus generation has become a central issue. PtBM offers a way to convert this excess renewable electricity into hydrogen through electrolysis, and subsequently into biomethane by combining the hydrogen with biogenic carbon dioxide derived from biogas or other organic sources [9,10]. In doing so, it transforms intermittent renewable power into a storable and dispatchable energy carrier, enabling long-term, inter-seasonal energy storage and improving system flexibility.
Equally important is PtBM’s contribution to Europe’s broader decarbonization goals. By using biogenic CO2, the process effectively closes the carbon cycle and can even achieve negative emissions under certain configurations [11,12,13]. This characteristic supports the European Union’s ambition to establish a circular carbon economy and to reach climate neutrality by mid-century, as defined in the European Green Deal [14]. Moreover, because biomethane is chemically identical to natural gas, it can be directly injected into the existing gas grid, used in storage facilities, and applied across heating, industry, and transport without the need for new infrastructure [15]. This makes PtBM a pragmatic solution that builds on Europe’s extensive gas network, reducing both transition costs and implementation time [16].
Moreover, by producing renewable gases locally from domestic renewable electricity and organic feedstocks, PtBM enhances energy sovereignty, strengthens rural economies, and contributes to a more secure and diversified energy supply [12,17]. At the policy level, the technology aligns closely with the objectives of the European Green Deal and the REPowerEU Plan, which call for a massive scale-up of biomethane production by 2030 [18]. The REPowerEU Plan explicitly targets the production of 35 billion cubic meters of sustainable biomethane per year by 2030, framing renewable gases as a cornerstone of European energy security and independence [19]. Power-to-Biomethane technologies are directly aligned with this target because they can expand biomethane production beyond the limits of conventional anaerobic digestion by incorporating renewable hydrogen and captured biogenic CO2 [9]. This hybridization not only increases overall biomethane yield but also strengthens the integration between the renewable electricity and gas systems, an essential feature for achieving REPowerEU’s dual goals of decarbonization and energy autonomy [10].
Furthermore, PtBM supports the EU Energy System Integration Strategy, which seeks to interconnect energy carriers, infrastructures, and consumption sectors to maximize efficiency and sustainability [14]. By transforming excess renewable electricity into biomethane, PtBM enhances grid stability, provides long-term energy storage, and facilitates renewable energy use across multiple end-use sectors. Its compatibility with existing gas infrastructure makes it a cost-effective and rapidly deployable component of the broader transition envisioned by these policies [10,16].

1.2. Power-to-Biomethane Concept

There are various technological approaches to producing biomethane. The most widespread methods are anaerobic digestion (AD), followed by biogas upgrading and biomass gasification, followed by methanation. Another method is the Power-to-Biomethane (PtBM) process, in which CO2 in biogas reacts with electrolytic hydrogen [20]. Within PtBM, there are two alternatives: one involves separating CO2 first, followed by hydrogenation; the other is based on direct methanation of the raw biogas mixture containing CH4 and CO2, without prior upgrading. The latter method, referred to as direct biogas methanation, eliminates the upgrading step, making it economically advantageous. It also has the potential to increase renewable methane production by up to 80% compared to traditional upgrading methods [7,21,22]. Direct methanation can be performed using biological or catalytic methods. Biological routes, in which hydrogen is introduced into a digester or separate reactor, are limited by slow reaction rates, complex process control, and high equipment costs [23]. In contrast, catalytic methanation provides quicker reactions and more favorable process conditions: in fact, the presence of methane in the biogas mixture helps to mitigate temperature increases during the exothermic Sabatier reaction, thus improving reactor operability [21,23]. Recent studies in the literature have demonstrated the technical maturity and potential of these systems. Witte et al. [24], for example, have reported the long-term stable operation of direct biogas methanation in a fluidized-bed reactor, registering methane yields of 96% and highlighting that sulfur compounds are the main cause of catalyst deactivation. Fürst et al. [25], instead, analyzed multi-scale power-to-methane configurations based on solid oxide electrolyzers, showing that an optimized thermal management and sweep-gas recirculation can raise system efficiency by up to 10–11%. These results confirm the technical feasibility of direct catalytic methanation, establishing a solid foundation for subsequent techno-economic analyses.
In addition to the technical aspect, another element to take into account when proposing the large-scale introduction of PtBM systems is their economic feasibility [26]. Consequently, recent studies on biomethane and synthetic methane production processes have focused on techno-economic feasibility analysis. Janke et al. [27] developed a dynamic model to assess synthetic CH4 production from PtG integrated into anaerobic digestion plants, finding that constrained power supply and CO2 variability significantly increased system complexity and costs. Bedoić et al. [28] conducted a techno-economic optimization of a power-to-gas system based on a food-waste-fed biogas plant. The authors used robust linear programming to minimize total costs under varying electricity prices. The study found that large-scale integration requires substantial renewable plant sizes (≈18 MW wind, 9 MW PV plus grid imports), while feedstock gate fees (the payments a biogas plant receives for accepting waste as raw material) and the availability of renewable sources are the main influencing factors of economic feasibility, being responsible for an increase in gas production costs by 10–30%. Ghafoori et al. [29] demonstrated the strong sensitivity of biomethane production costs to electricity prices, with a levelized cost of biomethane (LCOBM) ranging from EUR 78 to 150/MWh depending on the technology and operation mode of the electrolysis unit. In a wastewater treatment plant case study, Michailos et al. [30] estimated LCOBM at GBP 128–160/MWh (EUR 143–179/MWh, year 2020 values); these costs can be reduced as far as 75% through incentives and by coupling with on-site renewables, but they would still not be competitive with natural gas. Giglio et al. [31] applied real plant data to design methanation reactors coupled with PV electrolysis, requiring a 40 MW PV park and finding synthetic methane costs of EUR 1.09–2.01/Sm3 (EUR 109–202/MWh), only competitive under significant cost-reduction scenarios. On a broader systems level, McDonagh et al. [32] incorporated capital expenditure (CAPEX), operational costs (OPEX), and real market electricity prices into a lifetime PtG cost model, projecting LCOE reductions from EUR 107 to 143/MWh in 2020 to EUR 81–103/MWh by 2040, with the potential to reach EUR 55/MWh under surplus electricity conditions. Finally, Brands et al. [33] investigated a novel process of biomethane production based on pyrolysis, gas purification, and microbial methanogenesis, showing that improved CO2 removal reduces the process’s hydrogen demand by 51% and enables biomethane production at a minimum LCOBM of EUR 143/MWh, with hydrogen price as the critical cost component.
Table 1 summarizes and reports the main objectives and findings of the above-mentioned studies from the literature.

1.3. Research Purpose and Novelty

The present work proposes and analyzes an innovative Power-to-Biomethane (PtBM) system configuration that enables the efficient coupling of renewable electricity with biogenic carbon resources. The proposed configuration is based on two fundamental pillars: (i) electrolytic hydrogen production from renewable sources and (ii) the direct catalytic methanation of raw biogas derived from the anaerobic digestion of organic waste. This integration allows for the simultaneous exploitation of renewable electricity and biogenic CO2, creating a circular and carbon-neutral energy pathway that supports both energy storage and grid decarbonization objectives.
A detailed methodological framework is developed for the design, sizing, and performance assessment of the PtBM system. The approach includes a plant sizing procedure that couples plant management strategies with an optimization-based model aimed at minimizing the levelized cost of biomethane (LCOBM). By accounting for the variability of renewable energy supply and the operational flexibility of the plant, the framework provides a realistic and dynamic representation of system behavior.
The novelty and originality of this study stem from the integration of modeling approaches that have so far been investigated separately in the literature. Specifically, this work uniquely combines the following:
  • A thermochemical model for the direct catalytic methanation system of raw biogas;
  • A techno-economic modeling framework that explicitly incorporates renewable resource variability and operational management strategies;
  • An optimization approach that jointly evaluates technical and economic performance to identify cost-optimal system configurations.
By coupling a detailed sizing methodology with a techno-economic optimization model, this study introduces a novel and generalizable framework for assessing both the technical feasibility and the long-term economic sustainability of PtBM systems. This integrative approach bridges the gap between process-level analysis and system-level evaluation, offering an effective decision-support tool for the design and deployment of PtBM plants. In doing so, it positions PtBM technology as a key enabler for renewable energy storage, carbon valorization, and the global transition toward a climate-neutral energy system.

2. Materials and Methods

This research analyzes the technical feasibility of PtBM plant configurations powered by different renewable energy sources, identifying the optimal one, and demonstrates how the PtBM concept can facilitate the integration of renewable energy sources in future energy systems. The study is carried out through an optimization approach to determine the ideal size of the PtBM facility to minimize the LCOBM.

2.1. Description of the PtBM Plant Concept

The plant layout is organized into two main interconnected sections (Figure 1): (i) the Renewables plant, which is made up of the anaerobic digestion (AD) plant and the RES plant (which may be a photovoltaic plant, a wind farm, or a hybrid power plant that integrates both), dedicated to the production of biogas and the renewable electricity, respectively, and (ii) the Biomethane Production (BP) plant.
The AD plant is based on the Bekon dry digestion technology, which generates biogas from organic waste without any need for water input [34].
The composition of biogas can vary seasonally and according to the type of feedstock, due to differences in organic content, degradation rates, and operational conditions of the digester; however, the ratio between CO2 and CH4 can be considered relatively stable when the feedstock supply is consistent, the substrate composition remains homogeneous, and the operating conditions are properly controlled. In this study, the typical assumption of 60% CH4 and 40% CO2, representing an average, has been considered to ensure the consistency and comparability of the results. Similar assumptions have been reported in other studies that observed limited seasonal effects on biogas composition under stable operating conditions [35,36,37].
For the photovoltaic (PV) plant, crystalline silicon modules have been selected, as they currently demonstrate the highest performance, with efficiencies between 16% and 22% [38]. The specific module chosen is a 560 W (44.31 V@12.63 A) Jinko Solar monocrystalline solar panel, which has an efficiency of 20.5% under standard test conditions (STCs) [39]. For the wind farm, horizontal axis wind turbines (HAWTs) have been considered, which have reached a level of technical maturity both in terms of size (from several tens of kilowatts to multiple megawatts) and efficiency (30–35%) [40].
The electrolysis unit (EU) and the direct catalytic methanation unit (DCMU) are the key components of the Biomethane Production Section. Among the electrolysis technologies, the Proton Exchange Membrane Electrolyzer (PEMEL) technology is regarded as the optimal solution for power-to-gas (PtG) application [27], due to its combination of technical performance, operational flexibility, and technological maturity, all of which are essential for the dynamic and renewable-integrated operation. Table 2 illustrates a comparative assessment of electrolyzer technologies for Power-to-Biomethane (PtBM) applications, PEMEL, AEL (Alkaline Electrolyzers), and SOEL (Solid Oxide Electrolyzer).
From a technical standpoint, the ability of PEMEL to start up quickly, ramp up or down within seconds, and operate efficiently at partial loads is a critical factor in PtBM applications, where hydrogen production must align dynamically with fluctuating electricity availability. Thus, PEMEL currently represents the most viable and technically coherent option for renewable-integrated, dynamically operated PtBM systems thanks to its superior operational flexibility, fast dynamic response, high-purity hydrogen output, and commercial maturity.
The PEM electrolysis unit considered in this study consists of 1 MW modules operating at 20 bar and 80 °C. Each module works with a current density of 2.99 A/cm2 and a cell voltage of 2.17 V, producing 16.8 kgH2/h with a specific energy consumption of 59.6 kWh/kg and an LHV efficiency of 56.4%. Auxiliary systems account for 2.8% of the rated power [39].
Regarding the direct catalytic methanation unit, the biogas is directly converted into methane through catalytic methanation at a temperature of 280 °C in a multi-tube packed bed reactor characterized by a double pass system that includes condensate removal after the first pass. This process is conducted at a pressure of 20 bar and is cooled with boiling water. The use of this double pass approach ensures that the methane content and Wobbe index comply with the required specifications for integration into the natural gas grid [41,42]. For the compression unit, the reciprocating compressor has been chosen, as it is the most widely utilized technology for high-pressure applications [43].
Currently, large-scale PtG plants favor hydrogen storage in gaseous form at various pressure levels for hydrogen storage [44]. Therefore, in this study, steel cylinders kept at 200 bar have been considered for the storage unit [45].

2.2. Methods

The core objective of this study is the identification of the optimal plant configurations able to minimize the LCOBM. The latter is the objective function in the optimization process and must be achieved while complying with the 8000-h operating constraint.
min x L C O B M   subject to   O P H = 8000
where x is the vector of the input variables (RES plant sizes and H2 storage capacity).
The OPH are calculated as the sum of hours in which the hourly biomethane production m ˙ B M , t is greater than 0:
O P H = i = 1 8760 t i          
where t i = 1 if m ˙ B M , i > 0 or t i = 0 if   m ˙ B M , i = 0 .
In the next sections, the procedure is described and detailed.

2.2.1. Optimization Approach

The design of energy systems typically involves identifying the optimal configuration based on technical, economic, and environmental objectives. In this study, an optimization framework was developed to determine the optimal size of the renewable energy plant and hydrogen storage unit for the proposed PtG system. This optimization procedure was implemented using the modeFRONTIER tool, an integration platform for optimization problems. It was coupled with a dedicated Techno-Economic Model developed in MATLAB that allows for the sizing of the proposed plant and for the calculation of the LCOBM.
The procedure follows three steps:
(i)
Problem definition, where both RES plant sizes and H2 storage capacity are set as design variables, LCOBM as the objective, and OPH as a constraint.
(ii)
Optimization strategy definition, where the proprietary pilOPT algorithm was selected. This algorithm in modeFRONTIER combines global and local optimization strategies within an adaptive, self-learning framework. Unlike traditional methods, it does not rely on a predefined Design of Experiments; instead, it iteratively generates new designs based on previous evaluations. Convergence is assessed through the stabilization of the objective function and the evolution of the Pareto front, ensuring an efficient balance between exploration and refinement. In this study, a maximum of 200 iterations was adopted.
(iii)
Optimization phase, in which the pilOPT algorithm varies the input variables to achieve the defined objective while satisfying the specified constraint.
Figure 2 shows the structure of the optimization model built in modeFRONTIER. A proper interface ensures communication between modeFRONTIER and the Techno-Economic Model, which uses the operational and performance data of the BP plant obtained by a thermochemical model developed in Aspen Plus (described in Section 2.2.3).

2.2.2. Techno-Economic Model

The core of the optimization process is a Techno-Economic Model developed through MATLAB. The model is divided into two sections: (i) plant sizing and (ii) economic analysis.
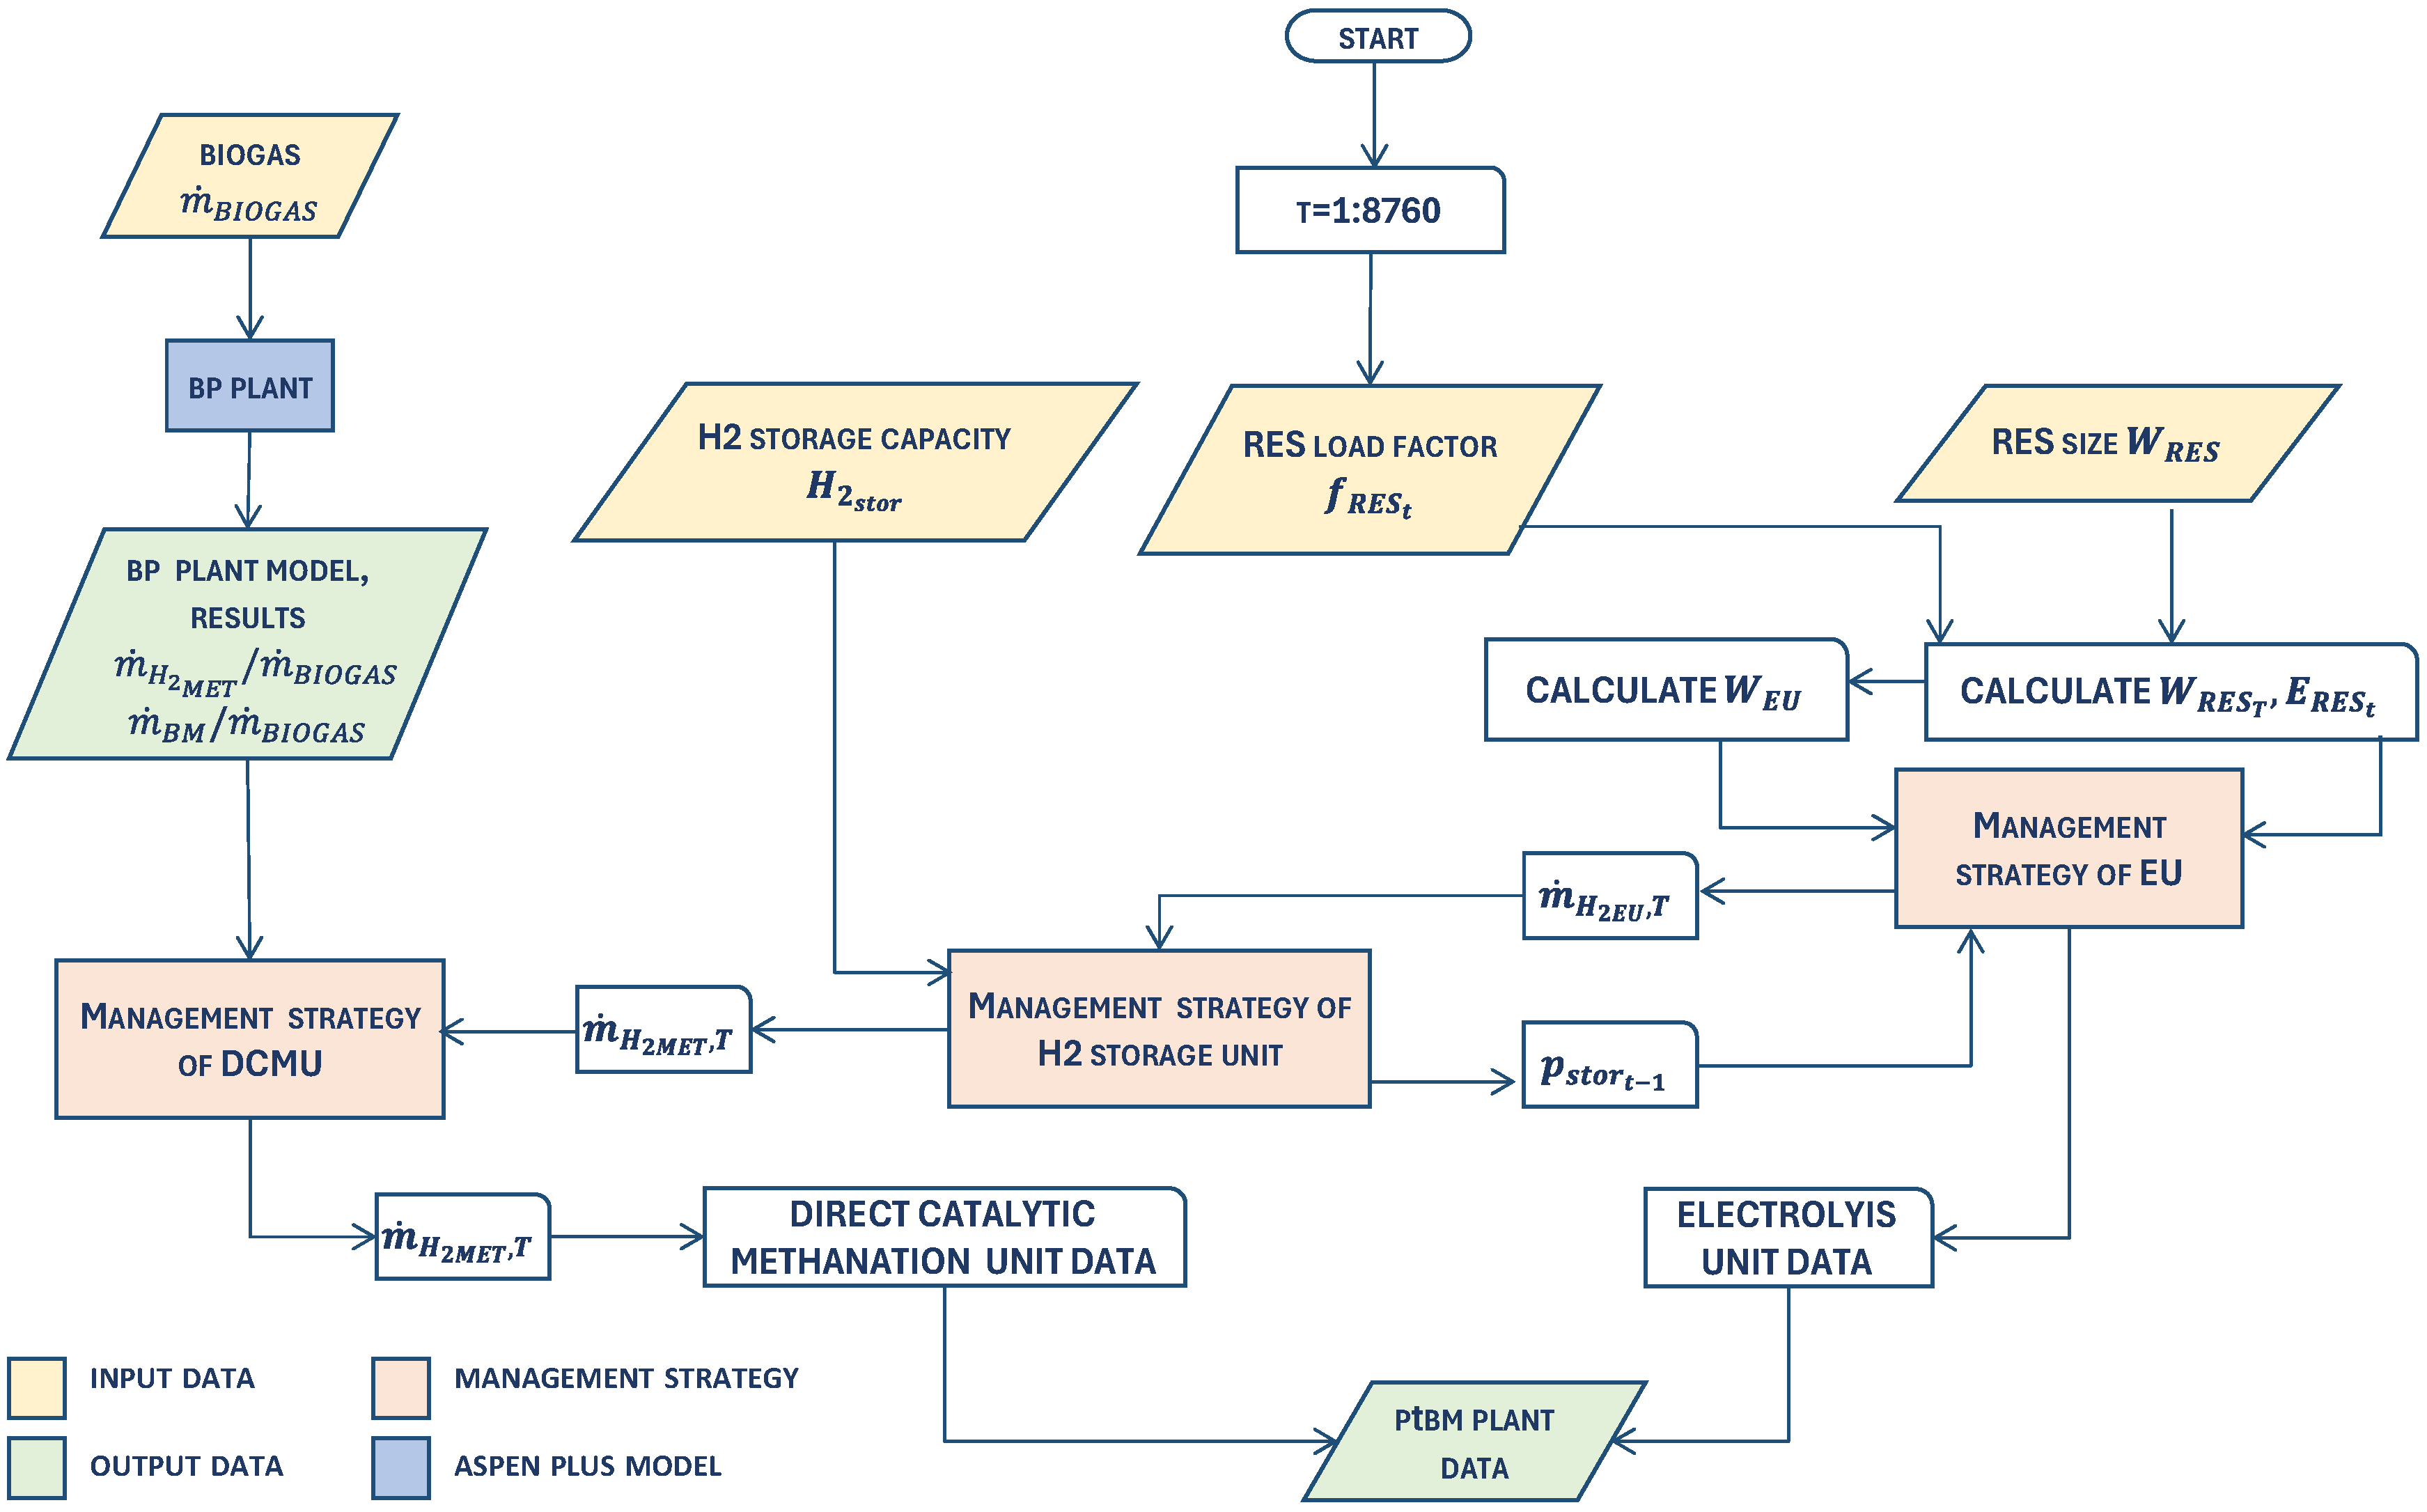
The plant sizing workflow is depicted in Figure 3.
The code operates on a set of input variables and management strategies to (i) size the system components; (ii) calculate annual mass and energy flows; (iii) and evaluate overall performance. The main inputs are as follows:
  • The photovoltaic plant and wind farm (RES) size W R E S (kW);
  • The hydrogen storage capacity (kg);
  • The RES load factor f R E S , t , that is, the hourly specific electric energy production with respect to the RES size (kWh/kW);
  • The operating data of the BP plant, which are the biogas flow rate m ˙ B I O G A S and the hydrogen-to-biogas ratio m ˙ H 2 , M E T / m ˙ B I O G A S .
The BP plant operating data are obtained from a thermochemical model developed in Aspen Plus (described in the next section), and the selected time-step ( t ) is equal to one hour.
The electrolyzer size is determined from the ratio of total electric energy generated from the RES plant and the number (n) of operating hours (the sum of hours in which E R E S , t > 0):
W E U = t = 1 8760 W R E S · f R E S , t n = t = 1 8760 E R E S , t n
This size becomes an input value for the electrolysis unit management strategy.
The management strategies which determine the operation of the three main subsystems are defined as follows:
  • Electrolysis unit: The electrolyzer operates according to both the available RES power and the storage status. It is characterized by a minimum and maximum input power demand ( W E U , m i n , W E U , F L ).
    • When the RES power output falls within the operating range of the electrolyzer ( W E U , m i n   W R E S , t W E U , F L ) the electrolyzer runs at partial or full load, directing hydrogen to storage;
    • If the RES power output exceeds the electrolyzer’s full load power consumption ( W R E S , t > W E U , F L ) the electrolysis unit works at full load, with excess power exported to the grid;
    • If, on the contrary, the RES capacity falls below the minimum power requirement of the electrolyzer ( W R E S , t < W E U , m i n ) or the storage tank is full ( p s t o r , t 1   =   p s t o r , m a x ) the electrolyzer enters standby mode and surplus RES electricity is diverted to the grid.
  • Hydrogen storage: The hydrogen storage unit is defined by four characteristic pressures: minimum ( p s t o r , m i n ), shutdown ( p s t o r , S D ), restart ( p s t o r , R S ,   ), and maximum (   p s t o r , m a x ).
    • When the tank pressure lies between the shutdown and maximum limits ( p s t o r ,   S D < p s t o r , t 1 p s t o r , m a x ), hydrogen is both stored and delivered to the methanation unit;
    • If the pressure drops below the shutdown threshold ( p s t o r , t 1 < p s t o r , S D ) the methanation unit is forced into standby, although hydrogen can still be accumulated in the tank;
    • Above   p s t o r , R S storage continues until restart conditions are satisfied;
    • Once the restart pressure is reached, the conditions for resuming methanation are restored.
  • Methanation unit: The direct catalytic methanation unit (DCMU) is directly controlled by the storage pressure.
    • At maximum tank pressure p s t o r , m a x , the reactor operates at full load;
    • Within the range p s t o r , S D < p s t o r , t 1 < p s t o r , m a x it follows a partial load regime according to a linear relation (Equation (9));
    • If the tank pressure falls to the shutdown value   p s t o r , S D   the unit is switched off; at even lower pressures p s t o r , t 1 < p s t o r , S D it remains in standby until restart conditions are satisfied p s t o r , t 1 p s t o r , R S ;
    • During transitions between shutdown and restart, flushing is performed to ensure safe operation.
The hydrogen storage pressure is updated hourly by applying the real-gas equation of state:
p s t o r , t = p s t o r , t 1 + z · ( m ˙ H 2 E U , t m ˙ H 2 M E T , t ) · t · R H 2 · T s t o r V s t o r
where z is the isothermal compressibility factor, T s t o r is the storage temperature, and   V s t o r is the tank volume. The hydrogen flow to the methanation unit at partial load varies linearly with storage pressure:
m ˙ H 2 M E T , t = c 1 · p s t o r , t 1 + c 2
with
c 1 = m ˙ H 2 M E T , F L m ˙ H 2 M E T , m i n p s t o r , m a x p s t o r , S D c 2 = c 1 · p s t o r , S D + m ˙ H 2 M E T , m i n
where m ˙ H 2 M E T , F L   is the full-load hydrogen flow rate and m ˙ H 2 M E T , m i n is the minimum flow rate (assumed to be equal to 40% of the full-load value).
The economic analysis section of the Techno-Economic Model allows us to determine the levelized cost of biomethane (LCOBM), which is calculated considering the plant’s lifetime (N):
L C O B M = ( n = 0 N 1 C i n v , n , a n ) · C R F + n = t C r e p , n , a n   + n = 0 N 1 C O & M , n , a n n = 0 N 1 m B M , n
C i n v , n , a n is the annualized total investment cost obtained by considering the sum of each component investment cost ( C i n v ) at year n; C r e p , n , a n   is the replacement cost of the components that need to be substituted during the plant’s lifetime, occurring in year t; C O & M , n , a n refers to the annualized operating and maintenance (for all plant’s components) costs at year n; C R F is the Capital Recovery Factor, and m B M , n is the annual biomethane production. The plant lifetime (N), the nominal interest rate ( i ), and the expected inflation rate ( f ) are assumed to be equal to 20 years, 3%, and 2% [46]. The terms in Equation (7) are calculated by Equations (8)–(11), as in ref. [47]:
C i n v , n , a n = C i n v   ( 1 + I r ) n ;   C O & M , n , a n = C O & M   ( 1 + I r ) n
C r e p , t , a n = C ( 1 + I r ) t
I r = i f 1 + f
C R F = I r · ( 1 + I r ) n ( 1 + I r ) n 1
The main economic data for the analysis are listed in Table 3. The maintenance costs have been calculated as a percentage of the specific investment cost for each plant component. The replacement costs have been considered only for the compressor unit and the PEM electrolysis unit (the replacement year is t = 10 years) and they are assumed to be equal to 100% and 40% of the investment cost, respectively.
Moreover, the economic feasibility of the proposed PtBM configuration has also been analyzed by estimating the Discounted Payback Period (DPBP), that is, the period (year) needed to return on the initial investment through the discounted cash flows obtained from the plant. DPBP is calculated as the year in which the following equation is satisfied [54]:
n = 0 D P B P D C F n C i n v = 0
The discounted cash flows are calculated as follows:
D C F n =   P V C F n + D C F n 1
In the first year, as expected, the term D C F n 1 is equal to zero; therefore, the value of the D C F 1 is equal to P V C F 1 . The term P V C F n is the annual Present Value of Cash Flows, calculated as follows:
P V C F n = R e v B M , n , a n + R e v e l , n , a n + R e v O 2 , n , a n + R e v C O 2 , n , a n C O & M , n C r e p , t , a n
In the above equation, the considered revenues originate from the sale of biomethane, electricity (to the grid), oxygen, and CO2. The latter corresponds to the avoided CO2 emissions associated with the substitution of fossil methane with biomethane, which can be monetized by assigning a value consistent with the prices defined within the Emission Trading System (ETS).
R e v ( B M / O 2 / C O 2 ) , n , a n = p ( B M / O 2 / C O 2 ) · m ( B M / O 2 / C O 2 ) , n ( 1 + I r ) n
R e v e l , n , a n = p e l · E g r i d , n ( 1 + I r ) n
where p i (EUR/kg) is the selling price of the material stream, m is its annual production, E g r i d , n (kWh) represents the annual amount of electricity supplied to the grid, and p el   (EUR/kWh) is the electricity selling price. In this analysis, the biomethane selling price is the calculated LCOBM, the electricity selling price is assumed to be EUR 0.1/kWh [55], the oxygen price is set at EUR 0.1/kg [54], and the price for avoided CO2 is assumed to be EUR 75/t [56].

2.2.3. Thermochemical Model

To assess the performance of the biomethane production (BP) plant, the thermochemical model presented in [39] and developed within the Aspen Plus environment has been applied. Figure 4 illustrates the flowsheet of the model, which is divided into four sub-models, each representing a specific section of the plant.
These sections are as follows:
(1) The direct biogas methanation unit operates at 280 °C and 20 bar, following a double-pass configuration in which the condensate is removed after the first pass. The resulting biomethane consists of 98.2% CH4, 0.9% H2, 0.2% CO2, and 0.1% H2O, with a lower heating value (LHV) of 49.75 MJ/kg. The CO2/H2 molar ratio is maintained at 4. The model of the isothermal methanation reactor has been validated by using the experimental data reported in ref. [42] and referring to a cylindrical-shaped Ni/Al2O3-based methanation catalyst. Details and data on the modeling are available in ref. [39].
(2) The PEM electrolysis unit (PEM EU), consisting of modules of 1 MWDC. Each module operates at 20 bar and produces 16.8 kg/h with a specific energy consumption of 59.6 kWh/kg [8].
(3) The hydrogen compression unit (H2 CU), based on reciprocating compressors, which presents a specific consumption of 1.21 kWh/kgH2 [57].
(4) The hydrogen storage unit (H2 SU), which enables the decoupling between the electrolysis dynamics and the methanation unit, is based on gas steel cylinders for hydrogen storage at 200 bar.

2.3. Case Studies

This work considers the installation of a PV power plant and a wind farm in the Puglia Region (Italy). At this site, on a daily basis, the annual solar irradiation ranges from about 16 W/m2 to 135 W/m2, while the wind speed varies between 2.1 m/s and 13.7 m/s. These data have been exploited by using the PVGIS and NASA POWER databases, respectively.
Regarding the solar data for the chosen installation location, the daily irradiation varies from 81.9 kWh/m2 in January to 214.1 kWh/m2 in July. By considering both the installation site and the selected PV panel, the plant capacity factor is equal to 18.1%. Referring to the wind plant, considering both the installation site and the selected wind turbine, a capacity factor equal to 26.8% is obtained. The daily average load factor ( f R E S ) for both PV and wind plants is shown in Figure 5.
Three different case studies are investigated: (i) a PV-based configuration; (ii) a wind-based configuration; and (iii) a hybrid configuration, in which both renewable plants are installed on the same site.

3. Results

The previously outlined optimization procedure allows us to identify, for each case study, the sizes of the plant components that allow us to minimize the LCOBM, respecting the imposed constraint ( O P H = 8000). The results in terms of components’ sizes, and annual energy and mass balances of the optimal configuration of each case study are reported in Table 4.
It is worth underlining that, among the proposed solutions, the hybrid configuration presents the lowest LCOBM (EUR 97.41/MWh), while the highest is obtained for the wind-based configuration (EUR 113.19/MWh). From the perspective of the DPBP analysis, the hybrid configuration achieves the break-even point within 8.7 years, demonstrating a balanced trade-off between investment costs and economic returns. This result can be considered reasonable, especially given the innovative technologies that are integrated in the proposed system configuration for the development of a Power-to-Biomethane plant.
By analyzing and comparing the other data of Table 4, it can be noticed that the photovoltaic-based plant design not only features the largest energy source capacity at 24.5 MW, compared to 16.5 MW for the wind farm and 21.1 MW for the hybrid configuration (consisting of 11.1 MW from solar and 10.0 MW from wind), but it also achieves the highest hydrogen production rate during full operation at 168.6 kg/h, with an electrolysis unit of 10,000 kW of installed power, and needs the greatest storage capacity (2000 kg). These outcomes can be attributed to the highly intermittent nature of solar energy, which requires all plant components to be designed with larger capacities. The hybrid configuration, in contrast, guarantees the most stable hydrogen production rate. As a matter of fact, it is capable of achieving the established hourly biomethane production with an electrolyzer of 6000 kW, a hydrogen production rate of 101.2 kg/h (equal to the one associated with the wind-based configuration), and a storage capacity of 540 kg, which is only one-fourth of the storage capacity required for the PV-based layout and one-third of that needed for the wind configuration, which stands at 1580 kg. The hybrid configuration is also responsible for generating the highest annual output of hydrogen (458.4 tons) and of biomethane (2287.8 tons).
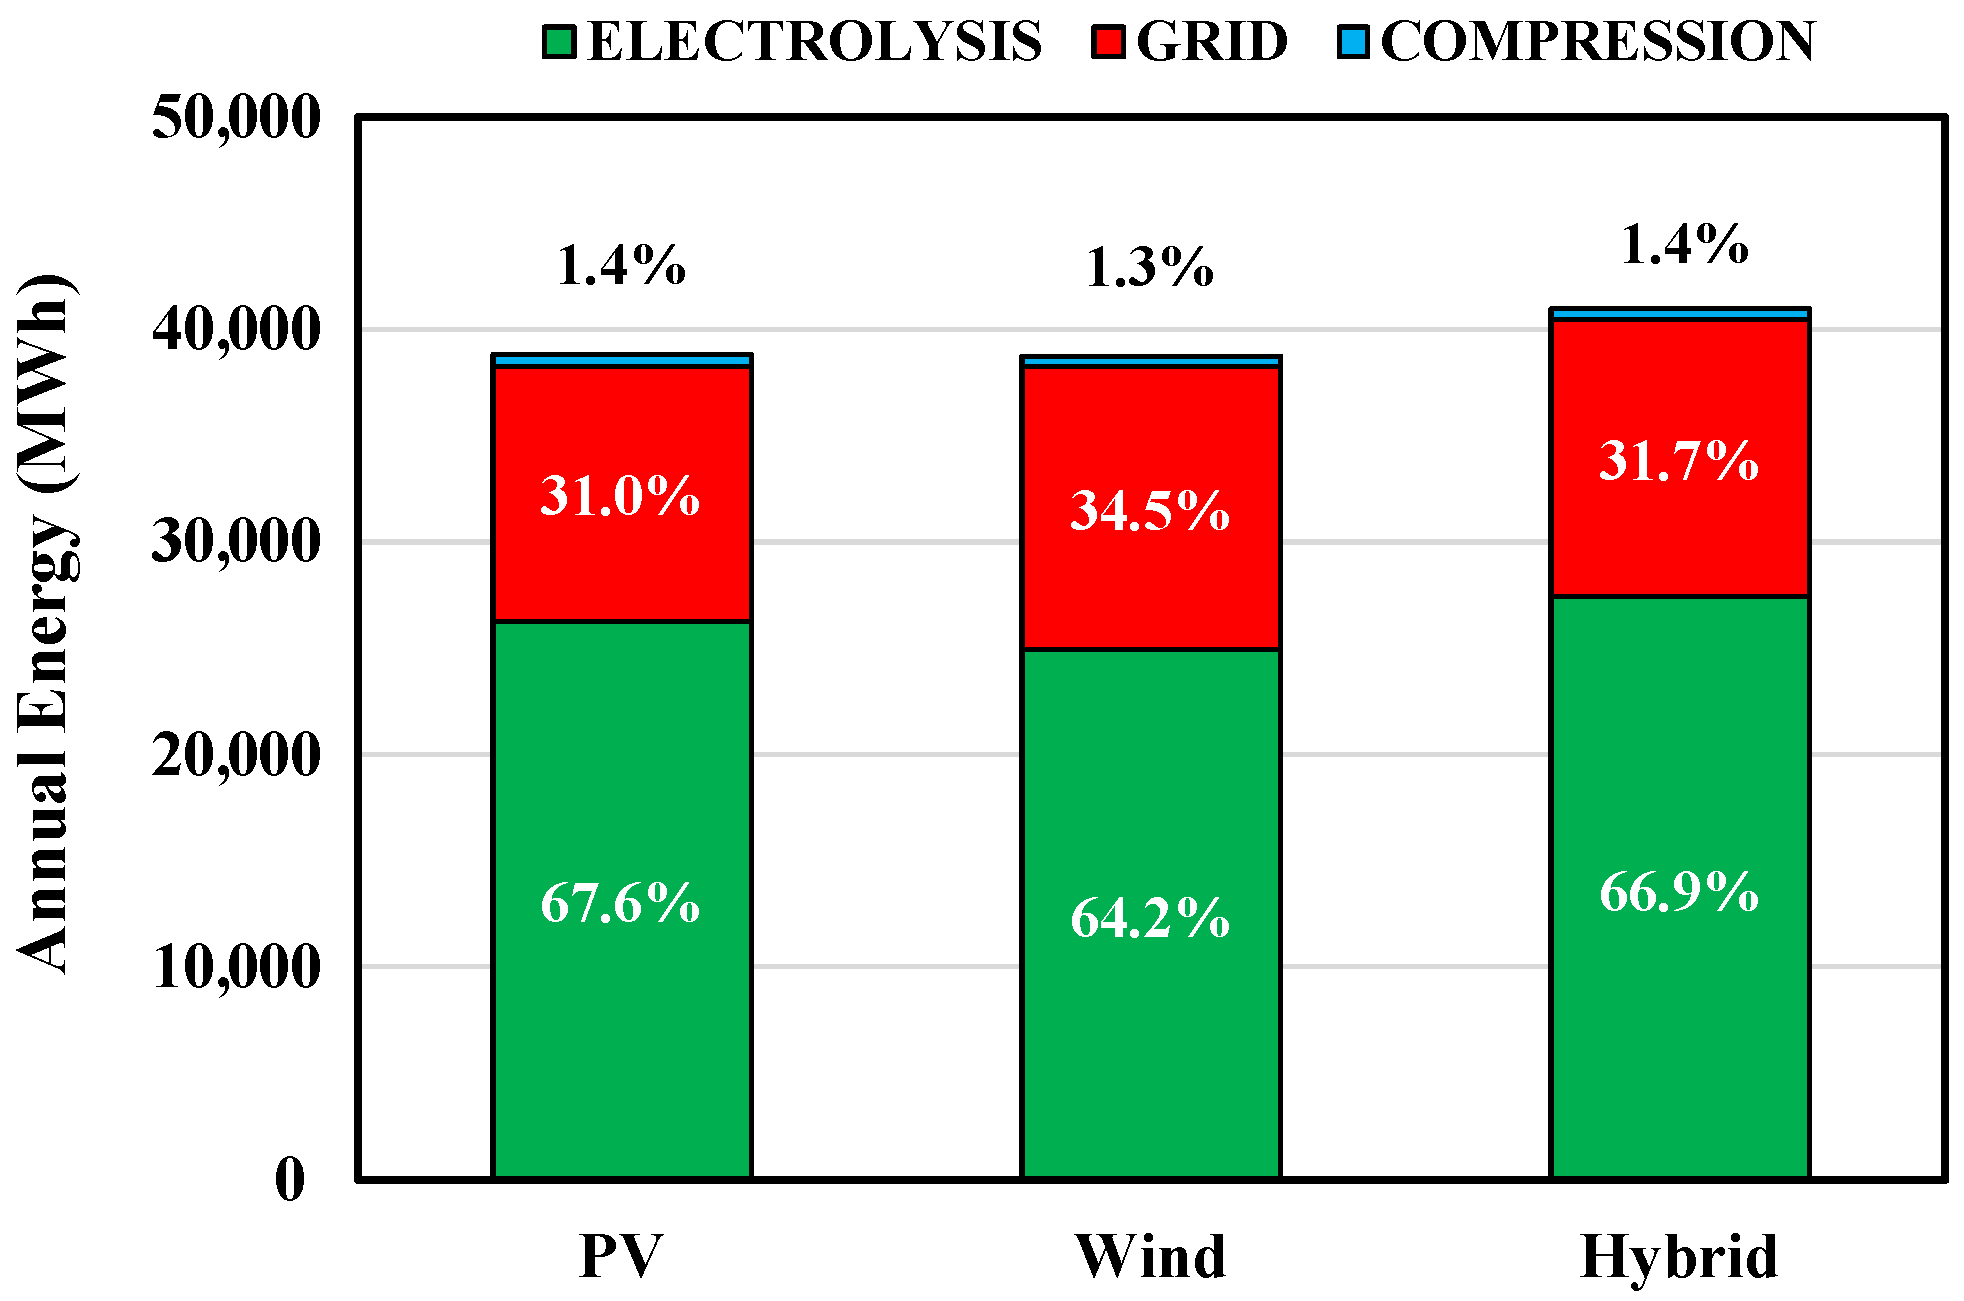
An additional interesting result can be derived from examining the allocation of the total renewable energy generated throughout the year among the electrolysis production, the compression unit, and the grid (Figure 6).
By evaluating these various contributions, it can be concluded that the configurations based on photovoltaic and hybrid systems exhibit nearly identical distributions of the proportions of electricity directed to the electrolysis unit (67.6% and 66.9%, respectively), to the compression unit (1.4% for both), and to the grid (31.0% and 31.7%, respectively). In contrast, the wind-based configuration, while requiring the smallest proportion of electricity for the compression unit (1.3%), also demonstrates the lowest amount of energy allocated to the electrolysis unit (64.2%) and the highest amount sent to the grid (34.5%).
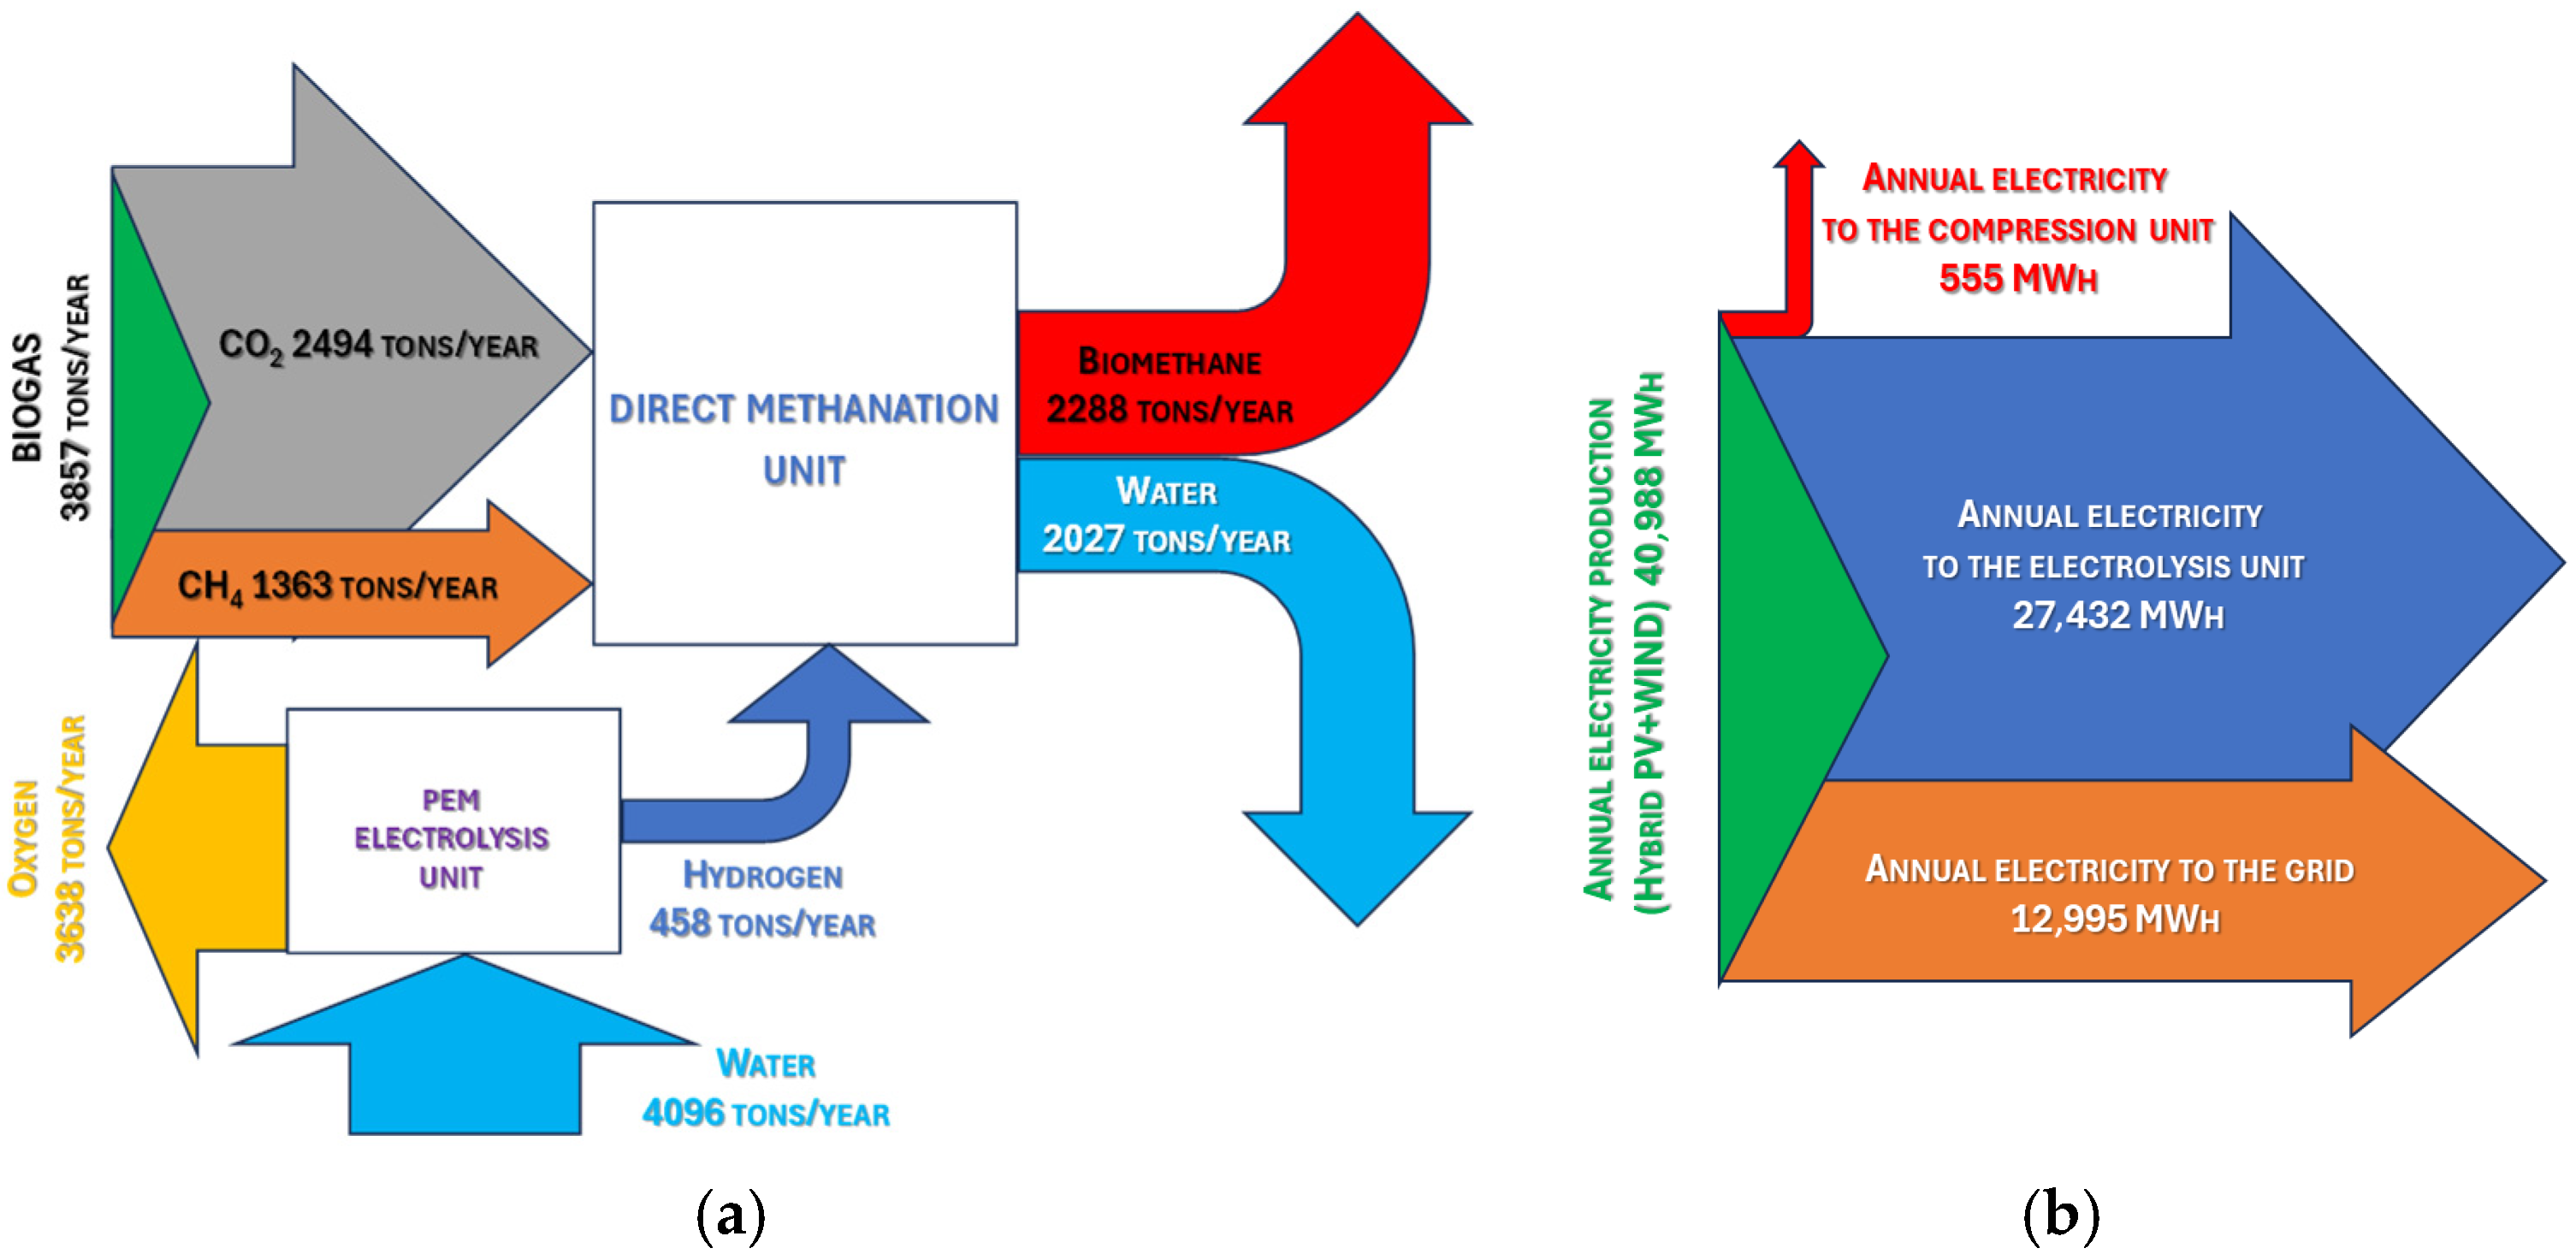
Finally, it is useful to summarize the mass and energy results of the best configuration (hybrid configuration) by using simplified process diagrams, as depicted in Figure 7.
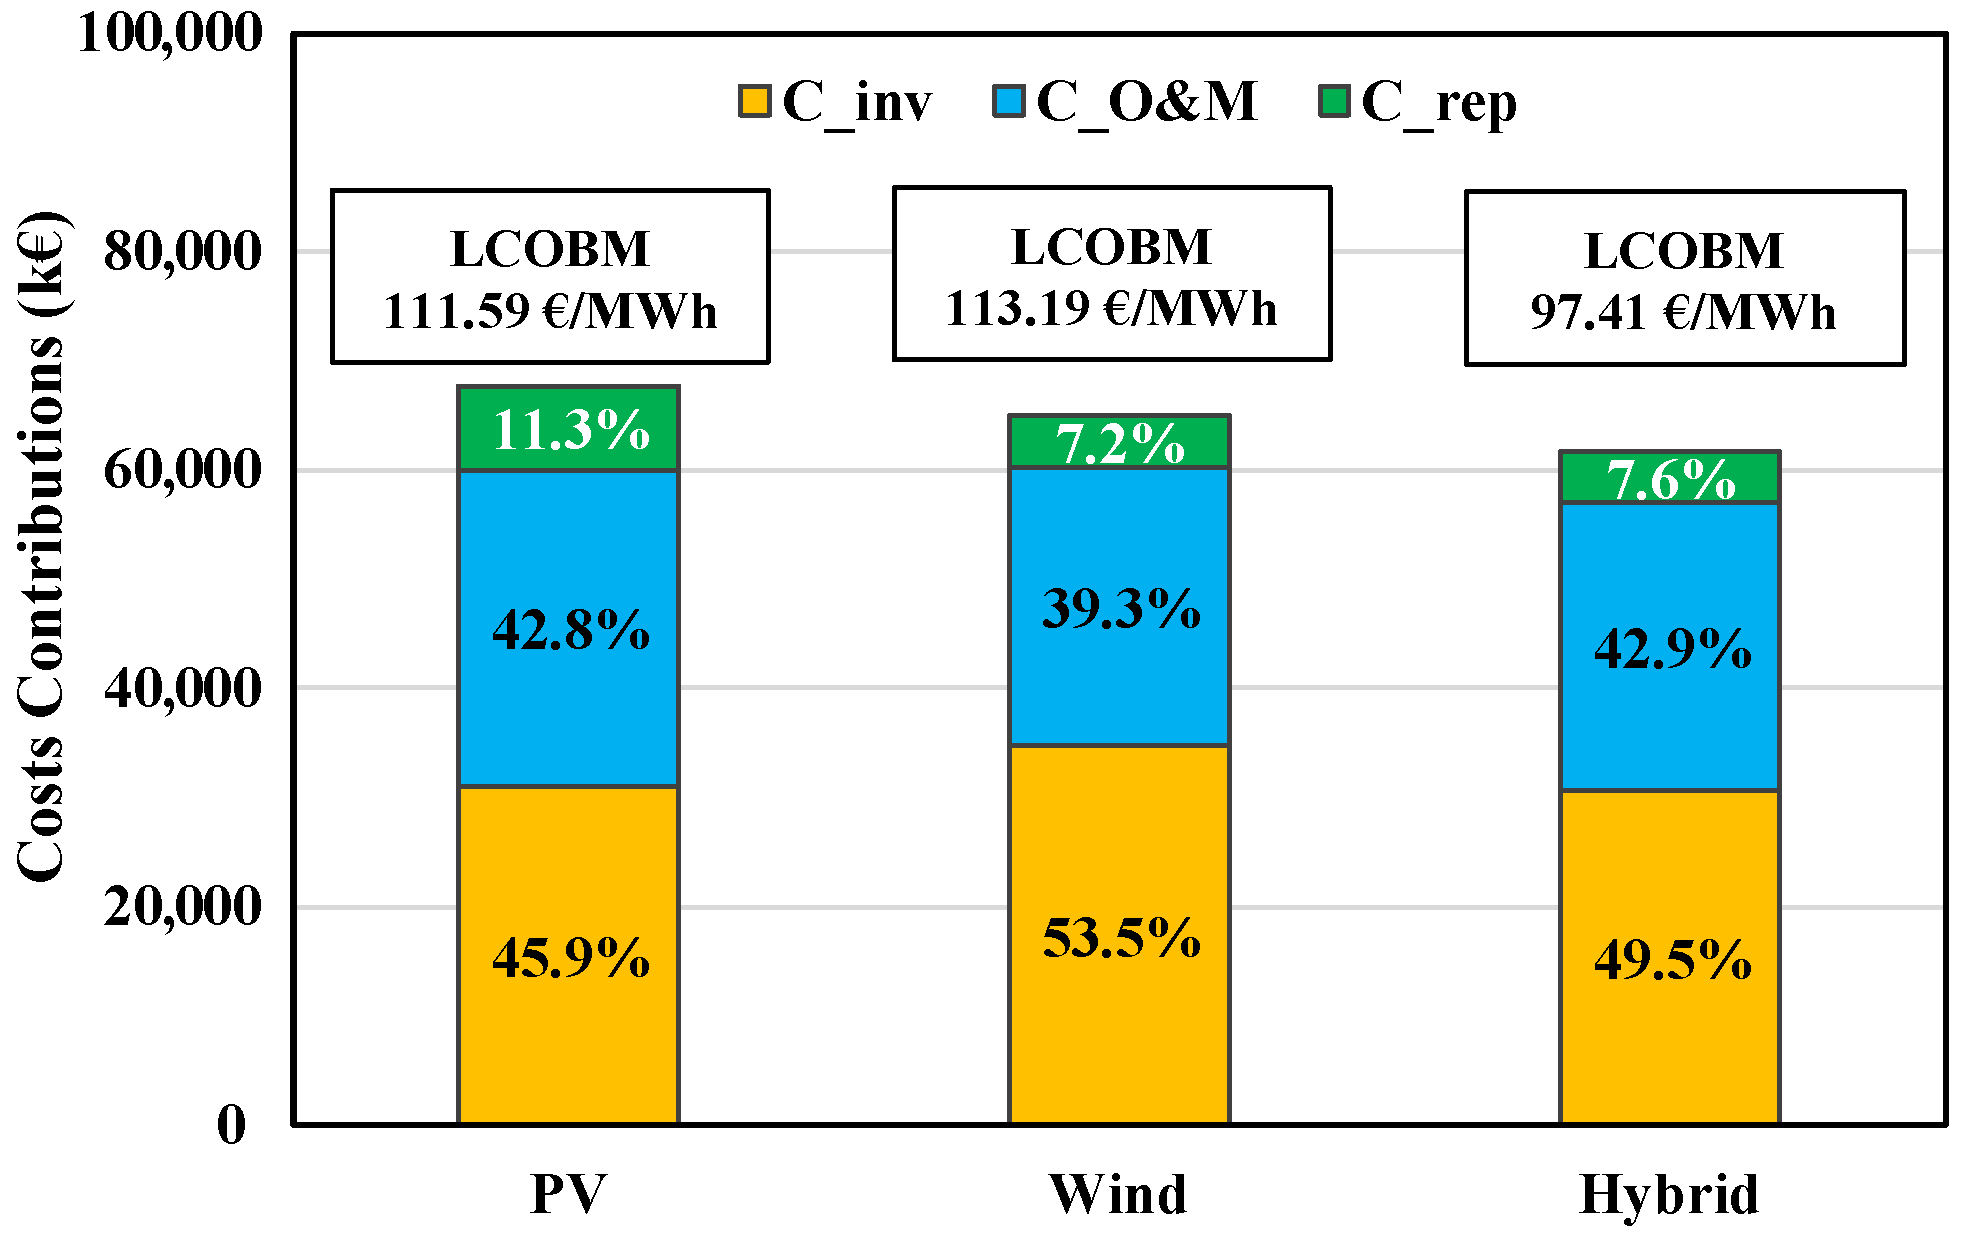
The economic performances of the analyzed plant configurations are shown in Figure 8, Figure 9, Figure 10 and Figure 11. An analysis of the total contributions from investment, operation, maintenance, and replacement costs across the three proposed scenarios (Figure 8) reveals that investment costs constitute the largest portion. Specifically, these costs range from a minimum of 45.9% for the PV configuration to a maximum of 53.5% for the wind-powered plant. This category also exhibits the most significant variation among the three types of costs, primarily due to the considerable disparity in initial investments between the two renewable energy systems, with wind farms being more expensive to install compared to PV solar cells. In contrast, operation and maintenance costs consistently account for approximately 40% of the total across the three scenarios, with a percentage of 39.3% for the wind-based plant and about 43% for both the PV and hybrid configurations.
A detailed examination of the breakdown of individual components associated with investment costs (Figure 9) reveals that in the photovoltaic (PV) configuration, the electrolyzer constitutes over half of the total investment costs (54%). The renewable energy system is immediately followed by the photovoltaic park at 32% and the methanation unit at 7.9%. On the contrary, in the wind and hybrid-based systems, the primary costs are attributed to the wind turbines, which account for 59.8% and 41.3%, respectively, while the electrolyzer’s share falls below half of the total, at 29% and 33%. The costs associated with compression and storage units are relatively minor, at 2.9% and 3.2%, respectively. In all three proposed scenarios, the methanation reactors consistently represent 7–8% of the overall investment cost, while compressor unit costs range from 1.9% to 2.9% of the total, and the hydrogen storage system contributes less than 1% in the hybrid configuration.
The analysis of the O&M costs (Figure 10) shows that the predominant factor is consistently the purchase of biogas, representing 46.6%, 50.2%, and 53.4% of the total in the PV, wind, and hybrid configurations, respectively. This is followed by the share attributed to the electrolyzer, which ranges between 20.7% and 31.4% of the total costs. The renewable energy power plants also make a significant contribution: the PV system accounts for 9.8% of the total costs, while the wind power plant contributes 16.2%. In the hybrid configuration, the PV and wind systems account for 4.8% and 9.5%, respectively.
In all proposed plant configurations, the methanation unit, compressor, and water contribute with lower percentages.
The replacement costs, in turn, range from 7.2% for the wind configuration to 11.3% for the PV one, and, as shown in Figure 11, they are mainly associated with the electrolyzer stack.

Sensitivity Analysis Results

From the conducted study, the hybrid configuration emerged as the most advantageous in terms of biomethane cost, with an estimated payback period of 8.7 years. Since this result is affected by the cost of the electrolyzer, as well as by the selling prices of electricity and biomethane, a sensitivity analysis has been carried out to further investigate this issue.
With respect to the variation in electrolyzer costs, four specific values were considered, based on the projected capital cost range for medium-scale PEM electrolyzers (1–10 MW) by 2050, as reported in the IEA Global Hydrogen Review 2023 database. The selected values reflect expected cost reductions driven by technology learning, economies of scale, and efficiency improvements, in line with medium- and long-term market scenarios [58].
Regarding electricity price variation, four selling prices were considered, ranging from EUR 60 to 180/MWh. These values were chosen to capture differences in electricity costs across various European countries, as well as potential temporal and market scenario variations within the European electricity system.
Finally, concerning the biomethane selling price, two values were assumed. The first corresponds to the current natural gas price (EUR 45/MWh) [59], while the second represents the production cost of biomethane under the national implementations of the Renewable Energy Directives RED II [60] and RED III [61], which support renewable gases through feed-in tariffs, contracts-for-difference, and Guarantee-of-Origin schemes. In this latter case, EUR 120/MWh was adopted as a representative average value.
The results of the sensitivity analysis, in terms of DPBP according to Equations (12)–(16), are summarized in Table 5 and Table 6.
The sensitivity analysis highlighted that if the biomethane selling price is not incentivized compared to the fossil methane price, the plant is not bankable and, therefore, not economically sustainable. Moreover, the electrolyzer cost and, clearly, the selling price of the surplus electricity exported to the grid are decisive factors for economic feasibility. The most favorable outcome from the sensitivity analysis corresponds to a DPBP of 5.7 years, assuming a biomethane selling price of EUR 120/MWh, an electrolyzer cost of EUR 400/kW, and an electricity selling price equal to the current European average (EUR 100/MWh).

4. Discussion and Perspectives

The results of this study indicate that the hybrid PV–wind configuration produces the best design trade-off: it ensures the highest annual biomethane production (≈2288 tons/year) while reducing H2 storage capacity with respect to the other configurations. These findings are consistent with recent analyses indicating that hybrid systems, due to the complementary power generation profiles of PV and wind plants, can significantly reduce the need for oversized electrolyzers and storage systems [42,43]. Consequently, the results of the economic assessment indicate that the hybrid configuration achieves the minimum levelized cost of biomethane (LCOBM), estimated at EUR 97.41/MWh and a DPBP of 8.7 years.
Even though this result may be affected by uncertainties arising from certain modeling assumptions and the choice of a specific installation site, which influences renewable power production and its seasonal fluctuations, it can be stated that the estimated cost is consistent with values reported in similar techno-economic studies in the literature, as discussed in Section 1.2, where biomethane costs are reported to range between 89 and EUR 131/MWh.
Obviously, this cost is not comparable with the natural gas prices worldwide. When compared to the current market price of natural gas, typically fluctuating between 37 and EUR 110/MWh in recent years [62], the production of renewable biomethane remains generally more expensive. This cost gap highlights the need for continued technological improvements and policy support to enhance the competitiveness of biomethane in the energy market.
Nevertheless, although these plants are highly attractive from a sustainability perspective, their large-scale deployment is still constrained by scalability challenges. As a matter of fact, increasing plant capacity requires a proportional increase in the renewable plant sizes, the expansion of hydrogen production, and biogenic CO2 availability (the total available amount of biogenic CO2 is geographically dispersed and relatively small [63]. Moreover, the development of these plants is also affected by technical limits as well as challenges. A critical technical barrier is the durability of methanation catalysts, typically based on Ni/Al2O3 or Ni/CeO2 supports. Catalyst deactivation due to sintering, carbon deposition (coking), and sulfur poisoning can lead to a gradual decline in conversion efficiency and methane yield over time, requiring periodic regeneration or replacement [47,48]. This degradation not only increases maintenance costs but also reduces plant availability, impacting the long-term levelized cost of biomethane.
A good strategy to support these plants by overcoming the above-mentioned criticalities could be the integration of PtBM units within local energy systems such as microgrids or district heating networks, as in this way, it can significantly improve overall energy efficiency and economic viability. The recovery of waste heat from the methanation reactor can be exploited to supply low-temperature heating demand in nearby residential or industrial districts, reducing total system exergy losses. The results of this study pave the way for further analyses that could encompass the evaluation of alternative system configurations to enhance economic performance. These configurations could play a key role in future smart energy districts, promoting circular carbon management and sector coupling between power, heat, and gas networks.
Future work should combine dynamic modeling of the methanation unit with stochastic or probabilistic approaches for PV and wind generation, such as time-series-based scenario generation or robust optimization, to represent a wide range of renewable conditions. These methods can capture short-term fluctuations, seasonal variability, and extreme events, enabling the PtBM system to be evaluated under realistic electricity supply scenarios. When combined with variable CO2 supply and catalyst degradation, this approach provides a more accurate and comprehensive assessment of electrolyzer utilization, storage requirements, methane production, operational flexibility, and overall PtBM scalability [64].

5. Conclusions

This study presents a novel and integrative framework for assessing PtBM systems by combining (i) a thermochemical model for direct catalytic methanation of raw biogas, (ii) a techno-economic model accounting for renewable resource variability and operational strategies, and (iii) an optimization approach to identify cost-optimal system configurations. By coupling detailed sizing with techno-economic optimization, the work bridges process-level and system-level analysis, offering a decision-support tool for PtBM design and deployment.
The analysis, performed using modeFRONTIER with MATLAB and Aspen Plus v14.5 models, considered three renewable energy scenarios (PV, wind, and a hybrid PV–wind system) for a site in Southern Italy. Key findings include the following:
  • The hybrid layout balances power supply, increasing system utilization and reducing methanation downtime.
  • The hybrid PV–wind configuration achieves the best techno-economic performance, with the highest annual biomethane production (~2288 t) and lowest hydrogen storage (~540 kg);
  • The PV system requires the largest capacity (24.5 MW) and storage (2000 kg) due to intermittency, while the wind system has lower costs but reduced production (~2037 t);
  • The corresponding LCOBM is lowest for the hybrid system (EUR 97.4/MWh) compared to PV (EUR 111.6/MWh) and wind (EUR 113.2/MWh);
  • The DPBP is 8.7 years, which can improve under incentivized biomethane tariffs.
In conclusion, it can be affirmed that continuous technological improvements—particularly in electrolyzer cost reduction—together with favorable electricity pricing and policy incentives, can significantly enhance the competitiveness of PtBM systems in future energy scenarios.

Author Contributions

Conceptualization, M.M. and A.P.; methodology, D.L., M.M., and A.P.; software, D.L.; formal analysis, D.L. and G.D.C.; investigation, D.L.; data curation, D.L. and G.D.C.; writing—original draft preparation, D.L., G.D.C., M.M., and A.P.; writing—review and editing, D.L., G.D.C., M.M., and A.P.; supervision, M.M. and A.P. All authors have read and agreed to the published version of the manuscript.

Funding

This research received no external funding.

Data Availability Statement

The raw data supporting the conclusions of this article will be made available by the authors on request.

Conflicts of Interest

The authors declare no conflicts of interest.

Abbreviations

Symbols
c 1 Hydrogen flow to the methanation unit calculation coefficient (kg/s·Pa)
c 2 Hydrogen flow to the methanation unit calculation coefficient (kg/s·Pa)
C I n v , n , a n Annualized Investment Costs (EUR)
C O & M , n , a n Annualized Operating and Maintenance Costs (EUR)
C R e p , n , a n Annualized Replacement Costs (EUR)
C R F Capital Recovery Factor
D C F n Annual discounted cash flows (EUR)
E C Annual electric energy consumption of the compression unit (MWh)
E E U Annual electric energy consumption of the electrolysis unit (MWh)
E G R I D Annual electric energy to the grid (MWh)
E R E S Annual electric energy production (MWh)
E R E S , t RES hourly electric energy (kWh)
f Inflation rate (%)
f R E S , t RES load factor (kWh/kW)
i Nominal interest rate (%)
I r
r
Real interest rate (%)
H2storeH2 Storage Capacity (kg)
m ˙ B I O G A S Biogas flow rate at full load (kg/h)
m B M Annual biomethane production (tons)
m ˙ B M , F L Biomethane flow rate at full load (kg/h)
m ˙ B M , t Hourly biomethane flow rate (kg/h)
m ˙ H 2 E U , t Hourly hydrogen flow rate produced by the electrolysis unit (kg/h)
m ˙ H 2 M E T , F L Hydrogen flow rate to the methanation unit at full load (kg/h)
m ˙ H 2 M E T , t Hourly hydrogen flow rate to the methanation unit (kg/h)
n Year
N Plant lifetime (year)
p s t o r , m a x Maximum storage pressure (Pa)
p s t o r , m i n Minimum storage pressure (Pa)
p s t o r , R S Restart pressure (Pa)
p s t o r , S D Shutdown pressure (Pa)
p s t o r , t Storage pressure at time t (Pa)
P V C F n Annual present value of cash flows (EUR)
R e v n , a n Annualized revenues (EUR)
t Time-step (hour)
W E U Electrolysis unit size (kW)
W e l , E U Electric power consumption of the electrolysis unit (kW)
W E U , F L Electric power consumption of the electrolysis unit at full load (kW)
W E U , m i n Electric power consumption of the electrolysis unit at minimum load (kW)
W R E S RES size (kW)
W R E S , t RES power at time t (kW)
Acronyms
ADAnaerobic Digestion
BMBiomethane
BPBiomethane Production
CAPEXCapital Expenditure
CO2Carbon Dioxide
DCMUDirect Catalytic Methanation Unit
DPBPDiscounted Payback Period
EUElectrolysis Unit
HAWTHorizontal Axis Wind Turbines
H2Hydrogen
LCOBMLevelized Cost of Biomethane
LHVLow Heating Value
O&MOperating and Maintenance
OPHOperating Hours (h)
PEMELProton Exchange Membrane Electrolysis
PtBMPower-to-Biomethane
PtGPower-to-Gas
PVPhotovoltaic
RESRenewable Energy Source

References

  1. Nemmour, A.; Inayat, A.; Janajreh, I.; Ghenai, C. Green hydrogen-based E-fuels (E-methane, E-methanol, E-ammonia) to support clean energy transition: A literature review. Int. J. Hydrogen Energy 2023, 48, 29011–29033. [Google Scholar] [CrossRef]
  2. Martin, J.; Neumann, A.; Ødegård, A. Renewable hydrogen and synthetic fuels versus fossil fuels for trucking, shipping and aviation: A holistic cost model. Renew. Sustain. Energy Rev. 2023, 186, 113637. [Google Scholar] [CrossRef]
  3. Schnuelle, C.; Thoeming, J.; Wassermann, T.; Thier, P.; von Gleich, A.; Goessling-Reisemann, S. Socio-technical-economic assessment of power-to-X: Potentials and limitations for an integration into the German energy system. Energy Res. Soc. Sci. 2019, 51, 187–197. [Google Scholar] [CrossRef]
  4. Ruth, M.; Goessling-Reisemann, S. Handbook on Resilience of Socio-Technical Systems, 1st ed.; Edward Elgar Publishing: Cheltenham, UK, 2019. [Google Scholar]
  5. Hasanzad, F.; Rastegar, H. Resilience enhancement of interdependent electricity-natural gas system considering gas storage and power to gas technology. J. Energy Storage 2022, 56, 106025. [Google Scholar] [CrossRef]
  6. Ghaib, K.; Ben-Fares, F.Z. Power-to-Methane: A state-of-the-art review. Renew. Sustain. Energy Rev. 2018, 81, 433–446. [Google Scholar] [CrossRef]
  7. Prabhakaran, P.; Graf, F.; Koeppel, W.; Kolb, T. Modelling and validation of energy systems with dynamically operated Power to Gas plants for gas-based sector coupling in de-central energy hubs. Energy Convers. Manag. 2023, 276, 116534. [Google Scholar] [CrossRef]
  8. Assunção, L.R.C.; Mendes, P.A.S.; Matos, S.; Borschiver, S. Technology roadmap of renewable natural gas: Identifying trends for research and development to improve biogas upgrading technology management. Appl. Energy 2021, 292, 116849. [Google Scholar] [CrossRef]
  9. Moioli, E.; Schildhauer, T.J. Techno-economic-environmental assessment of the integration of power-to-X and biogas utilization towards the production of electricity, hydrogen, methane and methanol. Sustain. Energy Fuels 2023, 7, 2690–2706. [Google Scholar] [CrossRef]
  10. IEA Bioenergy. Circular Economy Approaches to Integration of Anaerobic Digestion with Power to X Digestion to X Technologies; IEA Bioenergy: Dublin, Ireland, 2024. [Google Scholar]
  11. Tayyab, M.; Dreis, M.; Blaudszun, D. Closing the carbon cycle: Challenges and opportunities of CO2 electrolyser designs in light of cross-industrial CO2 source-sink matching in. Energy Environ. Sci. 2025, 18, 6854–6873. [Google Scholar] [CrossRef]
  12. Christianides, D.; Bagaki, D.A.; Timmers, R.A.; Zrimec, M.B.; Theodoropoulou, A.; Angelidaki, I.; Kougias, P.; Zampieri, G.; Kamergi, N.; Napoli, A.; et al. Biogenic CO2 Emissions in the EU Biofuel and Bioenergy Sector: Mapping Sources, Regional Trends, and Pathways for Capture and Utilisation. Energies 2025, 18, 1345. [Google Scholar] [CrossRef]
  13. Raimondi, G.; Greco, G.; Ongis, M.; D’Antuono, G.; Lanni, D.; Spazzafumo, G. Techno-Economical Assessment for Combined Production of Hydrogen, Heat, and Power from Residual Lignocellulosic Agricultural Biomass in Huesca Province (Spain). Energies 2024, 17, 813. [Google Scholar] [CrossRef]
  14. EUR-Lex. Communication from the Commission to the European Parliament, the European Council, the Council, the European Economic and Social Committee and the Committee of the Regions the European Green Deal. 2019. Available online: https://eur-lex.europa.eu/legal-content/EN/TXT/?uri=CELEX:52019DC0640 (accessed on 13 October 2025).
  15. European Commission. Biomethane. 2022. Available online: https://energy.ec.europa.eu/topics/renewable-energy/bioenergy/biomethane_en (accessed on 13 October 2025).
  16. Menin, L.; Benedetti, V.; Patuzzi, F.; Baratieri, M. Techno-economic modeling of an integrated biomethane-biomethanol production process via biomass gasification, electrolysis, biomethanation, and catalytic methanol synthesis. Biomass Convers. Biorefinery 2023, 13, 977–998. [Google Scholar] [CrossRef]
  17. European Biogas Association (EBA). EBA Policy Paper: Proposal on the Energy Market Design Revision; European Biogas Association (EBA): Brussels, Belgium, 2023. [Google Scholar]
  18. EUR-Lex. Communication from the Commission to the European Parliament, the European Council, the Council, the European Economic and Social Committee and the Committee of the RegioNS REPowerEU Plan. 2022. Available online: https://eur-lex.europa.eu/legal-content/EN/TXT/?uri=celex:52022DC0230 (accessed on 13 October 2025).
  19. News European Parliament. Reform of EU Gas Market: New Measures to Decarbonise and Secure Supply; European Commission: Brussels, Belgium, 2023; Available online: https://www.europarl.europa.eu/news/en/press-room/20230206IPR72111/reform-of-eu-gas-market-new-measures-to-decarbonise-and-secure-supply (accessed on 13 October 2025).
  20. Collet, P.; Flottes, E.; Favre, A.; Raynal, L.; Pierre, H.; Capela, S.; Peregrina, C. Techno-economic and Life Cycle Assessment of methane production via biogas upgrading and power to gas technology. Appl. Energy 2017, 192, 282–295. [Google Scholar] [CrossRef]
  21. Calbry-Muzyka, A.S.; Schildhauer, T.J. Direct Methanation of Biogas—Technical Challenges and Recent Progress. Front. Energy Res. 2020, 8, 570887. [Google Scholar] [CrossRef]
  22. Witte, J.; Settino, J.; Biollaz, S.M.A.; Schildhauer, T.J. Direct catalytic methanation of biogas—Part I: New insights into biomethane production using rate-based modelling and detailed process analysis. Energy Convers. Manag. 2018, 171, 750–768. [Google Scholar] [CrossRef]
  23. Hidalgo, D.; Martín-Marroquín, J.M. Power-to-methane, coupling CO2 capture with fuel production: An overview. Renew. Sustain. Energy Rev. 2020, 132, 110057. [Google Scholar] [CrossRef]
  24. Witte, J.; Calbry-Muzyka, A.; Wieseler, T.; Hottinger, P.; Biollaz, S.M.A.; Schildhauer, T.J. Demonstrating direct methanation of real biogas in a fluidised bed reactor. Appl. Energy 2019, 240, 359–371. [Google Scholar] [CrossRef]
  25. Furst, O.; Wehrle, L.; Schmider, D.; Dailly, J.; Deutschmann, O. Modeling, optimization and comparative assessment of power-to-methane and carbon capture technologies for renewable fuel production. Appl. Energy 2024, 375, 123972. [Google Scholar] [CrossRef]
  26. Inkeri, E.; Tynjälä, T.; Karjunen, H. Significance of methanation reactor dynamics on the annual efficiency of power-to-gas-system. Renew. Energy 2021, 163, 1113–1126. [Google Scholar] [CrossRef]
  27. Janke, L.; Ruoss, F.; Hahn, A.; Weinrich, S.; Nordberg, Å. Modelling synthetic methane production for decarbonising public transport buses: A techno-economic assessment of an integrated power-to-gas concept for urban biogas plants. Energy Convers. Manag. 2022, 259, 115574. [Google Scholar] [CrossRef]
  28. Bedoić, R.; Dorotić, H.; Schneider, D.R.; Čuček, L.; Ćosić, B.; Pukšec, T.; Duić, N. Synergy between feedstock gate fee and power-to-gas: An energy and economic analysis of renewable methane production in a biogas plant. Renew. Energy 2021, 173, 12–23. [Google Scholar] [CrossRef]
  29. Ghafoori, M.S.; Loubar, K.; Marin-Gallego, M.; Tazerout, M. Techno-economic and sensitivity analysis of biomethane production via landfill biogas upgrading and power-to-gas technology. Energy 2022, 239, 122086. [Google Scholar] [CrossRef]
  30. Michailos, S.; Walker, M.; Moody, A.; Poggio, D.; Pourkashanian, M. A techno-economic assessment of implementing power-to-gas systems based on biomethanation in an operating waste water treatment plant. J. Environ. Chem. Eng. 2021, 9, 104735. [Google Scholar] [CrossRef]
  31. Giglio, E.; Bianco, M.; Zanardi, G.; Catizzone, E.; Giordano, G.; Migliori, M. Direct biogas methanation via renewable-based Power-to-Gas: Techno-economic assessment based on real industrial data. Energy Convers. Manag. 2025, 332, 119775. [Google Scholar] [CrossRef]
  32. McDonagh, S.; O’Shea, R.; Wall, D.M.; Deane, J.P.; Murphy, J.D. Modelling of a power-to-gas system to predict the levelised cost of energy of an advanced renewable gaseous transport fuel. Appl. Energy 2018, 215, 444–456. [Google Scholar] [CrossRef]
  33. Brands, M.B.; Beuel, P.; Torres-Rivera, F.; Beckmüller, R.; Ayoub, M.S.; Stenzel, P. Optimization of biomethane production from purified biowaste pyrolysis gas: A comparative techno-economic assessment. Renew. Energy 2025, 245, 122865. [Google Scholar] [CrossRef]
  34. Fu, Y.; Luo, T.; Mei, Z.; Li, J.; Qiu, K.; Ge, Y. Dry anaerobic digestion technologies for agricultural straw and acceptability in China. Sustainability 2018, 10, 4588. [Google Scholar] [CrossRef]
  35. Angelidaki, I.; Treu, L.; Tsapekos, P.; Luo, G.; Campanaro, S.; Wenzel, H.; Kougias, P.G. Biogas upgrading and utilization: Current status and perspectives. Biotechnol. Adv. 2018, 36, 452–466. [Google Scholar] [CrossRef] [PubMed]
  36. Scarlat, N.; Dallemand, J.; Fahl, F. Biogas: Developments and perspectives in Europe. Renew. Energy 2018, 129, 457–472. [Google Scholar] [CrossRef]
  37. Budzianowski, W.M.; Budzianowska, D.A. Economic analysis of biomethane and bioelectricity generation from biogas using different support schemes and plant con fi gurations. Energy 2015, 88, 658–666. [Google Scholar] [CrossRef]
  38. Benda, V.; Černá, L. PV cells and modules—State of the art, limits and trends. Heliyon 2020, 6, e05666. [Google Scholar] [CrossRef]
  39. Lanni, D.; Minutillo, M.; Cigolotti, V.; Perna, A. Biomethane production through the power to gas concept: A strategy for increasing the renewable sources exploitation and promoting the green energy transition. Energy Convers. Manag. 2023, 293, 117538. [Google Scholar] [CrossRef]
  40. Rehman, S.; Alhems, L.M.; Alam, M.M.; Wang, L.; Toor, Z. A review of energy extraction from wind and ocean: Technologies, merits, efficiencies, and cost. Ocean Eng. 2023, 267, 113192. [Google Scholar] [CrossRef]
  41. de Carvalho, F.S.; Reis, L.C.B.d.S.; Lacava, P.T.; Araújo, F.H.M.d.; Carvalho, J.A.d. Substitution of Natural Gas by Biomethane: Operational Aspects in Industrial Equipment. Energies 2023, 16, 839. [Google Scholar] [CrossRef]
  42. Dannesboe, C.; Hansen, J.B.; Johannsen, I. Catalytic methanation of CO2 in biogas: Experimental results from a reactor at full scale. React. Chem. Eng. 2020, 5, 183–189. [Google Scholar] [CrossRef]
  43. Sdanghi, G.; Maranzana, G.; Celzard, A.; Fierro, V. Review of the current technologies and performances of hydrogen compression for stationary and automotive applications. Renew. Sustain. Energy Rev. 2019, 102, 150–170. [Google Scholar] [CrossRef]
  44. Gorre, J.; Ruoss, F.; Karjunen, H.; Schaffert, J.; Tynjälä, T. Cost benefits of optimizing hydrogen storage and methanation capacities for Power-to-Gas plants in dynamic operation. Appl. Energy 2020, 257, 113967. [Google Scholar] [CrossRef]
  45. Makridis, S.S. Hydrogen storage and compression. In MMethane and Hydrogen for Energy Storage; The Institution of Engineering and Technology: Stevenage, UK, 2016; Volume 2, pp. 1–28. [Google Scholar] [CrossRef]
  46. Wang, K.; Herrando, M.; Pantaleo, A.M.; Markides, C.N. Technoeconomic assessments of hybrid photovoltaic-thermal vs. conventional solar-energy systems: Case studies in heat and power provision to sports centres. Appl. Energy 2019, 254, 113657. [Google Scholar] [CrossRef]
  47. Perna, A.; Moretti, L.; Ficco, G.; Spazzafumo, G.; Canale, L.; Dell’isola, M. SNG generation via power to gas technology: Plant design and annual performance assessment. Appl. Sci. 2020, 10, 8443. [Google Scholar] [CrossRef]
  48. Blazquez-Diaz, C. Techno-economic modelling and analysis of hydrogen fuelling stations. Int. J. Hydrogen Energy 2019, 44, 495–510. [Google Scholar] [CrossRef]
  49. Elgowainy, A.; Reddi, K.; Lee, D.Y.; Rustagi, N.; Gupta, E. Techno-economic and thermodynamic analysis of pre-cooling systems at gaseous hydrogen refueling stations. Int. J. Hydrogen Energy 2017, 42, 29067–29079. [Google Scholar] [CrossRef]
  50. Gorre, J.; Ortloff, F.; van Leeuwen, C. Production costs for synthetic methane in 2030 and 2050 of an optimized Power-to-Gas plant with intermediate hydrogen storage. Appl. Energy 2019, 253, 113594. [Google Scholar] [CrossRef]
  51. Wegener, M.; Villarroel Schneider, J.; Malmquist, A.; Isalgue, A.; Martin, A.; Martin, V. Techno-economic optimization model for polygeneration hybrid energy storage systems using biogas and batteries. Energy 2021, 218, 119544. [Google Scholar] [CrossRef]
  52. Perna, A.; Minutillo, M.; Di Micco, S.; Jannelli, E. Design and Costs Analysis of Hydrogen Refuelling Stations Based on Different Hydrogen Sources and Plant Configurations. Energies 2022, 15, 541. [Google Scholar] [CrossRef]
  53. Jang, D.; Kim, J.; Kim, D.; Han, W.B.; Kang, S. Techno-economic analysis and Monte Carlo simulation of green hydrogen production technology through various water electrolysis technologies. Energy Convers. Manag. 2022, 258, 115499. [Google Scholar] [CrossRef]
  54. Perna, A.; Jannelli, E.; Di Micco, S.; Romano, F.; Minutillo, M. Designing, sizing and economic feasibility of a green hydrogen supply chain for maritime transportation. Energy Convers. Manag. 2023, 278, 116702. [Google Scholar] [CrossRef]
  55. Center, G. Electricity Prices in Europe Fell Significantly in January 2023. Available online: https://gmk.center/en/posts/electricity-prices-in-europe-fell-significantly-in-january-2023/ (accessed on 13 October 2025).
  56. KGroup. EU ETS Report CO2 Market February 2025; KGroup: Chiba, Japan, 2025. [Google Scholar]
  57. Lanni, D.; Di Cicco, G.; Minutillo, M.; Cigolotti, V.; Perna, A. Techno-economic assessment of a green liquid hydrogen supply chain for ship refueling. Int. J. Hydrogen Energy 2025, 97, 104–116. [Google Scholar] [CrossRef]
  58. IEA. Global Hydrogen Review 2023; IEA: Paris, France, 2023. [Google Scholar]
  59. Terna and Snam. Documento di Descrizione Degli Scenari 2022; Terna Academy: Viverone, Italy, 2022. [Google Scholar]
  60. EUR-Lex. Directive (EU) 2018/2001 of The European Parliament And Of The Council of 11 December 2018 on the Promotion of the Use of Energy from Renewable Sources. 2018. Available online: https://eur-lex.europa.eu/legal-content/EN/TXT/?uri=uriserv:OJ.L_.2018.328.01.0082.01.ENG&toc=OJ:L:2018:328:TOC (accessed on 13 October 2025).
  61. EUR-Lex. Directive (EU) 2023/2413 of the European Parliament and of the Council of 18 October 2023 amending Directive (EU) 2018/2001. Regulation (EU) 2018/1999 and Directive 98/70/EC as Regards the Promotion of Energy from Renewable Sources, and Repealing Council. 2023. Available online: https://eur-lex.europa.eu/eli/dir/2023/2413/oj/eng?utm_source=chatgpt.com (accessed on 13 October 2025).
  62. Eurostat Gas Prices for Non-Household Consumers—Bi-Annual Data (From 2007 Onwards). 2025. Available online: https://ec.europa.eu/eurostat/databrowser/view/nrg_pc_203/default/table?lang=en (accessed on 29 September 2025).
  63. Rodin, V.; Lindorfer, J.; Böhm, H.; Vieira, L. Assessing the potential of carbon dioxide valorisation in Europe with focus on biogenic CO2. J. CO2 Util. 2020, 41, 101219. [Google Scholar] [CrossRef]
  64. Giglio, E.; Pirone, R.; Bensaid, S. Dynamic modelling of methanation reactors during start-up and regulation in intermittent power-to-gas applications. Renew. Energy 2021, 170, 1040–1051. [Google Scholar] [CrossRef]
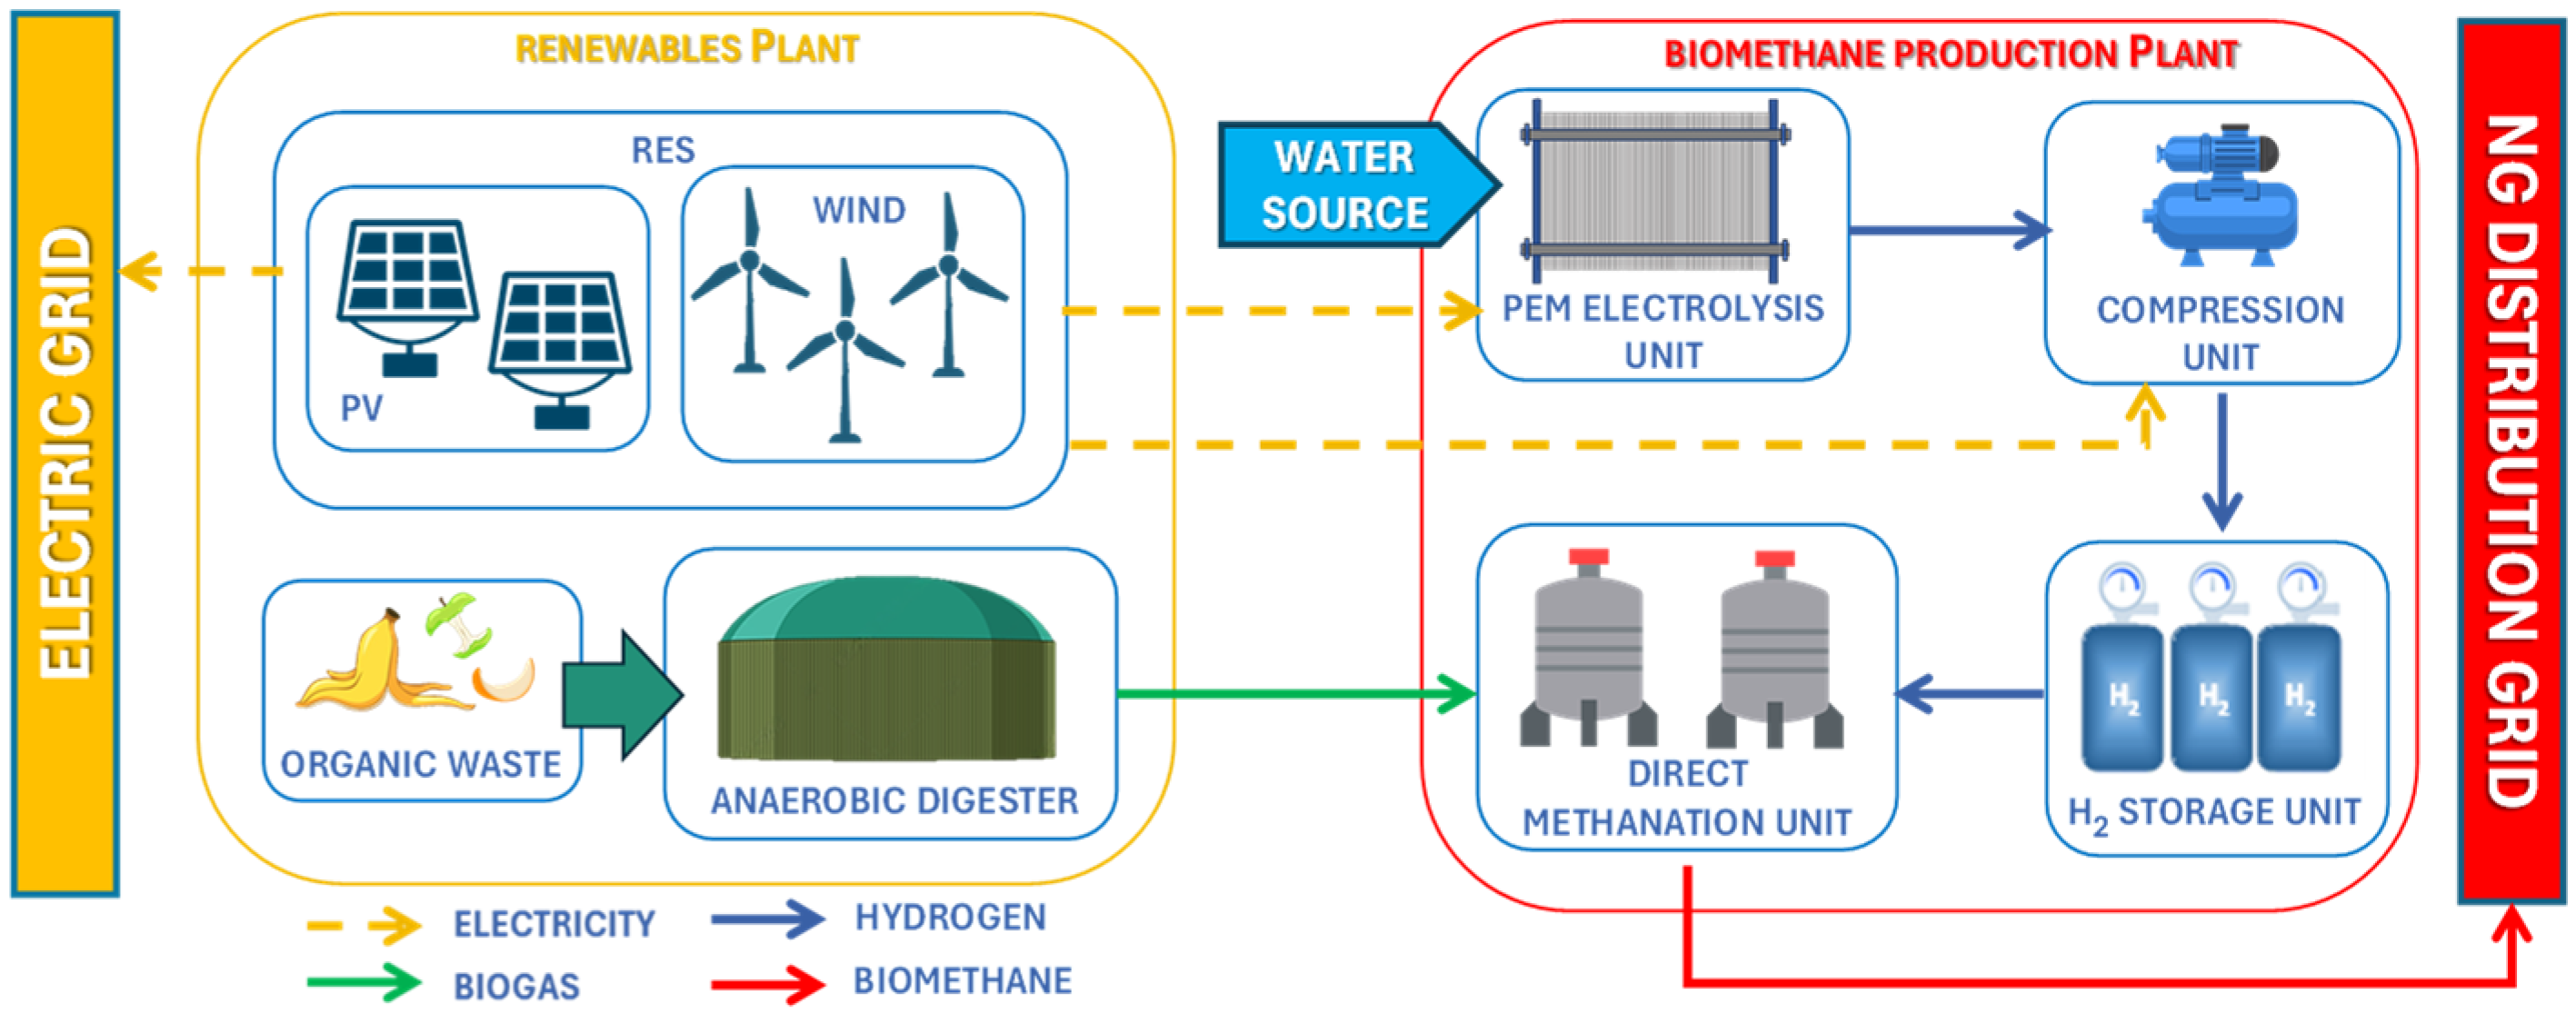
Figure 1. From renewable electricity and biogas to biomethane: the Power-to-Biomethane plant concept.
Applsci 15 12170 g001
Figure 2. Optimization model workflow.
Applsci 15 12170 g002
Figure 3. Plant sizing workflow.
Applsci 15 12170 g003
Figure 4. Flowsheet of the biomethane production plant model.
Applsci 15 12170 g004
Figure 5. Monthly average load factor for PV and wind plants.
Applsci 15 12170 g005
Figure 6. Contribution of the annual electricity sent to the electrolysis unit, the compression unit, and the electrical grid at the optimal design points which guarantee the minimum LCOBM.
Applsci 15 12170 g006
Figure 7. Mass (a) and energy (b) flows diagrams of the hybrid configuration.
Applsci 15 12170 g007
Figure 8. Contributions of investment, operation and maintenance, and replacement costs in the three proposed renewable energy supply options (PV, wind, and hybrid).
Applsci 15 12170 g008
Figure 9. Contributions of investment costs in the three proposed renewable energy supply options (PV, wind, and hybrid).
Applsci 15 12170 g009
Figure 10. Contributions of operation and maintenance costs in the three proposed renewable energy supply options (PV, wind, and hybrid).
Applsci 15 12170 g010
Figure 11. Contributions of replacement costs in the three proposed renewable energy supply options (PV, wind, and hybrid).
Applsci 15 12170 g011
Table 1. Summary of selected literature on PtM systems.
ResearchStudy TypePlant LayoutResults
Janke et al. [27]Dynamic discrete-event simulation, techno-economic assessmentAnaerobic digestion + power-to-gas (synthetic CH4 production, CO2 from AD, electricity from grid/RES)Constraints on renewable electricity usage and CO2 variability require larger installed plant sizes and larger storage units, increasing complexity and production cost.
Bedoić et al. [28]Mathematical modeling/energy and economic analysis applied to a real biogas plantBiogas plant + direct methanation powered by PV and wind (with grid backup)~60% of electricity demand could be met by RES; a feedstock gate fee of ~EUR 120/t was identified as the factor which ensures the economic feasibility of the system.
Ghafoori et al. [29]Techno-economic assessment + sensitivity analysis comparing landfill biogas upgrading and PtG methanation options(a) Biogas upgrading (water scrubbing, membrane) and (b) PtG (direct methanation; methanation + upgrading by membrane)LCOBM in direct methanation: ~EUR 78–131/MWh; LCOBM in methanation + upgrading ~EUR 92–150/MWh.
Michailos et al. [30]Techno-economic assessment with parametric analysisWastewater treatment plant integrating bio-methanation (in situ/ex situ) + electrolysis (on-site wind vs. grid electricity scenarios)Base-case LCOBM reported ≈GBP 127.8–159.8/MWh; with policy incentives and considering oxygen revenues, a reduction ranging from 57 to 75% can be achieved.
Giglio et al. [31]Techno-economic assessment using real industrial anaerobic digestion plant dataAnaerobic digestion + biogas cleaning + direct catalytic methanation (multi-tubular cooled fixed-bed reactors) + PV-powered electrolysis; three storage strategies examined (Buffer H2, Battery, Hybrid).~40 MW PV required for hydrogen demand; Buffer case: 35 MW electrolysis + 96 t H2 storage; Battery case: ~7.6 MW electrolysis + 5.8 GWh battery; Hybrid: 15.8 MW electrolysis + 42.8 t H2 + 3.2 GWh battery. Levelized cost of produced gas ranging from EUR 1.09 to 2.01/Sm3.
McDonagh et al. [32]Techno-economic modeling (discounted cash flow) to compute LCOE of PtG systems using real market electricity dataGeneric PtG (electrolysis + methanation) with grid/market interactions.LCOE (*) scenarios reported ~EUR 107–143/MWh (2020 base), EUR 89–121/MWh (2030), EUR 81–103/MWh (2040);
Brands et al.
[33]
Techno-economic and comparative assessment optimizing gas purification processPyrolysis of biowaste + water-gas shift + gas purification/CO2 removal + microbial methanogenesisOptimized purification reduces H2 process’ demand by ~51% and achieves a minimum LCOBM ≈ EUR 143/MWh.
(*) Although the authors refer to LCOE, this term corresponds to the cost of the produced synthetic methane and is thus equivalent to the LCOBM parameter used in the other studies.
Table 2. Comparison of electrolyzer technologies for Power-to-Biomethane (PtBM) applications.
CriterionPEMELAELSOEL
Operating temperature50–80 °C (low)60–80 °C (low)700–850 °C (high)
Electrolyte typeSolid polymer membraneLiquid alkaline solution (KOH/NaOH)Solid ceramic oxide
Hydrogen purityVery high (>99.999%)High, but requires post-purificationVery high
Electrical efficiency65–75% (HHV basis)60–70%80–90%
Dynamic response/load flexibilityExcellent (seconds)/
ideal for intermittent RES
Moderate (minutes)/
suited for steady operation
Poor (hours)/
sensitive to cycling
Start-up and rampingVery fastSlowVery slow
Part-load efficiencyHigh, stable across a wide load rangeLower, efficiency drops at part-loadUnfavorable, high thermal inertia
Maturity (TRL)Commercially matured
(TRL 8–9)
Commercially mature
(TRL 9)
Emerging technology
(TRL 5–6)
System integrationCompact, modular, compatible with dynamic PtBM operationSimple and robust, but less flexibleComplex integration due to high-temperature requirements
Capital cost (EUR/kW)Medium–High
(decreasing with scale-up)
LowHigh (prototype stage)
Maintenance and durabilityModerate; improving with material advancesLow-cost maintenance; long lifetimesChallenging due to thermal stress and degradation
Suitability for renewable couplingExcellent (responsive and efficient under variable loads)Moderate (limited by slower dynamics)Poor (not suited for frequent cycling)
Overall suitability for PtBMHigh (optimal balance of efficiency, flexibility, and readiness)Moderate (robust but inflexible under fluctuating power supply)Low (at present, promising efficiency but immature and rigid)
Table 3. Economic data.
ParameterSpecific
Investment Cost
(Cinv,s)
Annual
Maintenance Specific Cost
Annual
Operating Cost
PV plant costs [46]EUR 405.5/kW 1.58 %   C i n v , s (EUR/kW)-
Wind plant costs [48] EUR 1260/kW 1.1 %   C i n v EUR-
PEM Electrolyzer costs [47]EUR 1678/kW 3 %   C i n v EUR-
Compression unit costs [49] EUR 36079.54 · P 0.6038 8 %   C i n v EUR-
H2 storage system costs [50]EUR 490/kg 3 %   C i n v EUR-
Methanation unit costs [51]EUR 450/kW 3 %   C i n v EUR-
Biogas price [52]--EUR 0.243/m3
Deionized water price [53]--EUR 0.01/kg
This cost is not a specific investment cost because it takes into account the size of the compressor (P, kW).
Table 4. Comparison of components’ sizes, and annual energy and mass balances at the optimal design points which guarantee the minimum LCOBM.
PtBM PlantUnitPVWindHybrid
PV plant sizeMW24.5-11.1
Wind plant sizeMW-16.510.0
RES plant sizeMW24.516.521.1
Biogas flow rate
(at digester full load)
Nm3/h500500500
Annual electric energy productionMWh38,80538,74240,982
Annual electric energy to the gridMWh12,03713,35112,995
Annual biogas
consumption
tons3693.23494.93856.6
Electrolysis unitkW10,00060006000
Electrolytic hydrogen production
(at full load operation)
kg/h168.6101.2101.2
Hydrogen to the methanation reactor
(at full load operation)
kg/h717171
Hydrogen compression unitkW205123123
Hydrogen storage capacitykg20001580540
Methanation reactor production capacityMWth,LHV4.924.924.92
Biomethane production (at full load operation of the methanation reactor)kg/h355.8355.8355.8
Annual electric energy consumption of the hydrogen compression unitMWh531503555
Annual electric energy consumption of the electrolysis unitMWh26,23724,88827,432
Annual hydrogen
production
tons438.4415.8458.4
Annual biomethane
production
tons2190.92037.22287.8
Annual avoided CO2 *tons5904.55492.56142.7
LCOBMEUR/MWh111.59113.1997.41
DPBPyears8.810.88.7
* The CO2 emission factor of the biomethane is 2.695 gCO2/gbiomethane.
Table 5. DPBP vs. specific electrolyzer cost and biomethane selling price (electricity selling price equal to EUR 0.1/kWh).
DPBP (Year)Specific Electrolyzer Cost
(EUR/kW)
16781000700400
Biomethane selling price
(EUR/MWh)
45.018.014.813.512.3
120.0 *8.26.96.35.7
5–7Very good/bankable-quick return low risk
8–9Good/sustainable-solid and bankable project
10–12Marginal/slow capital recovery
>12Not profitable/high risk
* In this case, the revenues derived from CO2 are excluded from Equation (14).
Table 6. DPBP vs. electricity and biomethane selling prices (specific electrolyzer cost equal to 1678 EUR/kW).
DPBP (Year)Electricity Selling Price
(EUR/kWh)
0.180.140.100.06
Biomethane selling price
(EUR/MWh)
45.011.414.018.0>20
120.0 *6.37.18.211.1
5–7Very good/bankable-quick return low risk
8–9Good/sustainable-solid and bankable project
10–12Marginal/slow capital recovery
>12Not profitable/high risk
* In this case, the revenues derived from CO2 are excluded from Equation (14).
Disclaimer/Publisher’s Note: The statements, opinions and data contained in all publications are solely those of the individual author(s) and contributor(s) and not of MDPI and/or the editor(s). MDPI and/or the editor(s) disclaim responsibility for any injury to people or property resulting from any ideas, methods, instructions or products referred to in the content.