Article

Numerical Simulation for Drill Collar Noise Signal Removal in Elemental Logging While Drilling

1
China National Logging Corporation, Xi’an 710077, China
2
Department of Control Science and Engineering, School of Automation Engineering, University of Electronic Science and Technology of China, Chengdu 611731, China
*
Authors to whom correspondence should be addressed.
Appl. Sci. 2025, 15(22), 12057; https://doi.org/10.3390/app152212057
Submission received: 27 March 2025 / Revised: 18 August 2025 / Accepted: 23 September 2025 / Published: 13 November 2025

Abstract

Elemental gamma spectroscopy logging while drilling is crucial for assessing element content in unconventional oil and gas reservoirs. Unlike wireline elemental spectroscopy logging, the high cross section and high-density characteristics of the drill collar can interfere with the detection of formation element content. Using numerical simulation, this paper develops a drill collar background signal removal method based on a dual detector gamma energy and time spectra combination. First, the gamma counts ratio in different time periods from the time spectra of the dual detector and the gamma energy spectra measured by the near detector are used to characterize the drill collar background. Then, the energy spectra measured by the far detector are integrated to reconstruct the pure formation gamma energy spectra. The reconstructed gamma energy spectra demonstrate that the deviation of low-content element yields can be controlled within 0.5%, indicating the accuracy of the drill collar background removal method based on dual spectra information. A numerical simulation case of elemental logging while drilling in unconventional reservoirs is constructed, and the drill collar background is removed using the time spectra and energy spectra information of the dual detector. The calculation of element and mineral contents shows that the maximum calculation errors can be controlled within 2% and 3.5%, respectively, with the calculation error for low cross section elements like Mg reduced to below 0.5%. In conclusion, the proposed drill collar signal removal method based on the time and energy domains effectively improves the accuracy of formation elemental content calculation under drilling conditions, providing theoretical guidance and technical support for elemental content evaluation and mineral analysis in unconventional oil and gas reservoirs.

1. Introduction

Exploration of unconventional oil and gas reservoirs relies heavily on drilling high-angle and horizontal wells, with logging while drilling (LWD) proven to be successful for measuring azimuthal gamma, neutron-gamma density, and neutron porosity. These measurements provide crucial nuclear physics parameters for evaluating reservoirs [1,2,3]. Moreover, the accurate assessment of lithology or even mineralogy in unconventional reservoirs using LWD technology is a vital area for further investigation. The elements found in the formation are diverse, but are concentrated in a select few, such as O (49.13%), Si (26.00%), Al (7.45%), Fe (4.20%), Ca (3.25%), Na (2.40%), K (2.35%), Mg (2.35%), and H (1.00%) [4], accounting for over 98% of the total weight of the earth’s crust. Even in areas with igneous rocks, only a dozen or so common minerals are present among the over 2000 types of minerals discovered in formations. Therefore, the detection of secondary gamma rays based on the interaction between neutrons and the formation medium to calculate element and mineral content holds great significance for the accurate lithological classification of the formation.
Currently, significant advancements have been made in wireline elemental logging tools, such as the elemental capture spectroscopy logging tool (ECS) [5] and the gamma elemental mineralogical analysis logging tool (GEM) [6], which utilize an Am-Be neutron source and a bismuth germanate (BGO) detector. Baker Hughes has introduced the formation lithology explorer (FleX) elemental logging tool [7], employing a deuterium–tritium (D-T) pulsed neutron generator and a single BGO detector to determine the content of elements like C, Fe, Mg, O, Si, S, Al, and Ca. In 2012, Schlumberger unveiled the Litho-Scanner [8], a new generation elemental logging tool utilizing a D-T pulsed neutron source and a single lanthanum bromide scintillation (LaBr3) detector, less affected by temperature changes and boasting higher energy resolution. As elemental logging tools continue to evolve, the associated data processing techniques are becoming more diverse. Grau et al. established an experimental framework to obtain elemental standard spectra based on the influence of detector type and measurement device on the standard spectral shape [9]. Crittin et al. utilized the least-squares method to process ECS capture gamma energy spectra to obtain relative elemental yields, determining elemental content using the oxide closure model [10,11,12]. Liu et al. analyzed the precision of solving element content in shale oil and gas reservoirs based on spectral data processing [13,14]. MacDonald et al. utilized inelastic and capture gamma energy spectra to determine element content and applied it in the identification of complex carbonate lithology [15]. Perez et al. conducted algorithm research on through-casing elemental logging, and after obtaining the gamma energy spectra background of casing and cement through experiments, the calculation of element content beyond the casing was performed [16]. Zhou et al. developed a new method to calculate element content, achieving automatic compensation for the effects of casing and cement background on elemental measurements under various borehole conditions [17].
However, for elemental logging while drilling, Gjerdingen et al. conducted research on the effects of different drilling speeds, tool shapes, and borehole environments on element content calculation, showing that the measured element spectra contain a significant amount of drill collar signal, which is adverse to the acquisition of element content [18]. Schlumberger introduced the multifunctional logging while drilling tools Ecoscope and NeoScope [19,20], which have the capability of elemental logging while drilling, but further advancements in elemental logging while drilling functionality have not been made. To overcome this fundamental limitation and enable true formation elemental characterization during drilling, this study pioneers a novel spectral processing methodology. Our core innovation lies in the development of a dedicated algorithm designed to explicitly identify, isolate, and eliminate the drill collar signal component from the raw gamma energy spectra. This targeted signal separation is paramount for retrieving the uncontaminated formation signature, thereby facilitating the first robust and quantitative determination of element content directly under real-time drilling conditions.

2. Methodology

According to the neutron diffusion theory [21,22], fast neutrons interact with the nuclei of the formation elements and lose energy by inelastic scattering and elastic scattering until they are slowed down into thermal neutrons. Then, thermal neutrons are diffused and captured by the nuclei of the formation elements. The flux of thermal neutrons satisfies the following equation:
D t 2 ϕ t Σ t ϕ t + Σ f ϕ f = 0
where D t is the thermal neutron diffusion coefficient and Σ t is the thermal neutron capture cross section. The solution to the thermal neutron flux equation is as follows:
ϕ t r = 1 4 π D t r L t 2 L e 2 L t 2 e r / L e e r / L t
L t = 1 / D t / Σ t
Since the moderation length of fast neutrons ( L e ) is approximately twice the diffusion length of thermal neutrons ( L t ), when the spacing is large, the following can be approximated:
e r / L t / e r / L e = e r / 2 L t 0
Ignoring the exponential term of the diffusion length, if each thermal neutron capture in the formation produces an average number of gamma rays i t and the capture cross section is Σ t , the flux of secondary capture gamma rays produced recorded by the detector shell with thickness d r is as follows:
d I = i t Σ t S 0 4 π r 2 ϕ t r d r = i t S 0 r L e 2 L t 2 e r / L e d r
Considering the attenuation of gamma rays, the number of gamma rays produced at position r and received by the detector at spacing R is calculated as follows:
ϕ t R = 0 R d I r 4 π R 2 = 0 R i t S 0 L e 2 L t 2 r e r / L e e ρ μ E R r d r / 4 π R 2
The indefinite integral of the numerator is as follows:
i t S 0 L e 2 L t 2 r e r / L e e ρ μ E R r d r = i t S 0 L e 2 L t 2 r ρ μ E 1 L e 1 ρ μ E 1 L e 2 e r ρ μ E 1 L e ρ μ E R
Let M = ρ μ E 1 / L e ; then, we can obtain the flux of gamma-ray capture at spacing R in the dual medium of the drill collar and formation as follows:
ϕ t R = i t 2 S 0 L e 2 2 L t 2 2 M 2 2 R M 2 1 e R M 2 ρ 2 μ 2 E R h M 2 1 e h M 2 ρ 2 μ 2 E R   + i t 1 S 0 L e 1 2 L t 1 2 M 1 2 h M 1 1 e h M 1 ρ 1 μ 1 E R + e ρ 1 μ 1 E R / 4 π R 2
The theoretical distribution of secondary gamma-ray fields under the drill collar and formation dual medium conditions indicates that the distribution of secondary gamma rays in the drilling environment depends on the parameters of the drill collar and formation, such as the total scattering cross section, density, mass attenuation coefficient, moderation length, and diffusion length. Compared to the wireline measurement environment, the high cross section, density, and mass attenuation coefficient of Fe elements in the drill collar lead to a significant contribution of secondary gamma ray information. Thus, the elimination of the strong background signal from the drill collar in elemental logging while drilling is a challenge in the detection and processing of formation elemental gamma energy spectra.
In addition, the gamma rays released by the inelastic scattering of fast neutrons with iron (Fe) elements are generally low in energy, with most falling below 1 MeV. As a result, the background of inelastic gamma rays from the drill collar is not significant, and only the capture gamma ray spectrum is studied.

3. Numerical Simulation

3.1. Monte Carlo Method and Simulation Model

The FLUktuierende KAskade (a German term, FLUKA) is a general-purpose Monte Carlo particle transport tool [23], which can be used for neutron, photon, electron or coupled neutron/photon/electron transport, with wide applications in such scientific fields as particle transport, radiation protection and radiometry, radiation shielding design optimization, and detector design and analysis. In this study, the FLUKA code simulation is used to study the characteristics of the gamma energy spectrum and the method of eliminating drill collar noise signal. The formation model with an elemental logging while drilling tool is established as shown in Figure 1.
The model is detailed as follows:
Formation parameters: Under the formation conditions of 1400 mm in both height and diameter, the borehole is filled with fresh water (200 mm diameter). Quartz, calcite, kaolinite, iron oxide, titanium oxide, etc., are present as formation minerals, and the formation porosity changes from 0% to 20%. Brine with different salinity is used as pore fluid. The drill collar is 170 mm in diameter, and the logging instrument is slotted on one side.
Instrument parameters: The elemental spectroscopy logging tool adopts the deuterium–tritium (D-T) neutron source with 14 MeV as the controllable source; the neutron source and the detector are separated by the tungsten nickel iron alloy shields. The near detector is shielded from formation orientation to ensure that it can measure as many drill collar signals as possible. The instrument housing is 4 mm thick, made with 17-4PH steel, and the outside diameter is 70 mm. Lanthanum bromide (LaBr3) is selected as the detector crystal for the dual detector, and the spacing is 300 mm and 540 mm, respectively. The crystal size of the near detector is 12.7 mm in diameter and 60 mm in length and that of the far detector is 25.4 mm in diameter and 16 mm in length; the cross section of the detectors are 127 mm2 and 507 mm2, respectively.
Based on the above numerical calculation model, the formation medium is set as shown in Table 1 to analyze the measured gamma energy spectrum information.

3.2. Energy and Time Spectrum Characteristic Analysis

3.2.1. Capture Spectrum Recorded by Far Detector

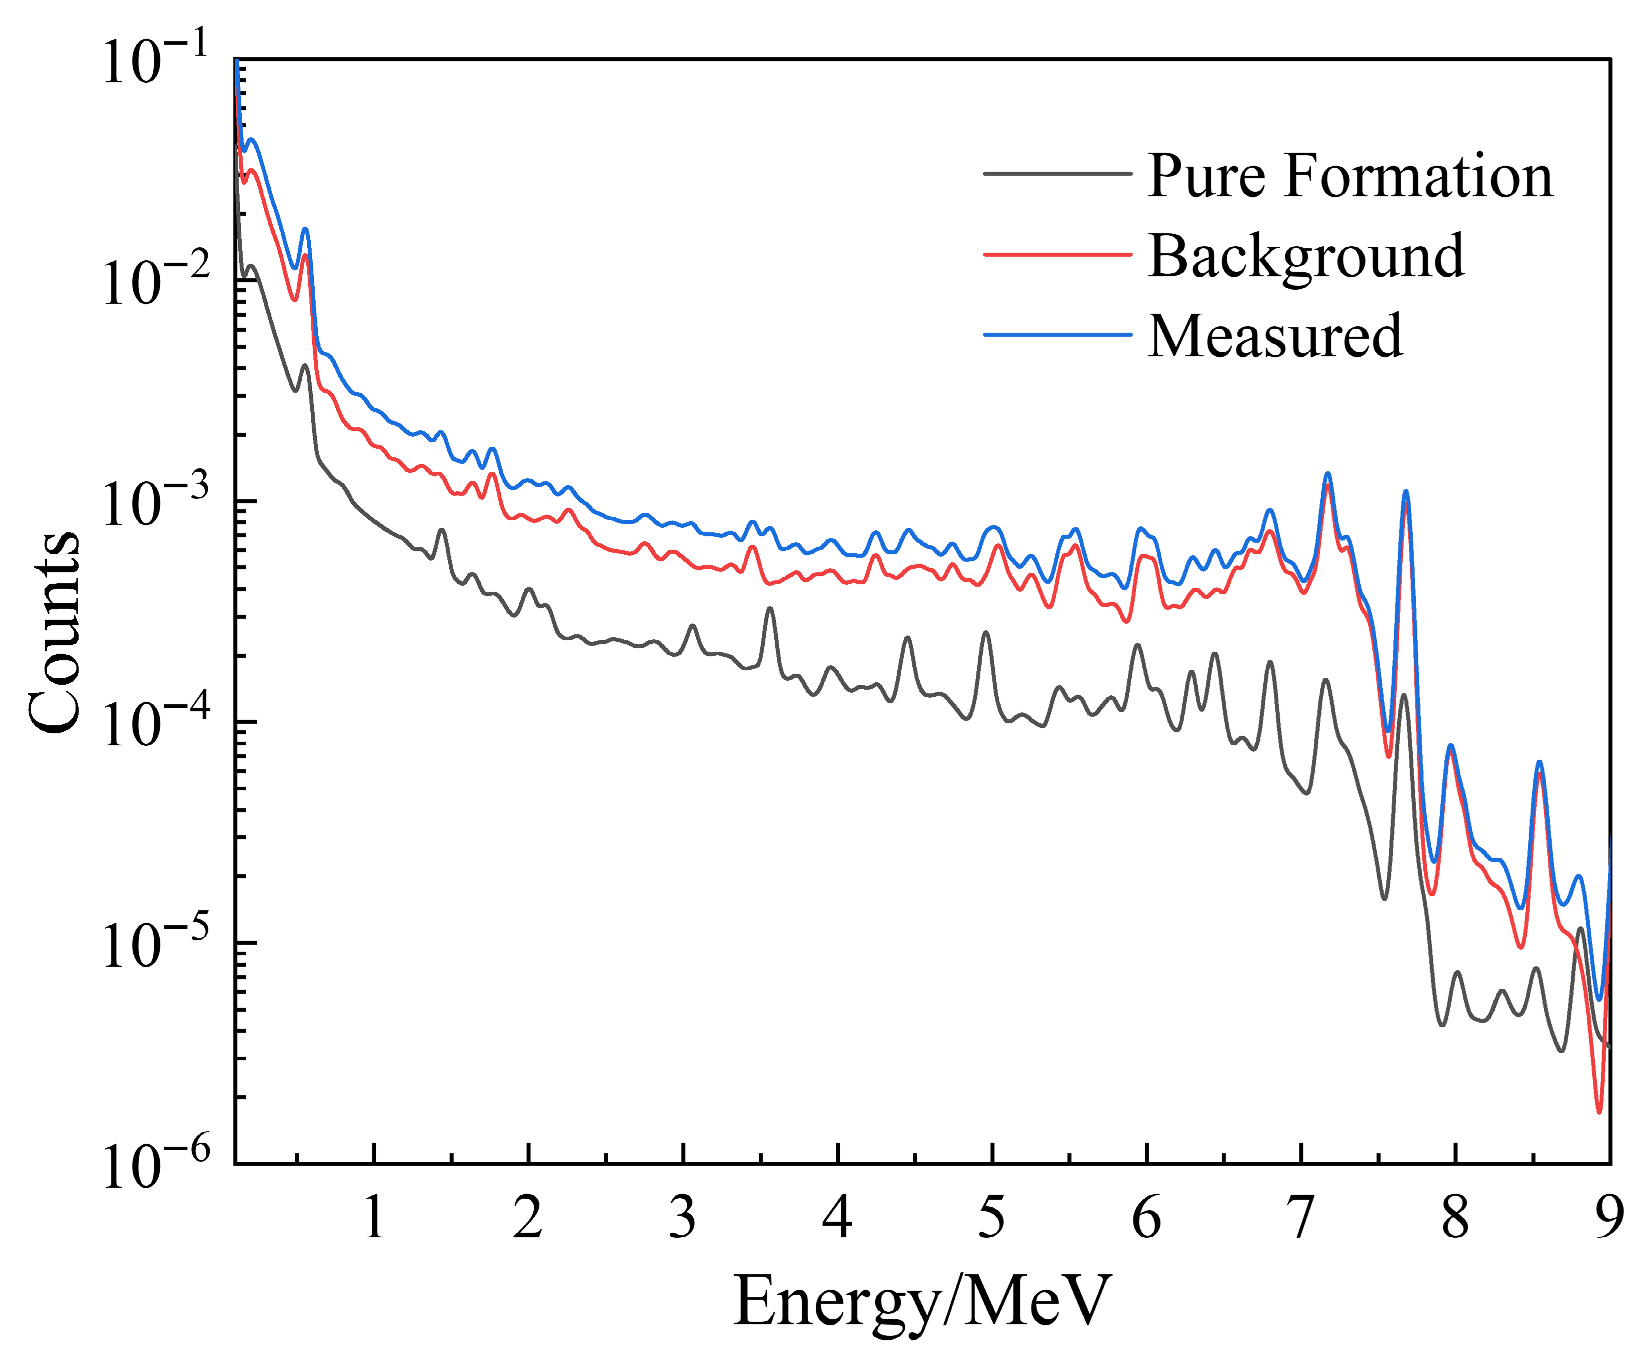
Taking Model 6 as an example, Figure 2 depicts the capture gamma energy spectrum of the far detector. The spectrum shows that a significant portion of the measured energy spectrum is attributed to drill collar background (the latter is referred to as background) signals. This is particularly evident in the high-energy section. The presence of a high concentration of Fe in the drill collar, along with the high cross section characteristic of Fe, causes the measurement spectrum to closely resemble the background spectrum. As a result, accurately extracting the pure formation spectrum from the measurement spectrum becomes a challenging task.
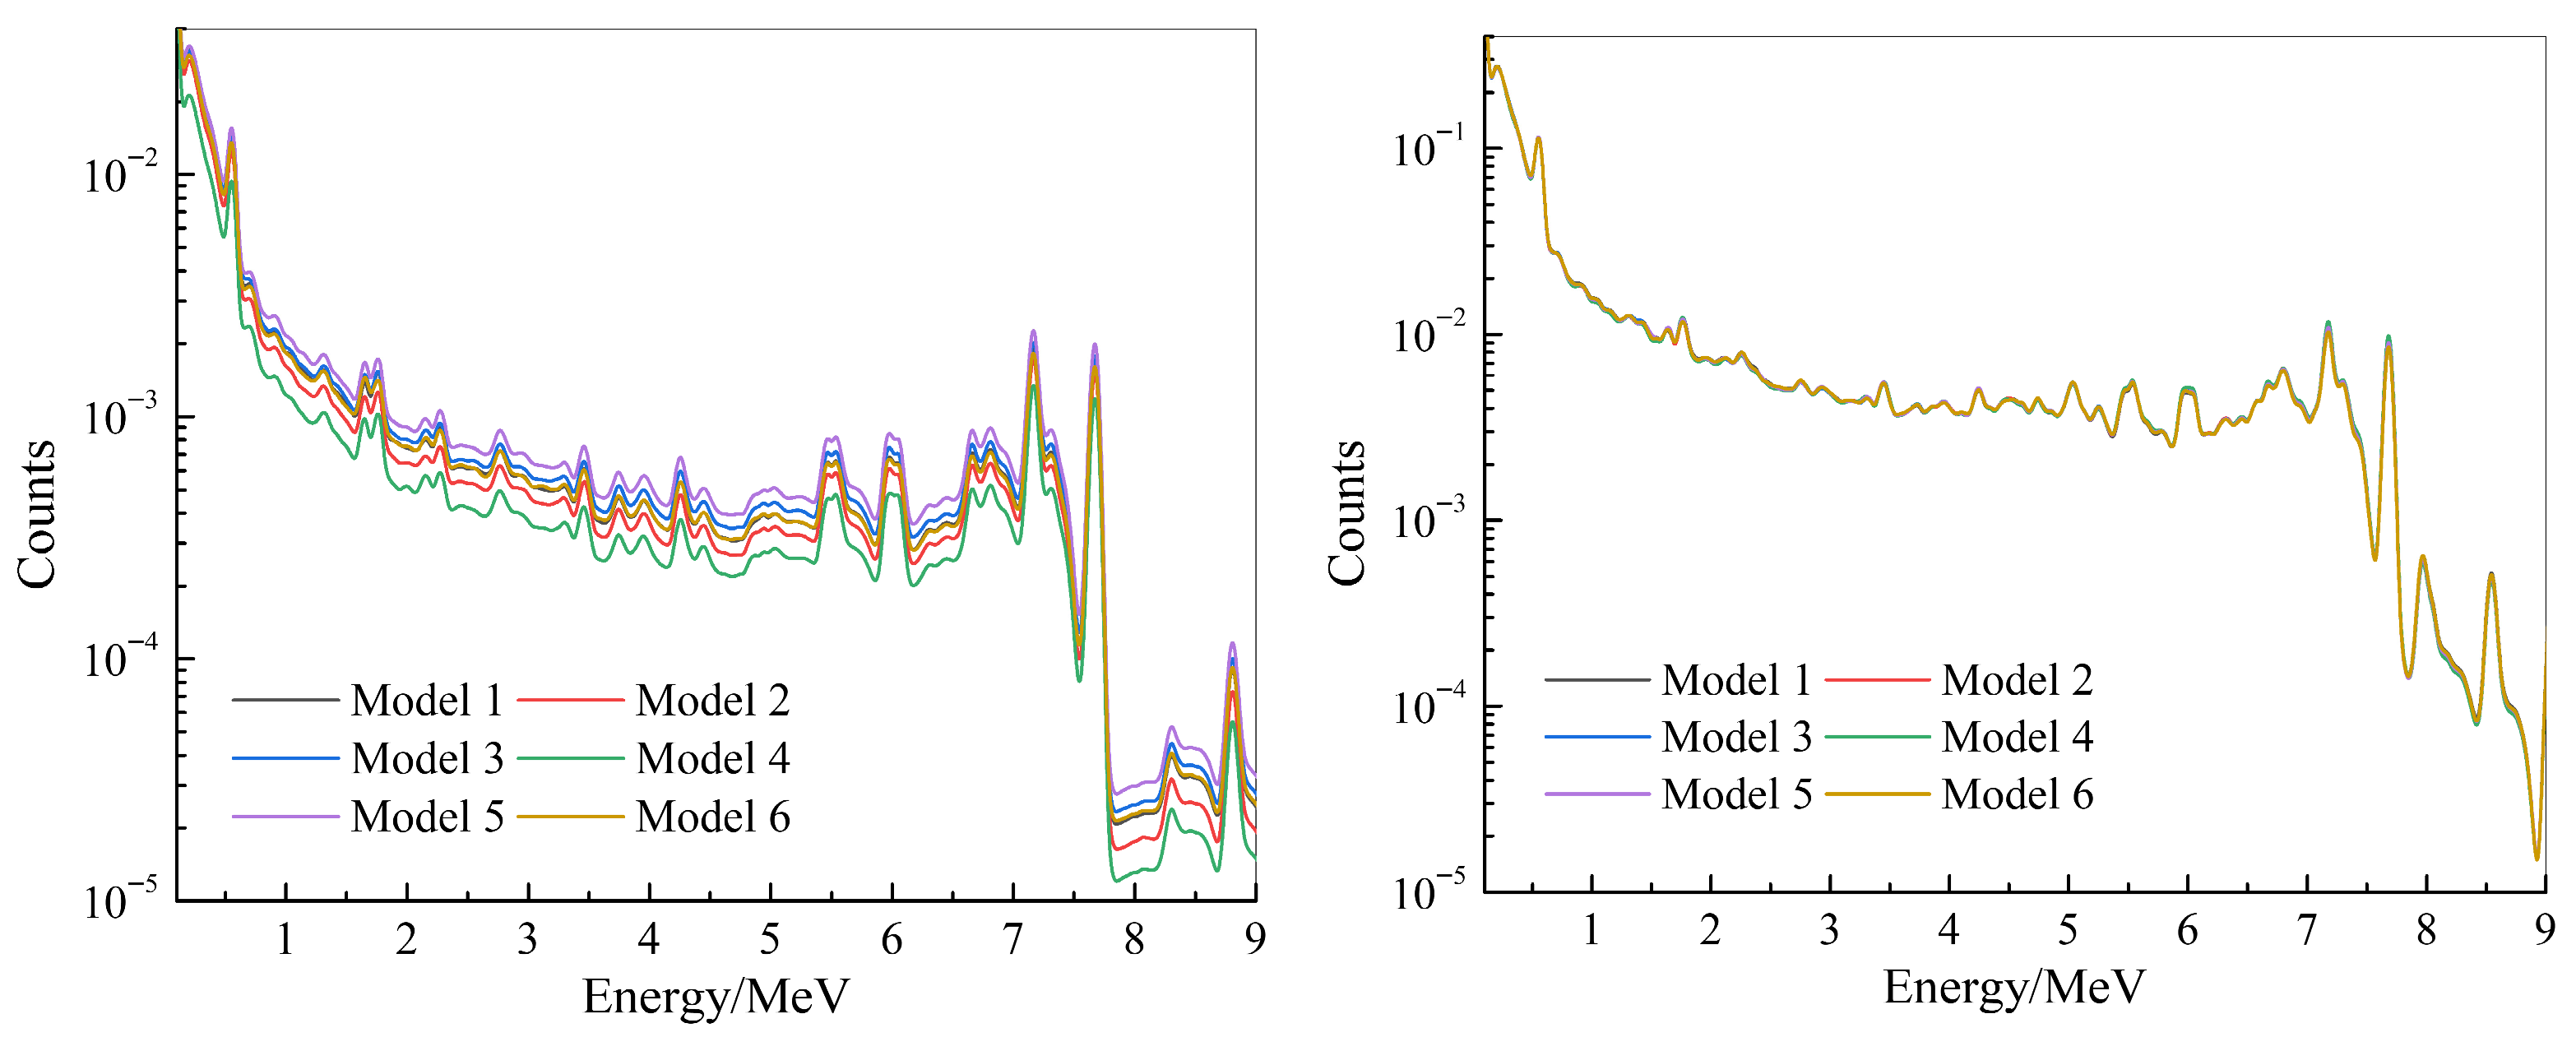
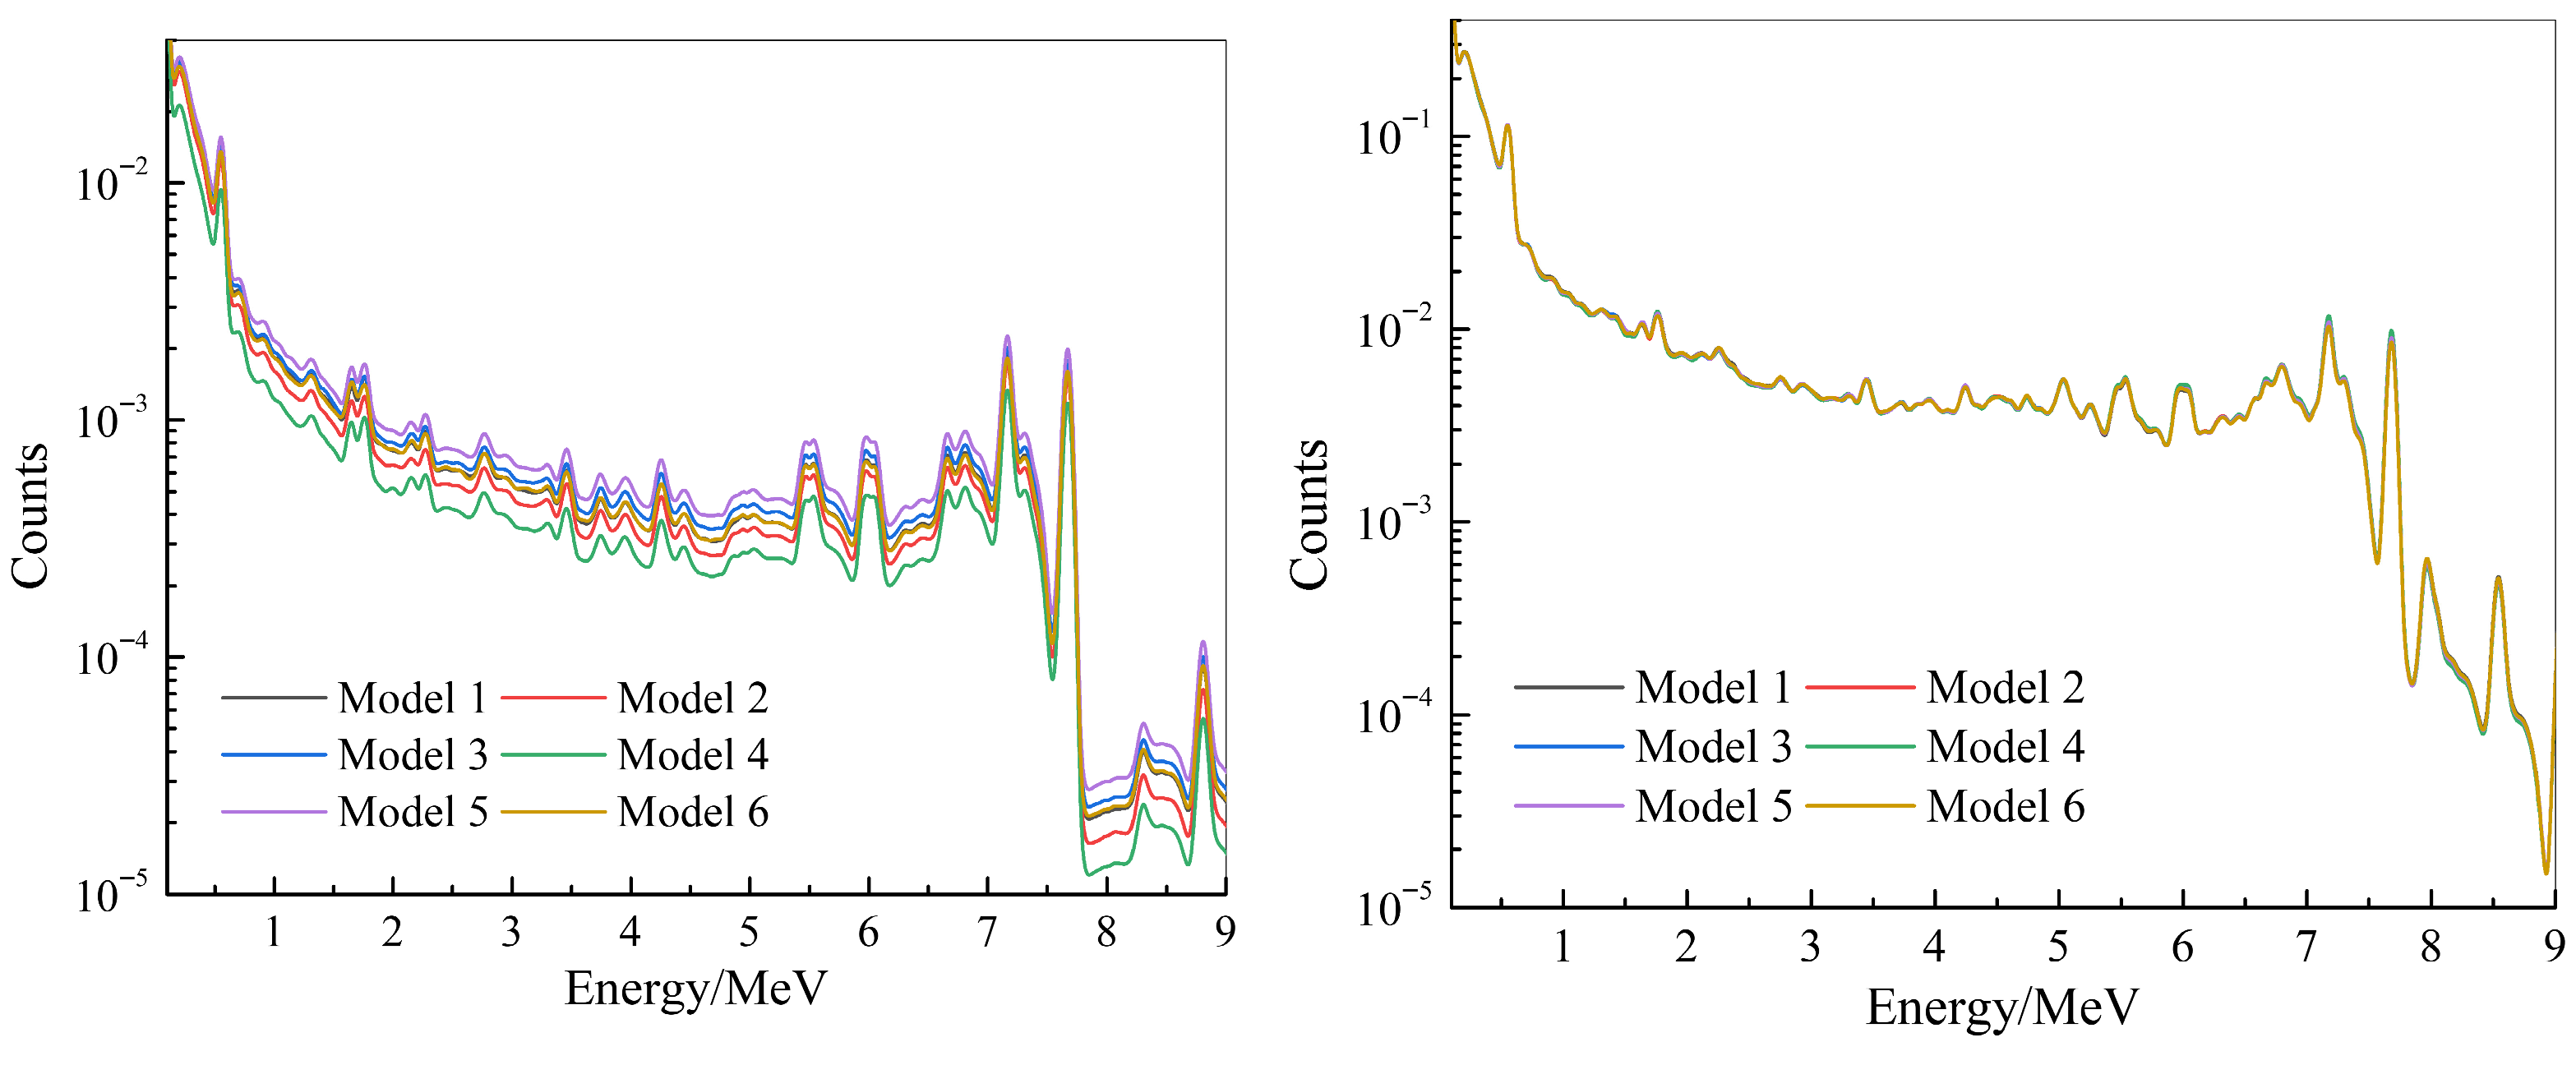
The background spectra of six groups of formation models are compared, and the characteristics of background spectra under different formation conditions are studied. The Fe peak is used as the standard to normalize different background spectra. Figure 3 shows the comparison of background spectra before and after the normalization of each model.
The comparison of background spectra in different models reveals that the change in formation medium is responsible for the variation in gamma ray counts. However, after normalization, it becomes evident that the characteristics of the background spectrum remain unaffected by the change in formation medium, with the background spectra of different models largely overlapping. Therefore, in conjunction with near detector measurements, accurately characterizing the background spectrum signal is crucial for effectively extracting pure formation signals.

3.2.2. Capture Spectrum Recorded by Near Detector

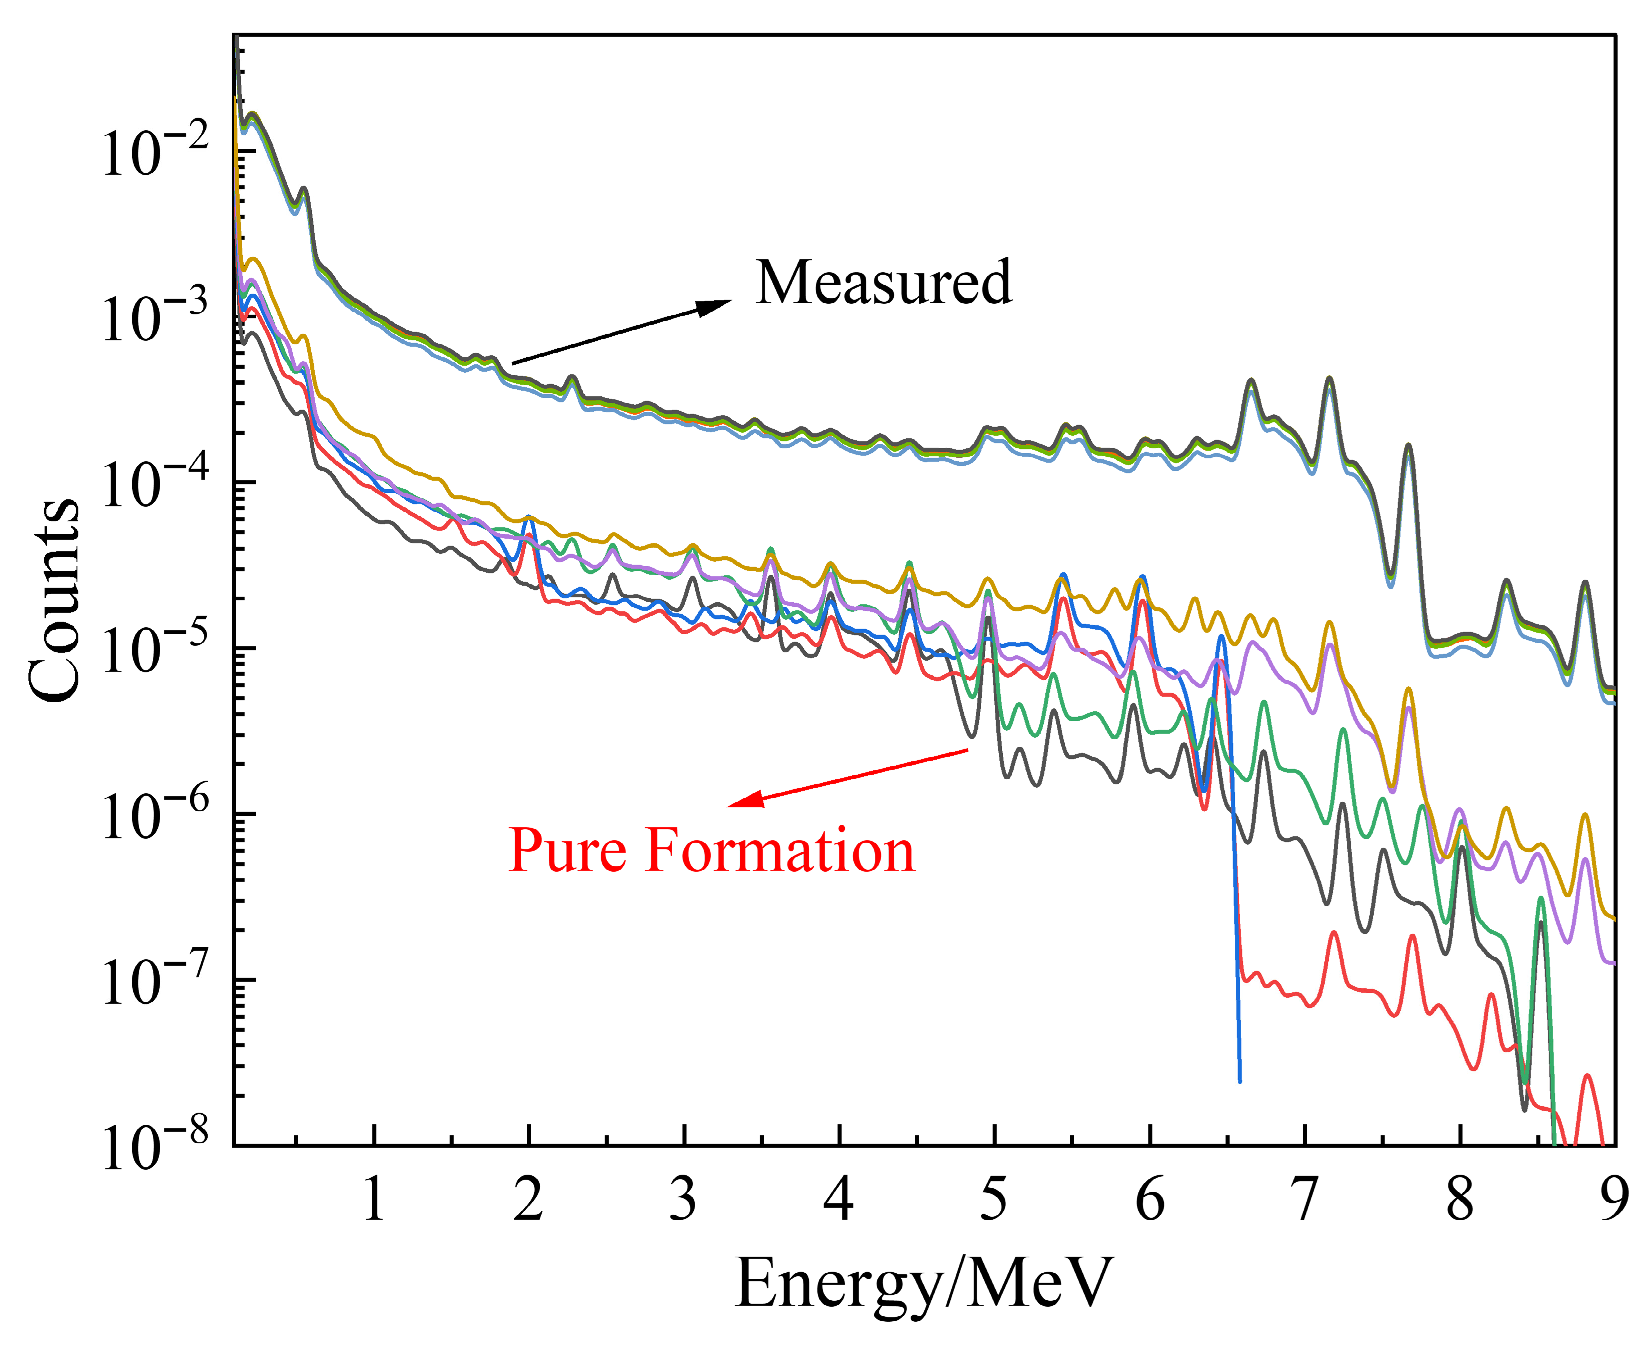
Upon analyzing the energy spectrum of the far detector, it becomes evident that studying the characteristics of the gamma energy spectrum measured by near detectors is also essential. The capture gamma energy spectrum characteristics of different models simulated by the near detector are examined. Figure 4 illustrates the comparison of the capture gamma energy spectra of the near detector under the conditions of six groups of formation models.
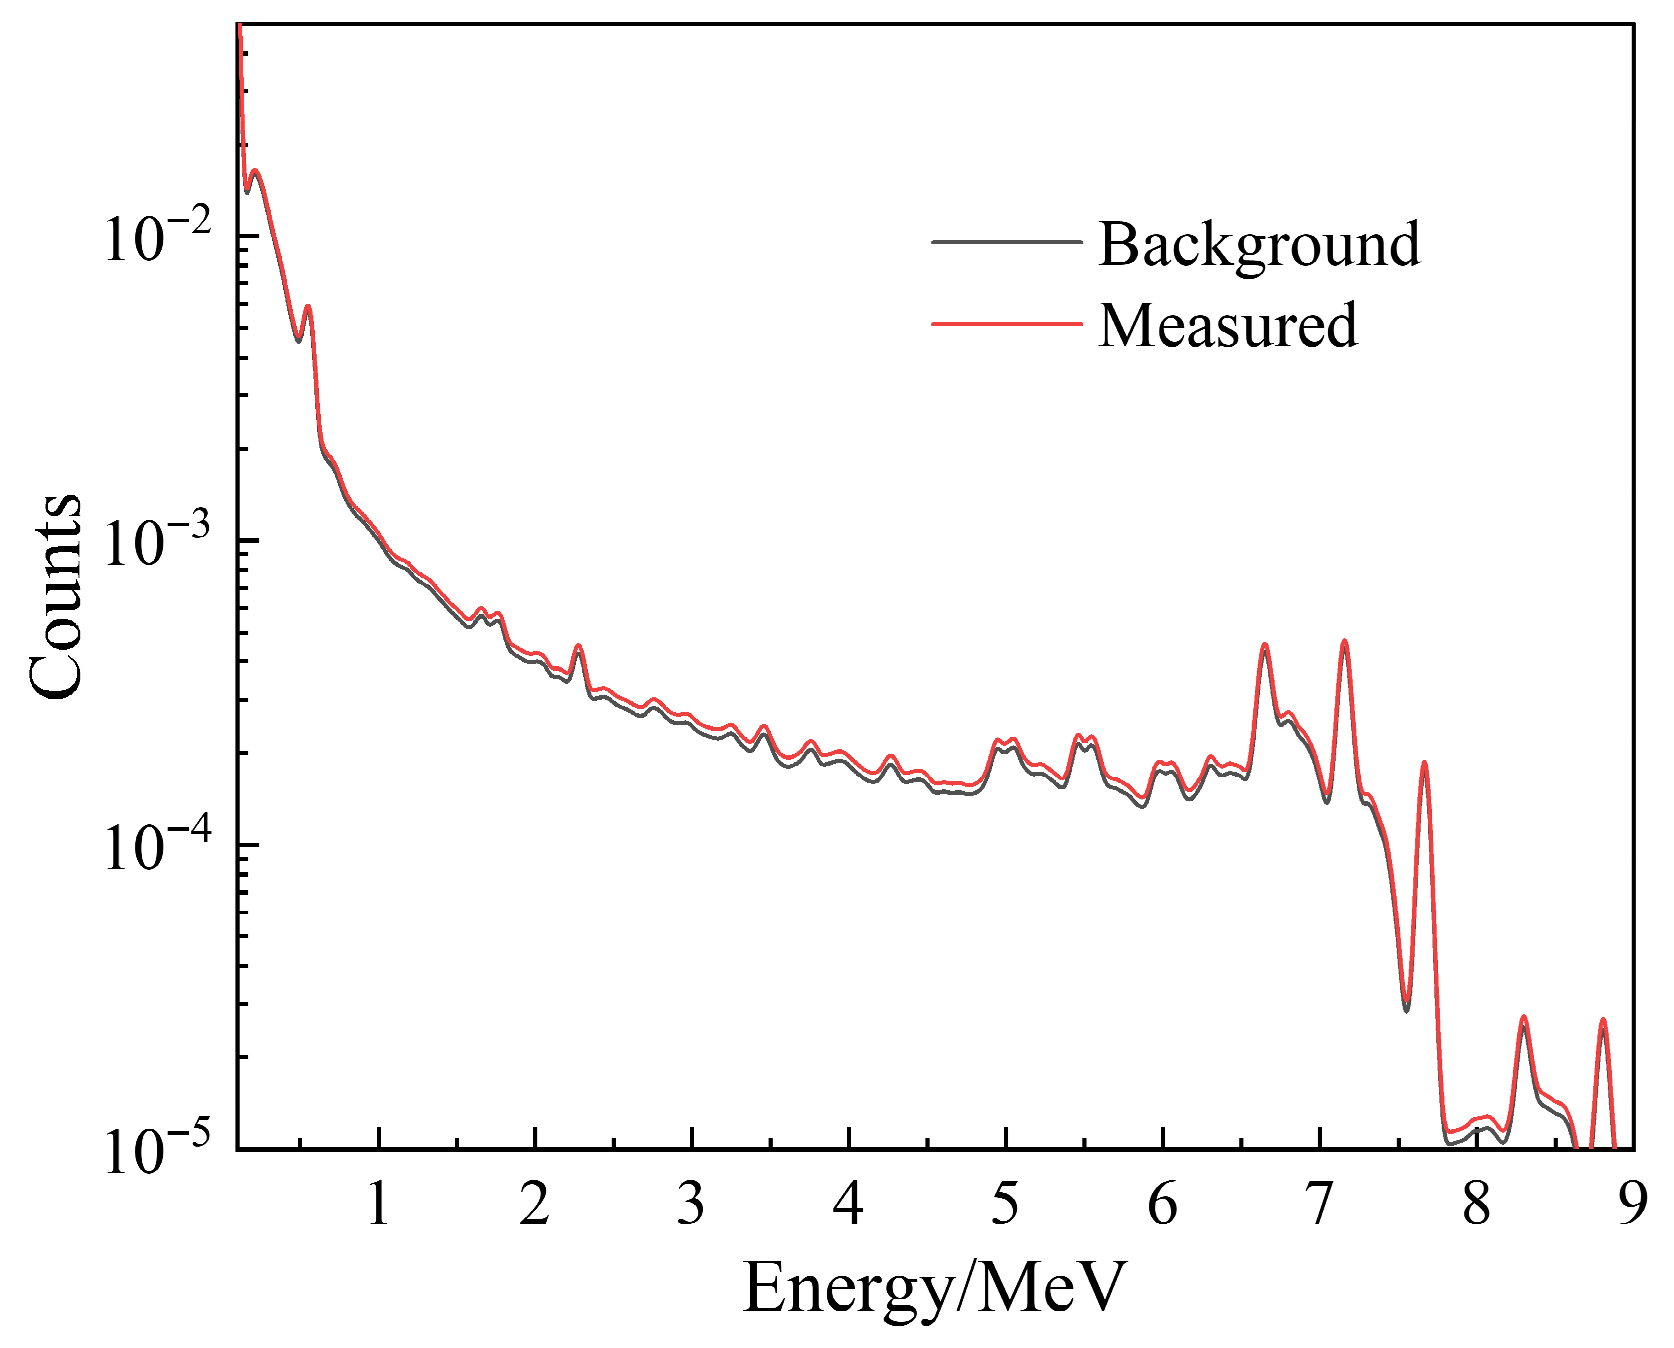
Based on the capture spectrum and pure formation spectrum measured by the near detector under different formation conditions, it is evident that the formation conditions have minimal impact on the spectrum measured by the near detector. Furthermore, the formation signal in the energy spectrum is approximately an order of magnitude lower than the measured gamma ray counts. Furthermore, comparing the measured spectrum with the background spectrum of the drill collar of Model 6 as depicted in Figure 5, it is evident that the measured spectrum of the near detector closely aligns with the background spectrum of the drill collar. This suggests that the spectrum obtained from the near detector primarily comprises background signals originating from the drill collar.

3.2.3. Gamma Time Spectrum of Dual Detector

The attenuation rate of gamma ray counts in the gamma time spectrum is linked to the thermal neutrons’ capturing ability in the surrounding medium. As a result, the gamma time spectrum can provide some insight into the physical properties of the drill collar and the formation. Using the numerical calculation models, the gamma time spectra of each model are simulated. By comparing the attenuation characteristics of the gamma time spectra from the near and far detectors, we can discern the varying degrees to which the gamma time spectra reflect the properties of the drill collar and formation. Figure 6 illustrates the normalized gamma time spectra of the near and far detectors for the six sets of models.
The near detector primarily reflects the drill collar information, with gamma-ray attenuation mainly affected by the drill collar. In contrast, the far detector’s gamma-ray attenuation is influenced by both the formation and the drill collar, with the formation’s impact increasing over time. This difference in attenuation speed under various formation conditions effectively reflects formation parameters.
The disparity in the reflection degree of the gamma energy spectrum and the time spectrum to the drill collar and formation medium indicates that the near detector’s bispectral information mainly reflects the drill collar, while the far detector’s information is influenced by both the drill collar and the formation. Therefore, utilizing dual detector bispectral information is crucial for reconstructing and extracting pure formation gamma energy spectra and accurately calculating formation element content, establishing a method to eliminate the strong background signal from the drill collar.

3.3. Extraction Method of Pure Formation Gamma Spectrum

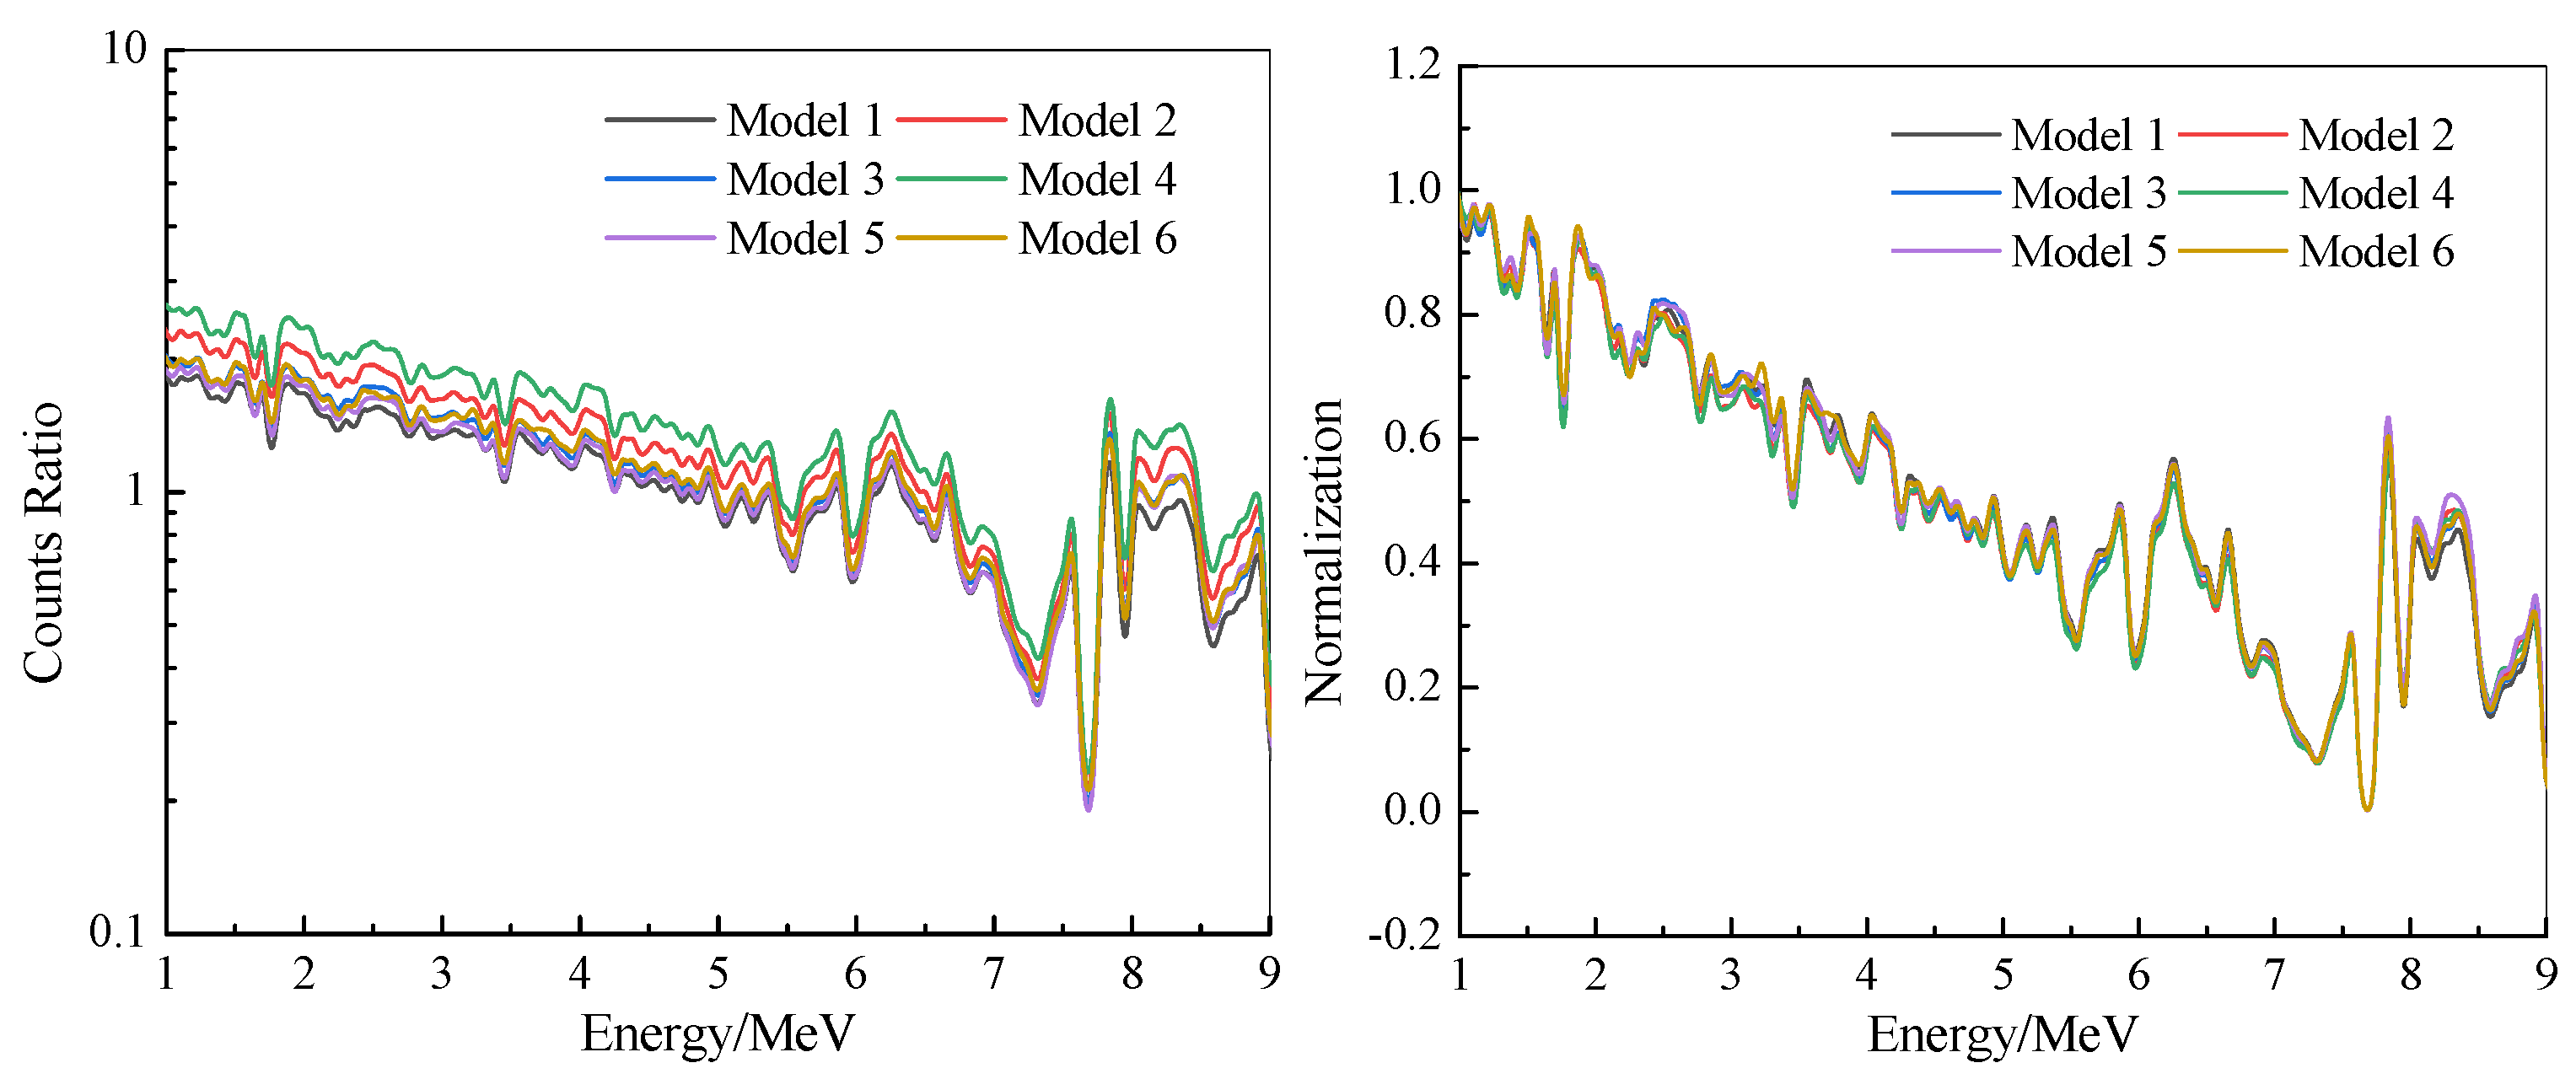
The gamma ray counts of different energy channels measured by the near detector are compared with the background spectrum of the drill collar of the far detector, and a “ratio spectrum” was constructed to observe the counts relationships of each energy channel in the ratio spectrum of 1–9 MeV under different formation conditions, as shown in Figure 7.
Under different formation conditions, the ratio spectrum exhibits precisely the opposite distribution characteristics compared to the background spectrum. For instance, at the 7.65 MeV characteristic peak of Fe, the ratio spectrum displays a notable dip. This occurs because both near and far detectors strongly respond to the background signal of the drill collar, resulting in a decrease in the count ratio at the high-count characteristic peak in the background spectrum. Furthermore, the amplitude of the ratio spectrum varies under different formation conditions, but normalization aligns the ratio spectrum completely. Therefore, it is essential to identify a parameter to determine the amplitude of the ratio spectrum.
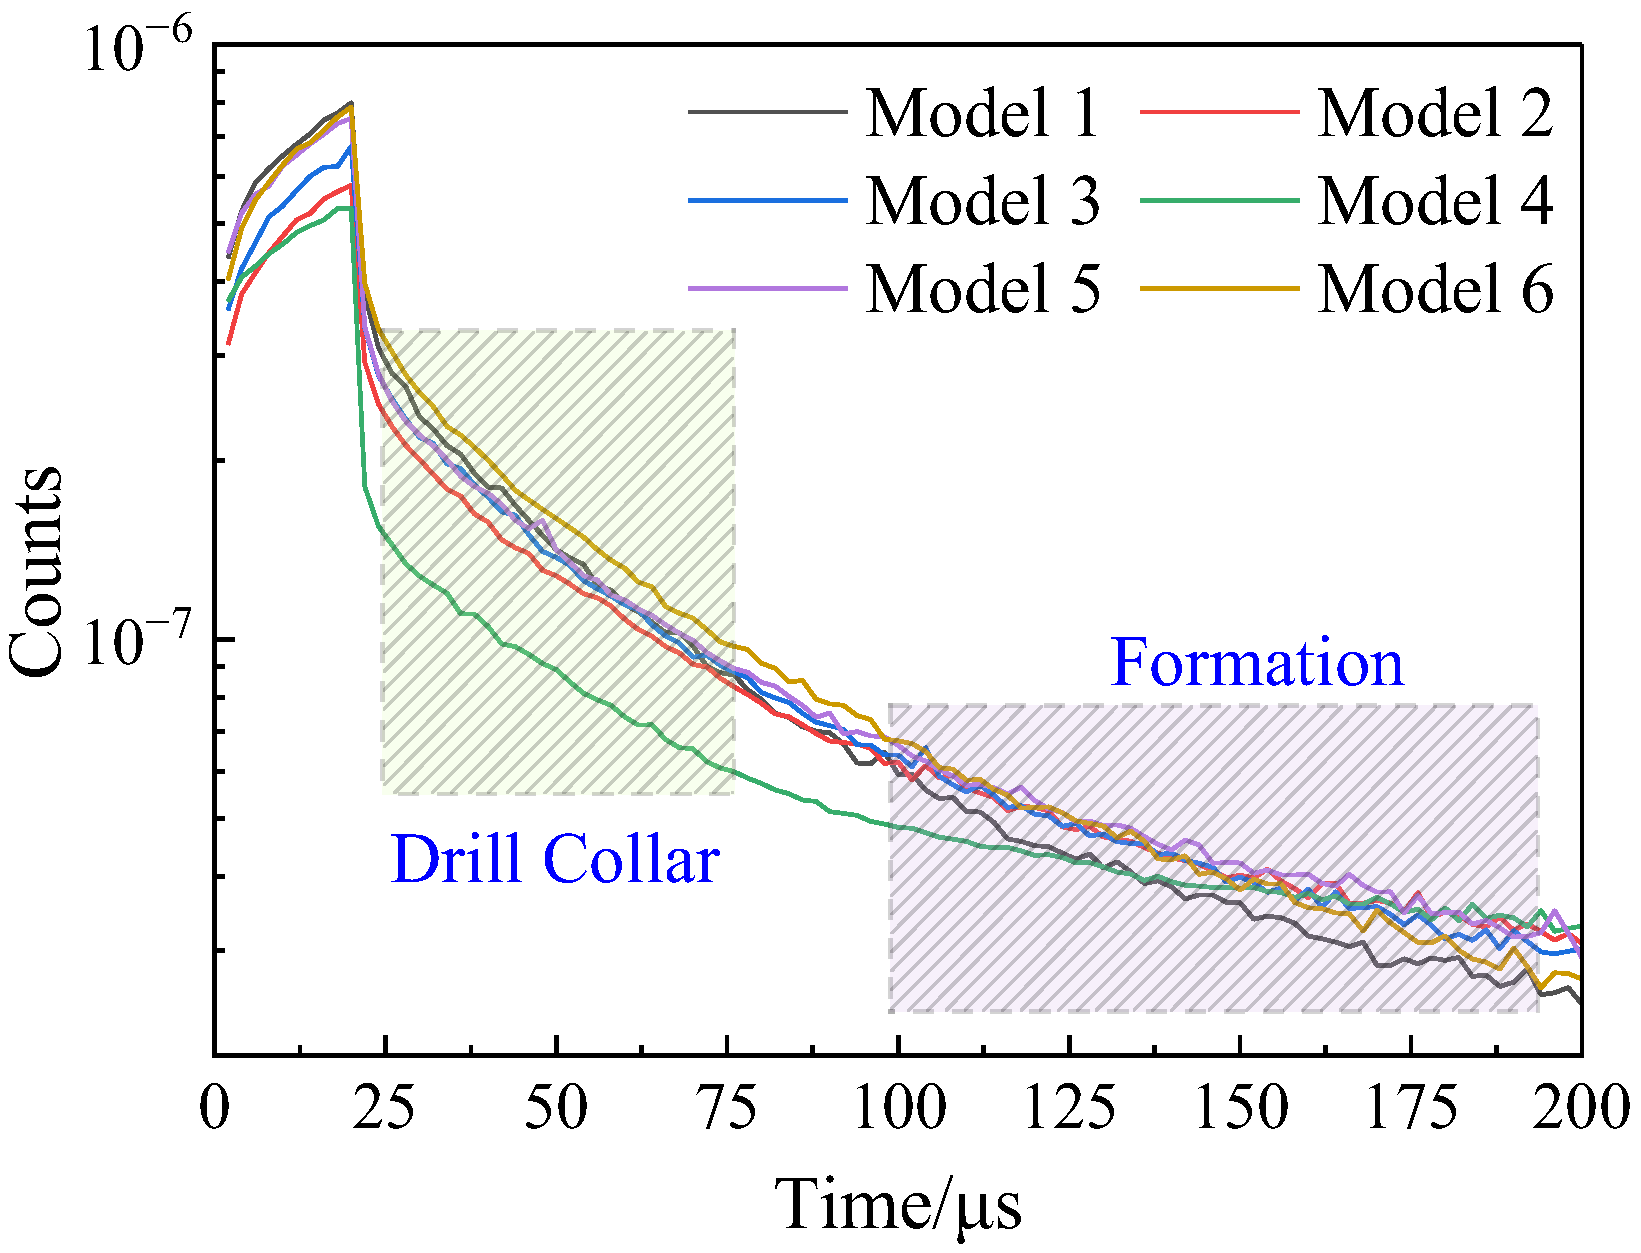
Since only the formation medium varies in the six models, the difference in the ratio spectrum amplitude is attributed to the change in the formation medium. While the gamma rays from the far detector can reflect the alteration in formation parameters, the gamma ray counts of the near detector are employed for calibration due to the influence of neutron yield, logging speed, and other factors. The gamma ray counts of both the near and far detectors are used to reflect the ratio spectrum amplitude. To capture the formation properties as accurately as possible, the gamma ray counts information from the time region representing the formation medium properties is selected. The time spectra of the six formation models are depicted in Figure 8.
The attenuation rate of the gamma time spectrum remains consistent within the range of 25 to 100 μs, primarily reflecting the drill collar medium. However, from 100 to 200 μs, the attenuation of gamma ray counts varies significantly. Therefore, the gamma ray counts in the 120 to 190 μs period are selected from the far detector and compared with the gamma ray counts of the near detector to reflect the amplitude of the ratio spectrum under different formation conditions.
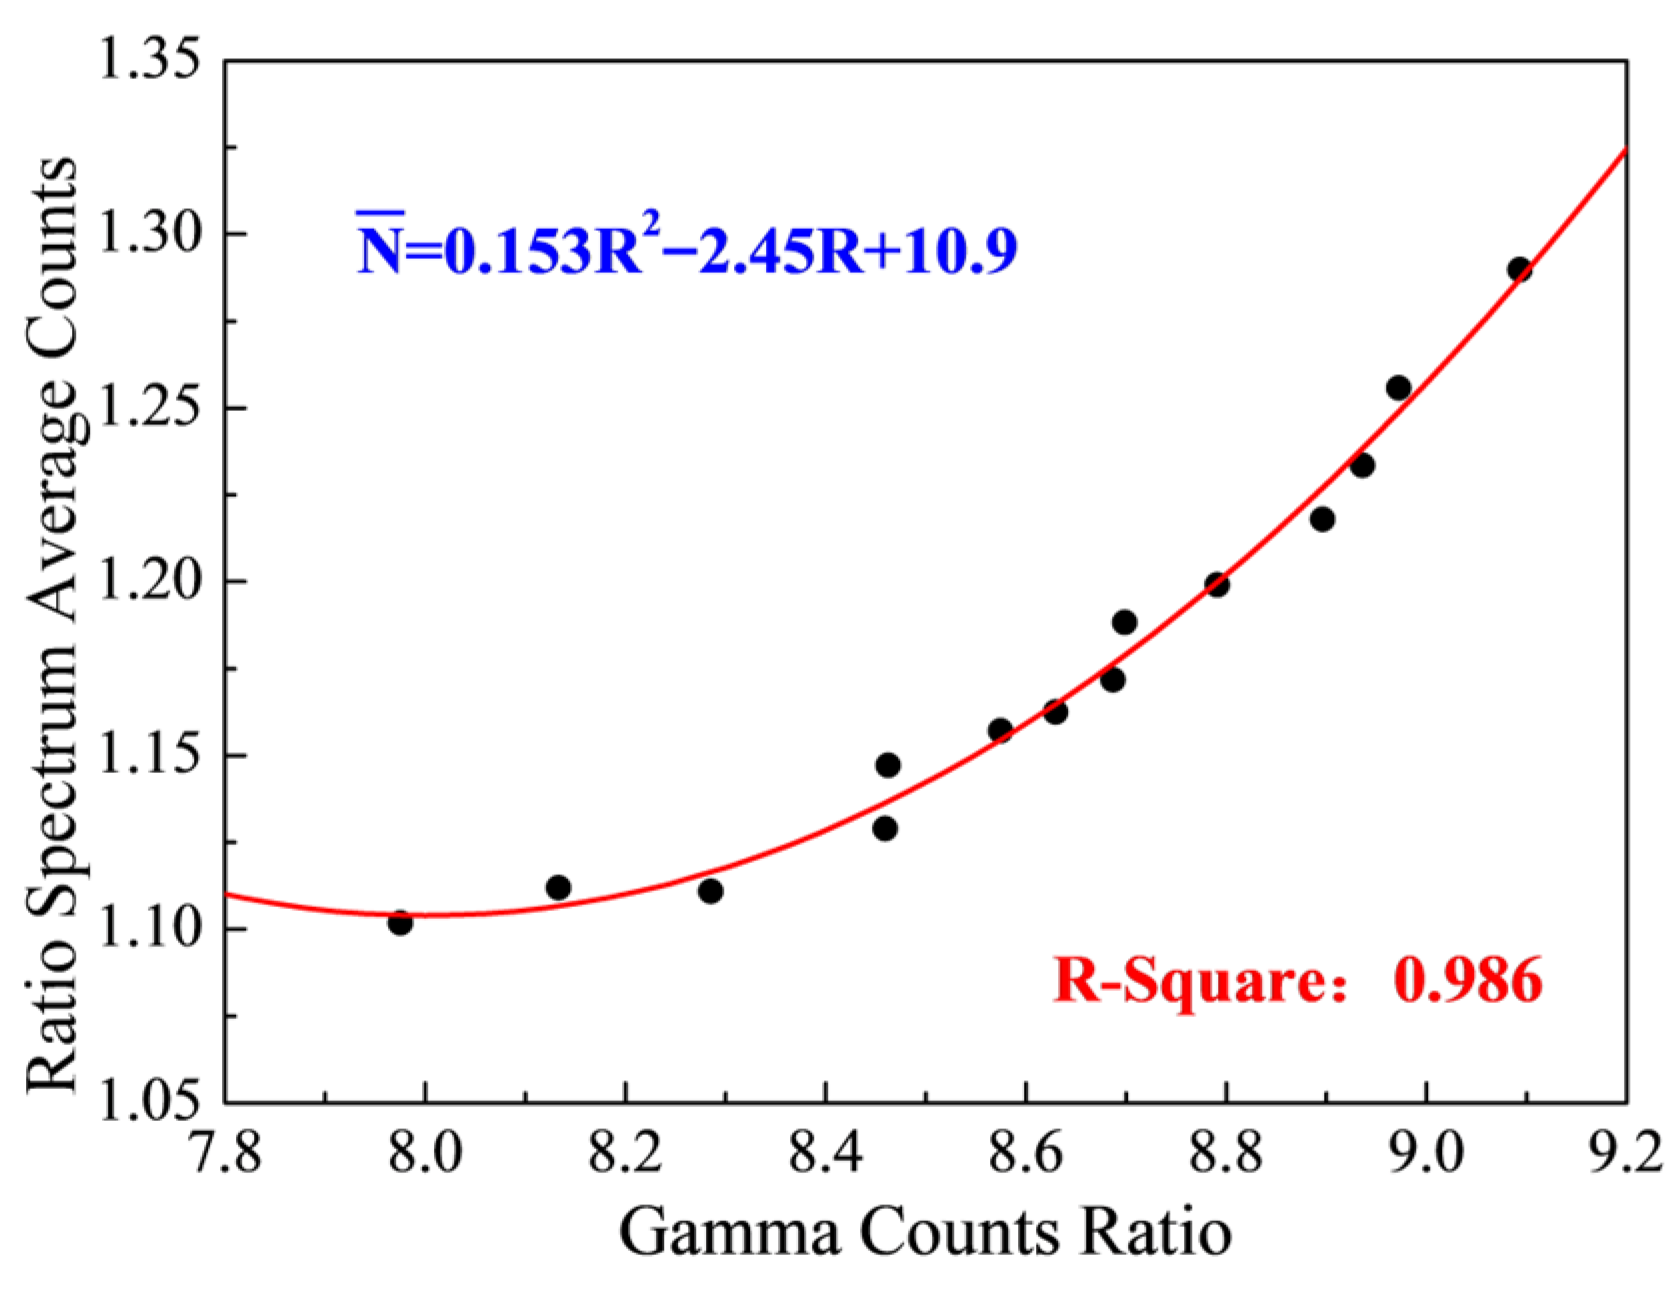
Additional formation conditions are incorporated into the existing six sets of models, resulting in a total of 14 sets of models to encompass a broader range of formation conditions. The added formation conditions are shown in Table 2. The relationship between the gamma–time spectrum counts ratio and the average count of the ratio spectrum from 1 to 9 MeV is established. The relationship between the gamma–time spectrum counts ratio and the ratio spectrum average count is illustrated in Figure 9.
It is evident that the gamma time spectrum counts ratio and the ratio spectrum average count from 1 to 9 MeV exhibit a quadratic function relationship, with a high correlation coefficient of 0.986. This suggests that a method can be developed to effectively remove the background signal of drill collars in the LWD environment.
S P f o r = S P f S P N / f R S P B
where S P f o r is the captured gamma energy spectra of formation elements, and S P N and S P F are the captured gamma energy spectra measured by the near and far detectors. f R S P B is the ratio spectrum obtained by combining the gamma–time spectrum count ratio.

3.4. Verification of Calculation Accuracy of Element Yield

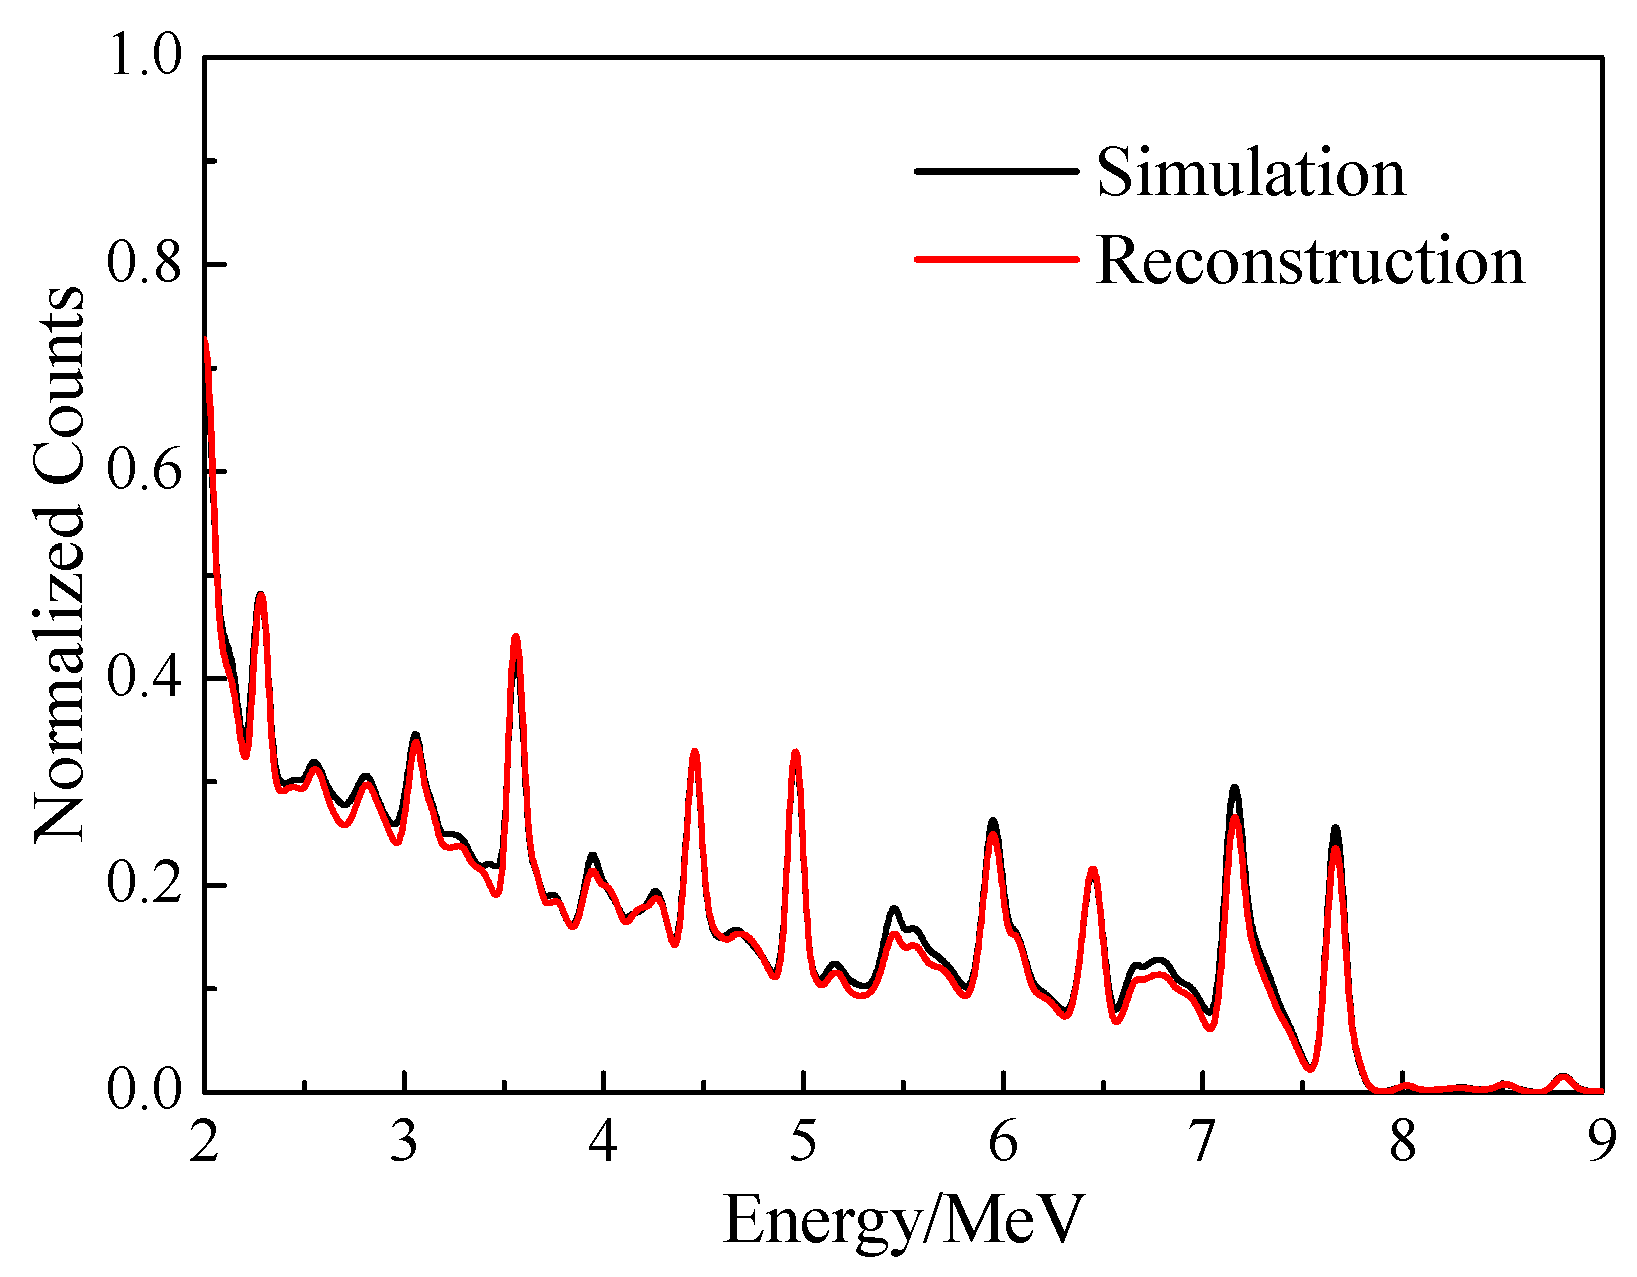
The numerical calculation model is established. The relative volumes of each mineral in the formation medium are sandstone (40%), limestone (20%), kaolinite (10%), montmorillonite (27%), and iron oxide (3%). The capture gamma energy spectra and time spectra measured by near and far detectors are obtained by simulation. The pure formation gamma energy spectra are obtained by the method proposed in this paper and compared with the ideal pure formation gamma energy spectra obtained by simulation. In addition, the pure formation gamma energy spectrum obtained after processing and the ideal gamma energy spectrum are analyzed, respectively, and the difference in element yield is compared to comprehensively judge the validity of the reconstructed pure formation gamma energy spectrum method. Figure 10 shows the comparison between the reconstructed pure formation gamma energy spectrum after eliminating the drill collar background and the ideal formation gamma spectrum.
The numerical calculation model has been established, and the relative volumes of each mineral in the formation medium are sandstone (40%), limestone (20%), kaolinite (10%), montmorillonite (27%), and iron oxide (3%). By simulation, gamma energy spectrum and time spectra are recorded by near and far detectors. The proposed method in this paper has enabled the extraction of pure formation gamma spectrum, which is then compared with the ideal pure formation gamma energy spectrum obtained by simulation. Furthermore, the processed and ideal pure formation gamma energy spectrum are analyzed separately, with a comparison of the differences in element yield to assess the validity of the reconstructed pure formation gamma energy spectrum method. Figure 10 illustrates the comparison between the reconstructed pure formation gamma energy spectrum after eliminating the drill collar background and the ideal formation gamma spectrum. Table 3 shows the yield and error analysis of each element obtained by energy spectrum analysis.
The reconstructed pure formation gamma energy spectrum shows a strong correlation with the ideal formation gamma spectrum, with most energy peaks aligning closely, albeit with some minor discrepancies. These differences may be attributed to the limited formation information captured by the near detector, impacting the exact correspondence between the reconstructed and ideal formation gamma energy spectra. In addition, it is evident that the errors in the element yield are quite low. Notably, although Na displays a relatively higher error margin, this is expected given its low content—the small absolute error resulted in amplified relative errors. Importantly, the absolute quantification of Na content remains accurate, confirming the method’s reliability for trace element detection. Overall, the reconstruction of the pure formation gamma energy spectrum effectively captures weak formation signals.

4. A Simulation Example

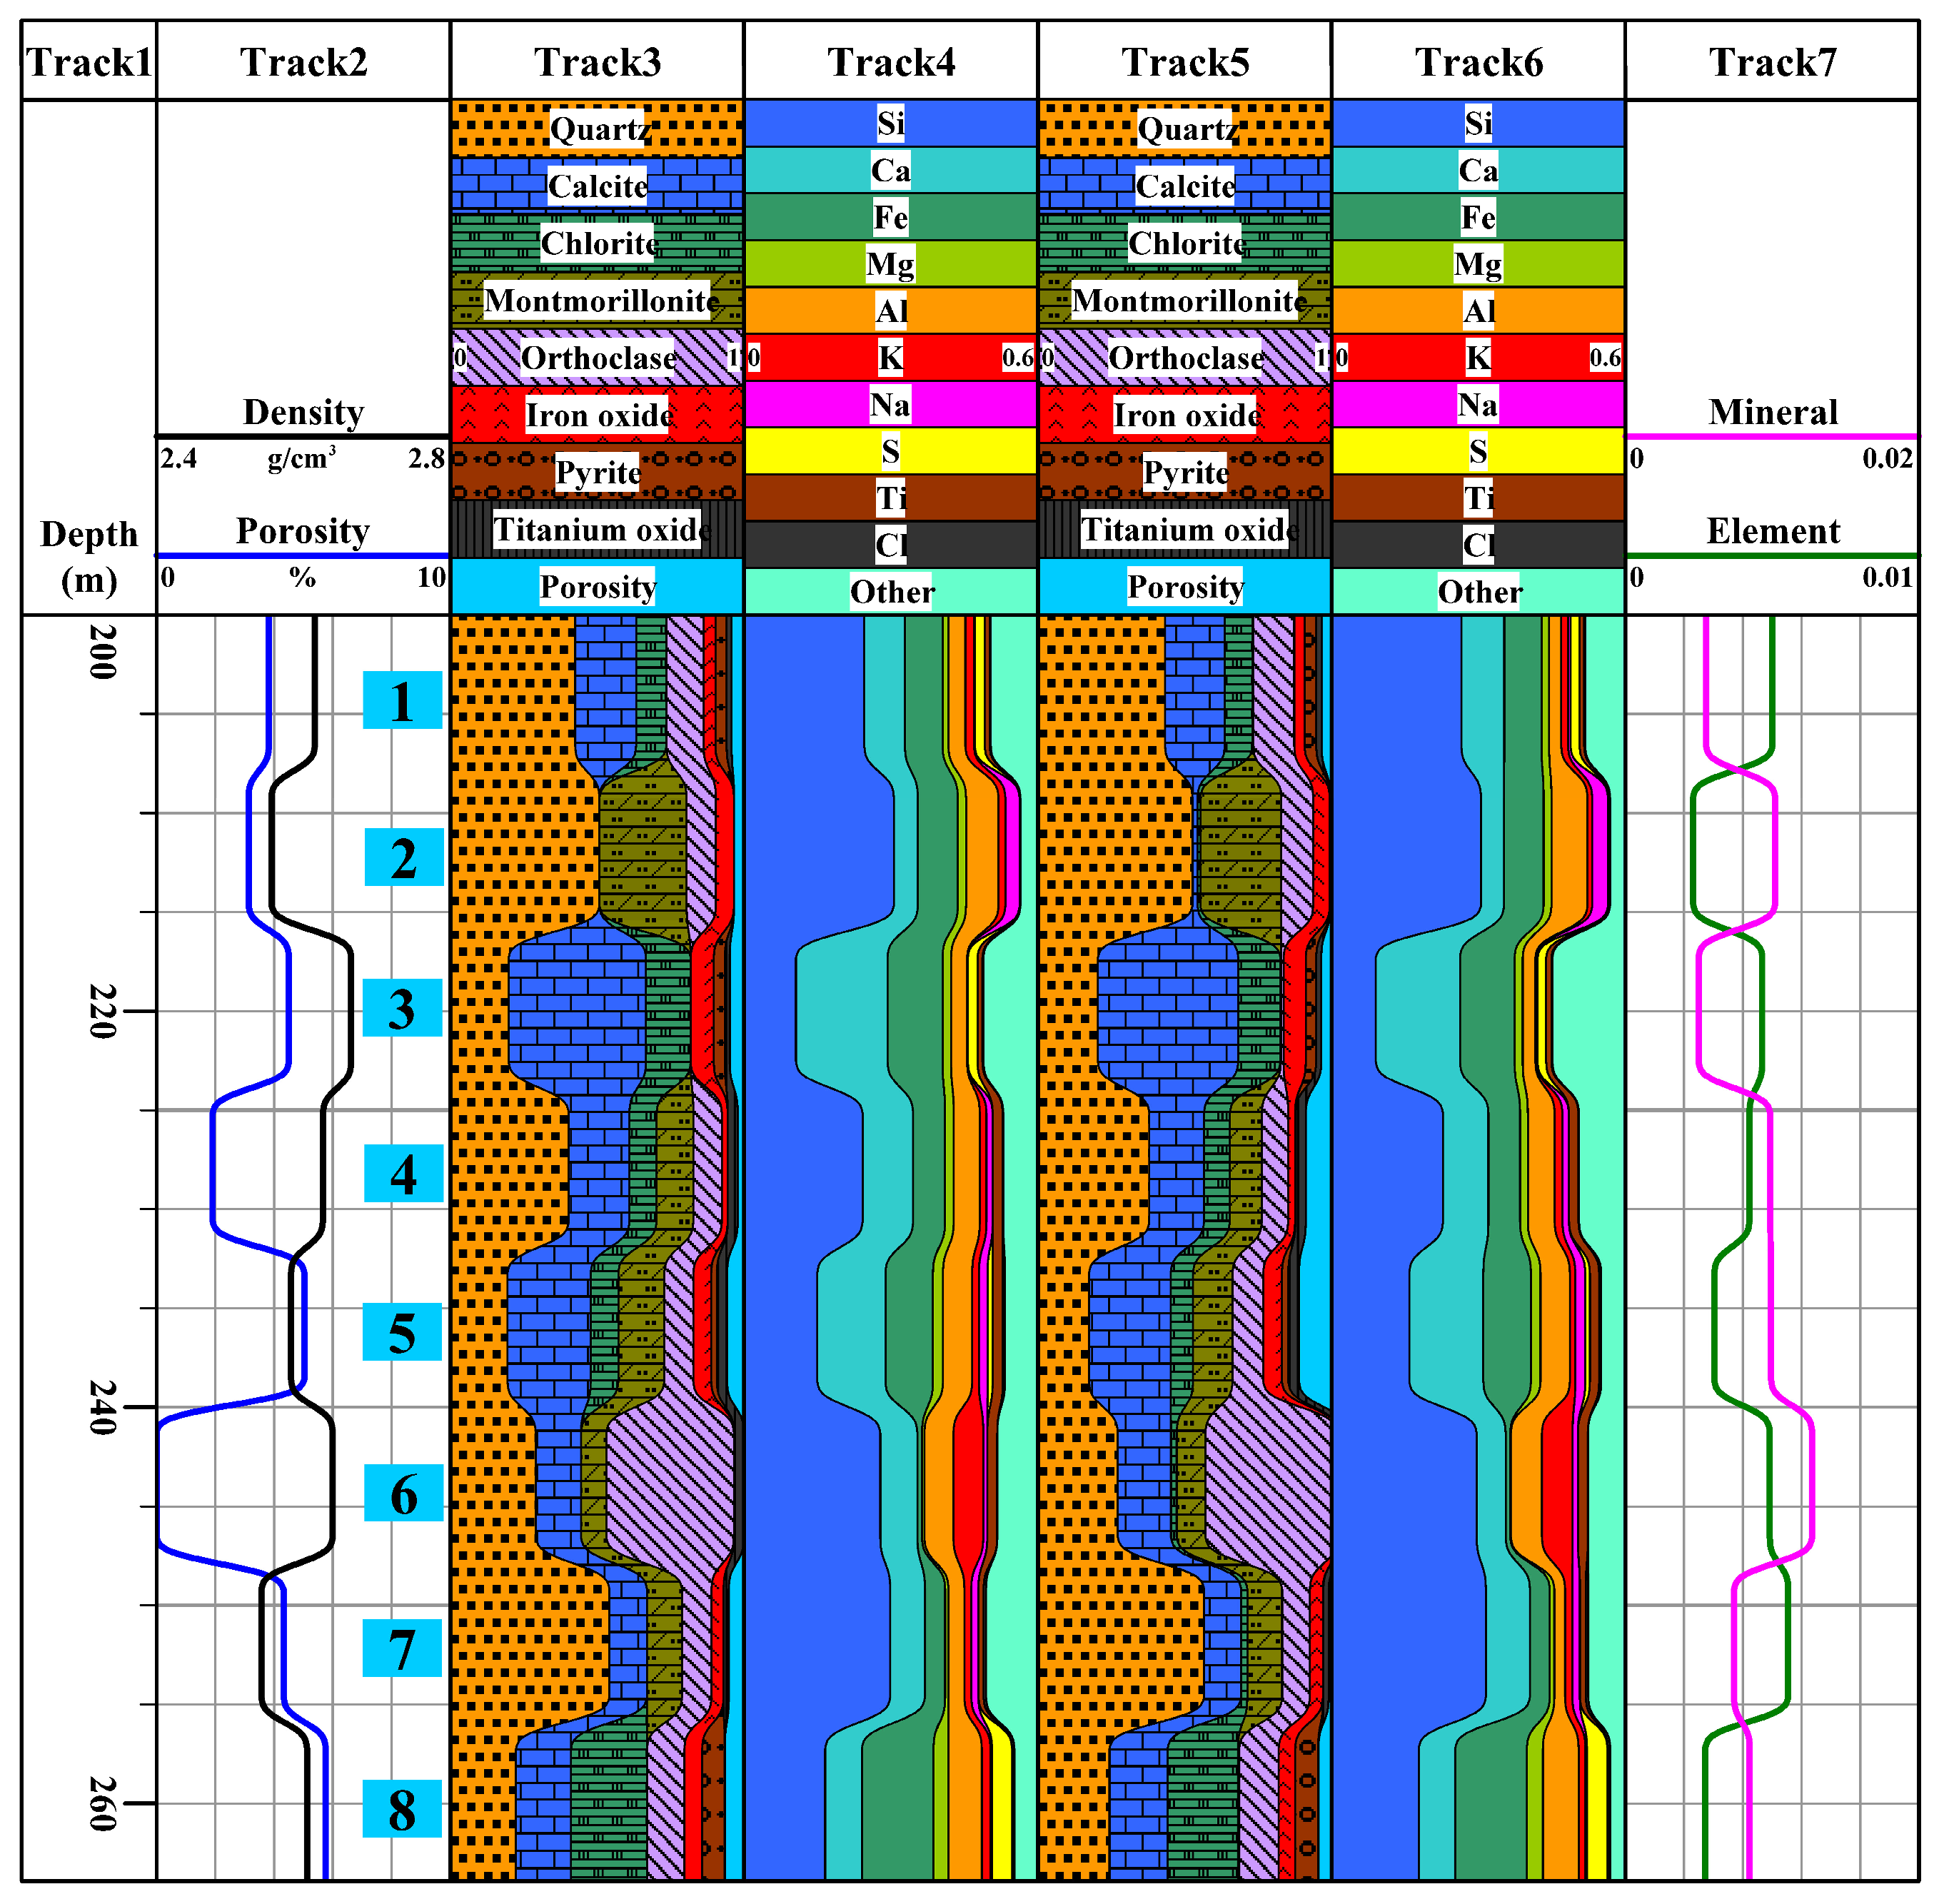
The unconventional reservoir formation model is established using the numerical simulation method. To accurately reflect the geological characteristics of unconventional reservoirs, the simulation example incorporates a complex mineral composition, including quartz (SiO2), calcite (CaCO3), chlorite ((Mg,Fe)3Si4O10(OH)2), montmorillonite ((Na,Ca)0.33(Al,Mg)2[Si4O10](OH)2·nH2O), orthoclase (K[AlSi3O8]), iron oxide (Fe2O3), pyrite (FeS2), titanium oxide (TiO2), and others. The simulated formation is characterized as a low-porosity tight reservoir, with porosity ranging from 5% to 15%. The pore fluid in each example is fresh water. Table 4 presents the mineral composition, porosity, and salinity parameters for the simulation.
The numerical calculation model is simulated based on the specified parameters, with the total formation thickness set at 64 m. The simulation involves the process of measuring the gamma energy spectrum and the time spectrum as the drilling collar and instrument slide along the wall from top to bottom using the dual detector. The pure formation gamma energy spectrum is then analyzed by subtracting the drill collar background, and the formation element content and mineral content are obtained through data processing methods. Figure 11 illustrates the processing results, with the first track representing the depth range of 200 to 264 m, divided into 8 m layers. The second to fourth tracks display the formation density, porosity, mineral profile, and formation element content as set in the model. By processing the energy spectrum and time spectrum, the calculated formation mineral content and element content are shown in the fifth and sixth tracks. A comparison between the set values and the calculated values of the formation element and mineral content is presented, with the absolute errors shown in the seventh track.
The calculation error of element content in each layer is observed to be less than 0.5%, as shown in the results. The relatively low content of elements such as Cl and Mg in the formation contributes to the small calculation error. Overall, the average error of element content is low. Furthermore, the average calculation error of mineral content, as calculated by element content, is less than 1.5%. This indicates that the proposed method is effective in ensuring the accuracy of element and mineral content measurement while drilling.

5. Conclusions

This paper addresses the challenge of low precision in calculating element content during elemental logging while drilling, caused by the strong background signal from the drilling collar. The proposed method combines the gamma energy and time spectrum of the dual detector to remove the background signal. Through numerical simulation, it is found that the near detector reflects only the drilling collar’s information, while the far detector reflects both the drilling collar and the formation. The ratio of gamma ray counts between the near detector’s measured spectrum and the far detector’s drilling collar background spectrum is utilized as the “ratio spectrum”. The pure formation gamma energy spectrum is extracted by using the response relationship of the gamma–time spectrum counts ratio and the ratio spectrum amplitude, combined with the gamma energy spectrum measured by the far detector. This method effectively controls the deviation of low-content element yield within 0.5%. A logging example of complex lithology formations with elemental logging while drilling is used to demonstrate the proposed method. The results indicate that the average calculation errors of element content and mineral content can be controlled within 0.5% and 1.5%, respectively, showcasing high precision in element measurement. This method forms the basis for the high-precision calculation of element content during logging while drilling, providing crucial technical support for the exploration and development of unconventional reservoirs.

Author Contributions

Conceptualization, J.F. and Q.Z.; methodology, J.F. and Q.Z.; software, J.F.; validation, J.F. and Q.Z.; formal analysis, Q.Z.; investigation, Q.Z.; re-sources, J.F.; data curation, J.F.; writing—original draft preparation, J.F.; writing—review and editing, J.F. and Q.Z.; visualization, J.F. and Q.Z.; supervision, J.F.; project administration, J.F. and Q.Z.; funding acquisition, Q.Z. All authors have read and agreed to the published version of the manuscript.

Funding

This research was funded by National Natural Science Foundation of China (U23B20151 and 52171253) and National Science Foundation for Young Scientists of Sichuan (2025ZNSFSC1168).

Institutional Review Board Statement

Not applicable.

Informed Consent Statement

Not applicable.

Data Availability Statement

The data presented in this study are available on request from the corresponding author.

Acknowledgments

We thank the reviewers for their valuable feedback, which has greatly improved the quality of this paper.

Conflicts of Interest

Author Jilin Fan was employed by the company China National Logging Corporation, Xi’an, China. The remaining authors declare that the research was conducted in the absence of any commercial or financial relationships that could be construed as a potential conflict of interest.

References

  1. Pedersen, B.K.; Pedersen, E.S.; Morriss, S.L.; Constable, M.V.; Vissapragada, B.; Sibbit, A.; Stoller, C.; Almaguer, J.; Evans, M.; Shray, F.; et al. Understanding the effects of cesium/potassium formate fluid on well log response-a case study of the Kristin and Kvitebjorn fields, Offshore Norway. In Proceedings of the SPE Annual Technical Conference and Exhibition, San Antonio, TX, USA, 24–27 September 2006. [Google Scholar]
  2. Sun, J.; Chen, M.; Li, Q.; Ren, L.; Dou, M.; Zhang, J. A new method for predicting formation lithology while drilling at horizontal well bit. J. Pet. Sci. Eng. 2021, 196, 107955. [Google Scholar] [CrossRef]
  3. Liu, J.; Zhang, G.; Bai, J.; Ding, W.; Yang, H.; Liu, Y. Quantitative prediction of the drilling azimuth of horizontal wells in fractured tight sandstone based on reservoir geomechanics in the Ordos Basin, central China. Mar. Pet. Geol. 2022, 136, 105439. [Google Scholar] [CrossRef]
  4. Herron, M.M. Mineralogy from geochemical well logging. Clays Clay Miner. 1986, 34, 204–213. [Google Scholar] [CrossRef]
  5. James, E.S.; Omole, O.; Diedjomahor, J.; Crowe, J. Calibration of the elemental capture spectroscopy tool using the Niger delta formation. In Proceedings of the Nigeria Annual International Conference and Exhibition, Abuja, Nigeria, 6–8 August 2007. [Google Scholar]
  6. Galford, J.; Quirein, J.; Shannon, S.; Truax, J.A.; Witkowsky, J. Field test results of a new neutron-induced gamma-ray spectroscopy geochemical logging tool. In Proceedings of the SPE Annual Technical Conference and Exhibition, New Orleans, LA, USA, 4–7 October 2009. [Google Scholar]
  7. Pemper, R.R.; Sommer, A.; Guo, P.; Jacobi, D.; Longo, J.; Bliven, S.; Rodriguez, E.; Mendez, F.; Han, X. A new pulsed neutron sonde for derivation of formation lithology and mineralogy. In Proceedings of the SPE Annual Technical Conference and Exhibition, San Antonio, TX, USA, 24–27 September 2006. [Google Scholar]
  8. Radtke, R.J.; Lorente, M.; Adolph, B.; Berheide, M.; Fricke, S.; Grau, J.; Herron, S.; Horkowitz, J.; Jorion, B.; Madio, D.; et al. A new capture and inelastic spectroscopy tool takes geochemical logging to the next level. In Proceedings of the SPWLA 53rd Annual Logging Symposium, Cartagena, Colombia, 16–20 June 2012. [Google Scholar]
  9. Grau, J.A.; Schweitzer, J.S. Prompt γ-ray spectral analysis of well data obtained with NaI (Tl) and 14 MeV neutrons. Nucl. Geophys. 1987, 1, 157–165. [Google Scholar]
  10. Crittin, M.; Kern, J.; Schenker, J.L. The new prompt gamma-ray activation facility at the Paul Scherrer Institute, Switzerland. Nucl. Instrum. Methods Phys. Res. Sect. A Accel. Spectrom. Detect. Assoc. Equip. 2000, 449, 221–236. [Google Scholar] [CrossRef]
  11. Mohamad, N.; Defrian, B.S.; Kusaka, K.; Simatupang, J. Optimization of matrix acidization by elementary capture spectroscopy log. In Proceedings of the International Symposium and Exhibition on Formation Damage Control, Lafayette, LA, USA, 20–21 February 2002. [Google Scholar]
  12. AlRuwaili, S.B.; AlWaheed, H.H. Petrophysical models and techniques for shaly-sand formation evaluation. In Proceedings of the Abu Dhabi International Conference and Exhibition, Abu Dhabi, United Arab Emirates, 10–13 October 2004. [Google Scholar]
  13. Liu, J.; Zhang, F.; Wang, X.; Han, F.; Yuan, Z. Numerical study on determining formation porosity using a boron capture gamma-ray technique and MCNP. Appl. Radiat. Isot. 2014, 94, 266–271. [Google Scholar] [CrossRef] [PubMed]
  14. Zhang, F.; Liu, J. Monte Carlo simulation of PGNAA system for determining element content in the rock sample. J. Radioanal. Nucl. Chem. 2014, 299, 1219–1224. [Google Scholar]
  15. MacDonald, R.; Bradford, C.; Kersey, D.G.; Zhang, T.; Alsuhaibani, A.; Crary, S. Improved lithology determination from nuclear logs in complex carbonate environments. In Proceedings of the North Africa Technical Conference and Exhibition, Cairo, Egypt, 14–17 February 2010. [Google Scholar]
  16. Perez, G.; Mendez, F.E.; Alarcon, N.; Paris, M.J. Pulsed neutron through-casing technology for determination of mineralogy and total organic carbon–first case study in the Neuquén Basin, Argentina. In Proceedings of the SPWLA 56th Annual Logging Symposium, Long Beach, CA, USA, 18–22 July 2015. [Google Scholar]
  17. Zhou, T.; Rose, D.; Miles, J.; Gendur, J. Self-compensated cased-hole pulsed neutron spectroscopy measurements. In Proceedings of the SPWLA 61st Annual Logging Symposium, Virtual Online Webinar, 24 June–29 July 2020. [Google Scholar]
  18. Gjerdingen, T.; Nygaard, J.; Elshayeb, T.; Hoch, E.; Narayanan, R. Application of spectroscopy and sigma measurements to enhance petrophysical evaluations and geosteering in the mineralogical complex, thin bedded Nahr Umr sandstone reservoir. In Proceedings of the International Petroleum Technology Conference, Doha, Qatar, 7–9 December 2009. [Google Scholar]
  19. Weller, G.; Griffiths, R.; Stoller, C.; Allioli, F. A new integrated LWD platform brings next-generation formation evaluation services. In Proceedings of the SPWLA 46th Annual Logging Symposium, New Orleans, LA, USA, 26–29 June 2005. [Google Scholar]
  20. Reichel, N.; Evans, M.; Allioli, F.; Mauborgne, M.L.; Nicoletti, L.; Haranger, F.; Laporte, N.; Stoller, C.; Cretoiu, V.; El Hehiawy, E.; et al. Neutron-Gamma Density (NGD): Principles, field test results and log quality control of a radioisotope-free bulk density measurement. In Proceedings of the SPWLA 53rd Annual Logging Symposium, Cartagena, Colombia, 16–20 June 2012. [Google Scholar]
  21. Glasstone, S.; Edlund, M.C. The Elements of Nuclear Reactor Theory; van Nostrand: New York, NY, USA, 1952. [Google Scholar]
  22. Feld, B.T. The neutron. Exp. Nucl. Phys. 1953, 2, 240. [Google Scholar]
  23. Battistoni, G.; Cerutti, F.; Fasso, A.; Ferrari, A.; Muraro, S.; Ranft, J.; Roesler, S.; Sala, P.R. The FLUKA code: Description and benchmarking. In Proceedings of the AIP Conference Proceedings, Batavia, IL, USA, 6–8 September 2006; American Institute of Physics: College Park, MD, USA, 2007; Volume 896, pp. 31–49. [Google Scholar]
Figure 1. The model of the formation and instrument.
Applsci 15 12057 g001
Figure 2. Far detector’s capture gamma energy spectrum of Model 6.
Applsci 15 12057 g002
Figure 3. Comparison of capture background spectrum in drill collar area of far detector. (Left): Background signal comparison. (Right): Normalized background signal.
Applsci 15 12057 g003
Figure 4. Gamma energy spectra of near detector.
Applsci 15 12057 g004
Figure 5. Measured energy spectrum and background energy spectrum of drill collar.
Applsci 15 12057 g005
Figure 6. Gamma time spectrum of dual detector. (Left): Near detector; (Right): Far detector.
Applsci 15 12057 g006
Figure 7. Spectral signal composed of the count ratio of each energy channel. (Left): before normalization. (Right): After normalization.
Applsci 15 12057 g007
Figure 8. Far detector gamma–time spectrum.
Applsci 15 12057 g008
Figure 9. The relationship of the counts ratio and the ratio spectrum average count.
Applsci 15 12057 g009
Figure 10. Comparison of reconstructed and simulated formation energy spectrum.
Applsci 15 12057 g010
Figure 11. Example of formation water salinity calculation.
Applsci 15 12057 g011
Table 1. Relative volume of minerals under different formation conditions.
Model Number123456
Mineral and relative volume fraction (%)Quartz10000807050
Dolomite01000000
Calcite001000020
Kaolinite0002000
Montmorillonite0000300
Orthoclase0000023
Iron oxide000005
Titanium oxide000002
Table 2. Relative volume of minerals of added formation conditions.
Model Number7891011121314
Mineral and relative Volume fraction (%)Quartz70050038732245
Dolomite10603588004815
Calcite00100151209
Kaolinite0130000015
Montmorillonite0001000012
Orthoclase1725004512300
Iron oxide30420203
Titanium oxide02102101
Table 3. Element yield calculation results and error analysis.
Element TypeSimulation/%Reconstruction/%Absolute Error/%Relative Error/%
Si22.7023.490.793.48
Ca16.1017.191.096.76
Fe49.6147.502.114.25
Al7.537.010.526.94
Na4.134.610.4711.45
Table 4. Model parameters.
Model12345678
Mineral volume fraction/%Quartz4249204019295222
Calcite200462027151218
Chlorite10015990025
Montmorillonite030013169120
Orthoclase131001010451013
Iron oxide23413023
Pyrite20201004
Titanium oxide10122210
Porosity/%1081251301115
Disclaimer/Publisher’s Note: The statements, opinions and data contained in all publications are solely those of the individual author(s) and contributor(s) and not of MDPI and/or the editor(s). MDPI and/or the editor(s) disclaim responsibility for any injury to people or property resulting from any ideas, methods, instructions or products referred to in the content.