Article

Study of Intelligent Identification of Radionuclides Using a CNN–Meta Deep Hybrid Model

1
Jiangxi Province Key Laboratory of Nuclear Physics and Technology, East China University of Technology, Nanchang 330013, China
2
School of Nuclear Science and Engineering, East China University of Technology, Nanchang 330013, China
3
Key Laboratory of Advanced Nuclear Energy Design and Safety, Ministry of Education, Hengyang 421001, China
4
School of Nuclear Science and Technology, University of South China, Hengyang 421001, China
*
Authors to whom correspondence should be addressed.
Appl. Sci. 2025, 15(22), 12285; https://doi.org/10.3390/app152212285
Submission received: 9 October 2025 / Revised: 16 November 2025 / Accepted: 16 November 2025 / Published: 19 November 2025

Abstract

The rapid and accurate identification of radionuclides and the quantitative analysis of their activities have long been key research areas in the field of nuclear spectrum data processing. Traditional nuclear spectrum analysis methods heavily rely on manual feature extraction, making them highly susceptible to interference from factors such as energy resolution, calibration drift, and spectral peak overlap when dealing with complex mixed-radionuclide spectra, ultimately leading to degraded identification performance and accuracy. Based on multi-nuclide energy spectral data acquired via Geant4 simulation, this study compares the performance of partial least squares regression (PLSR), random forest (RF), a convolutional neural network (CNN), and a hybrid CNN–Meta model for radionuclide identification and quantitative activity analysis under conditions of raw energy spectra, Z-score normalization, and min-max normalization. To maximize the potential of each model, principal component selection, Bayesian hyperparameter optimization, iteration tuning, and meta-learning optimization were employed. Model performance was comprehensively evaluated using the coefficient of determination (R2), root mean square error (RMSE), mean relative error (MRE), and computational time. The results demonstrate that deep learning models can effectively capture nonlinear relationships within complex energy spectra, enabling accurate radionuclide identification and activity quantification. Specifically, the CNN achieved a globally optimal test RMSE of 0.00566 and an R2 of 0.999 with raw energy spectra. CNN–Meta exhibited superior adaptability and generalization under min-max normalization, reducing test error by 70.8% compared to RF, while requiring only 49% of the total computation time of the CNN model. RF was relatively insensitive to preprocessing but yielded higher absolute errors, whereas PLSR was limited by its linear nature and failed to capture the nonlinear characteristics of complex energy spectra. In conclusion, the CNN–Meta hybrid model demonstrates superior performance in both accuracy and efficiency, providing a reliable and effective approach for the rapid identification of radionuclides and quantitative analysis of activity in complex energy spectra.

1. Introduction

Highly accurate radionuclide identification and activity quantification analysis hold significant application value in fields such as radiation environmental monitoring [1], nuclear safety regulation [2], nuclear medicine [3], and emergency response to nuclear incidents. Owing to their superior energy resolution, high-purity germanium (HPGe) detectors have become the instrument of choice for acquiring complex gamma-ray spectra [4]. However, traditional approaches, such as the net peak area method [5] and the library matching method [6], still heavily rely on manual or semi-automated processing steps, including smoothing, background subtraction, peak searching, energy calibration, and efficiency calibration. Consequently, even with high-resolution energy spectra, these traditional methods often fail to effectively resolve multi-nuclide mixtures, leading to limited analytical accuracy and poor robustness against interference [7].
In recent years, machine learning algorithms have been increasingly introduced into energy spectral analysis for their prowess in feature learning and nonlinear mapping, offering new pathways to improve recognition accuracy and automation [8]. Early studies on machine learning for energy spectral identification were primarily based on linear models. Partial least squares regression (PLSR) has been shown to effectively address multicollinearity in high-dimensional data [9], and latent variable modeling has also reduced dependence on physical priors in background subtraction [10]. However, such linear methods generally possess limited capability for nonlinear modeling of strongly overlapping peaks and often lack end-to-end activity quantification output [11]. To enhance nonlinear modeling capacity, support vector machines (SVMs) [12], random forests, and adaptive boosting (AdaBoost) algorithms [13,14] have been introduced in this field, demonstrating better robustness in classification tasks and practical applications. Nonetheless, most of these studies still focus on radionuclide classification or rely on hardware improvements to enhance activity quantification accuracy, with limited exploration into precise activity quantification for mixed nuclides and model generalization.
Recently, deep learning techniques, particularly convolutional neural networks (CNNs), have shown notable advantages in end-to-end feature extraction [15] and recognition of complex mixed spectra [16], significantly improving identification accuracy. Building upon traditional CNNs, more advanced architectures such as Residual Networks (ResNets) have been introduced into energy spectrum analysis, effectively mitigating the vanishing gradient problem in deep networks and thereby enhancing the feature representation capability for complex spectral structures [17]. Furthermore, Transformer-based models leverage self-attention mechanisms to effectively capture long-range dependencies and global contextual information in energy spectra, demonstrating superior modeling ability in resolving complex peak overlap tasks [18]. Despite these advances, deep learning approaches for radionuclide identification continue to face challenges. On the one hand, they depend heavily on large amounts of simulated training data. On the other hand, models often involve a large number of parameters and substantial computational costs, while their accuracy and robustness in high-precision activity quantification tasks using HPGe detectors remain to be improved [19].
Additionally, meta-learning and meta-adaptation frameworks are gradually emerging as promising approaches to address the aforementioned challenges. Their core idea lies in enabling models to acquire cross-task “learning-to-learn” capabilities, allowing rapid adaptation to new measurement conditions with only limited annotated data and a few gradient update steps. Notably, gradient-based meta-learning algorithms (such as MAML and Reptile) have shown significant potential in few-shot regression tasks, not only improving model generalization performance but also reducing reliance on large-scale training data [20]. Such meta-adaptation strategies highlight a promising development direction for building more robust and data-efficient radionuclide analysis models.
In summary, although machine learning methods have made remarkable progress in radionuclide identification, challenges remain in achieving high-precision quantitative analysis of multiple nuclides. To address this issue, this study systematically compares the performance of various machine learning models for radionuclide identification and activity quantification using Geant4 simulated energy spectral data. The main contributions of this paper are twofold. First, it introduces a hybrid CNN–Meta model that integrates meta-learning with convolutional neural networks for radionuclide activity quantification analysis. Second, it systematically evaluates the impact of different preprocessing strategies on the performance of models with different architectures, providing a feasible solution for achieving high-precision, high-efficiency, end-to-end quantitative analysis under mixed-spectrum conditions.

2. Experimental Methods

2.1. Dataset Construction

This study first acquired energy spectrum data from four thin-film standard sources (whose self-absorption effects are negligible): 241Am, 57Co, 137Cs, and 152Eu. The measurements were conducted using an HPGe detector system equipped with a low-background lead shielding device. All measurements were performed under uniform shielding and with an electronic configuration that ensured a low dead time and recorded the live time in real time. The experimental setup involved a coaxial and directly facing arrangement between the source and the detector, with a fixed distance of 7 cm between the source and the detector window. After acquiring the energy spectra of both single nuclides and mixed nuclides, the energies of characteristic peaks and their corresponding channel numbers were used for linear fitting. The energies listed in Table 1 were used for calibration to obtain the parameters for the energy calibration formula:
E ( keV ) = A × c h + B ,
where E is the energy, c h is the channel number, and A = 0.14262922 and B = 0.07708956 are the fitted parameters.
Since machine learning models rely on large-scale datasets for training, the acquisition of sufficient experimental data is often constrained by cost, time, and environmental conditions. The Monte Carlo (MC) method can generate statistically reliable large-scale simulated data based on physical processes and has been widely applied in fields such as nuclear spectroscopy [21,22]. However, its high computational cost and long runtime make it difficult to directly meet the data requirements of machine learning. To address this limitation, this study proposes a hybrid data construction strategy. First, a small but highly reliable set of simulated data was generated using Geant4 and validated against experimental measurements to ensure physical consistency. As illustrated in Figure 1, the data obtained from actual measurements of the detector system and the simulated data generated by Geant4 exhibit a high degree of consistency. The deviation of the main peak (661.66 keV) position is only 0.28%, and the overall integral area deviation is within 5%, verifying that the Monte Carlo simulated data can effectively substitute for experimentally measured data.
Based on this validation, large-scale synthetic datasets were generated using data synthesis techniques, significantly improving the efficiency of data generation while ensuring physical reliability [23]. All subsequent research in this study was conducted using the synthetic dataset.
The experiment utilized a GCDX-30185 high-purity germanium (HPGe) detector, which exhibits energy resolutions of 0.73 keV, 0.83 keV, and 1.65 keV at 5.9 keV, 122 keV, and 1332 keV, respectively, along with a peak-to-Compton ratio (Co 1332 keV) of 70:1, indicating excellent energy resolution performance. The digital spectrometer demonstrates high stability, with an integral nonlinearity of less than 0.02%, a differential nonlinearity of less than 0.8%, a zero drift of less than 1 channel over 72 h, and a gain instability of less than 0.2%. These specifications ensure the repeatability and accuracy of energy spectrum measurements [24]. Based on the geometric structure of the HPGe detector and the radiation source parameters, a corresponding geometric model was established in Geant4. The simulated energy deposition spectrum requires energy broadening to match the energy resolution of a real detector. The Full Width at Half Maximum (FWHM) required for energy broadening was calculated using the following empirical formula:
FWHM ( E ) = a + b E + c E 2 ,
where the parameters a = 0.0004932 , b = 0.0008085 , and c = 0.4676 were obtained by fitting the measured spectra.
Subsequently, the Gaussian standard deviation σ was calculated according to Equation (3), and convolution processing was applied to the simulated spectrum:
σ = FWHM 2.355 .
All simulated energy spectra were uniformly resampled to 16,384 channels. Spectra were then randomly drawn from individual nuclides. A synthetic full-spectrum y was generated through linear combination based on the relative activity fraction vector w (where the components sum to 1 after normalization), followed by normalization across the entire energy range.
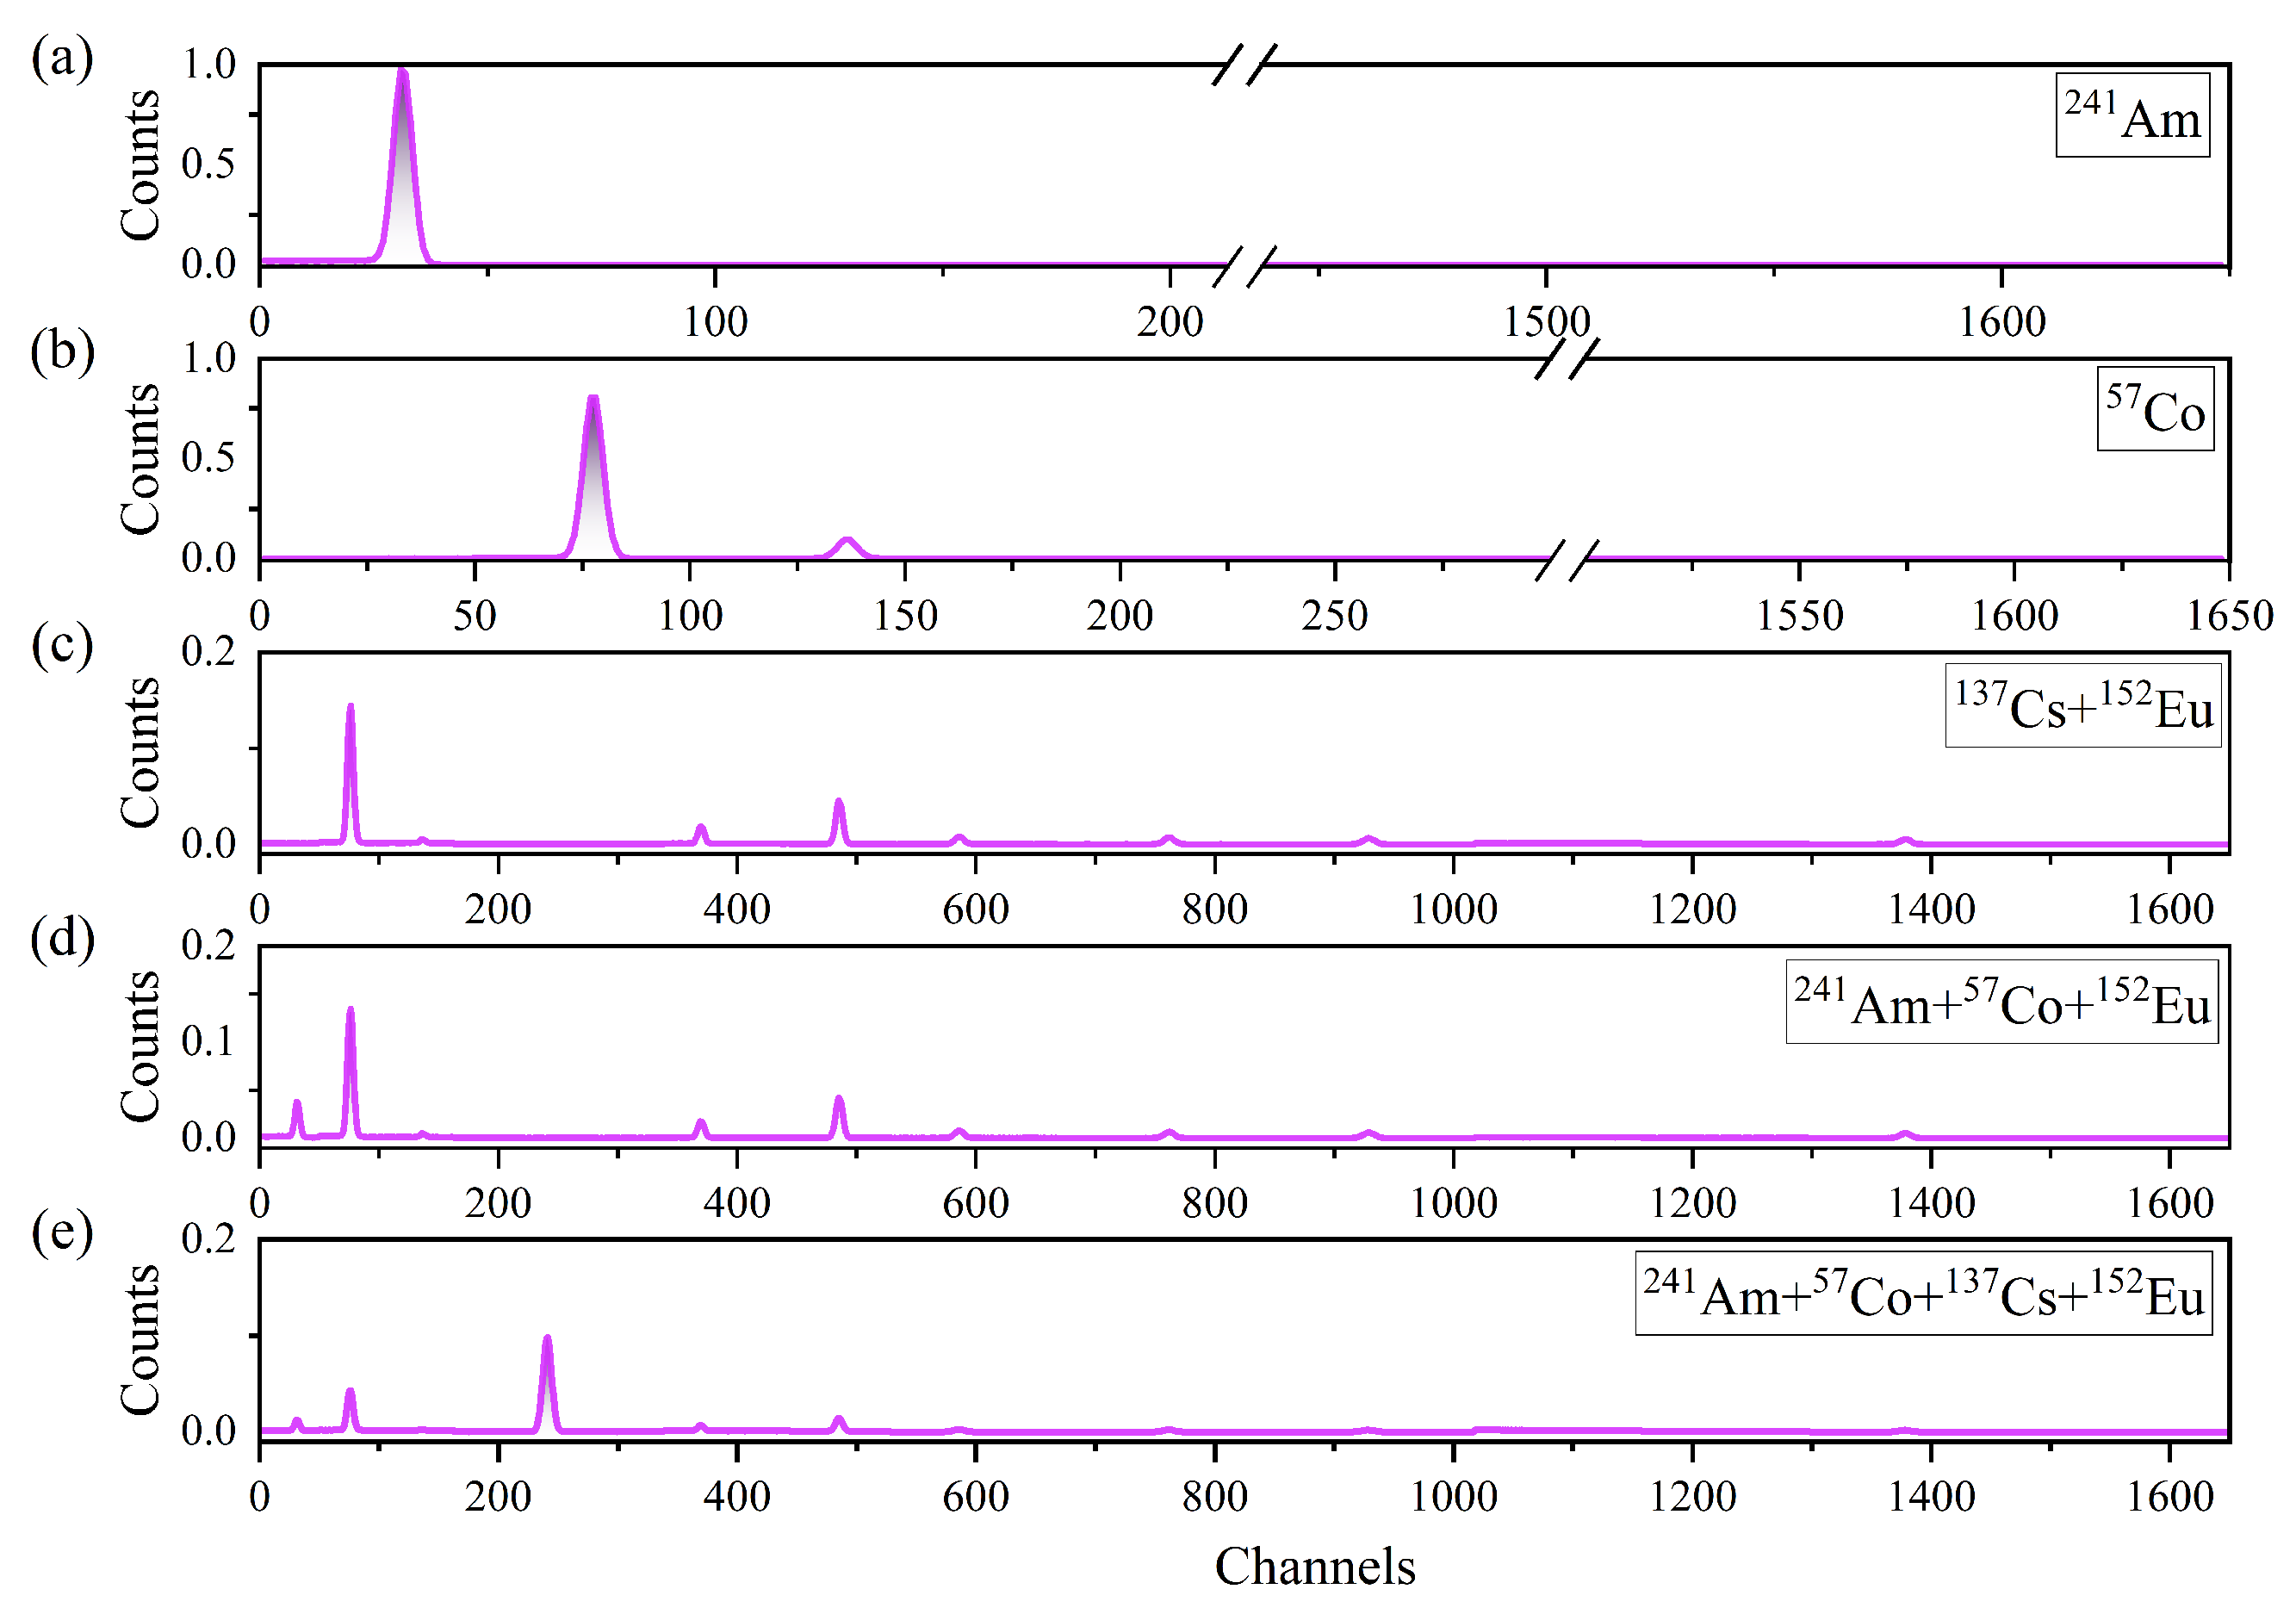
To better approximate the experimental conditions, two types of physical noise were introduced. First, a relative energy-axis scaling of ± 0.2 % followed by resampling was applied to simulate slight calibration drifts. Second, Poisson sampling was performed within a total count range of 5 × 10 4 to 3 × 10 5 to account for statistical fluctuations. Finally, 1648 region-of-interest (ROI) features were extracted for modeling, primarily based on the characteristic energies listed in Table 1 and supplemented by a small number of background windows. A dimensionally reduced representation of the simulated energy spectra is shown in Figure 2. The activity fraction vector is defined as follows:
w = ( w Am , w Co , w Cs , w Eu ) Dirichlet ( 1 4 ) , w k 0 , k w k = 1 ,
y = k { Am , Co , Cs , Eu } w k y k ( i ) ,
where w Am , w Co , w Cs , and w Eu represent the relative activity fractions of the different radionuclides, respectively. A non-zero value for a specific radionuclide signifies its contribution to the mixed energy spectrum, while the magnitude of the value reflects its relative activity. The Dirichlet distribution Dirichlet ( 1 4 ) ensures that the activity fractions are non-negative and sum to one.
Through the above procedure, a high-quality dataset containing 10,000 samples was constructed and subsequently randomly divided into training and test sets with an 8:2 ratio.

2.2. Spectral Data Preprocessing

Data preprocessing is widely applied in energy spectral analysis, where normalization methods can effectively eliminate variations in total counts, highlight spectral features, and improve the stability and accuracy of models. To systematically assess the impact of different preprocessing strategies, this study applied both min-max normalization and Z-score normalization to the full energy spectra and compared model performance on preprocessed and raw data to evaluate the suitability of each strategy.
Min-max normalization applies a linear transformation based on the minimum and maximum values of the dataset, mapping the original data into the interval [0,1] while preserving its distributional shape. The transformation is defined as:
X norm = X X min X max X min ,
where X is the original data, X min and X max are the minimum and maximum values in the dataset, and X norm represents the normalized data.
Z-score normalization, on the other hand, transforms the data using its mean and standard deviation, yielding a distribution with a mean of 0 and a standard deviation of 1. The transformation is given by
X standard = X μ σ ,
where X is the original data, μ is the mean, σ is the standard deviation, and X standard denotes the standardized data.

2.3. Machine Learning Models

In this study, the problem of radionuclide identification was formulated as a regression task based on energy spectral data, with the objective of achieving accurate nuclide recognition by establishing linear or nonlinear mappings between spectral features and the activities of multiple nuclides. By constructing regression models that map spectral inputs to nuclide activity levels, the presence of specific nuclides can be inferred from the predicted activities, thereby enabling the identification and classification of multi-nuclide mixtures. To systematically evaluate the performance of traditional statistical models, machine learning methods, and deep learning algorithms in spectral analysis, four representative models were selected: PLSR, RF, CNN, and the hybrid CNN–Meta model. These models correspond to four methodological approaches: linear regression modeling, ensemble learning, deep feature extraction, and meta-learning-enhanced approaches. Through systematic comparison, this study aims to assess the applicability and limitations of different methods in addressing complex spectral regression tasks.

2.3.1. Partial Least Squares Regression (PLSR)

PLSR is a multivariate statistical method based on latent variable extraction, effective for addressing multicollinearity in high-dimensional data [25]. By constructing a set of low-dimensional latent variables, PLSR compresses the high-dimensional feature space while preserving as much of the covariance structure related to the response variables as possible. It offers significant advantages in feature extraction, computational efficiency, and model interpretability. These characteristics make it well suited for regression analysis involving high-dimensional data with limited sample sizes.

2.3.2. Random Forest (RF)

RF is a nonparametric modeling approach based on ensemble learning that enhances predictive performance by constructing multiple decision trees and aggregating their outputs [26,27]. During training, the algorithm introduces randomness in both feature selection and sample generation, effectively reducing model variance and enhancing generalization. RF can capture complex nonlinear relationships in high-dimensional feature spaces, demonstrates strong robustness to outliers, and requires no complicated feature scaling or preprocessing, making it highly practical in applications.

2.3.3. Convolutional Neural Network (CNN)

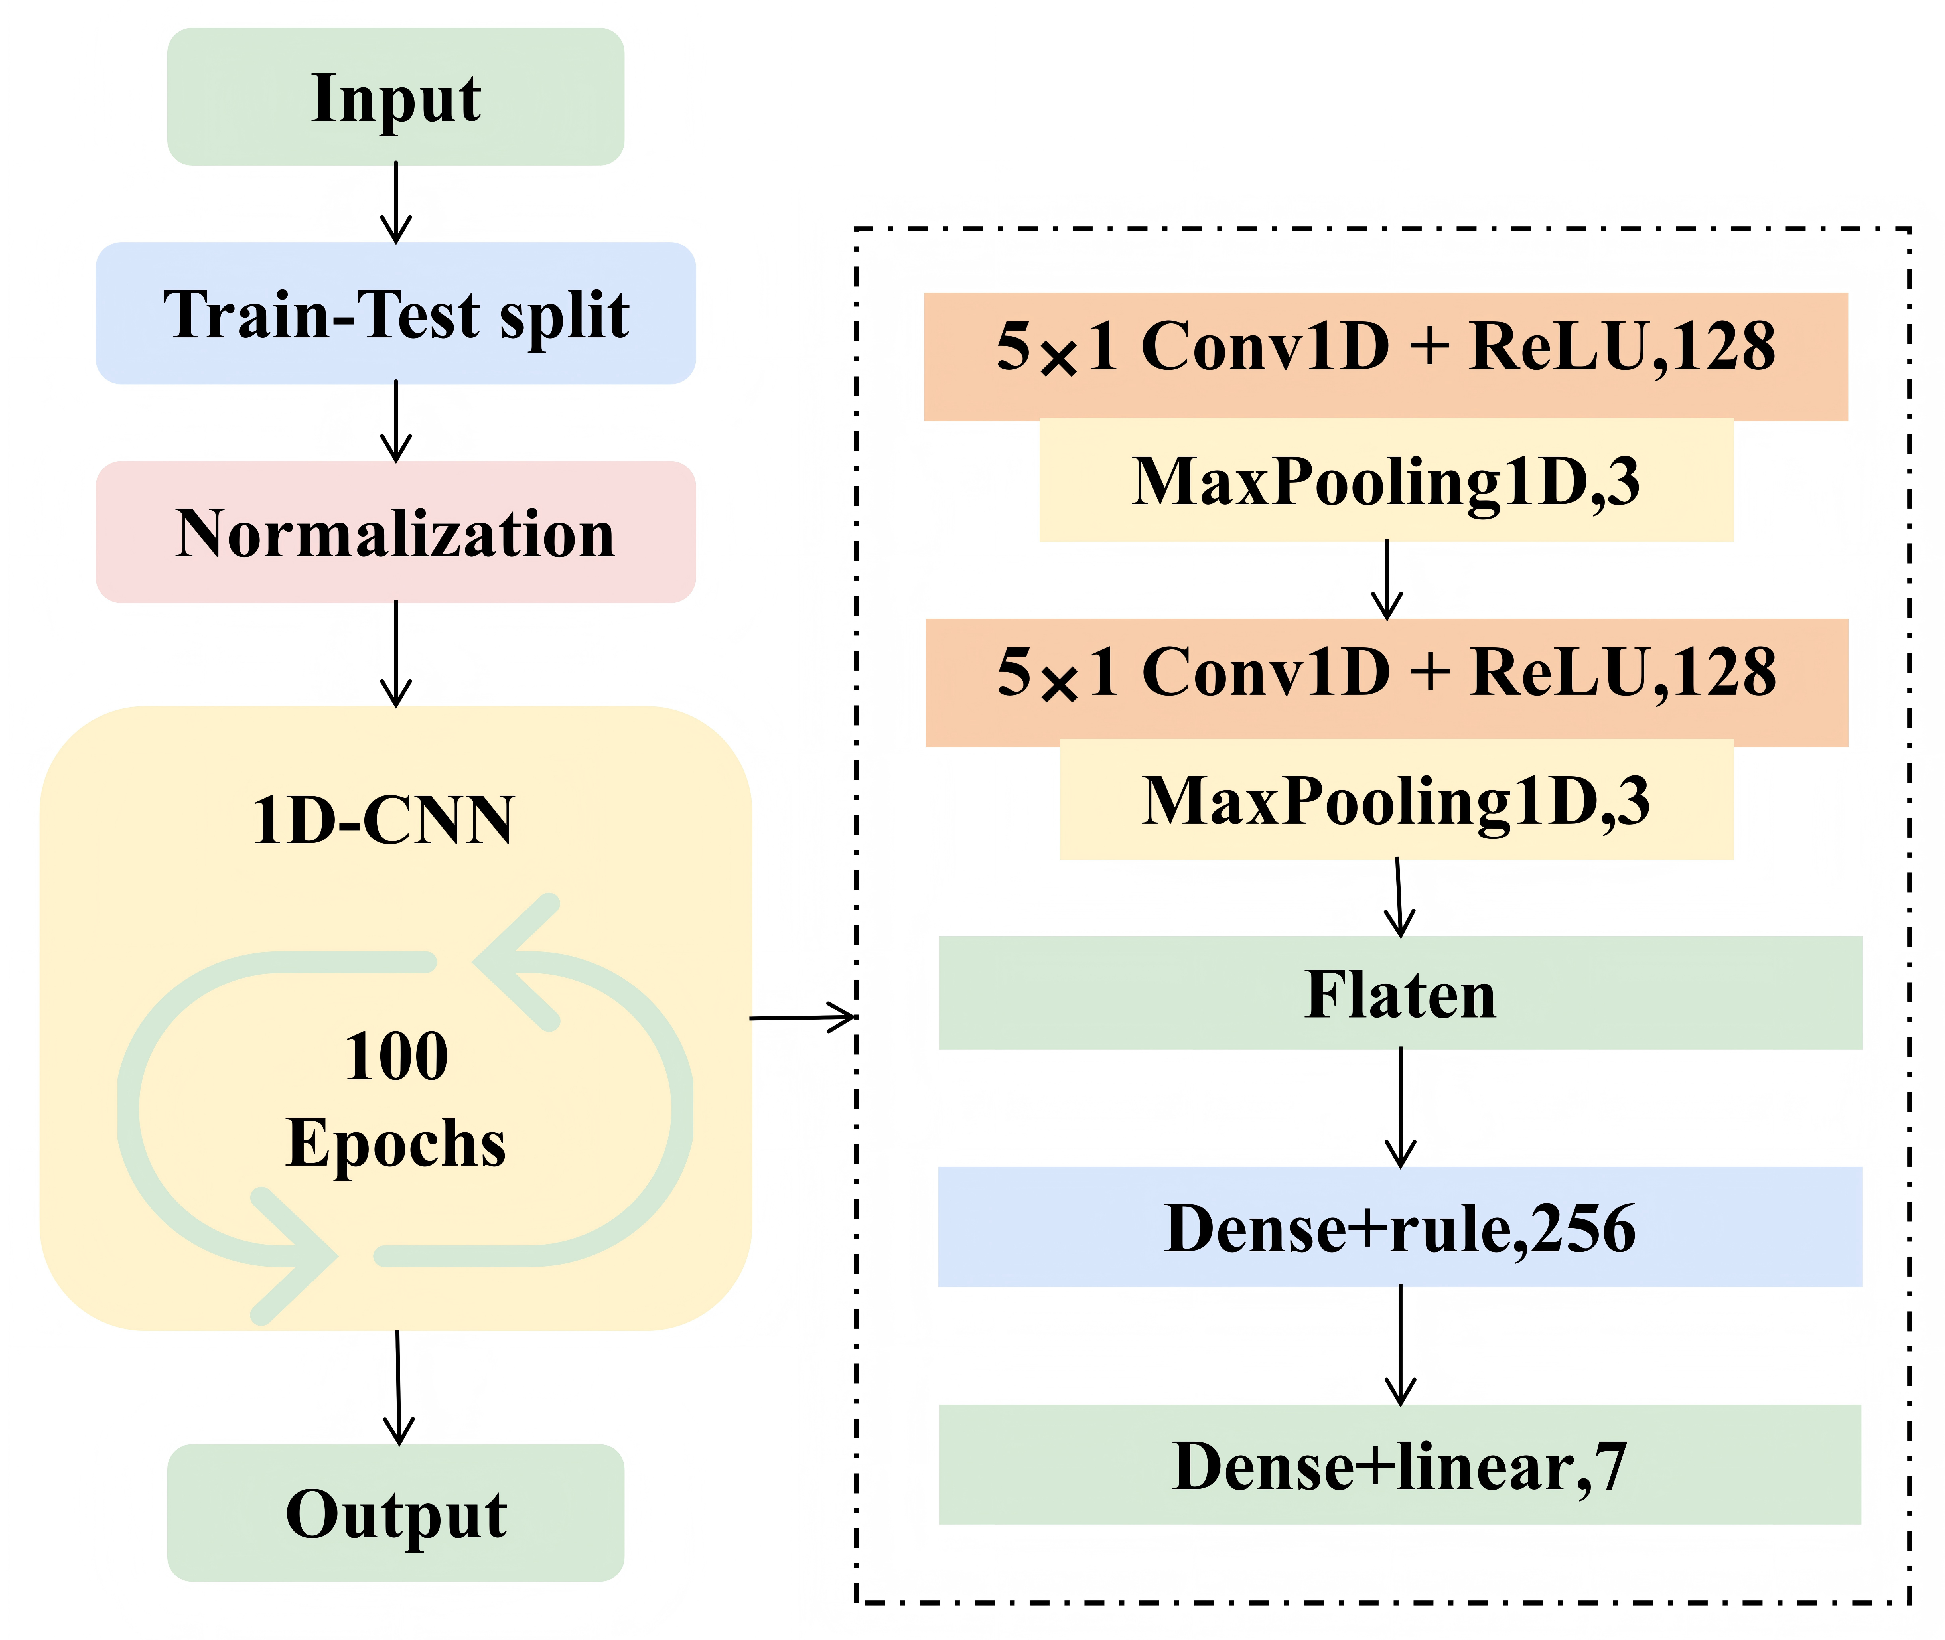
CNNs are deep feedforward neural networks characterized by local connectivity and weight-sharing mechanisms, enabling efficient extraction of local features and the construction of hierarchical representations from input data [28]. In this study, a one-dimensional convolutional neural network (1D-CNN) was employed for spectral analysis. As illustrated in Figure 3, the network architecture begins with two sequential blocks, each comprising a Conv1D layer (128 filters, kernel size of 5, ‘same’ padding) followed by a MaxPooling1D layer (pool size of 3). The extracted features are then flattened and passed through a dense layer with 256 units and ReLU activation, culminating in a final output layer with 4 units and linear activation for activity prediction. The model was trained using the Adam optimizer with a learning rate of 1 × 10 3 and a batch size of 64, minimizing the root mean square error (RMSE) loss over 100 epochs. Compared with conventional two-dimensional CNNs, 1D-CNNs are particularly well suited for high-dimensional and continuous spectral data, as they can accurately capture local peak shapes, spectral variations, and fine structural details. Their end-to-end modeling capability integrates feature extraction with regression prediction, thereby enhancing their responsiveness to complex nuclide data and improving overall modeling efficiency.

2.3.4. CNN–Meta

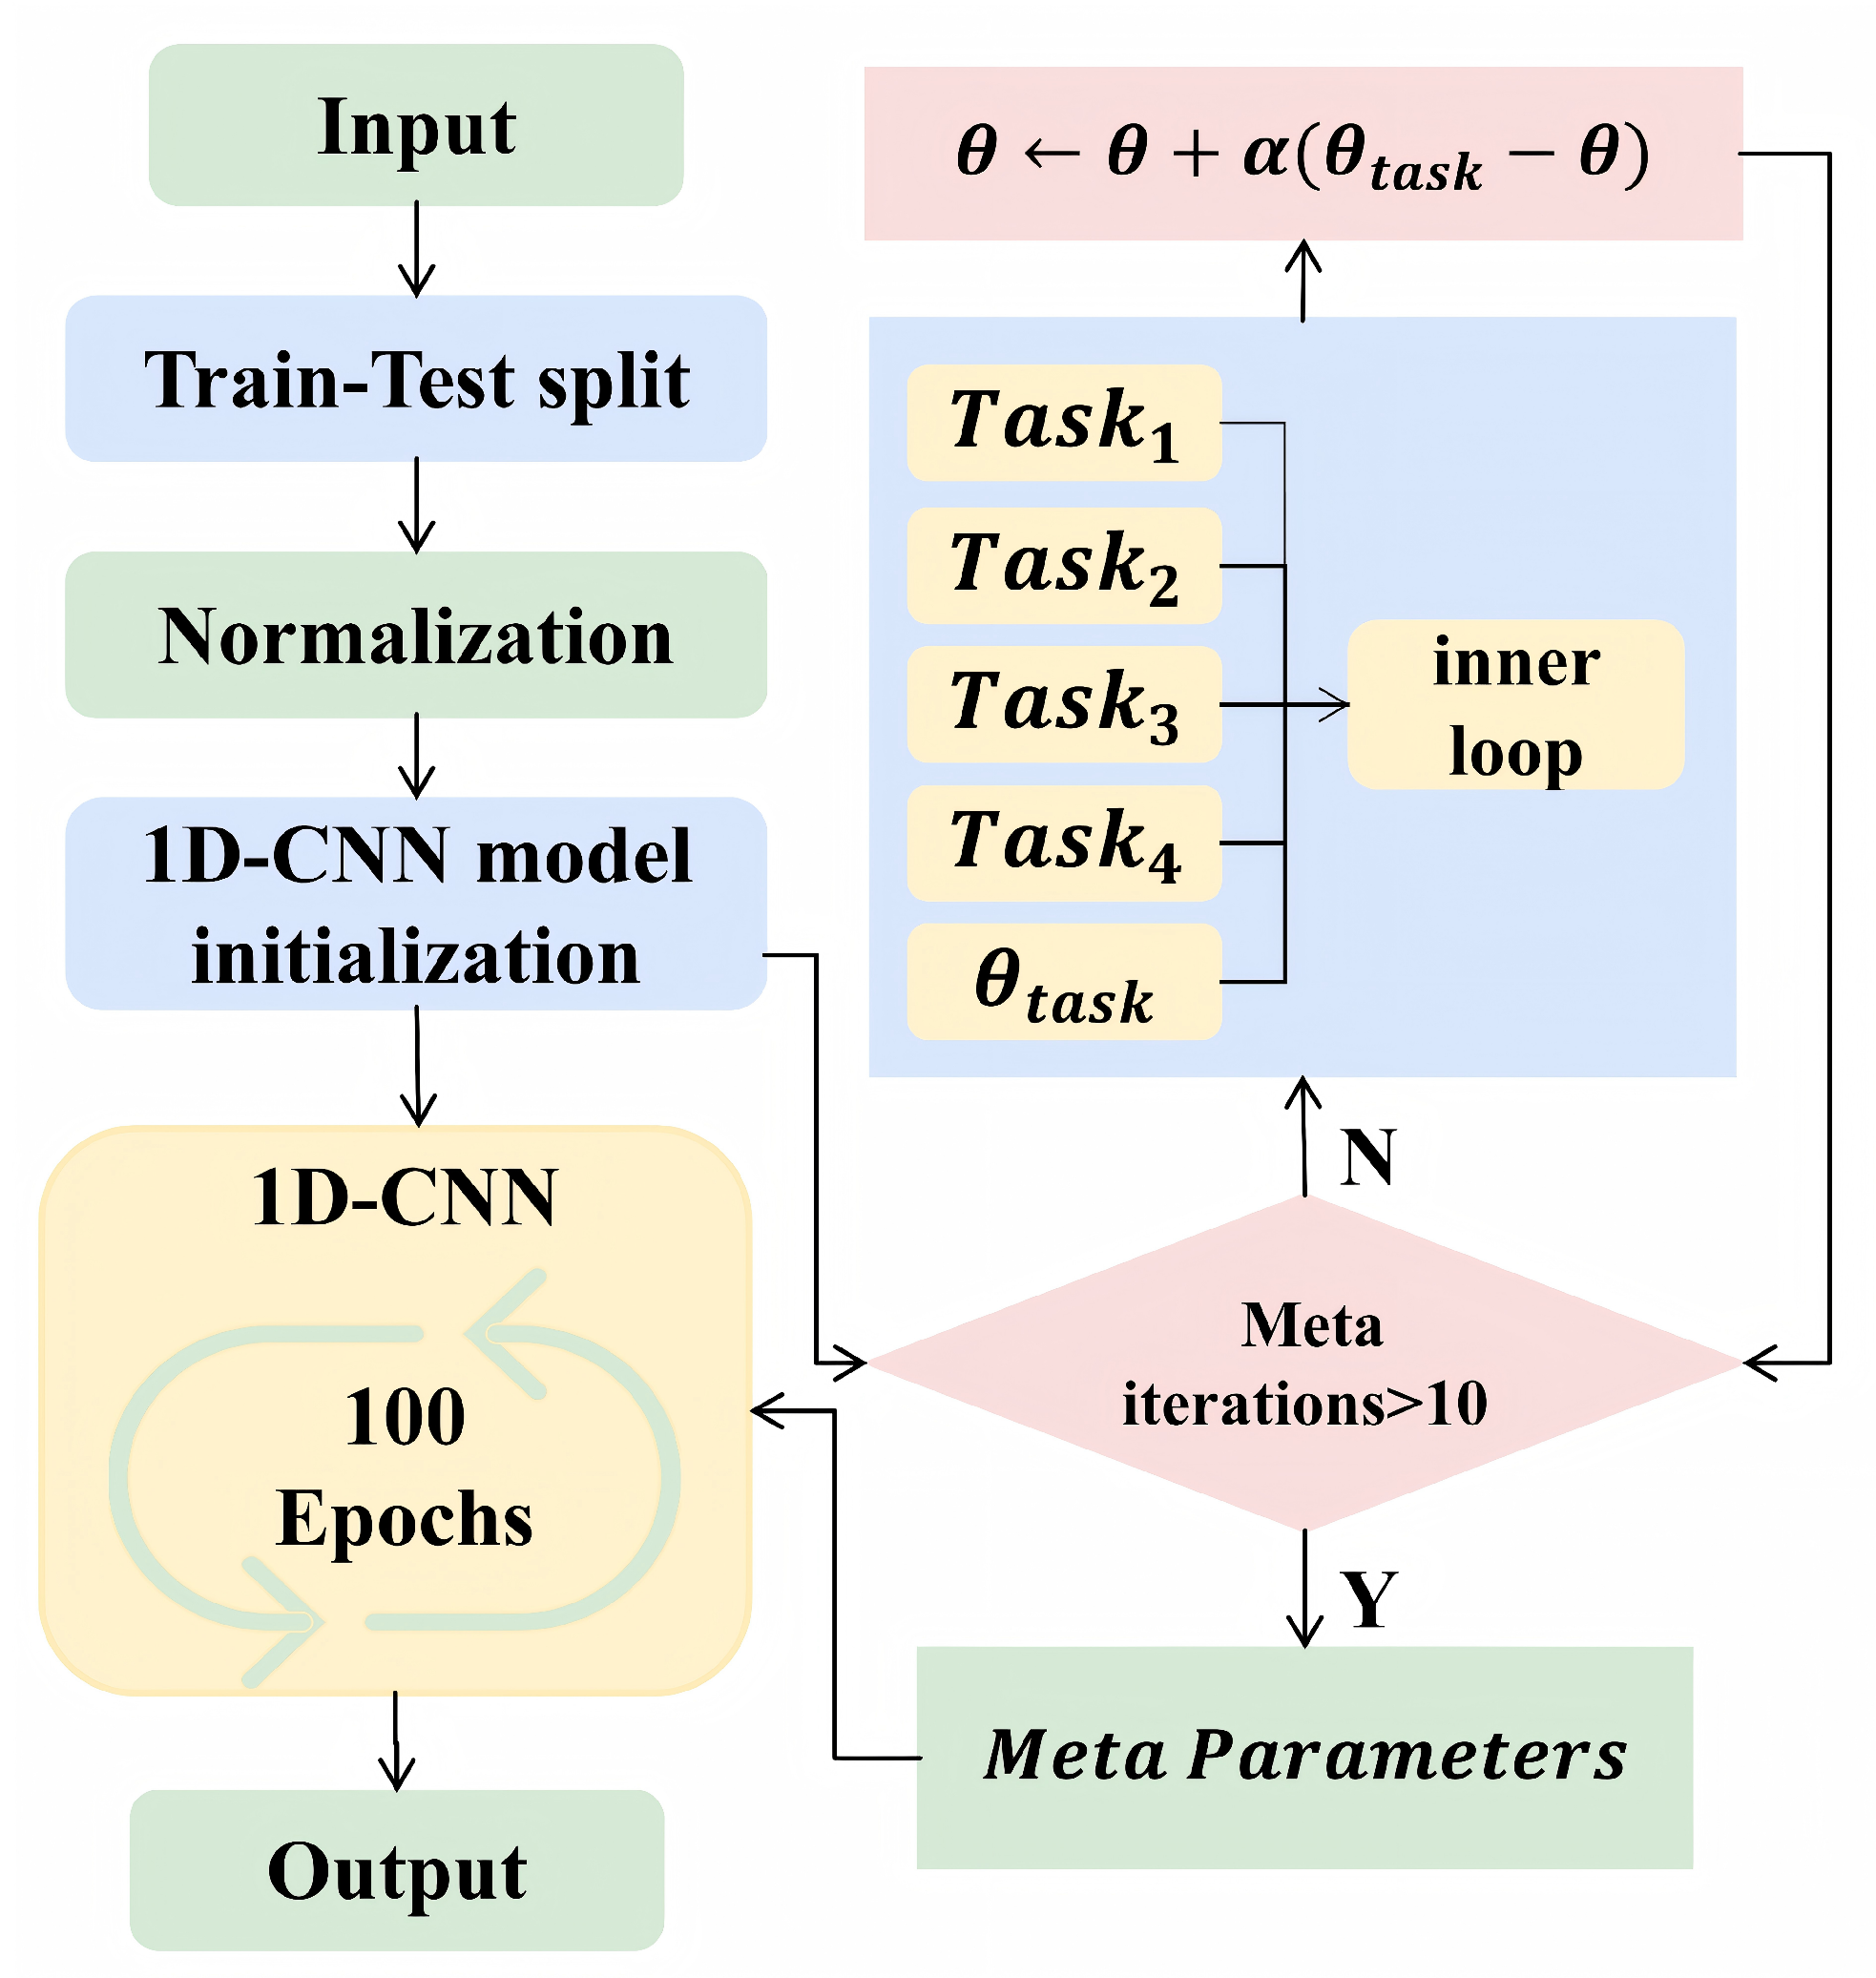
The CNN–Meta model is an integrated framework that combines a CNN with the Reptile algorithm, which is designed to enhance the model’s generalization capability under small-sample conditions [29,30,31]. Utilizing a CNN as its foundational architecture, the model performs internal gradient updates across multiple nuclide classification sub-tasks during the meta-training phase. This process enables the acquisition of transferable feature representations. The updated parameters from each task are aggregated via a weighted average to adjust the meta-parameters, thereby guiding the model to converge to an initialization point endowed with superior cross-task generalization capability. During the meta-testing phase, accurate identification can be achieved with only minimal fine-tuning. This model exhibits strong adaptive capability and efficient cross-task modeling performance in complex and variable identification tasks. Its network structure is illustrated in Figure 4. Specifically, the Reptile meta-learning algorithm was configured with 10 meta-iterations. In each iteration, 5 tasks were constructed from the dataset, and for each task, the model underwent 5 inner gradient steps using the Adam optimizer to minimize the RMSE. The updated parameters from each task were aggregated via a weighted average, with an outer step size of 0.01, to adjust the meta-parameters, thereby guiding the model to converge to an initialization point endowed with superior cross-task generalization capability.

2.4. Evaluation Metrics

To evaluate and compare the performance of different models, this study employed the coefficient of determination (R2), RMSE, and mean relative error (MRE) as the primary quantitative metrics. These indicators respectively reflect model accuracy, goodness of fit, and relative prediction error, and are well suited for regression-based recognition tasks. A lower RMSE, an R2 value closer to 1, and a smaller MRE all indicate higher predictive accuracy of the model. The calculation formulas for the three evaluation metrics are as follows:
RMSE = 1 n i = 1 n ( y i y ^ i ) 2 ,
R 2 = 1 i = 1 n ( y i y ^ i ) 2 i = 1 n ( y i y ¯ ) 2 ,
MRE = 1 n i = 1 n y i y ^ i y i ,
where y i and y ^ i denote the true and predicted activity values of the nuclides, respectively, y ¯ represents the mean of the true value, and n denotes the number of predictions.

2.5. Software

The computational models were developed in a Python 3.10.8 environment leveraging key libraries, including TensorFlow 2.19.0 for constructing and training deep neural networks and Scikit-learn 1.3.2 for implementing classical machine learning regressors and model evaluation. All computations were performed on a high-performance computing node equipped with one NVIDIA GeForce RTX 4090D GPU (24 GB of VRAM) to accelerate the training of deep learning models and an Intel Xeon Platinum 8474C CPU with 80 GB of system memory.

3. Results and Discussion

3.1. Model Optimization Process and Results

Due to variations in their structures and mechanisms, different machine learning models require the optimization of distinct hyperparameters. These parameters, defined by the respective mathematical formulations of the models, must be determined prior to training and critically influence predictive performance. To achieve optimal modeling, this study first determined the most suitable normalization method for each model and subsequently optimized its respective hyperparameters.

3.1.1. Optimization of the PLSR Model

For the PLSR model, the number of principal components (n_components) was the key hyperparameter optimized to enhance its dimensionality-reduction capability, noise suppression, and generalization performance on high-dimensional spectral data. By systematically comparing performance on the training and test sets with different numbers of components, the bias–variance trade-off was assessed to guide model selection.
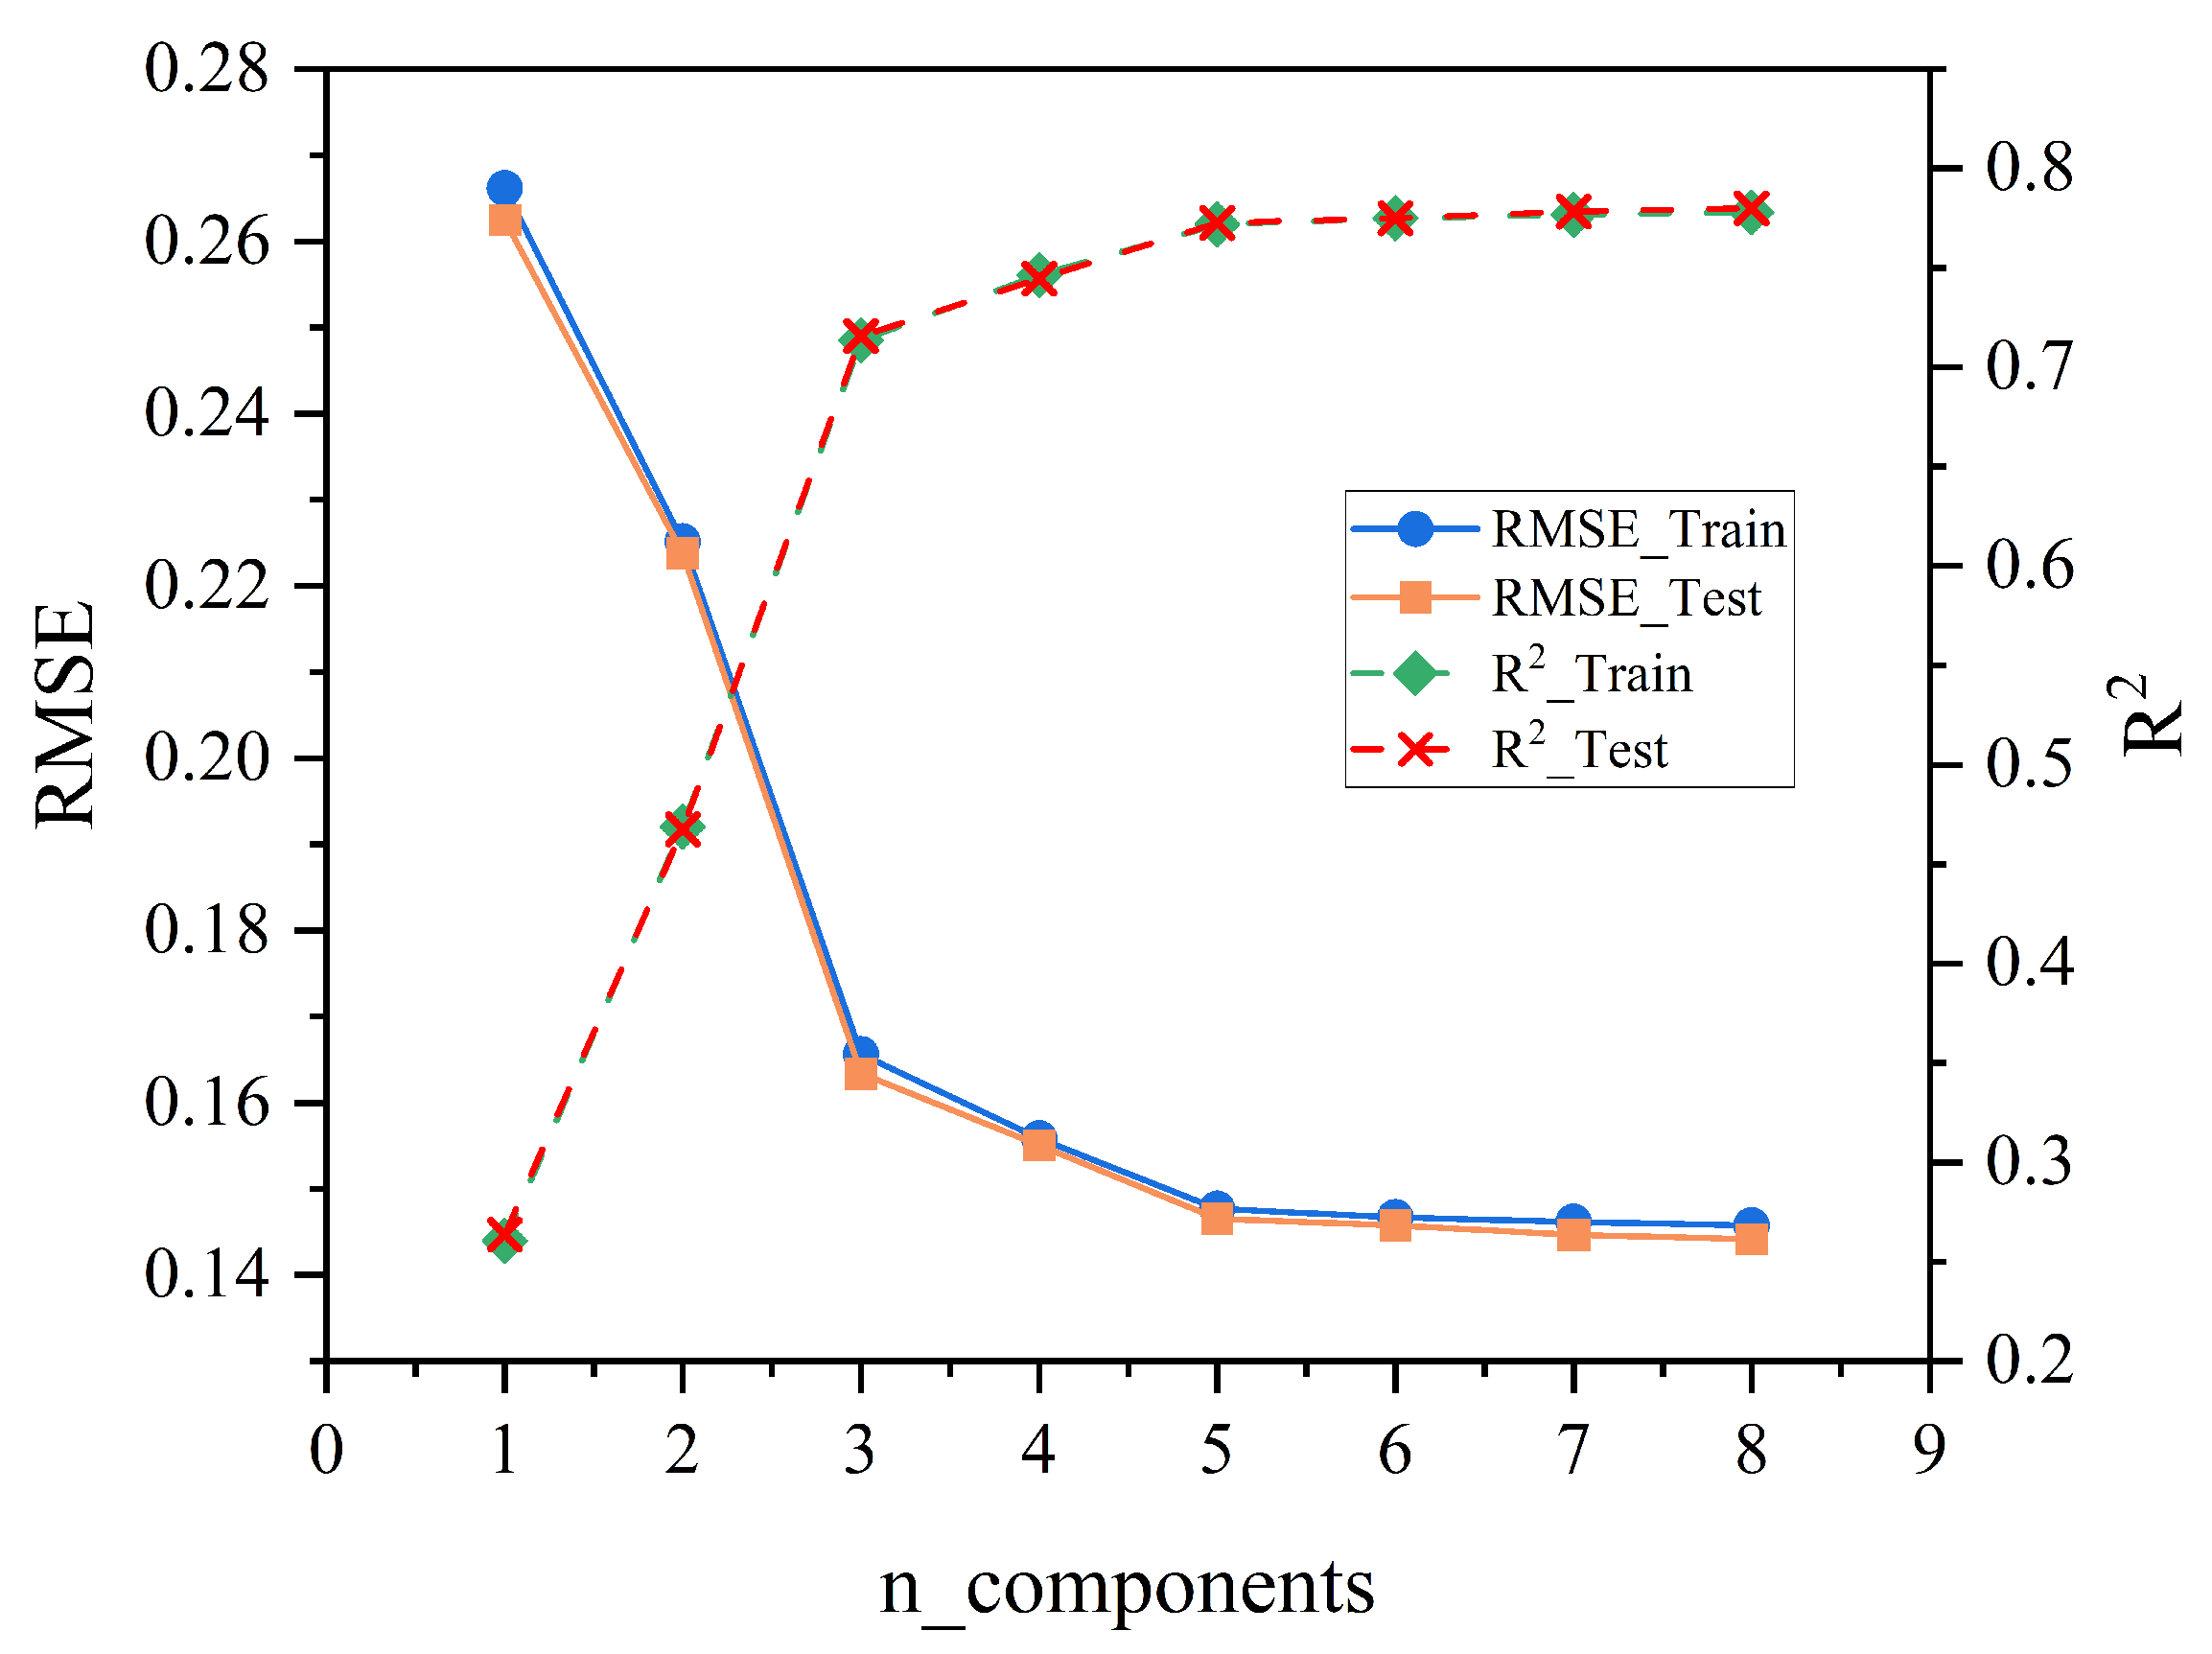
As shown in Figure 5, with increasing n_components, the RMSE of both the training and test sets decreased significantly, while the R2 values increased correspondingly and gradually stabilized at higher component numbers. The most significant improvement in model performance was observed when the number of components increased from 1 to 3, after which the model became stable when n_components ≥ 5. Notably, the curves of the training and test sets closely aligned, with only minor differences between them. No divergence was observed in which the training error continued to decrease while the testing error increased, indicating that under the current feature set and sample size, the model did not exhibit obvious overfitting and maintained reliable generalization performance.
PLSR models the relationship between variables by extracting their joint covariance structure. The first three latent variables captured most of the information relevant to the response variable, leading to a rapid error reduction. Model performance reached a plateau when n_components ≥ 5, indicating that additional components contributed minimally to predictive capability. The final model with n_components = 6 achieved an RMSE of 0.1467 and an R2 of 0.775 on the test set, with highly consistent performance metrics between the training and test sets. In this study, PLSR demonstrated that only a small number of latent variables were sufficient to capture the primary associative structure between the energy spectrum and the target properties. Further increasing the number of principal components offered limited accuracy improvement and risked introducing noise, which could impair the model’s generalization capability. Therefore, selecting a moderate number of components helps balance information extraction with noise suppression, thereby enhancing the model’s interpretability and practical utility.

3.1.2. Optimization of the RF Model

The relationship between the hyperparameters of the RF model and its performance is typically nonlinear. Bayesian optimization, as a probabilistic model-based optimization method, can effectively capture this nonlinearity and identify hyperparameter combinations that minimize the target-function RMSE with relatively few evaluations, thereby improving optimization efficiency. By efficiently exploring the hyperparameter space, Bayesian optimization reduces computational cost and can address nonlinear relationships and global optimization problems, making it an ideal choice for tuning the hyperparameters of the RF model.
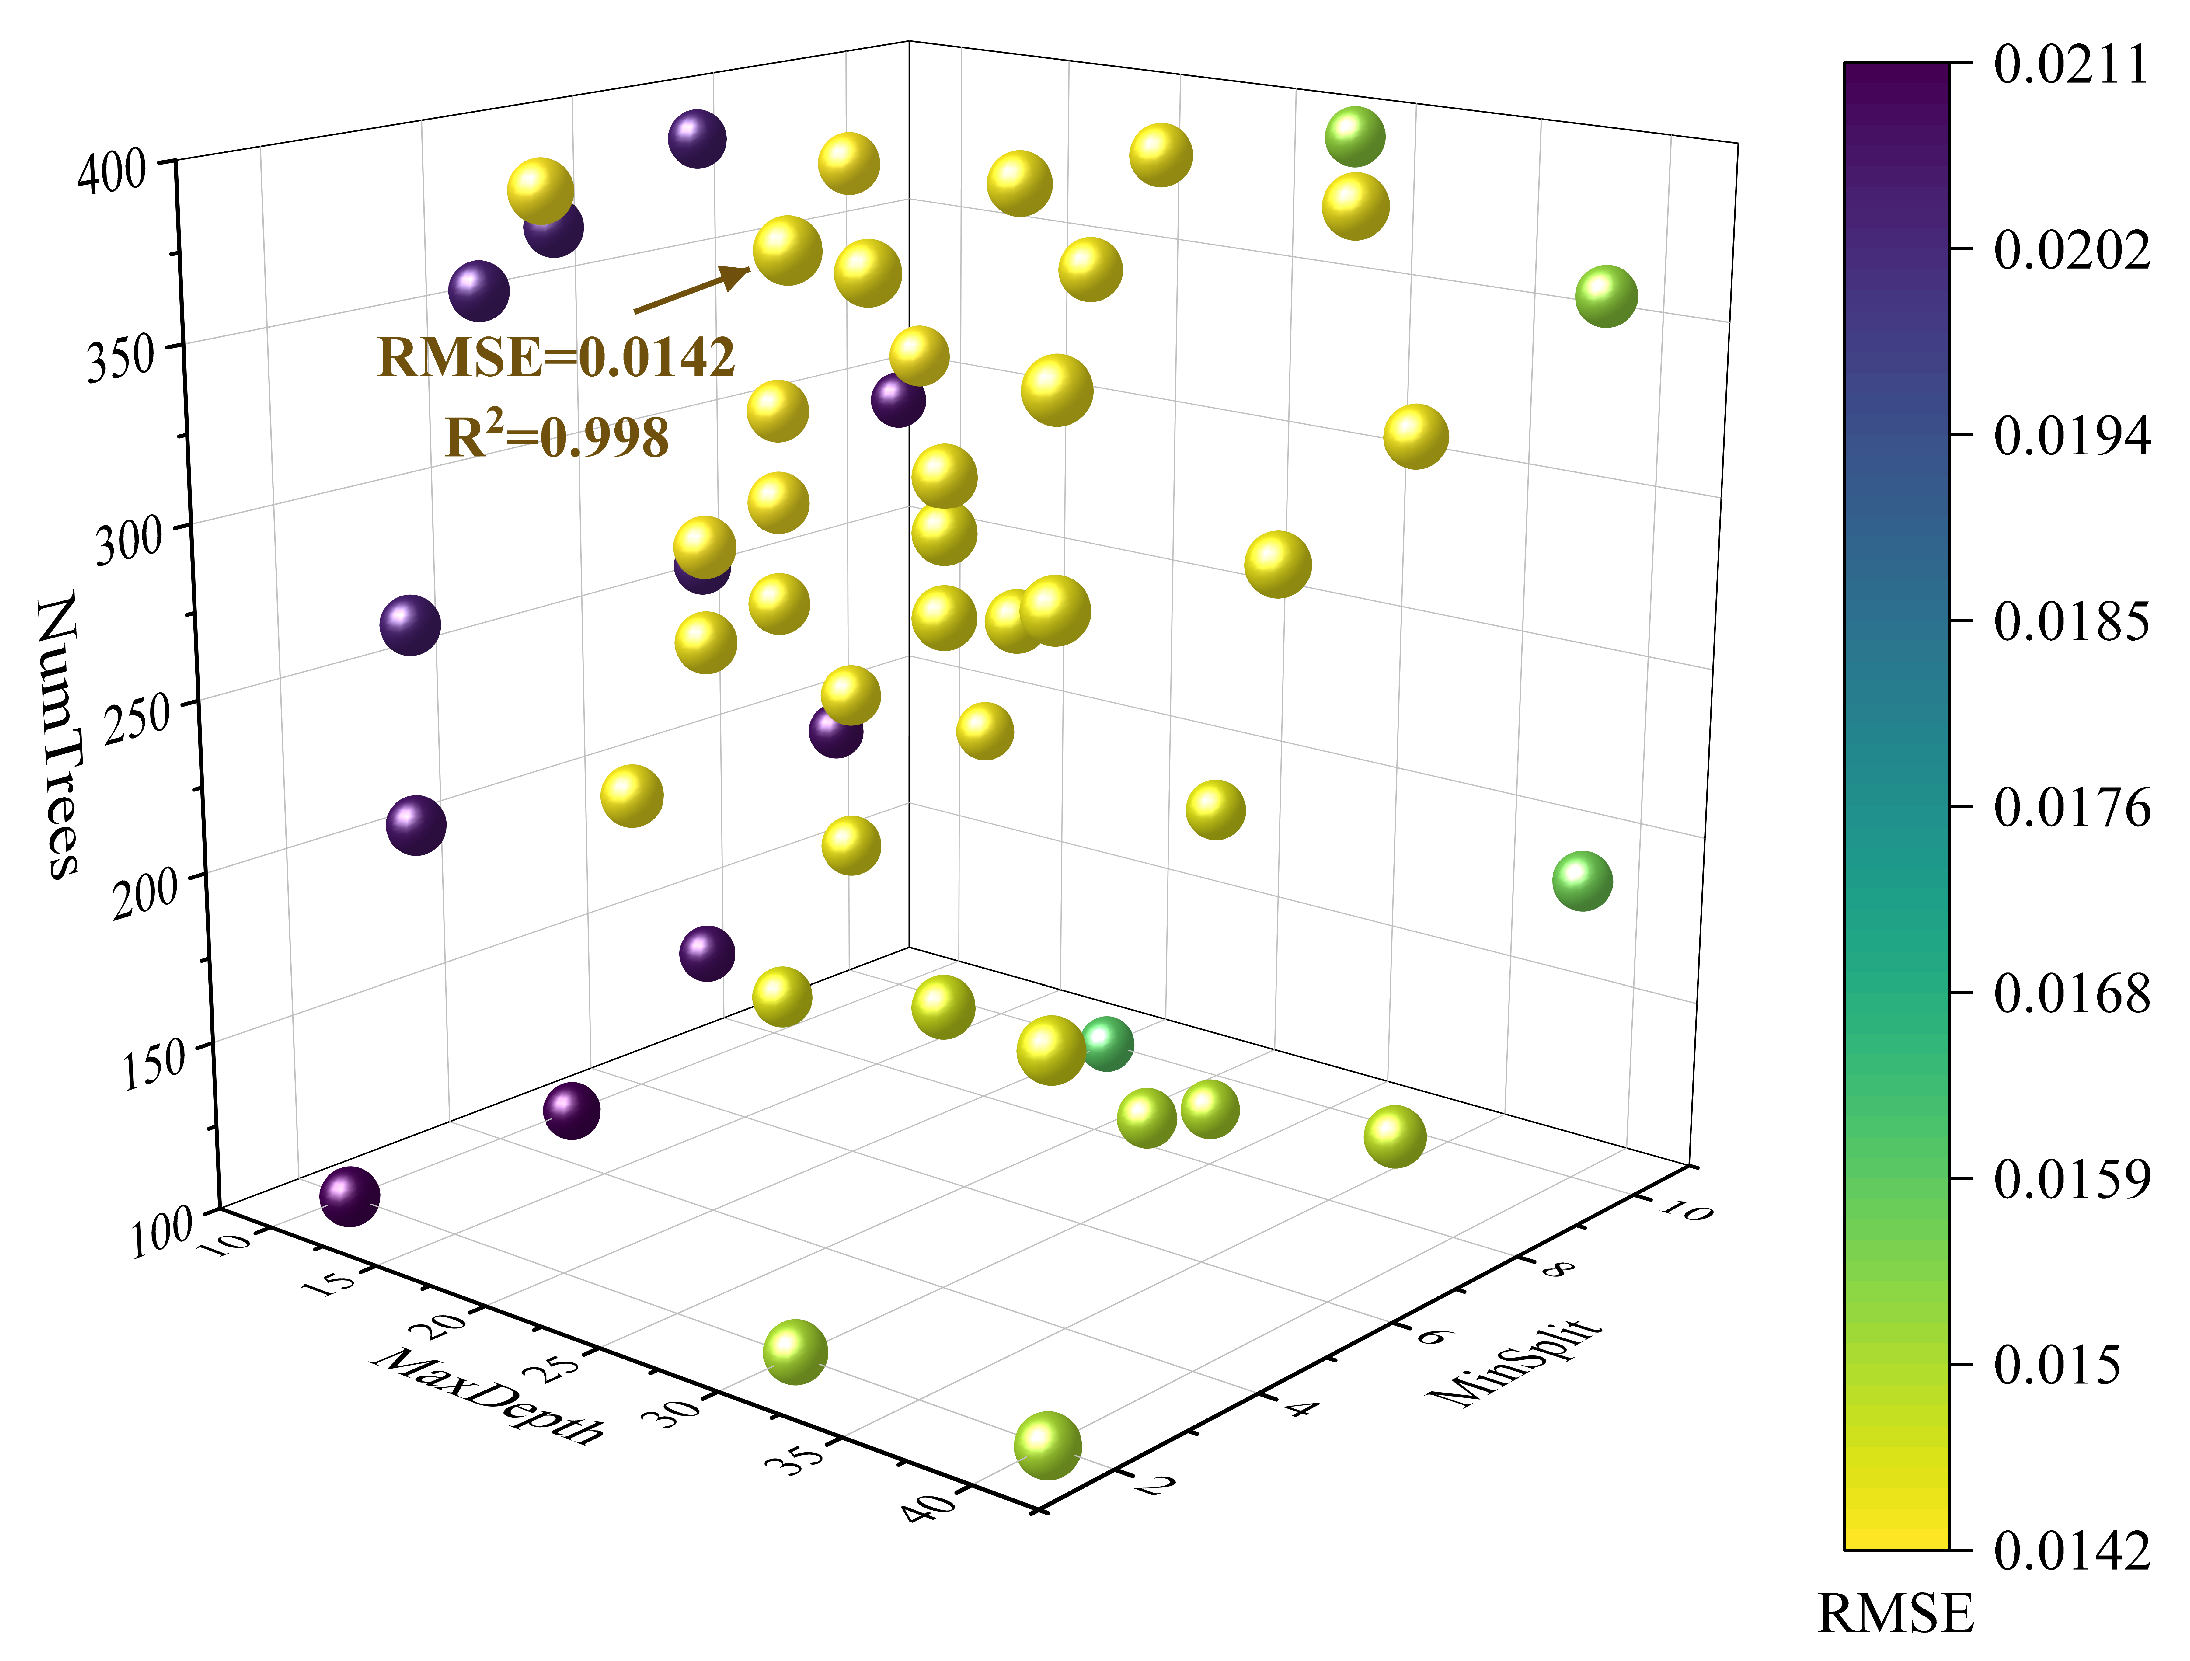
In this study, Bayesian optimization was employed to optimize the key hyperparameters of the RF model. Three hyperparameters with substantial influence on model performance were selected: the maximum depth of trees (MaxDepth), the minimum number of samples required for node splitting (MinSamplesSplit), and the number of trees (NumTrees). The maximum number of optimization iterations was set to 50. Table 2 summarizes the search ranges of these hyperparameters as well as the optimal parameter combination obtained.
As shown in Figure 6, different hyperparameter combinations had a significant impact on the training-set RMSE of the RF model. Increasing NumTrees led to a significant reduction in RMSE, with the most pronounced improvement observed in the range of 100 to 300 trees. Beyond 320 trees, performance gains became saturated. Increasing MaxDepth also contributed to error reduction, with substantial improvements when MaxDepth exceeded 20, although the benefits diminished once the depth was greater than 30. A smaller MinSamplesSplit resulted in stronger fitting capability and lower errors, whereas excessively large values of MinSamplesSplit caused a notable increase in RMSE.
The optimal performance region was concentrated within the range of NumTrees between 320 and 400, MaxDepth between 20 and 36, and MinSamplesSplit between 2 and 5. Within this region, the training set achieved a minimum RMSE of 0.0142 and an R2 of 0.998, reflecting a favorable balance between predictive performance and model complexity. Under the same hyperparameter settings, the independent testing set also achieved optimal results, achieving an RMSE of 0.024 and an R2 of 0.994, with performance trends largely consistent with the training set. These results confirm the robustness of the selected hyperparameters, enabling the model to capture underlying data patterns effectively without significant overfitting, thereby maintaining strong generalization performance alongside low training error.

3.1.3. Optimization of the CNN Model

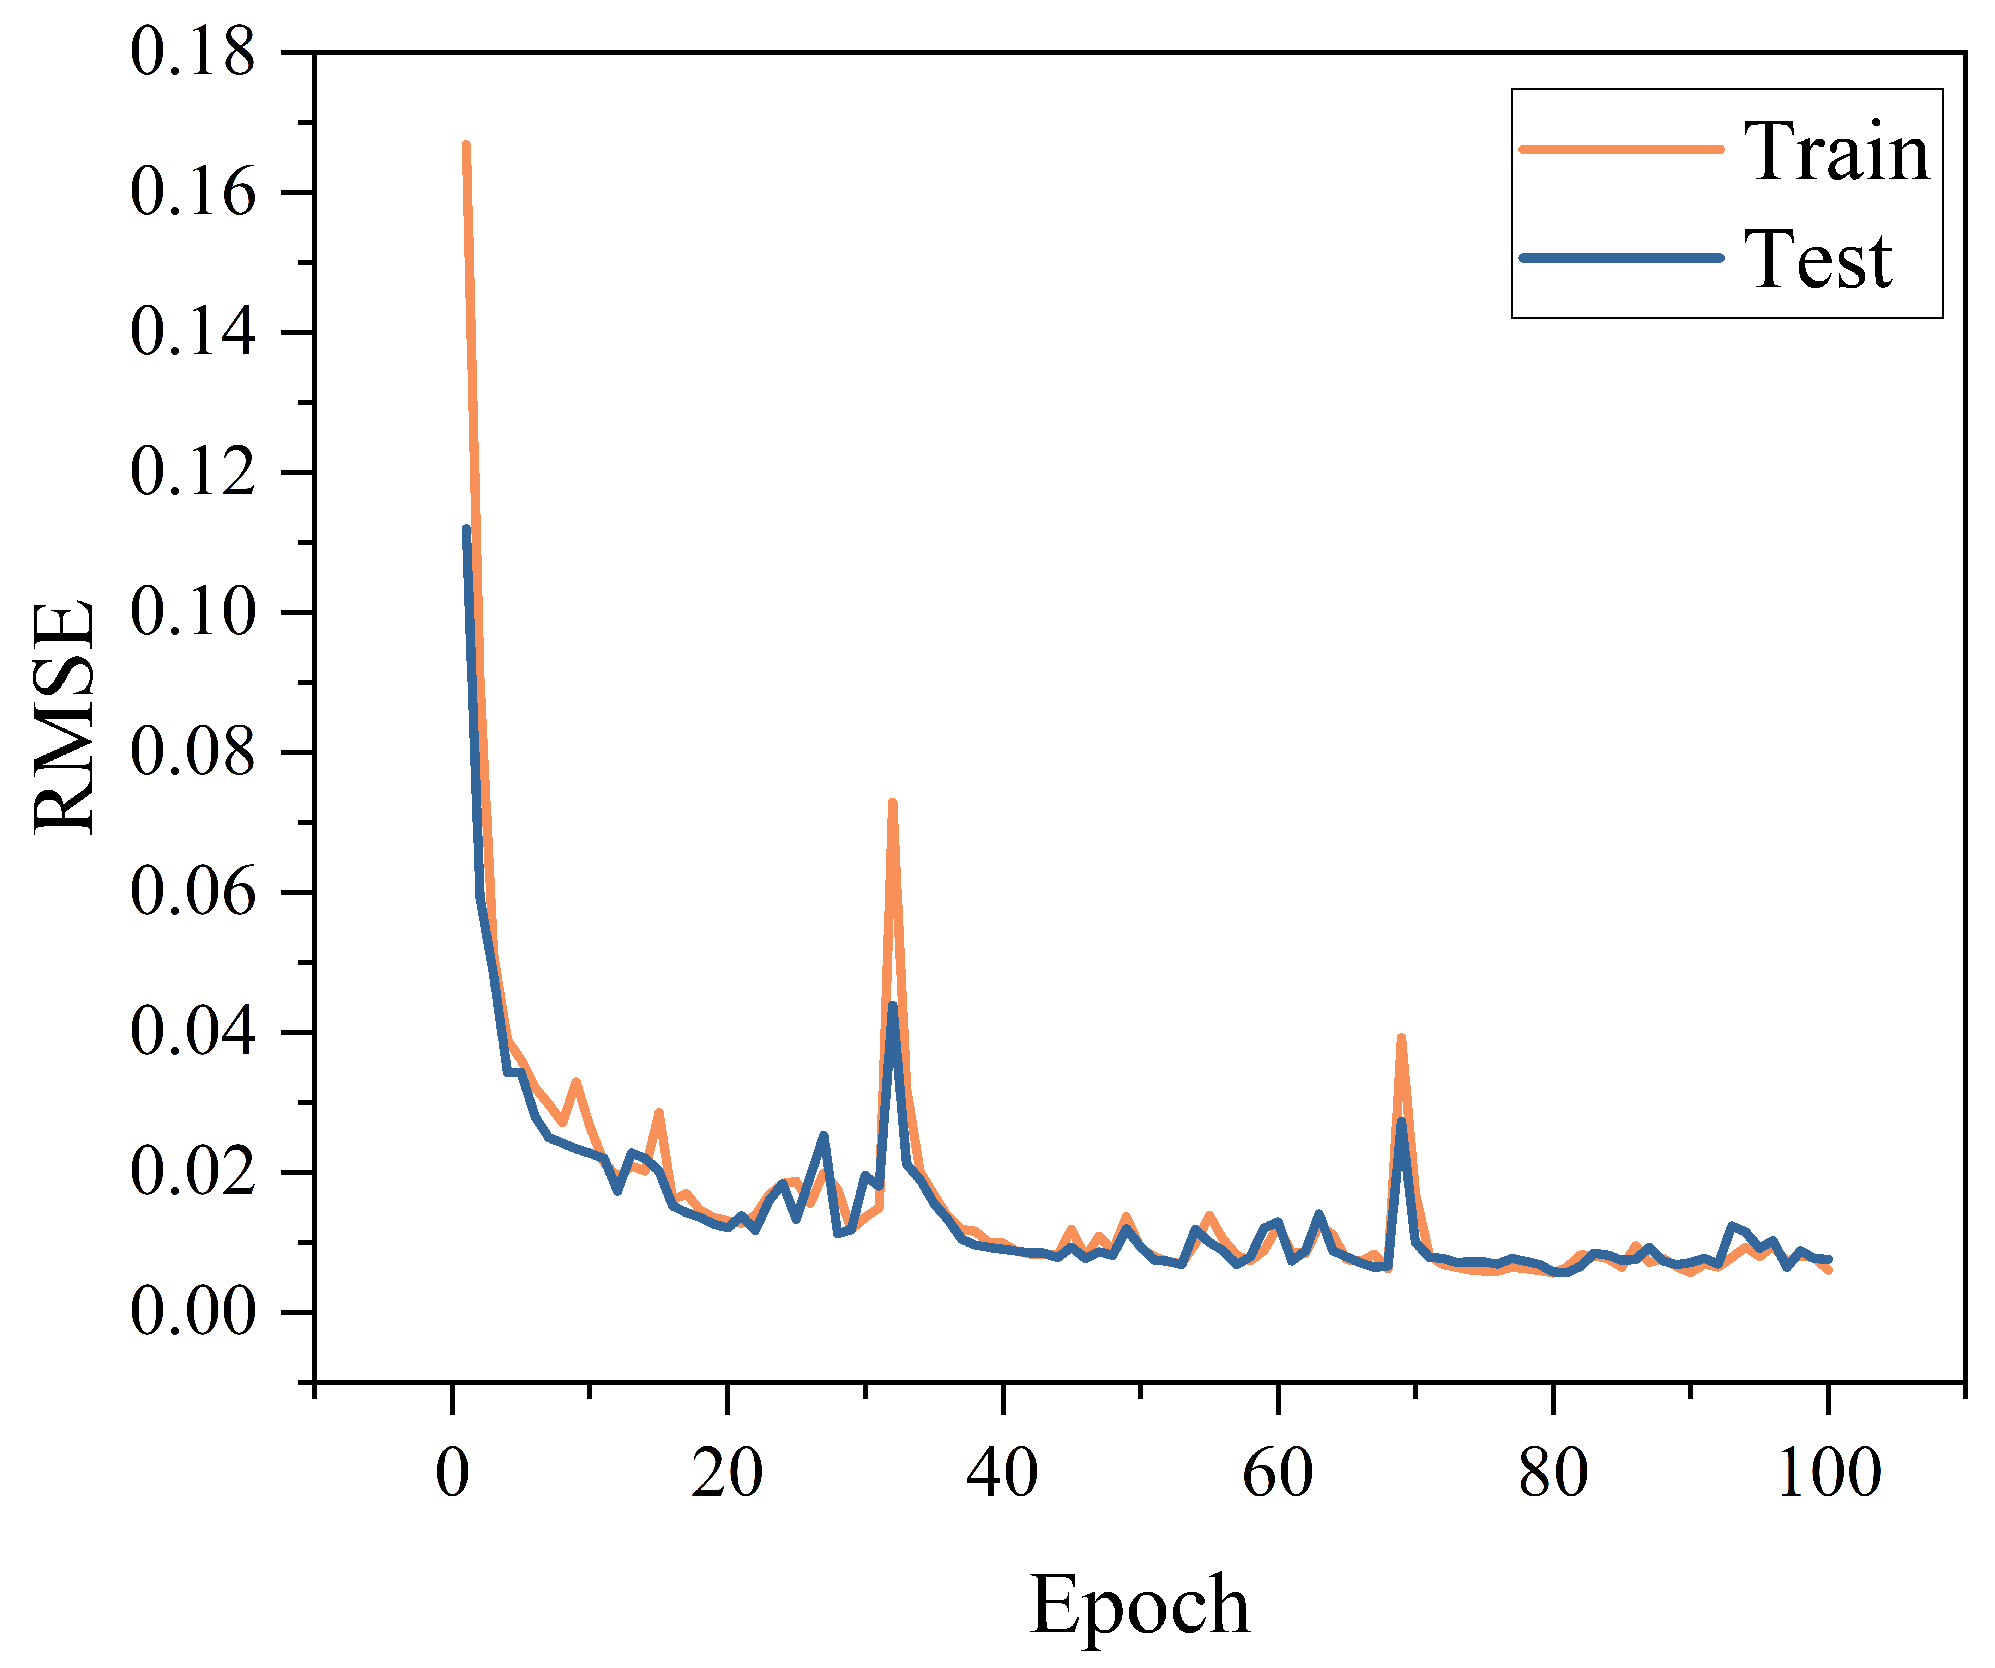
In the CNN model, the number of training epochs is one of the key hyperparameters affecting model accuracy and generalization capability. An appropriate number of epochs ensures that the model captures the essential features of the data while avoiding both overfitting and underfitting. This balance between model complexity and predictive performance enhances the overall accuracy and robustness of the model.
As shown in Figure 7, the overall error of the CNN model decreased rapidly as the number of epochs increased before the error gradually converged. At the optimal epoch, both training and test errors were reduced by more than 94%. Moreover, the variations in training and test errors were highly correlated throughout the training process, with a Pearson correlation coefficient of 0.979, indicating that improvements in model performance were consistently accompanied by enhanced generalization capability. At 81 epochs, the model achieved its lowest testing RMSE of 0.0566 and an R2 value of 0.999. The training and test errors remained close, with no clear signs of overfitting. Minor performance fluctuations observed at certain epochs may be attributed to the learning-rate schedule or regularization strategy, yet the overall convergence trend remained stable. In summary, the CNN model demonstrated stable convergence behavior and strong generalization capability.

3.1.4. Optimization of the CNN–Meta Model

In the CNN–Meta model, the Reptile algorithm employs a multi-task learning mechanism to obtain a set of highly generalized initialization weights, referred to as “meta-weights”. The core objective is to enhance the model’s adaptability and generalization performance on new tasks. Among the hyperparameters in Reptile, the number of meta-iterations plays a crucial role, as it directly affects the parameter-update trajectory and generalization capability in cross-task learning. An appropriate number of meta-iterations enables the model to capture shared spectral feature structures across tasks, thereby improving the transferability of the initial weights. This allows the model to achieve higher convergence accuracy and stronger generalization performance during fine-tuning with relatively few iterations.
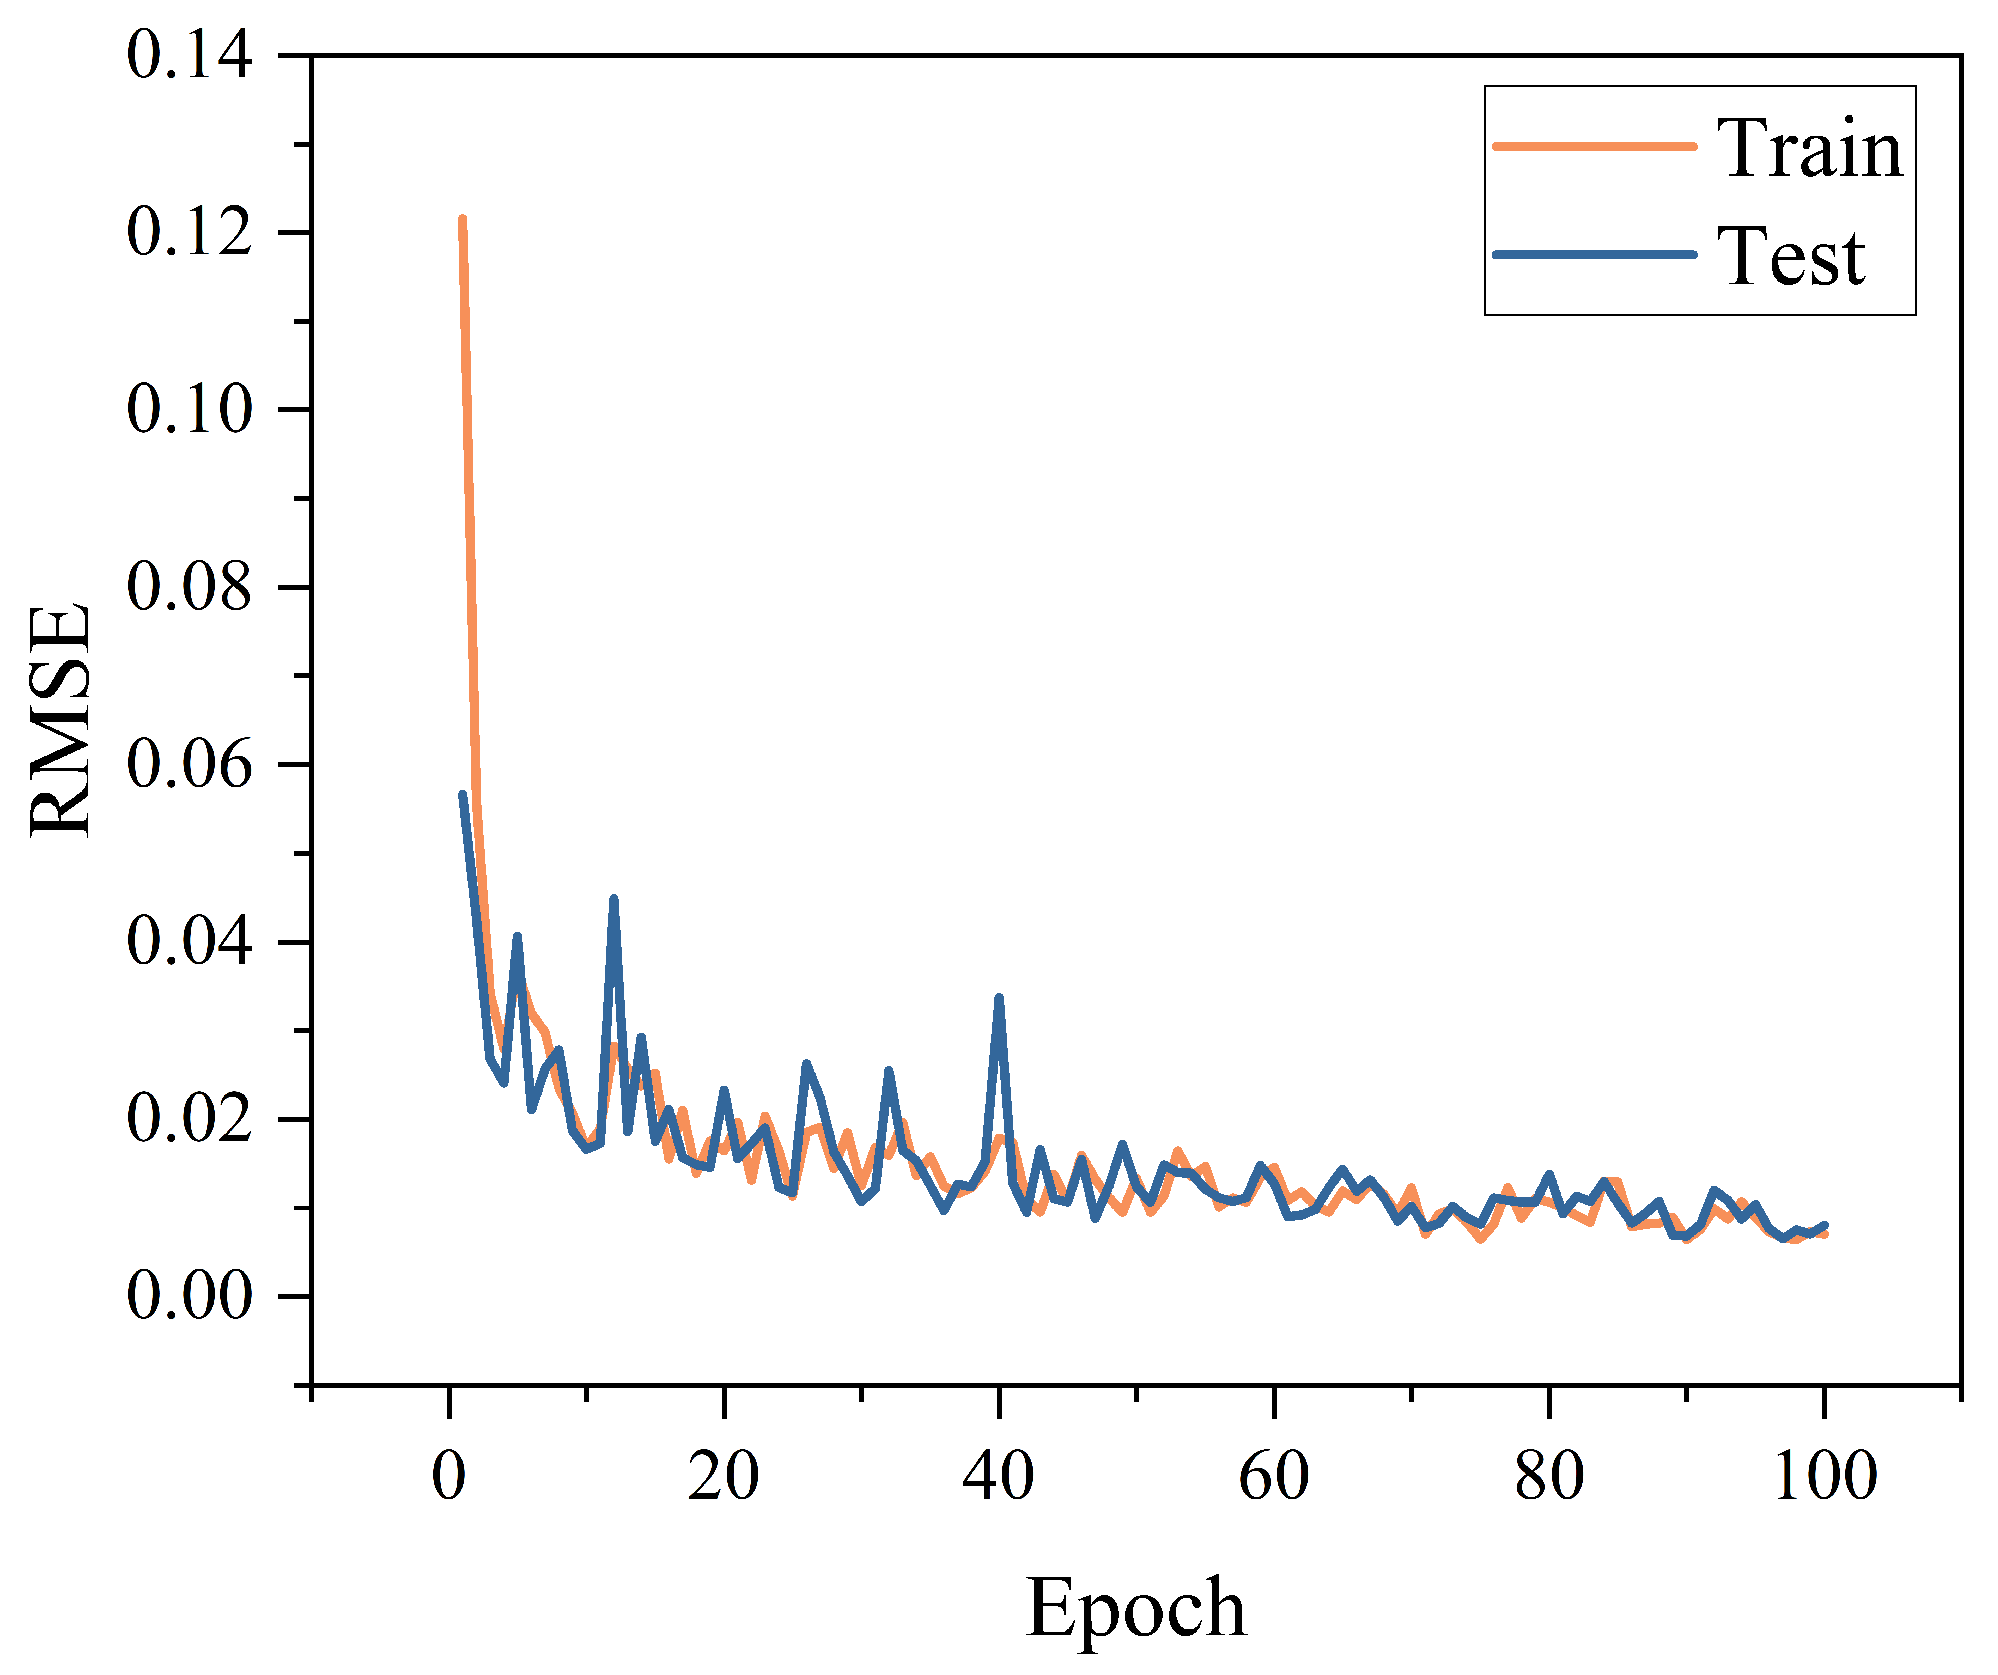
As shown in Figure 8, the CNN model employing the Reptile strategy exhibited a general trend in which the RMSE on the test set decreased rapidly and then gradually converged. Compared with the conventional CNN model, CNN–Meta achieved lower errors and enhanced robustness during the early stages of training. Within the first 20 epochs, CNN–Meta converged more rapidly, and its average RMSE on the test set was significantly lower than that of the conventional CNN, indicating that meta-learning leveraged cross-task knowledge sharing to acquire more generalized initial parameters. In the later epochs, the conventional CNN achieved a slightly lower RMSE than CNN–Meta, which is primarily attributed to its single-task focus that enabled finer adaptation during final-stage fine-tuning. Furthermore, the Reptile strategy significantly enhanced training stability, substantially reducing both the frequency of high-error occurrences and extreme error values in the test-set RMSE. This demonstrates that, by constraining the optimization path, meta-learning mitigates the risk of the model converging to local optima or becoming overly sensitive to limited samples, effectively suppressing performance fluctuations and extreme outliers, thereby exhibiting superior robustness and generalization capability.

3.2. Analysis of Training and Prediction Results for the Four Models

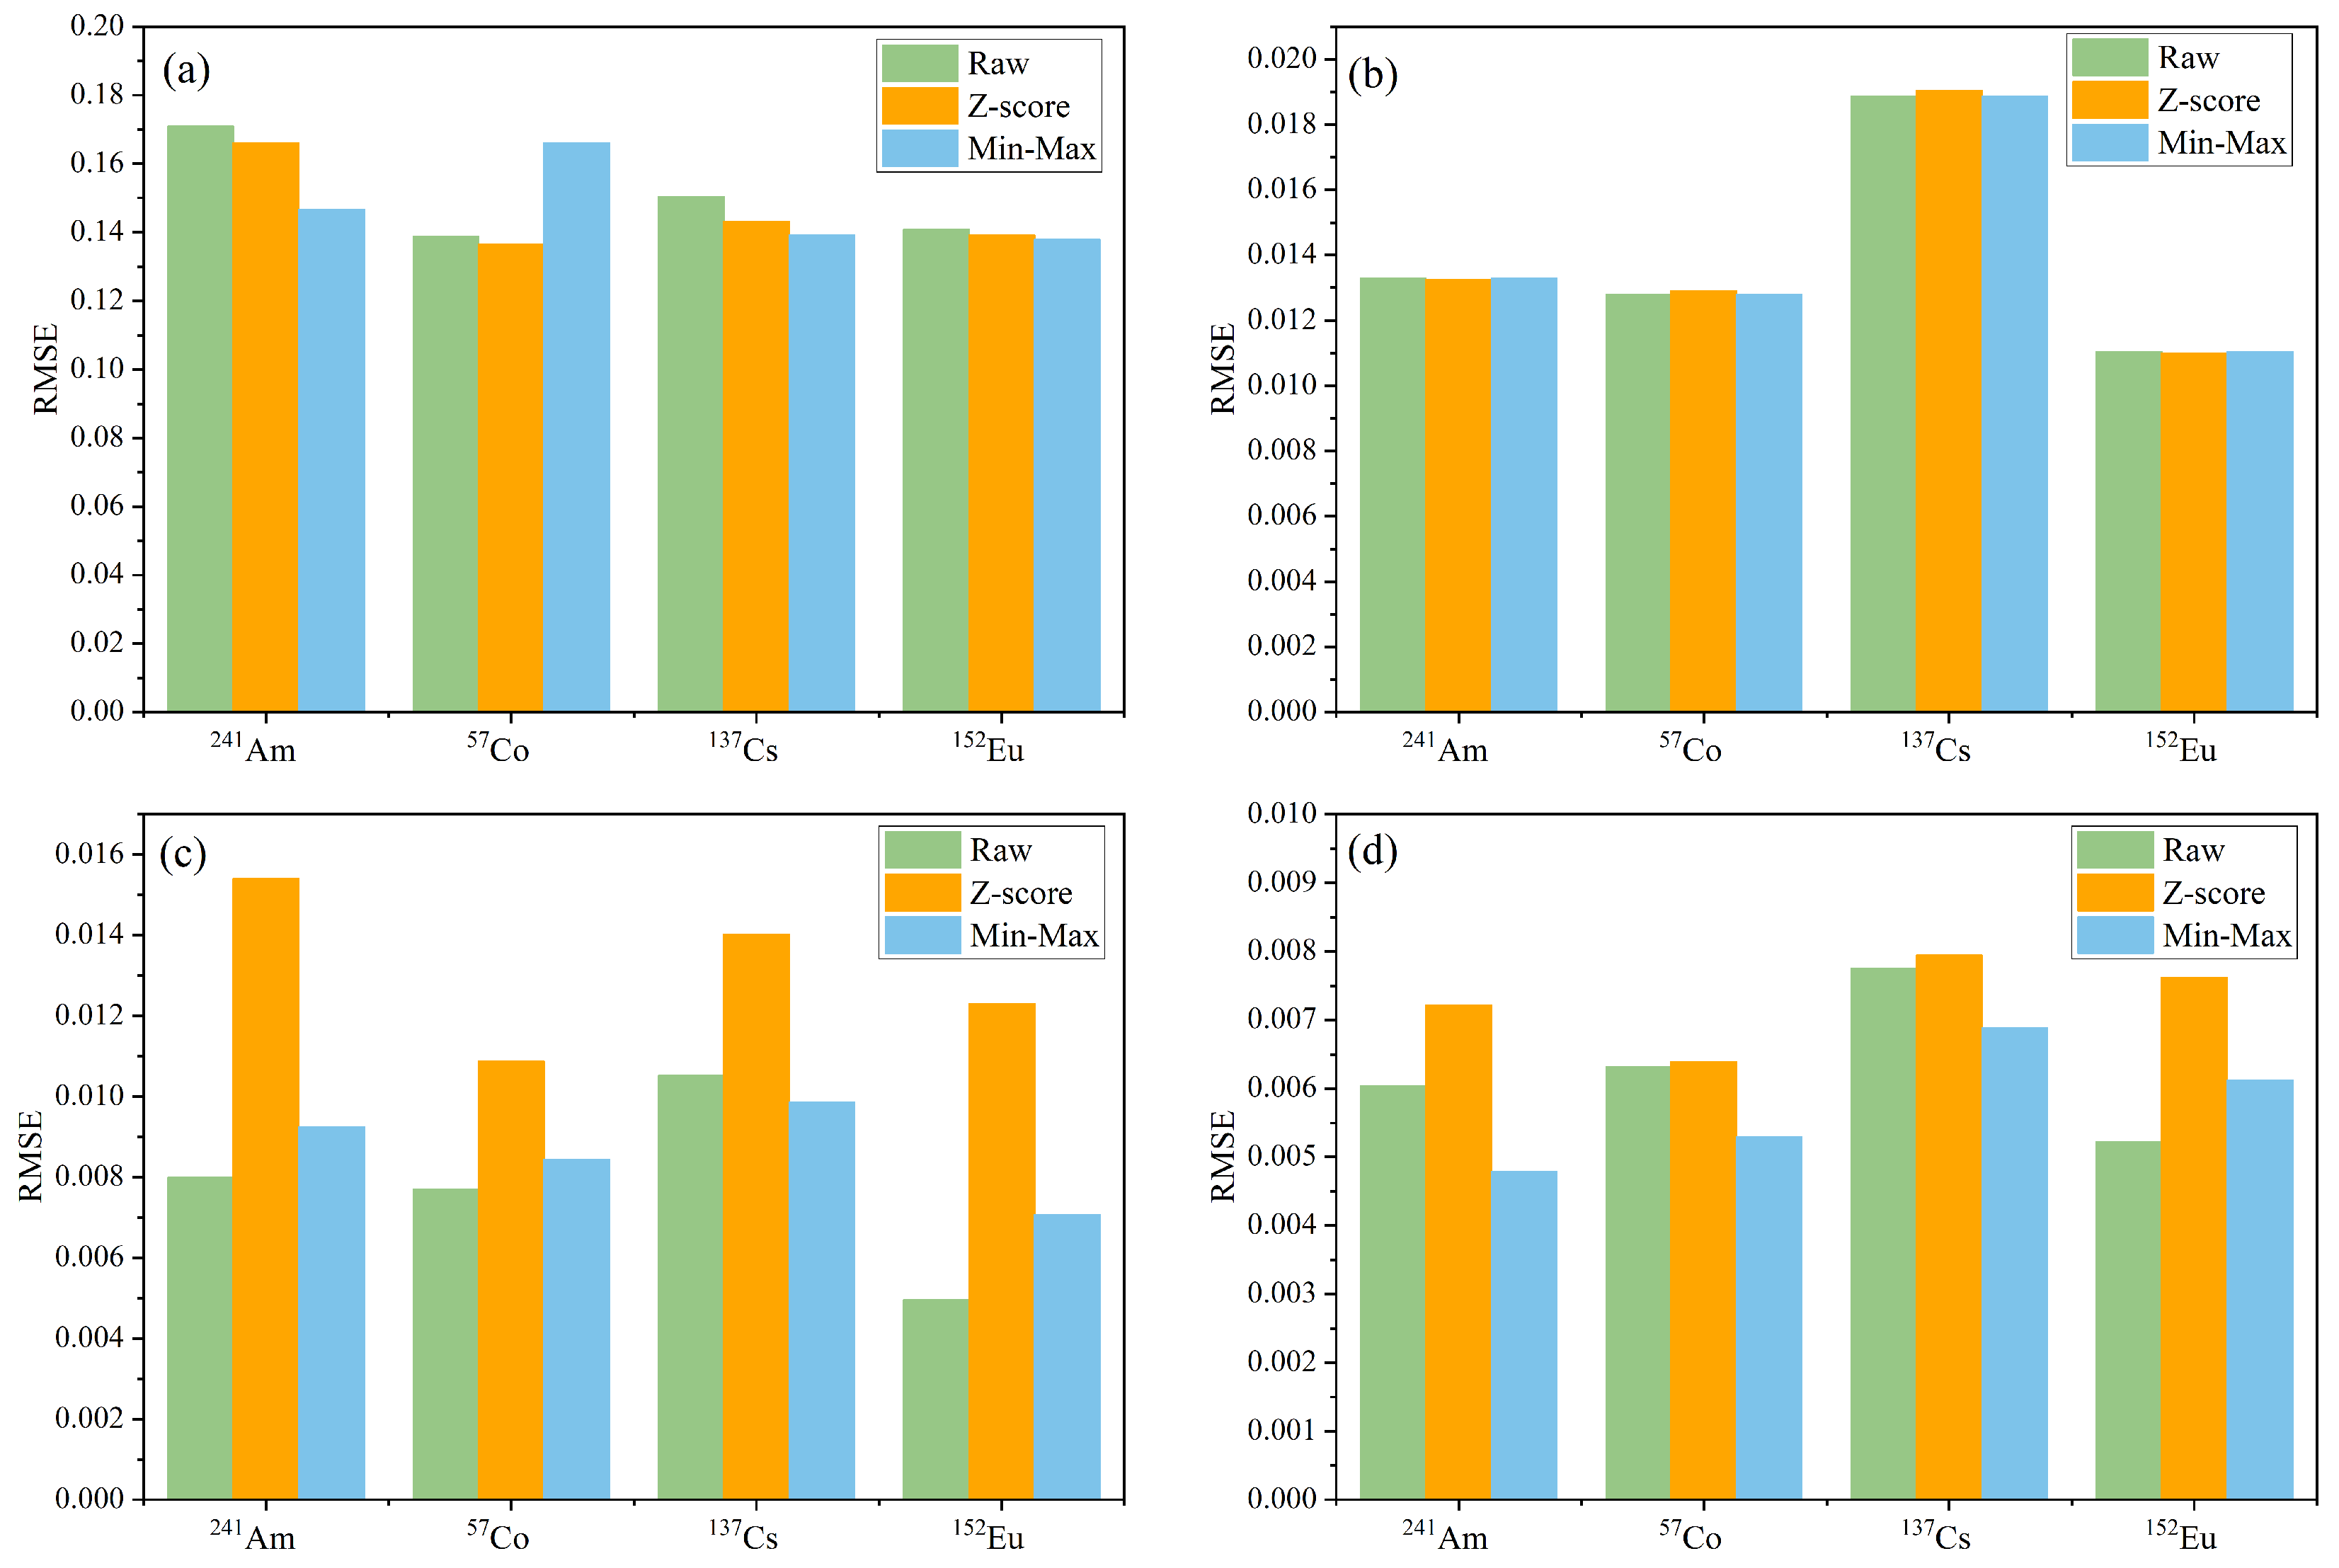
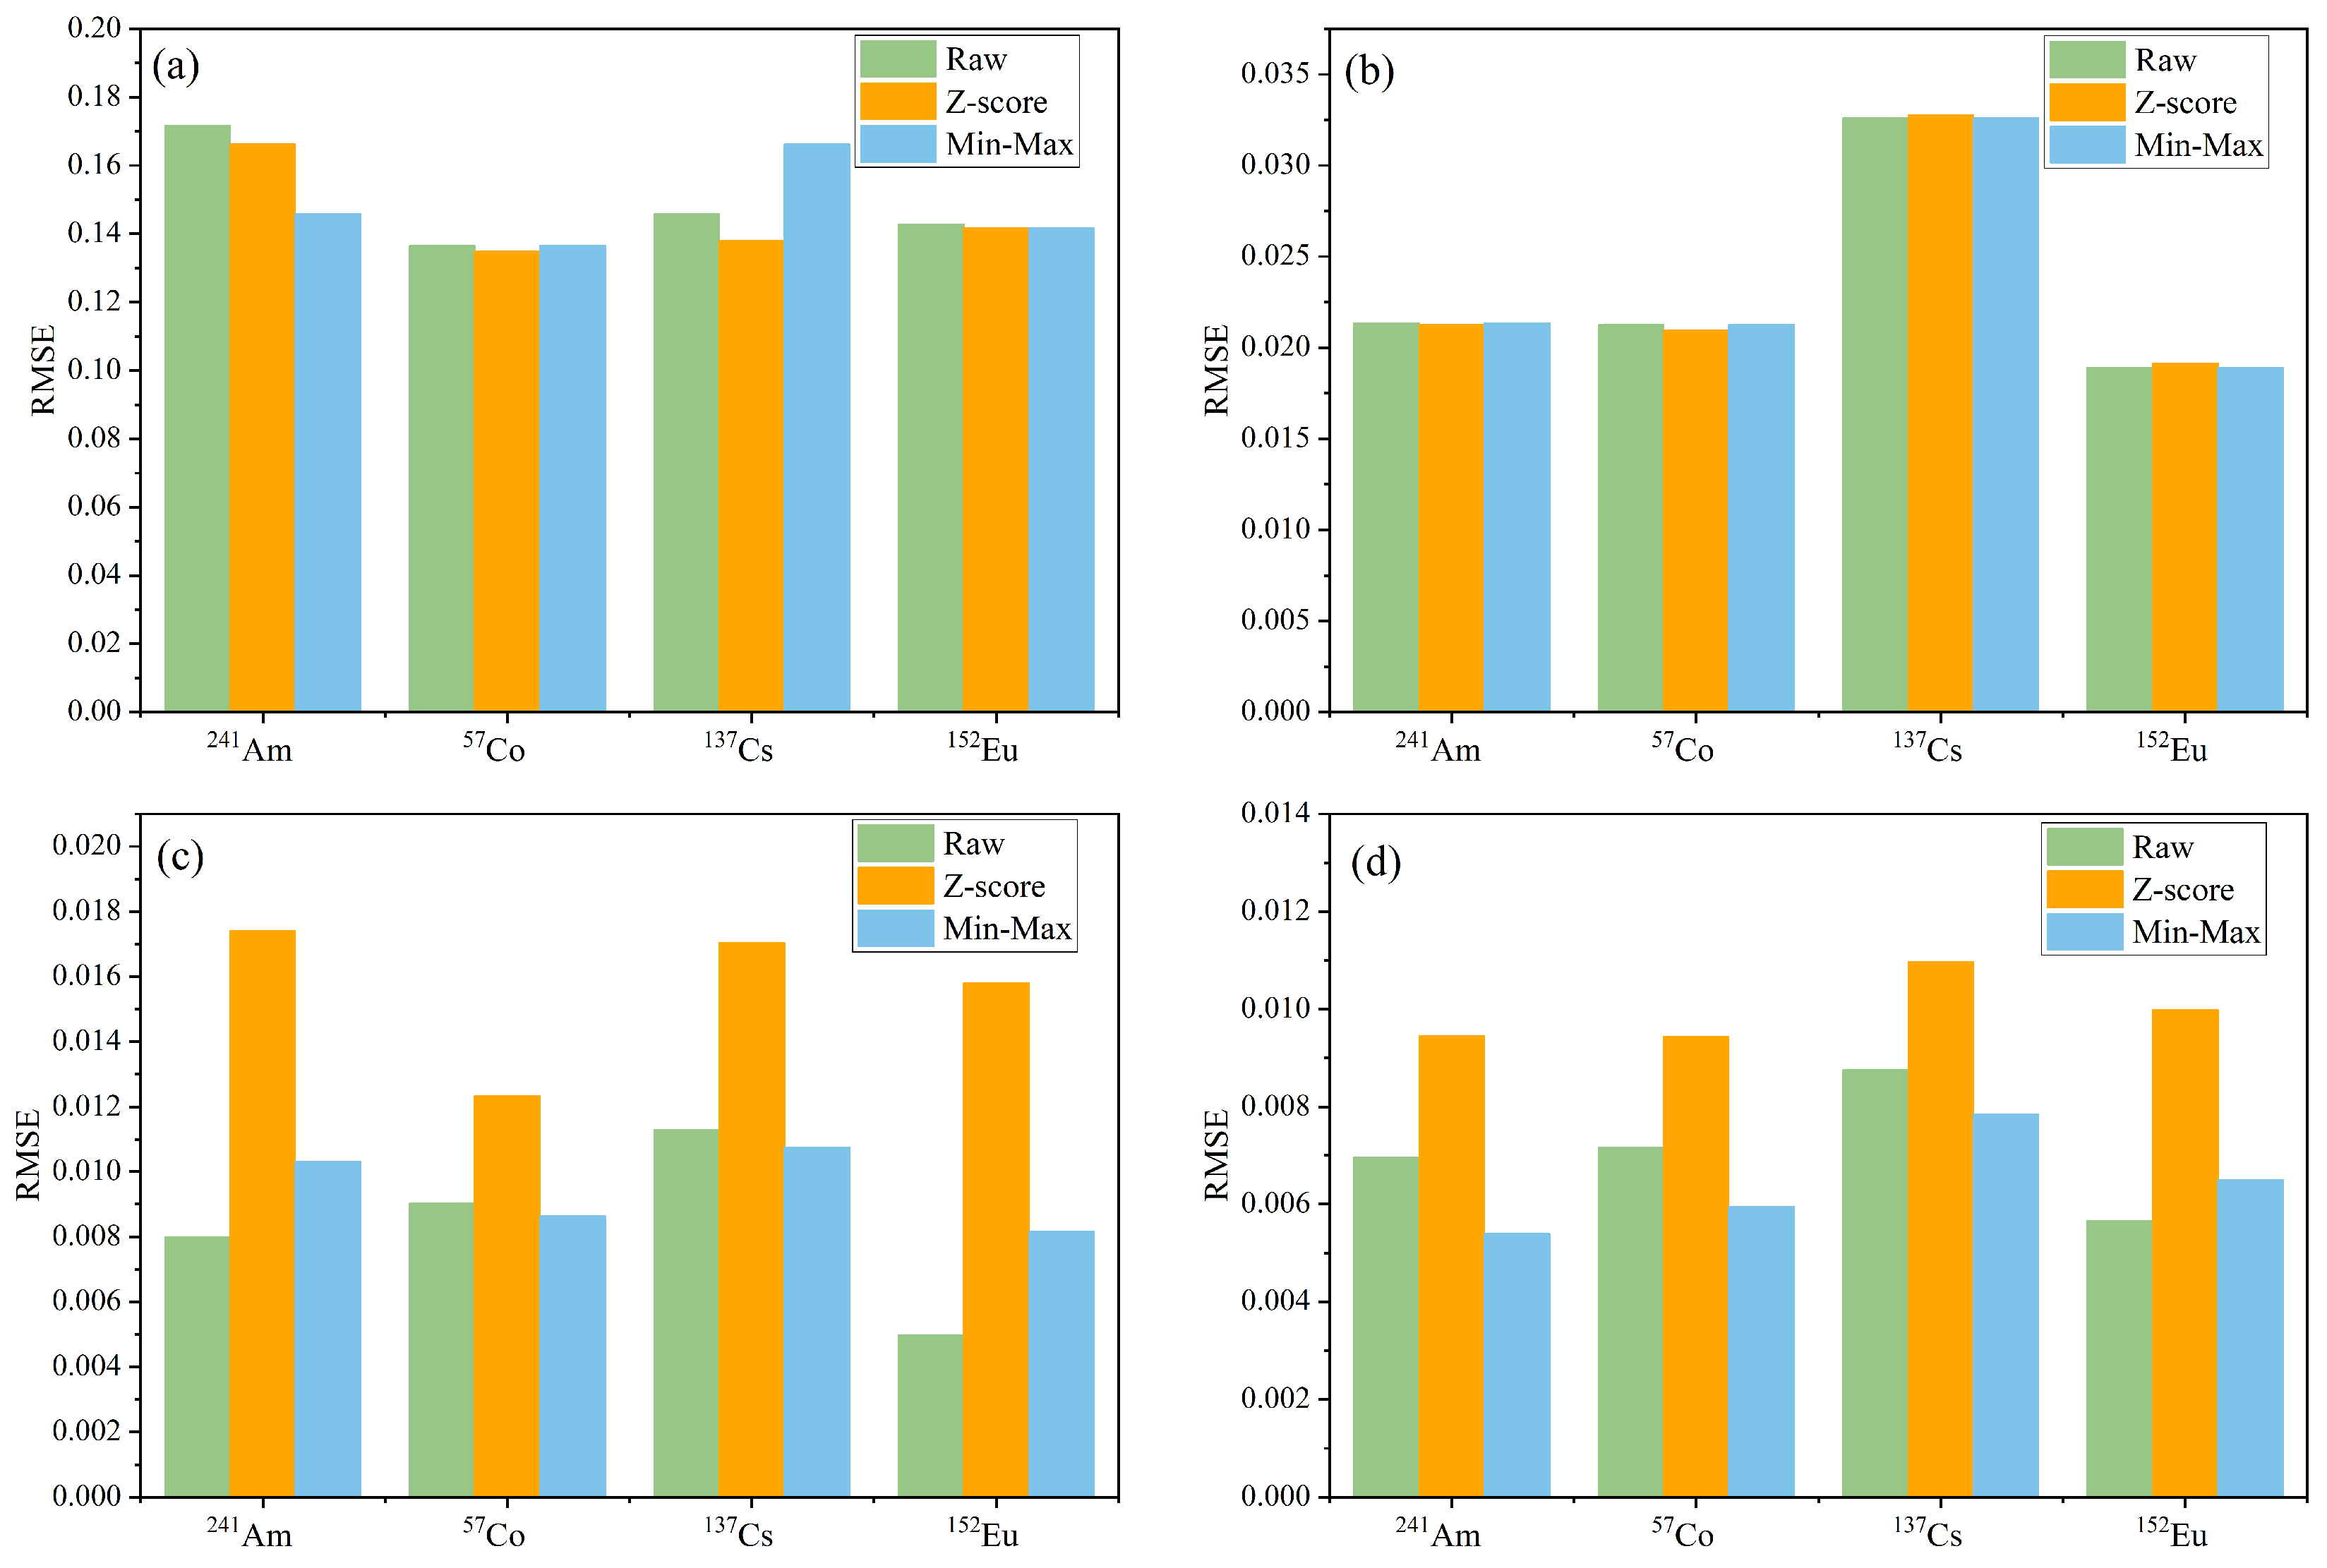
The training-set performance reflects a model’s feature-learning capability. As shown in Figure 9, deep learning models demonstrated significant advantages in this regard. Specifically, the CNN–Meta model utilizing min-max normalization achieved the best fitting performance, with an overall RMSE of 0.00603, representing a reduction of approximately 57.9% compared to the RF model. This result confirms that the initialization parameters provided by the meta-learning strategy through cross-task gradient optimization can effectively enhance both convergence speed and feature-extraction capability.
As shown in Figure 9, the preprocessing method has a significant impact on model performance. For both the CNN and CNN–Meta models, the training-set RMSE was lower when using either min-max normalization or raw spectral inputs, with CNN–Meta under min-max normalization achieving the global optimum, further reducing error by 5.6% compared with the best performance of the CNN using raw spectra. In contrast, Z-score normalization degraded the performance of the CNN, increasing the error to 1.8 times that of the raw spectral input. This decline can likely be attributed to the alteration of spectral intensity distribution and peak shape by Z-score normalization, which interfered with the convolution kernels’ ability to effectively extract local features. By constraining features within the [0,1] interval, min-max normalization preserved the relative spectral structure while promoting gradient stability. The RF model exhibited strong robustness to feature scaling, with RMSE variations of <0.5% across preprocessing methods. Its best performance improved by approximately 90.3% over PLSR, though it still lagged considerably behind the deep learning models.
The performance on the test set serves as the key basis for evaluating the model’s generalization capability and practical value. As shown in Figure 10, the CNN achieved the globally optimal overall test RMSE of 0.00566 using raw spectral inputs, while CNN–Meta reached 0.00704 under min-max normalization. Compared with the best RF result of 0.02412, these values corresponded to reductions of 76.5% and 70.8%, respectively. In addition, the RF model clearly outperformed PLSR, which produced an RMSE of 0.1457.
As a linear model, PLSR is highly sensitive to feature scaling, and its performance varied considerably with the preprocessing method. For instance, the error for 137Cs increased by 14.0% after min-max normalization, while the error for 241Am decreased by 15.1% under the same treatment. RF demonstrated strong robustness across different preprocessing methods, with the overall test-set RMSE varying by less than 0.2%. Nevertheless, its absolute error remained high, indicating limitations in modeling complex nonlinear relationships despite its insensitivity to feature scaling.
The CNN performed optimally with raw spectral data, whereas standardization increased its error by a factor of 1.26, and min-max normalization led to a 37% performance degradation. In contrast, CNN–Meta exhibited stronger adaptability under min-max normalization, achieving a 9.3% reduction in overall error compared to the CNN under the same preprocessing. For nuclides such as 241Am, 57Co, and 137Cs, the error reduction ranged from 20% to 48%, demonstrating that the meta-learning mechanism effectively mitigates distribution shift through cross-task optimization, thereby enhancing the model’s generalization performance.
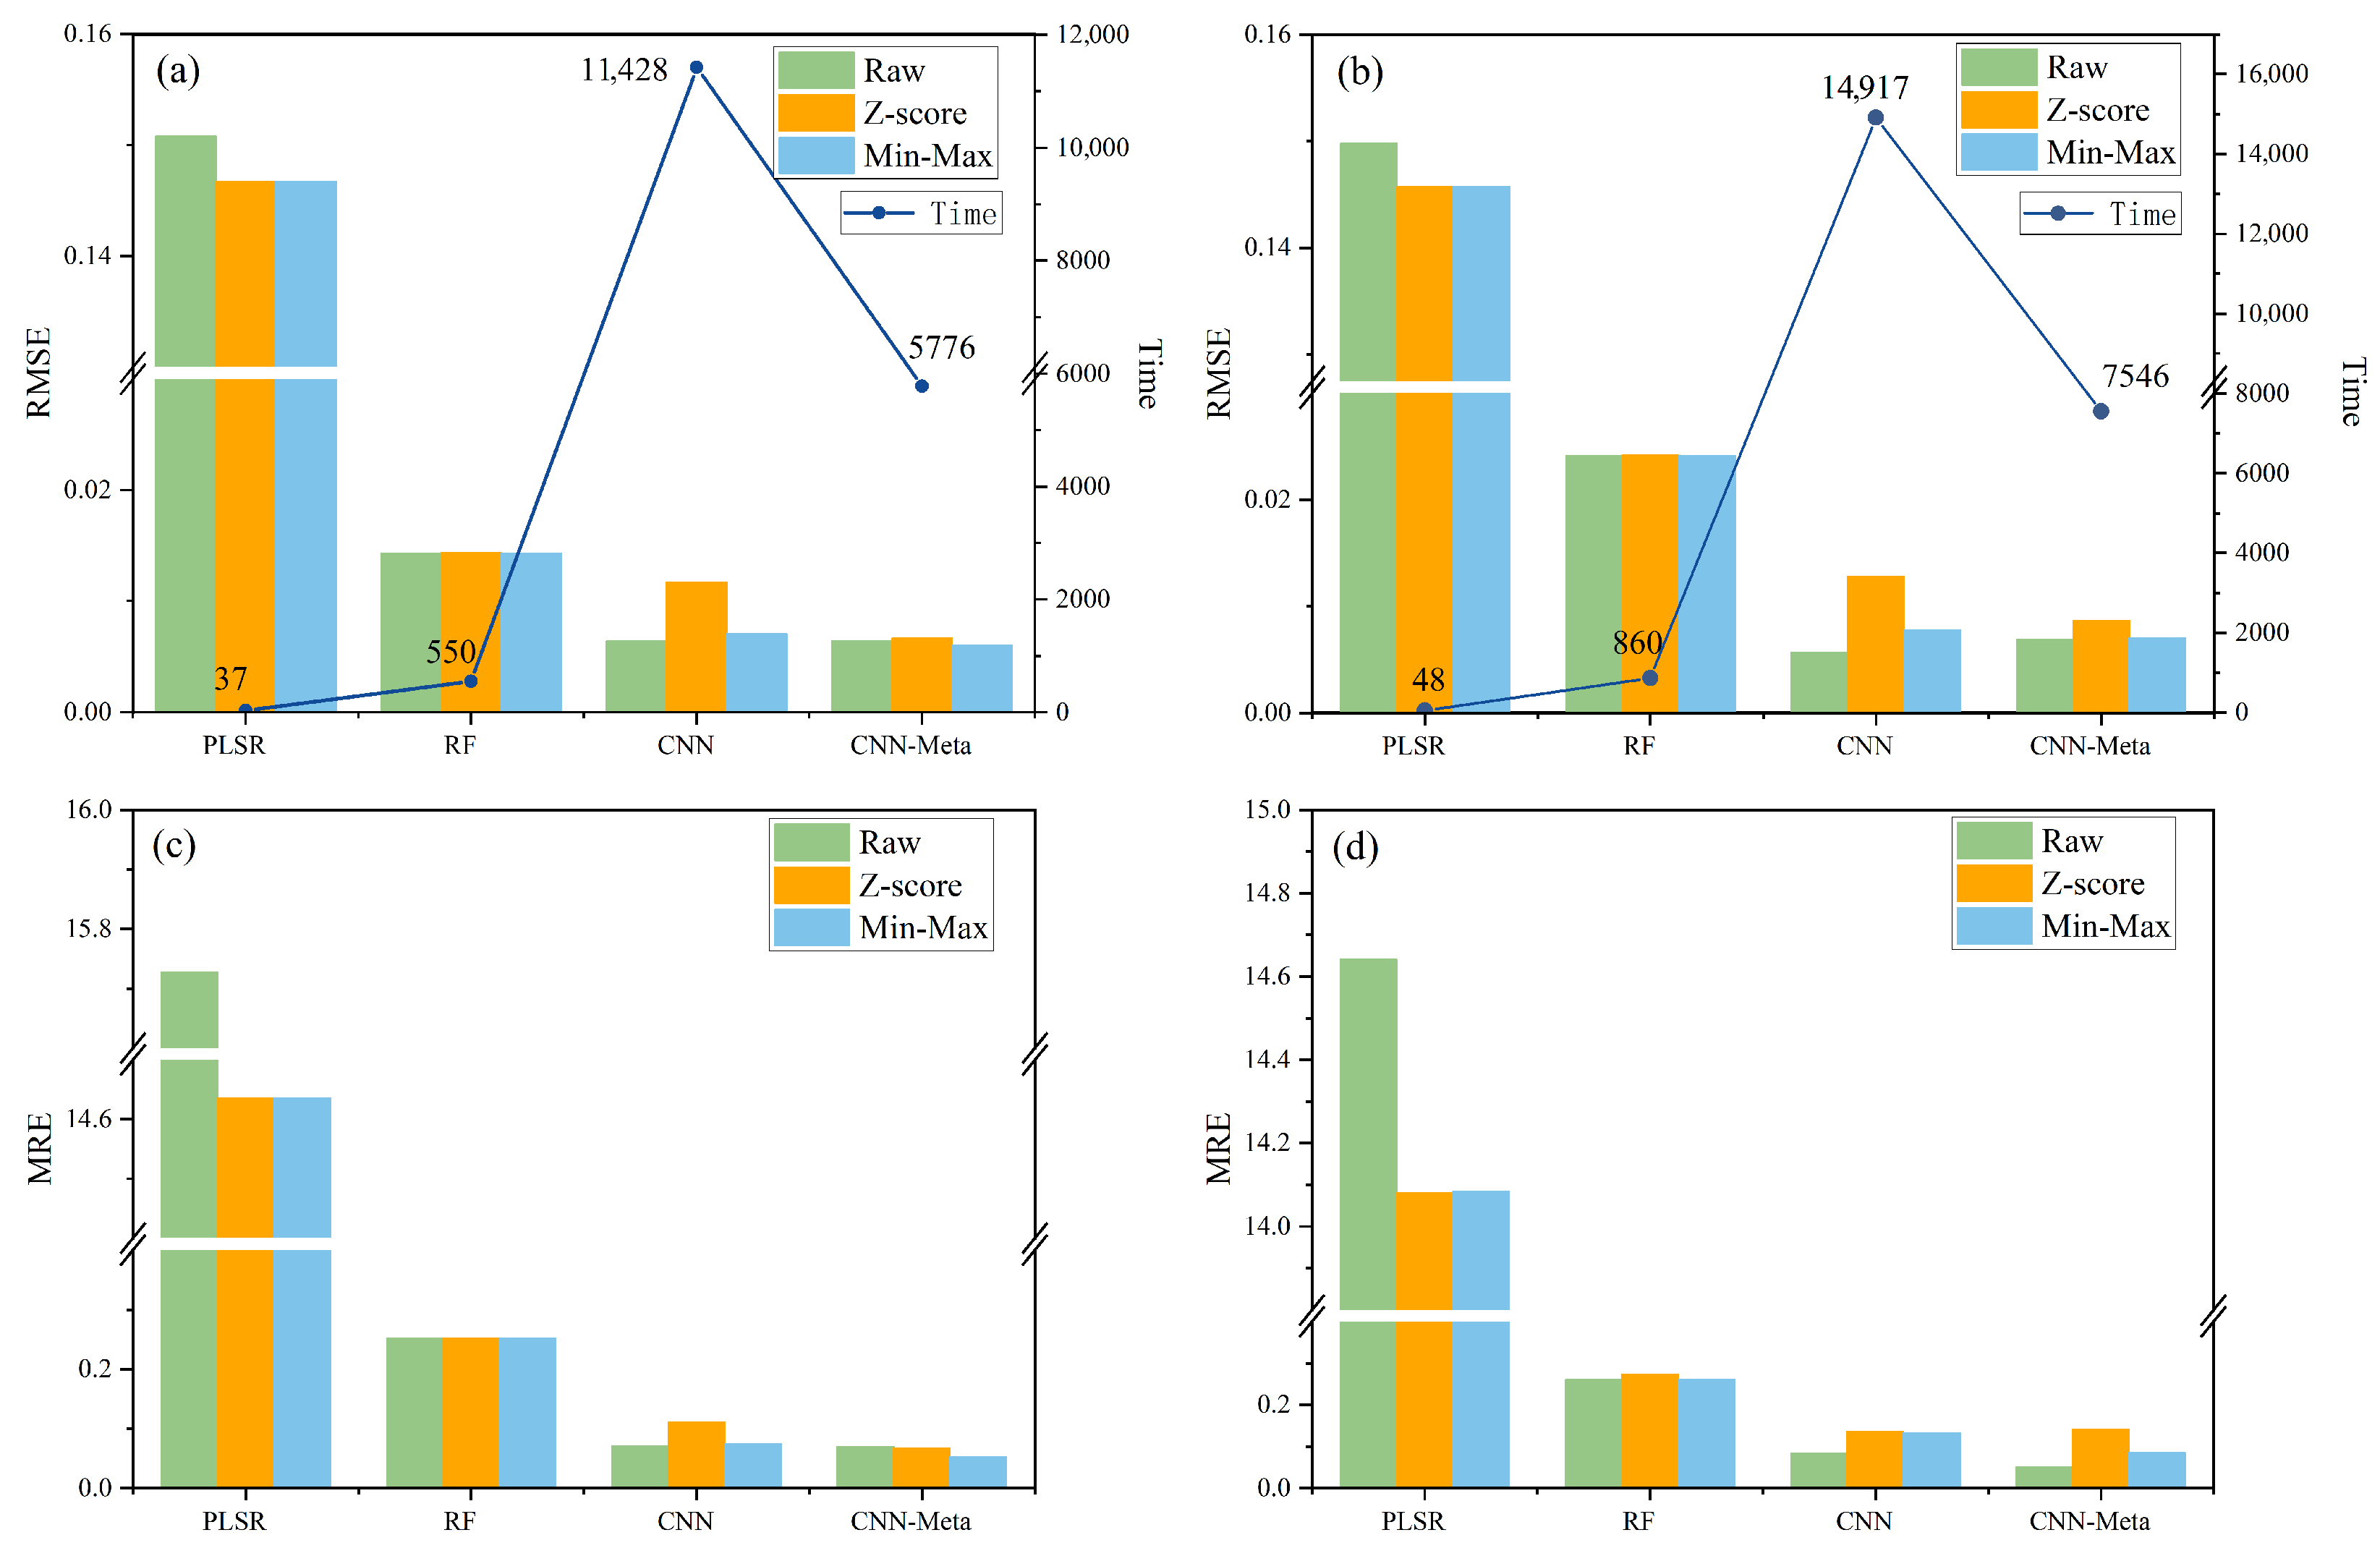
Figure 11 compares the test errors and computational efficiency of the four models—PLSR, RF, CNN, and CNN–Meta—under different preprocessing methods. PLSR achieved the highest test-set RMSE, followed by RF, while the two deep learning models exhibited lower RMSE values. Among them, the CNN achieved the optimal RMSE of only 0.00566, whereas CNN–Meta demonstrated overall superior performance to the CNN across different preprocessing conditions. The MRE results were consistent with the RMSE trend: PLSR showed the highest MRE, RF achieved a moderate reduction, while both the CNN and CNN–Meta models significantly outperformed PLSR and RF. Notably, CNN–Meta consistently achieved the lowest MRE across different preprocessing conditions, indicating stronger generalization capability and robustness.
In terms of computational efficiency, CNN–Meta also demonstrated an advantage, with total computation time being only 49% of that required by the CNN while maintaining competitive accuracy. In summary, PLSR is constrained by its linear modeling framework, limiting its ability to capture complex nonlinear relationships in spectral data. RF exhibits robustness but suffers from limited predictive accuracy. Notably, this efficiency improvement was highly consistent across both the training and test stages. The CNN achieves substantially higher accuracy than PLSR and RF, while CNN–Meta, by incorporating meta-learning, delivers both high accuracy and markedly reduced computational time, highlighting its superior overall performance.

4. Conclusions

Within the unified calibration and preprocessing framework, this study has proposed and systematically evaluated a hybrid model, CNN–Meta, and conducted comprehensive comparisons with PLSR, RF, and CNN models. The comparative results demonstrated that through the effective integration of a meta-learning-based initialization strategy and task-adaptive feature extraction, CNN–Meta significantly enhanced feature discriminability and convergence speed under conditions of spectral overlap and weak peak backgrounds, thereby improving computational efficiency while maintaining high accuracy.
This study was conducted using specific datasets and experimental geometric configurations, with the spectral data covering low-to-medium count-rate conditions. However, the model’s performance under high count rates—particularly regarding its generalization capability in real-world scenarios involving pulse pile-up effects, diverse detector types, and complex environments—still requires further validation and improvement. Future work will focus on enhancing the model’s robustness across broader count-rate ranges and more complex geometric conditions to improve its practical application value. Although this research was performed using thin-film standard sources under specific geometric conditions, the proposed CNN–Meta model demonstrates potential for application in more complex spectral scenarios, such as analyzing natural radionuclides (e.g., decay series of 40K, 238U, and 232Th) in ores or soils. The next step will involve applying the model to measured spectra characterized by complex matrix effects and multiple overlapping peaks, systematically evaluating its quantitative analysis performance in realistic complex scenarios, and further exploring its potential applications in environmental radiation monitoring and geological exploration.
In summary, the proposed hybrid model demonstrated superior performance in radionuclide identification and activity quantification, making it a valuable approach for the analysis of complex energy spectra.

Author Contributions

Conceptualization, X.M. and X.L.; methodology, Y.S.; software, Z.D.; validation, H.Z.; formal analysis, Z.W.; investigation, X.L.; resources, Y.S.; data curation, Z.W.; writing—original draft preparation, X.M. and Z.W.; writing—review and editing, X.L. and X.W.; visualization, H.Z.; supervision, X.L. and X.W.; project administration, H.Z.; funding acquisition, X.M. All authors have read and agreed to the published version of the manuscript.

Funding

This research was funded by the National Natural Science Foundation of China (No. 12305216); the Key Laboratory of Advanced Nuclear Energy Design and Safety, Ministry of Education, China (KLANETDS -KF-202402); and the Jiangxi Province Postgraduate Innovation Fund Project, China (YC2025-S538).

Institutional Review Board Statement

Not applicable.

Informed Consent Statement

Not applicable.

Data Availability Statement

The original contributions presented in this study are included in the article. Further inquiries can be directed to the corresponding authors.

Acknowledgments

The authors would like to thank Zhang Pengpeng and Li Deyuan for their experimental help, as well as the reviewers and editors for their valuable comments.

Conflicts of Interest

The authors declare no conflicts of interest.

References

  1. Sasaki, M.; Sanada, Y.; Katengeza, E.W.; Yamamoto, A. New method for visualizing the dose rate distribution around the Fukushima Daiichi Nuclear Power Plant using artificial neural networks. Sci. Rep. 2021, 11, 1857. [Google Scholar] [CrossRef]
  2. D’Onorio, M.; Glingler, T.; Molinari, M.; Maccari, P.; Mascari, F.; Mandelli, D.; Alfonsi, A.; Caruso, G. Nuclear safety Enhanced: A Deep dive into current and future RAVEN applications. Nucl. Eng. Des. 2024, 427, 113422. [Google Scholar] [CrossRef]
  3. Sanwick, A.; Chaple, I. Radiocobalt theranostic applications: Current landscape, challenges, and future directions. Front. Nucl. Med. 2025, 5, 1663748. [Google Scholar] [CrossRef] [PubMed]
  4. Cooper, R.J.; Amman, M.; Luke, P.N.; Vetter, K. A prototype High Purity Germanium detector for high resolution gamma-ray spectroscopy at high count rates. Nucl. Instrum. Methods Phys. Res. Sect. A Accel. Spectrometers Detect. Assoc. Equip. 2015, 795, 167–173. [Google Scholar] [CrossRef]
  5. Kanisch, G. Detection limit calculations for peak evaluation methods in HPGe gamma-ray spectrometry according to ISO 11929. Nucl. Instrum. Methods Phys. Res. Sect. A Accel. Spectrometers Detect. Assoc. Equip. 2017, 855, 118–132. [Google Scholar] [CrossRef]
  6. Russ, W.R. Library correlation nuclide identification algorithm. Nucl. Instrum. Methods Phys. Res. Sect. A Accel. Spectrometers Detect. Assoc. Equip. 2007, 579, 288–291. [Google Scholar] [CrossRef]
  7. Allinei, P.G.; Pérot, N.; Pérot, B.; Marchais, T.; Fondement, V.; Toubon, H.; Bruned, V.; Berland, A.; Goupillou, R. Estimation of uranium concentration in ore samples with machine learning methods on HPGe gamma-ray spectra. Nucl. Instrum. Methods Phys. Res. Sect. A Accel. Spectrometers Detect. Assoc. Equip. 2022, 1032, 166597. [Google Scholar] [CrossRef]
  8. Dai, W.; Zeng, Z.; Dou, D.; Ma, H.; Cheng, J.; Li, J.; Zhang, H. Marine radioisotope gamma-ray spectrum analysis method based on Geant4 simulation and MLP neural network. J. Instrum. 2021, 16, P06030. [Google Scholar] [CrossRef]
  9. Li, F.; Gu, Z.; Ge, L.; Li, H.; Tang, X.; Lang, X.; Hu, B. Review of recent gamma spectrum unfolding algorithms and their application. Results Phys. 2019, 13, 102211. [Google Scholar] [CrossRef]
  10. Hýža, M.; Dragounová, L.; Kořistková, M. Latent variable modeling of gamma-ray background in repeated measurements. Appl. Radiat. Isot. 2024, 204, 111119. [Google Scholar] [CrossRef]
  11. Qi, S.; Zhao, W.; Chen, Y.; Chen, W.; Li, J.; Zhao, H.; Xiao, W.; Ai, X.; Zhang, K.; Wang, S. Comparison of machine learning approaches for radioisotope identification using NaI (TI) gamma-ray spectrum. Appl. Radiat. Isot. 2022, 186, 110212. [Google Scholar] [CrossRef]
  12. Hata, H.; Yokoyama, K.; Ishimori, Y.; Ohara, Y.; Tanaka, Y.; Sugitsue, N. Application of support vector machine to rapid classification of uranium waste drums using low-resolution γ-ray spectra. Appl. Radiat. Isot. 2015, 104, 143–146. [Google Scholar] [CrossRef] [PubMed]
  13. Tomita, H.; Hara, S.; Mukai, A.; Yamagishi, K.; Ebi, H.; Shimazoe, K.; Tamura, Y.; Woo, H.; Takahashi, H.; Asama, H.; et al. Path-planning system for radioisotope identification devices using 4π gamma imaging based on random forest analysis. Sensors 2022, 22, 4325. [Google Scholar] [CrossRef] [PubMed]
  14. Mathew, J.; Kshirsagar, R.; Abidin, D.Z.; Griffin, J.; Kanarachos, S.; James, J.; Alamaniotis, M.; Fitzpatrick, M.E. A comparison of machine learning methods to classify radioactive elements using prompt-gamma-ray neutron activation data. Sci. Rep. 2023, 13, 9948. [Google Scholar] [CrossRef] [PubMed]
  15. Kamuda, M.; Zhao, J.; Huff, K. A comparison of machine learning methods for automated gamma-ray spectroscopy. Nucl. Instrum. Methods Phys. Res. Sect. A Accel. Spectrometers Detect. Assoc. Equip. 2020, 954, 161385. [Google Scholar] [CrossRef]
  16. Turner, A.N.; Wheldon, C.; Wheldon, T.K.; Gilbert, M.R.; Packer, L.P.; Burns, J.; Freer, M. Convolutional neural networks for challenges in automated nuclide identification. Sensors 2021, 21, 5238. [Google Scholar] [CrossRef]
  17. Li, F.; Qi, S.; Li, Z.; Gao, H.; Yang, S.; Liu, J.; Fan, C. Comparative analysis of multi-nuclide spectrum recognition methods based on neural network. Nucl. Eng. Technol. 2025, 58, 103914. [Google Scholar] [CrossRef]
  18. Li, F.; Luo, C.; Wen, Y.; Lv, S.; Cheng, F.; Zeng, G.; Jiang, J.; Li, B. A nuclide identification method of γ spectrum and model building based on the transformer. Nucl. Sci. Tech. 2025, 36, 7. [Google Scholar] [CrossRef]
  19. Li, C.; Liu, S.; Wang, C.; Jiang, X.; Sun, X.; Li, M.; Wei, L. A new radionuclide identification method for low-count energy spectra with multiple radionuclides. Appl. Radiat. Isot. 2022, 185, 110219. [Google Scholar] [CrossRef]
  20. Vettoruzzo, A.; Bouguelia, M.; Vanschoren, J.; Rögnvaldsson, T.; Santosh, K. Advances and challenges in meta-learning: A technical review. IEEE Trans. Pattern Anal. Mach. Intell. 2024, 46, 4763–4779. [Google Scholar] [CrossRef]
  21. Agostinelli, S.; Allison, J.; Amako, K.; Apostolakis, J.; Araujo, H.; Arce, P.; Asai, M.; Axen, D.; Banerjee, S.; Barrand, G.; et al. Geant4—A simulation toolkit. Nucl. Instrum. Methods Phys. Res. Sect. A Accel. Spectrometers Detect. Assoc. Equip. 2003, 506, 250–303. [Google Scholar] [CrossRef]
  22. Allison, J.; Amako, K.; Apostolakis, J.; Arce, P.; Asai, M.; Aso, T.; Bagli, E.; Bagulya, A.; Banerjee, S.; Barrand, G.; et al. Recent developments in Geant4. Nucl. Instrum. Methods Phys. Res. Sect. A Accel. Spectrometers Detect. Assoc. Equip. 2016, 835, 186–225. [Google Scholar] [CrossRef]
  23. Yan, Q.; Zhang, H.; Huang, J.; Xiong, W.; Huang, G.; Dai, L.; Wu, Z.; Liu, G. Quantitative Alpha Spectra Isotope Identification Based on Deep Learning Method and Monte Carlo modeling. Radiat. Meas. 2025, 186, 107460. [Google Scholar] [CrossRef]
  24. Déjeant, A.; Bourva, L.; Sia, R.; Galoisy, L.; Calas, G.; Phrommavanh, V.; Descostes, M. Field analyses of 238U and 226Ra in two uranium mill tailings piles from Niger using portable HPGe detector. J. Environ. Radioact. 2014, 137, 105–112. [Google Scholar] [CrossRef] [PubMed]
  25. Wold, S.; Sjöström, M.; Eriksson, L. PLS-regression: A basic tool of chemometrics. Chemom. Intell. Lab. Syst. 2001, 58, 109–130. [Google Scholar] [CrossRef]
  26. Breiman, L. Random forests. Mach. Learn. 2001, 45, 5–32. [Google Scholar] [CrossRef]
  27. Huang, X.; Yuan, Y.G.; Zhu, Y.X.; Chen, H.; Qu, J.; Tan, Z. A low-consumption multiple nuclides identification algorithm for portable gamma spectrometer. Nucl. Sci. Tech. 2025, 36, 121. [Google Scholar] [CrossRef]
  28. Barradas, N.P.; Vieira, A.; Felizardo, M.; Matos, M. Nuclide identification of radioactive sources from gamma spectra using artificial neural networks. Radiat. Phys. Chem. 2025, 232, 112692. [Google Scholar] [CrossRef]
  29. Wang, Y.; Liu, S.; Lv, S.; Liu, G. A First-Order Meta Learning Method for Remaining Useful Life Prediction of Rotating Machinery under limited Samples. Appl. Soft Comput. 2025, 182, 113616. [Google Scholar] [CrossRef]
  30. Bai, H.; Jiang, W.; Du, Z.; Zhou, W.; Li, X.; Li, H. An evolution strategy of GAN for the generation of high impedance fault samples based on Reptile algorithm. Front. Energy Res. 2023, 11, 1180555. [Google Scholar] [CrossRef]
  31. Huisman, M.; Plaat, A.; van Rijn, J.N. Understanding transfer learning and gradient-based meta-learning techniques. Mach. Learn. 2024, 113, 4113–4132. [Google Scholar] [CrossRef]
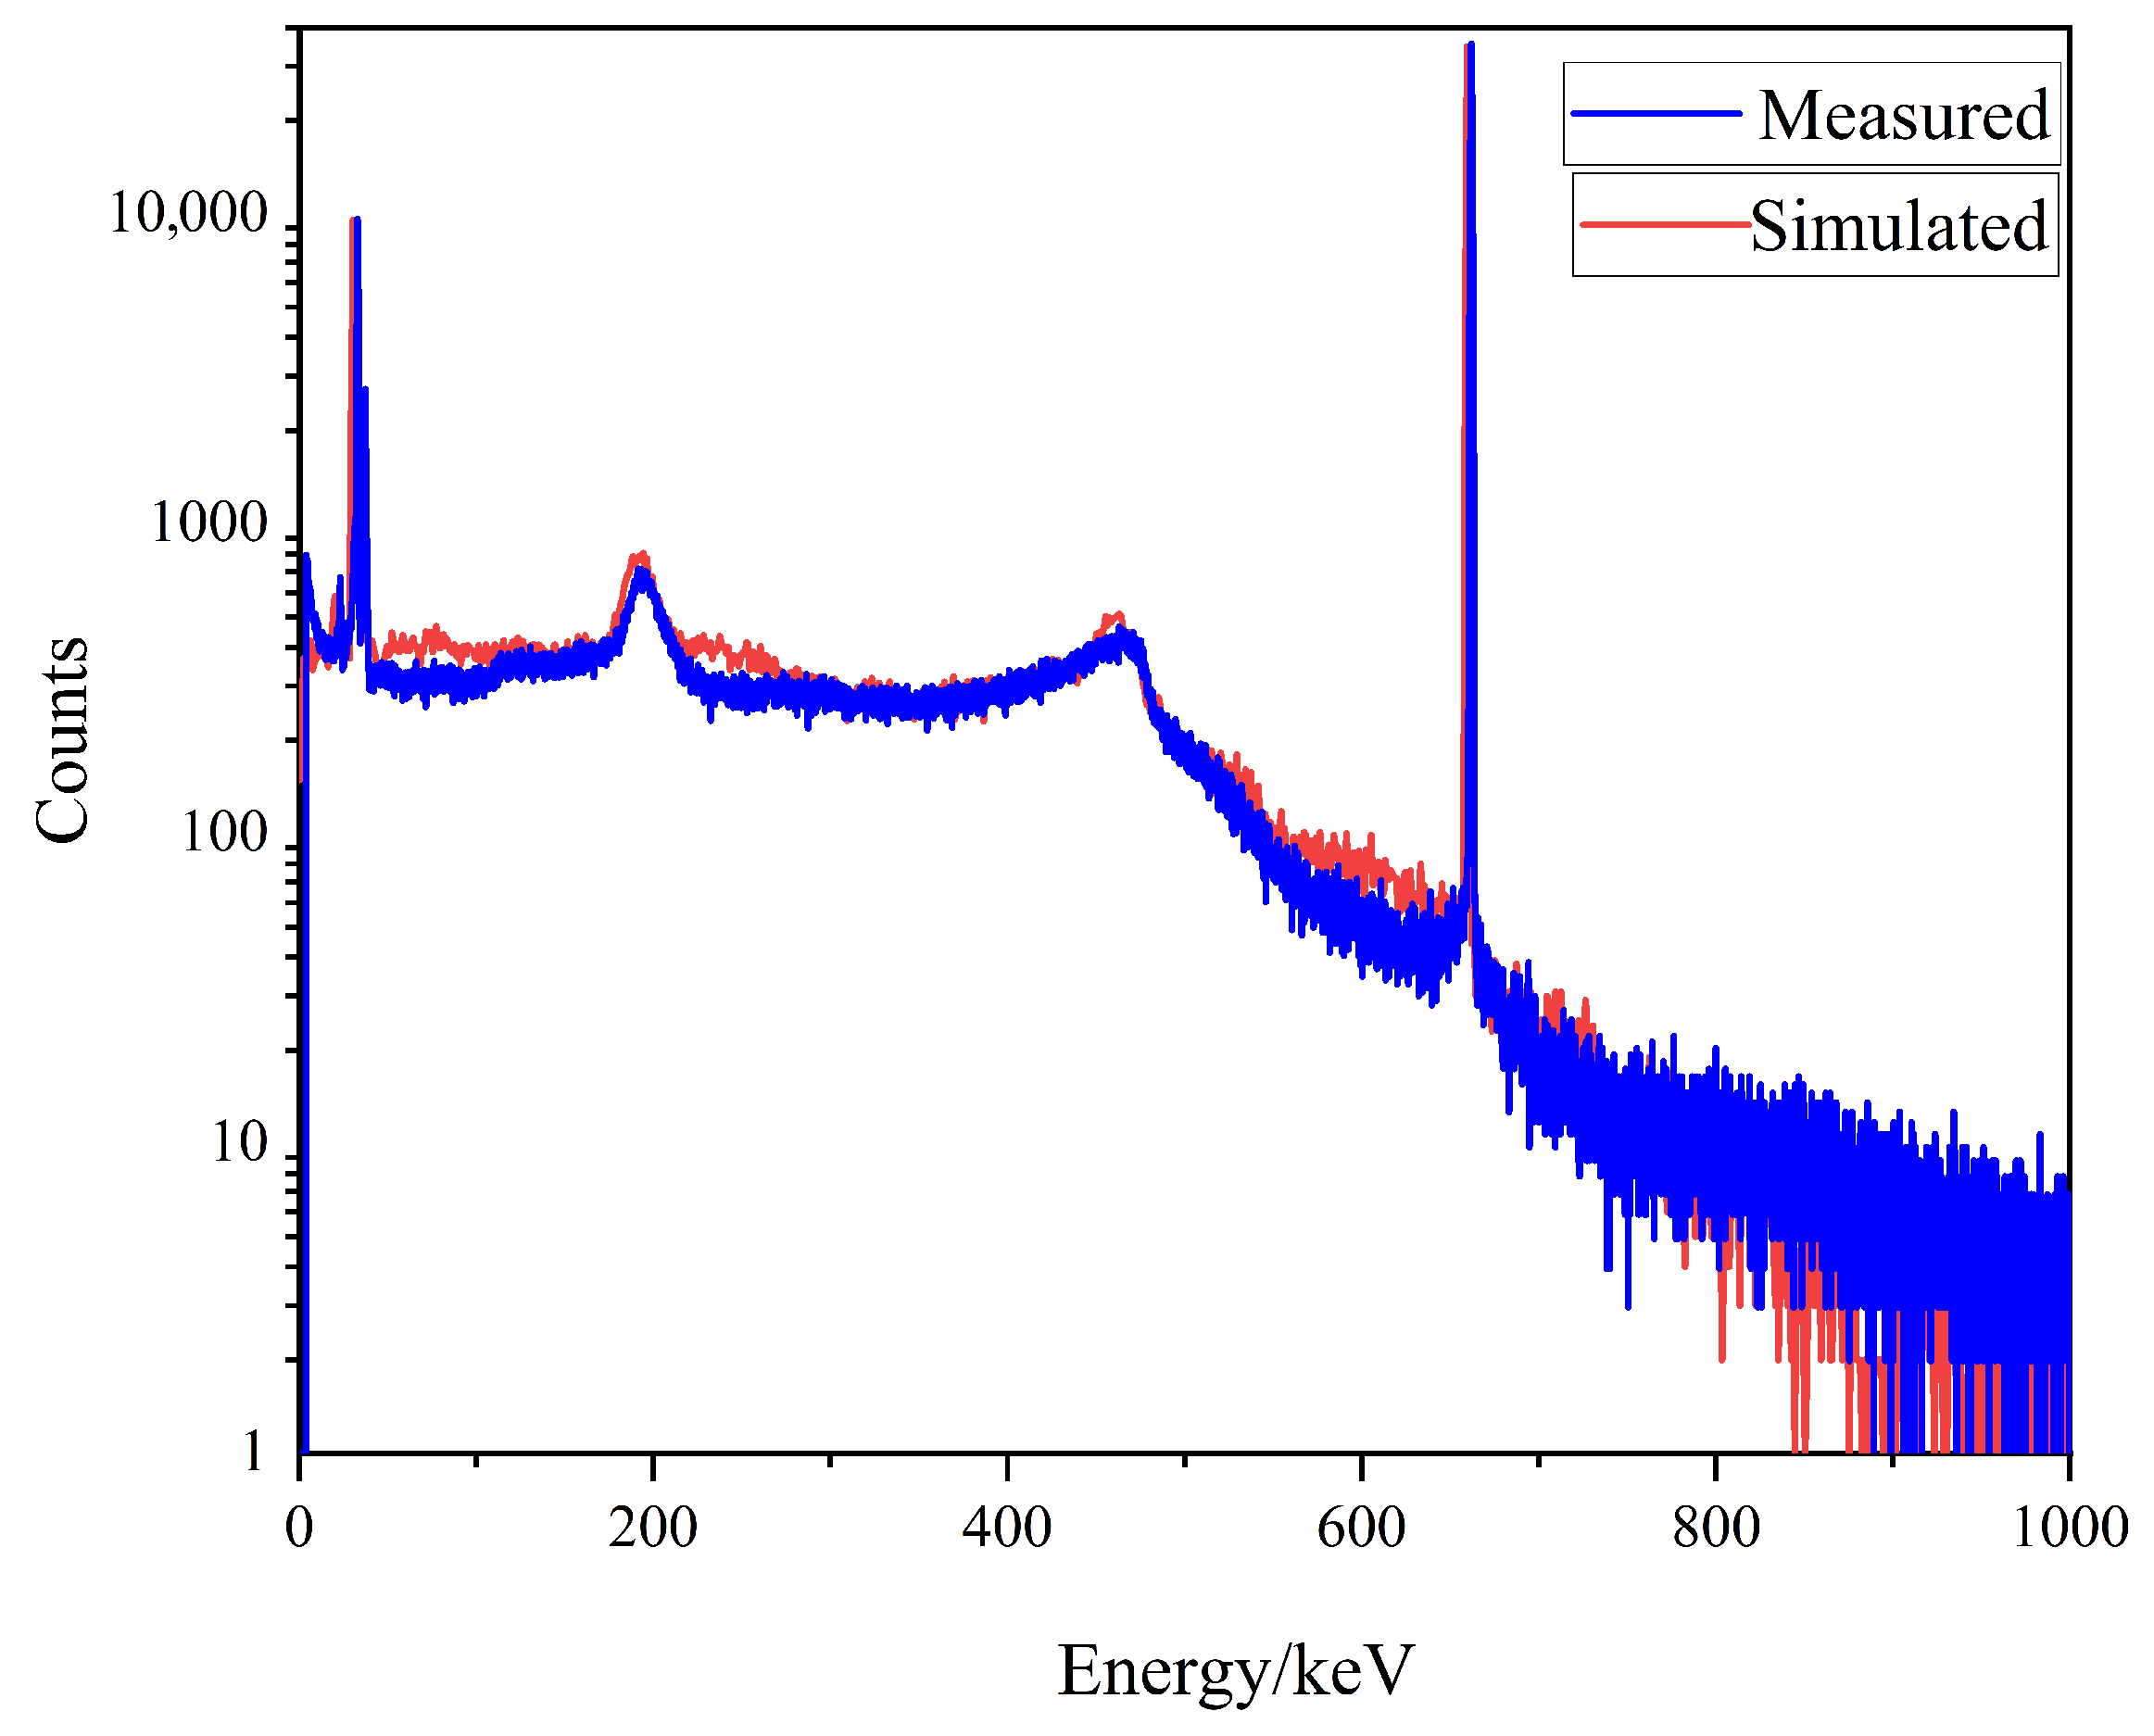
Figure 1. Comparison of the simulated and experimental energy spectra of 137Cs.
Applsci 15 12285 g001
Figure 2. Dimension-reduced distribution of the simulated energy spectra: (a) 241Am, (b) 57Co, (c) 137Cs+152Eu, (d) 241Am+57Co+152Eu, (e) 241Am+57Co+137Cs+152Eu.
Applsci 15 12285 g002
Figure 3. Network architecture of the 1D-CNN.
Applsci 15 12285 g003
Figure 4. Network architecture of the CNN–Meta model.
Applsci 15 12285 g004
Figure 5. Variations in R2 and RMSE with the number of components in the PLSR model.
Applsci 15 12285 g005
Figure 6. Response surface of training-set RMSE values across RF hyperparameters.
Applsci 15 12285 g006
Figure 7. Variation in RMSE with the number of training epochs for the CNN model.
Applsci 15 12285 g007
Figure 8. Variation in RMSE with training epochs.
Applsci 15 12285 g008
Figure 9. Training-set RMSE comparison across models and normalization methods: (a) PLSR, (b) RF, (c) CNN, and (d) CNN–Meta.
Applsci 15 12285 g009
Figure 10. Test-set RMSE comparison across models and normalization methods: (a) PLSR, (b) RF, (c) CNN, (d) CNN–Meta.
Applsci 15 12285 g010
Figure 11. Model performance across training and test sets: (a) training-set RMSE, (b) test-set RMSE, (c) training-set MRE, (d) test set-MRE.
Applsci 15 12285 g011
Table 1. Detailed information on the four standard radionuclides.
RadionuclideEnergy/keVEmission Rate/%Activity/kBq
241Am59.5435.7829.6
57Co122.06, 136.4785.51, 10.713.75
137Cs661.6684.9920.9
152Eu121.78, 244.70, 344.2828.14, 7.55, 26.586.5
411.12, 778.90, 964.072.24, 12.96, 14.62
1085.84, 1112.0810.13, 13.40
1408.0120.85
Table 2. Search ranges of hyperparameters and their optimized values.
ArchitectureHyperparameterValuesOptimized Values
RFMaxDepth10,20,30,4020
MinSamplesSplit2,3,4,5,6,7,8,9,106
NumTrees100–400392
Disclaimer/Publisher’s Note: The statements, opinions and data contained in all publications are solely those of the individual author(s) and contributor(s) and not of MDPI and/or the editor(s). MDPI and/or the editor(s) disclaim responsibility for any injury to people or property resulting from any ideas, methods, instructions or products referred to in the content.