Article

A New Method for Detecting Plastic-Mulched Land Using GF-2 Imagery

1
Yunnan Provincial International Joint Research and Development Center for Smart Environment, Kunming 650201, China
2
School of Water Conservancy, Yunnan Agricultural University, Kunming 650201, China
3
Institute of International Rivers and Eco-Security, Yunnan University, Kunming 650091, China
4
School of Land and Resources Engineering, Kunming University of Science and Technology, Kunming 650093, China
5
College of Economics and Management, Southwest Forestry University, Kunming 650224, China
*
Author to whom correspondence should be addressed.
Appl. Sci. 2025, 15(22), 11978; https://doi.org/10.3390/app152211978
Submission received: 10 October 2025 / Revised: 30 October 2025 / Accepted: 5 November 2025 / Published: 11 November 2025

Abstract

Plastic mulch residues threaten soil fertility and contribute to microplastic pollution, creating an urgent need for accurate, rapid mapping of plastic-mulched land (PML). This study presents a novel method for detecting PML from GF-2 imagery by introducing the second component of the K-T transform as a PML-enhancement feature to compensate for the sensor’s limited spectral bands. The K-T component was fused with selected texture metrics and the original spectral bands, and an object-oriented classification framework was applied to delineate PML. Validation shows that the proposed method achieves high identification accuracy for PML and good transferability, with accuracies exceeding 90% across the four selected study areas. Moreover, the method demonstrates strong temporal stability: classification accuracies exceeded 90% for two different time periods within the same study area. Compared with methods reported in previous studies, our approach attains comparable accuracy while offering higher classification efficiency. Overall, the proposed method enables accurate PML identification from GF-2 imagery and provides a valuable reference for agricultural planning and ecological protection.

1. Introduction

Plastic mulch film is a technology widely employed in global agricultural production, serving to enhance soil temperature, retain soil moisture, suppress weed growth, reduce evaporation, and partially mitigate the impact of pests and diseases on crops [1,2]. It represents a critical technological means for increasing crop yield and ensuring food security. Since its first application in agriculture in 1950s [3], plastic mulch film has been adopted in agricultural systems worldwide over the past seven decades [4,5]. During the 1980s, the area of farmland covered with plastic mulch expanded significantly, emerging as a large-scale land cover type and continuing to grow at an annual rate of nearly 20% across the globe [6,7]. China, as the largest user of plastic mulch film, now has a mulched area exceeding 25 million hectares [5], accounting for 68% of the world’s total plastic mulch coverage [8]. Approximately 2.6 million tonnes of plastic film accumulate annually as a result [9,10]. In dryland agricultural systems, areas under plastic mulch account for nearly half of crop production and thus play a crucial role in maintaining food security.
However, despite its agronomic benefits, multiple studies have documented environmental risks associated with plastic mulch. By altering surface albedo, mulch disrupts surface–atmosphere energy and moisture exchanges and can affect local climate [11,12]. Thin polyethylene films (about 0.006–0.010 mm) [8] rupture during removal and, because polyethylene is highly resistant to biodegradation, residues accumulate in soil [13,14,15], reducing fertility and impairing seedling emergence and root development [16,17,18]. Retained film is also a source of micro- and nanoplastics that can disperse through soils and watersheds, exacerbating pollution as agricultural use expands [19,20,21]. Regulatory controls on mulch application are therefore warranted.
Remote sensing technology, capable of acquiring quantitative and qualitative information over extensive areas in a timely and efficient manner, serves as a vital tool for the identification and extraction of plastic mulch film (PML). Researchers have developed various spectral indices, such as the Plastic Mulch-Like Index (PMLI) [22], the Plastic Greenhouse Index (PGI) [23], the Adaptive Plastic Greenhouse Index (APGI) [24], and the Adaptive Plastic Mulch Index (APMI) [25], to facilitate PML extraction. Although such spectral index-based methods enable rapid detection of PML, their application is subject to several limitations. First, they often impose high requirements on the availability of specific spectral bands. For instance, the APGI relies on the coastal aerosol band for calculation, making it difficult to apply to Landsat TM and ETM+ imagery. Second, the representational capability of spectral indices is highly influenced by PML properties-both the color and thickness of the plastic mulch significantly affect the extraction performance.
To overcome the limitations of spectral indices, an increasing number of studies have turned to machine learning (ML) for PML extraction. This approach mitigates the constraint of insufficient spectral bands and has achieved promising classification results across a variety of satellite imagery, including MODIS [26,27], Landsat-5 TM and Landsat-7 ETM+ [26,27], Landsat-8 OLI [25,28,29], Sentinel-2 [30,31], WorldView-2 [32], and GF-1 [33], which offer relatively rich spectral information. For example, Lu et al. [34] utilized MODIS time-series data and the normalized difference vegetation index (NDVI), combined with a thresholding model based on temporal changes in the spectral characteristics of greenhouse films, thereby improving extraction accuracy based on spectral traits. Similarly, satisfactory results have been obtained even with imagery containing fewer spectral bands, such as QuickBird, IKONOS [35], and GF-2 [36]. Gao et al. [37], for instance, employed spectral and textural features from GF-2 images and extracted PML using models including random forest (RF), CART decision tree, and support vector machine (SVM), finding that the RF algorithm achieved the highest classification accuracy of 89.65%. The incorporation of additional features, such as texture characteristics and more spectral indices [33], has further enhanced PML extraction accuracy. Wu et al. [36] computed texture features using different algorithms and demonstrated that image texture could significantly improve PML recognition accuracy.
Although machine learning has advanced PML extraction, many studies have relied on pixel-based classifiers that introduce substantial uncertainty [5]. This uncertainty stems from the translucent nature of PML, which produces mixed spectral signatures of film and underlying soil or vegetation and increases spectral variability, thereby generating a salt-and-pepper effect and lowering classification accuracy [38]. Object-based methods first segment the image into homogeneous objects and then classify those objects, thereby reducing noise from spectral mixing and producing more spatially coherent and accurate maps [38]. At the same time, deep learning has increasingly improved PML discrimination. Early CNN-based methods addressed automatic feature extraction for pixel-level mulch/non-mulch classification; subsequent developments tackled practical challenges such as limited labeled data (via transfer learning), spectral confusion with plastic greenhouses, and multiscale mulch distributions. For example, Wei et al. [3] proposed PT-CNN, which combines spectral analysis with transfer learning and achieved F1-scores of 97.09% (white mulch) and 98.65% (black mulch). Feng et al. [39] developed DNCNN, integrating dilated convolutions and non-local modules to enhance spatial context; this model reached overall accuracies of 89.6% and 92.6% at two sites, with its key modules contributing accuracy gains of 2.0–2.7%.
Several factors may undermine the accuracy of PML extraction: (1) as the mulching film is transparent and spectrum of some thin films is close to that of the mulched field, there are often errors in classification based on spectral features; and in particular, pixel-based PML extraction is susceptible to impulsive noises; (2) because in some cases, the film is not deployed continuously in large areas, such as flue-cured tobacco transplant mulching and mulching of potato fields, where there are narrow gaps between the mulching films. These gaps should, in principle, be classified as PML, but the differences in the spectral features and texture features may also result in impulsive noises; (3) in some cases, there are large built-up areas close to the mulched region, and the assorted ground objects in the built-up area complicate the spectral and texture features, resulting in strong disturbances in PML extraction based on these features and reducing the extraction accuracy. Mixed-pixel effects continue to pose a major challenge for PML classification. Although methodological advances in classifiers have partly mitigated these issues and improved PML extraction accuracy, the persistence of mixed pixels means that they remain a key obstacle. From the sensor perspective, increasing spatial resolution is the most direct way to reduce mixed-pixel contamination. The advent of high-spatial-resolution sensors such as GF-2 has therefore provided important data support for improving PML recognition. However, despite the common practice of combining original spectral bands with texture metrics and spectral indices, most spectral indices used in previous studies depend on shortwave infrared (SWIR) bands [22,23,24,40,41]. These indices perform well for Landsat and Sentinel-2 imagery but cannot be applied to GF-2, which lacks SWIR channels. Consequently, GF-2 classifications are deprived of spectral-index features that strongly delineate PML, which may lead to reduced classification accuracy. Meanwhile, because GF-2 offers substantially higher spatial resolution, PML extraction using GF-2 requires orders-of-magnitude more computation compared with Landsat and Sentinel-2. This dramatically increases computational cost and hinders the scalability and practical deployment of the methods.
To meet this need, we developed an object-based PML identification method tailored to GF-2 imagery. The approach operates at the object scale and exploits the most PML-sensitive spectral and texture features that can be derived from the available GF-2 bands. Compared with previous methods, our approach enables GF-2 imagery with relatively few spectral bands to exploit the available spectral information to better characterize PML, thereby improving identification accuracy and overcoming the limitation imposed by the absence of SWIR bands. Prior to classification, GF-2 data were preprocessed (radiometric calibration, atmospheric correction, and pan-sharpening between the panchromatic and multispectral bands), and training samples were generated. We then derived the spectral and texture metrics required for classification from the preprocessed imagery and performed a selection procedure to retain the most informative texture descriptors. Image segmentation was carried out next, followed by object-based classification applied to the segmented objects, yielding the final PML map. The principal objectives of the study were: (1) to propose enhanced PML indicators suitable for GF-2 data; (2) to quantify the relative contribution of different feature types to PML extraction performance from GF-2 imagery; and (3) to identify the optimal combination of features for PML mapping using GF-2.
Our results indicated that including the second component of the K-T transform as an additional classification feature improved PML extraction accuracy. Spectral features derived from the GF-2 bands contributed most strongly to classification accuracy. The optimal feature set for object-based PML mapping with GF-2 was the four original GF-2 bands combined with the second component of the K-T transform and a reduced subset of texture measures. After selection, the texture set retained only G-Homogeneity, R-Entropy, B-Entropy, and G-Secondary.

2. Materials and Methods

2.1. Overview of the Study Area

The study area is located in southwestern China, within Yunnan Province. Our research encompasses Shilin County (Kunming; 103°10′–103°41′ E, 24°30′–25°03′ N), Zhanyi District (Qujing; 103°29′–104°14′ E, 25°31′–26°06′ N), Luliang County (Qujing; 103°23′–104°02′ E, 24°44′–25°18′ N), and Jinghong City (Xishuangbanna Prefecture; 100°25′–101°31′ E, 21°27′–22°36′ N), four study areas. The region is characterized by a subtropical plateau monsoon climate with dry winters and humid summers. Soils are predominantly red and yellow-brown, and the area benefits from fertile soils as well as abundant heat, light, and water resources, making it an important agricultural core of Yunnan. Method development was carried out primarily in Luliang, and the method was validated at Shilin, Zhanyi, and Jinghong. For this paper we used GF-2 imagery covering Shilin, Zhanyi, Luliang, and Jinghong, and selected subareas with dense plastic-mulch coverage as the analysis targets. The spatial distribution of the study sites is shown in Figure 1.

2.2. Image Acquisition and Pretreatment

This study used four GF-2 images that cover the four study areas. Two scenes, acquired on 10 April 2022, covered the Shilin, Zhanyi and Luliang study areas; the scene for Jinghong was acquired on 19 October 2022. Additionally, to assess the long-term stability of the method, PML extraction was repeated on a Luliang scene acquired on 23 November 2022. All images were obtained from the Natural Resources Satellite Remote Sensing Cloud Service Cloud Service Platform (http://114.116.226.59/english/home), accessed on 8 August 2024. Each scene had less than 5% cloud cover and contained no clouds over the study area. GF-2 imagery provides sub-meter spatial resolution and is acquired by two optical pan-and-multispectral (PMS) sensors with a swath width of 45 km. The imagery contains four multispectral bands, each captured at a spatial resolution of 4 m. A single panchromatic band is provided at a spatial resolution of 1 m. Visual interpretation shows that the area of mulching film distribution is recognizable and is suitable for accurate PML recognition.
To preclude the impact of atmosphere on the spectra of ground objects, radiometric calibration and atmospheric correction were performed on the original GF-2 data before PML recognition experiments. The calibrated parameters provided by the China Centre for Resources Satellite Data and Application were used for radiometric calibration to convert gray values to radiance values, and the calibrated results were used for atmospheric correction by the FLAASH model. To obtain multispectral data of a high spatial resolution, the NNDifuse Pan Sharpening algorithm was employed to merge the panchromatic bands with the multispectral bands. Through these pretreatment steps, a high-resolution remote sensing map of the study area was obtained.

2.3. Technical Route

In existing works on PML recognition, some factors were found to affect the recognition accuracy: (1) as the mulching film is transparent, the mulched region shares similar spectral features to the mulched region; (2) there are built-up regions with more complex spectral and texture characteristics near the mulched area, which will affect the recognition accuracy; (3) pixel-based classification methods are susceptible to impulsive noises and hence may reach a reduced accuracy in PML extraction. To address these problems, we computed the spectral and texture features of the study area, selected the optimal texture features to avoid data redundancy, and performed K-T transform on the pretreated images to reduce disturbances from nearby built-up areas. By combining spectral features, the selected optimal texture features and results of K-T transform, the object-oriented classification method was employed in this paper to classify the study area and reach a higher accuracy of PML extraction. The technical route is shown in Figure 2.
We first preprocessed the GF-2 imagery and then performed pan-sharpening to produce 1 m spatial-resolution images. From these fused images we computed a suite of texture metrics and derived K-T transform components, and subsequently applied feature selection to identify an optimal subset of classification predictors. This procedure balanced classification accuracy against dimensionality reduction to mitigate the “curse of dimensionality” and to improve computational efficiency. Finally, we applied an object-based image analysis workflow and used a Random forest to map the spatial distribution of PML across the study area. We randomly generated 2000 samples across the study area for classification and accuracy assessment. After removing invalid samples, areas with uneven sample coverage were supplemented by visual interpretation. The final dataset comprised 1750 samples, of which 80% (n = 1400) were used for classification and the remaining 20% (n = 350) were reserved for accuracy assessment.

2.4. Fusion Algorithm

To make the best of the spectral features and spatial details of GF-2 images, image fusion of the panchromatic bands and multispectral bands of GF-2 images was performed. The NNDiffuse Pan Sharpening fusion method takes the spectral value of single pixels as the minimum unit, and generates fused images of an augmented resolution through the fusion model. This method would reserve complete chromatic and texture features of the original images, and keep the spatial and spectral features of the fused images largely unchanged [42]. Therefore, the method adopted in our experiments could fuse the visible-light bands and panchromatic bands of GF-2 images, and generate multispectral bands (blue/Green/Red/NR) with a spatial resolution of 1 m.

2.5. Texture Feature Calculation and Optimal Feature Selection

When using GF-2 data for PML detection, Wu et al. [36] pointed out that texture features provided a solution to the unsatisfactory accuracy of spectral feature-based PML detection that is attributable to the complexity of spectral features of GF-2 images. The gray-level co-occurrence matrix (GLCM) texture feature extraction algorithm proposed by Haralick et al. [43] would generate co-occurrence matrices of different spatial structures and textures in regions of interest, and differentiate spatial structures in the region by indicators including mean, variance, homogeneity, contrast, information entropy and correlation. To secure clear texture features in our experiments and reserve texture information of the original image, the size of the sliding window was set at 5 × 5, the gray level at 64, and the variation of the spatial correlation matrices X and Y at 1. Eight indicators (mean, variance, homogeneity, contrast, heterogeneity, information entropy, secondary moment, correlation) were computed to obtain eight texture features for each band of the GF-2 images, and a total of 32 groups of texture features were obtained. To remove redundant information without sacrificing the classification performance, dimensionality reduction of the obtained features was performed using the ReliefF algorithm. By computing the hypothesis margin of the training samples, the ReliefF algorithm classifies the features and assesses their contribution, assigns a weight of classification power to each feature, and a larger weight indicates a stronger power of classification [44]. The ReliefF calculation formula was defined as
θ = 1 2 ( x M ( x ) x H ( x ) )
Here θ denotes the maximum distance by which the classification decision boundary can be displaced without changing the class label of the sample. H ( x ) and M ( x ) are the nearest intra-class and inter-class neighbors of the sample x , respectively.
Based on previous studies, common selection criteria include retaining features with weights greater than zero or keeping the top 50% by weight. However, because the GF-2 imagery has a small pixel size, including a large number of texture features greatly increases classification time. Hasituya’s [28] work indicated that although the introduction of texture features does improve PML classification accuracy, the magnitude of accuracy gain is not positively correlated with the number of texture features. In other words, increasing the number of texture features raises computational time but does not produce a corresponding improvement in accuracy. Consequently, we adopted a stricter selection criterion than the conventional benchmarks. The retention threshold was defined as
w t h = w m a x 0.25 × ( w m a x w m i n )
Here, w t h   denotes the weight threshold, w m a x is the maximum weight obtained, and w m i n is the minimum weight obtained.

2.6. K-T Transform

Kauth–Thomas (K-T) transform, an orthogonal linear transform, was first proposed by Kauth et al. [45] who was studying the temporal development of agricultural crops. It can be considered as a principal component transform with fixed coefficients, which generates new principal components through multi-dimensional rotations to reduce the data dimensionality [46]. The initial K-T transform coefficient was established based on features of MSS images for the transform of the green band, the red band, and two near-infrared bands in the MSS images. This coefficient, however, does not apply to GF-2 images. Yang et al. [47] compared the band parameters of GF-1 and IKONOS and, because their spectral ranges are highly similar, suggested that the IKONOS K-T transform coefficients proposed by Horne (2003) [48] (Table 1) could be applied to GF-1 imagery. Their study confirmed the validity of this application. The spectral ranges of GF-1 and GF-2 are identical, and therefore the spectral range of GF-2 is also highly similar to that of IKONOS (Table 2). We thus argue that applying the IKONOS K-T transform coefficients to GF-2 imagery should yield comparable results.
The second component of the K-T transform for GF-2 imagery is computed as follows:
T C 2 = B l u e × 0.509 + G r e e n × ( 0.356 ) + R e d × ( 0.312 ) + N i r × 0.719
Here, T C 2 denotes the second component of the K-T transform, and Blue, Green, Red, and N i r refer to the corresponding spectral bands of the imagery.

2.7. Image Segmentation

Pixel-based classification would discard the correlations between neighboring pixels, and the overall geometric structure of patches would reduce detection accuracy and incur impulsive noises [50]. To solve these problems, the object-oriented classification technique was used, which reserved the spectral, texture features and K-T transform results, and meanwhile improved the spatial correlation and semantics of the classification results, thereby improving the PML recognition accuracy.
The multiresolution segmentation algorithm is the most popular option for image segmentation, which merges similar pixels into a set based on such features as spectral, textural, spatial, contextual information and aspect ratio [50]. In this study, spectral features, texture metrics, and the second component of the K-T transform were combined into a multi-band image that served as input to multiresolution segmentation (MRS). Image segmentation was carried out in eCognition 9.0. Segmentation parameters were obtained in an unsupervised manner using the Estimation of Scale Parameter 2 (ESP2) tool.

3. Results

3.1. Classification Feature Selection Results

To avoid reduced classification efficiency caused by an excessive number of predictors while preserving high accuracy, we applied feature selection to reduce dimensionality. The candidate features comprised three groups: the original image bands, derived texture measures, and components from the K-T transform. We deliberately did not reduce the original spectral bands because GF-2 provides only a few multispectral channels, which limits the number of computable indices; moreover, there is no consensus in the literature that any derived index from these limited bands consistently enhances PML discrimination, so all original bands were retained.
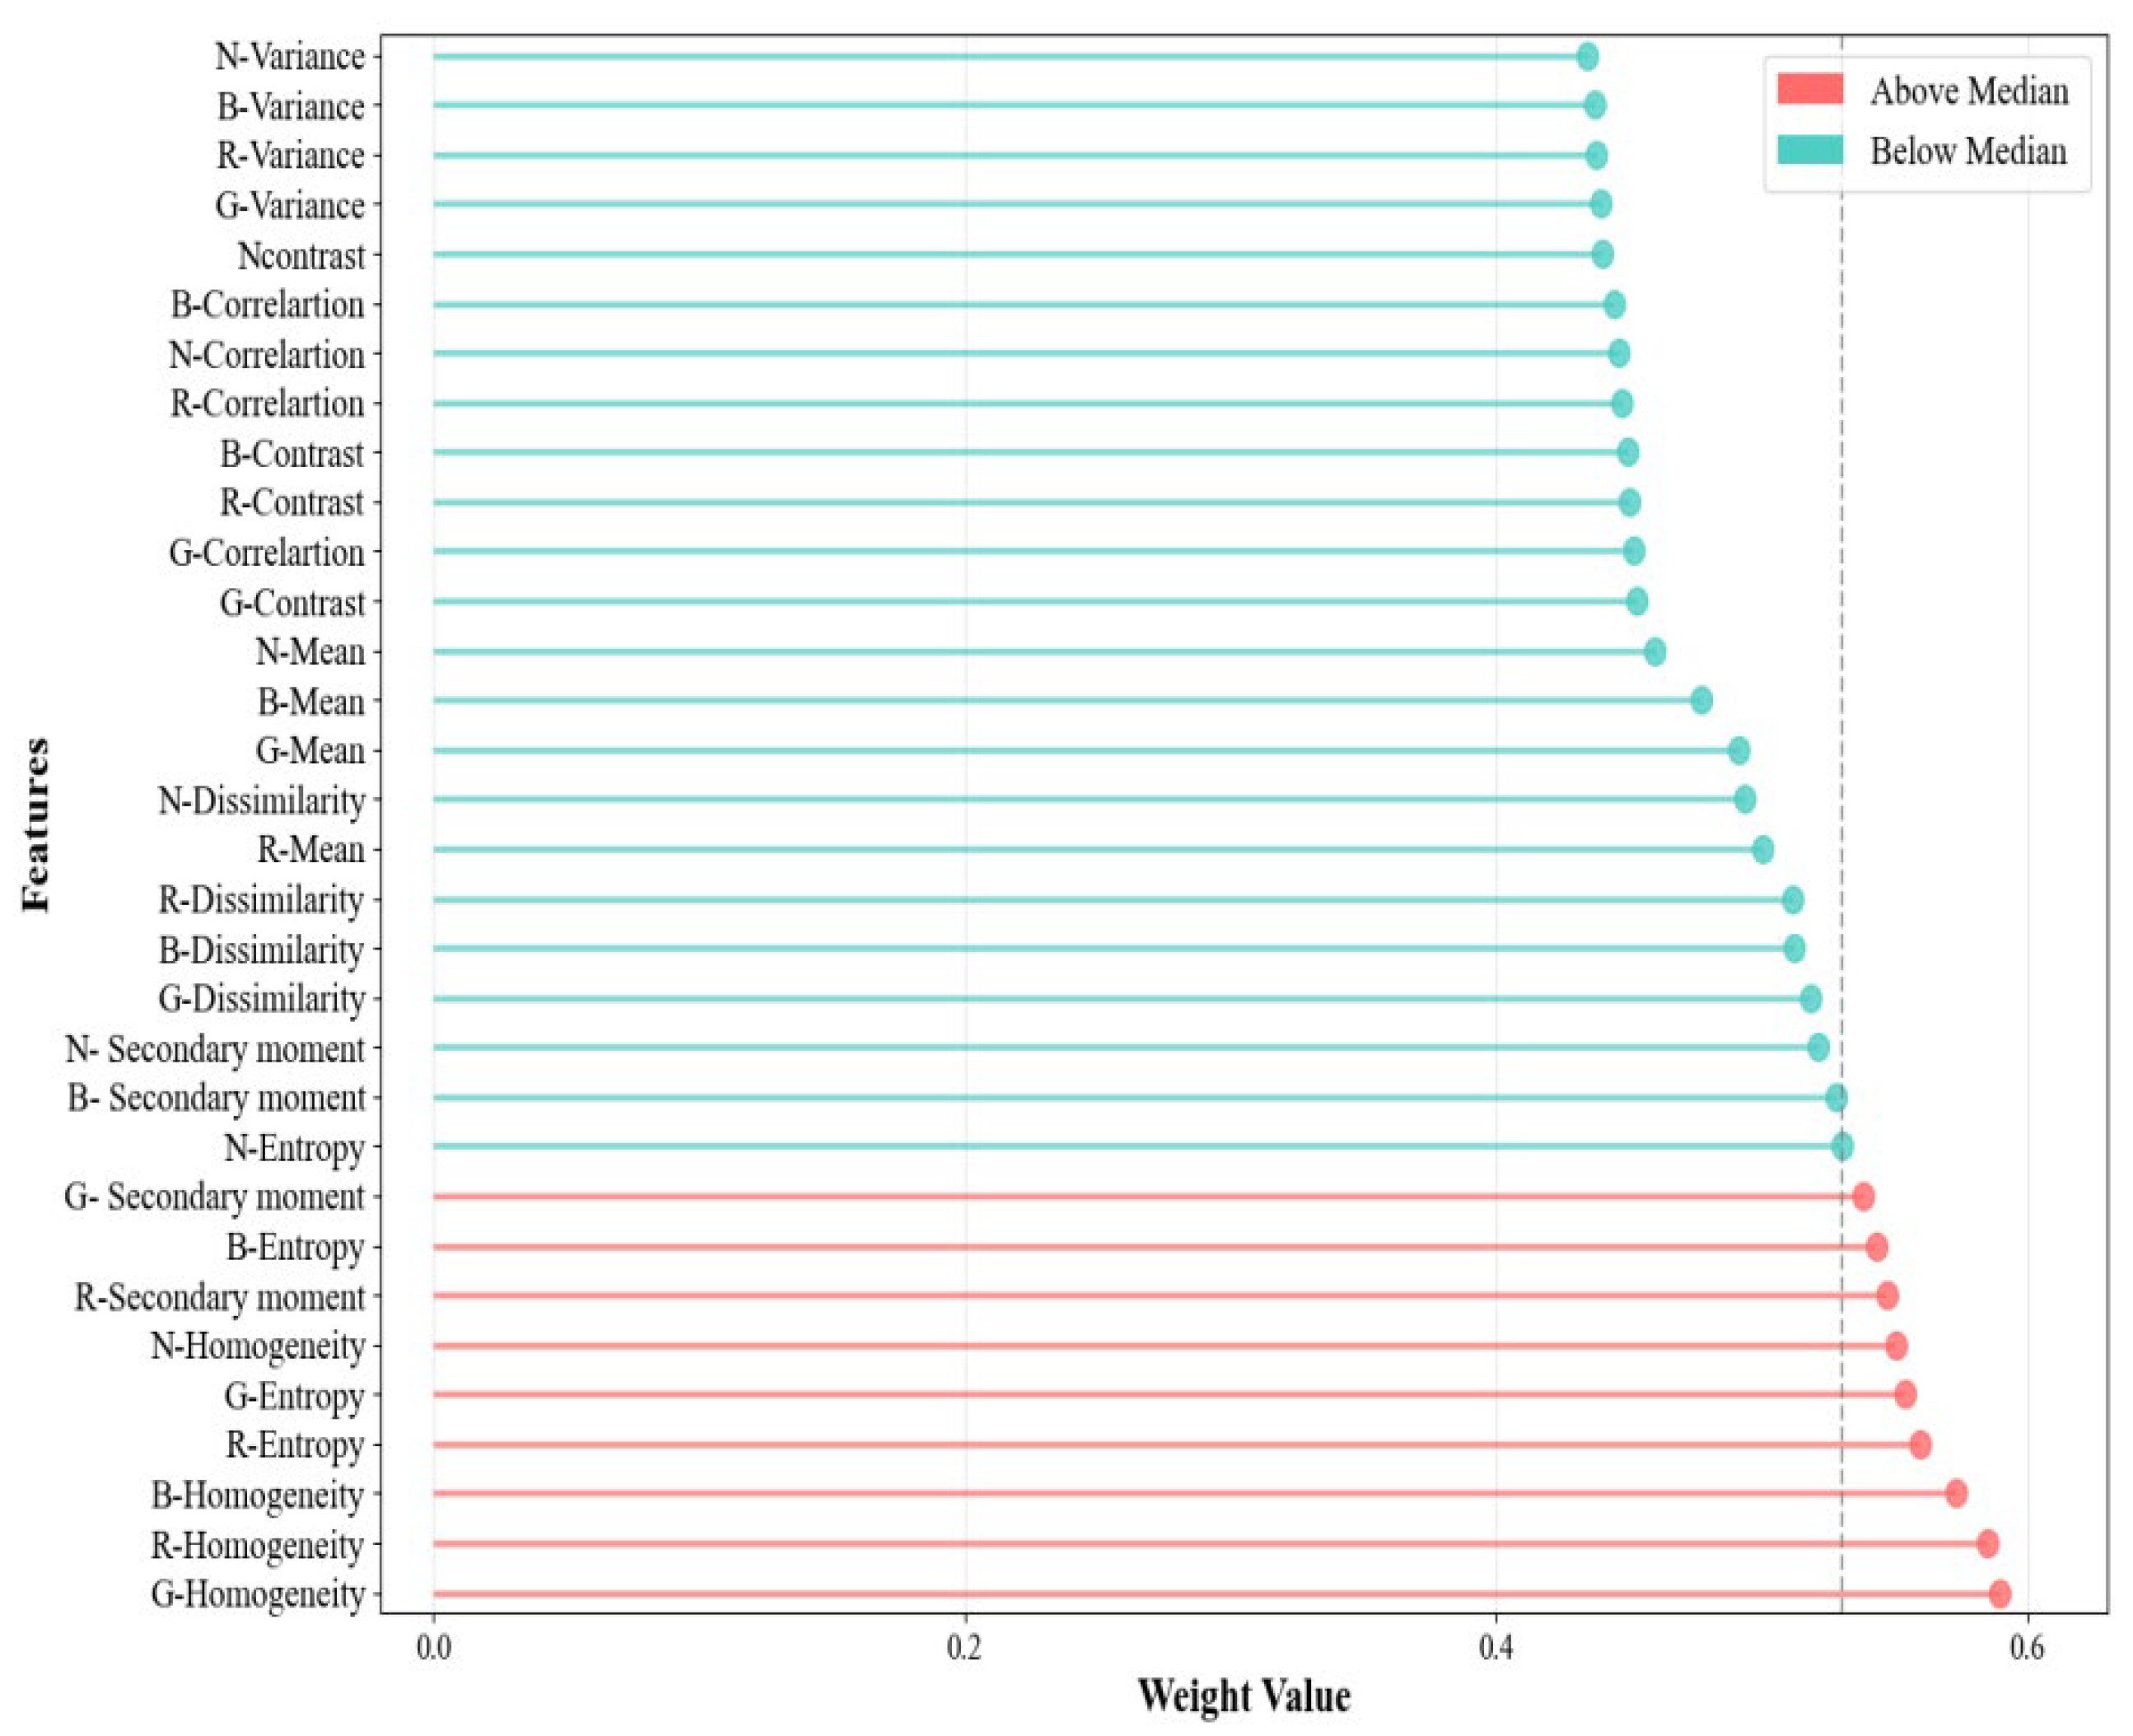
Texture features were ranked and screened using the ReliefF algorithm. The extraction threshold was set at 0.53. This selection strategy balanced feature parsimony and discriminative power, improving computational efficiency while maintaining classification performance.
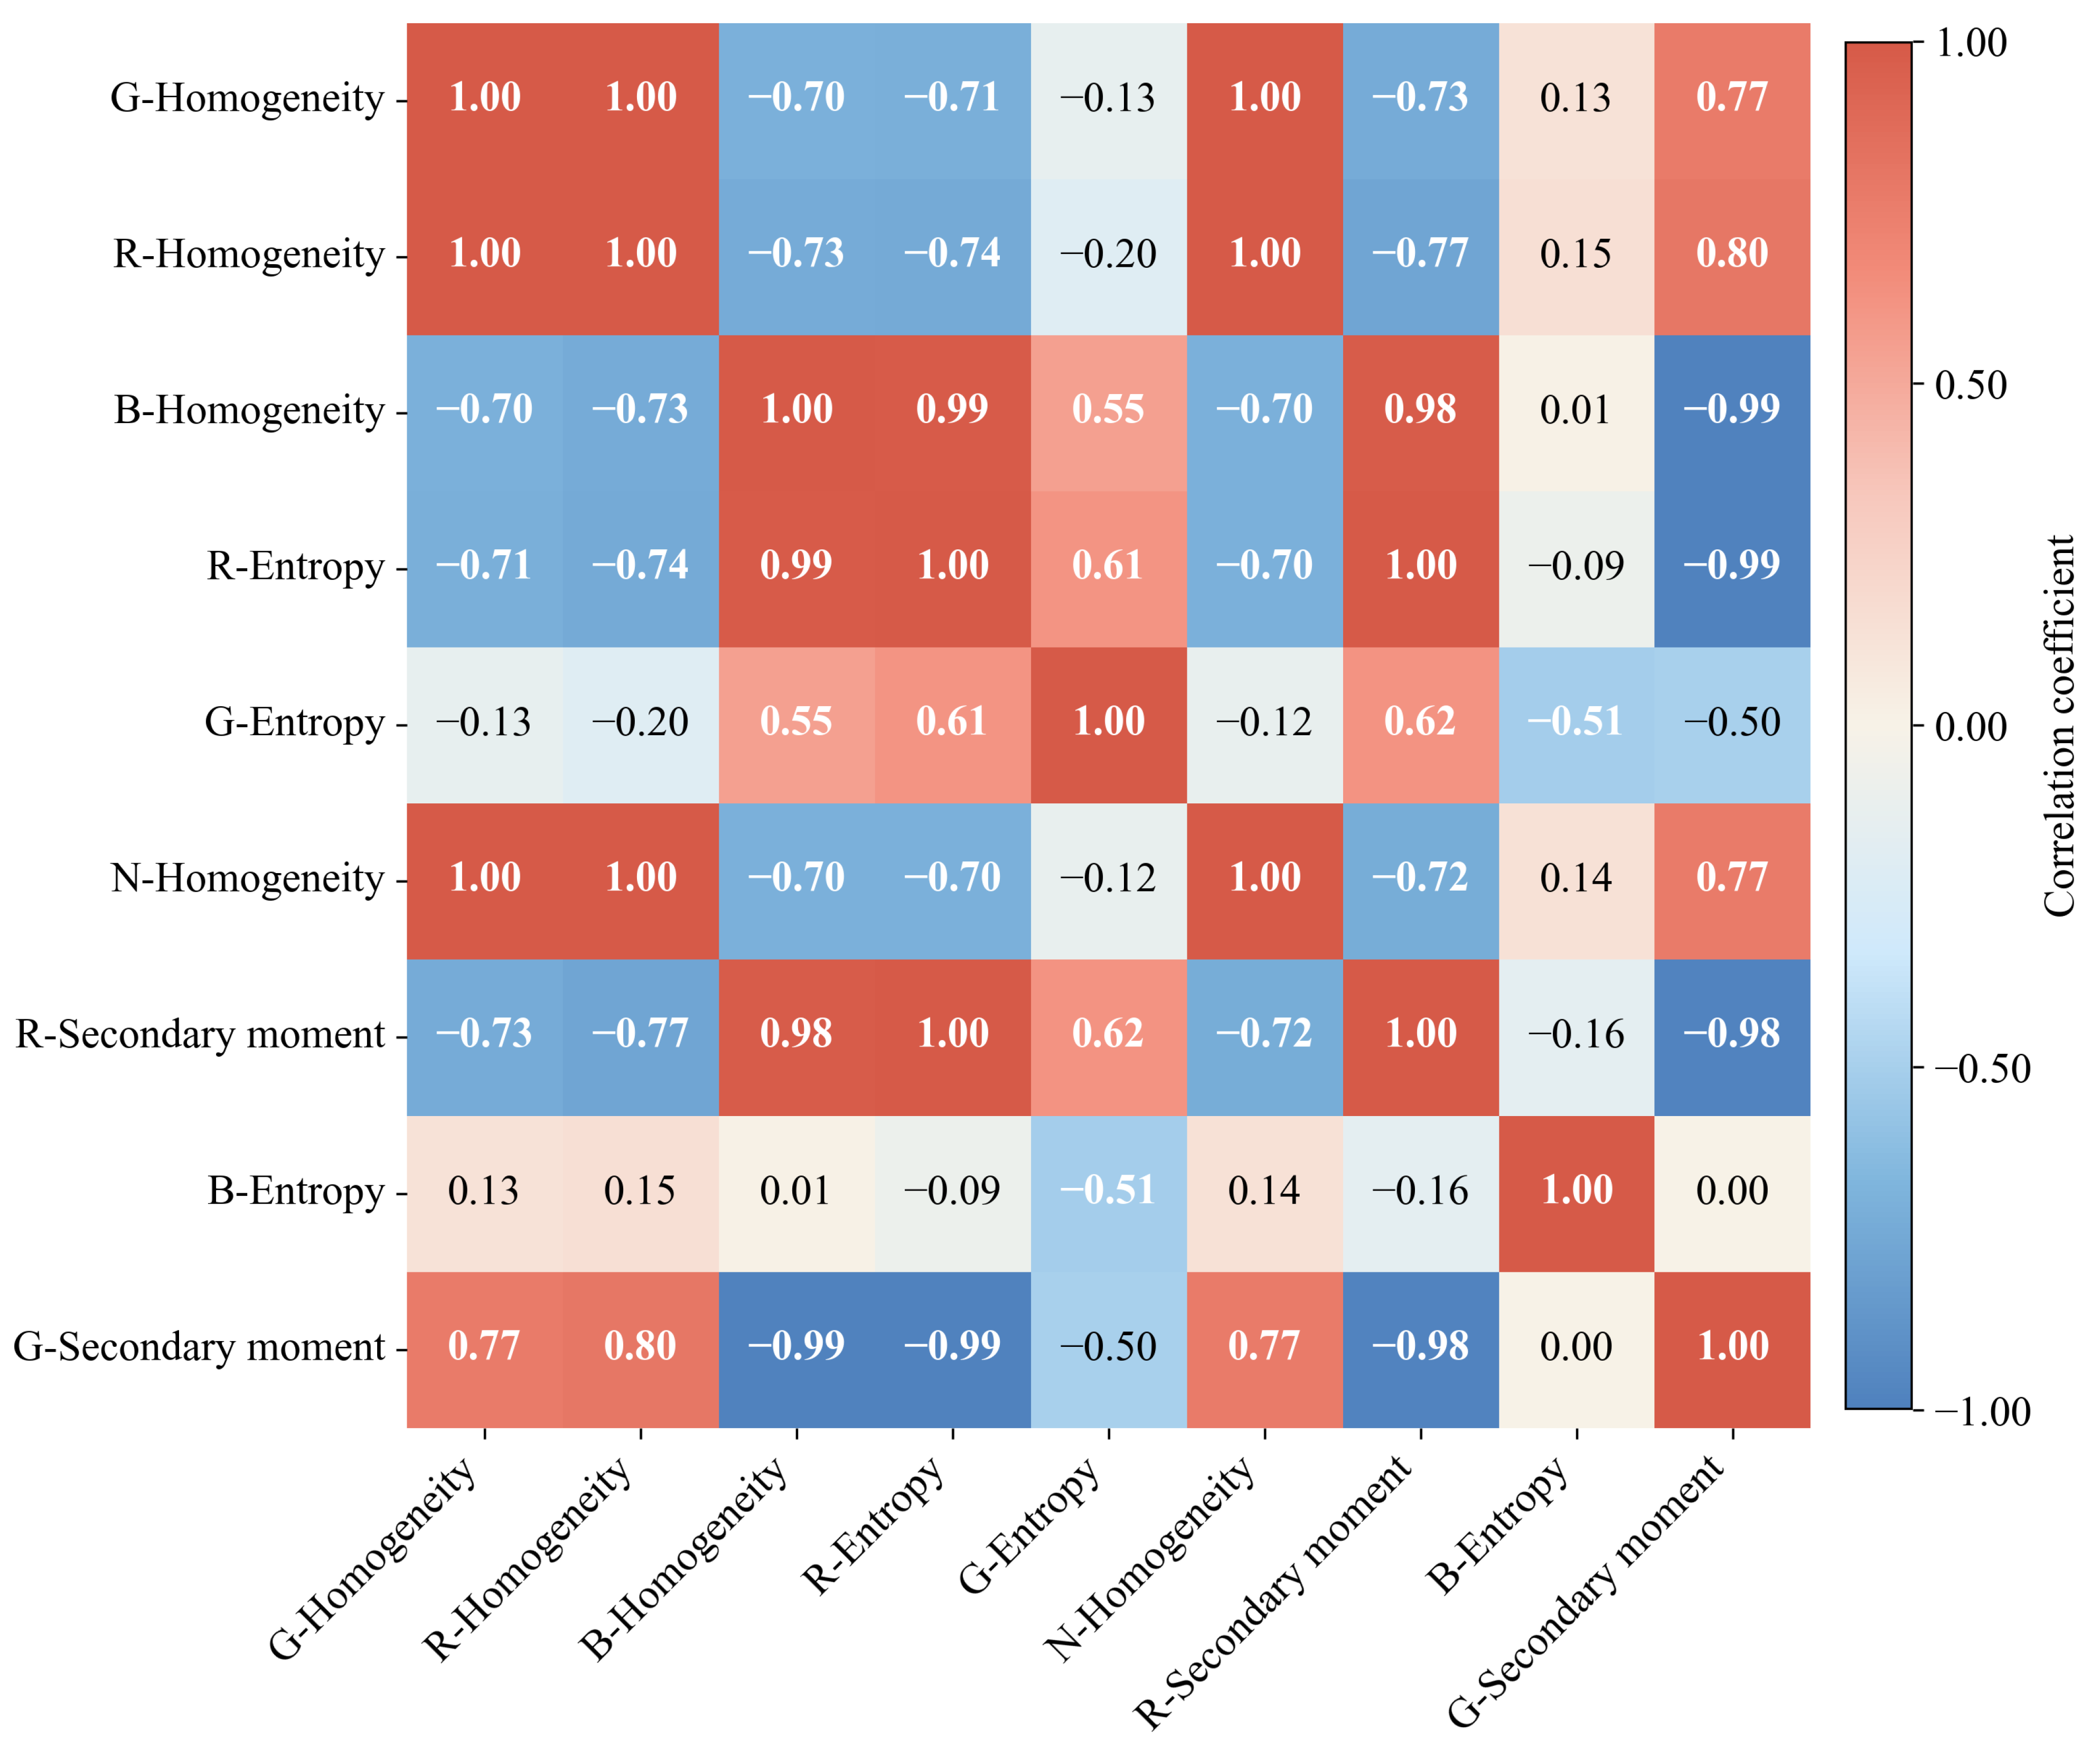
As Figure 3 shows, the nine extracted texture features (G-Homogeneity, R-Homogeneity, B-Homogeneity, R-Entropy, G-Entropy, N-Homogeneity, R-Secondary moment, B-Entropy, G-Secondary moment) could represent features with rich information and improve accuracy, but there were possible information overlaps between these features, which would result in data redundancy and lower the speed of data processing. Thus, the Pearson’s correlation method was employed to re-filter the extracted features to obtain texture features of low inter-feature correlations. A lower correlation between features means less data redundancy and higher data processing efficiency. The correlation coefficients between the nine features were calculated (Figure 4).
Through the ReliefF algorithm and the Pearson’s correlation analysis, the texture features were filtered, and the texture features obtained at last with a high ReliefF weight and a low Pearson’s correlation coefficient had rich information but low data redundancy, which could ensure a high recognition accuracy and high computing efficiency in PML recognition. Therefore, four texture features, namely, G-Homogeneity, R-Entropy, B-Entropy, and G-Secondary moment, were selected in our experiments for PML recognition.
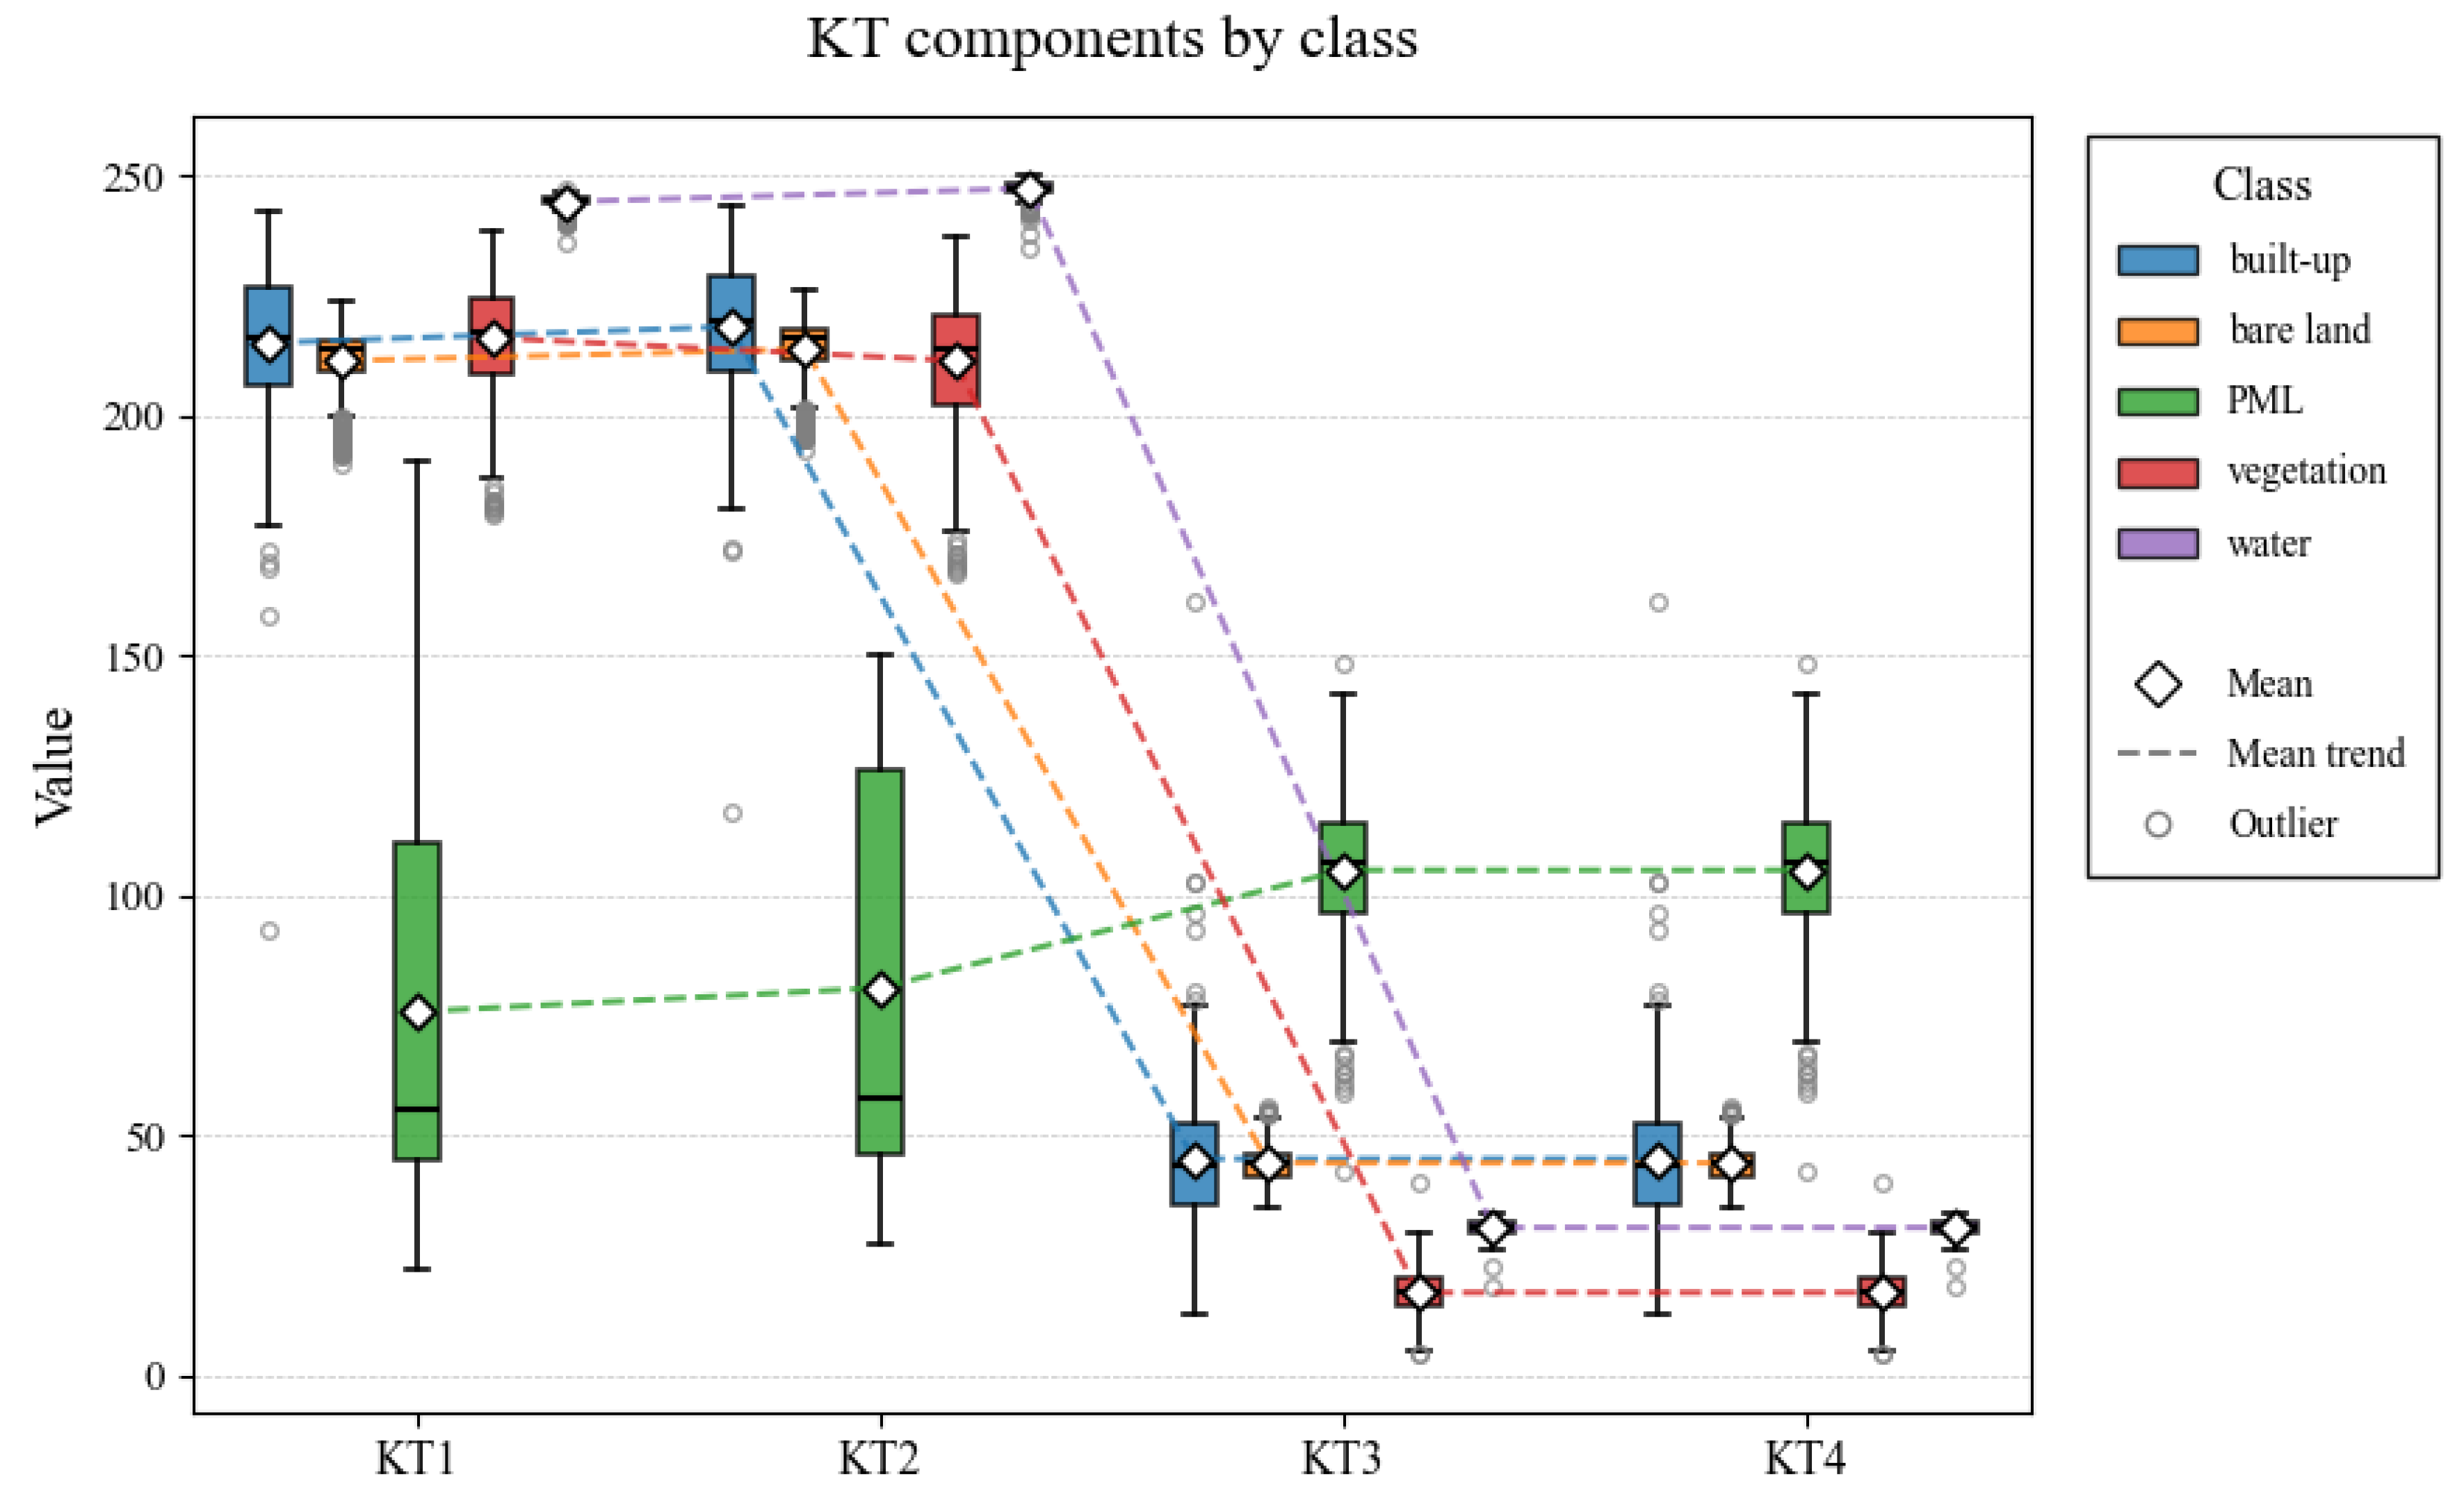
Because different K-T transform components vary in their ability to characterize land-cover types, we selected components according to their capacity to discriminate PML from other classes, using the magnitude of inter-class differences as the selection criterion. For this purpose, we drew 800 random samples from each of five land-cover categories in the imagery—buildings, bare land, water, vegetation, and PML—extracted their values for the various K-T components, and compared the components’ discriminative power. The results are presented in Figure 5.
As Figure 5 shows, the principal information in the images was in the first two components, so ground objects in these two components were highly distinguishable. However, observation showed that in the first two components of K-T transform, PML had a far smaller mean value than the other four ground objects. Although the first K-T component produced more tightly clustered values for PML than the second component, its value range overlapped substantially with those of several other land-cover classes. This overlap implies that using the first component to amplify PML signatures would also amplify many non-target classes, thereby degrading classification accuracy. Therefore, in subsequent classification experiments we used only the second K-T component as an input feature to the classifier. To ensure computing efficiency and avoid data redundancy, the second component of K-T transform was used in our work for PML recognition.

3.2. Classification Results

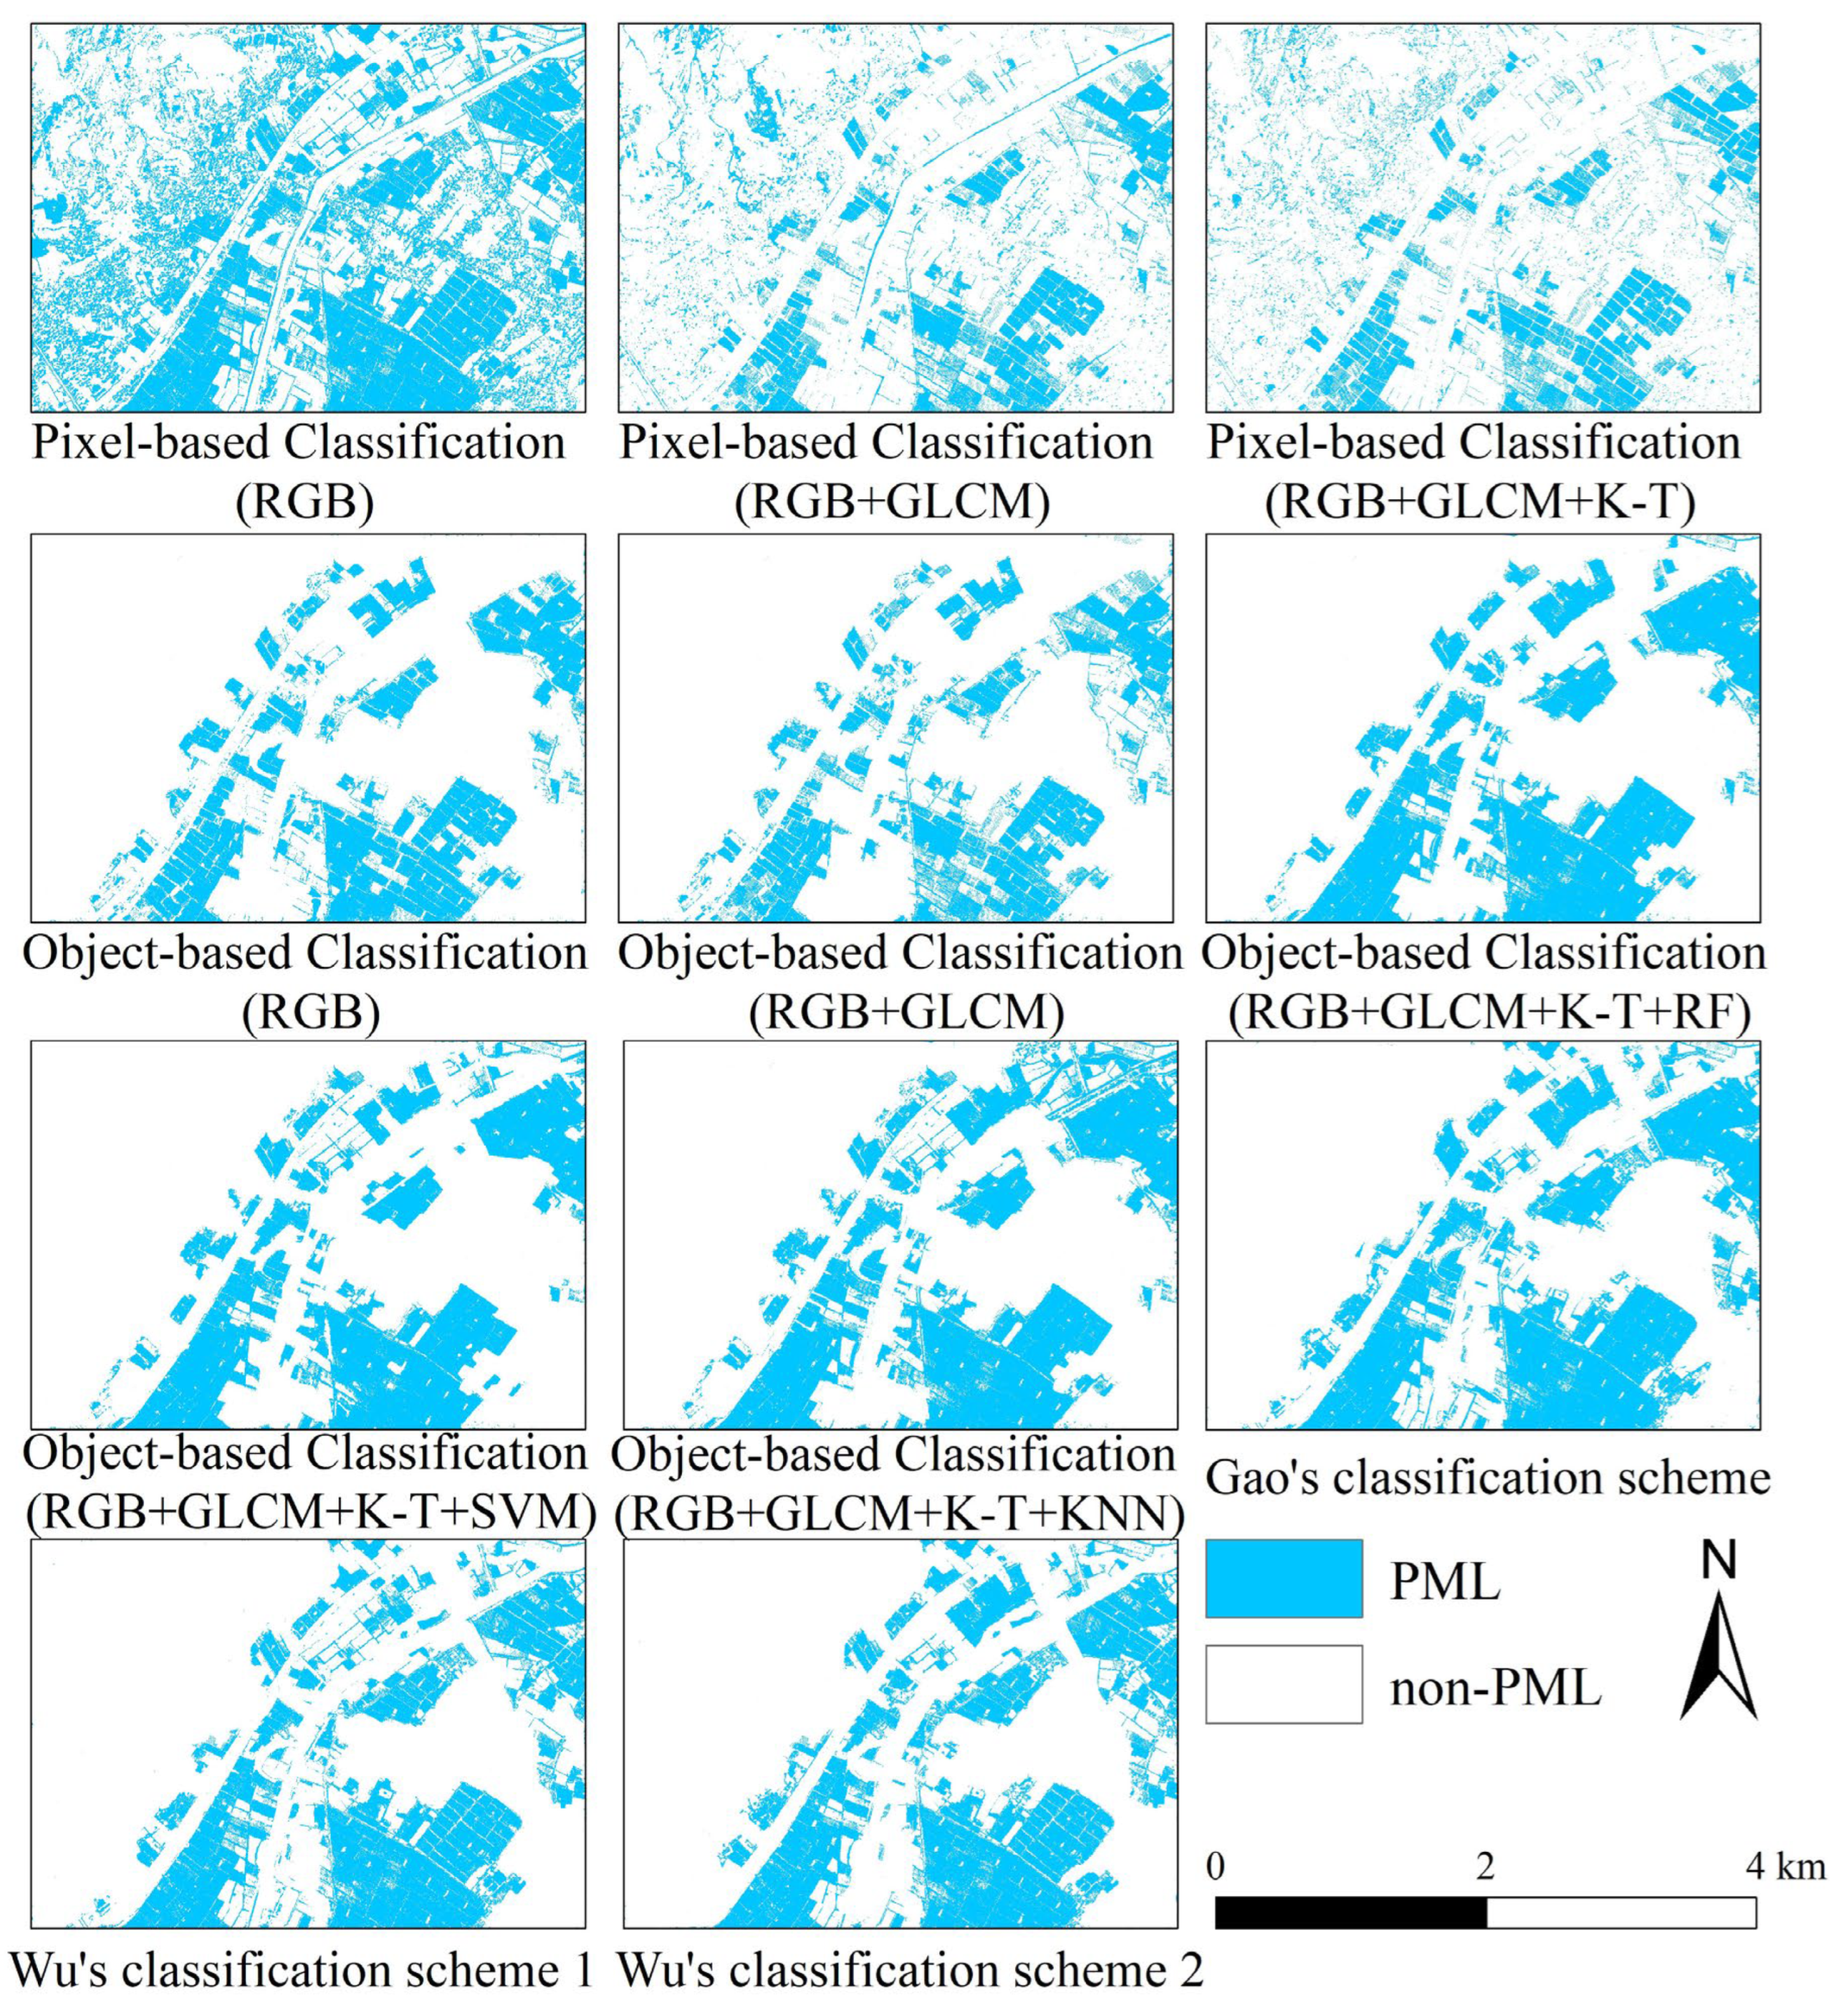
To validate the classification method and evaluate the recognition performance of different extraction models, we developed eight classification schemes, each applied to the original experimental data at the same spatial resolution. In addition, we incorporated the PML classification methods of Gao et al. and Wu et al. for comparison, yielding a total of 11 schemes for accuracy assessment. It should be noted that the object-based segmentation settings were kept identical across all tests. Table 3 shows the specific schemes and feature combinations.
In our work, three pixel-based classification schemes were implemented in ENVI 5.6, and all object-based classifications were carried out in eCognition 9.0. The study area was classified into mulched patches (PML) and un-mulched patches (non-PML). Figure 6 presents the original imagery used for classification together with the results of multi-scale segmentation, while Figure 7 displays the corresponding classification outcomes.
Visual interpretation revealed that among the three pixel-based classification schemes, the introduction of textural features and the second component of K-T transform significantly enhanced the recognition accuracy, but impulsive noises remained. Among the three object-oriented classification schemes, classification based solely on spectral features showed substantial errors, and large areas of un-mulched regions were misrecognized as mulched regions. Classification that combined spectral and optimal textural features misrecognized part of the built-up area as mulched landcover, whereas some mulched landcover was not recognized. The scheme that combined spectral, optimal textural features and the second component of K-T transform was the best scheme, which effectively suppressed disturbances from the built-up region and improved the recognition accuracy.

3.3. Accuracy of Different Classification Schemes

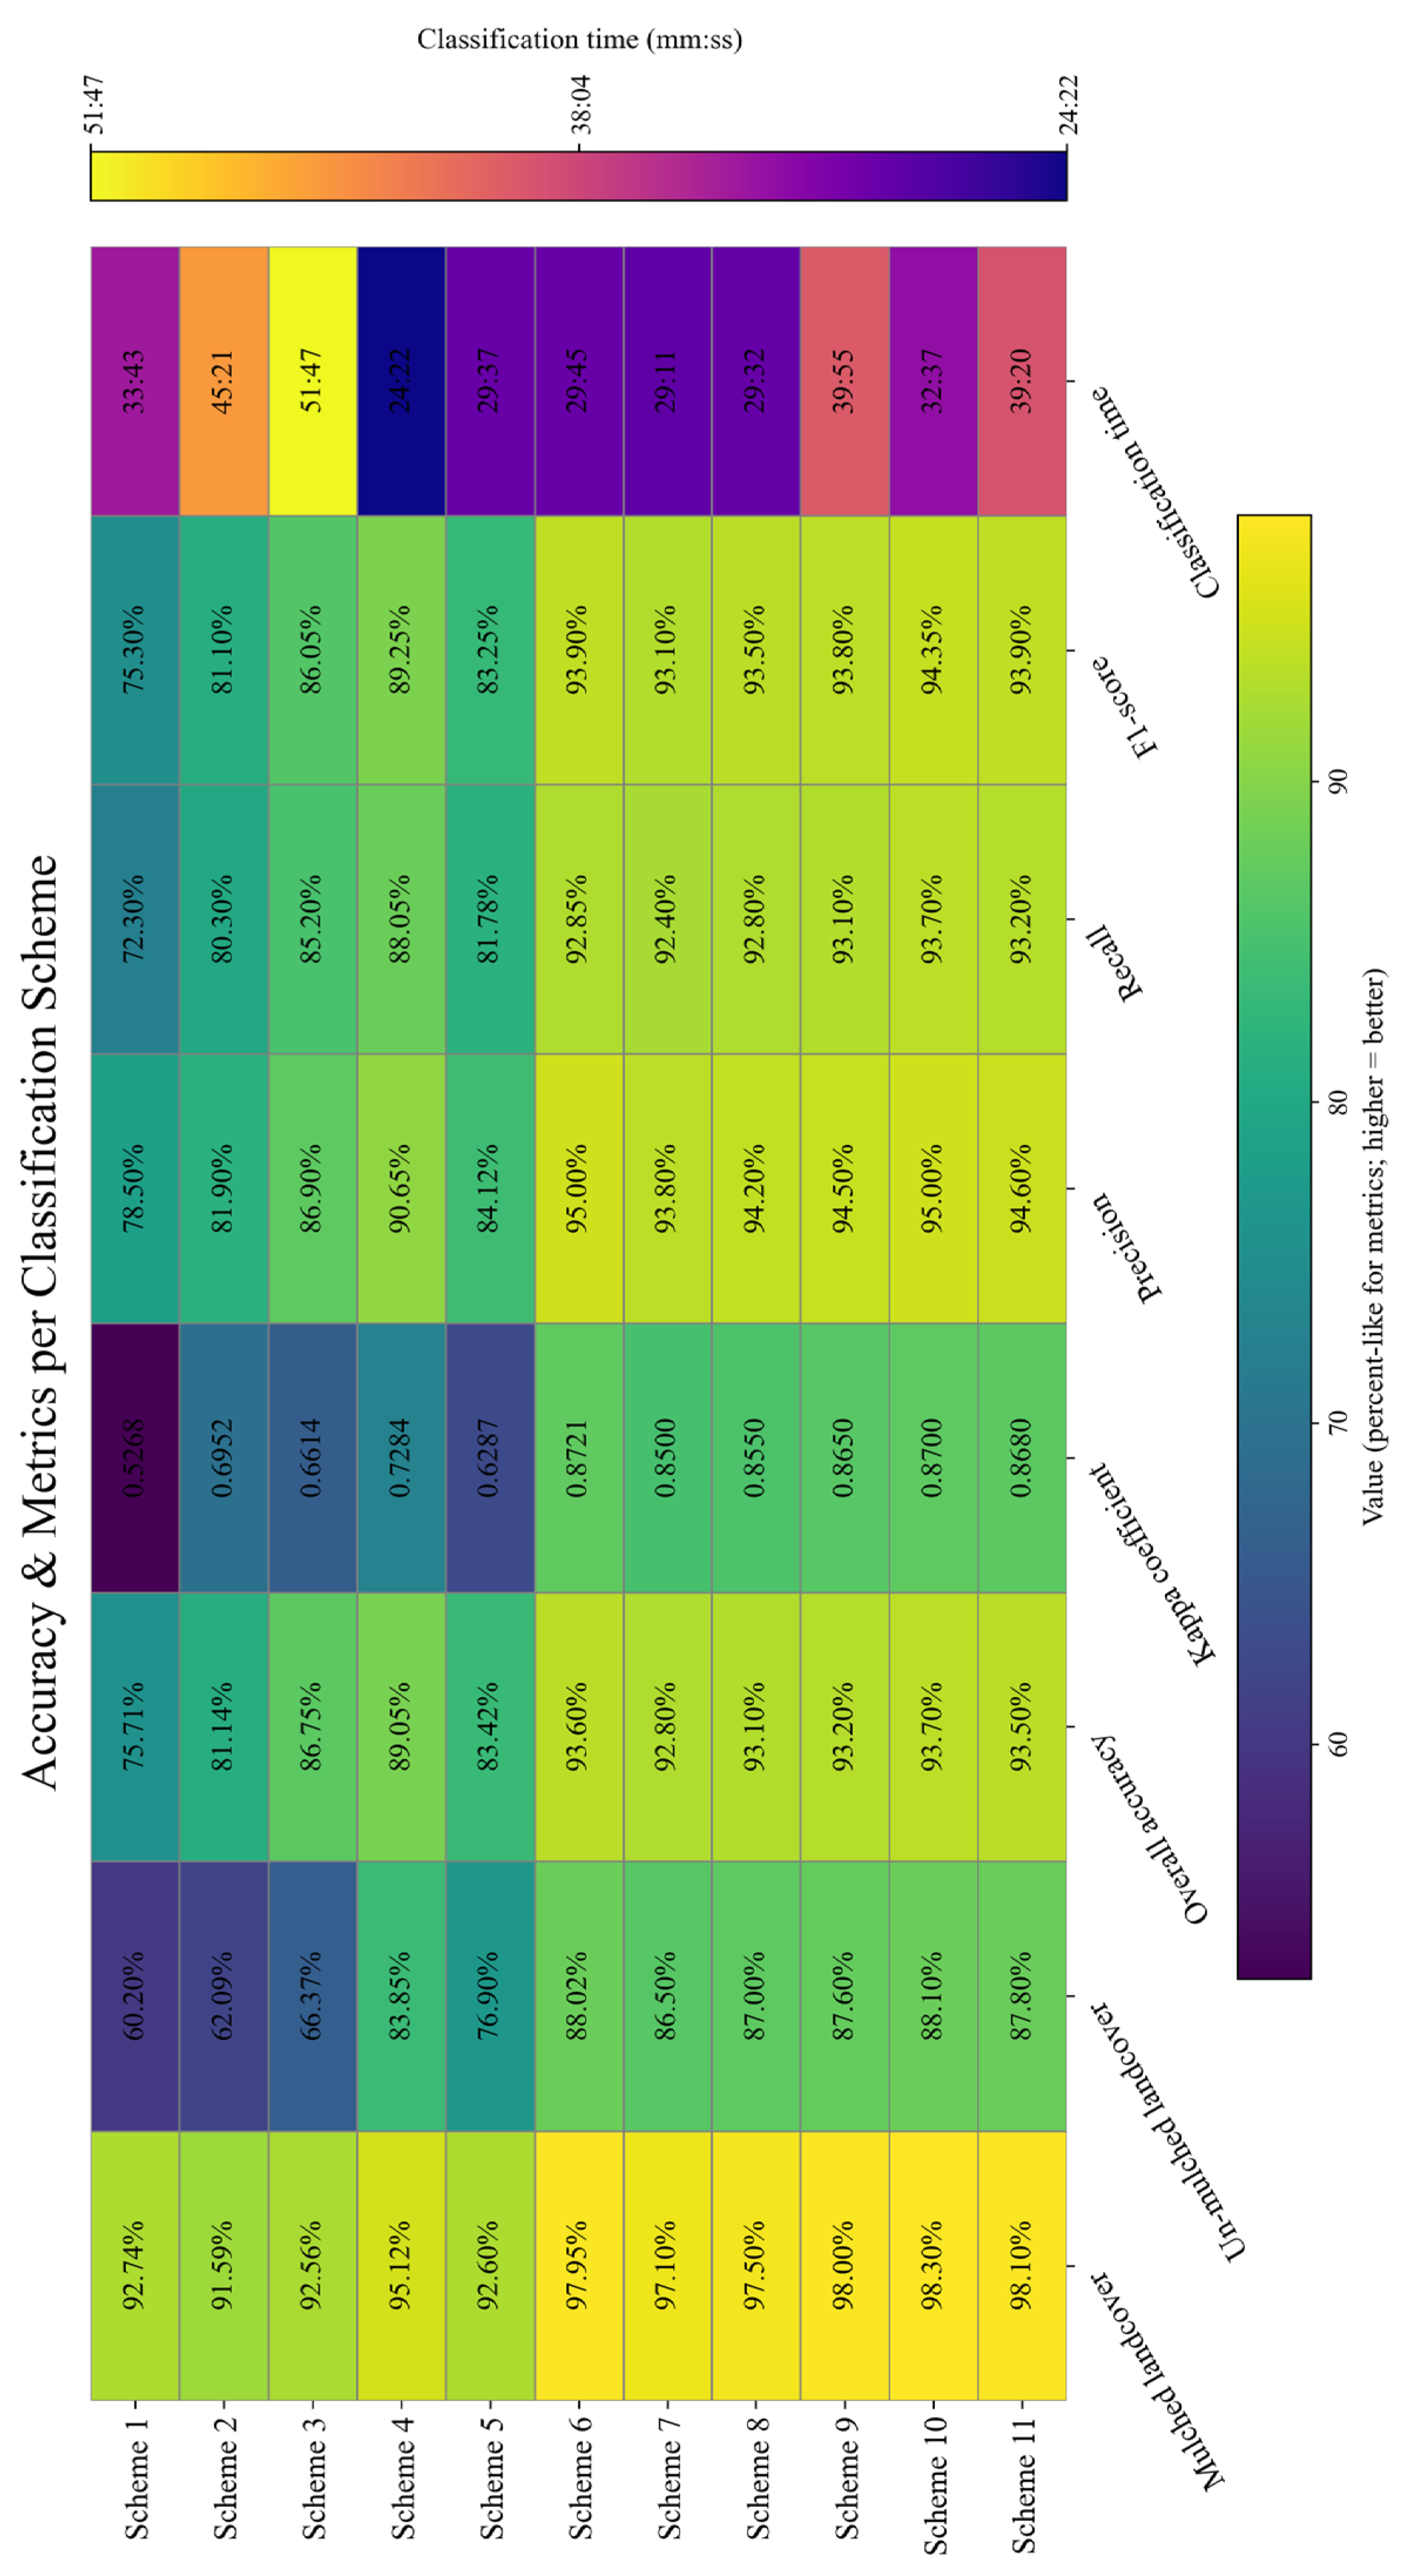
This study employed multiple accuracy assessment metrics to evaluate the results, including overall accuracy, precision, recall, F1-score, and the Kappa coefficient. The runtime of each method was also reported as an evaluation metric. The results are shown in Figure 8.

4. Discussion

In this study, we developed an object-based classification workflow that coupled spectral features, texture metrics, and components of the K-T transform to produce a high-accuracy PML recognition system using GF-2 imagery. The principal challenge was to derive discriminative features from GF-2’s limited spectral bands that would reliably enhance PML signatures; our work shows that the proposed feature construction strategy successfully met this challenge. We demonstrated that the second component of the K-T transform offers strong representational power for PML and provides high separability from other land-cover types. Moreover, integrating this K-T second component with conventional spectral and texture descriptors within an object-based framework substantially improved PML detection accuracy on GF-2 images. The approach is both user-friendly and reproducible, and it offers practical value for large-scale PML mapping and management. Authors should discuss the results and how they can be interpreted from the perspective of previous studies and of the working hypotheses. The findings and their implications should be discussed in the broadest context possible. Future research directions may also be highlighted. This work not only complements shortcomings in the existing literature but also proposes a novel remote-sensing-based approach for PML detection and management. Nonetheless, several limitations remain that warrant further refinement.

4.1. Rationality Demonstration of Method

We applied an object-based classification method to single-date GF-2 imagery to identify PML across primary agricultural production areas. The results showed that incorporating the second component of the K-T transform as a novel PML-enhancement indicator, together with an optimized feature set, produced higher accuracy within the object-based framework. The object-based approach effectively preserved the spatial structure of PML and enabled clear discrimination from other land-cover types.
The accuracy assessment results shown in Figure 8 indicate that the proposed classification method achieves robust accuracy across multiple classifiers. Furthermore, by adopting an object-based classification framework combined with feature selection, our approach attains substantially higher classification efficiency than pixel-based methods. In cross-method comparisons with techniques reported in the literature, our method achieves comparable accuracy while distinguishing itself through markedly greater classification efficiency.
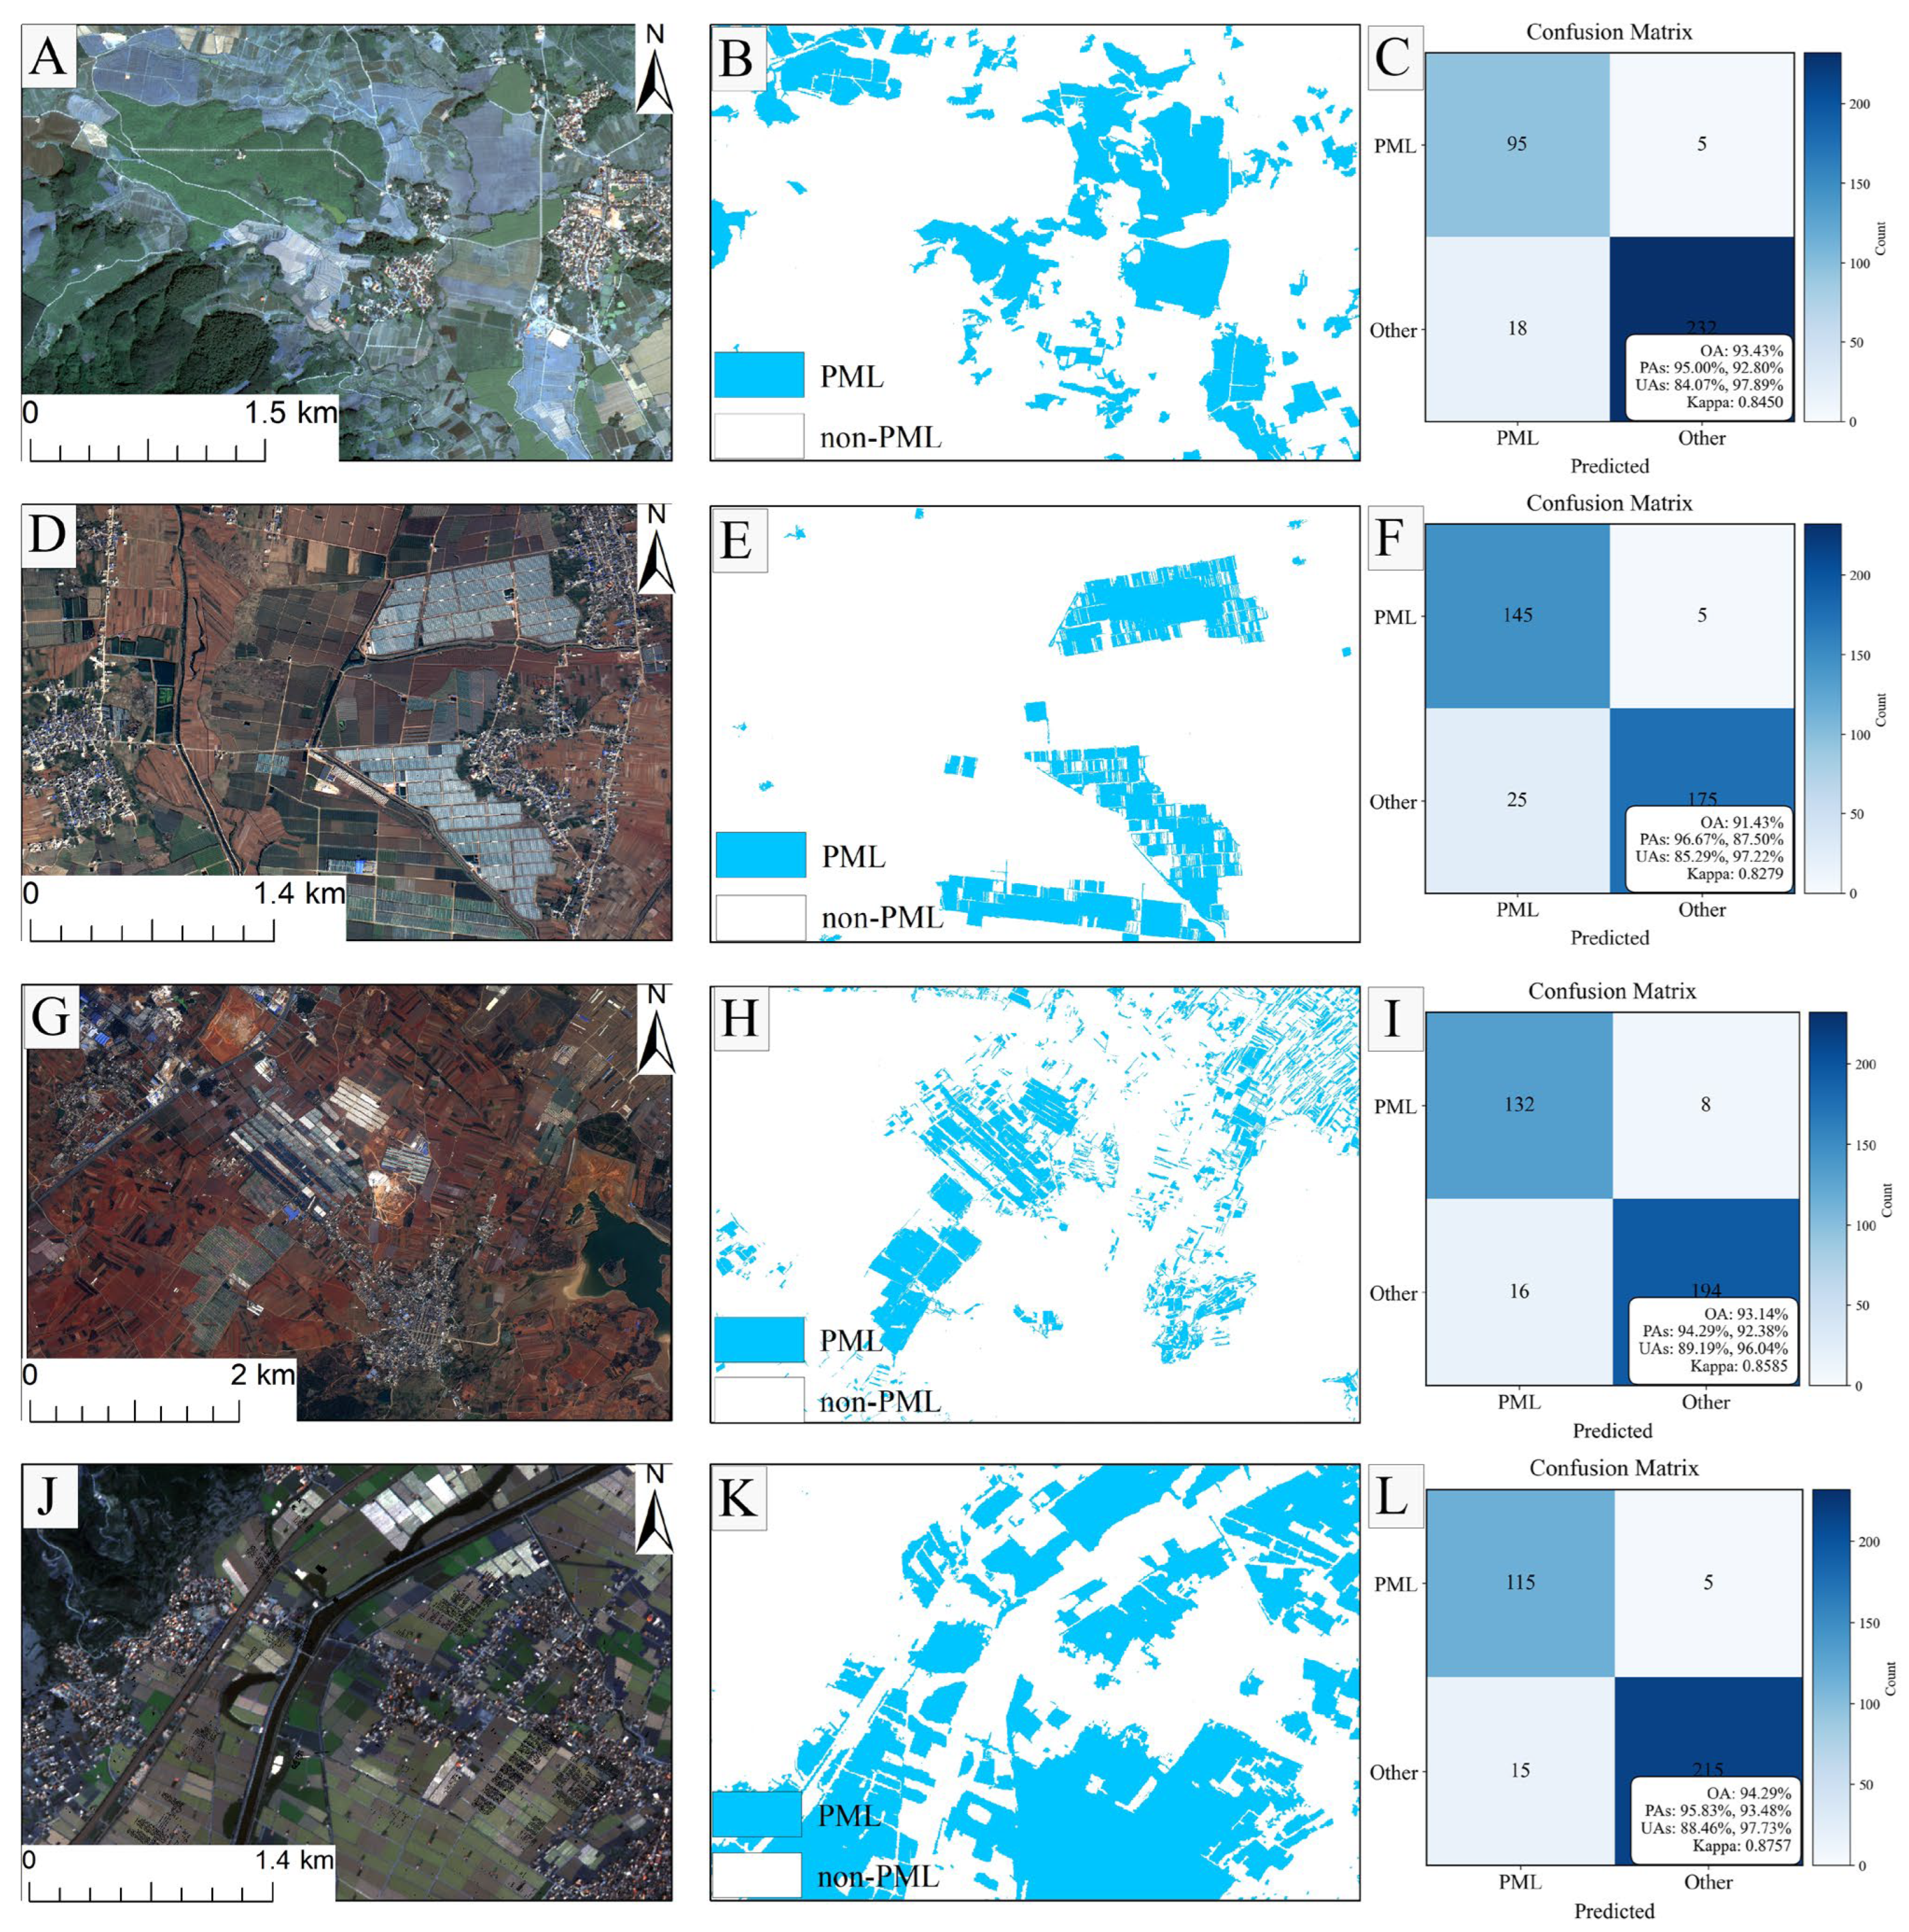
To evaluate the method’s transferability and seasonal stability, we applied it to Shilin County, Zhanyi District, and Jinghong City and conducted accuracy assessments. Additionally, to demonstrate seasonal stability, PML extraction was repeated on a Luliang scene acquired on 23 November 2022. The resulting classification maps and accuracy assessment results are presented in Figure 9.
The above results indicate that the proposed method demonstrates good generalization capability and temporal stability, with classification accuracies exceeding 90% in all four independent tests. Qualitative assessment via visual interpretation further confirmed that the spatial extent of detected PML closely matched the true distribution. Together, these findings demonstrate that our approach can reliably and accurately identify plastic-mulched land using GF-2 imagery.

4.2. Uncertainties and Future Needs

Although we validated the effectiveness of the proposed method, several limitations remained. These classification errors arise from two principal causes. Some buildings exhibit regular geometric forms in the imagery and are therefore segmented into distinct, regularly shaped objects; a subset of building roofs show spectral characteristics that resemble thicker, less-translucent plastic mulch, which leads to misclassification. In addition, where buildings or roads abut PML areas the segmentation algorithm may group portions of adjacent built surfaces with the PML into a single object, producing erroneous PML labels for those structures. This pattern of errors does not imply that the second component of the K-T transform fails to suppress building signatures in general, since building spectral properties vary and the transform’s suppressive effect cannot be uniformly applied to all built structures.
Uncertainty in the classification results also stems from the multiscale segmentation of PML. Some PML areas appear as conspicuous, elongated stripe-like regions in the visible bands (for example, potato mulch films), and these stripe patterns are highly distinctive. In contrast, PML characteristics in surrounding areas are relatively weak, which may cause them not to be grouped into the same object during multiscale segmentation. Although these regions are also PML, their features may resemble those of other land covers (e.g., bare soil or vegetation) during subsequent classification and therefore fail to exhibit clear PML signatures, resulting in omission errors. While adjusting the segmentation scale/coefficients can merge these regions into a single object, indiscriminately increasing the scale leads to over-segmentation elsewhere and thereby aggravates misclassification.
For the K-T transform-based classification of GF-2 imagery, we adopted the transform coefficients developed for IKONOS after comparative testing, because GF-2-specific K-T coefficients have not yet been definitively established. Although previous studies have empirically shown that this workaround is practicable, the spectral band ranges of GF-2 and IKONOS do not fully coincide, which can introduce systematic errors. Addressing and correcting these mismatches will require further investigation in future work.

5. Conclusions

In this paper, we evaluated GF-2 imagery to determine its suitability for PML detection in Luliang County, Shilin County, Zhanyi District and Jinghong City of Yunnan Province. We also assessed the effectiveness and relative contributions of different feature combinations for PML recognition. Our preliminary conclusions are as follows:
  • This study demonstrates that PML can be accurately identified using object-based classification of GF-2 fused imagery, integrating the original spectral bands, optimized texture features, and the second component of the K-T transformation. The method proved transferable across different regions of Yunnan Province, achieving classification accuracies of 93.60% in Luliang County, 93.14% in Zhanyi County, and 94.29% in Shilin District, and 93.43% in Jinghong City, all of which represent relatively high levels of performance. An accuracy assessment carried out in November in the Luliang area achieved 94.29% accuracy, indicating that the method likewise exhibits high temporal stability.
  • The second component of the K-T transformation, derived from GF-2 imagery using transformation coefficients from IKONOS data, effectively enhanced the spectral representation of PML and provided clear separability from other land-cover types. Incorporating this component as a classification feature substantially improved the accuracy of PML identification.

Author Contributions

Conceptualization, S.L. (Shixian Lu) and J.W.; methodology, S.L. (Shixian Lu); software, S.L. (Shixian Lu) and C.X.; validation, S.L. (Shixian Lu); formal analysis, C.C.; investigation, S.L. (Shixian Lu); resources, J.W.; data curation, S.Z.; writing—original draft preparation, S.L. (Shixian Lu); writing—review and editing, S.L. (Shixian Lu) and J.W.; visualization, S.L. (Shixian Lu); supervision, S.Z., S.L. (Shanshan Liu) and J.D.; project administration, S.L. (Shanshan Liu) and J.D.; funding acquisition, J.W. All authors have read and agreed to the published version of the manuscript.

Funding

This research was funded by National Key Research and Development Program of China, grant number 2024YFD1700104 and the Basic Research Project of Yunnan Provincial Science and Technology Department (Grant No. 202401CF070082).

Institutional Review Board Statement

Not applicable.

Informed Consent Statement

Not applicable.

Data Availability Statement

All data in this study were correctly referenced. The remote sensing images of the study area were obtained from the Natural Resources Satellite Remote Sensing Cloud Service Cloud Service Platform (http://114.116.226.59/english/home). The data were acquired and processed via operations such as radiometric calibration, atmospheric correction and cropping.

Acknowledgments

The authors extend their appreciation to the National Key Research and Development Program of China, grant number 2024YFD1700104.

Conflicts of Interest

The authors declare no conflicts of interest.

References

  1. Zeng, L.S.; Zhou, Z.F.; Shi, Y.X. Environmental Problems and Control Ways of Plastic Film in Agricultural Production. AMM 2013, 295–298, 2187–2190. [Google Scholar] [CrossRef]
  2. Zhang, Q.-Q.; Ma, Z.-R.; Cai, Y.-Y.; Li, H.-R.; Ying, G.-G. Agricultural Plastic Pollution in China: Generation of Plastic Debris and Emission of Phthalic Acid Esters from Agricultural Films. Environ. Sci. Technol. 2021, 55, 12459–12470. [Google Scholar] [CrossRef]
  3. Wei, Z.; Cui, Y.; Li, S.; Wang, X.; Dong, J.; Wu, L.; Yao, Z.; Wang, S.; Fan, W. A Novel Two-Step Framework for Mapping Fraction of Mulched Film Based on Very-High-Resolution Satellite Observation and Deep Learning. IEEE Trans. Geosci. Remote Sens. 2024, 62, 4406214. [Google Scholar] [CrossRef]
  4. Yang, H.; Hu, Z.; Wu, F.; Guo, K.; Gu, F.; Cao, M. The Use and Recycling of Agricultural Plastic Mulch in China: A Review. Sustainability 2023, 15, 15096. [Google Scholar] [CrossRef]
  5. Jiménez-Lao, R.; Aguilar, F.J.; Nemmaoui, A.; Aguilar, M.A. Remote Sensing of Agricultural Greenhouses and Plastic-Mulched Farmland: An Analysis of Worldwide Research. Remote Sens. 2020, 12, 2649. [Google Scholar] [CrossRef]
  6. Yan, C.; Liu, E.; Shu, F.; Liu, Q.; Liu, S.; He, W. Review of Agricultural Plastic Mulching and Its Residual Pollution and Prevention Measures in China. J. Agric. Resour. Environ. 2014, 31, 95–102. [Google Scholar]
  7. Espí, E.; Salmerón, A.; Fontecha, A.; García, Y.; Real, A.I. PLastic Films for Agricultural Applications. J. Plast. Film. Sheeting 2006, 22, 85–102. [Google Scholar] [CrossRef]
  8. Dai, J.; Hu, C.; Flury, M.; Huang, Y.; Rillig, M.C.; Ji, D.; Peng, J.; Fei, J.; Huang, Q.; Xiong, Y.; et al. National Inventory of Plastic Mulch Residues in Chinese Croplands From 1993 to 2050. Glob. Change Biol. 2025, 31, e70297. [Google Scholar] [CrossRef] [PubMed]
  9. Qi, R.; Jones, D.L.; Li, Z.; Liu, Q.; Yan, C. Behavior of Microplastics and Plastic Film Residues in the Soil Environment: A Critical Review. Sci. Total Environ. 2020, 703, 134722. [Google Scholar] [CrossRef]
  10. Wanner, P. Plastic in Agricultural Soils—A Global Risk for Groundwater Systems and Drinking Water Supplies?—A Review. Chemosphere 2021, 264, 128453. [Google Scholar] [CrossRef]
  11. Li, Z.; Zhang, R.; Wang, X.; Chen, F.; Lai, D.; Tian, C. Effects of Plastic Film Mulching with Drip Irrigation on N2O and CH4 Emissions from Cotton Fields in Arid Land. J. Agric. Sci. 2014, 152, 534–542. [Google Scholar] [CrossRef]
  12. Berger, S.; Kim, Y.; Kettering, J.; Gebauer, G. Plastic Mulching in Agriculture—Friend or Foe of N2O Emissions? Agric. Ecosyst. Environ. 2013, 167, 43–51. [Google Scholar] [CrossRef]
  13. Wang, S.; Fan, T.; Cheng, W.; Wang, L.; Zhao, G.; Li, S.; Dang, Y.; Zhang, J. Occurrence of Macroplastic Debris in the Long-Term Plastic Film-Mulched Agricultural Soil: A Case Study of Northwest China. Sci. Total Environ. 2022, 831, 154881. [Google Scholar] [CrossRef]
  14. Kumar, M.; Xiong, X.; He, M.; Tsang, D.C.W.; Gupta, J.; Khan, E.; Harrad, S.; Hou, D.; Ok, Y.S.; Bolan, N.S. Microplastics as Pollutants in Agricultural Soils. Environ. Pollut. 2020, 265, 114980. [Google Scholar] [CrossRef]
  15. Hayes, D.G.; Wadsworth, L.C.; Sintim, H.Y.; Flury, M.; English, M.; Schaeffer, S.; Saxton, A.M. Effect of Diverse Weathering Conditions on the Physicochemical Properties of Biodegradable Plastic Mulches. Polym. Test. 2017, 62, 454–467. [Google Scholar] [CrossRef]
  16. Steinmetz, Z.; Wollmann, C.; Schaefer, M.; Buchmann, C.; David, J.; Tröger, J.; Muñoz, K.; Frör, O.; Schaumann, G.E. Plastic Mulching in Agriculture. Trading Short-Term Agronomic Benefits for Long-Term Soil Degradation? Sci. Total Environ. 2016, 550, 690–705. [Google Scholar] [CrossRef]
  17. Van Schothorst, B.; Beriot, N.; Huerta Lwanga, E.; Geissen, V. Sources of Light Density Microplastic Related to Two Agricultural Practices: The Use of Compost and Plastic Mulch. Environments 2021, 8, 36. [Google Scholar] [CrossRef]
  18. Uzamurera, A.G.; Wang, P.-Y.; Zhao, Z.-Y.; Tao, X.-P.; Zhou, R.; Wang, W.-Y.; Xiong, X.-B.; Wang, S.; Wesly, K.; Tao, H.-Y.; et al. Thickness-Dependent Release of Microplastics and Phthalic Acid Esters from Polythene and Biodegradable Residual Films in Agricultural Soils and Its Related Productivity Effects. J. Hazard. Mater. 2023, 448, 130897. [Google Scholar] [CrossRef]
  19. Panno, S.V.; Kelly, W.R.; Scott, J.; Zheng, W.; McNeish, R.E.; Holm, N.; Hoellein, T.J.; Baranski, E.L. Microplastic Contamination in Karst Groundwater Systems. Groundwater 2019, 57, 189–196. [Google Scholar] [CrossRef]
  20. Li, J.; Liu, H.; Paul Chen, J. Microplastics in Freshwater Systems: A Review on Occurrence, Environmental Effects, and Methods for Microplastics Detection. Water Res. 2018, 137, 362–374. [Google Scholar] [CrossRef] [PubMed]
  21. Lebreton, L.C.M.; Van Der Zwet, J.; Damsteeg, J.-W.; Slat, B.; Andrady, A.; Reisser, J. River Plastic Emissions to the World’s Oceans. Nat. Commun. 2017, 8, 15611. [Google Scholar] [CrossRef]
  22. Lu, L.; Di, L.; Ye, Y. A Decision-Tree Classifier for Extracting Transparent Plastic-Mulched Landcover from Landsat-5 TM Images. IEEE J. Sel. Top. Appl. Earth Obs. Remote Sens. 2014, 7, 4548–4558. [Google Scholar] [CrossRef]
  23. Yang, D.; Chen, J.; Zhou, Y.; Chen, X.; Chen, X.; Cao, X. Mapping Plastic Greenhouse with Medium Spatial Resolution Satellite Data: Development of a New Spectral Index. ISPRS J. Photogramm. Remote Sens. 2017, 128, 47–60. [Google Scholar] [CrossRef]
  24. Zhang, P.; Du, P.; Guo, S.; Zhang, W.; Tang, P.; Chen, J.; Zheng, H. A Novel Index for Robust and Large-Scale Mapping of Plastic Greenhouse from Sentinel-2 Images. Remote Sens. Environ. 2022, 276, 113042. [Google Scholar] [CrossRef]
  25. Ma, X.; Shuai, Y.; Latipa, T. An Adaptive Index for Mapping Plastic-Mulched Crop Fields from Landsat-8 OLI Images. Int. J. Digit. Earth 2025, 18, 2538818. [Google Scholar] [CrossRef]
  26. Fu, C.; Cheng, L.; Qin, S.; Tariq, A.; Liu, P.; Zou, K.; Chang, L. Timely Plastic-Mulched Cropland Extraction Method from Complex Mixed Surfaces in Arid Regions. Remote Sens. 2022, 14, 4051. [Google Scholar] [CrossRef]
  27. Levin, N.; Lugassi, R.; Ramon, U.; Braun, O.; Ben-Dor, E. Remote Sensing as a Tool for Monitoring Plasticulture in Agricultural Landscapes. Int. J. Remote Sens. 2007, 28, 183–202. [Google Scholar] [CrossRef]
  28. Hasituya; Chen, Z.; Wang, L.; Wu, W.; Jiang, Z.; Li, H. Monitoring Plastic-Mulched Farmland by Landsat-8 OLI Imagery Using Spectral and Textural Features. Remote Sens. 2016, 8, 353. [Google Scholar] [CrossRef]
  29. Hasituya; Chen, Z. Mapping Plastic-Mulched Farmland with Multi-Temporal Landsat-8 Data. Remote Sens. 2017, 9, 557. [Google Scholar] [CrossRef]
  30. Dong, X.; Li, J.; Xu, N.; Lei, J.; He, Z.; Zhao, L. A Novel Phenology-Based Index for Plastic-Mulched Farmland Extraction and Its Application in a Typical Agricultural Region of China Using Sentinel-2 Imagery and Google Earth Engine. Land 2024, 13, 1825. [Google Scholar] [CrossRef]
  31. Lu, L.; Xu, Y.; Huang, X.; Zhang, H.K.; Du, Y. Large-Scale Mapping of Plastic-Mulched Land from Sentinel-2 Using an Index-Feature-Spatial-Attention Fused Deep Learning Model. Sci. Remote Sens. 2025, 11, 100188. [Google Scholar] [CrossRef]
  32. Koc-San, D. Evaluation of Different Classification Techniques for the Detection of Glass and Plastic Greenhouses from WorldView-2 Satellite Imagery. J. Appl. Remote Sens 2013, 7, 073553. [Google Scholar] [CrossRef]
  33. Luo, Q.; Liu, X.; Shi, Z.; Qu, R.; Zhao, W. Study on Plastic Mulch Identification Based on the Fusion of GF-1 and Sentinel -2 Images. Geogr. Geo Inf. Sci. 2021, 37, 39–46. [Google Scholar]
  34. Lu, L.; Hang, D.; Di, L. Threshold Model for Detecting Transparent Plastic-Mulched Landcover Using Moderate-Resolution Imaging Spectroradiometer Time Series Data: A Case Study in Southern Xinjiang, China. J. Appl. Remote Sens 2015, 9, 097094. [Google Scholar] [CrossRef]
  35. Agüera, F.; Aguilar, F.J.; Aguilar, M.A. Using Texture Analysis to Improve Per-Pixel Classification of Very High Resolution Images for Mapping Plastic Greenhouses. ISPRS J. Photogramm. Remote Sens. 2008, 63, 635–646. [Google Scholar] [CrossRef]
  36. Wu, J.; Liu, X.; Bo, Y.; Shi, Z.; Fu, Z. Plastic greenhouse recognition based on GF-2 data and multi-texture features. Trans. Chin. Soc. Agric. Eng. 2019, 35, 173–183. [Google Scholar]
  37. Gao, M.; Jiang, Q.; Zhao, Y.; Yang, W.; Shi, M. Comparison of plastic greenhouse extraction method based on GF-2 remote-sensing imagery. J. China Agric. Univ. 2018, 23, 125–134. [Google Scholar] [CrossRef]
  38. Yan, Z.; Chen, Z.; Dorjsuren, A.; Tuvdendorj, B. Mapping Exposure Duration of Plastic-Mulched Farmland Using Object-Scale Spectral Indices and Time Series Sentinel-2 Data. Int. J. Appl. Earth Obs. Geoinf. 2025, 143, 104782. [Google Scholar]
  39. Feng, Q.; Niu, B.; Chen, B.; Ren, Y.; Zhu, D.; Yang, J.; Liu, J.; Ou, C.; Li, B. Mapping of Plastic Greenhouses and Mulching Films from Very High Resolution Remote Sensing Imagery Based on a Dilated and Non-Local Convolutional Neural Network. Int. J. Appl. Earth Obs. Geoinf. 2021, 102, 102441. [Google Scholar] [CrossRef]
  40. Sun, W.; Chen, B.; Messinger, D.W. Nearest-Neighbor Diffusion-Based Pan-Sharpening Algorithm for Spectral Images. Opt. Eng. 2014, 53, 013107. [Google Scholar] [CrossRef]
  41. Haralick, R.M.; Shanmugam, K.; Dinstein, I. Textural Features for Image Classification. IEEE Trans. Syst. Man Cybern. 1973, SMC-3, 610–621. [Google Scholar] [CrossRef]
  42. Ali, S.A.; Parvin, F.; Vojteková, J.; Costache, R.; Linh, N.T.T.; Pham, Q.B.; Vojtek, M.; Gigović, L.; Ahmad, A.; Ghorbani, M.A. GIS-Based Landslide Susceptibility Modeling: A Comparison between Fuzzy Multi-Criteria and Machine Learning Algorithms. Geosci. Front. 2021, 12, 857–876. [Google Scholar] [CrossRef]
  43. Kauth, R.J.; Thomas, G.S. The Tasselled Cap—A Graphic Description of the Spectral-Temporal Development of Agricultural Crops as Seen by LANDSAT. Mach. Process. Remote. Sensed Data 1976, 1, 41–51. [Google Scholar]
  44. Fei, X.; Zhang, Z.; Gao, X. Study on IKONOS data fusion based on Tasseled Cap transformation. Comput. Eng. Appl. 2008, 44, 233–240. [Google Scholar]
  45. Yang, W.; Zhang, Y.; Yin, X.; Wang, J. Construction of ratio build-up index for GF—1 image. Remote Sens. Land Resour. 2016, 28, 35–42. [Google Scholar]
  46. Zhou, J.; Zhu, J.; Zuo, T. A tasseled cap transformation for IKONOS images. Mine Surverying 2006, 1, 60–70. [Google Scholar]
  47. Dial, G.; Bowen, H.; Gerlach, F.; Grodecki, J.; Oleszczuk, R. IKONOS Satellite, Imagery, and Products. Remote Sens. Environ. 2003, 88, 23–36. [Google Scholar] [CrossRef]
  48. Li, Z.; Shen, H.; Li, H.; Xia, G.; Gamba, P.; Zhang, L. Multi-Feature Combined Cloud and Cloud Shadow Detection in GaoFen-1 Wide Field of View Imagery. Remote Sens. Environ. 2017, 191, 342–358. [Google Scholar] [CrossRef]
  49. Zhang, R.; Jia, M.; Wang, Z.; Zhou, Y.; Wen, X.; Tan, Y.; Cheng, L. A Comparison of Gaofen-2 and Sentinel-2 Imagery for Mapping Mangrove Forests Using Object-Oriented Analysis and Random Forest. IEEE J. Sel. Top. Appl. Earth Obs. Remote Sens. 2021, 14, 4185–4193. [Google Scholar] [CrossRef]
  50. Hu, R.; Wei, M.; Yang, C.; He, J. Taking SPOT5 remote sensing data for example to compare pixel-based and object-oriented classification. Remote Sens. Technol. Appl. 2012, 27, 366–371. [Google Scholar]
  51. Shen, X.; Guo, Y.; Cao, J. Object-Based Multiscale Segmentation Incorporating Texture and Edge Features of High-Resolution Remote Sensing Images. PeerJ Comput. Sci. 2023, 9, e1290. [Google Scholar] [CrossRef] [PubMed]
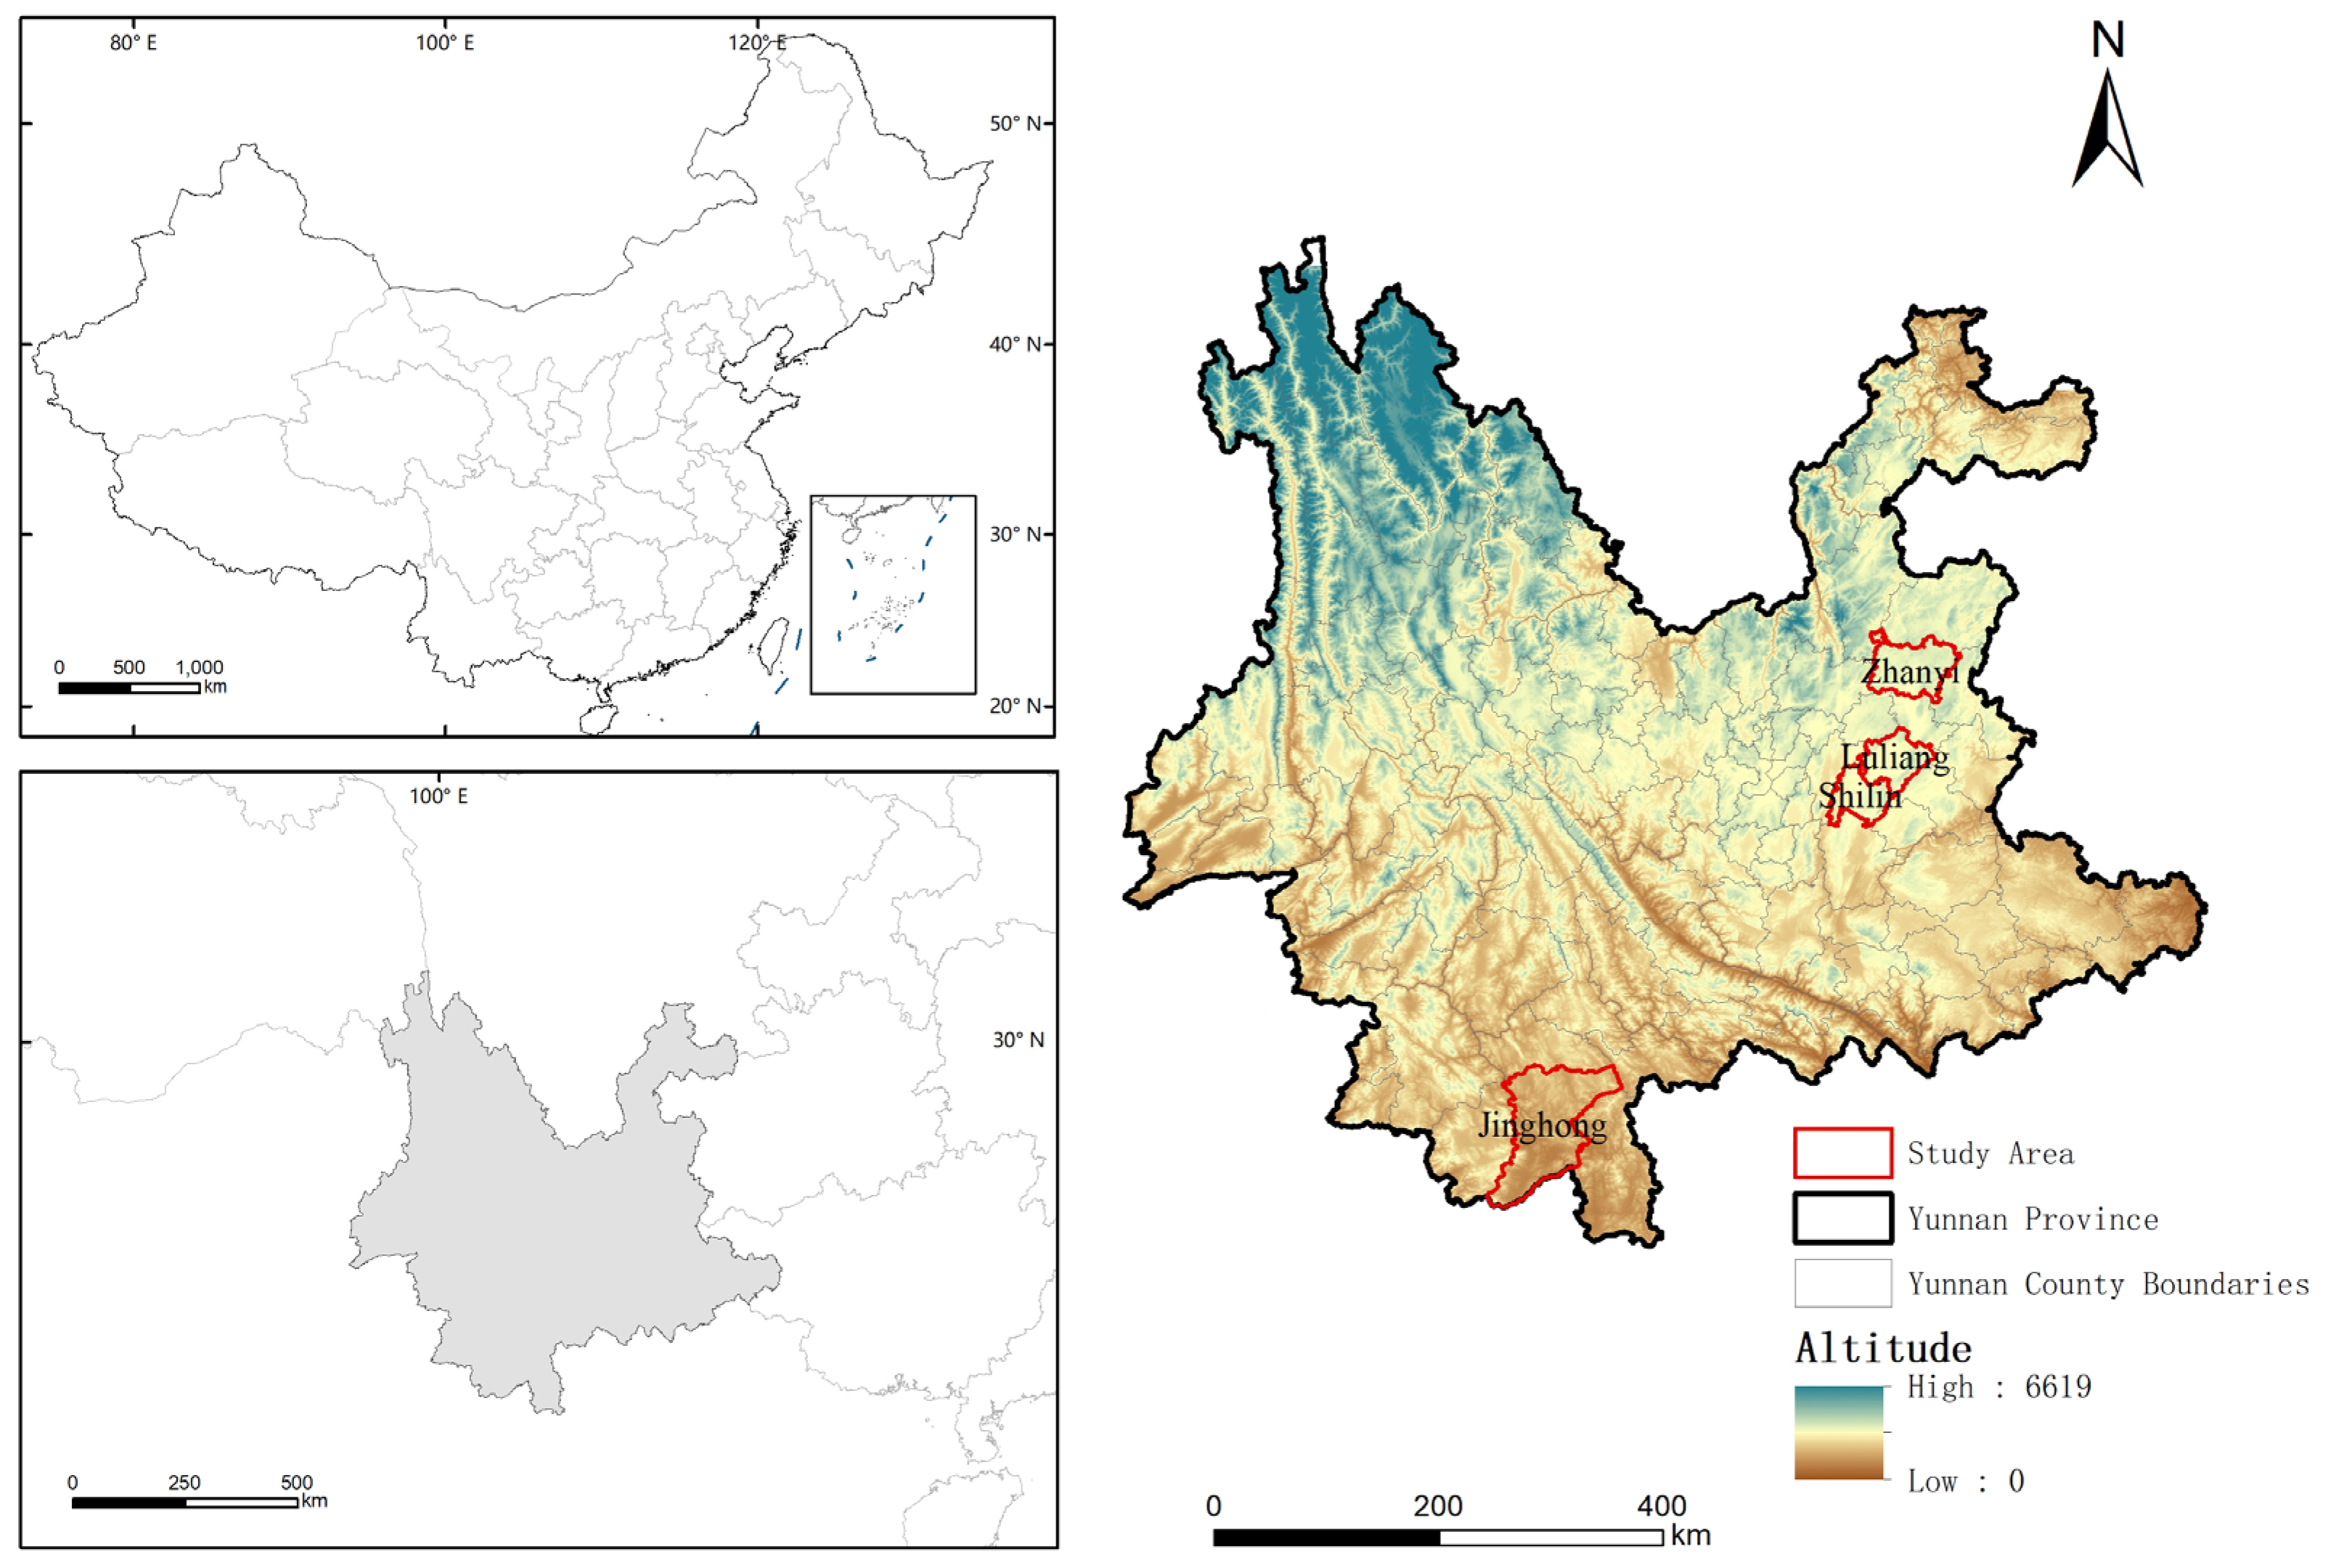
Figure 1. Schematic of the research area.
Applsci 15 11978 g001
Figure 2. Technical route of PML recognition in this study.
Applsci 15 11978 g002
Figure 3. Histogram of texture feature weights.
Applsci 15 11978 g003
Figure 4. Correlation coefficients between texture features.
Applsci 15 11978 g004
Figure 5. K-T transform of typical ground objects in GF-2 images.
Applsci 15 11978 g005
Figure 6. Original imagery and segmentation results. Panel (A) shows the original imagery of the study area. Panel (B) presents the image segmentation results. Panel (C) illustrates the locations of the classification sample points.
Applsci 15 11978 g006
Figure 7. PML recognition results of different classification schemes.
Applsci 15 11978 g007
Figure 8. PML extraction evaluation for different schemes.
Applsci 15 11978 g008
Figure 9. Validation of the classification-scheme generalizability. Panels (AC) show the original imagery, classification results, and classification accuracy for Jinghong City; Panels (DF) show the original imagery, classification results, and classification accuracy for Zhanyi District; Panels (GI) show the original imagery, classification results, and classification accuracy for Shilin County; and Panels (JL) show the original imagery, classification results, and classification accuracy for Luliang County (scene acquired on 23 November 2022).
Applsci 15 11978 g009
Table 1. K-T transform coefficients of IKONOS images.
K-T Transform ComponentBlue BandGreen BandRed BandNear-Infrared Band
1. Illuminance component0.326−0.311−0.612−0.650
2. Green component0.509−0.356−0.3120.719
3. Humidity component0.560−0.3250.722−0.243
4. The 4th component0.5670.819−0.081−0.031
Table 2. Spectral range comparison between IKONOS imagery and GF-1 WFV/GF-2 MSS imagery.
SatelliteBlue BandGreen BandRed BandNear-Infrared Band
IKONOS [49]445–516 nm506–595 nm632–698 nm757–853 nm
GF-1 [50]450–520 nm520–590 nm630–690 nm770–890 nm
GF-2 [51]450–520 nm520–590 nm630–690 nm770–890 nm
Table 3. Different classifications for PML recognition.
SchemeClassification Combinations
1Pixel-based classification–RGB
2Pixel-based classification–RGB + GLCM
3Pixel-based classification–RGB + GLCM + KT
4Object-oriented classification–RGB
5Object-oriented classification–RGB + GLCM
6Object-oriented classification–RGB + GLCM + KT (RF)
7Object-oriented classification–RGB + GLCM + KT (SVM)
8Object-oriented classification–RGB + GLCM + KT (KNN)
9Object-oriented classification–Spectral&Shape feature + GLCM + VI (Gao)
10Object-oriented classification–RGB + NIR + NDVI + PSI + LBP (Wu 1)
11Object-oriented classification–RGB + NIR + NDVI + GLCM + LBP + PSI (Wu 2)
Note: R is for the red band, G for green band, B for blue band, GLCM for texture features, and K-T for the second component of K-T transform. VI stands for vegetation index, PSI denotes the pixel shape index, LBP denotes the local binary pattern, NDVI denotes the normalized difference vegetation index, RF denotes the random forest classifier, SVM denotes the support vector machine classifier, and KNN denotes the k-nearest neighbors classifier. When applying the PML extraction procedures proposed by Gao and Wu, the bands and indices were computed according to the optimal configurations reported in the original papers, and the classifiers used followed those employed in the source studies: Gao recommended RF, while Wu recommended SVM.
Disclaimer/Publisher’s Note: The statements, opinions and data contained in all publications are solely those of the individual author(s) and contributor(s) and not of MDPI and/or the editor(s). MDPI and/or the editor(s) disclaim responsibility for any injury to people or property resulting from any ideas, methods, instructions or products referred to in the content.