You are currently viewing a new version of our website. To view the old version click .
Applied Sciences
  • Article
  • Open Access

10 November 2025

Revealing the Stabilization Mechanism of ZnO Polar Facets with 17O NMR Spectroscopy

and
Key Laboratory for Organic Electronics and Information Displays (KLOEID) & Institute of Advanced Materials (IAM), Jiangsu National Synergetic Innovation Center for Advanced Materials (SICAM), Nanjing University of Posts & Telecommunications, 9 Wenyuan Road, Nanjing 210023, China
*
Author to whom correspondence should be addressed.
This article belongs to the Section Applied Physics General

Abstract

Interactions of ZnO nanoplates with water are crucial in determining its structure and performance of the catalyst, yet the details for these processes remain missing due to the lack of an effective detection method that provides resolution at the atomic level. Here, 17O solid-state NMR spectroscopy is applied to investigate the interactions and the associated stabilization mechanisms for the polar surface of ZnO nanoplates. It shows that the specific O sites (around Zn vacancy) on the polar surface also contribute to the 17O NMR signal at −18.8 ppm. The observed trends in both 17O and 1H spectra after exposing to water vapor further support the assignment of this 17O high-frequency signal (−18.8 ppm). In addition, the dissociation of water at defective sites of polar surfaces is evidenced, which leads to the generation of OH groups on both (000 1 ¯ )-O and (0001)-Zn surfaces. The generated OH species obviously improves the dispersity of ZnO nanocrystals, as well as the stability of polar facets by significant electrostatic repulsion interactions. This study will provide insight into the adsorption properties of water on polar facets and the related stabilization mechanisms of the polar surface in nanocrystals.

1. Introduction

Zinc oxide (ZnO) has attracted tremendous interest due to its extensive applications in solar cells [], semiconductors [], and catalysts []. For catalytic applications, ZnO plays an important role in the water–gas shift reaction [], methanol synthesis [], and syngas conversion reaction []. In these processes, the catalytic activity of ZnO is related to its surface structure and adsorbed species. Among the species that change the properties of nanocrystals, water molecules are of particular significance []. Most previous studies were performed to investigate the interactions of a ZnO (10 1 ¯ 0) nonpolar surface with water, and two adsorption patterns (i.e., molecular adsorption and semi-dissociative adsorption on a nonpolar surface) of water on a ZnO surface were evidenced [,]. However, few works are available on polar (0002) facets, including the (0001)-Zn surface with positive charge and (000 1 ¯ )-O surface with negative charge. The difficulty is due to the instability of ZnO polar surfaces caused by the nonzero dipole moment between two polar surfaces, thus, highly disordered polar facets resulting from reconstruction are usually present to compensate the charge accumulation. Although earlier scanning tunneling spectroscopy (STM) experiments have reported the dissociation of water on polar surfaces in ZnO single crystals [,], studies of water adsorbed on polar facets in ZnO nanocrystals remain lacking, which severely limits the applications of ZnO nanocrystals in the chemical industry. Therefore, it is necessary to study the interactions between water and ZnO nanoplates to further uncover the stabilization mechanisms of polar facets.
We can obtain abundant material information by solid-state NMR spectroscopy due to its powerful functions in characterizing the structure of nanosized materials. In particular, 17O NMR spectroscopy has been widely used in metal oxide nanomaterials [], oxygen sites on different facets or layers, structural defects, and surface adatoms in solids can be clearly distinguished by a surface-selective 17O labeling technique combined with density functional theory (DFT) calculations. Here, we apply 17O NMR spectroscopy to study the interactions between water and ZnO nanoplates and explore the associated stabilization mechanisms for polar facets.

2. Materials and Methods

2.1. Material Preparation

ZnO nanoplates were synthesized according to a previous study []. A total of 6.0 g of Zn(Ac)2·2H2O (Sinopharm Chemical Reagent Co., Ltd., Shanghai, China) and 3.84 g of C6H12N4 (HMT) (Sinopharm Chemical Reagent Co., Ltd., Shanghai, China) were dissolved in 48 mL of deionized water. After stirring for 10 min, the mixture was transferred to a Teflon-lined autoclave and heated at 99 °C for 24 h. After centrifugal separation and washing three times by ethanol (Sinopharm Chemical Reagent Co., Ltd., Shanghai, China) and distilled water, the resulting white product was dried at 100 °C for 12 h, followed by calcination at 300 °C for 2 h in air.
Long and short ZnO nanorods were prepared by the hydrothermal method []. For the synthesis of long (short) ZnO nanorods, 1.6 mmol (1.6 mmol) of Zn(Ac)2·2H2O and 48 mmol (3.2 mmol) of NaOH (Sinopharm Chemical Reagent Co., Ltd., Shanghai, China) were dissolved in 80 mL of ethanol, respectively. The solution of NaOH was slowly added into the solution of Zn(Ac)2 under stirring conditions, followed by the addition of 3 mL of aqueous solution (containing 0.19 g of ethanediamine (Sinopharm Chemical Reagent Co., Ltd., Shanghai, China)). The mixed solution was stirred for 0.5 h and then transferred to a Teflon-lined autoclave, followed by heating at 120 °C (200 °C) for 3 h (0.25 h). After centrifugation and washing three times by distilled water, the resulting white product was dried at 80 °C for 8 h.

2.2. Characterizations

The X-ray powder diffraction experiments were conducted on a Philips X’Pro X-ray diffractometer (Philips, Amsterdam, the Netherlands) operated at 40 mA and 40 kV at 25 °C. Transmission electron microscope images for ZnO nanoplates were obtained on a JEOL JEM-2010 type apparatus (JEOL, Tokyo, Japan).

2.3. Exposure to Closed Container

To reveal the stabilization mechanisms of ZnO polar facets, ZnO nanoplates were exposed to water vapor (from saturated NH4Cl solution, in which natural abundant water was used) in a closed container for one or two weeks. At the same time, ZnO nanoplates were exposed to a closed dried container without water for comparison.

2.4. 17O Isotopic Labeling

For ZnO samples (nanoplates and nanorods) labeled with H217O (90% 17O, Cambridge Isotope Laboratories, Tewksbury, MA, USA), the samples were first dried at 100 °C for 2 h under vacuum. Then, H217O vapor was supplied through the vacuum line. The mixture was maintained at 40 °C for 5 h before it was dried under vacuum. For ZnO nanoplates or bulk ZnO labeled with 17O2, the samples were first heated at 400 °C for 2 h under vacuum, followed by the introduction of 15 mL of 17O2 (90% 17O, Sigma-Aldrich, St. Louis, MO, USA, 0.41 × 10⁵ Pa). Subsequently, the mixture was heated at 400 °C overnight.

2.5. Solid-State NMR Spectroscopy

Solid-state NMR spectra were obtained on 9.4 T Bruker Avance III spectrometers (Bruker, Billerica, MA, USA) using 4.0 mm MAS probes. The radio frequency fields for 17O and 1H nuclei were 54.2 and 400 MHz, respectively. For all 17O NMR spectra, a spinning frequency of 14 kHz and a 30° pulse of 1.2 μs were used with a recycle delay of 5 s. For 1H NMR spectra, a MAS rate of 14 kHz and a 90° pulse of 2.9 μs were used with a recycle delay of 5 s. Chemical shifts for 17O and 1H are referenced to H2O (0.0 ppm) and adamantane (1.79 ppm), respectively.

2.6. DFT Calculations

For structural optimization, DFT calculations were carried out using the Vienna ab initio Simulation Package (VASP) []. The Perdew–Burke–Ernzerhof (PBE) functional [] was used. The projector augmented wave (PAW) [] method was used to describe the interaction of valence electrons with cores. Calculations were finished when the value of the Hellman–Feynman force on each ion was lower than 0.04 eV/Å; the convergence criterion for electronic minimization was 1 × 10⁻⁵ eV/atom. A k-point mesh of 4 × 4 × 1 was used.

3. Results and Discussion

3.1. Morphology of the ZnO Sample

ZnO nanoplates were synthesized hydrothermally. The XRD pattern indicates that the prepared ZnO shows the wurtzite crystal structure (Figure S1a). Transmission electron microscopy (TEM) images reveal plate-shaped ZnO with average diameters of 35 nm and average lengths of approximately 18 nm. The exposed ratio of polar (0002) facets is around 46% (Figure S1b–d and Table S1). Figure S2 also shows different morphologies of ZnO nanorods to illustrate the facet-related changes in the following sections. The samples are named as L-rod and S-rod for long and short ZnO nanorods, respectively, and the corresponding proportions of polar (0002) facet are 3% (L-rod) and 15% (S-rod) (Table S1), indicating that ZnO nanorods are predominately covered by nonpolar (10 1 ¯ 0) facets (L-rod: 97%; S-rod: 85%).

3.2. Oxygen Species on the Polar Surface of ZnO Nanoplates

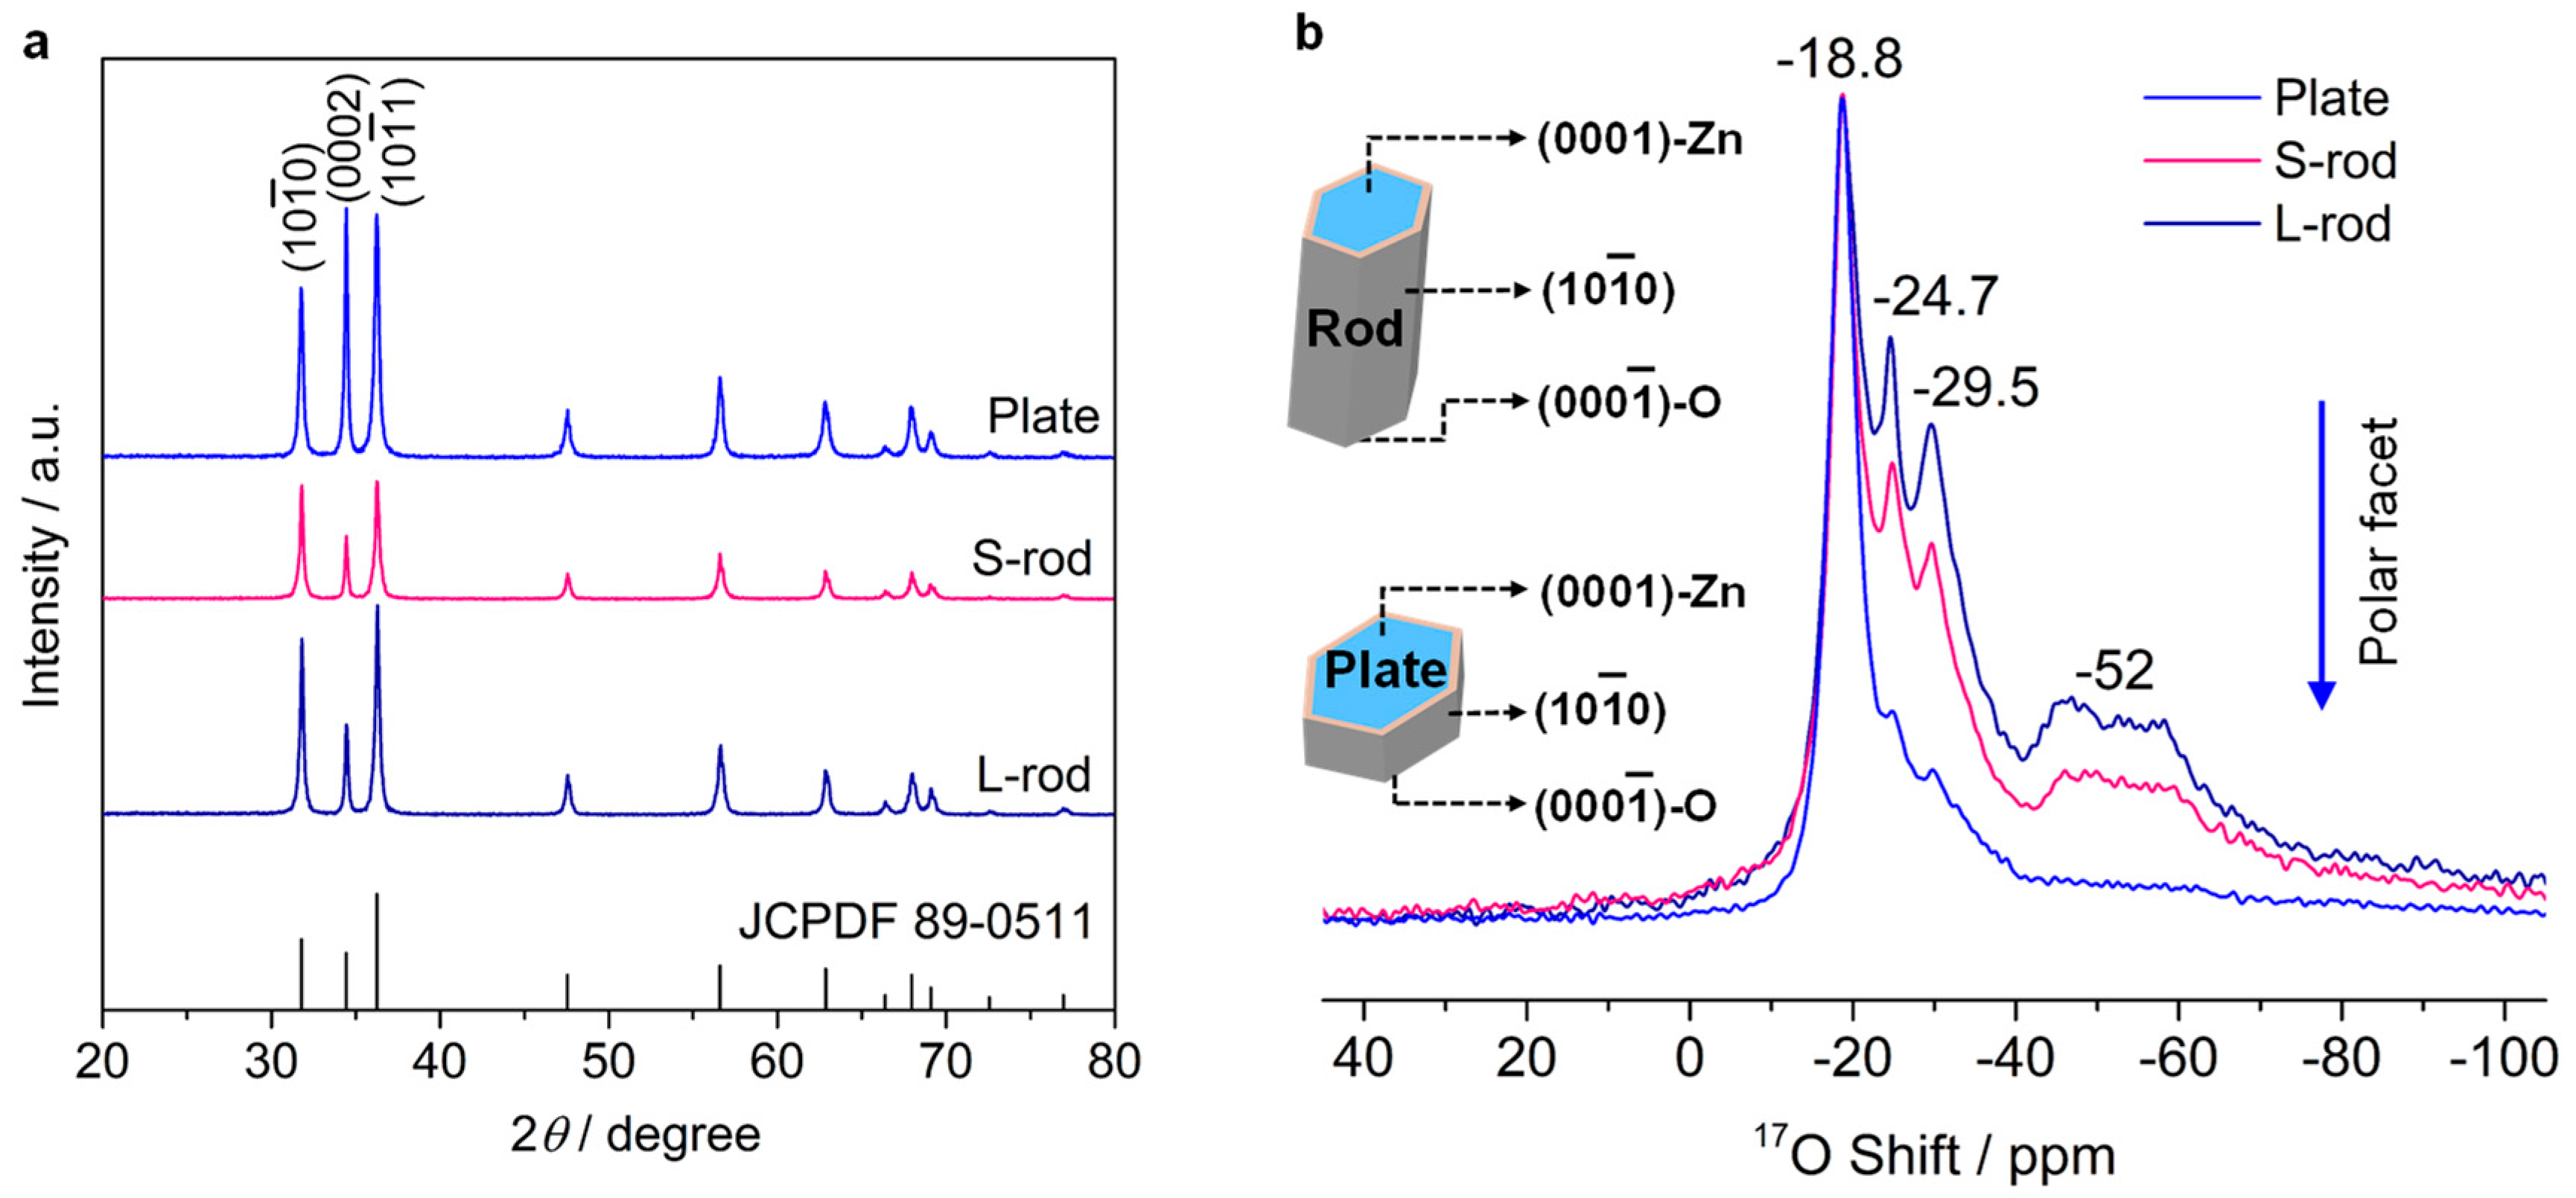
The XRD patterns in Figure 1a show that the relative intensity of (0002) peak in ZnO nanoplates is higher than that of (10 1 ¯ 0) peak, matching the large exposure ratios of polar facets; while the (10 1 ¯ 0) peak is much higher compared to (0002) peak for both L-rod and S-rod, due to the larger exposure ratios of nonpolar facets in these rod-shaped ZnO samples. Based on the 17O surface-selective labeling technique, we investigated the relevance of 17O NMR signals of different ZnO nanomaterials (nanoplates and nanorods) with exposure facets. Before NMR detection, 17O enrichment was conducted by heating ZnO samples in H217O vapor at 40 °C. 17O NMR spectra of all ZnO samples can be reproduced with four peaks at −18.8, −24.7, −29.5, and around −52 ppm (Figure 1b). Notably, 17O is a quadrupole nucleus (I = 5/2) and thus has a quadrupole moment. The quadrupolar interaction of 17O and the distribution of its NMR parameters due to disorder in the local structure usually make it difficult to distinguish different oxygen species. Therefore, a careful analysis is required, in which spectral deconvolution and fitting may be necessary to obtain more structural information. Furthermore, DFT calculations are normally performed to help further spectral assignments. Based on our previous work on ZnO nanorods exposing the (10 1 ¯ 0) surface (Figure S3 and Table S2) [], the high-frequency peak at −18.8 ppm consists of two components, a broad one with a relatively larger quadrupolar coupling constant (CQ, ~1.2 MHz) attributed to surface three-coordinated oxygen (O3c) ions in model M2 (water molecules adsorbed on ZnO(10 1 ¯ 0) surface molecularly), and a narrow one with a small CQ (~0.1 MHz) ascribed to subsurface four-coordinated oxygen (O4c) sites in models M2 and M1D1 (one water molecule dissociatively adsorbed and another water molecule molecularly adsorbed on a ZnO(10 1 ¯ 0) surface). Both signals at −24.7 and −29.5 ppm arise from surface O4c ions. The peak centered at approx. −52 ppm is assigned to surface OH groups according to its obvious second-order quadrupolar line shape.
Figure 1. (a) XRD patterns and (b) 17O NMR spectra of different ZnO samples (nanoplates, L-rod, and S-rod) labeled with H217O. External field: 9.4 T; MAS rate: 14 kHz.
The intensities of these signals at −24.7, −29.5, and −52 ppm obviously decrease from L-rod to plate, agreeing well with the decrease in exposure fractions of the ZnO nonpolar surface. Whereas the relative intensity of the peak at −18.8 ppm increases, matching the increase in exposure ratios of polar (0002) facets from L-rod to plate samples. In our previous study on L-rod and S-rod [], we have shown that the −18.8 ppm peak in NMR spectra also arises from oxygen ions on or near the ZnO(0002) surface, which is supported with 17O isotopic labeling experiments and X-ray photoelectron spectroscopy (XPS) data. Combined with the stronger 17O resonance at −18.8 ppm in ZnO nanoplates with larger fractions of polar surface, the results further support the conclusion that O ions on polar (0002) facets also contribute to the high-frequency signal (−18.8 ppm), in addition to that from nonpolar (10 1 ¯ 0) facets.
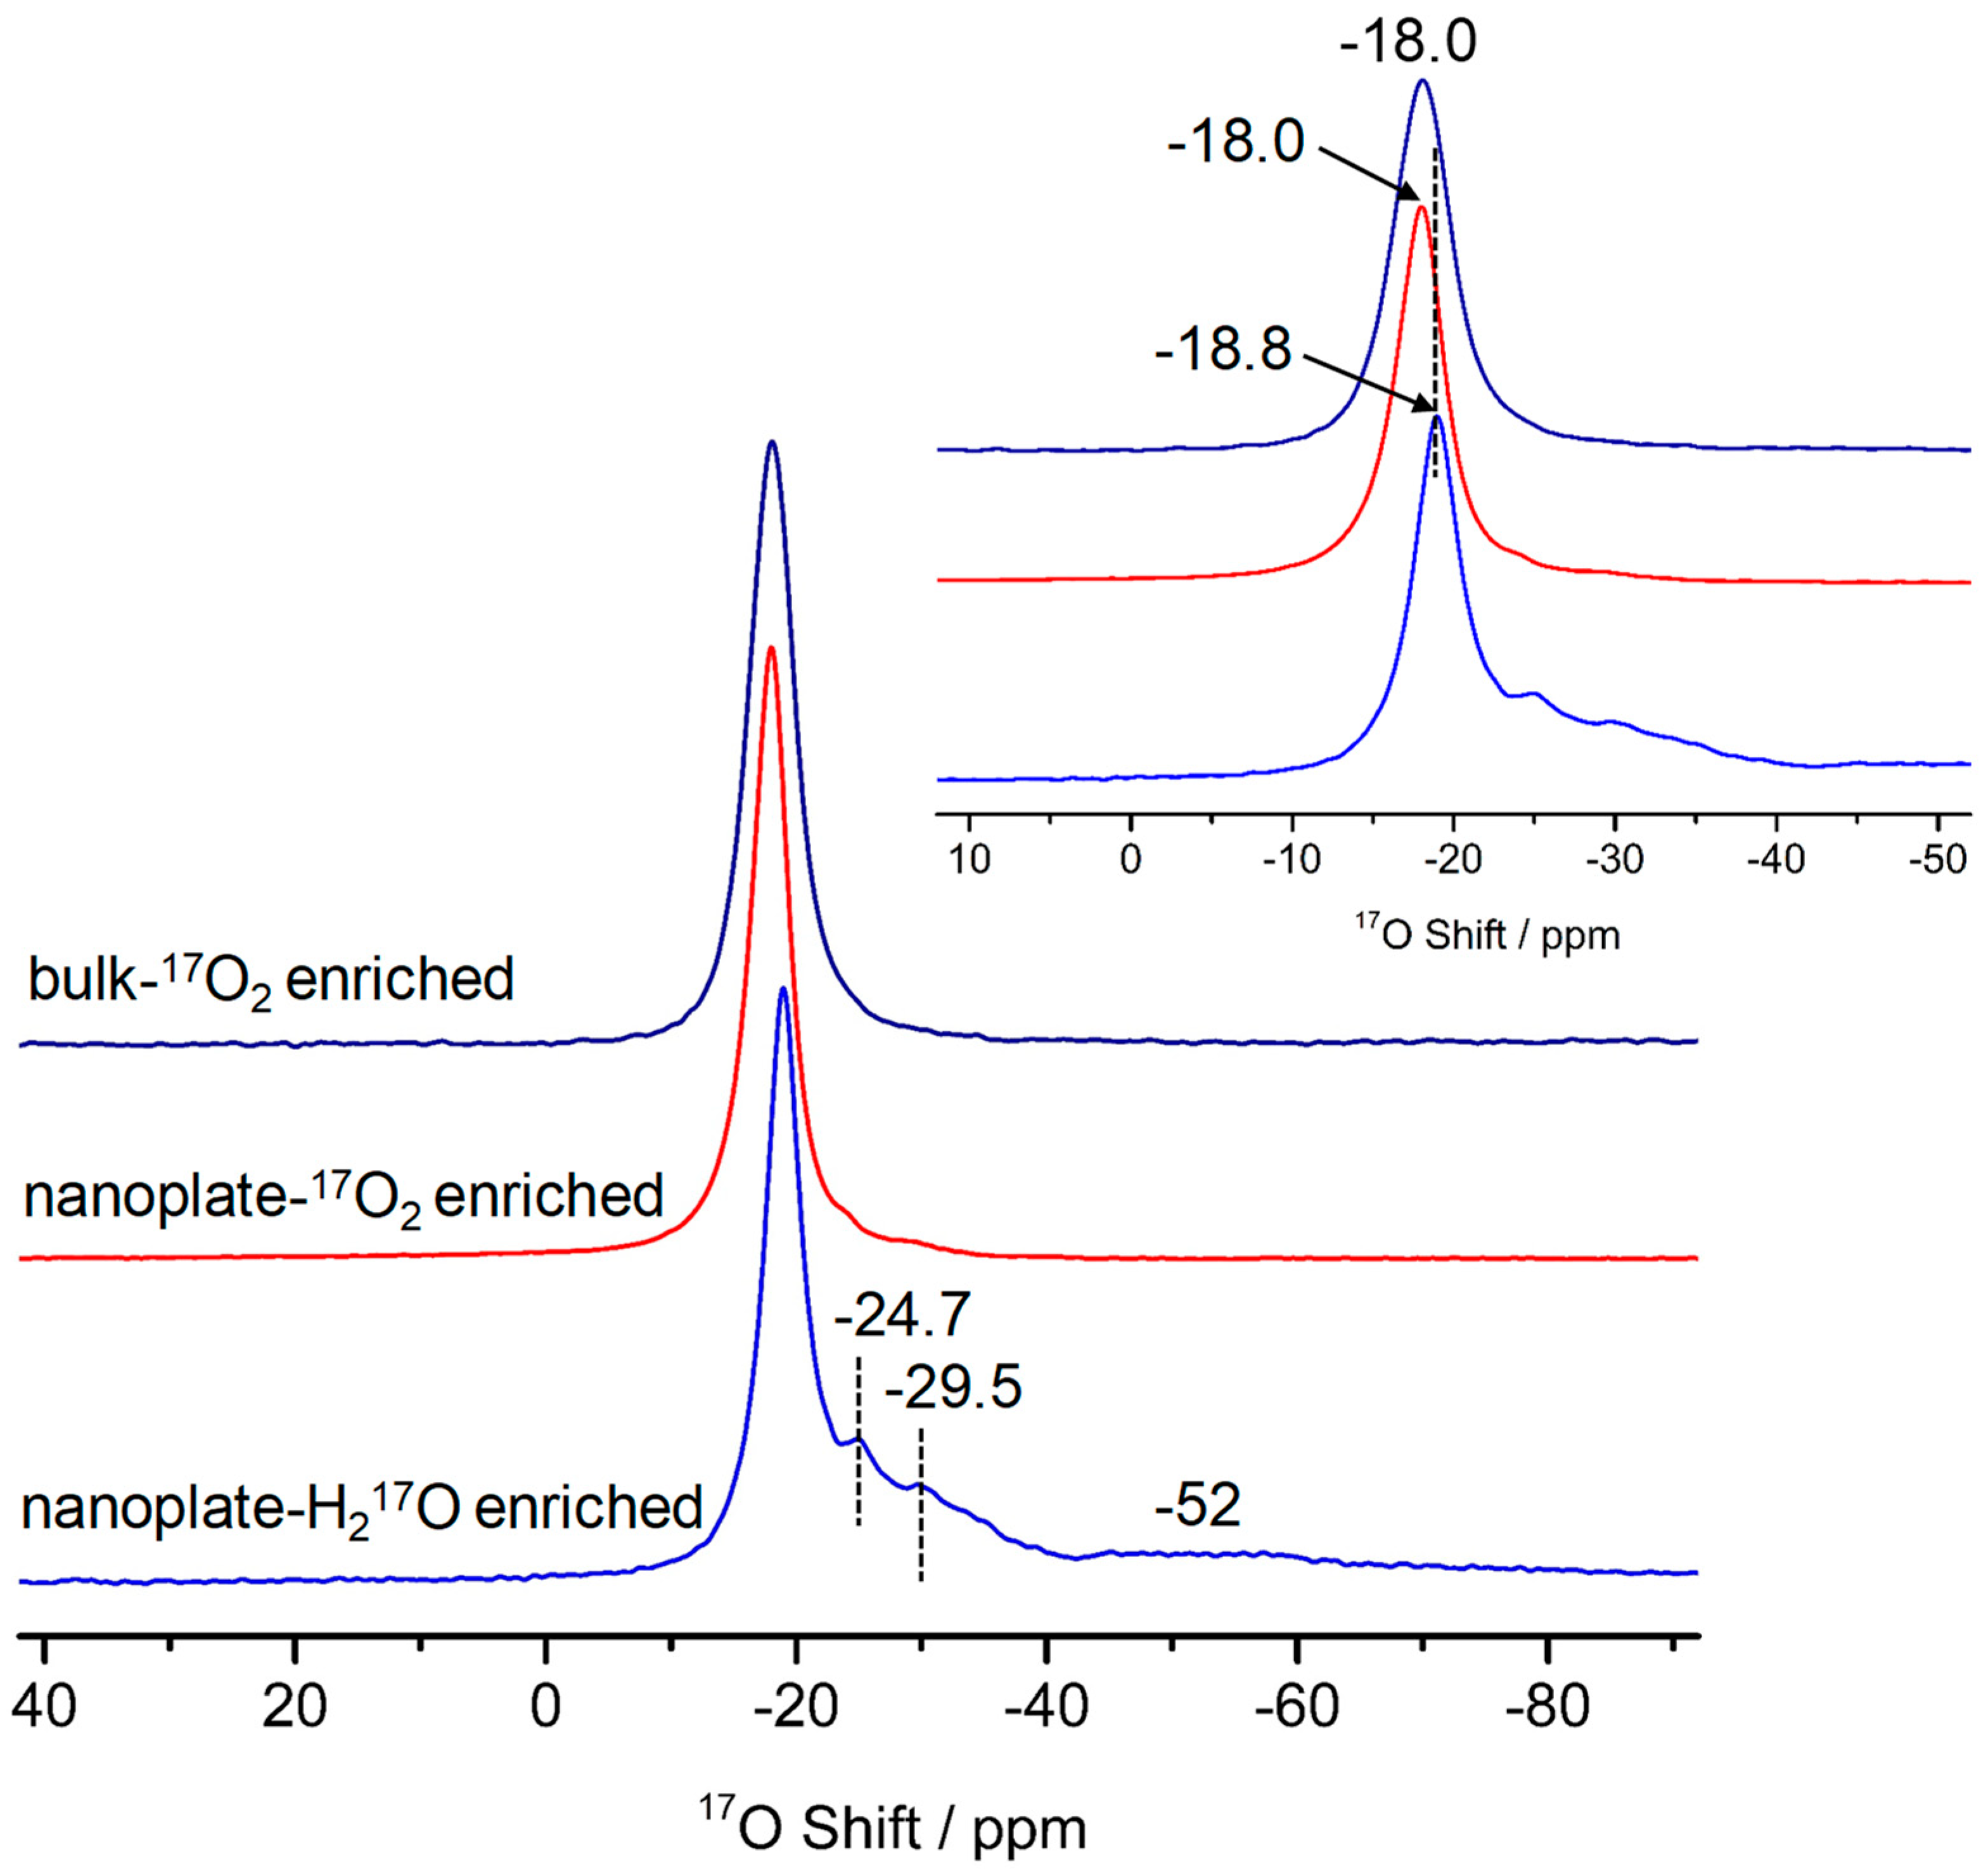
In order to prove the conclusion that the −18.8 ppm peak corresponds to ZnO surface sites, the possible contributions from O ions in the bulk part of ZnO nanoplates to this high-frequency signal need to be excluded. Thus, 17O NMR experiments of ZnO nanoplates and bulk ZnO labeled with 17O2 at a high temperature of 400 °C were performed in comparison with the NMR spectrum of surface-selectively enriched samples, to distinguish ZnO surface oxygen sites from the bulk. Figure 2 shows that the high-frequency signal of ZnO nanoplates shifts to −18.0 ppm and dominates the spectrum, due to O ions diffusing from surface to inner layers at an elevated temperature. Similarly, the intensities of the two signals at −24.7 and −29.5 ppm assigned to surface O4c ions decrease significantly and the surface OH signal disappears owing to the O ions diffusion effect. For a bulk ZnO sample, a sharp 17O peak at −18.0 ppm is observed, which is ascribed to bulk O4c ions according to early reports []. On the whole, the 17O NMR spectrum of ZnO nanoplates labeled with 17O2 is similar to that of bulk ZnO in this situation. Therefore, oxygen ions in deeper layers of ZnO nanoplates also resonate at −18.0 ppm, differing from the chemical shift (−18.8 ppm) arising from surface oxygen sites.
Figure 2. 17O NMR spectra of ZnO samples. ZnO nanoplates and bulk ZnO were isotopically labeled with 17O2 at 400 °C. For ZnO nanoplates labeled with H217O and conducted at 40 °C. External field: 9.4 T; MAS rate: 14 kHz.
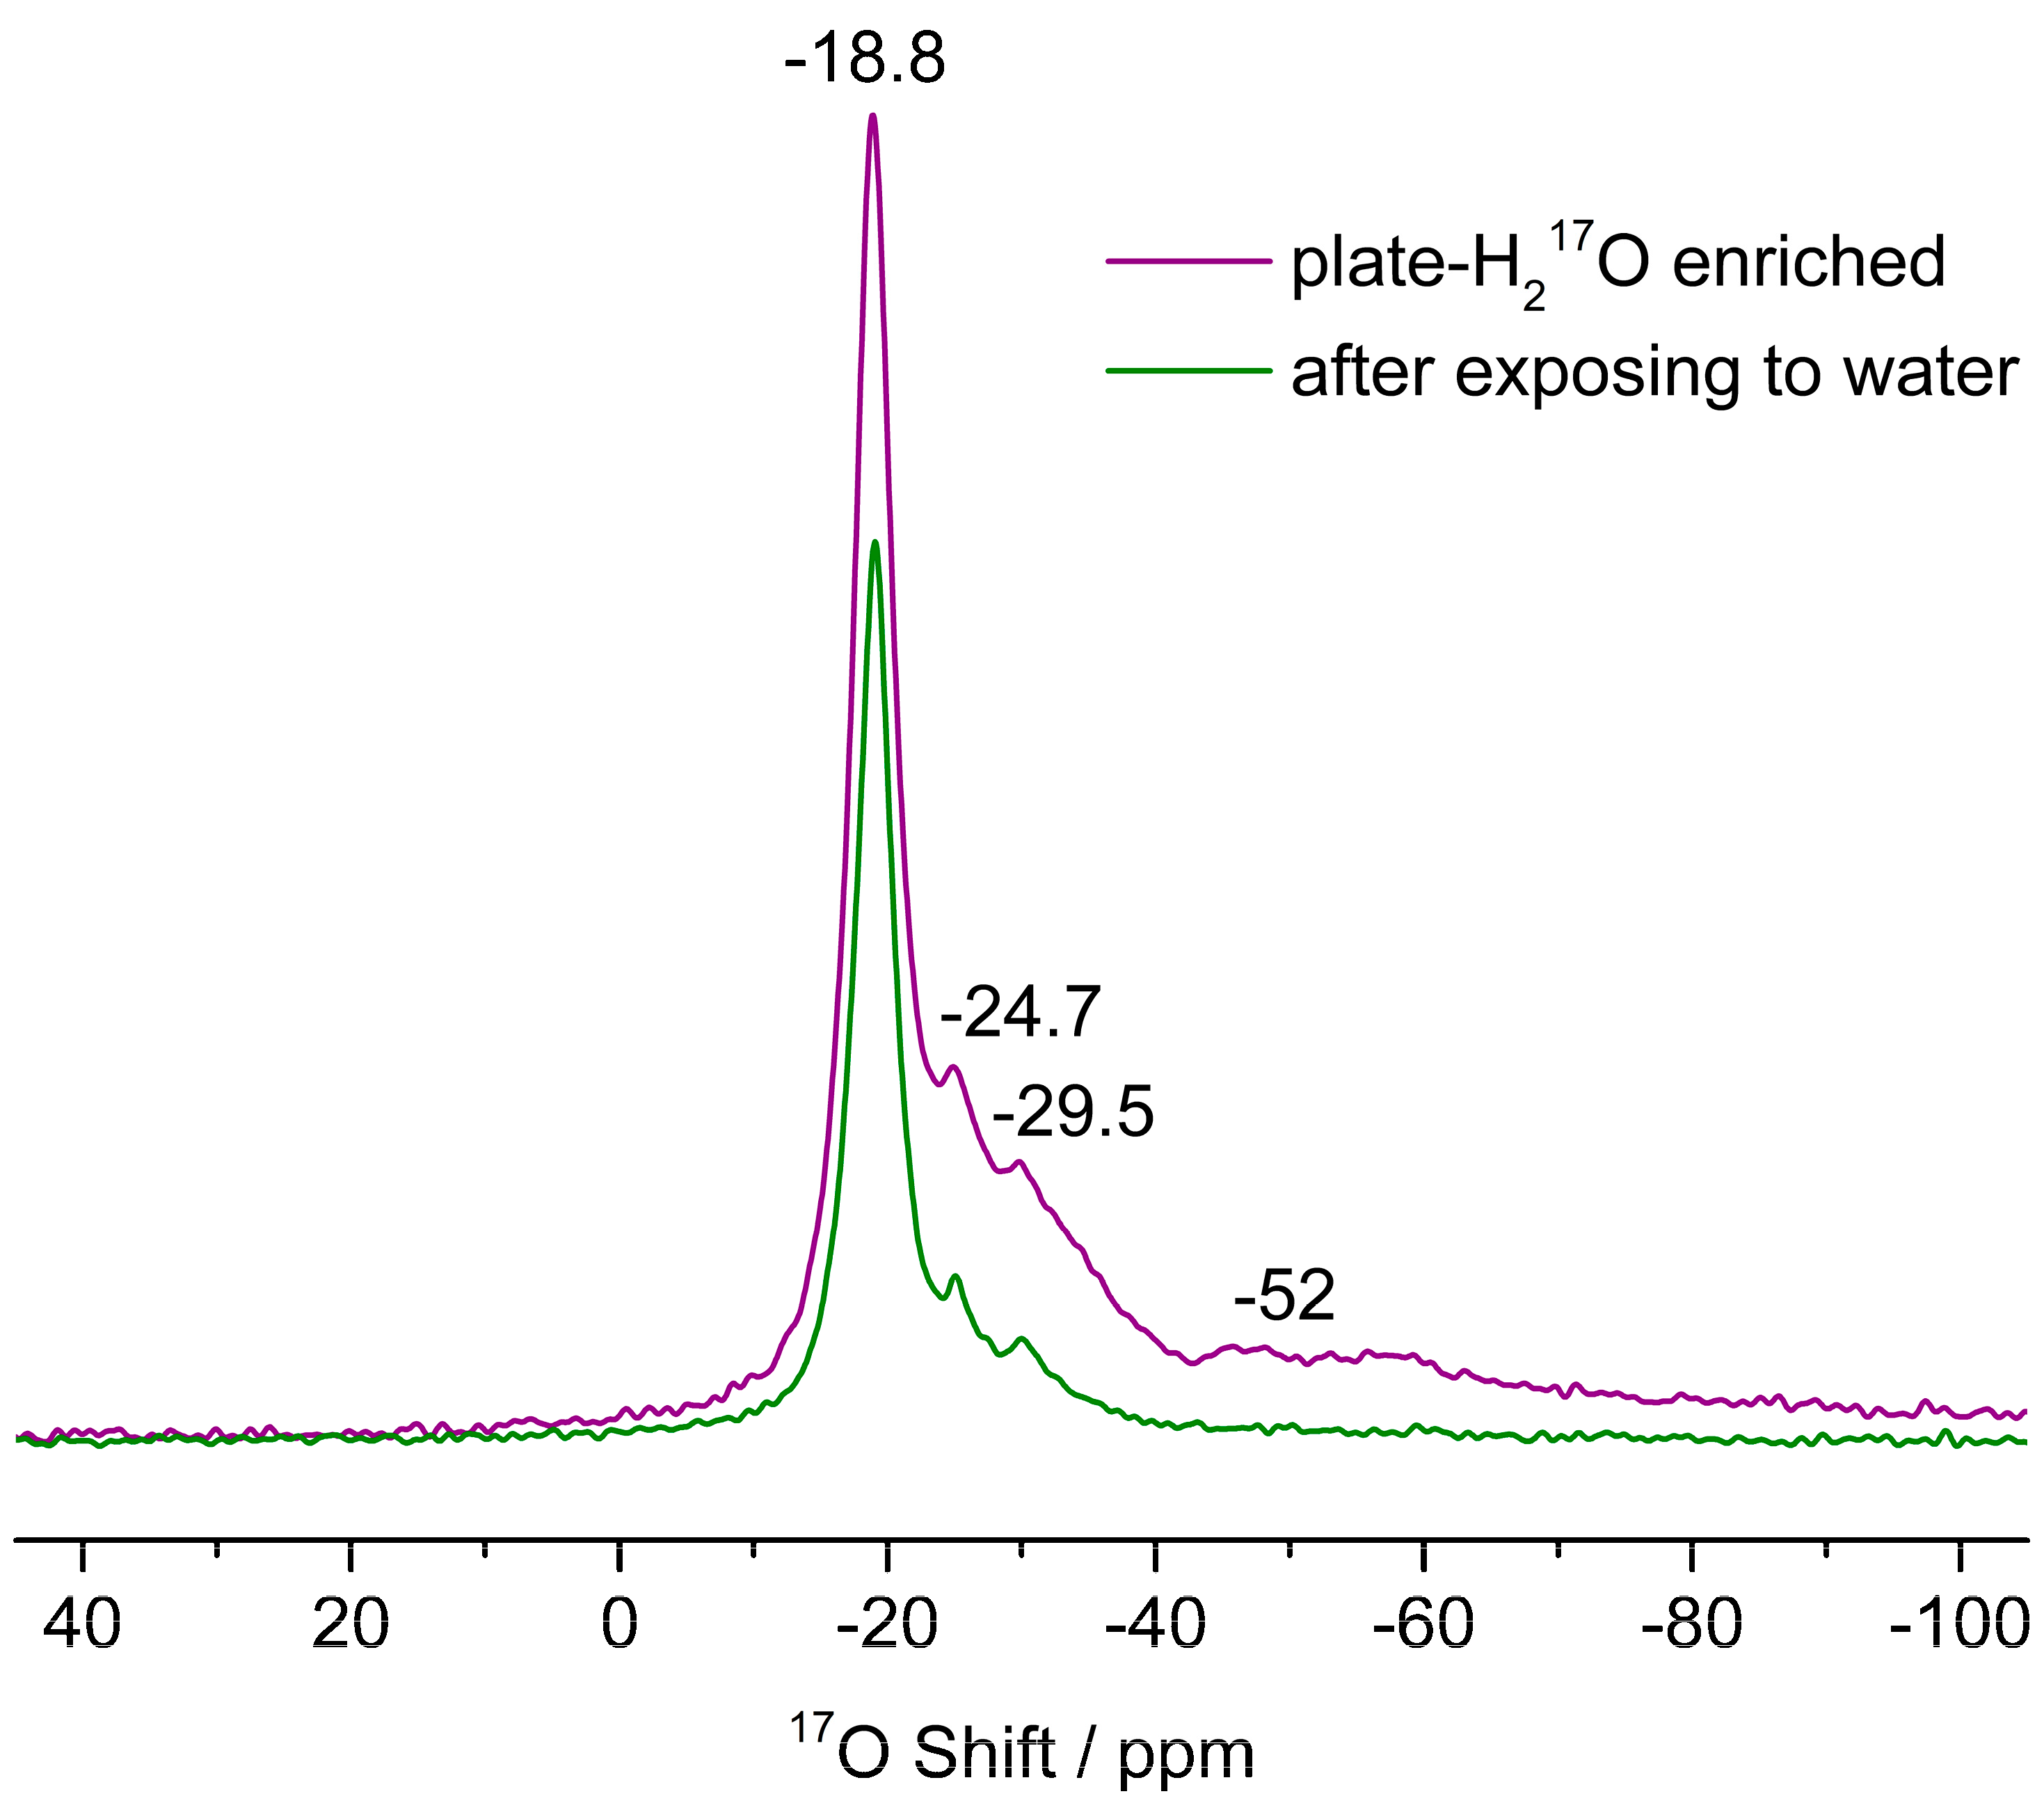
To further evidence the inference that the signal at −18.8 ppm is contributed to by ZnO surface/subsurface oxygen sites, 17O NMR experiments of ZnO nanoplates labeled with H217O before and after exposing to water vapor were carried out. Upon water vapor exposure of the 17O-enriched ZnO nanoplates, the intensity of the resonance at −18.8 ppm prominently decreases, in addition to the observed decrease in the other three peaks (−24.7, −29.5, and −52 ppm) arising from surface/subsurface oxygen sites (Figure 3). The decrease in intensity of the former (−18.8 ppm) is comparable to the decrease in each peak of the latter (−24.7, −29.5, and −52 ppm). The results demonstrate that O ions at −18.8 ppm signal locate at or near the ZnO surface.
Figure 3. 17O NMR spectra of ZnO nanoplates labeled with H217O before and after exposure to water vapor for 1 day. External field: 9.4 T; MAS rate: 14 kHz.
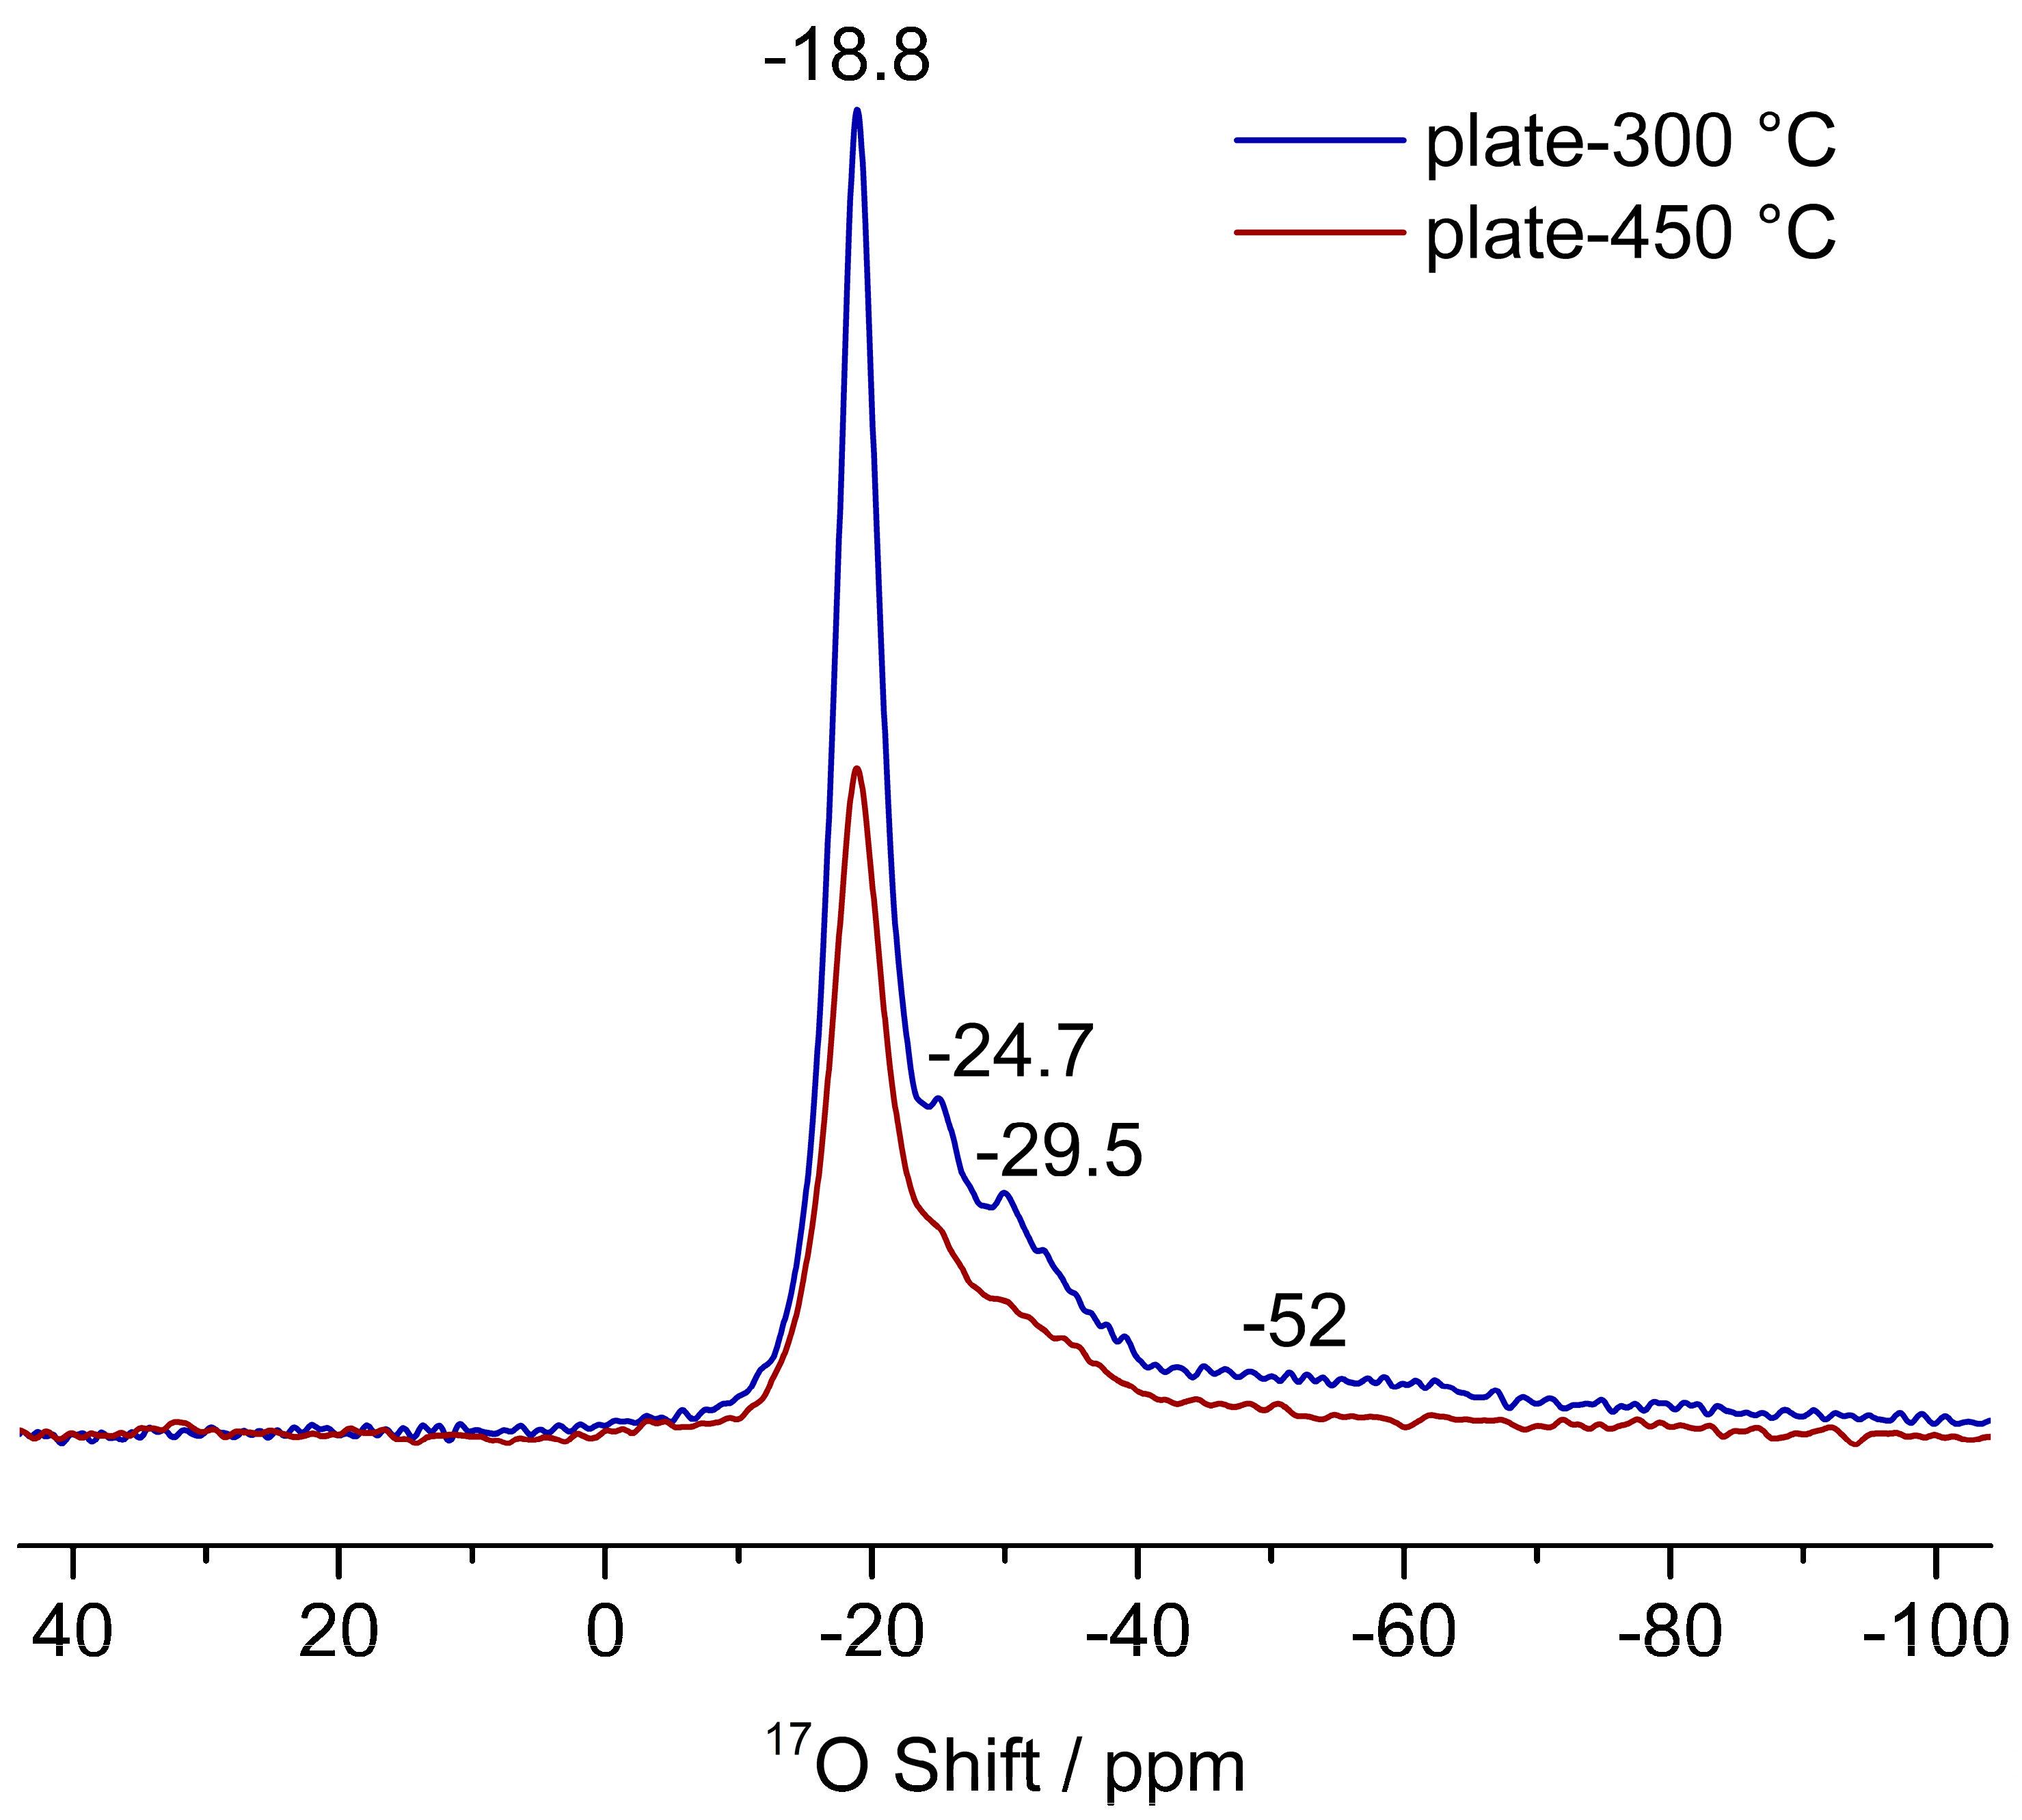
In addition, 17O NMR experiments of ZnO nanoplates after preheating at 300 and 450 °C were conducted to observe the effects of sample surface sintering on 17O NMR signals. For ZnO samples preheated at a higher temperature of 450 °C, the reduced intensities for all NMR peaks at the same level are detected in comparison to the samples preheated at 300 °C (Figure 4), which is due to the reduction in surface area caused by the thermal treatment at elevated temperature (Figure S4), leading to the decrease in surface O ions and thus the corresponding 17O NMR signals. These observations confirm that polar surface and/or subsurface O ions in ZnO nanoplates contribute to the signal at −18.8 ppm. Furthermore, it has been reported that the values of longitudinal relaxation times (T1) can be used to distinguish surface oxygen sites from the bulk, in general, the values for the former are much shorter than the latter. Our previous study shows that the values of T1 measured for the signal at −18.8 ppm assigned to surface O3c and subsurface O4c ions and the resonance at −18.0 ppm attributed to bulk O sites in the spectra of ZnO nanorods are 0.18 and 3.0 s, respectively []. The values of T1 (0.2 s for −18.8 ppm and 2.9 s for −18.0 ppm) obtained for the two peaks in ZnO nanoplates are comparable to those in ZnO nanorods (Figures S5 and S6). These results further support the assignment for the 17O signal at −18.8 ppm originating from surface/subsurface O ions in ZnO nanoplates.
Figure 4. 17O NMR spectra of ZnO nanoplates labeled with H217O after preheating at 300 and 450 °C, respectively. External field: 9.4 T; MAS rate: 14 kHz.

3.3. The Interactions of ZnO Polar Surfaces with Water

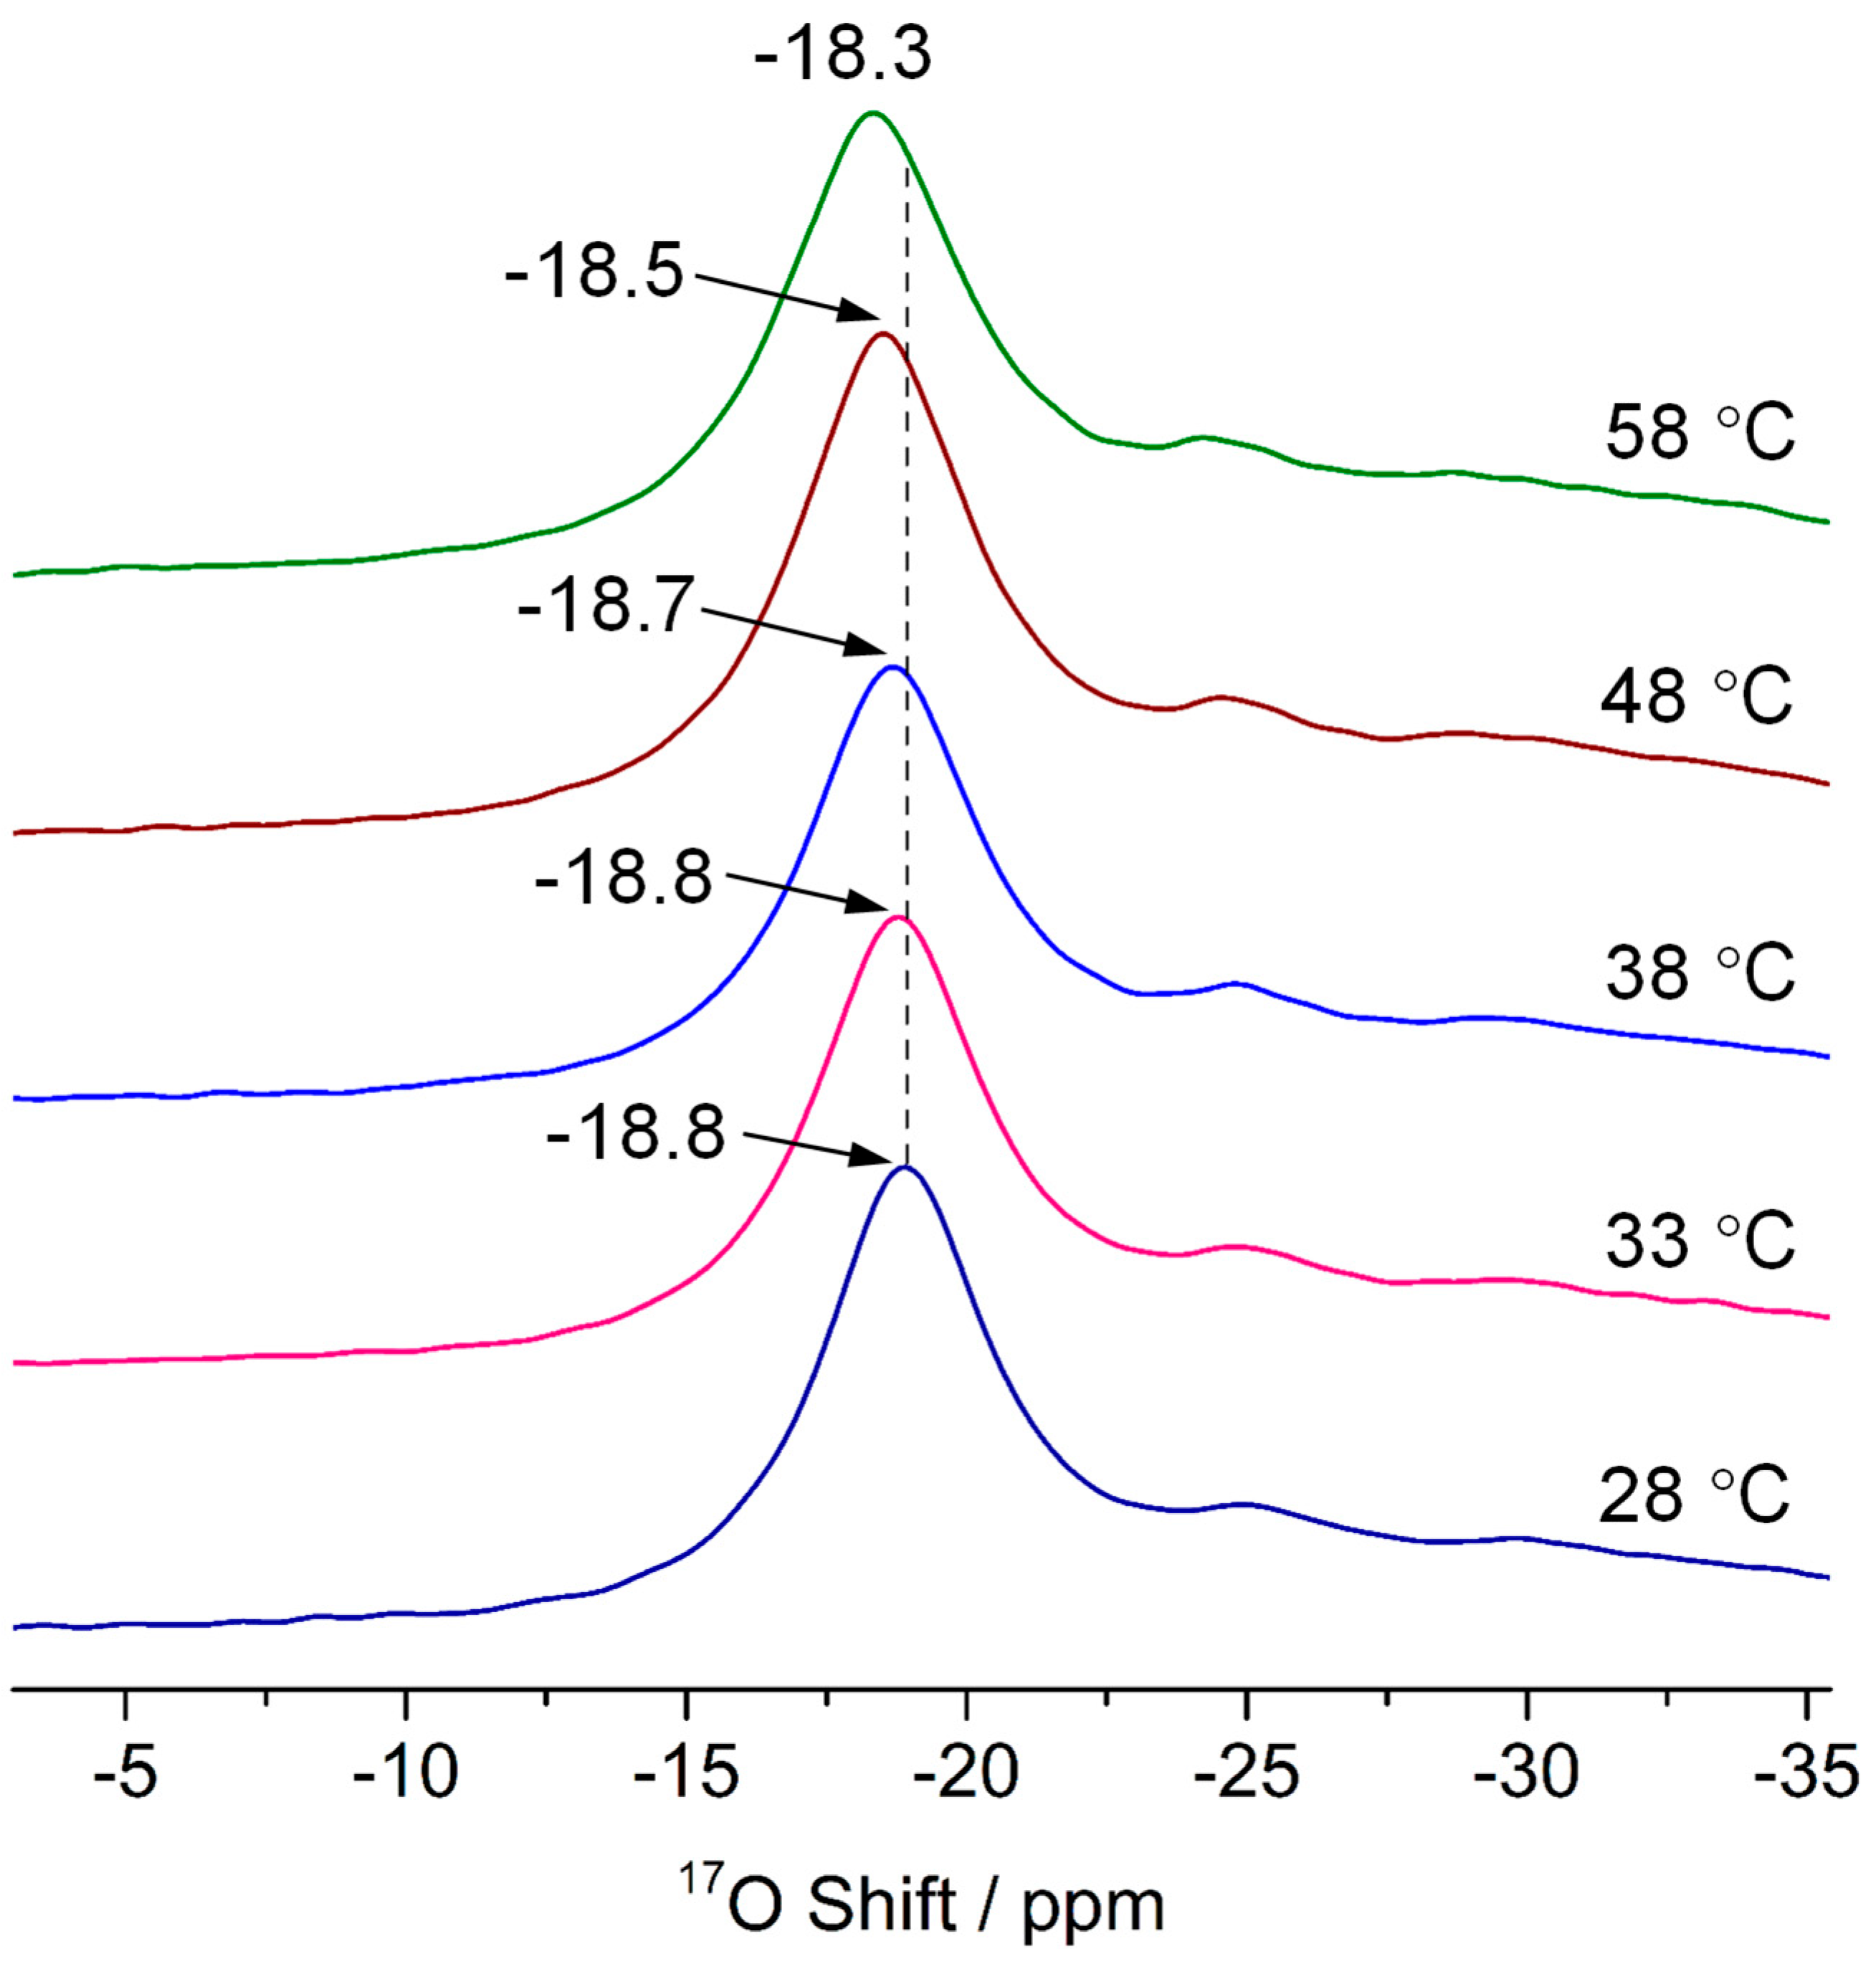
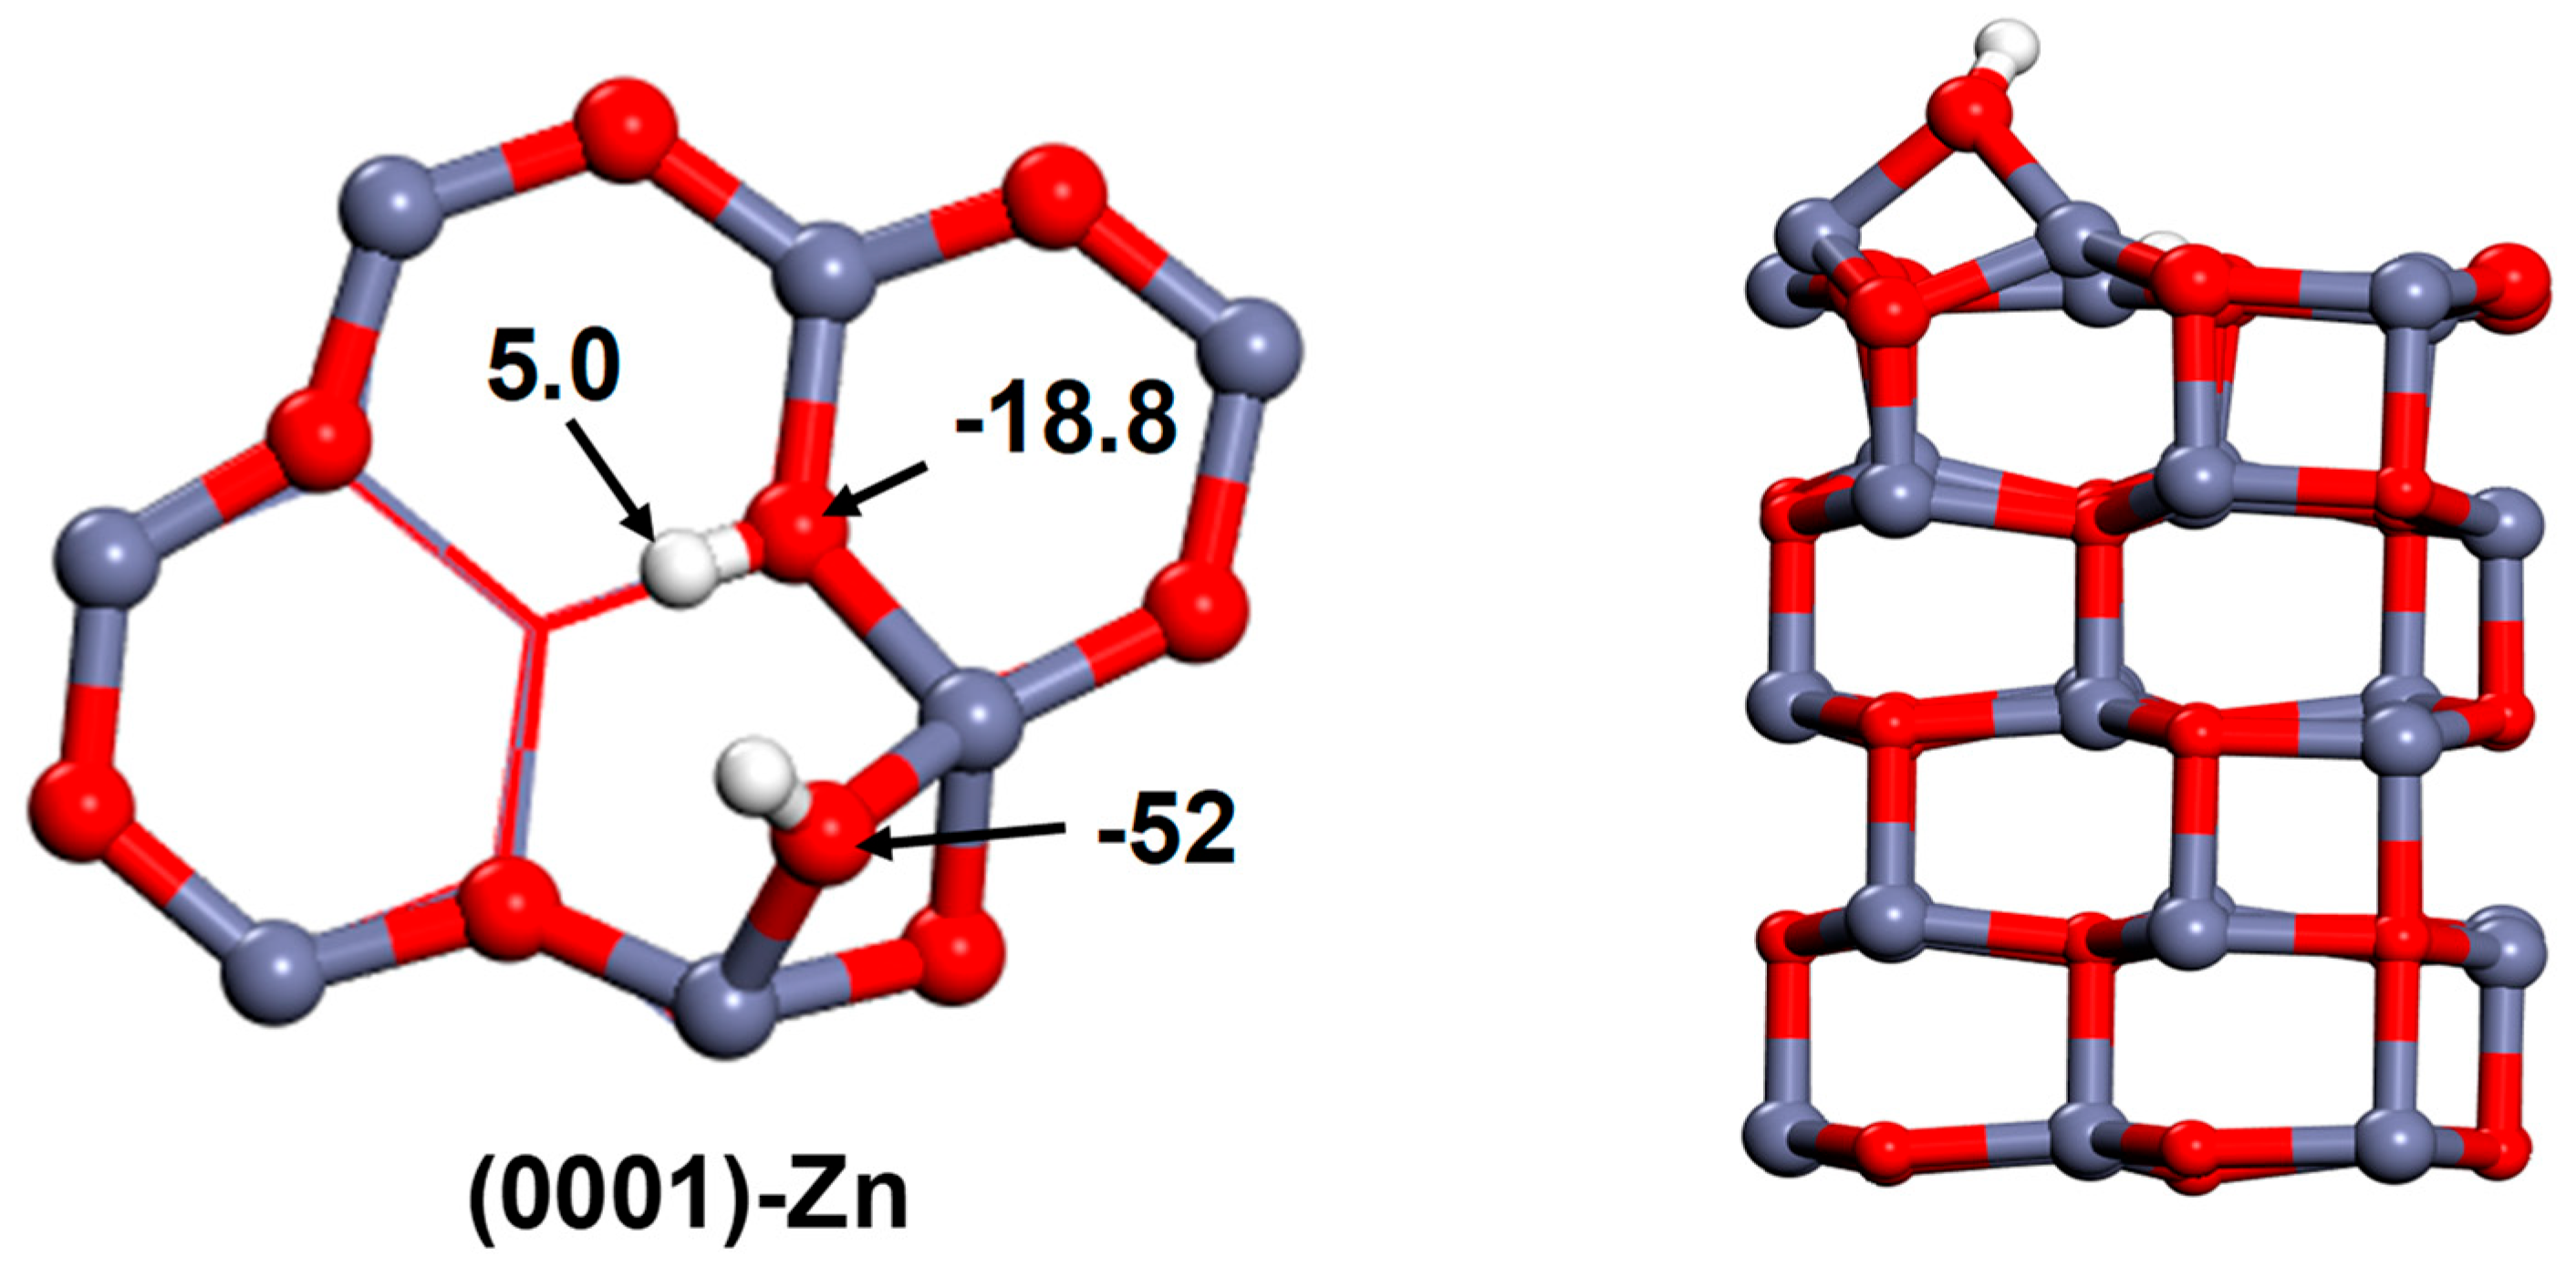
In a variable temperature experiment, Figure 5 shows that the 17O high-frequency peak is dependent on the probe temperature, which gradually shifts to −18.3 ppm from −18.8 ppm with the increase in probe temperature from 28 to 58 °C. After cooling to the initial temperature of 28 °C, this high-frequency resonance returns to its original chemical shift (−18.8 ppm) (Figure S7). This suggests that the process of chemical shift change caused by experimental temperature in this situation is reversible and differs from the migration process of surface oxygen species to inner layers. This observation is similar to our recent NMR study on ZnO nanoplates [], in which the 1H resonance ascribed to H in Zn vacancy due to water dissociation on the polar (0001)-Zn surface, shifts from 5.0 to 4.7 ppm with increasing probe temperature from 28 to 58 °C. The 1H NMR peak also again resonates at its original frequency after returning the probe temperature to 28 °C []. It is worth noting that the chemical shifts in corresponding 17O (−18.8 ppm) and 1H (5.0 ppm) move to the opposite direction upon increasing probe temperature, namely, −18.8 ppm signal shifting to a higher frequency and 5.0 ppm peak moving to a lower frequency. These suggest that the related oxygen nucleus at −18.8 ppm loses electrons and the hydrogen nucleus at 5.0 ppm obtains electrons, respectively, during the variable temperature experimental process. At the same time, all other NMR resonances in both 17O and 1H spectra have no change in chemical shifts apart from the 5.0 ppm (1H) signal and −18.8 ppm (17O) signal (Figure S8). Consequently, a direct relationship between the associated oxygen sites at −18.8 ppm in 17O spectrum and hydrogen sites at 5.0 ppm in 1H spectrum is expected. Based on the assignment of the 1H signal at 5.0 ppm to H in the Zn vacancy on polar (0001)-Zn facets in ZnO nanoplates, the 17O resonance at −18.8 ppm arising from the polar surface can be attributed to O atoms bonded to the H atoms (5.0 ppm) located at Zn vacancy on polar Zn-terminated surface (Figure 6).
Figure 5. Variable temperature 17O NMR spectra of ZnO nanoplates labeled with H217O. The corresponding 17O NMR spectra of ZnO nanoplates are also shown in Figure S8. External field: 9.4 T; MAS rate: 14 kHz.
Figure 6. The optimized structures of ZnO nanoplates for the dissociation of water at the Zn vacancy on polar (0001)-Zn surface. The chemical shifts of oxygen sites observed in 17O NMR experiments are represented by ‘−18.8’ and ‘−52’; the chemical shift of hydrogen sites observed in 1H NMR experiments is represented by ‘5.0’. Left: top view; right: side view. Gray, red, and white spheres represent Zn, O, and H atoms, respectively.
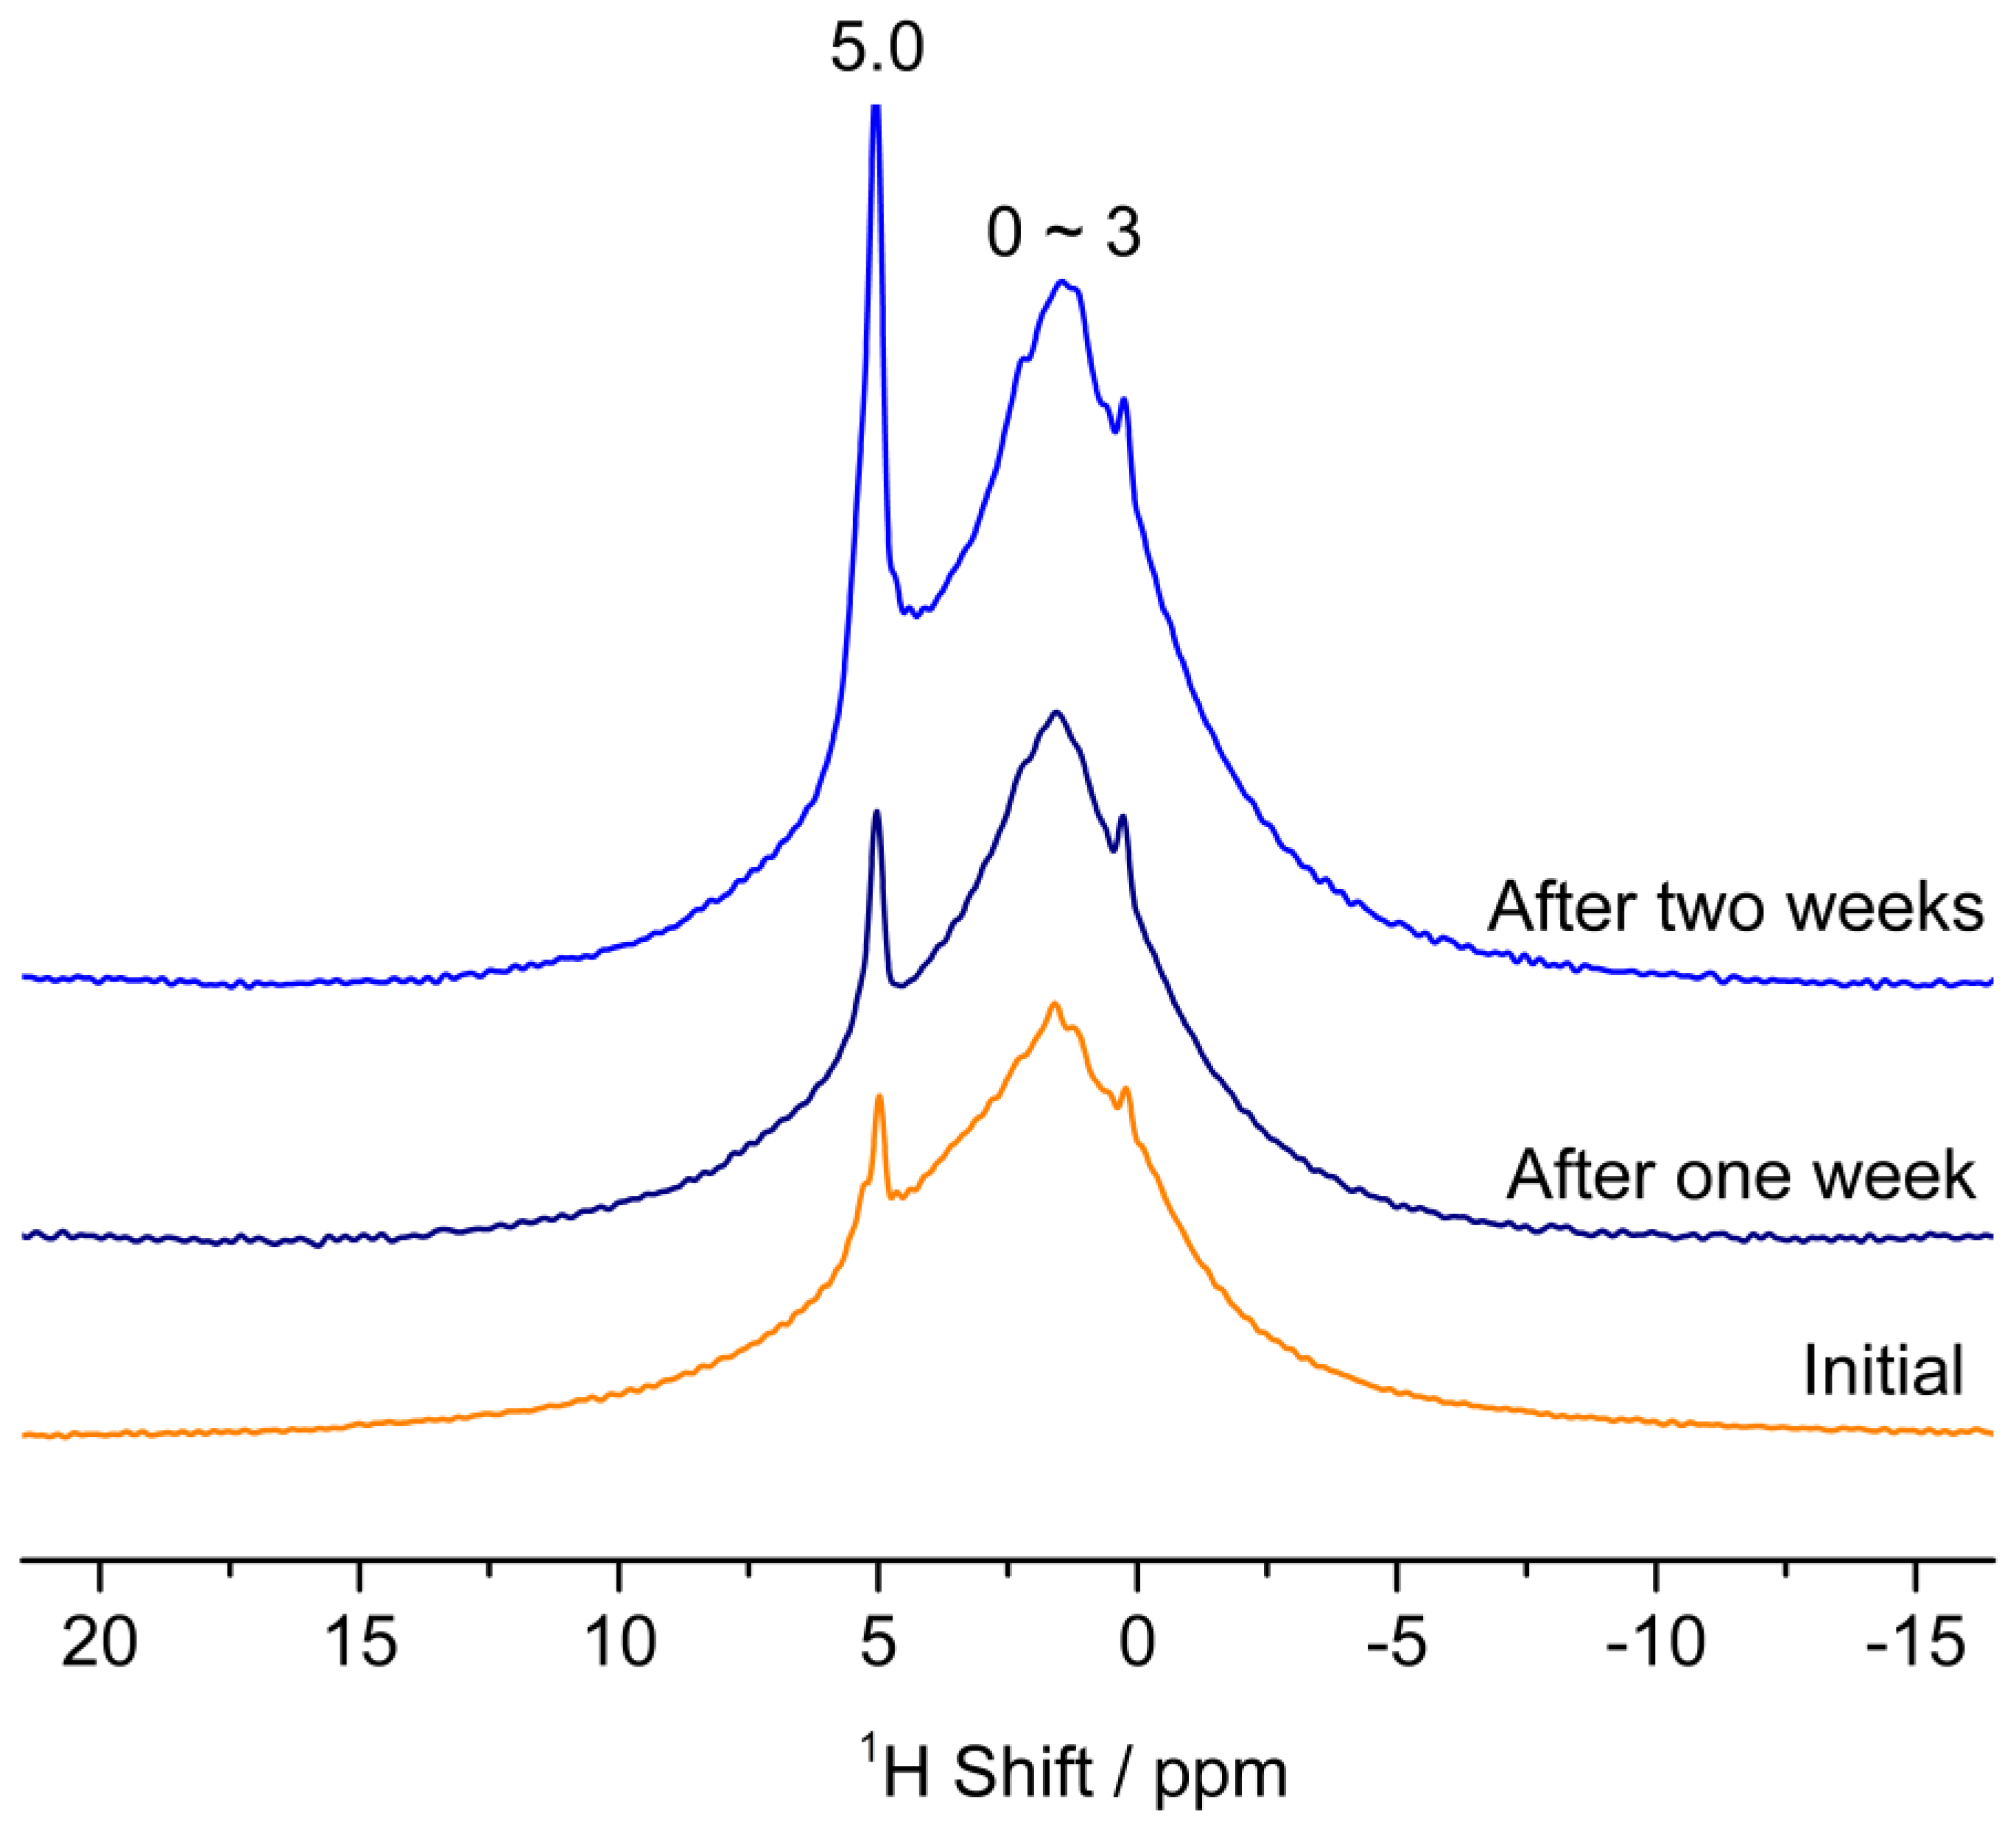
In our last study on ZnO nanoplates, we found that the dissociation of water at the Zn vacancy on (0001)-Zn surface occurs, leading to the increase in the 1H signal at 5.0 ppm after water vapor exposure []. In this work, we prove the relationship of the 17O signal at −18.8 ppm with 1H resonance at 5.0 ppm. Accordingly, the increase in intensity of the −18.8 ppm peak is expected after exposing ZnO nanoplates to water vapor. Figure 7a shows that the signal at −18.8 ppm obviously increases after contacting with water vapor for one week, which becomes stronger after water vapor exposure for two weeks. This change in 17O signal intensity for −18.8 ppm is consistent with the trend observed in 1H NMR spectra at 5.0 ppm with exposing to water vapor for different times (Figure 8). For the other two peaks at −24.7 and −29.5 ppm assigned to nonpolar surface O4c sites, which increase slightly in intensity after exposing to water vapor, probably due to the contribution from the wider and stronger peak at −18.8 ppm. Note that increased intensities of the peak at approximately −52 ppm ascribed to surface OH groups are observed upon water vapor exposure, this can be attributed to the dissociation of water at the Zn vacancy on a polar Zn-terminated surface, generating bridging OH groups (Figure 6). In addition, DFT calculations and experimental results evidenced that water can easily dissociate at defective sites on O-terminated polar facets of ZnO, forming two OH species from one water molecule [,,]. Therefore, OH species on both Zn- and O-terminated polar surfaces in ZnO nanoplates contribute to the −52 ppm signal in Figure 7a. As a comparison, the control experiment for ZnO nanoplates after exposure to a dried container without water was also examined (Figure 7b). The resonance at −18.8 ppm slightly increases after two weeks, and the other three peaks (−24.7, −29.5, and −52 ppm) are still unchanged, further supporting the viewpoint that the increase in intensity at −18.8 ppm in Figure 7a is due to water dissociation at the ZnO polar surface.
Figure 7. (a) 17O NMR spectra of ZnO nanoplates before (initial) and after water vapor exposure. Inset: enlarged OH signals at −52 ppm in 17O NMR spectra. (b) 17O NMR spectra of ZnO nanoplates before (initial) and after exposure to a dried container without water. External field: 9.4 T; MAS rate: 14 kHz.
Figure 8. 1H NMR spectra of ZnO nanoplates before (initial) and after exposing to water vapor. External field: 9.4 T; MAS rate: 14 kHz.
As mentioned above, water can dissociatively adsorb on both O and Zn vacancies on O- and Zn-terminated polar surfaces, forming surface OH groups. Thus, electrostatic repulsion forces from these OH species are expected between polar facets, which may have an important effect on their stability. For this purpose, TEM characterizations for ZnO nanoplates after contacting with water vapor for different times were conducted. Figure S9a shows that the as-prepared ZnO nanoplates are arranged in rows before exposing to water vapor, presumably owing to the electrostatic attraction effect between (0001)-Zn surface with positive charge and (000 1 ¯ )-O surface with negative charge. After contact with water vapor for one week, ZnO samples become more dispersed caused by electrostatic repulsive forces of OH groups on polar surfaces (Figure S9b), matching the increase in intensity of OH species in 17O (−52 ppm) and 1H (0–3 ppm) NMR spectra (Figure 7a and Figure 8). After water vapor exposure for two weeks (Figure S9c), the dispersity of ZnO nanoplates is further enhanced because of more OH groups producing from water dissociation covering (0001)-Zn and (000 1 ¯ )-O polar surfaces, as indicated by the changing trend of OH species in 17O and 1H signals. These results demonstrate that water molecules prefer to dissociate at defect sites on a ZnO polar surface, leading to the formation of OH coatings on both (0001)-Zn and (000 1 ¯ )-O polar facets, which significantly improves polar facet stability by the electrostatic repulsion effect. This is in accordance with previous theoretical and experimental reports that state that constructing hydroxylated surfaces can effectively promote polar face stability of ZnO samples [,,].

4. Conclusions

The interactions between ZnO nanoplates and water, as well as the associated stabilization mechanisms of polar facets, are investigated with 17O NMR spectroscopy. We show that O ions around Zn defect sites on polar (0001)-Zn surfaces, in addition to nonpolar (10 1 ¯ 0) facets, also contribute to the 17O signal at −18.8 ppm. Water can dissociate at defective sites on polar (0001)-Zn and (000 1 ¯ )-O surfaces, generating H occupied Zn vacancies and surface OH species. Therefore, the relevant 17O/1H signals assigned to OH species significantly increase after exposure to water vapor, which improves the dispersity of plate-shaped ZnO nanocrystals and thus the stability of polar facets by repulsive OH-OH interactions between polar surfaces. The results presented here are significant to understanding the interactions between polar facets in nanomaterials and water and its stabilization mechanisms at the atomic level.

Supplementary Materials

The following supporting information can be downloaded at: https://www.mdpi.com/article/10.3390/app152211938/s1: Figure S1: (a) XRD pattern, and (b–d) TEM/HRTEM images of ZnO nanoplates. Figure S2: TEM images of (a) L-rod and (b) S-rod. Figure S3: The structural models of ZnO nanorods used for DFT calculations. (a) (Side view). (b) (Top view). The optimized ZnO (10 1 ¯ 0) surface with a monolayer of water molecules in which half of the water molecules are dissociatively adsorbed, while the other half are molecularly adsorbed (model M1D1). (c) (Side view). (d) (Top view). ZnO (10 1 ¯ 0) surface with a monolayer of molecularly adsorbed water molecules (model M2). Figure S4: XRD pattern of ZnO nanoplates preheated at 300 and 450 °C, respectively, and the corresponding surface area. Figure S5: Longitudinal relaxation studies of ZnO nanoplates and L-rod. (a) 17O NMR spectra signal intensities measured with different recycle delays on the sample of ZnO nanoplates using a solution π/6 pulse as the excitation pulse (left), and T1 analytical fits for the high-frequency peak at −18.8 ppm using a stretch exponential function of the type I t = I 0 1 e ( t T 1 ) b , where I(t) and I0 are the signal intensities at recycle delay t and at equilibrium, respectively. (b) Similarly to ZnO nanoplates, the corresponding 17O NMR spectra signal intensities and T1 analytical fits for L-rod. Figure S6: T1 analytical fits for (a) ZnO nanoplates and (b) L-rod using a stretch exponential function of the type I t = I 0 1 e ( t T 1 ) b , where I(t) and I0 are the signal intensities at recycle delay t and at equilibrium, respectively, based on 17O NMR spectral intensities measured with different recycle delays on corresponding ZnO samples using a solution π/6 pulse as the excitation pulse. Figure S7: 17O NMR spectra of ZnO nanoplates obtained at 28 °C before (initial) and after (recovered) the variable temperature process shown in Figure 5. External field: 9.4 T; MAS rate: 14 kHz. Figure S8: 17O NMR spectra of ZnO nanoplates labeled with H217O with a larger frequency range as a function of probe temperature (c.f. Figure 5). Figure S9: TEM images of initial ZnO nanoplates (a) and the samples after exposing to saturated water vapor at room temperature for one (b) and two weeks (c), respectively. Table S1: Data analysis on the exposed facet ratios of different ZnO samples. Table S2: The assignments of different 17O signals of ZnO nanorods obtained at 9.4 T.

Author Contributions

B.S.: Conceptualization, Investigation, Methodology, Formal analysis, Writing—original draft, Data curation, Funding acquisition. L.X.: Investigation, Formal analysis, Validation, Writing—review and editing. All authors have read and agreed to the published version of the manuscript.

Funding

This research was funded by the National Natural Science Foundation of China (NSFC) (22402085) and the Postdoctoral Fellowship Program (Grade C) of China Postdoctoral Science Foundation under Grant Number GZC20240742.

Institutional Review Board Statement

Not applicable.

Data Availability Statement

The data presented in this study are available upon request from the corresponding author.

Conflicts of Interest

The authors declare no conflicts of interest.

References

  1. Zhang, Q.F.; Dandeneau, C.S.; Zhou, X.Y.; Cao, G.Z. ZnO nanostructures for dye-sensitized solar cells. Adv. Mater. 2009, 21, 4087–4108. [Google Scholar] [CrossRef]
  2. Wöll, C. The chemistry and physics of zinc oxide surfaces. Prog. Surf. Sci. 2007, 82, 55–120. [Google Scholar] [CrossRef]
  3. Özgür, Ü.; Alivov, Y.I.; Liu, C.; Teke, A.; Reshchikov, M.A.; Doğan, S.; Avrutin, V.; Cho, S.-J.; Morkoç, H. A comprehensive review of ZnO materials and devices. J. Appl. Phys. 2005, 98, 041301. [Google Scholar] [CrossRef]
  4. Bu, Y.B.; Weststrate, C.J.; Niemantsverdriet, J.W.; Fredriksson, H.O.A. Role of ZnO and CeOx in Cu-based model catalysts in activation of H2O and CO2 dynamics studied by in situ ultraviolet–visible and X-ray photoelectron spectroscopy. ACS Catal. 2016, 6, 7994–8003. [Google Scholar] [CrossRef]
  5. Behrens, M.; Studt, F.; Kasatkin, I.; Kühl, S.; Hävecker, M.; Abild-Pedersen, F.; Zander, S.; Girgsdies, F.; Kurr, P.; Kniep, B.-L.; et al. The active site of methanol synthesis over Cu/ZnO/Al2O3 industrial catalysts. Science 2012, 336, 893–897. [Google Scholar] [CrossRef] [PubMed]
  6. Jiao, F.; Li, J.J.; Pan, X.L.; Xiao, J.P.; Li, H.B.; Ma, H.; Wei, M.M.; Pan, Y.; Zhou, Z.Y.; Li, M.R.; et al. Selective conversion of syngas to light olefins. Science 2016, 351, 1065–1068. [Google Scholar] [CrossRef]
  7. Daté, M.; Okumura, M.; Tsubota, S.; Haruta, M. Vital role of moisture in the catalytic activity of supported gold nanoparticles. Angew. Chem. Int. Ed. 2004, 43, 2129–2132. [Google Scholar] [CrossRef] [PubMed]
  8. Meyer, B.; Marx, D.; Dulub, O.; Diebold, U.; Kunat, M.; Langenberg, D.; Wöll, C. Partial dissociation of water leads to stable superstructures on the surface of zinc oxide. Angew. Chem. Int. Ed. 2004, 43, 6641–6645. [Google Scholar] [CrossRef]
  9. Dulub, O.; Meyer, B.; Diebold, U. Observation of the dynamical change in a water monolayer adsorbed on a ZnO surface. Phys. Rev. Lett. 2005, 95, 136101. [Google Scholar] [CrossRef]
  10. Dulub, O.; Diebold, U.; Kresse, G. Novel stabilization mechanism on polar surfaces: ZnO(0001)-Zn. Phys. Rev. Lett. 2003, 90, 016102. [Google Scholar] [CrossRef]
  11. Önsten, A.; Stoltz, D.; Palmgren, P.; Yu, S.; Göthelid, M.; Karlsson, U.O. Water adsorption on ZnO(0001): Transition from triangular surface structures to a disordered hydroxyl terminated phase. J. Phys. Chem. C 2010, 114, 11157–11161. [Google Scholar] [CrossRef]
  12. Song, B.T.; Li, Y.H.; Wu, X.-P.; Wang, F.; Lin, M.; Sun, Y.H.; Jia, A.-P.; Ning, X.; Jin, L.; Ke, X.K.; et al. Unveiling the surface structure of ZnO nanorods and H2 activation mechanisms with 17O NMR spectroscopy. J. Am. Chem. Soc. 2022, 144, 23340–23351. [Google Scholar] [CrossRef]
  13. Liao, F.L.; Huang, Y.Q.; Ge, J.W.; Zheng, W.R.; Tedsree, K.; Collier, P.; Hong, X.L.; Tsang, S.C. Morphology-dependent interactions of ZnO with Cu nanoparticles at the materials’ interface in selective hydrogenation of CO2 to CH3OH. Angew. Chem. Int. Ed. 2011, 50, 2162–2165. [Google Scholar] [CrossRef]
  14. Song, B.T.; Li, Y.H.; Sun, Y.H.; Peng, L.M.; Xie, L.-H. 17O solid-state NMR study on exposed facets of ZnO nanorods with different aspect ratios. Phys. Chem. Chem. Phys. 2024, 26, 7890–7895. [Google Scholar] [CrossRef]
  15. Kresse, G.; Hafner, J. Ab initio molecular-dynamics simulation of the liquid-metal-amorphous-semiconductor transition in germanium. Phys. Rev. B 1994, 49, 14251–14269. [Google Scholar] [CrossRef]
  16. Perdew, J.P.; Burke, K.; Ernzerhof, M. Generalized gradient approximation made simple. Phys. Rev. Lett. 1996, 77, 3865–3868. [Google Scholar] [CrossRef]
  17. Blochl, P.E. Projector augmented-wave method. Phys. Rev. B 1994, 50, 17953–17979. [Google Scholar] [CrossRef]
  18. Turner, G.L.; Chung, S.E.; Oldfield, E. Solid-state oxygen-17 nuclear magnetic resonance spectroscopic study of the group 11 oxides. J. Magn. Reson. 1985, 64, 316–324. [Google Scholar] [CrossRef]
  19. Song, B.T.; Zhu, Q.; Xie, L.-H. Investigation of the water-induced polar facet stabilization mechanism in ZnO nanoplates with 1H NMR spectroscopy. Phys. Chem. Chem. Phys. 2025, 27, 14054–14059. [Google Scholar] [CrossRef] [PubMed]
  20. Iachella, M.; Cure, J.; Rouhani, M.D.; Chabal, Y.; Rossi, C.; Estève, A. Water dissociation and further hydroxylation of perfect and defective polar ZnO model surfaces. J. Phys. Chem. C 2018, 122, 21861–21873. [Google Scholar] [CrossRef]
  21. Noei, H.; Qiu, H.S.; Wang, Y.M.; Löffler, E.; Wöll, C.; Muhler, M. The identification of hydroxyl groups on ZnO nanoparticles by infrared spectroscopy. Phys. Chem. Chem. Phys. 2008, 10, 7092–7097. [Google Scholar] [CrossRef] [PubMed]
  22. Mora-Fonz, D.; Lazauskas, T.; Farrow, M.R.; Catlow, C.R.A.; Woodley, S.M.; Sokol, A.A. Why are polar surfaces of ZnO stable? Chem. Mater. 2017, 29, 5306–5320. [Google Scholar] [CrossRef]
  23. Ye, H.G.; Chen, G.D.; Niu, H.B.; Zhu, Y.Z.; Shao, L.; Qiao, Z.J. Structures and mechanisms of water adsorption on ZnO(0001) and GaN(0001) surface. J. Phys. Chem. C 2013, 117, 15976–15983. [Google Scholar] [CrossRef]
  24. Zhang, W.Y.; Zhang, D.D.; Yan, W.S.; Luo, W.Y.; Zhao, C.P.; Liu, D. Optically induced rapid wetting transition on Zn-polar and O-polar zinc oxide. Langmuir 2019, 35, 14791–14796. [Google Scholar] [CrossRef] [PubMed]
Disclaimer/Publisher’s Note: The statements, opinions and data contained in all publications are solely those of the individual author(s) and contributor(s) and not of MDPI and/or the editor(s). MDPI and/or the editor(s) disclaim responsibility for any injury to people or property resulting from any ideas, methods, instructions or products referred to in the content.

Article Metrics

Citations

Article Access Statistics

Multiple requests from the same IP address are counted as one view.