Article

Outflow Boundary Conditions for Turbine-Integrated Rotating Detonation Combustors

1
School of Aeronautics and Astronautics, Purdue University, West Lafayette, IN 47907, USA
2
Ames National Laboratory, U.S. Department of Energy, Ames, IA 50010, USA
3
National Energy Technology Laboratory, U.S. Department of Energy, Morgantown, WV 26505, USA
4
National Energy Technology Laboratory, U.S. Department of Energy, Pittsburgh, PA 15236, USA
*
Author to whom correspondence should be addressed.
Appl. Sci. 2025, 15(22), 11922; https://doi.org/10.3390/app152211922
Submission received: 23 September 2025 / Revised: 3 November 2025 / Accepted: 5 November 2025 / Published: 10 November 2025
(This article belongs to the Special Issue Computational Fluid Dynamics in Mechanical Engineering)

Abstract

This study examines outflow boundary conditions (BCs) in computational fluid dynamics (CFD) simulations of a transition duct with and without guide vanes that converts supersonic flow exiting a rotating detonation combustor (RDC) to subsonic flow to drive a turbine. Since the flow exiting the transition duct has swirling shock waves with significant spatial and temporal variations in pressure, temperature, and Mach number, imposing proper BCs poses a challenge. To ensure all swirling shock waves exit the transition duct without creating non-physical reflected waves at its outlet, this study examined three outflow BCs: (1) the average pressure imposed at the duct’s outlet, (2) a nonreflecting BC (NRBC) with a specified average pressure imposed at the duct’s outlet, (3) the average pressure imposed at the outlet of an extension duct made up of a buffer layer and a sponge layer. This study is based on the three-dimensional, unsteady density-weighted-ensemble-averaged continuity, Navier–Stokes, and energy equations for a thermally perfect gas closed by the realizable k–ε model and “enhanced” wall functions. The results obtained show that imposing an average pressure at the transition duct’s outlet produces spurious waves that degrade the physical meaningfulness of the solution. When the NRBC was applied, swirling shock waves exited the duct’s outlet without creating spurious waves. However, its usage requires the gas to be thermally, as well as calorically, perfect, which this study shows could be a concern. By imposing the average pressure at the outlet of an extension duct, the gas does not need to be calorically perfect. The results obtained show the effects of the sponge layer’s length and coarsening ratio on damping nonuniformities in non-physical reflected waves to ensure the flow exiting the transition duct’s outlet can do so as if there are no boundaries present and has the desired average pressure—even though the BC is applied at the extension duct’s outlet.

1. Introduction

Rotating detonation combustors (RDCs), by having combustion occurring nearly isochorically, increase pressure gain when compared to combustors that operate nearly isobarically. Thus, rotating detonation combustors (RDCs)—patented as early as 1949 [1] and studied as early as the 1960s [2,3]—have promise for propulsion and electric power generation. Many investigators have studied the flow physics in RDCs computationally and experimentally. Bykovskii et al. [4] and Lu and Braun [5] provided excellent reviews of the literature till 2014. More recent studies can be found in Refs. [6,7,8,9,10,11,12,13,14,15,16,17,18,19,20,21,22,23,24] and the papers cited therein.
When an RDC is integrated with a conventional turbine to generate electric power or propulsion, a transition duct is needed to convert the flow exiting the RDC from supersonic to subsonic speeds while maximizing temperature and pressure before entering the turbine. To perform computational fluid dynamics (CFD) simulations of flow in a transition duct with or without guide vanes that connect an RDC to a turbine, the computational domain must be defined, which typically involves the following: the inflow boundary, where flow from the RDC enters the transition duct; all solid surfaces of the transition duct, including the guide vanes; and the outflow boundary, where the flow exits the transition duct. The BC on solid surfaces is straight forward with no slip plus a temperature or a heat flux condition. The BC at the inflow boundary is straightforward if the flow exiting the RDC is supersonic. This is because for supersonic flow, all flow variables can be specified. The BC at the outflow boundary, however, is problematic. This is because even though the flow at the transition duct’s outlet is subsonic, the swirling shock waves—created by the RDC—propagate throughout the transition duct at supersonic speeds. Thus, the flow exiting the outflow boundary is not only unsteady but also has significant variations in pressure, temperature, and Mach number in the azimuthal direction. The ideal BC is one that enables the imposition of an average pressure at the duct’s outlet and still allow the unsteady swirling shock waves to exit without creating non-physical waves that reflect back into the transition duct.
BCs that seek to ensure waves—that approach an inflow or an outflow boundary—leave those boundaries without creating spurious (i.e., non-physical) reflections are known as absorbing or nonreflecting boundary conditions (NRBCs). BCs at the inflow and outflow boundaries for the Navier–Stokes equations are complicated and not well understood, especially at lower speeds and near walls where streamwise diffusion terms are comparable to advection terms (see Gustafsson and Sundstrom [25]). For the Euler equations, BCs at inflow and outflow boundaries are well understood via characteristic theory, which has been used to develop inflow and outflow BCs for the Navier–Stokes equations. However, this approach is acceptable only for viscous flows at high Reynolds numbers. This is because at high Reynolds numbers, viscous force in the streamwise direction can be neglected so the Navier–Stokes equations behave like the Euler equations along the streamwise direction. As a result, NRBCs developed are mostly based on one-dimensional (1D) Euler equations [26,27,28,29,30,31,32,33,34,35,36,37,38], and they are intended to be implemented along the streamwise direction at the inflow and outflow boundaries. NRBCs that found success are those that control characteristic waves’ amplitudes to ensure no reflections at boundaries while imposing BCs. The often-used linear relaxation method (LRM) for the outflow boundary assumes the amplitude is proportional to the difference between the computed pressure at the boundary and the desired pressure at the boundary [26,35]. The challenge is determining the appropriate proportionality constant for each problem. Selle et al. [35] developed an analytical method to determine that proportionality constant. However, the method developed requires the gas to be thermally and calorically perfect (i.e., not only must P = ρ R T , the constant-pressure and constant-volume specific heats ( c p and c v ) must also be constants). Though NRBCs that allow c p and c v to be a function of temperature are possible, they have not been developed because it can be extremely complicated and tedious (e.g., [38]). On NRBCs, it is interesting to note that Colonius et al. [34] found adding an extension duct with a sponge layer (i.e., a layer with grid spacings that coarsen along the flow direction) causes attenuation of the reflected wave to increase by three orders of magnitude. The mechanism by which waves are dampened by a coarsened grid was examined by Kreiss et al. [37].
Though physically meaningful solutions can only be obtained with proper BCs enforced, many CFD studies of RDCs do not report how BCs at the outflow boundary are implemented. For those CFD studies that did report this information, some implemented NRBCs (see, e.g., [5,7,19]). However, to use those NRBCs, c p and c v were assumed to be constant throughout the flow domain in their studies. For RDCs, the differences between the maximum and minimum temperatures in the azimuthal direction created by the detonation and oblique shock waves are significant. Thus, assuming constant c p and c v maybe unacceptable. To account for temperature-dependent c p and c v , other CFD studies had forgone NRBCs and just imposed an averaged static pressure, which is the correct BC at an outflow boundary with subsonic flow based on characteristic theory. Regrettably, whenever this BC was imposed, non-physical reflected waves could be seen in their solutions. Thus, other CFD studies added an extension duct and then imposed the average constant pressure at its outlet [11,14,15,16]. However, details of the extension ducts used (e.g., length and their properties) and how well they controlled reflected shock waves were not reported.
Since outflow BCs strongly affect the meaningfulness of solutions generated and many CFD studies of RDCs do not adequately describe how outflow BCs were implemented and assessed, the objective of this study is threefold. The first is to examine the performance of the following three outflow BCs in CFD simulations of flow in a transition duct with and without guide vanes that convert supersonic flow from the RDC to subsonic flow for the turbine: (1) impose an average pressure at the outlet of the transition duct—the commonly used method, (2) impose the LRM-NRBC from Selle et al. [35] with the required average pressure at the outlet of the transition duct—a less used method, and (3) impose an average pressure at the outlet of an extension duct with a buffer layer and a sponge layer—an occasionally used method but not described or assessed. The second objective is to provide guidelines on the length and the ratio of grid coarsening in the sponge layer needed to obtain meaningful solutions. The third objective is to examine the effects of temperature-dependent c p and c v on the solutions generated because using LRM-NRBC requires them to be constants, whereas using an extension duct does not.
The objectives of this study are addressed by using the ensemble-averaged continuity, Navier–Stokes, and energy equations closed by the realizable k - ϵ model with wall functions (i.e., unsteady RANS). Although RANS has challenges in modeling turbulence because large scales in turbulent flows are problem-dependent and wall functions do not account for shock-wave/boundary-layer interactions in the low-Reynolds number regions next to walls, the ability of an outflow BC to enable swirling shock waves to exit without creating spurious reflected waves at the outlet is unconnected to turbulence models and wall functions. In fact, one of the outflow BCs examined, the one involving extension ducts, could be used in direct or large-eddy simulations of RDCs. Also, the geometry and operating conditions of the problem studied are not intended to examine the performance of transition ducts with and without guide vanes that connect RDCs to turbines. Those conditions were selected to be representative of what exits RDCs and sufficiently stringent to test the ability of outflow BCs to mitigate or remove non-physical phenomena at the transition duct’s outlet.
In the remainder of this paper, the problem studied is first explained. Afterwards, the problem formulation and the numerical method of solution along with all BCs examined are described. This is followed by grid and time-step size sensitivity studies, presentation of results, and a summary of key findings.

2. Problem Description

The problem selected to meet the objectives of this study is the flow in a transition duct with and without guide vanes that connects an RDC at its inlet and a turbine at its outlet. Figure 1 shows a three-dimensional isometric view and a schematic of the transition duct with guide vanes and an extension duct. From Figure 1, the transition duct can be seen to have an annular cross section. Its inner radius is R i = 130 mm. Its outer radius, R o , increases smoothly along z from R 1 = 153 mm at z = 0 to R 2 = 190 mm at z = L 1 and remains at R 2 for all z L 1 . The geometry of the annulus was tuned to ensure the transition duct could accommodate unsteady supersonic flow with swirling shock waves without “unstarting”. Also, angles in the duct’s divergence portion along z are less than 8 o to ensure no flow separation. The length of the transition duct without guide vanes is L 1 =   750 mm. With guide vanes, that length is L 1 + L 2 , where L 2 =   350 mm. On the guide vanes, there are nine airfoils that are equally spaced in the azimuthal direction. Each airfoil extends from the inner to the outer wall of the annulus and has an axial chord length of 60.1 mm and a thickness of 15.6 mm at its leading edge in the azimuthal direction. The extension duct has a buffer layer with length of L b = 50 mm R h and a sponge layer with length of L = 5 R h , 15 R h , and 30 R h , where R h = R o R i = 60 mm is the hydraulic radius of the transition duct at z = L 1 .
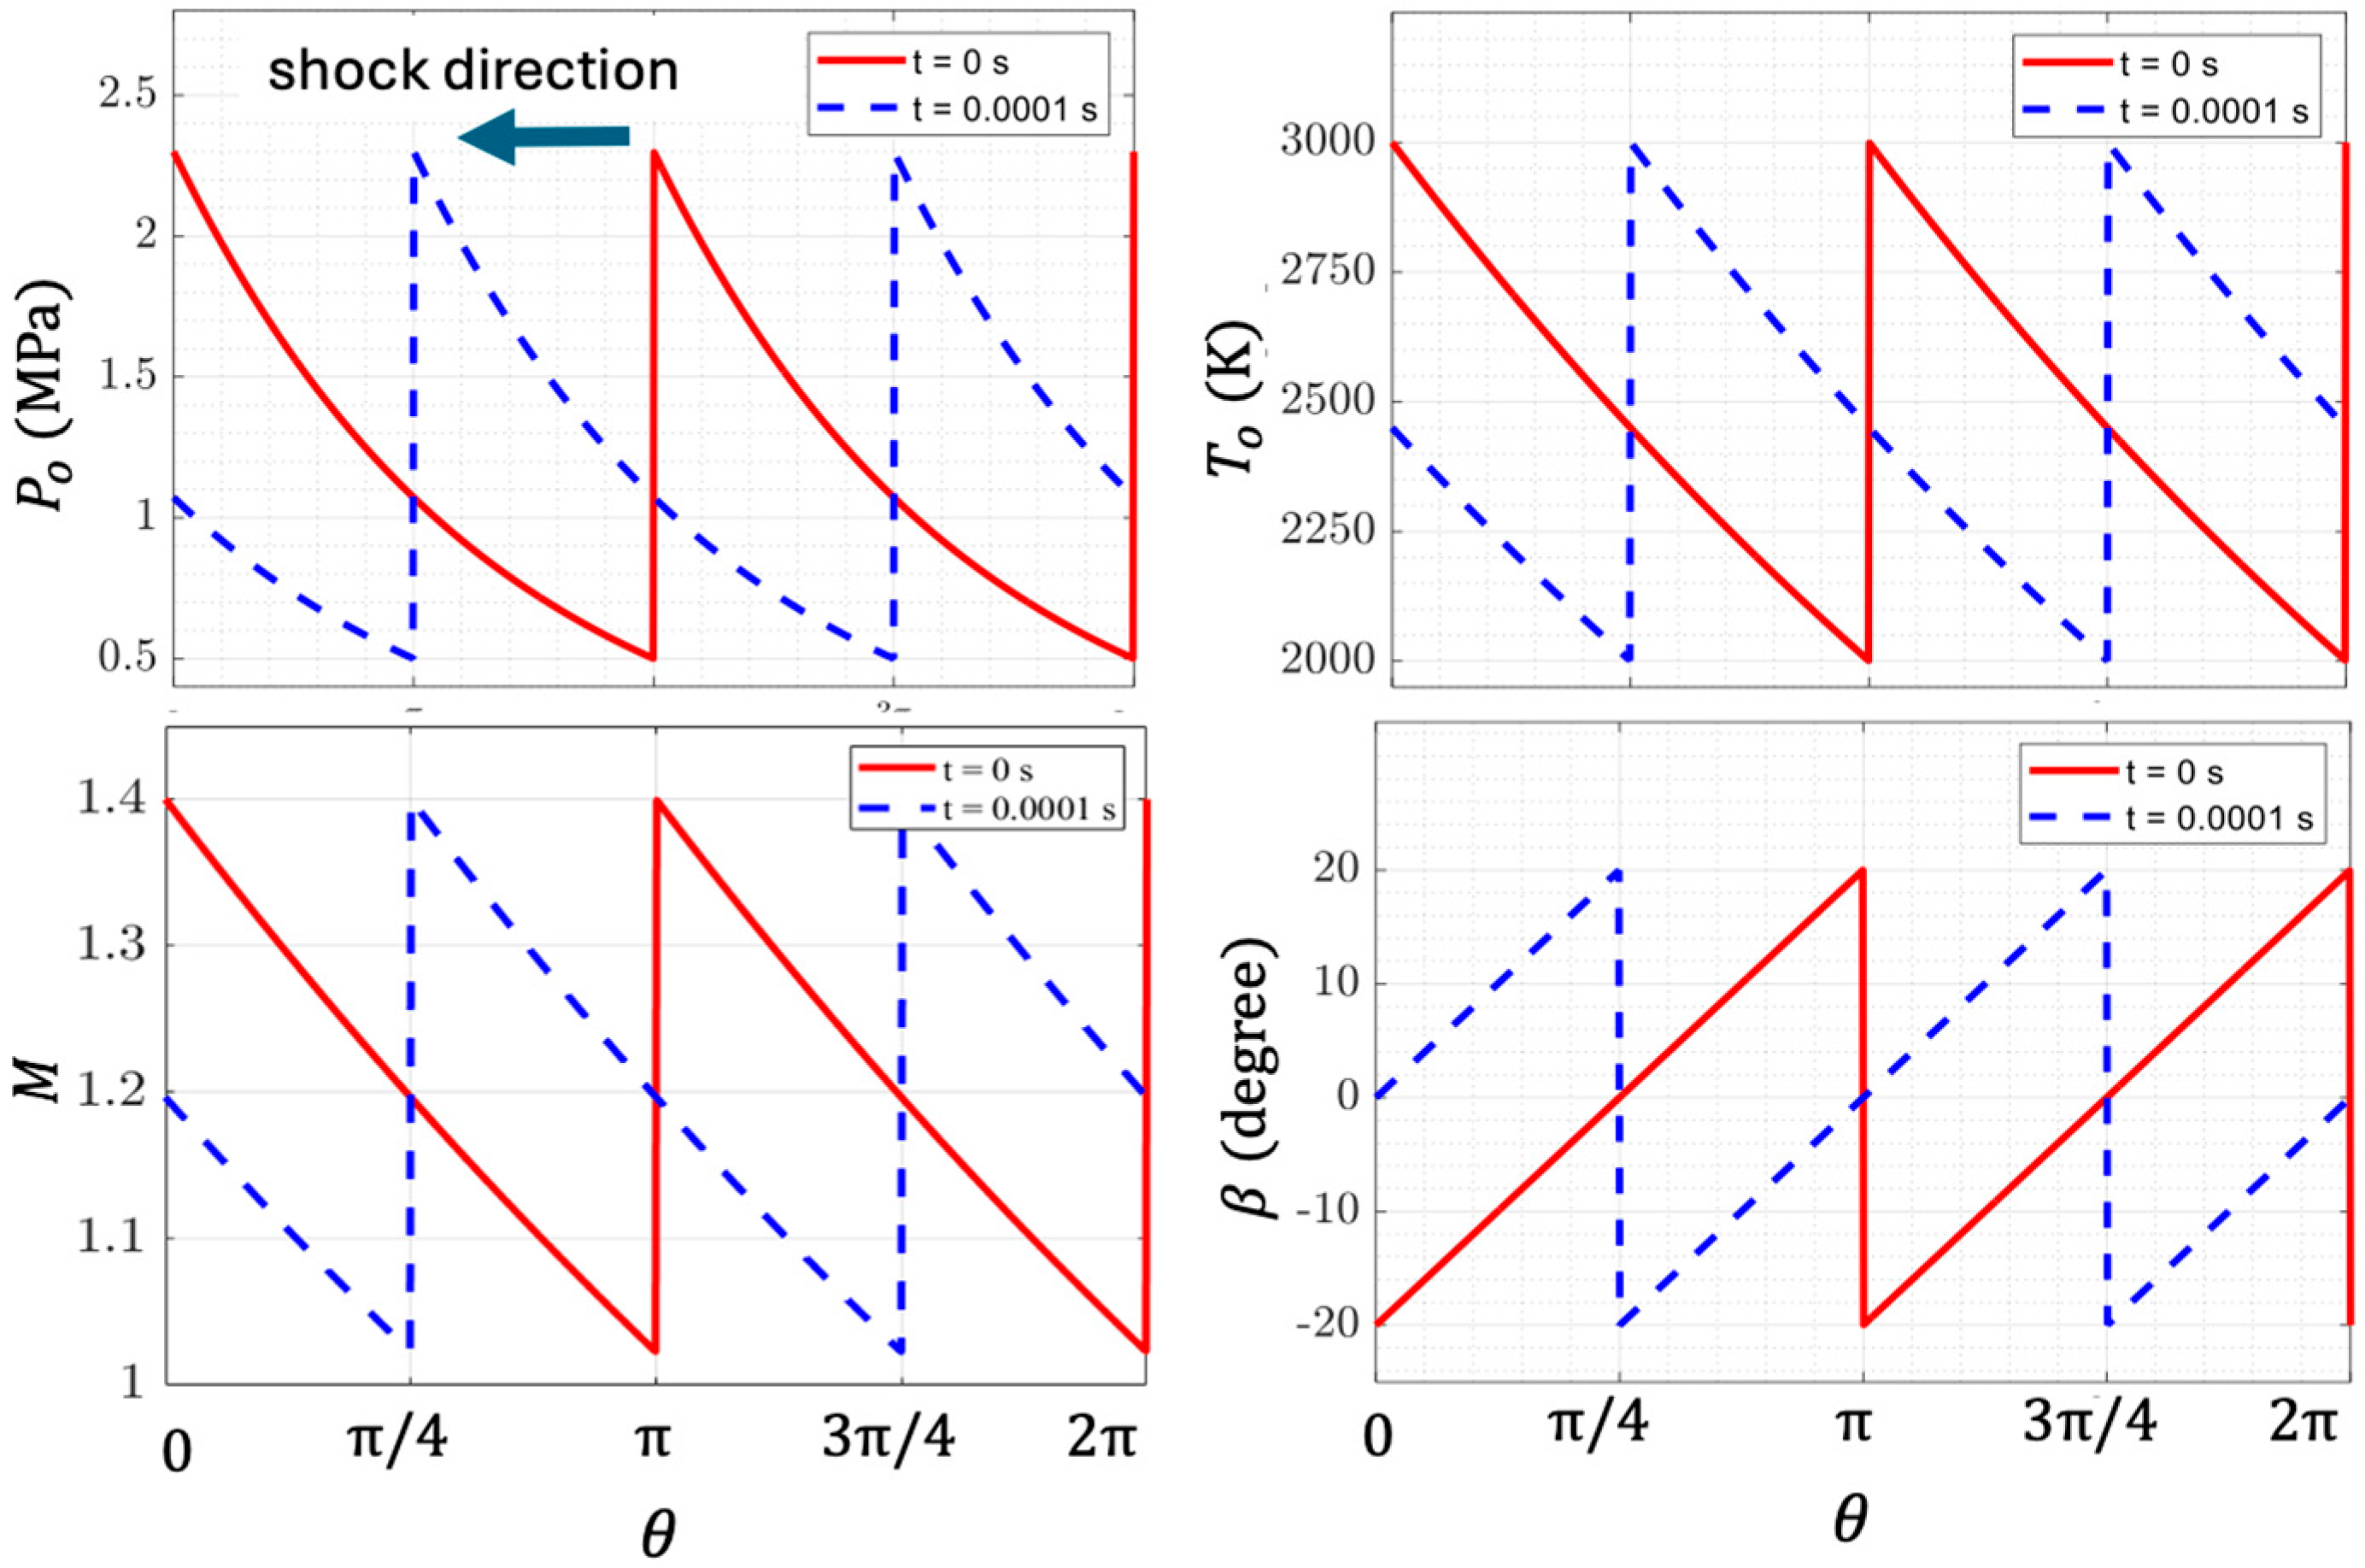
At the inflow boundary ( z = 0 ), the flow exiting the RDC enters the transition duct. The flow entering is supersonic with two detonation waves spanning 2 π radians of the annulus. Figure 2 shows the total pressure ( P o ), total temperature ( T o ), Mach number ( M ), and flow angle ( β , measured with respect to the z-direction) at the inflow boundary ( z = 0 ) as a function of the azimuthal direction ( θ ) at t = 0 and t = 0.0001   s . The total time required for the two peaks (detonation waves) to span 2 π of the annulus is 0.0004 s. The data shown in Figure 2 was taken from Ref. [9], where irregularities in the data were smoothed as follows:
P o = 2.3 e 0.49 θ t     M P a
    T o = 3000 e 0.13 θ t   K
M = 1.4 e 0.08 θ t
  β = 20 + 12.72 θ t   d e g r e e s
θ t = m o d θ + 2 V s / ( R i + R o ) t ,   2 π     r a d i a n s
V s = a r c   l e n g t h   o f   a n n u l u s / [ ( n o .   o f   s h o c k s   i n   a n n u l u s ) ( d u r a t i o n   p e r   s h o c k ) ] = 2 π R i + R o / 2 / 2 0.0002   s = 2221   m / s
From the data shown in Figure 2 and given by Equations (1)–(6), the static pressure ( P ) and the static temperature ( T ) were obtained from P o , T o , and M by using isentropic relations with local values of γ = c p / c v . The speed of sound ( c = γ R T ) was also computed by using the local γ = c p / c v and T . The velocity at the inflow boundary ( V = V sin β   e θ + V cos β e z ,   | V | = M c ) were obtained by using the local M , T , and β . The angle at which the shock wave propagates at these inflow conditions is α = 47 o with respect to the z direction, which satisfies the Hugoniot relations with the maximum relative error in the pressure and temperature ratios across the shock wave to be less than 6%.
At the outflow boundary, the desired average pressure is P b = 0.90   M P a , if there are no guide vanes, and P b = 0.65   M P a , if there are guide vanes. The value of P b affects the location of the terminal shock, where the supersonic flow becomes subsonic. In this study, the optimal P b for the configuration shown in Figure 1 was not examined.
On wall boundaries, all walls are adiabatic. Also, all walls are no-slip except the sponge layer, which has slip walls. Note that the buffer layer has the same wall conditions as the transition duct so the flow and the propagating shock waves can exit the transition duct’s outlet without encountering any changes in geometry or operating conditions.
Table 1 summarizes all cases studied. The outflow boundary for Cases 1 and 2 is located at z = L 1 (i.e., no guide vanes and no extension duct). For Cases 3 to 9, the outflow boundary is located at z = L 1 + L b + L (i.e., no guide vanes, but has extension duct). For Cases 10 and 11, the outflow boundary is located at z = L 1 + L 2 + L b + L (i.e., has guide vanes and extension duct). Note that the extension duct is made up of a buffer layer and a sponge layer, and the coarsening ratio (CR) characterizes the sponge layer. Details on the buffer and sponge layers, as well as CR, are given in Section 3.2.2. On c p and c v , they are constant for Cases 1 to 8 so that results obtained by using the three outflow BCs examined could be compared with each other. Cases 9 to 11 feature temperature-dependent c p and c v .

3. Problem Formulation and Numerical Method of Solution

3.1. Governing Equations

The problem described in the previous section was modeled by the density-weighted, ensemble-averaged time-dependent continuity, Navier–Stokes, and total energy equations in three dimensions for a thermally perfect gas with temperature-dependent viscosity ( μ ), thermal conductivity ( k ), and constant-pressure and constant-volume specific heats ( c p , c v ) [39]. Since the static temperature at the inflow boundary is greater than 2000 K, the temperature-dependent μ and k were modeled by kinetic theory [40], while the temperature-dependent c p and c v were calculated by using NASA’s piecewise polynomial curve-fitted model [41]. For cases where c p and c v were taken to be constants (Cases 1 to 8 in Table 1), they were evaluated at the average static temperature at the inlet of the transition duct ( z = 0 ). The Reynolds stresses in the ensemble-averaged equations were modeled by the realizable k ϵ model [42] with enhanced wall functions [43]. The correlations for turbulent transport of energy in the ensemble-averaged energy equation were modeled by gradients of mean temperature with a turbulent thermal conductivity defined by the turbulent Prandtl number, which was set to 0.85.
The boundary conditions imposed were as follows. At the inflow boundary, the flow is supersonic. Thus, all flow variables were specified as a function of position and time. On solid surfaces, no-slip, adiabatic wall conditions were imposed except in the sponge layer. In the sponge layer, slip adiabatic wall conditions were applied to minimize pressure drop incurred in the extension duct. At the outflow boundary, three BCs were examined: (1) specified average static pressure, P b , at the transition duct’s outlet (i.e., no extension duct added); (2) LRM-NRBC from Selle [35] with specified average static pressure, P b , at the transition duct’s outlet (i.e., no extension duct added); and (3) specified average static pressure, P b , at the exit of the extension duct.
In this study, only the time-periodic solutions are of interest, as opposed to the initial transient solution from the initial conditions. To achieve a time-periodic solution as efficiently as possible requires a good initial condition (IC). The IC employed in this study is as follows. Since the transition duct transforms the flow from supersonic to subsonic, there must be a terminal shock in the annulus. To construct the IC, the inflow BCs were averaged, which yielded a Mach number of M = 1.2 , a total pressure of P o = 1.2   M P a , and a total temperature of T o = 2400   K . With these conditions at the inflow boundary and the specified pressure of P b = 0.90   M P a at the outflow boundary for cases without guide vanes, the terminal shock is located at z = 150 mm based on isentropic relations and jump conditions. For cases with guide vanes, the process just described is repeated for P b = 0.65   M P a .

3.2. Numerical Method of Solution

To generate numerical solutions to the governing equations in the transition duct with and without guide vanes and with and without an extension duct, the computational domain bounded by the inflow and outflow boundaries and solid surfaces must be replaced by a grid, the duration of interest by time levels, and the governing equations by algebraic equations. The discretization of the spatial and temporal domains and the governing equations are given in this section.

3.2.1. Grid in the Transition Duct

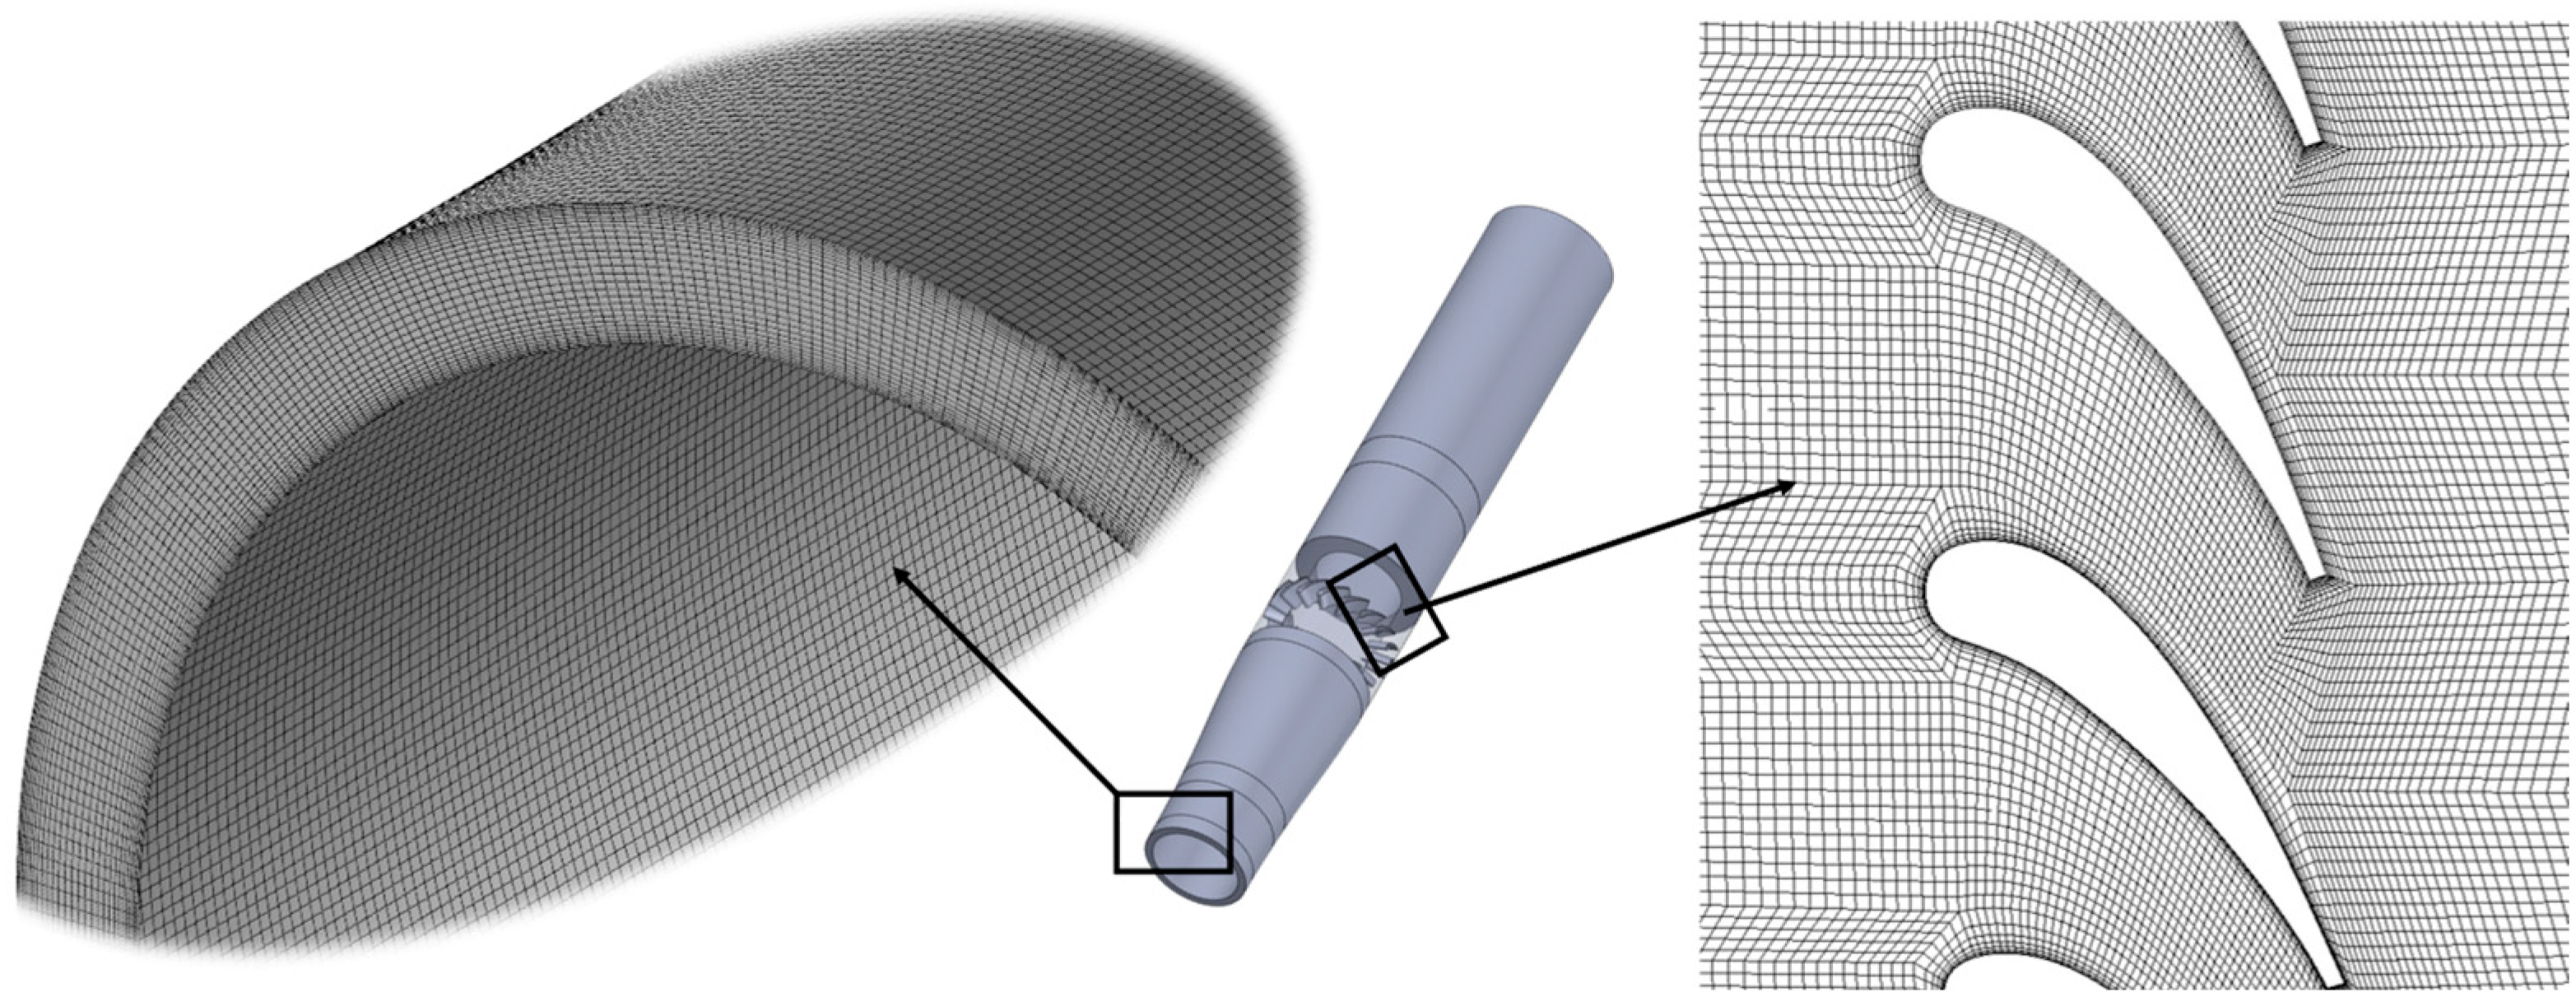
On discretization of the spatial domain, boundary-conforming structured grids were used as shown in Figure 3. Grid lines and points in the axial and azimuthal directions were equally spaced. In the radial direction, grid lines and points were clustered next to the two walls of the annulus and to all solid surfaces of the guide vanes. To improve accuracy in computing pressure, temperature, and velocity gradients next to walls, all grid lines intersect solid surfaces orthogonally. Also, since this study focuses on BCs at the outflow boundary, grid spacings were made fine enough to resolve the propagating shock waves throughout the transition duct with and without guide vanes and throughout the buffer layer of the extension duct. Since wall functions were used, most grid points next to walls have y + value in the log-law layer. When grid points next to walls were in the linear or buffer layer, a one-equation turbulence model was used. Additional details about the grid used to generate solutions along with the time-step sizes used are given in the section on grid and time-step size sensitivity studies.

3.2.2. Grid in the Extension Duct

The extension duct is made of two parts: the buffer layer and the sponge layer. The goal of the buffer layer is to ensure that when the flow exits the outlet of the transition duct, there are no changes in geometry, operating conditions, grid spacing, and time-step size, so that swirling shock waves can exit without creating any spurious phenomena at the transition duct’s outlet. The goal of the sponge layer is to dissipate all non-physical waves generated at the extension duct’s outlet before reaching the buffer layer.
In this study, the buffer layer has the same grid distribution as one in the transition duct about its outlet in the radial, azimuthal, and axial directions. In the sponge layer, grid spacing in the radial and azimuthal directions are the same as those in the transition duct at z = L 1 , if no guide vanes, and at z = L 1 + L 2 , if with guide vanes. However, the grid spacings in the z-direction are coarsened (i.e., made successively larger). The coarsening ratio, C R , is defined by
C R = z k + 1 z k / z k z k 1
where z k is the location of the k t h grid line or point along the z-direction in the extension duct; z k + 1 z k is the spacing between two successive grid points along the z-direction; and k = 1 ,   2 ,   ,   K L , where K L is the total number of grid points in the sponge layer along the z -direction. When C R is greater than unity, the grid spacing increases with z . In this study, C R = 1.025, 1.075, 1.15, 1.3, and 1.65 were examined (see Table 1).

3.2.3. Discretization of the Governing Equations and Solution Algorithm

A finite-volume method was used to discretize the governing equations on the boundary-conforming structured grids. Advection terms were approximated by the second-order in space Advection Upwind Splitting Method (AUSM+) [44]. Diffusion terms were approximated by second order in space central formulas. Time derivatives were approximated by a second-order implicit method. Solutions to the discretized governing equations were obtained by using the density-based approach. Since time-accurate solutions are of interest, the solution obtained at each time step were iterated until convergence. Details on the grid, time-step size, and convergence criteria imposed at each time step are given in the next section. All computations were obtained by using ANSYS Fluent 2024 R2 [45].

4. Grid and Time-Step Size Sensitivity Studies

The grid-sensitivity and time-step size sensitivity studies were obtained by using the LRM-NRBC outflow BC with c p and c v set to constant values based on the average static temperature at the inflow boundary (Case 2, Table 1). This case was selected for the grid-sensitivity study because LRM-NRBC is the only available nonreflecting BC in many commercial codes, and because it has found success as an outflow BC for a wide range of problems for thermally perfect gases as long as c p and c v are constants.
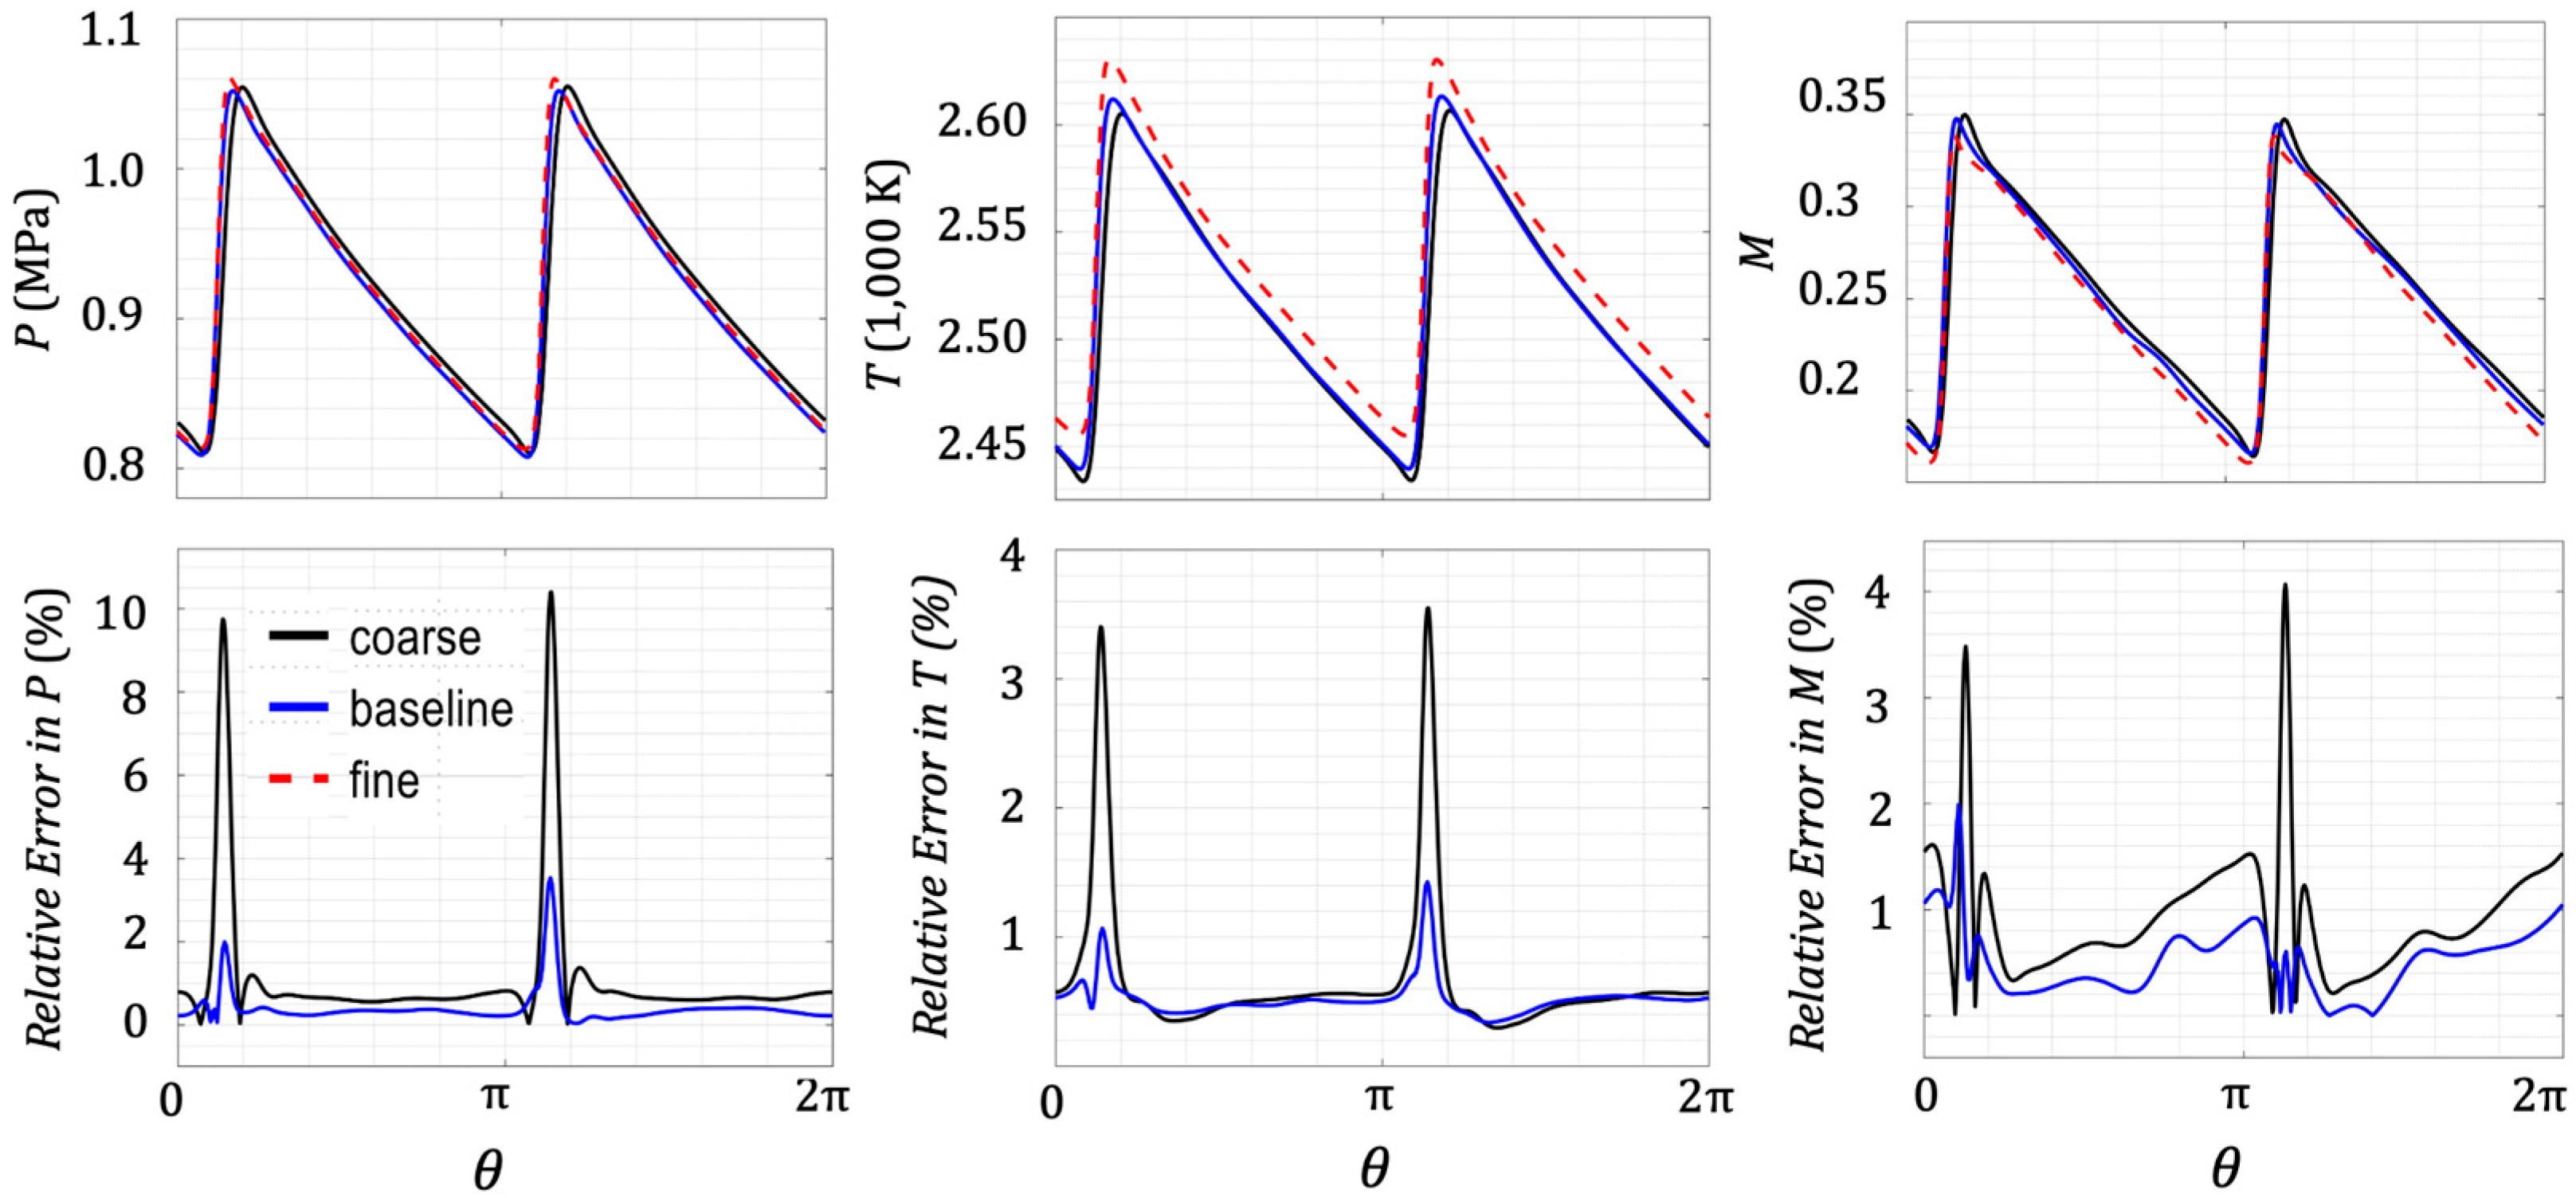
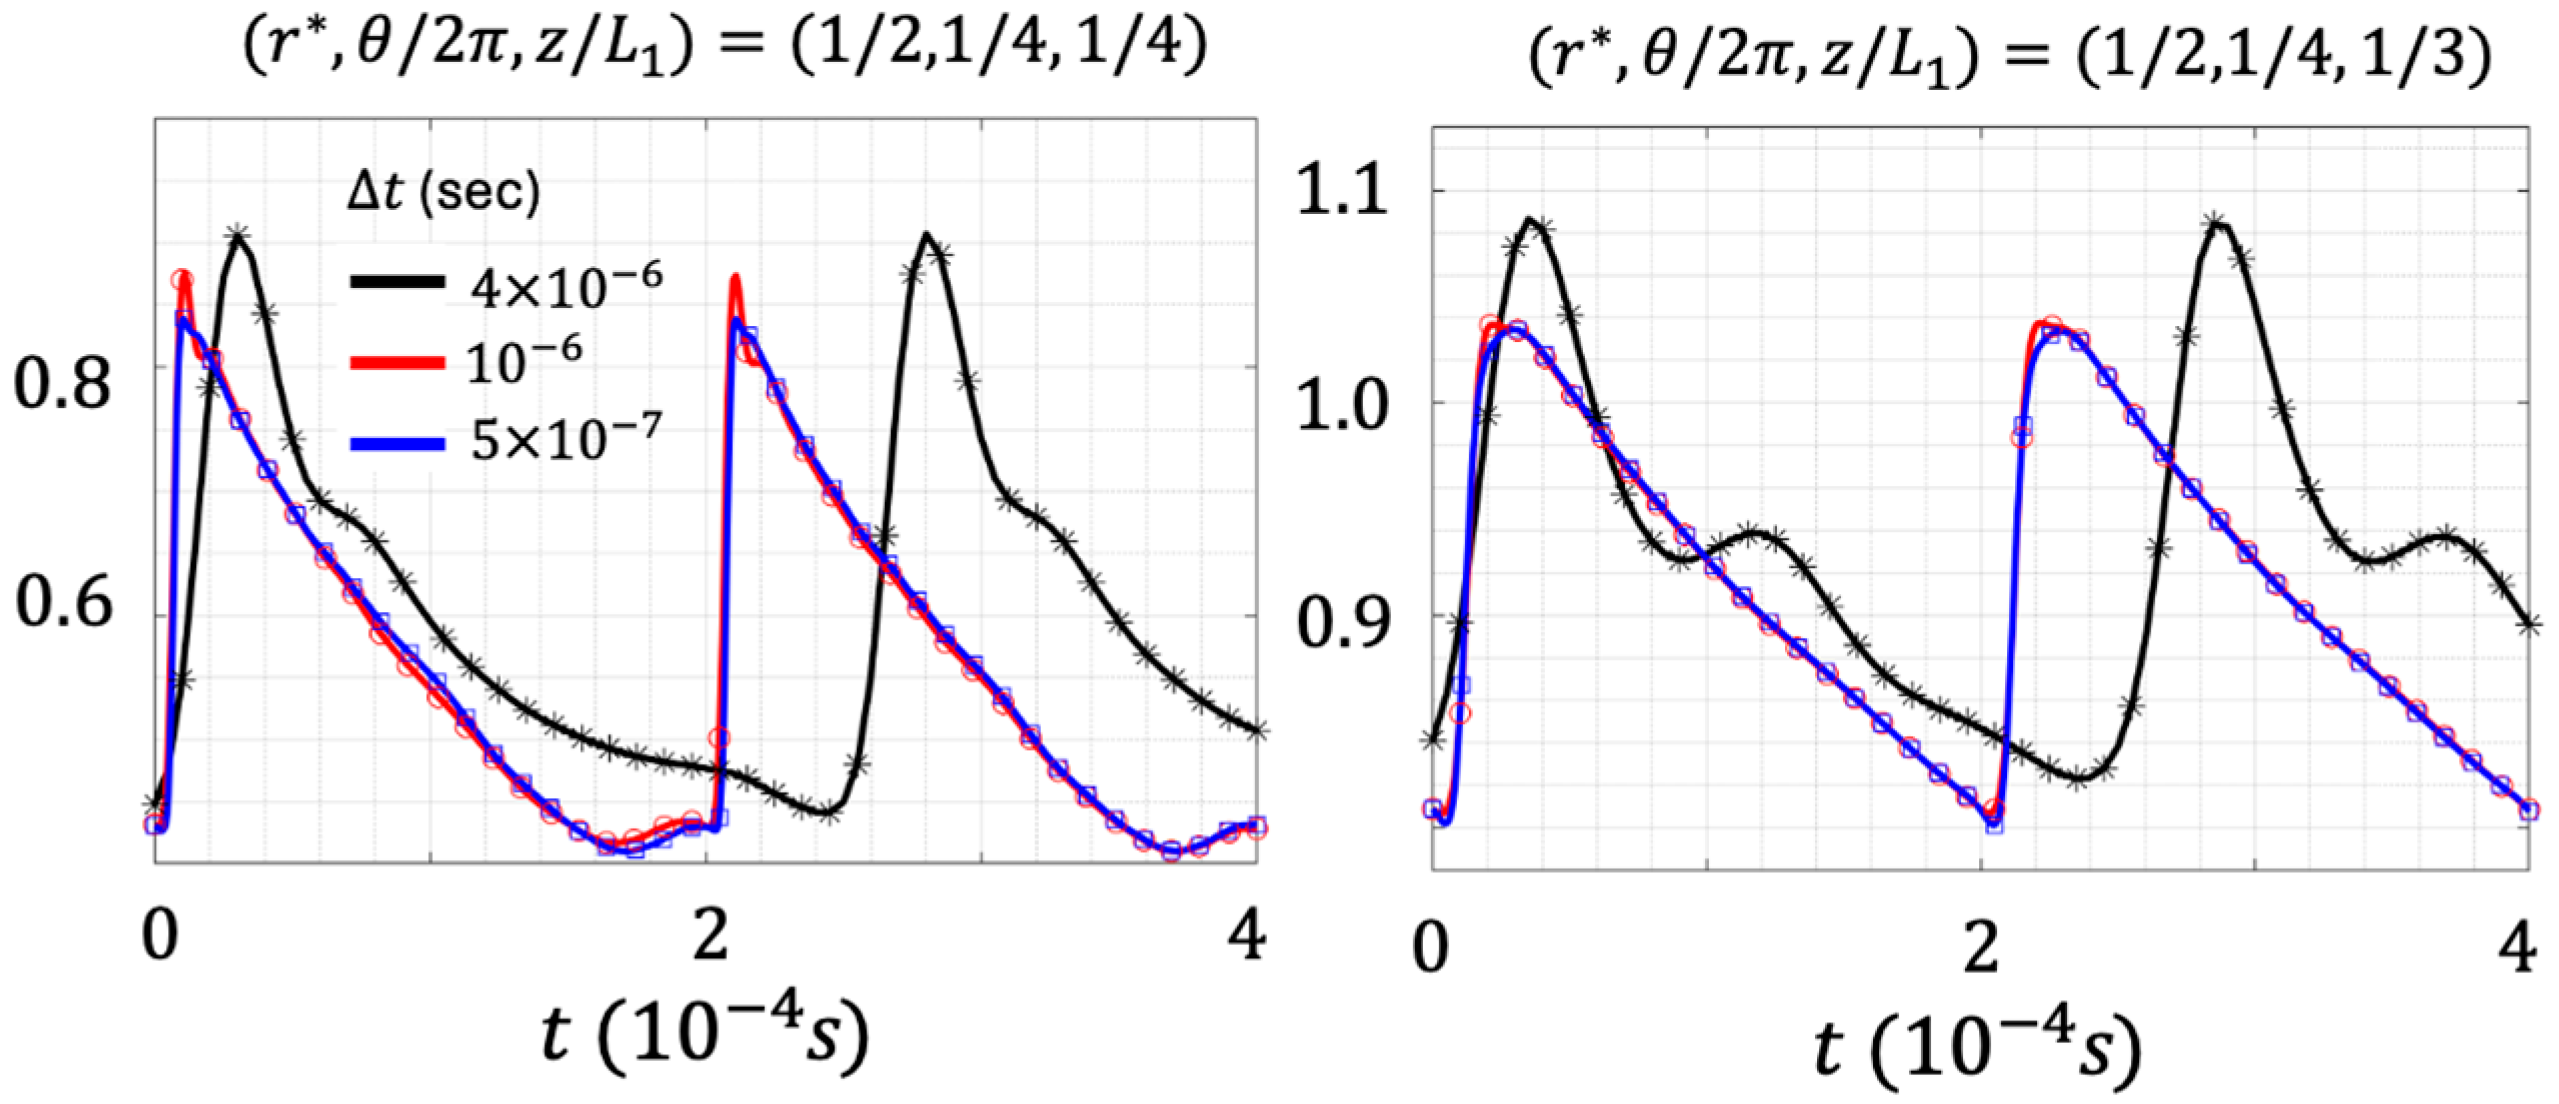
Figure 4 shows the three grids used in the grid-sensitivity study: coarse with 1.2 million cells, baseline with 3.6 million cells, and fine with 9.6 million cells. The number of cells in the radial, azimuthal, and axial directions for the coarse, baseline, and fine grids are 20 × 300 × 200, 30 × 400 × 300, and 40 × 600 × 400, respectively. As noted, grid lines were equally distributed in the axial and azimuthal directions, clustered towards the two walls in the radial direction, and intersected all walls orthogonally. The y + values at grid points next to all solid surfaces are between 40 and 150 except for a few grid points with y + as low as 10. Where wall functions were not applicable, the one-equation turbulence model was used. The three time-step sizes examined in the time-step size sensitivity study are Δ t = 4 × 10 6   s , Δ t = 10 6   s , and Δ t = 10 7 s, which correspond to 100, 400, and 800 time steps for each shock wave to traverse 2 π in the θ -direction within the annulus of the transition duct.
The time-periodic solution obtained are shown in Figure 5 and Figure 6. Figure 5 shows the instantaneous pressure (P), temperature (T), and Mach number (M) at the transition duct’s outlet ( z = L 1 ) as a function of θ at r = r R i / R o R i = 0.5 obtained by using the three grids shown in Figure 4 with Δ t = 10 6   s . As shown below in the time-step size sensitivity study, this time-step size is sufficiently small. From Figure 5, the P, T, and M distributions obtained on the baseline and fine grids can be seen to match well in their magnitudes and gradients. The maximum relative error in P, T, and M is 3.5%, 1.5%, and 2%, respectively. Thus, the baseline grid was used to obtain all solutions presented in this study.
Figure 6 shows P as a function of time at two locations: just upstream of the terminal shock at r ,   θ / 2 π ,     z / L 1 = ( 1 / 2 ,   1 / 4 ,   1 / 3 ) and slightly downstream of the terminal shock at r ,   θ / 2 π ,   z / L 1 = ( 1 / 2 ,   1 / 4 ,   1 / 4 ) by using the baseline grid with Δ t = 4 × 10 6   s , Δ t = 10 6   s , and Δ t = 5 × 10 7 s. From this figure, Δ t = 10 6   s and Δ t = 5 × 10 7   s gave nearly identical results, but results obtained by Δ t = 4 × 10 6   s lagged and had oscillations. Thus, Δ t = 10 6 s was used in all computations.

5. Results

As noted in the introduction, the objectives of this study are (1) examine the performance of outflow BCs in CFD simulations of flow in a transition duct with and without guide vanes that convert supersonic flow with swirling shock waves from the RDC to subsonic flow for the turbine; (2) provide guidelines on the length of the sponge layer and the ratio of grid coarsening in the sponge layer needed to obtain meaningful solutions; and (3) examine effects of temperature-dependent c p and c v on the solutions generated, because the LRM-NRBC requires c p and c v to be constant in the entire flow domain, whereas the method that uses an extension duct does not. Table 1 shows a summary of the cases simulated to meet the objectives.
On assessing outflow BCs, it is important to note that the exact solution sought is known, and that exact solution is “nothing should happen as the flow exits the outlet of the transition duct” at z = L 1 , if no guide vanes, and at z = L 1 + L 2 , if there are guide vanes. This means no new phenomena such as reflected shock waves should form at the outlet to disrupt the solution upstream of the outlet. This exact solution is used to validate and assess the usefulness of outflow BCs examined in this study.

5.1. With and Without Nonreflecting BCs at the Outflow Boundary

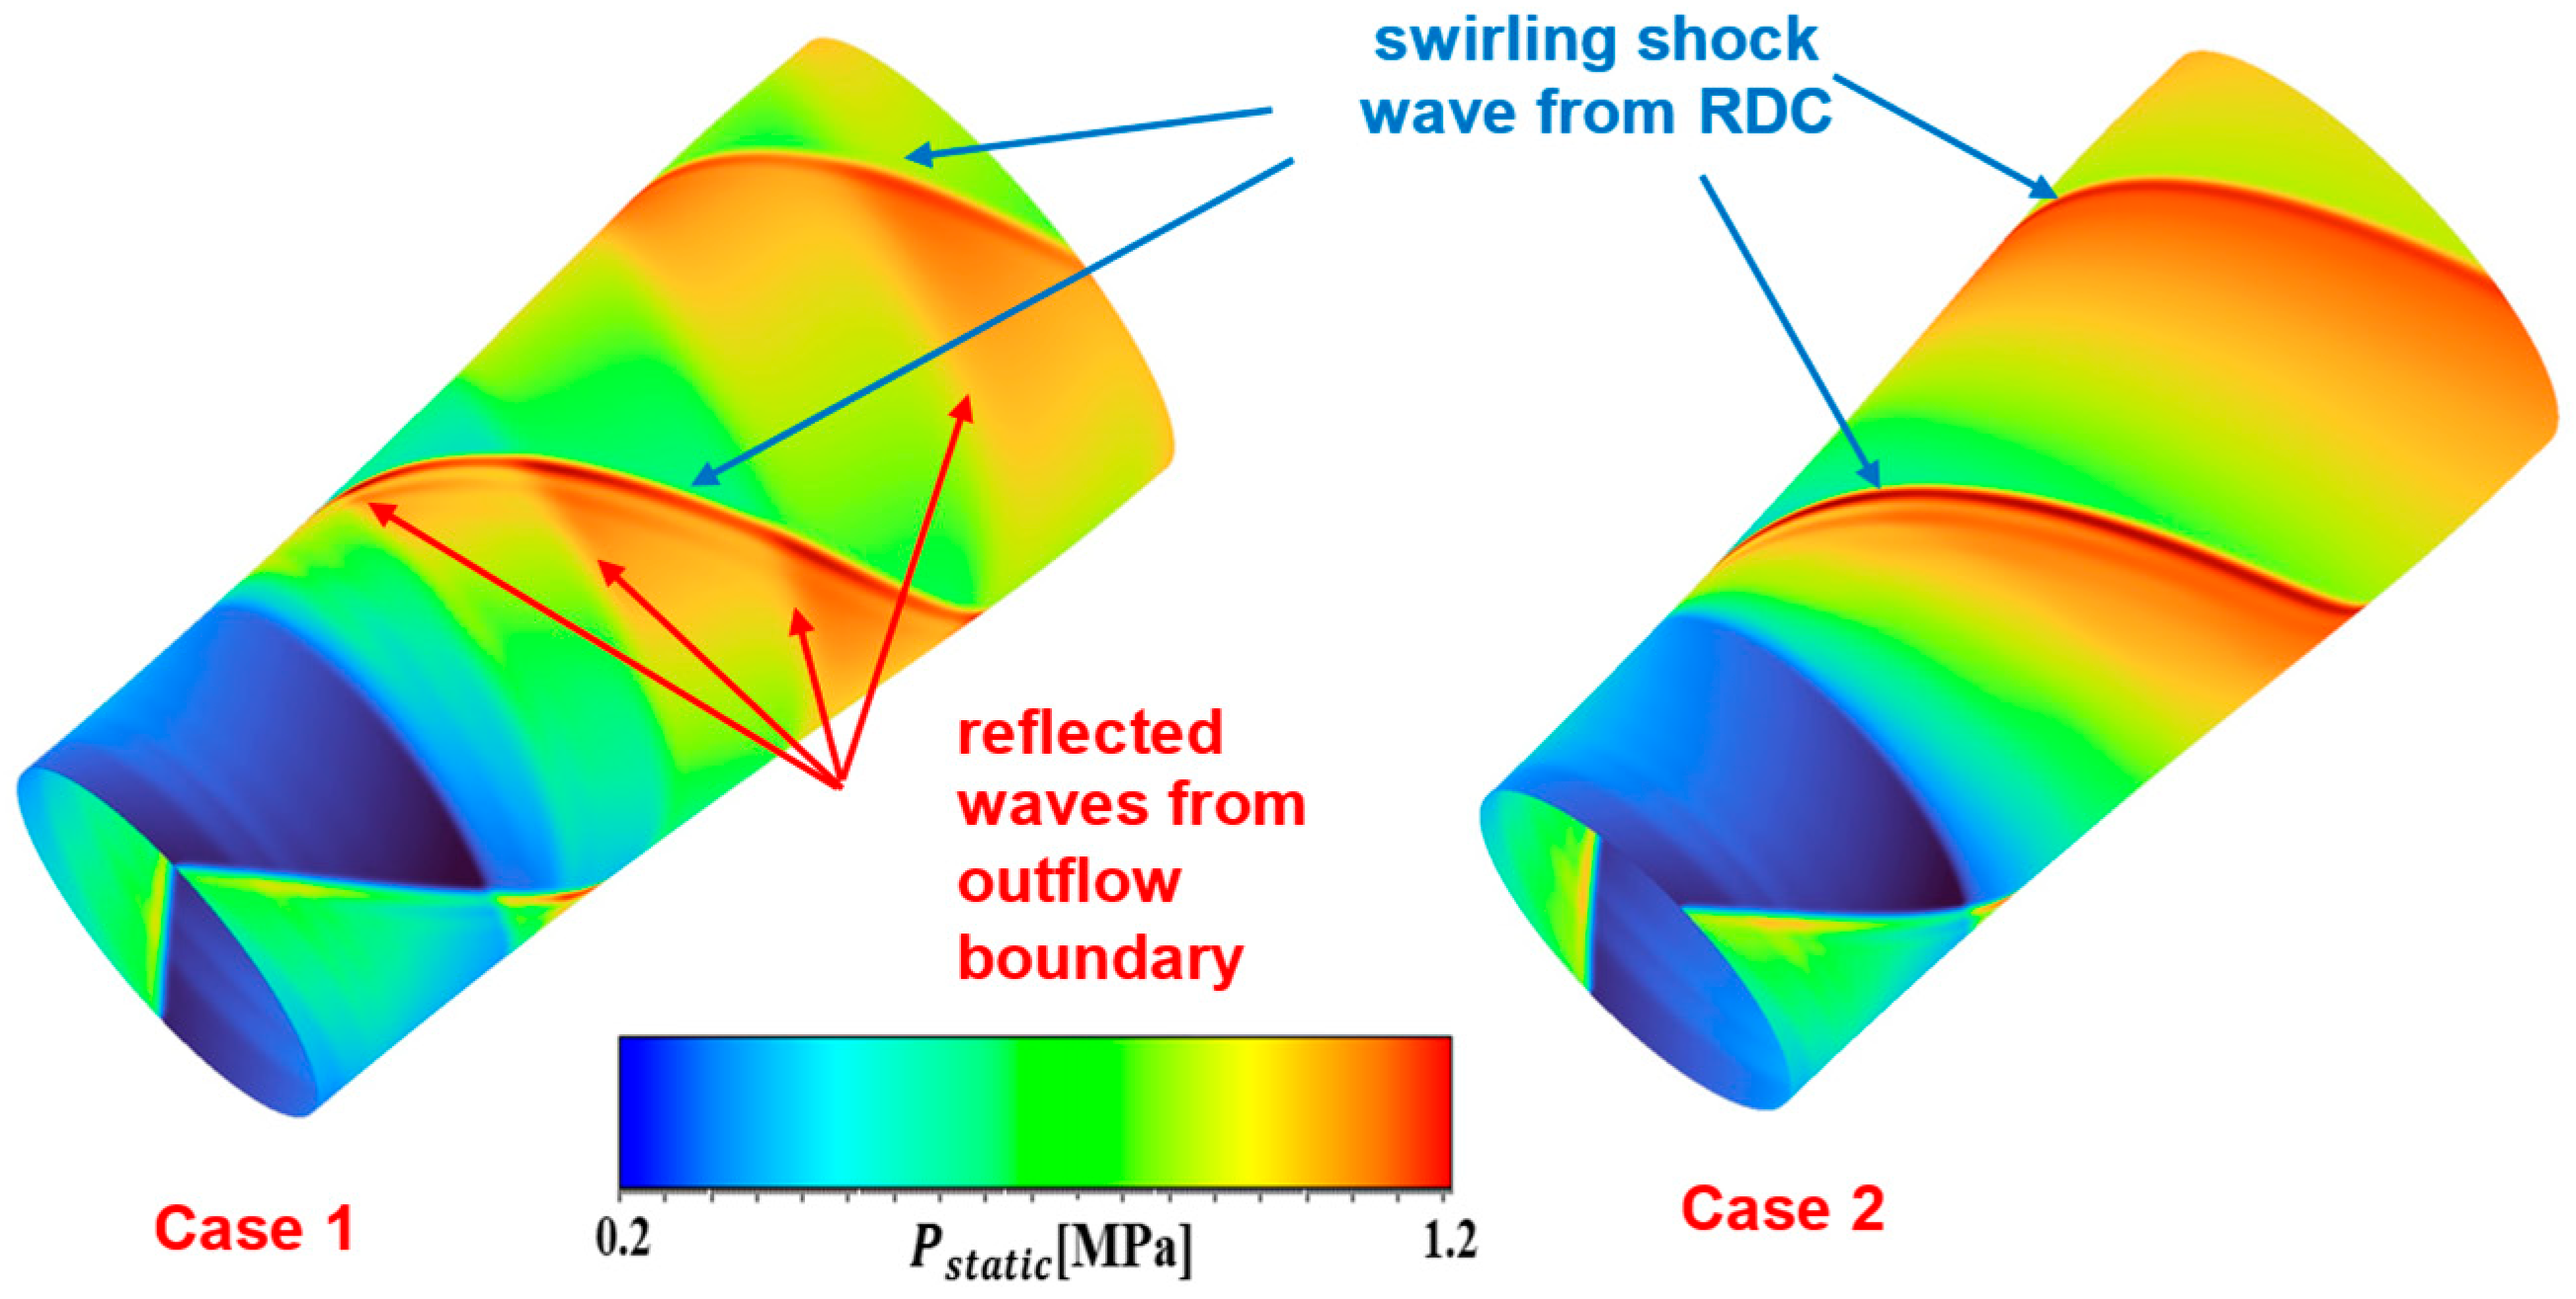
To understand consequences of improper BCs at the outflow boundary in simulations containing highly nonuniform and unsteady flow field such as those produced in an RDC, this subsection compares the results obtained with and without the implementation of LRM-NRBC. In Case 1, the averaged pressure was imposed at the outlet of the transition duct. All other flow variables were extracted from inside the transition duct. This is the typical BC imposed at the outflow boundary if the flow there is subsonic, and its foundation is based on characteristic theory. In Case 2, that same average pressure was imposed but in conjunction with the LRM-NRBC. Figure 7 shows the pressure contours at one instant of time in the transition duct obtained for Cases 1 and 2 at a radial position midway between the inner and outer walls of the transition duct’s annulus. From this figure, Case 2 shows the swirling shock waves that enter the inflow boundary at supersonic speeds. Although the flow becomes subsonic after the terminal shock, the swirling shock waves continue to propagate downstream. When the swirling shock waves reach the outlet of the transition duct at z = L 1 , the shock waves can be seen to exit without producing reflected shock waves. Thus, the LRM-NRBC is useful in ensuring the flow exited as if there are no boundaries there, which match the exact solution. For Case 1, reflected shock waves can be seen to emanate from the duct’s outlet. These reflected shock waves are generated at the outflow boundary because the BC imposed there does not allow the approaching shock waves to exit properly. Thus, these reflected waves are not physical, as claimed in some papers, but stem from the incorrect treatment of the BC at the outflow boundary. Note that Case 2 has the same walls and the same boundary layers, and no reflected shocks were observed from the outflow boundary.
At this point, it is important to note that flows in RDCs that exhaust into an open environment—as is often done in experimental studies—do produce reflected waves at the duct’s outlet. This is because there is a sudden change in geometry and in the flow environment (open space vs. confinement in an annulus). Thus, these reflected waves are physical, just like a flute or any wind musical instrument. If a CFD study is to simulate such a problem, then the outflow boundary must not be placed at the interface where the annulus meets the open environment. Instead, the outflow boundary must be placed sufficiently far downstream in the axial and radial directions to capture the relevant physics, including the air in the open environment entrained by the exiting jet.
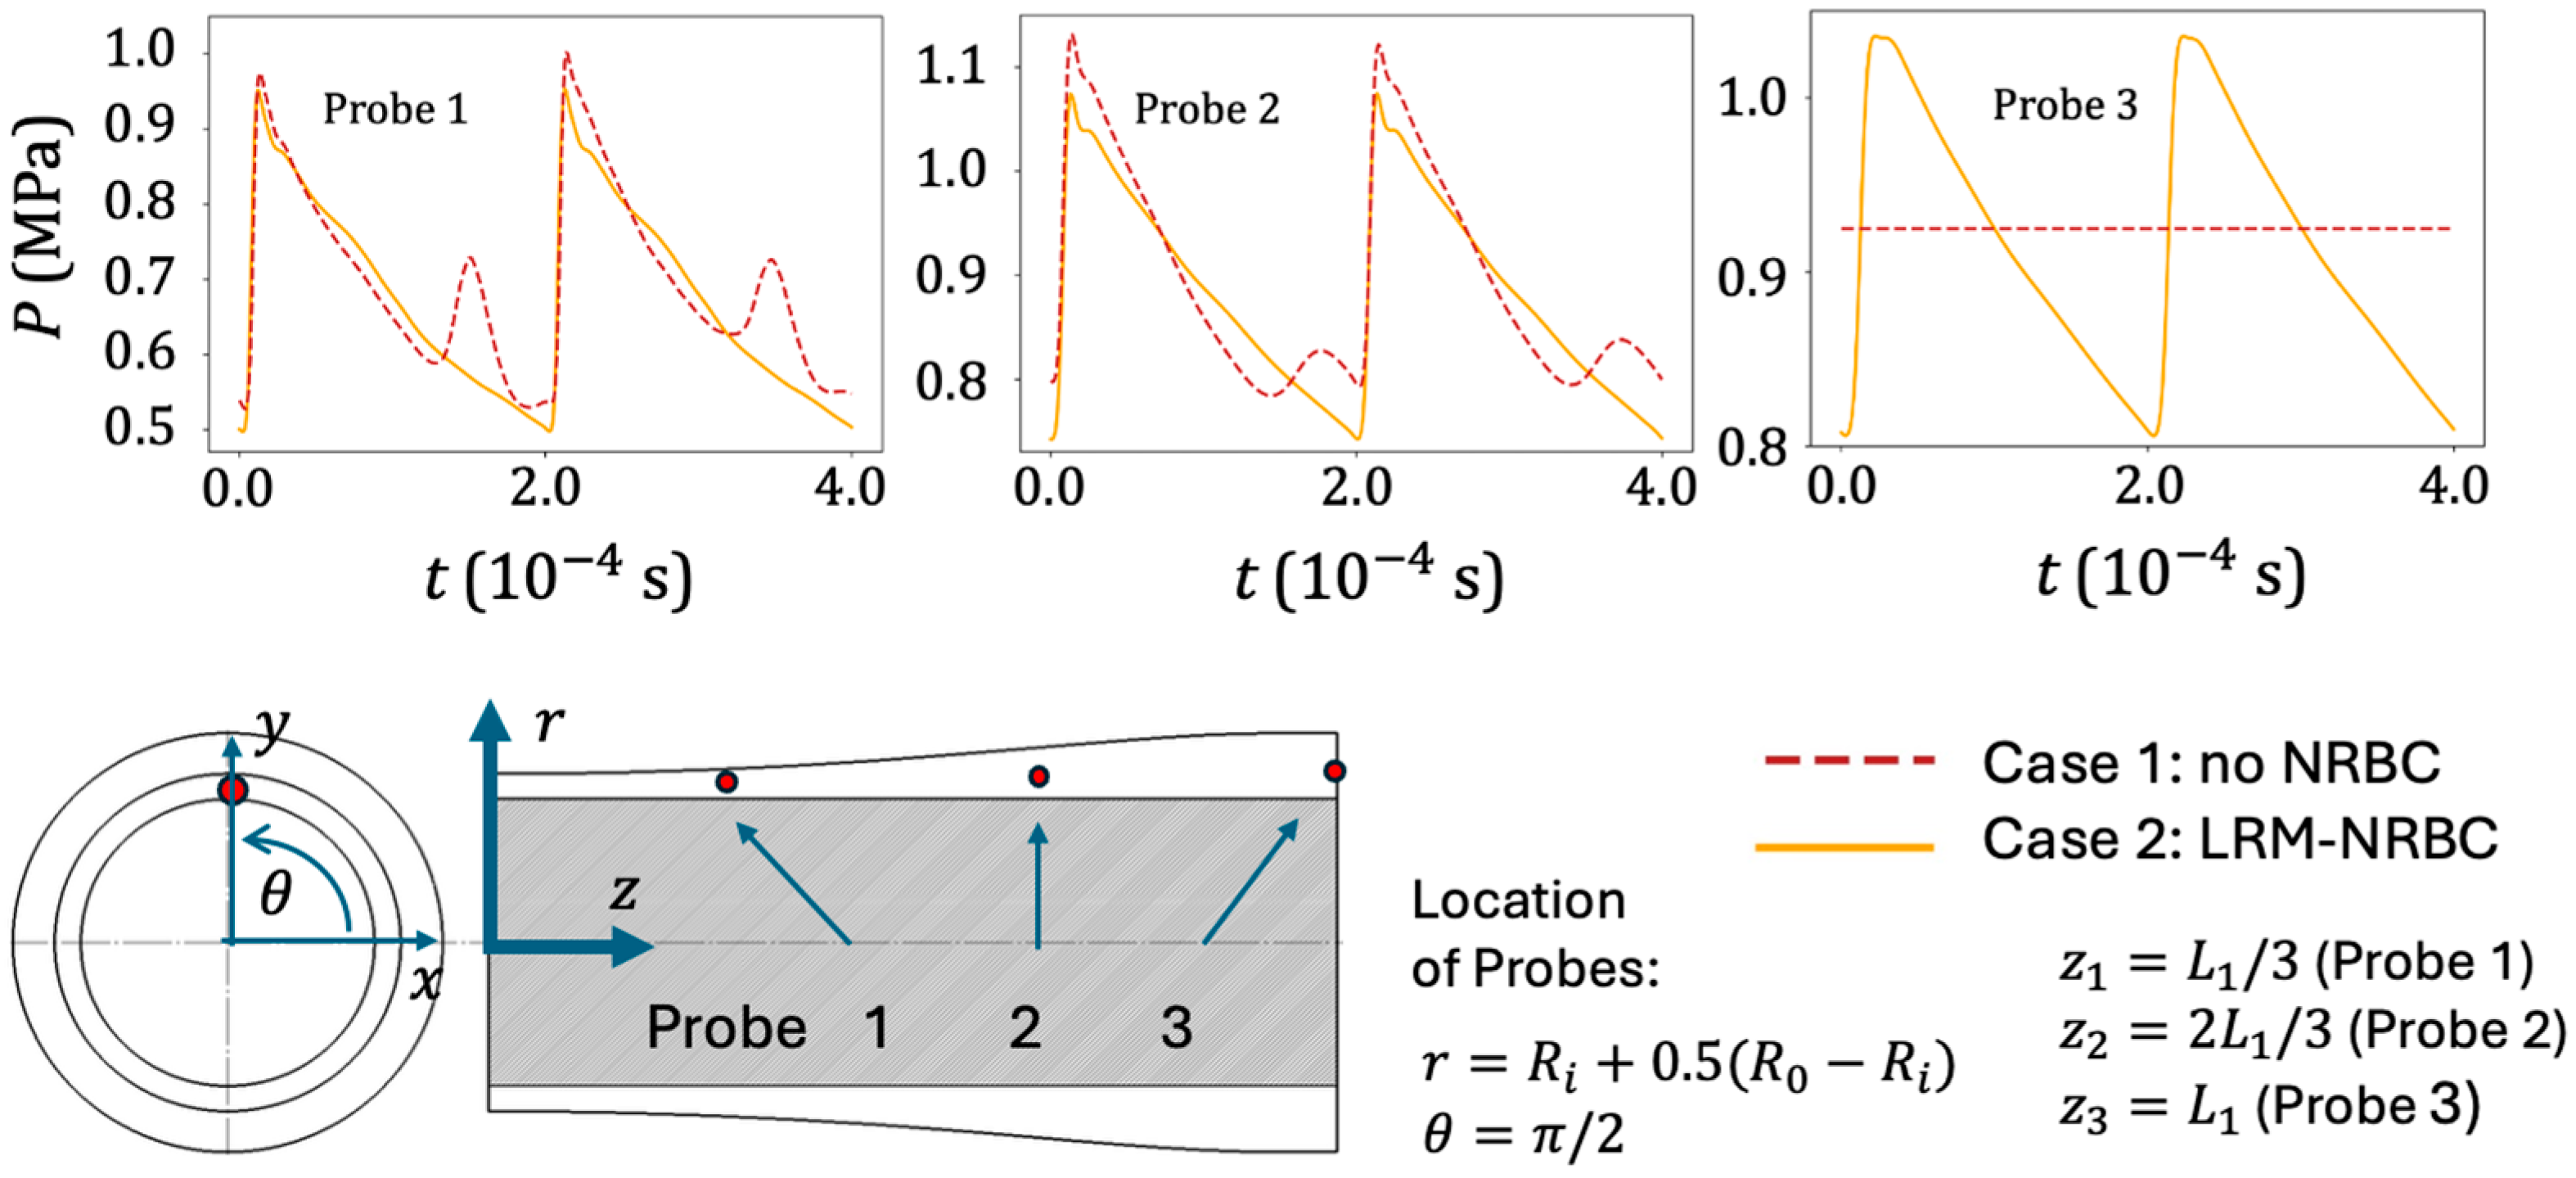
To illustrate how the reflective shock waves degrade the accuracy of the simulation results, Figure 8 shows how pressure varies with time at three probe locations: Probe 1: r ,   θ / 2 π ,   z / L 1 = 0.5 ,   0.25 ,   1 / 3 ; Probe 2: r ,   θ / 2 π ,   z / L 1 = 0.5 ,   0.25 ,   2 / 3 ; and Probe 3: r ,   θ / 2 π ,   z / L 1 = 0.5 ,   0.25 ,   1 . For Case 1, Figure 8 shows the pressure at Probe 3 to be constant with time, having a value equal to P b = 0.90   M P a , the BC imposed there. In contrast, the pressure at Probe 3 for Case 2 has significant temporal variations because the swirling shock waves exit the transition duct as if there is no boundary there, which shows the usefulness and efficacy of LRM-NRBC. Moreover, the pressure histories for Case 2 at Probes 1, 2, and 3 can be seen to exhibit a single pressure peak for each swirling shock wave, whereas the pressure histories at Probes 1 and 2 for Case 1 contain an additional pressure peak—produced by the reflected shock wave created at the outlet of the transition duct, where P b = 0.90   M P a was imposed. Although LRM-NRBC is able to prevent the creation of spurious shock waves at the outflow boundary, it also smooths the pressure peak slightly at the outflow boundary. This can be seen by comparing the pressure histories at the three probe locations for Case 2.

5.2. Outflow BC via an Extension Duct with a Buffer Layer and a Sponge Layer

As mentioned in the introduction, there are several ways to create nonreflecting boundary conditions at the outflow boundary. One is LRM-NRBC from Selle et al. [35] that was examined in Section 5.1. Another is appending an extension duct to the outflow boundary of the “physical domain,” which is the transition duct for the current study.
When an extension duct is used to ensure no spurious waves form and reflect into the transition duct, a buffer layer is used to ensure that the flow can exit the transition duct’s outlet without changes in geometry and flow conditions. Downstream of the buffer layer is the sponge layer with stretched or coarsened grid to smooth nonuniformities and dissipate reflected waves created at the outlet of the extension duct before reaching the transition duct.
Wherever grid spacings change in size from small to large (coarsening) or large to small, Fourier components that make up the solution dissipate (i.e., amplitudes of waves lower) and disperse (i.e., different Fourier components propagate at different speeds). Since dissipation is highest at the shortest length scales resolved by the grid spacing, successively coarsening the grid spacing makes dissipation highest at increasingly longer length scales until the entire spectrum of Fourier components that make up the spurious waves are dissipated. Since Fourier components with wavelengths shorter than the grid spacing are aliased into Fourier components of longer wavelengths, the sponge layer must be sufficiently long until all waves from short to long can be dissipated before reaching the intended outflow boundary of the physical domain.
Since the average static pressure, P b , is imposed at the exit of the extension duct but must provide that same average static pressure at the outflow boundary of the physical domain without spurious reflections, the sponge layer has adiabatic and slip walls, and the following parameter is used to assess how well this is accomplished by the sponge layer:
      Φ p = 1 N i = 1 N P i / P b
where N is the total number of grid points in the r θ plane at any z location.
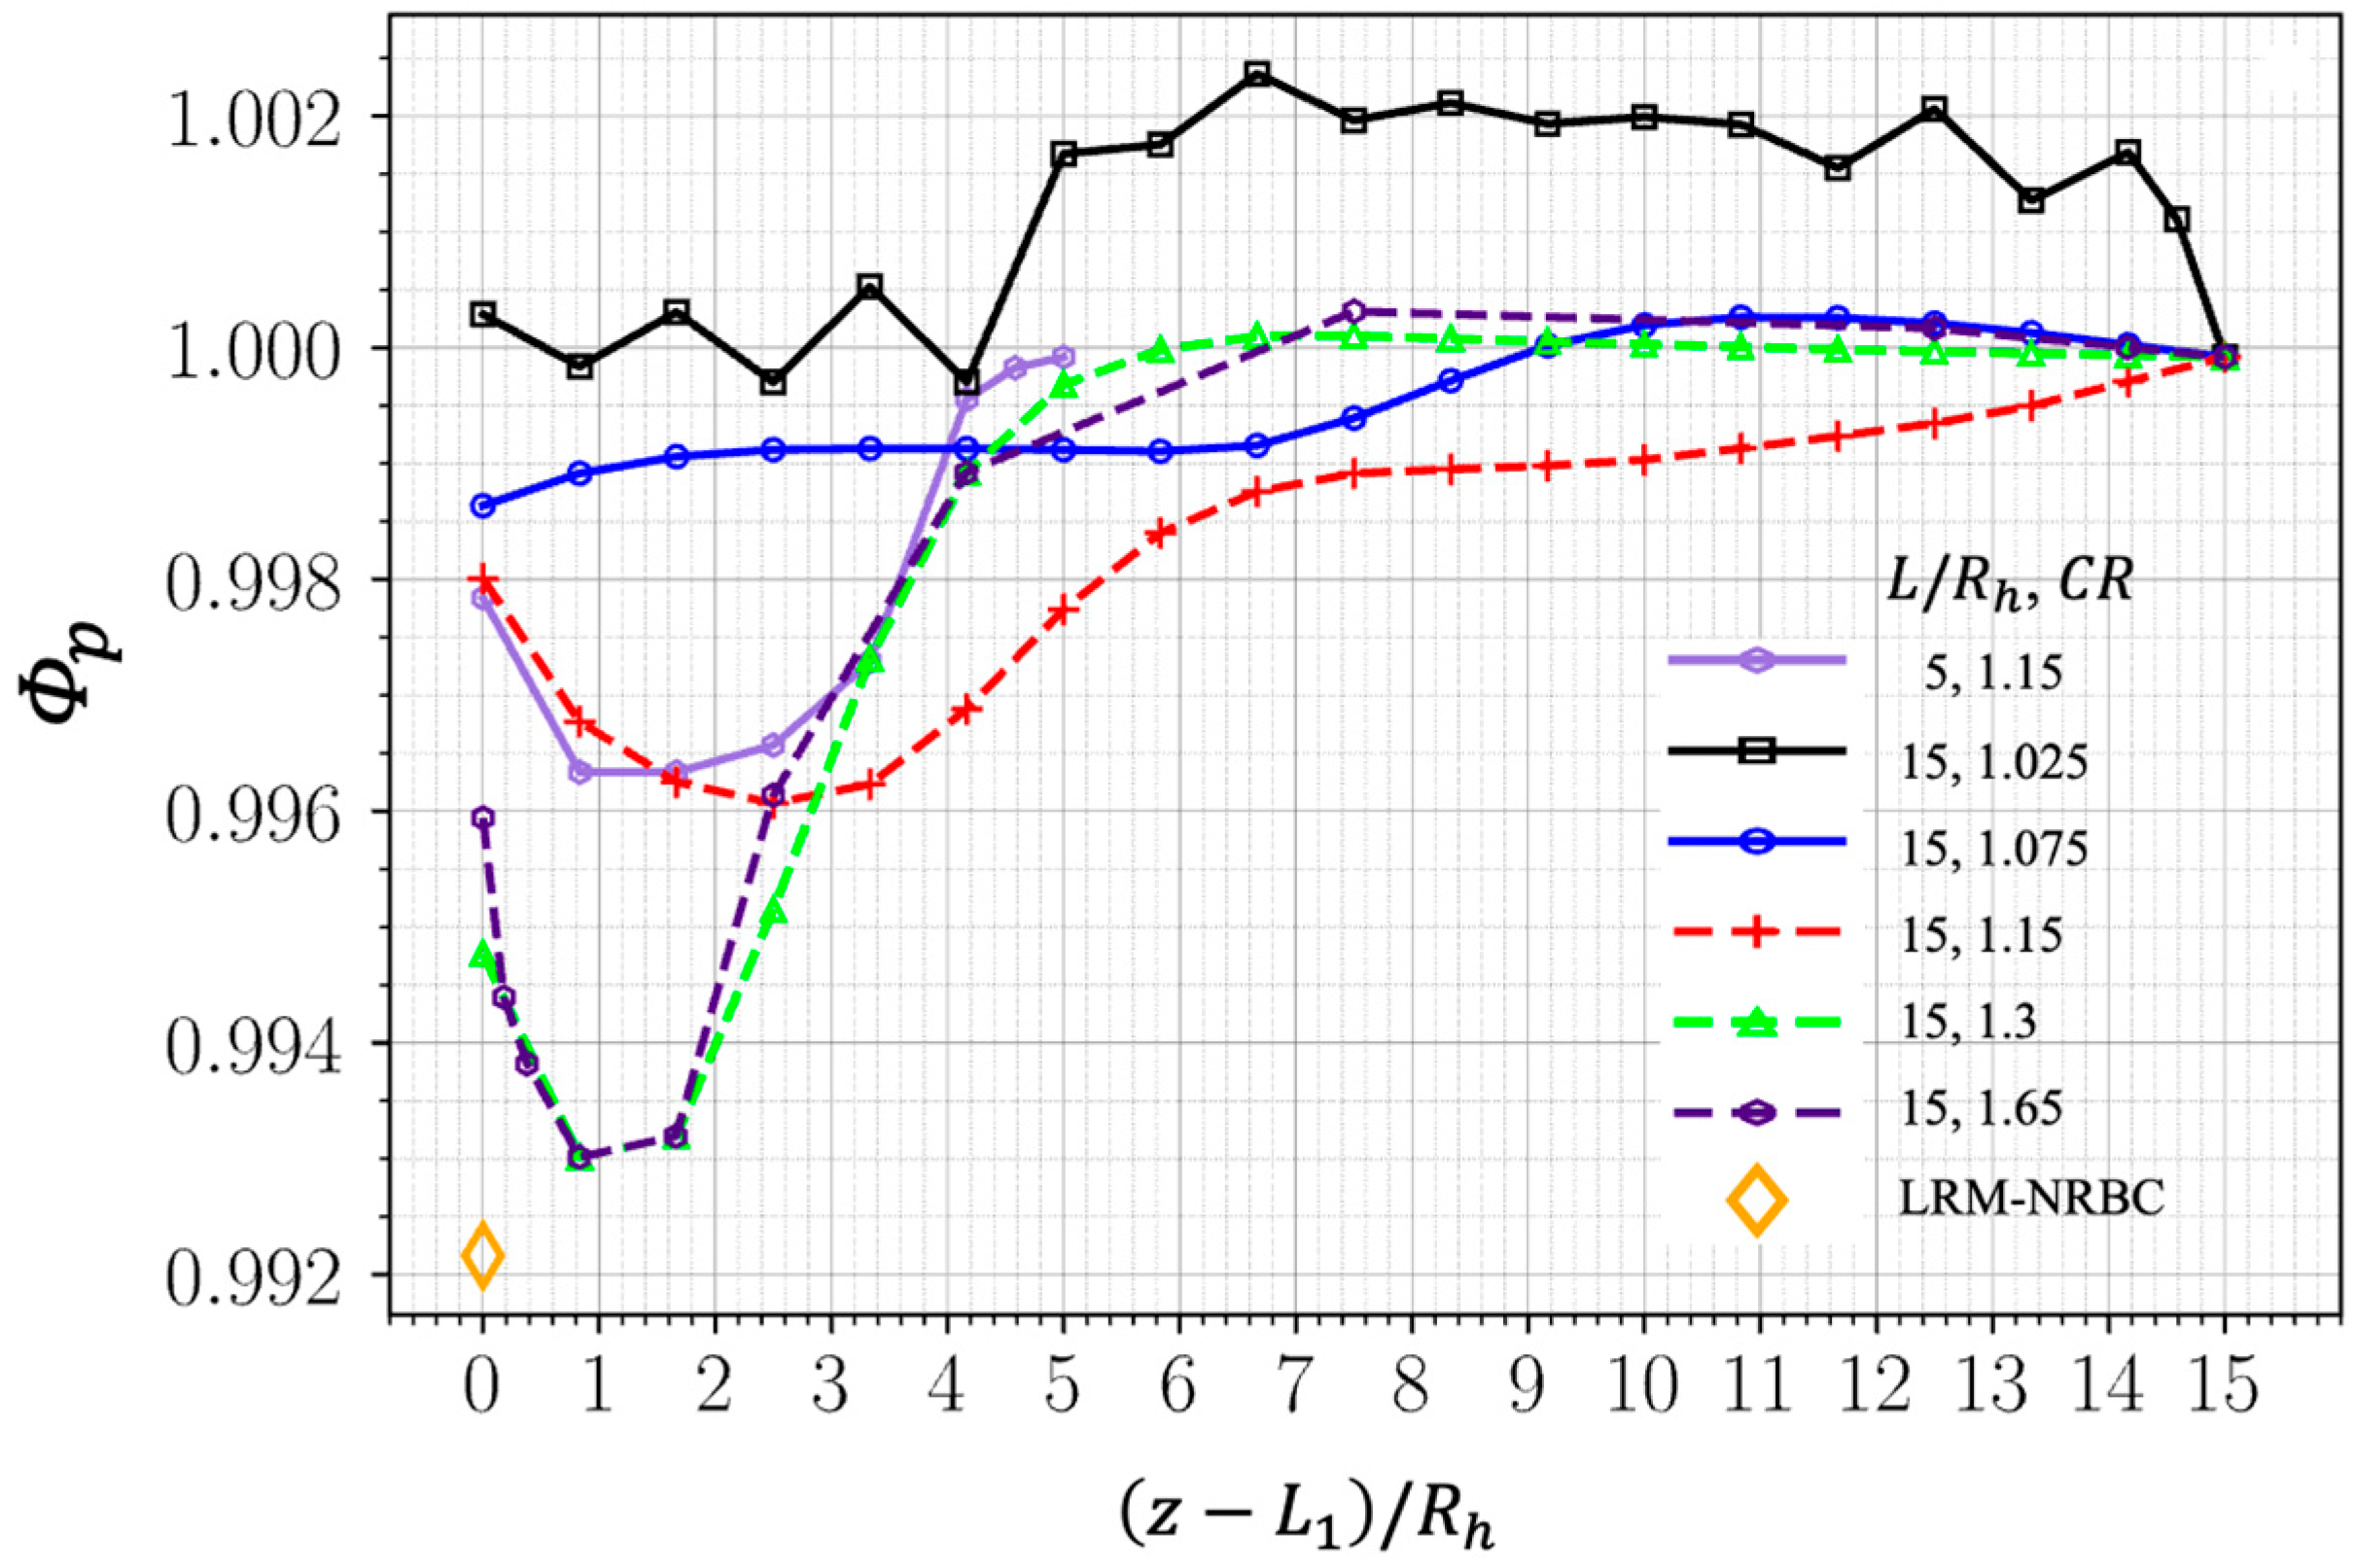
Figure 9 shows Φ p in the extension duct from z = L 1 to z = L 1 + L b + L for Cases 3 to 8 with L / R h = 5, 15 and C R = 1.025, 1.075, 1.3, and 1.65. With Φ p as defined by Equation (8), it should equal unity at z = L 1 , not just at z = L 1 + L b + L , where P b is imposed. From Figure 9, it can be seen that none of the cases studied produced Φ p = 1 at z = L 1 . However, the relative errors are small, ranging from 0.1% to 0.5% for the cases studied. Here, it is interesting to note that Φ p = 0.75 % if the LRM-NRBC is used (Case 2). Thus, using the extension duct with a sponge layer produced more accurate averaged pressure at the outlet of the transition duct than by LRM-NRBC.
From Figure 9, the smallest relative error in Φ p occurs with the longest sponge layer, L / R h = 15 , and the smallest coarsening ratio, C R = 1.025 . However, even with a coarsening ratio of C R = 1.65 , the error is still reasonable at 0.4%. By increasing C R from 1.025 to 1.65, the number of cells in the sponge layer decreases from 0.83 million to 0.10 million. For the baseline grid that was used to obtain simulations, there are 3.6 million cells in the transition duct ( 0 z L 1 ) and 0.43 million in the buffer layer ( L 1 z L 1 + L b ). Thus, the total number of cells is reduced from 4.86 million to 4.13 million or 15.0% less when C R is increased from 1.025 to 1.65, which reduces computational cost. Compared to the LRM-NRBC, the total number of cells is increased by 14.7%. Thus, there is a cost in using an extension duct. However, recall that LRM-NRBC requires c p and c v to be constants, whereas using an extension duct does not impose such a restriction. The effects of accounting for temperature-dependent c p and c v are examined in Section 5.3.
One more thing to note in Figure 9 is that except for the case with L / R h = 15 and C R = 1.025 , which has Φ p hovering around unity, all other cases have values of Φ p less than unity. This implies LRM-NRBC and extension ducts with high coarsening ratios create losses so the pressure at the exit of the physical domain is slightly less than the desired value. This loss is expected for the LRM-NRBC because it is based on 1D theory and so must be applied along the streamline, and it is difficult to develop a grid with grid lines that are aligned with the flow direction when there are swirling shock waves. Also, the proportionality constant in the LRM-NRBC [35] dissipates slightly more than needed to ensure no reflections. This loss is also expected for the extension duct because the buffer layer has no-slip walls and because of numerical dissipation in the sponge layer, where nonuniformities are smoothed. If the exact P b is needed, then one could use smaller coarsening ratios and longer sponge layers, but this could significantly increase computational cost. The other approach is to slightly increase the pressure imposed at the exit of the extension duct (e.g., P b + ϵ with ϵ = 0.004 P b as an initial guess if L / R h = 15 and C R = 1.65 and then iterate by adjusting ϵ until the desired accuracy in P b at z = L 1 is obtained). The numerical value of P b at the transition duct’s outlet affects the location of the terminal shock.
Since not only must the average pressure at the transition duct’s outlet be correct, the unsteady solution there must also be correct. Figure 10 shows the time history of the static pressure ( P ), static temperature ( T ), and Mach number ( M ) at one azimuthal location midway between the inner and outer walls of the transition duct’s exit (Probe 3 in Figure 8). From this figure, it can be seen that for all cases studied with the extension duct (Cases 3 to 8), the pressure histories match closely with each other. From this figure, the peak temperature predicted by LRM-NRBC (Case 2) can be seen to be slightly higher than those predicted by cases using the extension duct, where the flow with swirling shock wave can freely pass by z = L 1 . Since using LRM-NRBC implies the simulation stops at z = L 1 , this small difference in the predicted peak temperature is a source of error in LRM-NRBC.
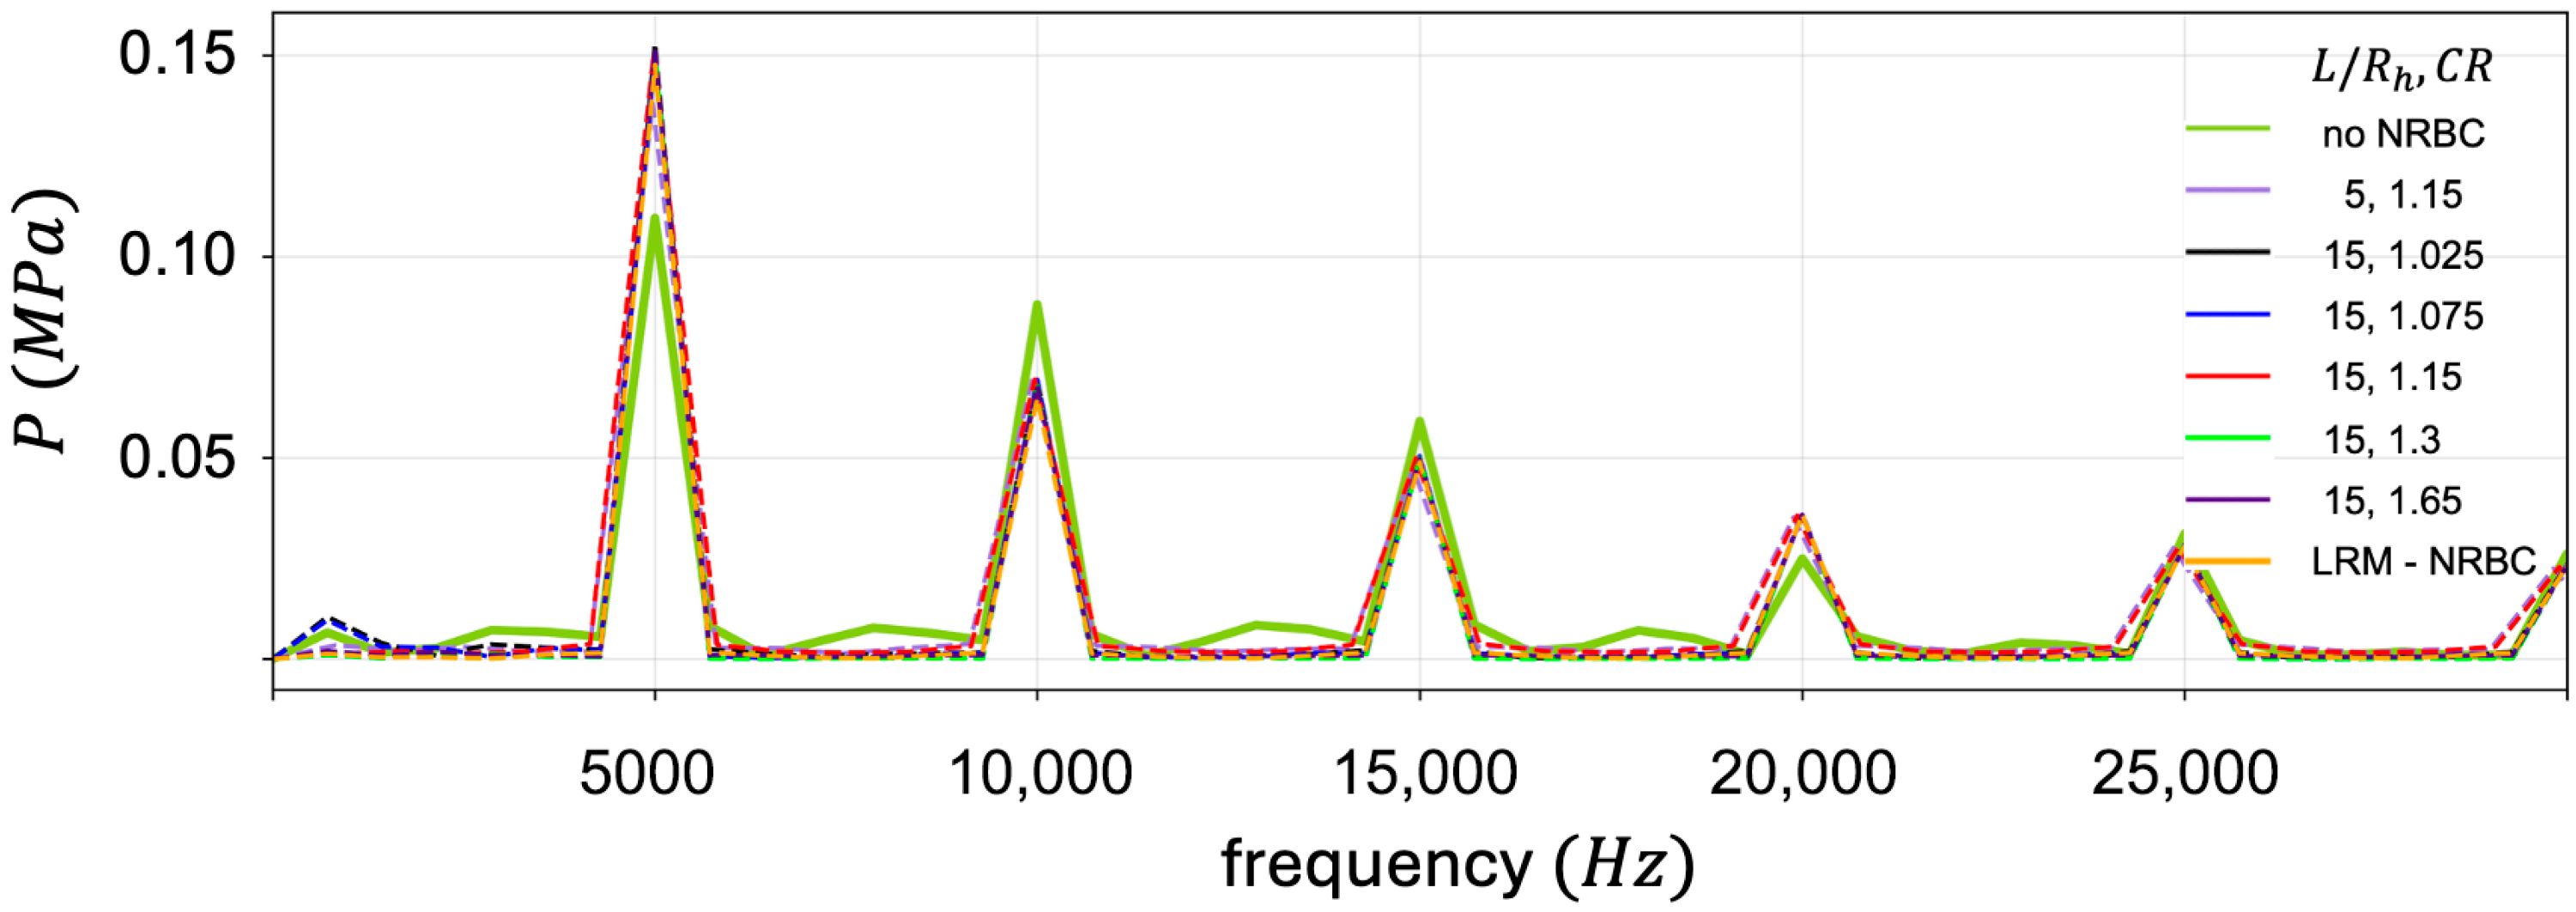
Figure 11 shows the instantaneous normalized static pressure ( P / P b ) as a function of normalized z ( z / L 1 in the transition duct, z L 1 / L b in the buffer layer, and ( z L 1 L b ) / L in the sponge layer) at θ =   π / 4 and a radial location midway between the inner and outer walls of the transition duct obtained for Cases 1 to 8 in Table 1. From this figure, it can be seen that for an extension duct with L / R h = 15 and C R = 1.65 , all swirling shock waves in the flow and any reflected waves created at the outlet of the extension duct are nearly completely smoothed and dissipated by about 2 R h downstream of the buffer layer. At the lower values of C R studied, remnants of the swirling shock and reflected waves can be seen throughout the extension duct. Within the transition duct, Figure 11 shows that if an extension duct is used, then all results obtained are similar (Cases 3 to 8). However, if P b is specified at z = L 1 without using an NRBC or an extension duct (Case 1 in Table 1), then the solution in the transition duct is strongly affected by reflected shock waves created at the outflow boundary, which are not physical. For this case, Figure 12 shows the frequency of swirling shock waves and the frequency of the non-physical waves formed at the outflow boundary.
Cases 3 to 8 in Table 1 are part of a sensitivity study on the length, L , and the coarsening ratio, C R , of the extension duct, and the following parameter, Φ L C R , was used to assess the adequacy the extension duct:
Φ L C R ( r ,   θ / 2 π ,   z / L 1 ,   t ) = P ( r ,   θ / 2 π ,   z / L 1 ,   t ) P ̿ ( r ,   θ / 2 π ,   z / L 1 ,   t ) P ̿ ( r ,   θ / 2 π ,   z / L 1 ,   t )
where Φ L C R is the error in the solution relative to the solution with an L and a C R that ensures all reflected waves are damped in the sponge layer, denoted as P ̿ ( r ,   θ / 2 π ,   z / L 1 ,   t ) . For Cases 3 to 8, Figure 11 shows Case 6 with L = 15 R h and C R = 1.65 to suppress all reflected waves by z 2 R h . Although L = 15 R h and C R = 1.65 may not be optimal, the solution obtained for Case 6 is set as P ̿ . Figure 11 shows Φ L C R to be less than 2% between 0.8 z / L 1 1.0 for all extension ducts examined. The amount of relative error that is acceptable depends on the problem studied. The norm of Equation (9) might be a simpler global criterion. The first norm of Equation (9) is given by
  | | Φ L C R | | = 1 N T i = 1 N T | Φ L C R i |  
where N T is the total number of grid points in the transition duct.
Simulations were also performed to examine the usefulness of extension ducts when there are guide vanes in the transition duct (Cases 10 and 11). For these simulations, the number of cells used were 3.6 million in the transition duct up to z = L 1 , 2.6 million in the duct containing the guide vanes with L 1   z L 1 + L 2 , 0.43 million in the buffer layer, 0.1 million in the sponge layer, if L / R h = 15 , and 0.15 million if L / R h = 30 . The time-step size used was Δ t = 10 6 s.
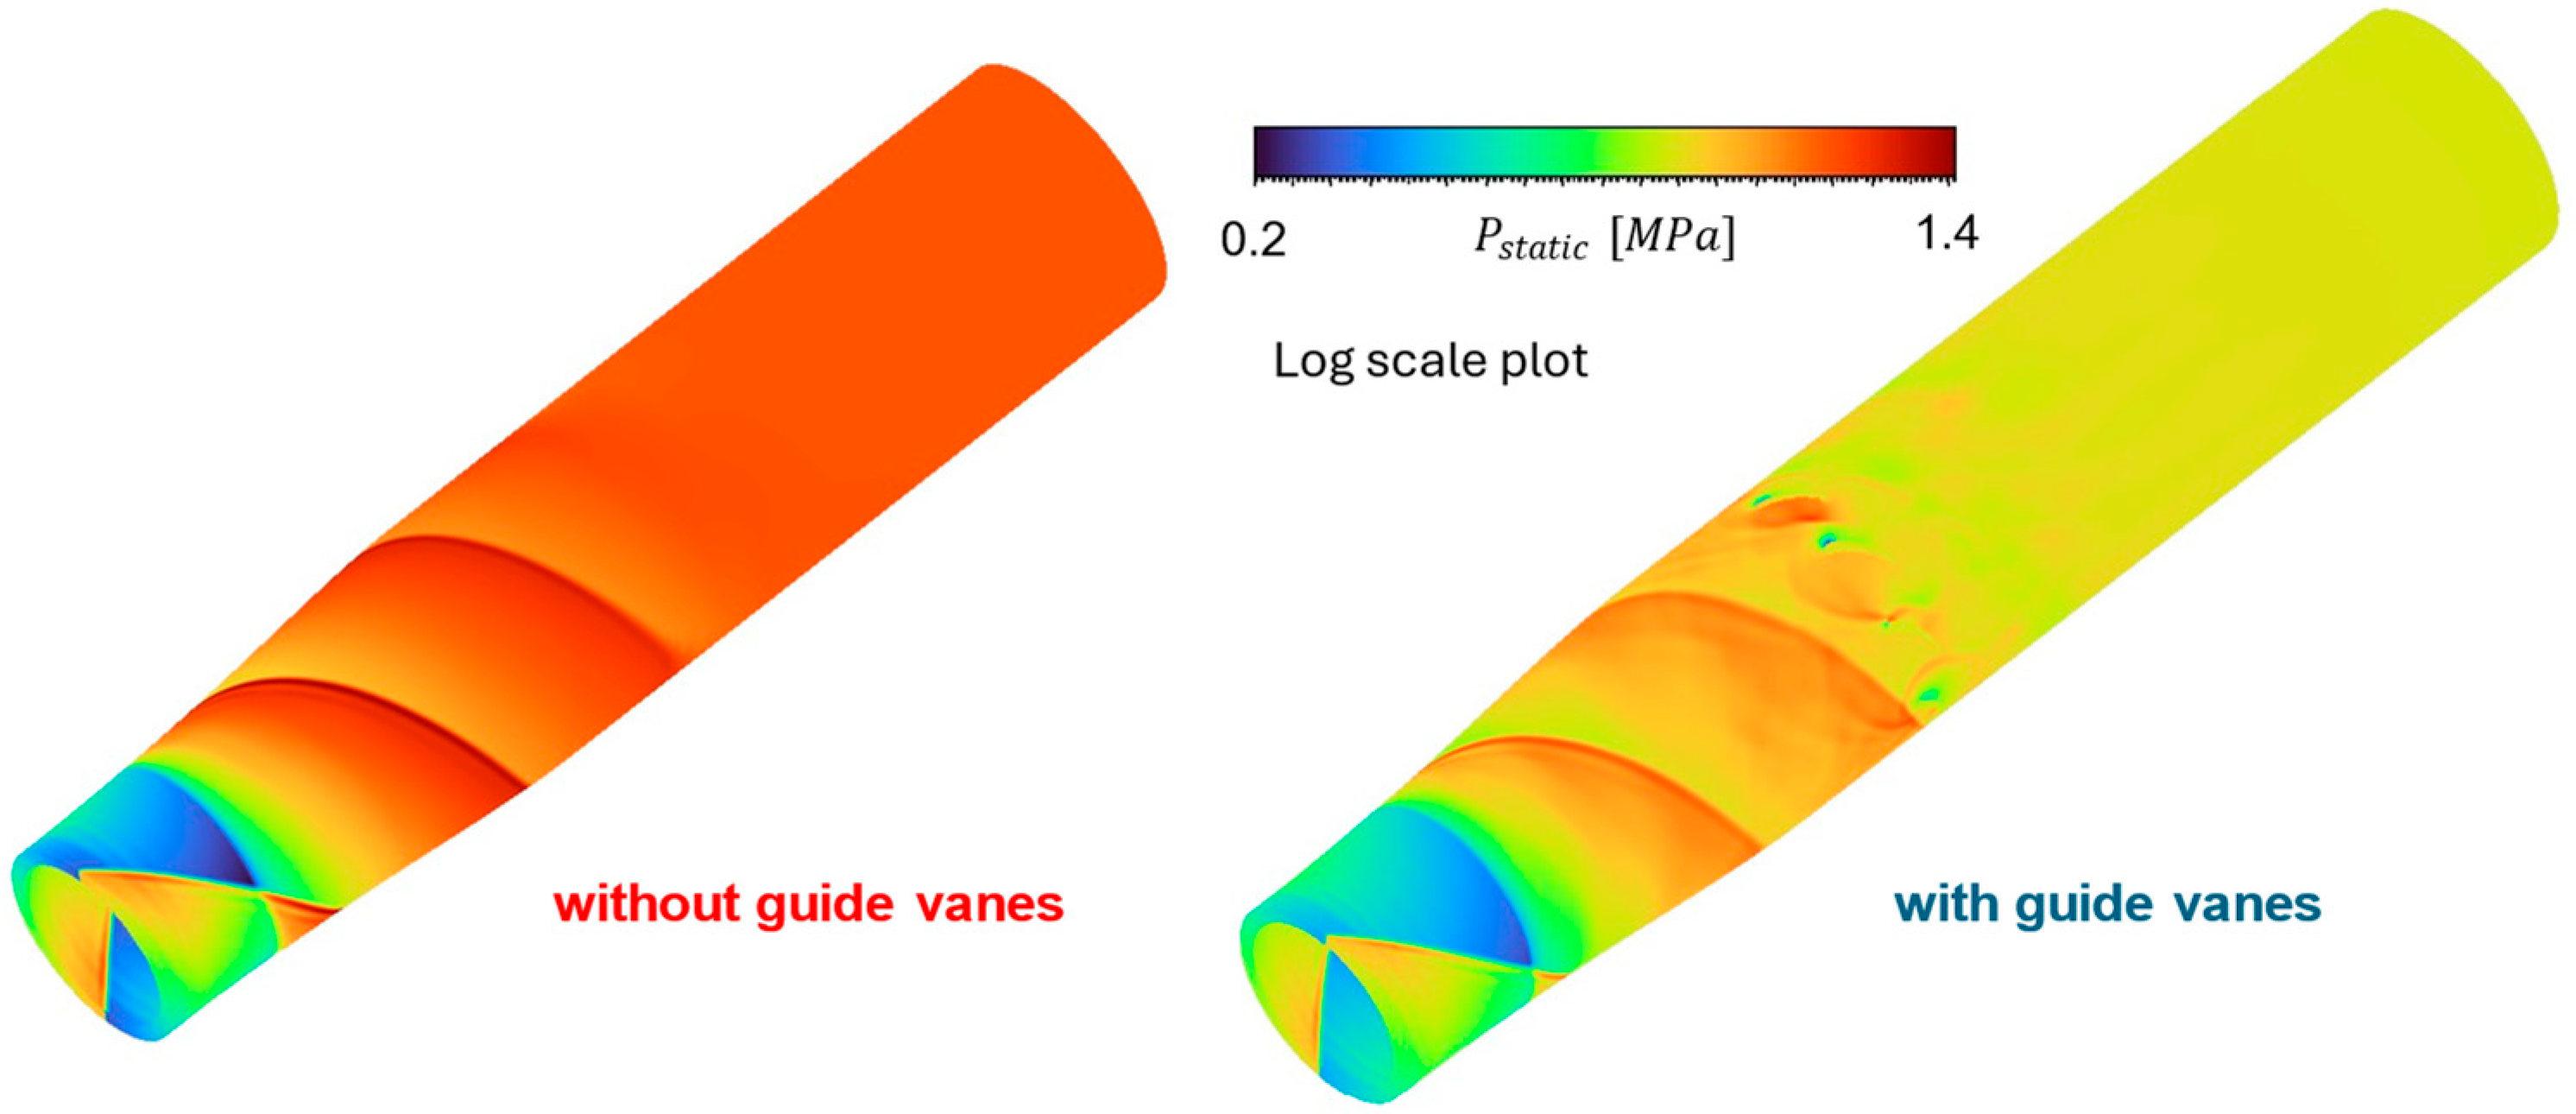
Figure 13 shows the pressure contours at one instant of time in the transition duct with and without guide vanes. From this figure, swirling shock waves approaching the guide vanes can be seen to be reflected by the guide vanes. These reflected waves are physically meaningful. Once reflected, there are complex shock-wave/wall and shock-wave/shock-wave interactions. Thus, guide vanes increase the complexity of the flow. In this study, the guide vanes used were not optimized to take advantage of the unsteady swirling shock waves to increase pressure while turning the flow to drive the rotor blades with minimum loss.
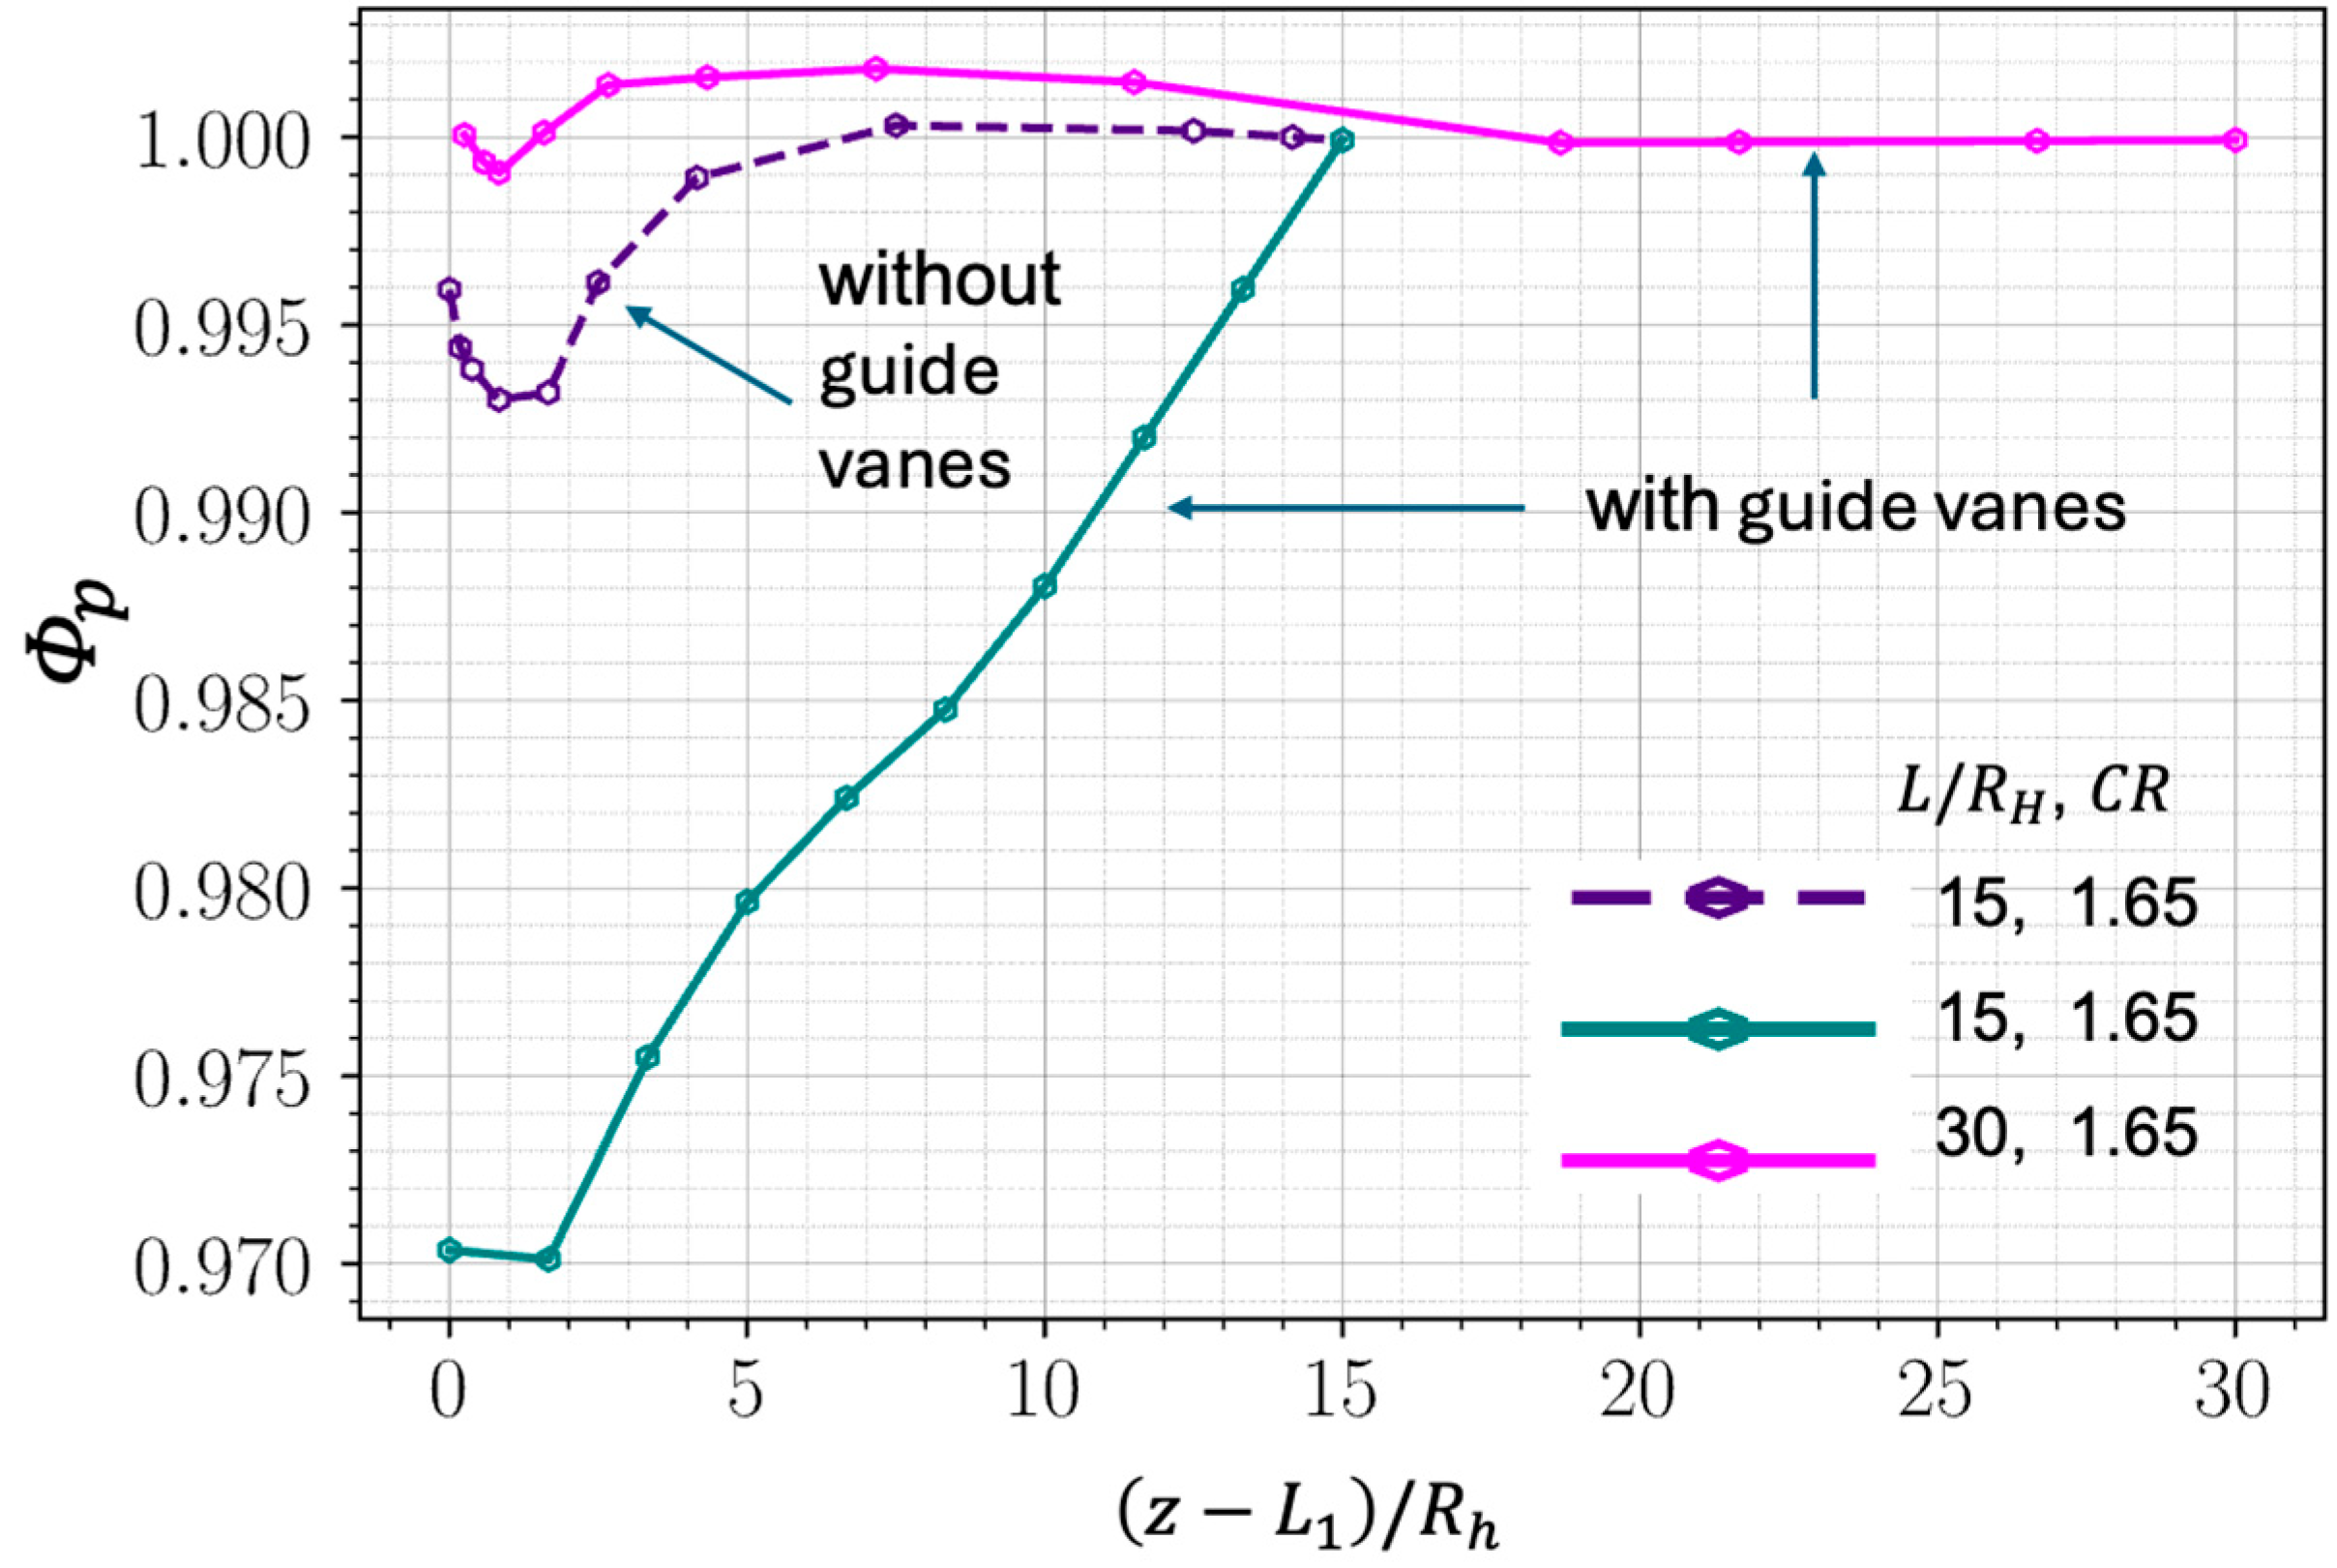
Figure 14 shows that when there are guide vanes, a longer sponge layer was needed. With a coarsening ratio of C R = 1.65 the sponge layer with length of L / R h = 15 produced a relative error of about 3% on the average pressure predicted at the outflow boundary of the physical domain ( z = L 1 + L 2 ). By increasing the length of the sponge layer from 15 to 30 and using the same C R = 1.65 , that relative error reduced to 0.2%. Increasing L / R h from 15 to 30 adds 0.05 million cells or 0.7% more cells to the problem studied. Adding an extension duct with L / R h = 30 and C R = 1.65 adds 0.58 million cells or 9% more cells to the problem studied.

5.3. Effects of Temperature-Dependent Specific Heats

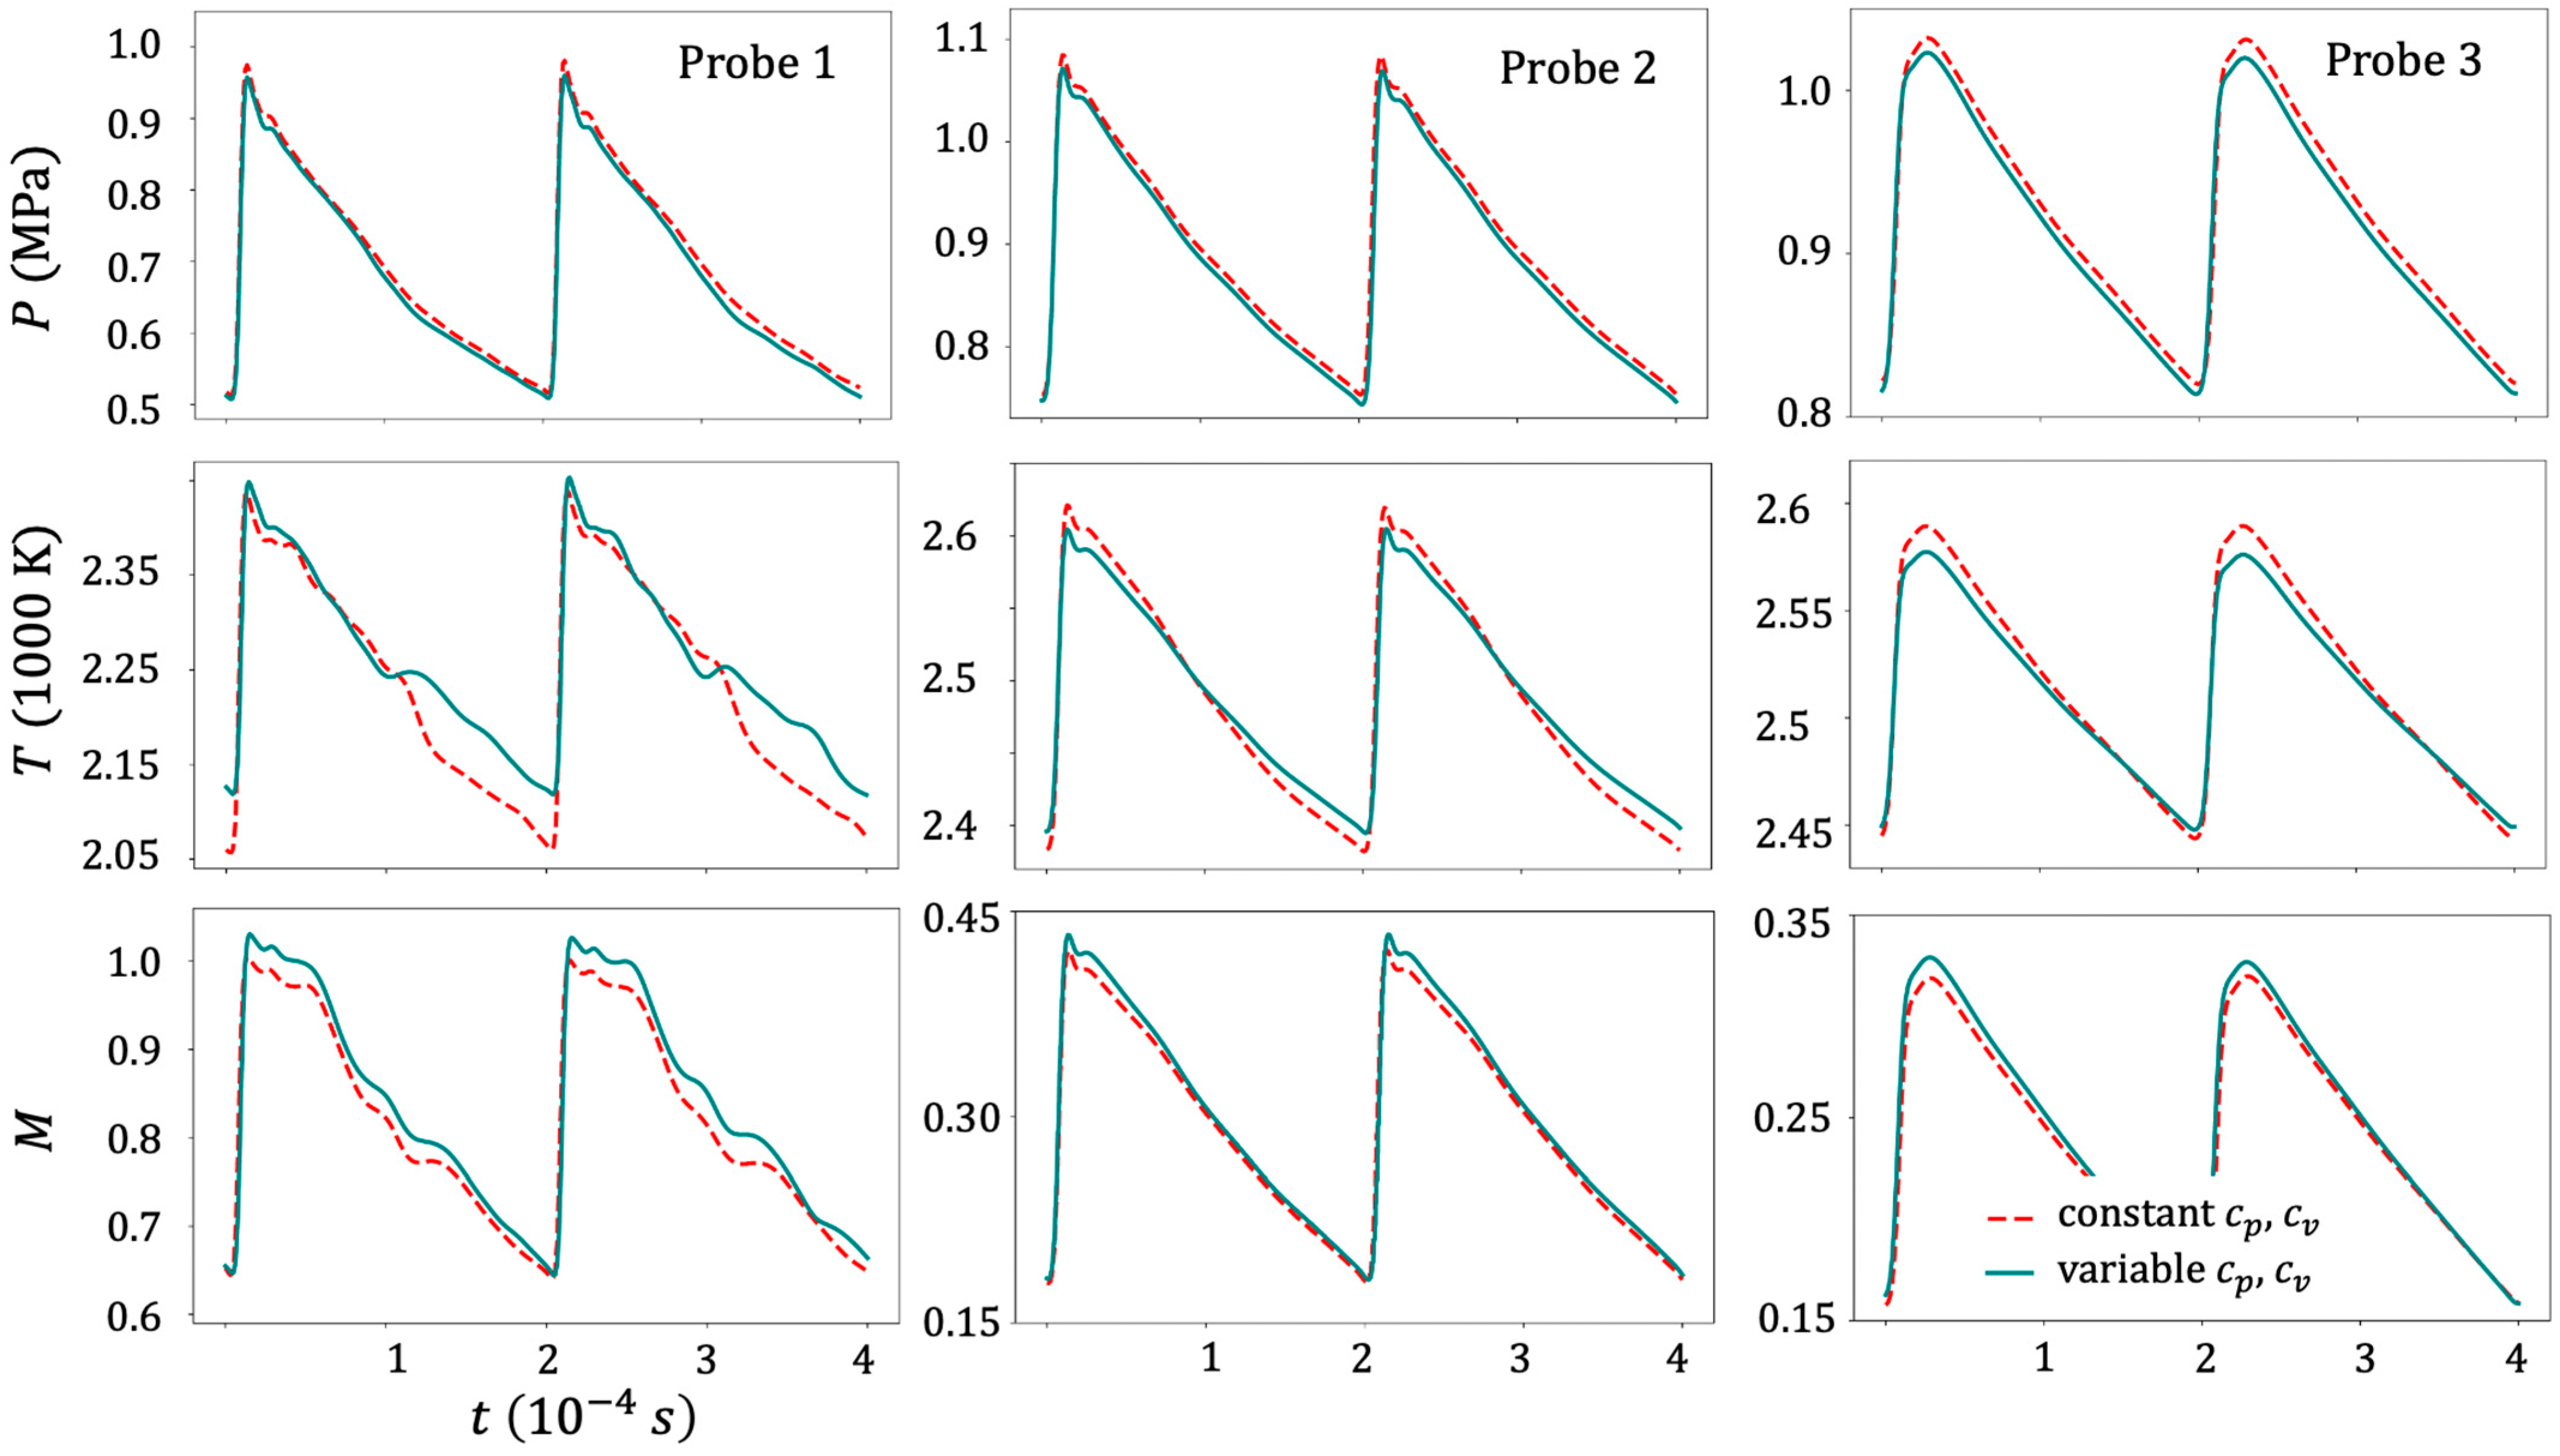
Since the LRM-NRBC from Selle et al. [35] requires the specific heats, c p and c v , to be constants, it is of interest to examine whether this assumption could be invoked for swirling shock waves where the maximum and minimum temperature differ by as much as 400 K for the conditions of this study. Figure 15 shows results obtained by using constant values of c p and c v based on the average static temperature at the inflow boundary of the transition duct and by using temperature-dependent c p and c v [41]. From this figure, the maximum relative error in not accounting for the effects of temperature on c p and c v is less than 2% for static pressure, 3% for static temperature, and 3% for Mach number. Though these relative errors are small, their absolute values are not because the static pressure and static temperatures are so high. A 3% relative error in static temperature is 75 K. A 3% relative error in the Mach number could be supersonic or subsonic flow. If there is combustion, then the temperature variations will be greater and temperature-dependent c p and c v become even more critical. In those cases, nonreflecting boundary conditions such as LRM-NRBC [35] should not be used, but an extension duct with a buffer layer and a sponge layer of proper length (e.g., L / R h = 15 ) and coarsening ratio (e.g., C R = 1.65 ) would be useful in preventing spurious reflections at the outflow boundary and still impose the correct average static pressure at the outflow boundary of the physical domain (i.e., outlet of the transition duct with or without guide vanes).

6. Conclusions

CFD based on unsteady, three-dimensional ensemble-averaged Navier–Stokes equations for a thermally perfect gas and closed by the realizable k–ε model with “enhanced” wall function were used to study outflow boundary conditions (BCs) for a transition duct with and without guide vanes that convert supersonic flow with swirling shock waves that enter from a rotation detonation combustor (RDC) to subsonic flow for a turbine. Results obtained show an extension duct—made up of a buffer layer with length of L b / R h 1 and a sponge layer with length of L / R h = 15 and grid coarsening ratio of C R = z k + 1 z k ( z k z k 1 ) = 1.65 , where R h is the hydraulic radius of the transition’s duct’s annulus—could dampen swirling shock waves and its reflected waves so that the solution obtained at the outlet of the transition duct with or without guide vanes do not have any non-physical waves degrading the solution. Also, though the desired averaged pressure is imposed at the outlet of the extension duct, the predicted average pressure at the outlet of the transition has error less than 0.4%, better than that produced by the LRM-NRBC. If higher accuracy is needed, then the length of sponge layer could be doubled while keeping the same coarsening ratio. Since a coarsening ratio of C R = 1.65 is quite high, using an extension duct to implement the outflow boundary condition does not significantly increase computational cost. For the problem studied, the increase in cost is 15% for the transition duct without guide vanes and 10% for the transition duct with guide vanes. Also, by using the extension duct to implement the outflow boundary condition, temperature-dependent specific heats could be accounted for, which is important if the combustion process is also simulated. This study also proposed two parameters— Φ p and Φ L C R —to assess the adequacy of extension ducts in ensuring no non-physical reflected waves at the outflow boundary.

Author Contributions

Conceptualization, J.C. and T.I.-P.S.; methodology, T.I.-P.S. and T.-M.H.; software, T.-M.H.; validation, T.-M.H.; formal analysis, T.-M.H. and T.I.-P.S.; investigation, T.-M.H. and T.I.-P.S.; resources, T.I.-P.S.; data curation, T.-M.H.; writing—original draft preparation, T.I.-P.S.; writing—review and editing, T.-M.H., J.C., K.M.B. and R.P.D.; visualization, T.-M.H. and T.I.-P.S.; supervision, T.I.-P.S.; project administration, J.C., R.P.D. and K.M.B.; funding acquisition, J.C., R.P.D. and K.M.B. All authors have read and agreed to the published version of the manuscript.

Funding

This research was funded by US Department of Energy National Energy Technology Laboratory Contract No. DE-AC02-07CH11358 and US Department of Energy Ames National Laboratory Agreement No. AL-24-450-026.

Institutional Review Board Statement

Not applicable.

Informed Consent Statement

Not applicable.

Data Availability Statement

All data are given in the paper.

Acknowledgments

This work was supported by the Ames Laboratory and the National Energy Technology Laboratory with funding from the Department of Energy under Contract No. DE-AC02-07CH11358/Agreement No. AL-24-450-026. The authors are grateful for this support.

Conflicts of Interest

The authors declare no conflicts of interest.

References

  1. Goddard, R.H. Reaction Combustion Chamber for Unconfined Charges of Detonative Fuel Fed Intermittently to the Combustion Chamber. U.S. Patent No. 2,465,525, 29 March 1949. [Google Scholar]
  2. Nicholls, J.A.; Cullen, R.E.; Ragland, K.W. Feasibility Studies of a Rotating Detonation Wave Rocket Motor. J. Spacecr. Rockets 1966, 3, 893–898. [Google Scholar] [CrossRef]
  3. Adamson, T.C.; Olsson, G.R. Performance Analysis of a Rotating Detonation Wave Rocket Engine (Rotating Detonation Wave Rocket Engine Performance Analyzed and Compared to Conventional Rocket Engines). Acta Astronaut. 1967, 14, 405–415. [Google Scholar]
  4. Bykovskii, F.A.; Zhdan, S.A.; Vedernikov, E.F. Continuous Spin Detonations. J. Propul. Power 2006, 22, 1204–1216. [Google Scholar] [CrossRef]
  5. Lu, F.K.; Braun, E.M. Rotating Detonation Wave Propulsion: Experimental Challenges, Modeling, ad Engine Concepts. J. Propul. Power 2014, 30, 1125–1142. [Google Scholar] [CrossRef]
  6. Zhou, R.; Wang, J.-P. Numerical Investigation of Shock Wave Reflections near the Head Ends of Rotating Detonation Engines. Shock Waves 2013, 23, 461–472. [Google Scholar] [CrossRef]
  7. Escobar, S. Rotating Detonation Combustion: A Computational Study for Stationary Power Generation. Ph.D. Thesis, West Virginia University, Morgantown, WV, USA, 2014. [Google Scholar]
  8. Paniagua, G.; Iorio, M.C.; Vinha, N.; Sousa, J. Design and analysis of pioneering high supersonic axial turbines. Int. J. Mech. Sci. 2014, 89, 300–310. [Google Scholar] [CrossRef]
  9. Saracoglu, B.H.; Ozden, A. The Effects of Multiple Detonation Waves. Transp. Res. Procedia 2018, 29, 23–32. [Google Scholar] [CrossRef]
  10. Ji, Z.; Zhang, H.; Wang, B. Performance Analysis of Dual-Duct Rotating Detonation Aero-Turbine Engine. Aerosp. Sci. Technol. 2019, 92, 806–819. [Google Scholar] [CrossRef]
  11. Lietz, C.; Desai, Y.; Munipalli, R.; Schumaker, S.A.; Sankaran, V. Flowfield Analysis of a 3D Simulation of a Rotating Detonation Rocket Engine. In Proceedings of the AIAA Scitech 2019 Forum, San Diego, CA, USA, 7–11 January 2019. [Google Scholar] [CrossRef]
  12. Zhang, S.J.; Ma, J.Z.; Wang, J. Theoretical and Numerical Investigation on Total Pressure Gain in Rotating Detonation Engine. AIAA J. 2020, 58, 4866–4875. [Google Scholar] [CrossRef]
  13. Liu, Z.; Braun, J.; Paniagua, G. Integration of a Transonic High-Pressure Turbine with a Rotating Detonation Combustor and a Diffuser. Int. J. Turbo Jet-Engines 2023, 40, 1–10. [Google Scholar] [CrossRef]
  14. Prakash, S.; Raman, V.; Lietz, C.F.; Hargus, W.A., Jr.; Schumaker, S.A. Numerical Simulation of a Methane–Oxygen Rotating Detonation Rocket Engine. Proc. Combust. Inst. 2021, 38, 3777–3786. [Google Scholar] [CrossRef]
  15. Sato, T.; Chacon, F.; White, L.; Raman, V.; Gamba, M. Mixing and Detonation Structure in a Rotating Detonation Engine with an Axial Air Inlet. Proc. Combust. Inst. 2021, 38, 3767–3776. [Google Scholar] [CrossRef]
  16. Sato, T.; Chacon, F.; Gamba, M.; Raman, V. Mass Flow Rate Effect on a Rotating Detonation Combustor with an Axial Air Injection. Shock Waves 2021, 31, 741–751. [Google Scholar] [CrossRef]
  17. Zhang, C.; Lin, Z.; Dong, T. Numerical Study on the Interaction Characterization of Rotating Detonation Wave and Turbine Rotor Blades. Int. J. Hydrogen Energy 2022, 47, 6898–6910. [Google Scholar] [CrossRef]
  18. Shen, D.; Cheng, M.; Wu, K.; Sheng, Z.; Wang, J. Effects of Supersonic Nozzle Guide Vanes on the Performance and Flow Structures of a Rotating Detonation Combustor. Acta Astronaut. 2022, 193, 90–99. [Google Scholar] [CrossRef]
  19. Sridhara, S.R.; Andreini, A.; Polanka, M.D.; Bohon, M.D. LES Investigation of Film Cooling in Rotating Detonation Combustors. In Proceedings of the ASME Turbo Expo 2024: Turbomachinery Technical Conference and Exposition, London, UK, 24–28 June 2024. [Google Scholar]
  20. Talukdar, S.; Langner, D.; Gupta, A.; Agarwal, A.K. Performance Characteristics of a Rotating Detonation Combustor Exiting into a Pressurized Plenum to Simulate Gas Turbine Inlet. J. Eng. Gas Turbines Power 2024, 146, 041015. [Google Scholar] [CrossRef]
  21. Shao, X.; Yang, H.; Zhao, N.; Zhai, D.; Jin, S.; Zhang, W. Numerical Study on the Interaction between Rotating Detonation Wave and Turbine Stator Blades with Multicomponent Mixtures. Int. J. Hydrogen Energy 2024, 49, 1436–1445. [Google Scholar] [CrossRef]
  22. Dille, K.J.; Slabaugh, C.D.; Heister, S.D. Rotating Detonation Combustor Performance Modelling Informed by Experimental Stagnation Pressure Measurements. In Proceedings of the AIAA SCITECH 2024 Forum, Orlando, FL, USA, 8–12 January 2024. [Google Scholar]
  23. Pal, P.; Braun, J.; Wang, Y.; Athmanathan, V.; Paniagua, G.; Meyer, T.R. Large-Eddy Simulation Study of Flow and Combustion Dynamics in a Full-Scale Hydrogen-Air Rotating Detonation Combustor-Stator Integrated System. J. Eng. Gas Turbines Power 2025, 147, 031002. [Google Scholar] [CrossRef]
  24. Plaseehn, E.W.; Haynes, A.L.; Gejji, R.M.; Slabaugh, C.D. Chamber Length Limits of a Continuously Variable Geometry Rotating Detonation Combustor. J. Propul. Power 2025, 41, 135–149. [Google Scholar] [CrossRef]
  25. Gustafsson, B.; Sundstrom, A. Incompletely Parabolic Problems in Fluid Dynamics. SIAM J. Appl. Math. 1978, 35, 343–357. [Google Scholar] [CrossRef]
  26. Rudy, D.H.; Strikwerda, J.C. A Non-Reflecting Outflow Boundary Condition for Subsonic Navier–Stokes Calculations. J. Comput. Phys. 1980, 36, 55–70. [Google Scholar] [CrossRef]
  27. Israel, M.; Orszag, S.A. Approximation of Radiation Boundary Conditions. J. Comput. Phys. 1981, 41, 115–135. [Google Scholar] [CrossRef]
  28. Thompson, K.W. Time Dependent Boundary Conditions for Hyperbolic Systems. J. Comput. Phys. 1987, 68, 1–24. [Google Scholar] [CrossRef]
  29. Gustafsson, B. Far-Field Boundary Conditions for Time-Dependant Hyperbolic Systems. SIAM J. Sci. Stat. Comput. 1988, 9, 812–828. [Google Scholar] [CrossRef]
  30. Giles, M.B. Non-Reflecting Boundary Conditions for Euler Equations; TR CFDL-TR-88-1; Massachusetts Institute of Technology, Department of Aeronautics and Astronautics: Cambridge, MA, USA, 1988. [Google Scholar]
  31. Giles, M.B. Non-Reflecting Boundary Conditions for Euler Equation Calculations. AIAA J. 1990, 28, 2050–2058. [Google Scholar] [CrossRef]
  32. Thompson, K.W. Time Dependent Boundary Conditions for Hyperbolic Systems II. J. Comput. Phys. 1990, 89, 439–461. [Google Scholar] [CrossRef]
  33. Poinsot, T.J.; Lele, S.K. Boundary Conditions for Direct Simulations of Compressible Viscous Flows. J. Comput. Phys. 1992, 101, 104–129. [Google Scholar] [CrossRef]
  34. Colonius, T.; Lele, S.K.; Moin, P. Boundary Conditions for Direct Computation of Aerodynamic Sound Generation. AIAA J. 1993, 31, 1574–1582. [Google Scholar] [CrossRef]
  35. Selle, L.; Nicoud, F.; Poinsot, T. Actual Impedance of Nonreflecting Boundary Conditions: Implications for Computation of Resonators. AIAA J. 2004, 42, 958–964. [Google Scholar] [CrossRef]
  36. Hu, F.Q.; Li, X.D.; Lin, D.K. Absorbing Boundary Conditions for Nonlinear Euler and Navier-Stokes Equations Based on the Perfectly Matched Layer Technique. J. Comput. Phys. 2008, 227, 4398–4424. [Google Scholar] [CrossRef]
  37. Kreiss, G.; Krank, B.; Efraimsson, G. Analysis of Stretched Grids and Buffer Zones in Simulations of Wave Propagation. Appl. Numer. Math. 2016, 107, 1–15. [Google Scholar] [CrossRef]
  38. Li, Z.; Abdellatif, A.; Yang, R.; Jofre, L.; Capuano, F. Navier-Stokes Characteristic Boundary Conditions for Real Fluids with Kinetic-Energy- and Pressure-Equilibrium Preserving Schemes. J. Comput. Phys. 2025, 535, 114035. [Google Scholar] [CrossRef]
  39. Kuo, K.K. Principles of Combustion; Wiley: New York, NY, USA, 1986. [Google Scholar]
  40. White, F.M. Viscous Fluid Flow, 3rd ed.; McGraw-Hill: New York, NY, USA, 2006. [Google Scholar]
  41. McBride, B.J.; Zehe, M.J.; Gordon, S. NASA Glenn Coefficients for Calculating Thermodynamic Properties of Individual Species; NASA/TP–2002-211556; Glenn Research Center: Cleveland, OH, USA, 2002. [Google Scholar]
  42. Shih, T.-H.; Liou, W.; Shabbir, A.; Zhu, J. A New k-ε Eddy-Viscosity Model for High Reynolds Number Turbulent Flows—Model Development and Validation. Comput. Fluids 1995, 24, 227–238. [Google Scholar] [CrossRef]
  43. Kader, B. Temperature and Concentration Profiles in Fully Turbulent Boundary Layers. Int. J. Heat Mass Transfer 1981, 24, 1541–1544. [Google Scholar] [CrossRef]
  44. Chima, R.V.; Liou, M.S. Comparison of the AUSM+ and H-CUSP Schemes for Turbomachinery Applications. In Proceedings of the 33rd Fluid Dynamics Conference and Exhibit, Orlando, FL, USA, 23–26 June 2003. [Google Scholar]
  45. ANSYS FLUENT. Computational Fluid Dynamic Code Manual, Version 2024R2. Available online: https://ansyshelp.ansys.com/public/account/secured?returnurl=/Views/Secured/prod_page.html?pn=Fluent&prodver=24.2&lang=en (accessed on 5 November 2025).
Figure 1. Schematic of the transition duct studied: R i = 130   m m ,   R 1 = 153   m m , R 2 = 190   m m ,   L 1 = 750   m m   , L 2 = 350   m m ,   L b = 50   m m ,   L = 5 R h ,   15 R h ,   30 R h ,   R h = 60   m m .
Applsci 15 11922 g001
Figure 2. Flow conditions exiting RDC and entering transition duct (data taken from Ref. [9] and smoothed). Flow angle ( β ) is with respect to axis of annulus (z-direction).
Applsci 15 11922 g002
Figure 3. Baseline grid used.
Applsci 15 11922 g003
Figure 4. Grids used in the grid-spacing sensitivity study: coarse with 1.2 million cells (20 × 300 × 200), baseline with 3.6 million cells (30 × 400 × 300), and fine with 9.6 million cells (40 × 600 × 400).
Applsci 15 11922 g004
Figure 5. Instantaneous pressure (P), temperature (T), and Mach number (M) at the transition duct’s outlet ( z = L 1 ) as a function of θ at r = r R i / R o R i = 0 . 5 obtained by using the three grids shown in Figure 4 with LRM-NRBC (Case 1, Table 1).
Applsci 15 11922 g005
Figure 6. Pressure (P) at transition duct’s outlet ( z = L 1 ) as a function of time at r ,   θ / 2 π ,   z / L 1 = 0.5 ,   0.25 ,   0.25 —a location just upstream of the terminal shock—and at r ,   θ / 2 π ,   z / L 1 = 0.5 ,   0.25 ,   1 / 3 —a location slightly downstream of the terminal shock—obtained by using the baseline grid with Δ t = 4 × 10 6   s , Δ t = 10 6   s , and Δ t = 5 × 10 7 s.
Applsci 15 11922 g006
Figure 7. Pressure contours at one instant of time in the transition duct obtained for Case 1 (no NRBC) and Case 2 (with NRBC) in Table 1 at a radial position midway between the inner and outer walls of the transition duct.
Applsci 15 11922 g007
Figure 8. Pressure history at three probe locations in the transition duct for Cases 1 and 2.
Applsci 15 11922 g008
Figure 9. Φ p as a function of L / R h and C R along the extension duct for Cases 2 to 8.
Applsci 15 11922 g009
Figure 10. Time history of the static pressure ( P ), static temperature( T ), and Mach number ( M ) at Probe 3: r ,   θ / 2 π ,   z / L 1 = 0.5 ,   0.25 ,   1 in Figure 8.
Applsci 15 11922 g010
Figure 11. Instantaneous normalized static pressure ( P / P b ) as a function of normalized z ( z / L 1 in the transition duct, z L 1 / L b in the buffer layer, and ( z L 1 L b ) / L in the sponge layer) at θ =   π / 4 and a radial location midway between the inner and outer walls of the transition duct. Dotted color lines were used in the zoomed-up views to improve visualization.
Applsci 15 11922 g011
Figure 12. Spectral analysis of the instantaneous static pressure ( P ) at Probe 1: r ,   θ / 2 π ,   z / L 1 = 0.5 ,   0.25 ,   1 / 3 in Figure 8.
Applsci 15 11922 g012
Figure 13. Pressure contours at one instant of time in the transition duct with and without guide vanes obtained for Cases 6 and 10 at a radial position midway between the inner and outer walls.
Applsci 15 11922 g013
Figure 14. Φ p as a function of L / R h along the extension duct for Cases 6, 10, and 11 with and without guide vanes in the transition duct.
Applsci 15 11922 g014
Figure 15. Time history of the static pressure ( P ), static temperature ( T ), and Mach number ( M ) at three probe locations given in Figure 8 for flow with constant and temperature-dependent c p and c v .
Applsci 15 11922 g015
Table 1. Summary of Cases Studied.
Case NoGuide VaneLRM-NRBC P b c p ,   c v L / R h C R *
1nono0.90constant0N/A
2noyes0.90constant0N/A
3nono0.90constant51.15
4nono0.90constant151.15
5nono0.90constant151.3
6nono0.90constant151.65
7nono0.90constant151.025
8nono0.90constant151.075
9nono0.90variable151.15
10yesno0.65variable151.65
11yesno0.65variable301.65
* C R = coarsening ratio (see Equation (7)).
Disclaimer/Publisher’s Note: The statements, opinions and data contained in all publications are solely those of the individual author(s) and contributor(s) and not of MDPI and/or the editor(s). MDPI and/or the editor(s) disclaim responsibility for any injury to people or property resulting from any ideas, methods, instructions or products referred to in the content.