Article

Low-Dose Narrowband UVB Exposure Modulates Systemic Metabolism in Mice

by
Shion Yuki
1,
Kazuaki Mawatari
1,*,
Takashi Uebanso
1,
Akira Takahashi
1 and
Tetsuya Shiuchi
2,3,*
1
Department of Preventive Environment and Nutrition, Institute of Biomedical Sciences, Tokushima University Graduate School, Tokushima City 770-8503, Tokushima, Japan
2
Department of Integrative Physiology, Institute of Biomedical Sciences, Tokushima University Graduate School, Tokushima City 770-8503, Tokushima, Japan
3
Department of Health and Nutrition, Faculty of Human Life Science, Shikoku University, Tokushima City 771-1192, Tokushima, Japan
*
Authors to whom correspondence should be addressed.
Appl. Sci. 2025, 15(22), 11869; https://doi.org/10.3390/app152211869
Submission received: 13 September 2025 / Revised: 14 October 2025 / Accepted: 3 November 2025 / Published: 7 November 2025
(This article belongs to the Special Issue Emerging Technologies for Health, Nutrition, and Sports Performance)

Abstract

Ultraviolet B (UVB) light exerts biological effects beyond the skin; however, its influence on systemic energy metabolism remains unclear. We investigated the effects of chronic, low-dose narrowband UVB irradiation on substrate utilization, circulating metabolites, and thermogenesis of brown adipose tissue (BAT) in mice. Male and female C57BL/6J mice were daily exposed to sub-erythemal UVB (308 nm, 50 or 100 mJ/cm2, 3 h) for up to 7 weeks using a custom light-emitting diode-based device. Metabolic outcomes were assessed by indirect calorimetry, locomotor activity monitoring, and infrared thermography. Plasma metabolites were profiled by capillary electrophoresis–time-of-flight mass spectrometry. Gene expression in BAT and skin was measured by reverse transcription quantitative polymerase chain reaction. UVB exposure lowered the respiratory exchange ratio at specific time points, indicating greater lipid utilization, and transiently increased oxygen consumption. Metabolomic profiling revealed reduced succinate levels and enrichment of nicotinate/nicotinamide and propanoate metabolism pathways. Infrared thermography showed elevated surface temperature after irradiation and that prolonged UVB exposure modestly upregulated thermogenic genes in BAT, along with increased cutaneous expression of Cidea. These findings suggested that sub-erythemal UVB exposure modestly modulates systemic metabolism, circulating metabolites, and BAT activity, highlighting UVB as a potential environmental regulator of energy balance.

1. Introduction

Light regulates various physiological processes, and evidence indicates that different wavelengths of light exert distinct biological effects [1,2,3,4]. They differentially influence glucose metabolism [3,5], thermoregulation [3,6,7], energy expenditure [2,8], and body weight [4,8]. Among these, ultraviolet B (UVB, 280–320 nm) exerts particularly pronounced effects [9]. To induce a similar erythemal response, approximately 1000-fold less UVB is required than UVA (320–400 nm) in fair-skinned Caucasians [9,10]. Although UVB represents only ~5% of the solar UV radiation reaching Earth’s surface [9], people in Europe and the United States spend a median of 1–2.5 h outdoors daily, leading to continuous natural exposure [11,12]. Clinically, UVB irradiation is also applied in phototherapy for skin diseases such as vitiligo, psoriasis, and mycosis fungoides, with narrowband UVB considered a first-line treatment [13]. Given its dual role as an environmental factor and a therapeutic modality, elucidating the systemic biological effects of UVB is of social and clinical relevance.
Recent studies in mice suggest that UVB irradiation may influence energy metabolism. Long-term sub-erythemal UVB exposure alleviates high-fat diet (HFD)-induced metabolic impairments, including weight gain, hepatic steatosis, and glucose intolerance [14,15,16]. Mechanistically, UVB irradiation has been shown to stimulate the hypothalamic–pituitary–adrenal (HPA) axis and the hypothalamic melanocortin system [17,18,19,20,21], both of which are established regulators of energy metabolism and substrate utilization [22,23,24,25,26]. However, the effects of long-term, low-dose UVB irradiation on energy metabolism are not yet fully understood. In particular, two studies examining UVB exposure and oxygen consumption—a key measure of energy expenditure—have yielded conflicting results, with one reporting no effect and another showing an increase in oxygen consumption [20,21]. Because both studies analyzed standard chow-fed C57BL/6 mice, such discrepancies likely arise from differences in irradiation conditions. Both studies used broadband UVB fluorescent lamps ranging from 275 to 380 nm; however, their emission characteristics differed in peak wavelength (302 nm or 310–315 nm) and in the use or omission of UVC-cut filters. Similar discrepancies have also been reported regarding UVB’s effects on HFD-induced weight gain [14,27]; however, those studies employed broadband UV irradiation within the 250–360 nm range. These inconsistencies highlight the need for a systematic evaluation of the metabolic effects of low-dose UVB exposure. To address this gap, the present study focused on long-term, low-dose narrowband UVB (308 nm) exposure using a custom, spectrally calibrated light-emitting diode (LED) system to reproducibly assess its effects on systemic metabolism and thermogenic regulation. LEDs can emit light at specific narrowband wavelengths without the need for optical filters. The customized UVB irradiation device developed in this study enables precise control of wavelength, irradiance, and fluence, ensuring reproducible and physiologically relevant exposure. This approach allows for the accurate delineation of the biological responses specifically attributable to narrowband UVB irradiation, minimizing confounding factors inherent to broadband sources.
Brown adipose tissue (BAT) plays a central role in non-shivering thermogenesis [28,29]. This process is mediated by uncoupling protein 1 (UCP1), which promotes proton leakage across the mitochondrial membrane, thereby uncoupling substrate oxidation from ATP production [28]. Thermogenic activity and UCP-1 function are regulated by neurological pathways, including sympathetic nerve projections descending from the hypothalamus [30]. Activated BAT enhances the utilization of glucose and lipids [31,32], thereby altering whole-body substrate use, as reflected in the respiratory exchange ratio (RER). In addition, chronic cold exposure modifies plasma metabolite profiles [33], further underscoring the connection between BAT activity and circulating metabolites. Given its pivotal role in energy balance and substrate metabolism, BAT thermogenesis has attracted considerable attention as a therapeutic target for obesity and related metabolic disorders, although challenges remain in its clinical application [34].
Previous studies have shown that UVB irradiation in mice, when combined with running activity, increases UCP1 expression in BAT, suggesting that UVB exposure might enhance thermogenic capacity [35]. However, no studies have directly examined the impact of UVB on energy metabolism and substrate utilization in the context of BAT function. To address this gap, the present study investigated the effects of long-term, low-dose UVB exposure on systemic metabolism, the plasma metabolome, and BAT thermogenic function in mice. We hypothesized that prolonged UVB exposure would modulate systemic metabolic processes and alter circulating metabolites associated with enhanced BAT activity. These findings will provide novel insights into the role of UVB in energy homeostasis and explore its potential as a therapeutic approach for metabolic diseases.

2. Materials and Methods

2.1. Animals

Six- to seven-week-old male and female C57BL/6J mice (SLC Inc., Shizuoka, Japan) were acclimatized for at least 1 week before experiments. After acclimatization, mice were randomly assigned to either the Control or the UVB group, matched by body weight. All animals were fed a standard moderate-fat (MF) diet (Oriental Yeast Co., Ltd., Tokyo, Japan) and housed individually under controlled conditions (23 ± 1 °C, 12 h light/dark cycle). Body weight was recorded weekly. All procedures were performed in accordance with the ARRIVE guidelines. To expose the dorsal skin to UVB irradiation, all mice in both the Control and UVB groups had their dorsal hair removed weekly under isoflurane anesthesia (Abbott, Abbott Park, IL, USA) using an electric clipper. Repeated shaving under light isoflurane anesthesia could theoretically alter stress hormone levels or thermoregulation. However, to minimize such confounding effects, identical handling and anesthesia were applied to all mice, including controls. Previous study have reported that repeated anesthesia (six times at 3–4-day intervals) with isoflurane did not alter fecal or hair corticosterone levels, indicators of chronic stress, in C57BL/6J mice [36]. Therefore, the effects of anesthesia and shaving were considered negligible in the present experimental context.

2.2. UVB Irradiation Device and Irradiating Conditions

To enable long-term and well-controlled UVB exposure, we developed a custom irradiation device designed to fit standard mouse cages and evaluated its performance (Figure 1A). The device consisted of an aluminum plate with a heat-dissipating sheet that contributed to thermal stability (Supplementary Figure S1), fitted with printed circuit boards (Audio-Q, Shizuoka, Japan) containing UVB-LEDs (NCSU434B, Nichia Corp., Tokushima, Japan) that emitted narrowband UVB light at a measured peak wavelength of 308 nm and a full width at half maximum of approximately 10 nm (spectral half-bandwidth ± 5 nm). Spectroradiometric analysis confirmed that the emission spectrum consisted solely of UVB wavelengths, with no detectable radiation below 290 nm, ensuring the absence of UVC contamination, using a fiber-coupled spectroradiometer (MCPD 3700A, Otsuka Electronics, Osaka, Japan) equipped with a cosine corrector, with calibration traceable to the Japan Calibration Service System (JCSS). Irradiance was measured using a data-logging spectrophotometer (TR-74Ui, T&D Corp., Nagano, Japan) and was found to increase linearly with current (Figure 1C). The device provided temporal stability (Supplementary Figure S1B) and uniform illumination across the cage floor, except for the area beneath the water bottle (3.6–10.8 cm in width and 0.0–3.5 cm in depth), thereby enabling precise dose control (Figure 1D).
Seven- to eight-week-old mice were irradiated daily from zeitgeber time (ZT) 9 to ZT12 with either 50 mJ/cm2 UVB (cohorts 1–3) or 100 mJ/cm2 UVB (cohort 4) under light conditions (Figure 1E). After 3 weeks of irradiation, skin color, resting energy expenditure (REE), oxygen consumption (VO2), and locomotor activity were assessed in back-shaved mice (Figure 1F). After 7 weeks, body surface temperature was measured, and tissues including blood, hypothalamus, interscapular BAT (iBAT), small intestine, and dorsal skin with subcutaneous fat, were collected for further analyses (Figure 1F). The assays, experimental groupings, irradiation conditions, and corresponding data figures for each cohort are summarized in Table 1. The irradiation dose used in cohorts 1 and 2 (50 mJ/cm2) was determined based on a previous report [20], in which UVB exposure at this dose produced significant biological effects, including increased food intake in male mice. Therefore, we selected 50 mJ/cm2 as the lower limit of our exposure range. However, in our own study, 50 mJ/cm2 UVB irradiation did not elicit significant changes in food intake in both sexes (Figure 2E,F and Figure S2). To ensure a sufficient physiological response, we subsequently focused on male mice (cohorts 3 and 4) and applied a higher dose of 100 mJ/cm2 in cohort 4. This value was chosen as it remains below the Threshold Limit Value (TLV) for 308 nm UVB (120 mJ/cm2) defined by the American Conference of Governmental Industrial Hygienists (ACGIH) [37], ensuring safety while providing a stronger stimulus.
In cohort 4, three mice in the UVB group were excluded due to higher-than-intended UVB exposure caused by a user-related timer configuration error, rather than a malfunction or instability of the UVB device itself. This issue could be subsequently resolved by replacing the external timer hardware and implementing an integrated, microcontroller-based secondary timer system to ensure synchronized and automated control of irradiation duration. And we acknowledge that the number of female mice in cohort 2 (n = 4, with one excluded from metabolomic analysis) was insufficient to achieve adequate statistical power for analyzing sex differences.

2.3. Respiratory Exchange Ratio (RER), VO2, and Locomotor Activity

After a 12 h acclimation period in individual cages (LP-80LED-6ARS, NK System, Osaka, Japan), VO2 and locomotor activity were measured using a mass spectrometry respiratory gas analyzer (ARCO-2000, ARCO System, Chiba, Japan) and an animal locomotor analysis system (ACTIMO System, Shin Factory, Fukuoka, Japan), respectively. The UVB irradiation device was mounted on the lid of the measurement chamber. During data collection, mice were exposed to UVB at an irradiance of 0.0185 µW/cm2 during ZT9–12 (estimated fluence, 200 mJ/cm2). Food and water were provided ad libitum. Measurements were continuously recorded for 48 h following acclimation.

2.4. Food Intake Measurement

Food intake was assessed on a weekly basis. Approximately 30–40 g of fresh chow was provided to each mouse per week. Baseline food intake was defined as consumption under non-UVB conditions. In the UVB group, food intake was measured over 1 week of daily irradiation. Intake was calculated as the difference between the amount provided and the amount remaining. The residual food included chow left on the wire mesh of the cage and easily visible pellets (>5 mm) on the bedding. Smaller fragments could not be collected; therefore, the measurements may include minor errors.

2.5. Body Surface Temperature Measurement

On the day following acclimation at 24 °C, the body surface temperature of each mouse was measured using an infrared camera (FLIR C5, Teledyne FLIR, Wilsonville, OR, USA). Temperatures were recorded immediately before irradiation, immediately after irradiation (0 h), and 3 h post-irradiation at ambient temperatures of either 24 °C or 30 °C. For each mouse, the highest recorded value on the body surface was defined as its body surface temperature.

2.6. Tissue Collection and Real-Time Polymerase Chain Reaction

Following cervical dislocation and decapitation, various tissues (e.g., hypothalamus, BAT, blood, etc.) were collected, flash-frozen in liquid nitrogen, and stored at −70 °C. Because the back skin samples were connected to subcutaneous fat, RNA extracted from these samples included contributions from both tissues. Total RNA was isolated using the RNAiso Plus kit (Takara Bio, Shiga, Japan). Complementary DNA (cDNA) was synthesized using the High-Capacity cDNA Reverse Transcription Kit (Applied Biosystems, Waltham, MA, USA). Reverse transcription quantitative polymerase chain reaction (RT-qPCR) was performed on a StepOne™ Real-Time PCR System (Applied Biosystems) using FastStart Universal SYBR Green Master Mix (Roche Applied Science, Upper Bavaria, Germany) and specific primers (Table S1), following the manufacturer’s instructions. Gene expression normalization in BAT is a critical factor influencing quantitative interpretation, and inconsistent results across reference genes can weaken conclusions regarding thermogenic activation. TATA box-binding protein (Tbp), previously reported as a stable housekeeping gene in BAT in vitro [38], was used for normalization, along with β-actin (Actβ) and 16S ribosomal RNA (Rna18sn5).

2.7. Capillary Electrophoresis Mass Spectrometry (CE-MS) Analysis

Hydrophilic metabolites in the plasma were analyzed as described previously [39]. Ten-fold-diluted plasma samples (50 μL) were mixed with 450 μL methanol containing internal standards (10 μM). Chloroform (500 μL) and Milli-Q water (200 μL) were added, mixed thoroughly, and centrifuged (2300× g, 4 °C, 5 min). Then, 375 μL of the aqueous layer was filtered through a 5 kDa cutoff filter (Millipore, Billerica, MA, USA) to remove macromolecules. The filtrate was lyophilized and dissolved in 50 μL Milli-Q water containing the reference compound before mass spectrometry analysis.
Plasma metabolite profiling and a mixture of 110 standard metabolites (HMT, Tsuruoka, Japan) were analyzed using a capillary electrophoresis electrospray ionization time-of-flight mass spectrometry (CE-ESI-TOFMS) system (Agilent 7100 CE and 6230 TOFMS; Agilent Technologies, Palo Alto, CA, USA) in both cationic and anionic modes, with a mass scan range of 50–1000 mass-to-charge ratio (m/z). Metabolites were separated using a fused-silica capillary column (50 μm i.d. × 80 cm length) filled with the proprietary electrolyte buffer solution (HMT, Tsuruoka, Japan). The applied voltages for cationic and anionic analyses were set to 27 kV and 30 kV, respectively.
Briefly, mass-to-charge ratio (m/z) values, migration times, and ion counts of metabolites were extracted from the total ion chromatogram using the molecular feature extraction method in the MassHunter software (version 8.0) (Agilent Technologies, Hong Kong, China). Metabolite annotation was performed by matching migration time and m/z values against the standard compound library (HMT, Tsuruoka, Japan) and verified using the Humam metabolome database (HMDB). The tolerance range for annotation was set to ±0.1 min for migration time and ±1 ppm for m/z. Peak areas were normalized to the internal standard. Only metabolites meeting the annotation criteria were included in subsequent analyses. Metabolites that showed significant differences between the Control and UVB groups (p < 0.05, unpaired two-tailed Welch’s t-test with Benjamini–Krieger–Yekutieli correction for multiple comparisons) were identified. Kyoto Encyclopedia of Genes and Genomes (KEGG) pathway enrichment analysis was performed with MetaboAnalyst 5.0 [40].

2.8. Statistical Analyses

Statistical analyses and data visualization were performed using Microsoft Excel® (Version 2311), GraphPad Prism (Version 10), and MATLAB (R2023b). A two-tailed Welch’s t-test was applied to compare the control and UVB groups unless otherwise specified. Differences with p < 0.05 were considered statistically significant, while differences with 0.05 ≤ p < 0.10 were regarded as moderate differences. Data from three male mice in cohort 4 that inadvertently received high-dose UVB exposure (~600 mJ/cm2) due to a user-related timer configuration error, rather than a malfunction or instability of the UVB device itself, were excluded from the final analysis. were excluded from the final analysis.

3. Results

3.1. Low-Dose UVB Irradiation by the Customized Device Did Not Affect Feeding Behavior

To evaluate the effects of low-dose UVB irradiation, we monitored skin color in back-shaved mice at week 3. Compared with controls, the ears of the UVB-irradiated mice exhibited lower RGB values and brightness but showed no signs of erythema (Figure 2A,B). These results suggested that the applied UVB dose did not induce severe skin damage. We next measured food intake and body weight of the mice weekly until week 7. No significant differences were observed between the control and UVB groups during the experimental period (Figure 2C–F). Cohort-based analysis of food intake also showed no consistent differences (Supplementary Figure S2), indicating that this UVB dose did not influence appetite, growth, or development in mice. Consistent with these findings, UVB irradiation did not significantly alter mRNA expression of appetite-regulating peptides in the hypothalamus (Npy, Agp, Pomc, and Cart; Figure 2G) or proximal small intestine (Cck and Gip; Figure 2H). Collectively, these results demonstrated that the customized UVB device enabled long-term, well-controlled irradiation in mice without significantly affecting their feeding behavior or body weight.
Figure 2. Effects of UVB irradiation on food intake and body weight of the mice. (A) Representative images of mice after 3 weeks of UVB irradiation. (B) RGB and grayscale values of ear skin in male mice (Control, n = 4; UVB, n = 4). (C, D) Body weight during the experimental period in (C) female and (D) male mice (Control, n = 4; UVB, n = 4). (E,F) Weekly food intake in (E) female and (F) male mice (Control, n = 4; UVB, n = 4–20). (G) Relative mRNA expression of orexigenic peptides (Npy and Agrp) and anorexigenic peptides (Pomc and Cart) in the hypothalamus of male mice (Control, n = 4; UVB, n = 4). (H) Relative mRNA expression of Cck and Gip in the proximal small intestine (Control, n = 8; UVB, n = 8). The dots indicate individual mouse data points within each group. Data are presented as mean ± SEM. ** p < 0.01, *** p < 0.001 (unpaired two-tailed Welch’s t-test). Black dots indicate the control group, and magenta or cyan dots indicate the UVB group. SEM, standard error of mean.
Applsci 15 11869 g002

3.2. UVB Impacts on Locomotor Activity and Systemic Metabolism

To assess the effects of UVB irradiation on substrate utilization and energy expenditure, we measured RER, VO2, and locomotor activity in mice. During the dark period on Day 1, locomotor activity was higher in the control group than in the UVB group (Figure 3A,B). RER and VO2 fluctuated over time, increasing during the dark period and decreasing during the light period (Figure 3C,E). UVB irradiation significantly influenced RER, with effects varying across time points. Average RER was reduced in the UVB group during the dark period on Day 1 and during UVB exposure on Day 2 (Figure 3D). Although UVB irradiation did not significantly alter the overall mean VO2, time-dependent effects were observed (Figure 3E). Furthermore, average VO2 tended to be higher in the UVB group compared to controls during UVB exposure on Day 1 and during the dark period on Day 2 (Figure 3F). Collectively, these results indicated that UVB irradiation slightly lowered RER, increased VO2, and reduced locomotor activity at select time points.

3.3. UVB Effects on Plasma Metabolome

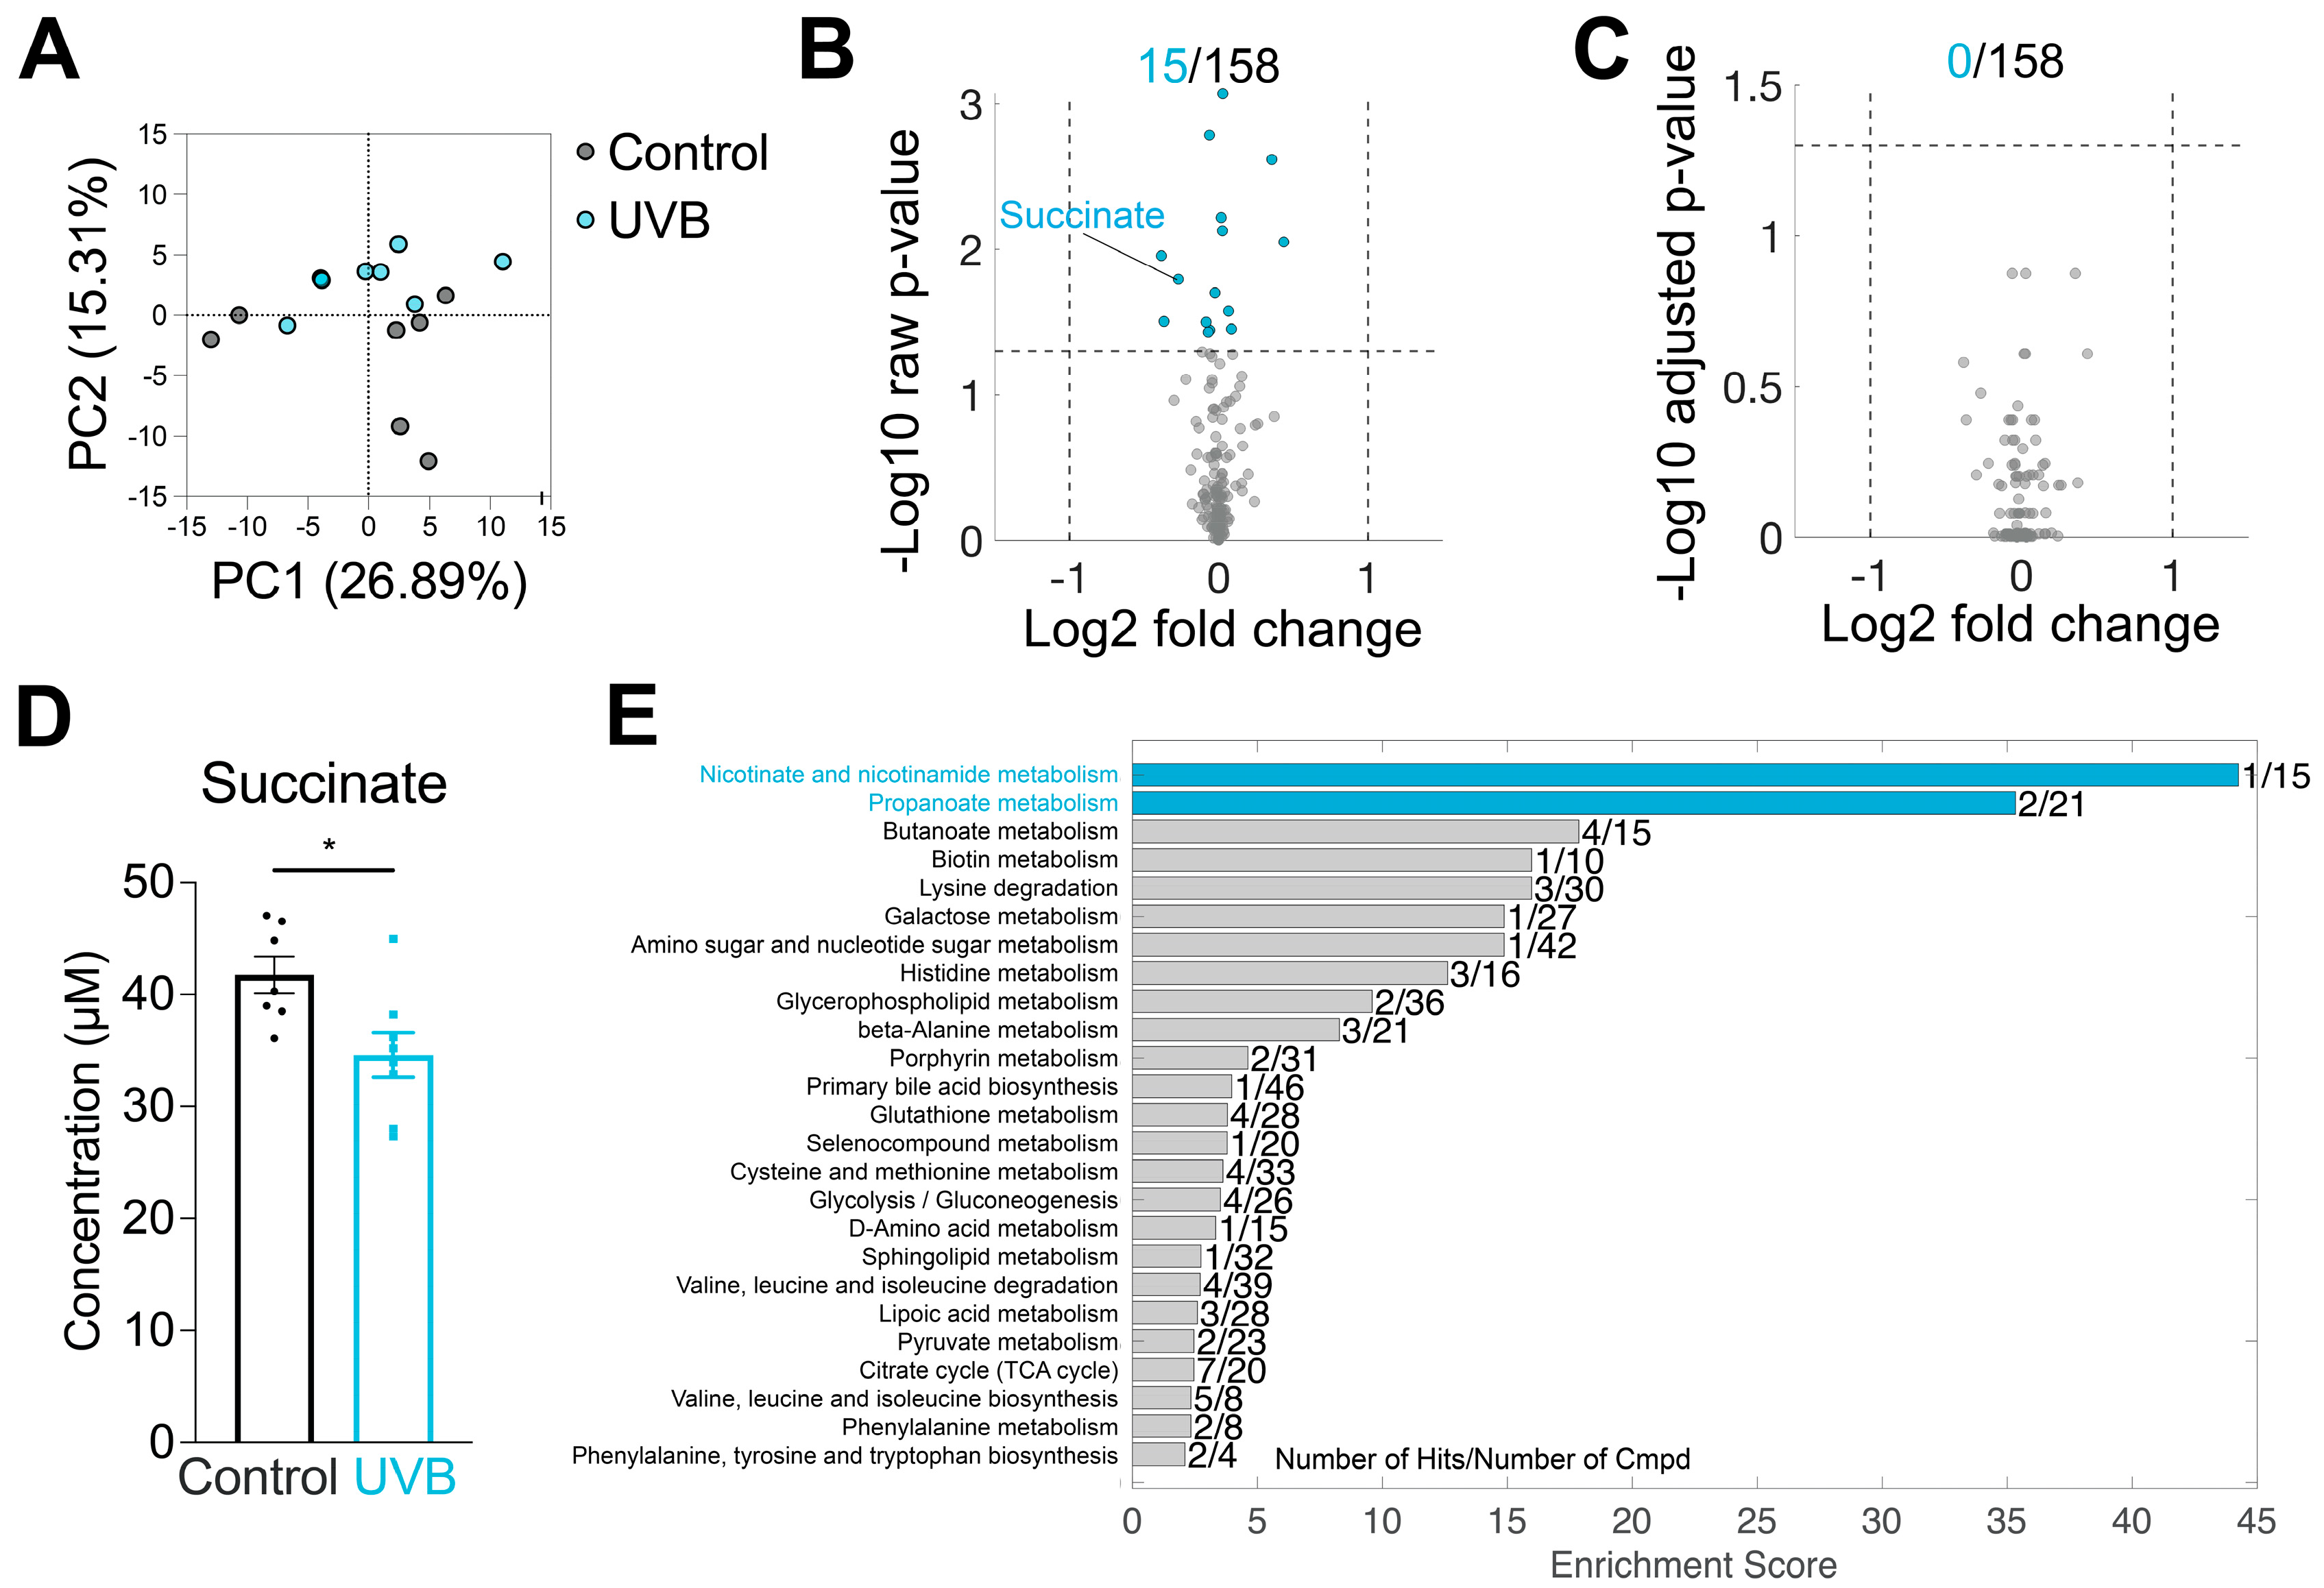
To investigate systemic metabolic changes induced by UVB irradiation, we analyzed circulating hormones and plasma metabolite profiles in mice. Plasma samples were collected from control and UVB groups, and metabolites were quantified by CE-MS, enabling sensitive detection of hydrophilic metabolites from small plasma volumes. Plasma corticosterone (CORT), thyroid-stimulating hormone (TSH), and insulin concentrations were comparable between the mice groups (Supplementary Figure S3A–C). Similarly, UVB irradiation did not significantly affect plasma glucose or non-esterified fatty acid (NEFA) levels (Supplementary Figure S3D,E). Principal component analysis (PCA) revealed partial clustering between the control and UVB groups (Figure 4A). Of the 158 metabolites identified by CE-MS, 15 were significantly elevated in the UVB group based on raw p-values (Figure 4B), although none remained significantly high after adjusting for multiple comparisons (Figure 4C). Despite this, we focused on plasma succinate because it was an A Priori target metabolite, based on previous reports linking succinate to brown adipose tissue (BAT) thermogenesis and mitochondrial activation [41]. Plasma succinate concentration was lower in the UVB group compared to controls (Figure 4D). Pathway enrichment analysis of the raw p-value dataset highlighted significant involvement of nicotinate and nicotinamide metabolism and propanoate metabolism pathways (Figure 4E). Together, these results suggested that long-term, low-dose UVB irradiation induces mild but detectable alternations in the plasma metabolomic profile.

3.4. Body Surface Temperature Is Increased by UVB Irradiation

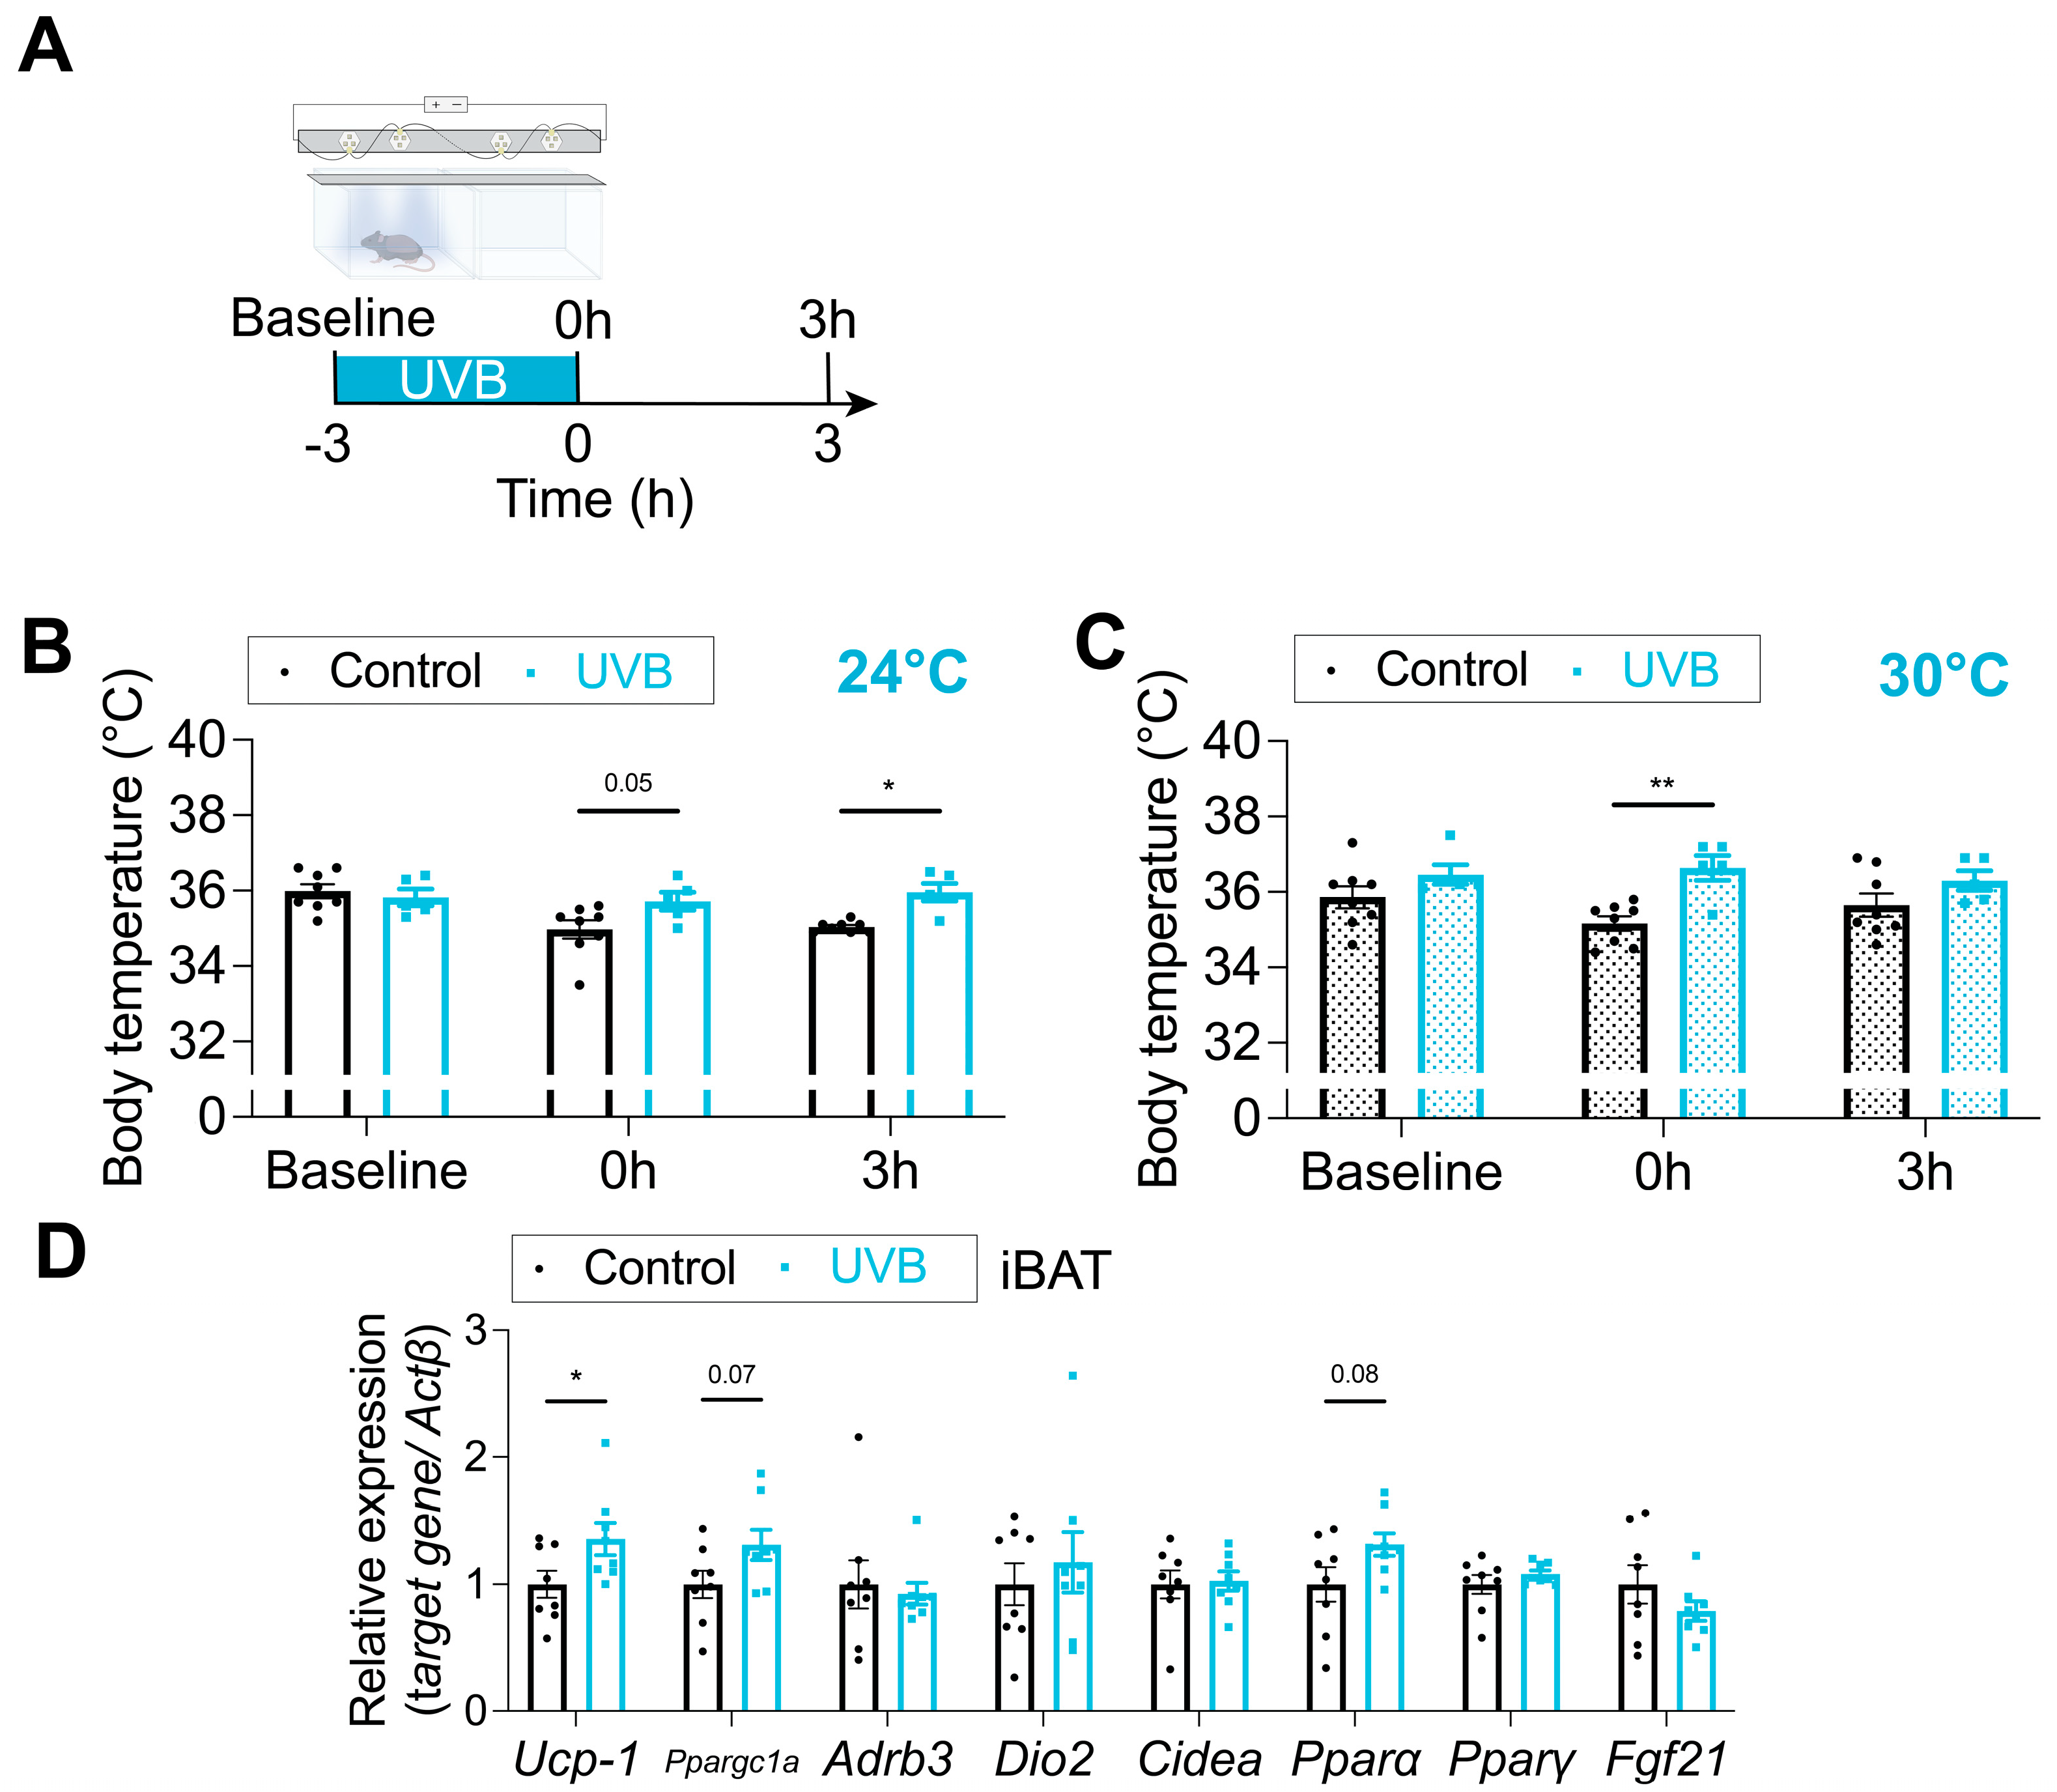
Given the observed reduction in plasma levels of succinate—a metabolite associated with thermogenesis—we next examined whether UVB exposure influences body temperature and BAT thermogenic activity [40]. Body surface temperature was measured at ambient temperatures of 24 °C and 30 °C using an infrared camera at baseline (pre-irradiation), immediately after irradiation (0 h), and 3 h post-irradiation (Figure 5A). At 24 °C, body surface temperature in the UVB group was significantly higher than that in the control group both immediately after and 3 h after irradiation (Figure 5B). At 30 °C, surface temperature in the UVB group was elevated relative to controls immediately after irradiation but not at 3 h post-irradiation (Figure 5C).
Next, we measured the expression of thermogenic genes in iBAT by RT-qPCR to determine whether UVB irradiation activates thermogenic pathways. After 7 weeks of UVB irradiation, expression of Ucp1, Ppargc1a, and Ppara was moderately elevated in iBAT when normalized to Actb as the housekeeping gene (Figure 5D). However, Ucp1 and Ppargc1a levels were not consistently increased when normalized to alternative housekeeping genes (Tbp and Rna18sn5, Supplementary Figure S4A,B). Because iBAT is anatomically distant from the irradiation site, we also examined tissues directly exposed to UVB, including dorsal skin and subcutaneous fat, which have been reported to undergo “browning” upon UVB exposure [21]. In the UVB group, Cidea expression in dorsal skin with subcutaneous fat was significantly higher than in controls (Figure 6). Collectively, although the effects were modest, these findings indicated that UVB irradiation elevates body surface temperature and upregulates thermogenesis-associated gene expression, suggesting partial activation of thermogenic processes in iBAT.

4. Discussion

In this study, we investigated the effects of long-term, low-dose narrowband UVB irradiation on systemic metabolism, plasma metabolites, and BAT thermogenic activity in mice. UVB exposure modestly influenced energy metabolism, as reflected by time-dependent alterations in RER, VO2, and locomotor activity. Plasma metabolomic analysis revealed a significant reduction in the levels of succinate, a metabolite implicated in the regulation of BAT thermogenesis [41]. In line with this finding, UVB irradiation increased body surface temperature and upregulated thermogenic gene expression in iBAT, indicating that UVB may promote energy expenditure, at least in part, through BAT activation.
Among the 158 metabolites analyzed, 15 showed significant differences between the Control and UVB groups based on raw p-values; however, these did not remain significant after multiple comparison correction (Figure 4). These results likely reflect modest UVB-induced metabolic changes masked by stringent multiple-comparison correction criteria, rather than a genuine absence of biological significance among these metabolites. Succinate functions as a tricarboxylic acid (TCA) cycle intermediate and as a signaling metabolite that promotes BAT thermogenesis by fueling mitochondrial respiration and stimulating reactive oxygen species-dependent UCP1 activation [41]. The reduction in plasma succinate observed in our study may therefore reflect enhanced uptake and utilization by BAT, consistent with the elevated body surface temperature and modest increases in thermogenic gene expression. Furthermore, pathway enrichment analysis indicated alterations in nicotinate and nicotinamide metabolism and in propanoate metabolism (Figure 4E). Nicotinate and nicotinamide metabolism is closely associated with the NAD+/NADH balance, a key regulator of mitochondrial oxidative capacity and energy metabolism [42]. Propanoate metabolism, which generates succinyl-CoA from propionyl-CoA, provides additional TCA cycle intermediates [43] and may facilitate substrate utilization. Taken together, these results suggested that UVB irradiation modulates systemic energy metabolism by influencing succinate-dependent thermogenic pathways and by shifting broader metabolic networks toward enhanced mitochondrial function and fatty acid oxidation.
UVB irradiation also influenced whole-body energy metabolism in a time-dependent manner. During the dark period on Day 1, locomotor activity was slightly higher in the control group, potentially contributing to the higher RER observed at corresponding time points. However, the UVB group showed reduced RER even during the light phase and during the subsequent dark period when activity levels were comparable, suggesting that the metabolic shift was not solely attributable to differences in movement. Although average VO2 across the experimental period did not differ significantly between groups, transient increases were observed during UVB exposure and the dark phase, while RER decreased at specific time points (Figure 3C–F), indicating a shift toward greater lipid utilization. Although the transient decrease in RER suggests a shift toward enhanced lipid oxidation, this change occurred without detectable alterations in plasma corticosterone or hypothalamic neuropeptides (Npy, Agrp, Pomc, Cart). Hence, activation of the classical HPA axis or melanocortin pathways appears unlikely under these low-dose conditions [17,18,19,20,21]. Other mechanisms may contribute, including sympathetic activation of peripheral tissues, altered adipose lipolysis, or modulation of mitochondrial oxidative capacity in brown or beige adipocytes. Previous studies have shown that sub-erythemal UV exposure can elevate norepinephrine release and promote adipose β-adrenergic signaling [21] or enhance nitric-oxide-mediated mitochondrial function [27]. These pathways could facilitate greater lipid utilization independently of hypothalamic regulation. Future experiments incorporating sympathetic-nerve activity recording, catecholamine assays, and mitochondrial-respiration measurements will help clarify this mechanism. Norepinephrine activates β-adrenergic signaling in white adipose tissue (WAT), stimulating lipolysis and promoting fatty acid mobilization [44]. The released fatty acids can subsequently serve as oxidative substrates in other tissues, including BAT and skeletal muscle. Therefore, it is possible that low-dose narrowband UVB exposure modulates systemic metabolism primarily through a norepinephrine-mediated lipolytic pathway rather than via the HPA axis or central hypothalamic regulation. This sympathetic activation pathway may also underlie the reported protective effects of UVB against HFD-induced hepatic steatosis [15,16,35]. Future studies should directly evaluate UVB’s impact on lipolytic activity in WAT to clarify this potential mechanism.
Body surface temperature analysis further supported UVB-induced thermogenic activation. At 24 °C, UVB increased body surface temperature both immediately after and 3 h after irradiation, whereas at 30 °C, the effect was transient, dissipating by 3 h. These findings suggested that ambient temperature modulates the persistence of UVB’s thermogenic effects, consistent with the attenuated BAT activity observed under thermoneutral conditions (~30 °C). Seven weeks of UVB treatment also elevated the expression of thermogenic genes, including Ucp1, Ppargc1a, and Ppara, in iBAT, although normalization against different housekeeping genes yielded variable results. In the directly irradiated dorsal skin and subcutaneous fat, Cidea expression was significantly increased, indicating local transcriptional responses in addition to systemic BAT activation. Previous studies similarly reported UVB-induced thermogenic pathways, particularly through Ucp1 upregulation [21,27,35]. Moreover, our metabolomics data revealed alterations in methionine and aspartic acid—metabolites previously linked to iBAT thermogenesis [45,46]—further supporting a link between metabolic reprogramming and BAT activation. Although elevated surface temperature and the modest, variable induction of Ucp1 and Ppargc1a in iBAT suggest partial thermogenic activation rather than definitive upregulation, UVB exposure could also trigger local or systemic inflammatory responses that secondarily elevate skin temperature. While no overt erythema or edema was observed, the possibility of subclinical inflammation cannot be excluded. Because inflammatory markers were not quantified in the present study, these data should be regarded as inconclusive with respect to genuine thermogenesis. Future studies will incorporate assessments of inflammatory markers (e.g., Il1β, Tnfα, Cox2), circulating cytokines (IL-6, TNF-α), and histological analyses (e.g., macrophage infiltration) alongside thermogenic markers to delineate the relative contributions of inflammation and brown adipose tissue activation.
Previous studies have reported variable effects of UVB exposure on systemic metabolism in mice. In terms of body weight, we observed no significant changes, consistent with a report showing that sub-erythemal UVB irradiation at 100 mJ/cm2 (65% UVB, twice weekly for 12 weeks) did not affect body weight in mature adult mice [16]. In contrast, daily exposure at 50 mJ/cm2 for 10 weeks increased weight gain selectively in male mice [20]. Similarly, effects on energy expenditure have been inconsistent. In our study, we observed only a modest upward trend in VO2 during and after UVB exposure. In contrast, one study reported no change in basal VO2 under daily 50 mJ/cm2 irradiation [20], whereas higher-dose protocols (100–400 mJ/cm2, three times weekly for 12 weeks) significantly increased energy expenditure [21]. Reports on food intake also vary. We detected no significant or consistent changes under a normal diet, whereas daily 50 mJ/cm2 irradiation increased food intake in males only [20], and higher-dose exposures altered intake, although outcomes differed across cohorts [21]. These discrepancies highlighted the critical influence of irradiation parameters—including wavelength, dose, and frequency—on systemic outcomes. By using a controlled LED-based UVB system, our study highlighted the gaps in the current literature and emphasized the need for systematic comparisons of UVB dose, intensity, and wavelength to elucidate the metabolic consequences of phototherapy.
Although the effects of UVB irradiation observed herein were modest, our findings indicated that UVB has the capacity to influence systemic energy balance. Prior studies have demonstrated that chronic sub-erythemal UVB can alleviate HFD-induced obesity and glucose intolerance in mice [14,15,16] and that UVB enhances BAT activation when combined with physical activity [35]. Our results extended this work by linking UVB exposure to metabolite alterations, body surface temperature, and thermogenic gene expression. Additionally, our study did not investigate the possible effects of narrowband low-dose UVB on oxidative stress and DNA damage in the skin, although UVB exposure is known to induce such effects [47]. Chronic irradiation with broadband UVB lacking a UVC-cut filter has been shown to cause skin carcinogenesis [48]; however, to our knowledge, no evidence of carcinogenic effects from chronic irradiation with narrowband UVB has been reported. Future studies should therefore include serial skin biopsies following equivalent low-dose exposure and comprehensively analyze molecular pathways related to oxidative stress, DNA repair, and carcinogenesis to ensure the safety of long-term phototherapy.

5. Conclusions

This study demonstrated that chronic, low-dose narrowband UVB irradiation modestly alters systemic metabolism, BAT thermogenic activity, and the plasma metabolome in mice. UVB exposure modestly lowered RER, suggesting a possible shift toward greater lipid use, which was accompanied by decreased plasma succinate levels and modest induction of thermogenic genes. The expression of Ucp1 and other thermogenic markers showed a variable but overall upward trend, indicating partial rather than definitive activation of BAT. Collectively, these findings add to the growing evidence that UVB exposure can influence systemic energy metabolism and highlight its potential as a mild, adjunctive approach for modulating energy balance. Further investigations should systematically define optimal dose, duration, and mechanistic pathways and evaluate the translational relevance of UVB-based interventions for metabolic disorders.

Supplementary Materials

The following supporting information can be downloaded at https://www.mdpi.com/article/10.3390/app152211869/s1. Table S1. Primer sequences and their corresponding gene names used for RT-qPCR. Figure S1. Specification of narrowband UVB irradiation. Figure S2. Food intake of male mice in each cohort. Figure S3. Plasma nutrient and hormone levels in control and UVB groups. Figure S4. Related to Figure 5D. mRNA levels of thermogenic genes in iBAT normalized by alternative housekeeping genes.

Author Contributions

Conceptualization, S.Y., K.M., T.U., A.T. and T.S.; methodology, S.Y., K.M., and T.S.; software, S.Y., K.M. and T.S.; validation, S.Y., K.M. and T.S.; formal analysis, S.Y., K.M., and T.S.; investigation, S.Y.; resources, K.M., T.U., A.T. and T.S.; data curation, S.Y.; writing—original draft preparation, S.Y.; writing—review and editing, S.Y., K.M. and T.S.; visualization, S.Y., K.M., and T.S.; supervision, S.Y., K.M. and T.S.; project administration, S.Y., K.M. and T.S.; funding acquisition, K.M., A.T. and T.S. All authors have read and agreed to the published version of the manuscript.

Funding

This research was supported by JSPS KAKENHI Grant Numbers 24K22251 (T.S. and K.M.) and 25K00743 (K.M. and A.T.).

Institutional Review Board Statement

All animal procedures were approved by the Animal Care and Use Committee of the Institute of Biomedical Sciences, Tokushima University Graduate School (Approval No. T2023-55 [8 August 2023]) and conducted in accordance with institutional guidelines for the care and use of laboratory animals.

Informed Consent Statement

Not applicable.

Data Availability Statement

The data presented in this study are available in the article and Supplementary Materials. Further inquiries can be directed at the corresponding authors (K.M. and T.S.).

Acknowledgments

We are deeply grateful to Hiroyoshi Sei (Tokushima University) for his insightful guidance and valuable advice. We thank Sae Toda (Tokushima University) for her valuable advice and assistance in data interpretation and manuscript revision. We also sincerely thank the undergraduate and graduate students in the Laboratory of Preventive Environmental Nutrition, Tokushima University, for their support with experimental design and data analysis. Our heartfelt appreciation extends to all staff and individuals who contributed to this study. We acknowledge the Support Center for Advanced Medical Sciences, Institute of Biomedical Sciences, Tokushima University Graduate School, for technical assistance with RNA concentration measurement. This work was further supported by the Research Clusters program of Tokushima University.

Conflicts of Interest

The authors declare no conflicts of interest.

Abbreviations

The following abbreviations are used in this manuscript:
BATbrown adipose tissue
ELISAenzyme-linked immunosorbent assay
HPAhypothalamic–pituitary–adrenal
KEGGKyoto Encyclopedia of Genes and Genomes
LEDlight-emitting diode
NEFAnon-esterified fatty acids
Pparαperoxisome proliferator-activated receptor alpha
REEresting energy expenditure
RERrespiratory exchange ratio
RT-qPCRreverse transcription quantitative polymerase chain reaction
TbpTATA box-binding protein
TSHthyroid-stimulating hormone
UCP1uncoupling protein 1
UVAultraviolet A
UVBultraviolet B
VO2oxygen consumption
ZTzeitgeber time
Actββ-actin
Cideacell death-inducing DFFA-like effector a
PCAprincipal component analysis
HFDhigh-fat diet
CORTcorticosterone
iBATinterscapular brown adipose tissue
TCAtricarboxylic acid

References

  1. Fleury, G.; Masís-Vargas, A.; Kalsbeek, A. Metabolic Implications of Exposure to Light at Night: Lessons from Animal and Human Studies. Obesity 2020, 28, S18–S28. [Google Scholar] [CrossRef]
  2. Masís-Vargas, A.; Ritsema, W.I.G.R.; Mendoza, J.; Kalsbeek, A. Metabolic Effects of Light at Night Are Time- and Wavelength-Dependent in Rats. Obesity 2020, 28, S114–S125. [Google Scholar] [CrossRef]
  3. Meng, J.-J.; Shen, J.-W.; Li, G.; Ouyang, C.-J.; Hu, J.-X.; Li, Z.-S.; Zhao, H.; Shi, Y.-M.; Zhang, M.; Liu, R.; et al. Light Modulates Glucose Metabolism by a Retina-Hypothalamus-Brown Adipose Tissue Axis. Cell 2023, 186, 398–412.e17. [Google Scholar] [CrossRef]
  4. Zhang, S.; Zhang, Y.; Zhang, W.; Chen, S.; Liu, C. Chronic Exposure to Green Light Aggravates High-Fat Diet-Induced Obesity and Metabolic Disorders in Male Mice. Ecotoxicol. Environ. Saf. 2019, 178, 94–104. [Google Scholar] [CrossRef] [PubMed]
  5. Opperhuizen, A.-L.; Stenvers, D.J.; Jansen, R.D.; Foppen, E.; Fliers, E.; Kalsbeek, A. Light at Night Acutely Impairs Glucose Tolerance in a Time-, Intensity- and Wavelength-Dependent Manner in Rats. Diabetologia 2017, 60, 1333–1343. [Google Scholar] [CrossRef] [PubMed]
  6. Cajochen, C.; Münch, M.; Kobialka, S.; Kräuchi, K.; Steiner, R.; Oelhafen, P.; Orgül, S.; Wirz-Justice, A. High Sensitivity of Human Melatonin, Alertness, Thermoregulation, and Heart Rate to Short Wavelength Light. J. Clin. Endocrinol. Metab. 2005, 90, 1311–1316. [Google Scholar] [CrossRef]
  7. Münch, M.; Kobialka, S.; Steiner, R.; Oelhafen, P.; Wirz-Justice, A.; Cajochen, C. Wavelength-Dependent Effects of Evening Light Exposure on Sleep Architecture and Sleep EEG Power Density in Men. Am. J. Physiol. Integr. Comp. Physiol. 2006, 290, R1421–R1428. [Google Scholar] [CrossRef]
  8. Zubidat, A.E.; Nelson, R.J.; Haim, A. Spectral and Duration Sensitivity to Light-at-Night in ‘Blind’ and Sighted Rodent Species. J. Exp. Biol. 2011, 214, 3206–3217. [Google Scholar] [CrossRef] [PubMed]
  9. Slominski, A.T.; Zmijewski, M.A.; Plonka, P.M.; Szaflarski, J.P.; Paus, R. How UV Light Touches the Brain and Endocrine System Through Skin, and Why. Endocrinology 2018, 159, 1992–2007. [Google Scholar] [CrossRef]
  10. Parrish, J.A.; Jaenicke, K.F.; Anderson, R.R. Erythema and melanogenesis action spectra of normal human skin. Photochem. Photobiol. 1982, 36, 187–191. [Google Scholar] [CrossRef]
  11. Diffey, B.L. An Overview Analysis of the Time People Spend Outdoors: Time Spent Outdoors. Br. J. Dermatol. 2011, 164, 848–854. [Google Scholar] [CrossRef]
  12. Burns, A.C.; Saxena, R.; Vetter, C.; Phillips, A.J.K.; Lane, J.M.; Cain, S.W. Time Spent in Outdoor Light Is Associated with Mood, Sleep, and Circadian Rhythm-Related Outcomes: A Cross-Sectional and Longitudinal Study in over 400,000 UK Biobank Participants. J. Affect. Disord. 2021, 295, 347–352. [Google Scholar] [CrossRef] [PubMed]
  13. Myers, E.; Kheradmand, S.; Miller, R. An Update on Narrowband Ultraviolet B Therapy for the Treatment of Skin Diseases. Cureus 2021, 13, e19182. [Google Scholar] [CrossRef]
  14. Geldenhuys, S.; Hart, P.H.; Endersby, R.; Jacoby, P.; Feelisch, M.; Weller, R.B.; Matthews, V.; Gorman, S. Ultraviolet Radiation Suppresses Obesity and Symptoms of Metabolic Syndrome Independently of Vitamin D in Mice Fed a High-Fat Diet. Diabetes 2014, 63, 3759–3769. [Google Scholar] [CrossRef] [PubMed]
  15. Fleury, N.; Feelisch, M.; Hart, P.H.; Weller, R.B.; Smoothy, J.; Matthews, V.B.; Gorman, S. Sub-Erythemal Ultraviolet Radiation Reduces Metabolic Dysfunction in Already Overweight Mice. J. Endocrinol. 2017, 233, 81–92. [Google Scholar] [CrossRef]
  16. Teng, S.; Chakravorty, L.; Fleury, N.; Gorman, S. Regular Exposure to Non-Burning Ultraviolet Radiation Reduces Signs of Non-Alcoholic Fatty Liver Disease in Mature Adult Mice Fed a High Fat Diet: Results of a Pilot Study. BMC Res. Notes 2019, 12, 78. [Google Scholar] [CrossRef] [PubMed]
  17. Skobowiat, C.; Postlethwaite, A.E.; Slominski, A.T. Skin Exposure to Ultraviolet B Rapidly Activates Systemic Neuroendocrine and Immunosuppressive Responses. Photochem. Photobiol. 2017, 93, 1008–1015. [Google Scholar] [CrossRef]
  18. Skobowiat, C.; Slominski, A.T. UVB Activates Hypothalamic–Pituitary–Adrenal Axis in C57BL/6 Mice. J. Investig. Dermatol. 2015, 135, 1638–1648. [Google Scholar] [CrossRef]
  19. Skobowiat, C.; Slominski, A.T. Ultraviolet B Stimulates Proopiomelanocortin Signalling in the Arcuate Nucleus of the Hypothalamus in Mice. Exp. Dermatol. 2016, 25, 120–123. [Google Scholar] [CrossRef]
  20. Parikh, S.; Parikh, R.; Michael, K.; Bikovski, L.; Barnabas, G.; Mardamshina, M.; Hemi, R.; Manich, P.; Goldstein, N.; Malcov-Brog, H.; et al. Food-Seeking Behavior Is Triggered by Skin Ultraviolet Exposure in Males. Nat. Metab. 2022, 4, 883–900. [Google Scholar] [CrossRef]
  21. Quan, Q.-L.; Kim, E.J.; Kim, S.; Kim, Y.K.; Chung, M.H.; Tian, Y.-D.; Shin, C.-Y.; Lee, D.H.; Chung, J.H. UV Irradiation Increases Appetite and Prevents Body Weight Gain through the Upregulation of Norepinephrine in Mice. J. Investig. Dermatol. 2024, 144, 2273–2284.e5. [Google Scholar] [CrossRef] [PubMed]
  22. Nieuwenhuizen, A.G.; Rutters, F. The Hypothalamic-Pituitary-Adrenal-Axis in the Regulation of Energy Balance. Physiol. Behav. 2008, 94, 169–177. [Google Scholar] [CrossRef]
  23. Christiansen, J.J.; Djurhuus, C.B.; Gravholt, C.H.; Iversen, P.; Christiansen, J.S.; Schmitz, O.; Weeke, J.; Jørgensen, J.O.L.; Møller, N. Effects of Cortisol on Carbohydrate, Lipid, and Protein Metabolism: Studies of Acute Cortisol Withdrawal in Adrenocortical Failure. J. Clin. Endocrinol. Metab. 2007, 92, 3553–3559. [Google Scholar] [CrossRef]
  24. Cone, R.D. The Central Melanocortin System and Energy Homeostasis. Trends Endocrinol. Metab. 1999, 10, 211–216. [Google Scholar] [CrossRef]
  25. Butler, A.A. The Melanocortin System and Energy Balance. Peptides 2006, 27, 281–290. [Google Scholar] [CrossRef] [PubMed]
  26. Cavalcanti-de-Albuquerque, J.P.; Bober, J.; Zimmer, M.R.; Dietrich, M.O. Regulation of Substrate Utilization and Adiposity by Agrp Neurons. Nat. Commun. 2019, 10, 311. [Google Scholar] [CrossRef]
  27. Dhamrait, G.K.; Panchal, K.; Fleury, N.J.; Abel, T.N.; Ancliffe, M.K.; Crew, R.C.; Croft, K.; Fernandez, B.O.; Minnion, M.; Hart, P.H.; et al. Characterising Nitric Oxide-Mediated Metabolic Benefits of Low-Dose Ultraviolet Radiation in the Mouse: A Focus on Brown Adipose Tissue. Diabetologia 2020, 63, 179–193. [Google Scholar] [CrossRef]
  28. Cannon, B.; Nedergaard, J. Brown Adipose Tissue: Function and Physiological Significance. Physiol. Rev. 2004, 84, 277–359. [Google Scholar] [CrossRef]
  29. Cypess, A.M.; Cannon, B.; Nedergaard, J.; Kazak, L.; Chang, D.C.; Krakoff, J.; Tseng, Y.-H.; Schéele, C.; Boucher, J.; Petrovic, N.; et al. Emerging Debates and Resolutions in Brown Adipose Tissue Research. Cell Metab. 2025, 37, 12–33. [Google Scholar] [CrossRef]
  30. Zhang, W.; Bi, S. Hypothalamic Regulation of Brown Adipose Tissue Thermogenesis and Energy Homeostasis. Front. Endocrinol. 2015, 6, 136. [Google Scholar] [CrossRef] [PubMed]
  31. Orava, J.; Nuutila, P.; Lidell, M.E.; Oikonen, V.; Noponen, T.; Viljanen, T.; Scheinin, M.; Taittonen, M.; Niemi, T.; Enerbäck, S.; et al. Different Metabolic Responses of Human Brown Adipose Tissue to Activation by Cold and Insulin. Cell Metab. 2011, 14, 272–279. [Google Scholar] [CrossRef]
  32. Bartelt, A.; Bruns, O.T.; Reimer, R.; Hohenberg, H.; Ittrich, H.; Peldschus, K.; Kaul, M.G.; Tromsdorf, U.I.; Weller, H.; Waurisch, C.; et al. Brown Adipose Tissue Activity Controls Triglyceride Clearance. Nat. Med. 2011, 17, 200–205. [Google Scholar] [CrossRef]
  33. Whitehead, A.; Krause, F.N.; Moran, A.; MacCannell, A.D.V.; Scragg, J.L.; McNally, B.D.; Boateng, E.; Murfitt, S.A.; Virtue, S.; Wright, J.; et al. Brown and Beige Adipose Tissue Regulate Systemic Metabolism through a Metabolite Interorgan Signaling Axis. Nat. Commun. 2021, 12, 1905. [Google Scholar] [CrossRef] [PubMed]
  34. Trayhurn, P. Brown Adipose Tissue—A Therapeutic Target in Obesity? Front. Physiol. 2018, 9, 1672. [Google Scholar] [CrossRef] [PubMed]
  35. Allemann, T.S.; Dhamrait, G.K.; Fleury, N.J.; Abel, T.N.; Hart, P.H.; Lucas, R.M.; Matthews, V.B.; Gorman, S. Low-Dose UV Radiation before Running Wheel Access Activates Brown Adipose Tissue. J. Endocrinol. 2020, 244, 473–486. [Google Scholar] [CrossRef] [PubMed]
  36. Hohlbaum, K.; Bert, B.; Dietze, S.; Palme, R.; Fink, H.; Thöne-Reineke, C. Severity Classification of Repeated Isoflurane Anesthesia in C57BL/6JRj Mice—Assessing the Degree of Distress. PLoS ONE 2017, 12, e0179588. [Google Scholar] [CrossRef]
  37. TLVs and BEIs: Threshold Limit Values for Chemical Substances and Physical Agents & Biological Exposure Indices, 2024th ed.; ACGIH TLVs and BEIs Committees, ACGIH: Cincinnati, OH, USA, 2024.
  38. Lai, T.H.; Hwang, J.S.; Ngo, Q.N.; Lee, D.-K.; Kim, H.J.; Kim, D.R. A Comparative Assessment of Reference Genes in Mouse Brown Adipocyte Differentiation and Thermogenesis in Vitro. Adipocyte 2024, 13, 2330355. [Google Scholar] [CrossRef]
  39. Mawatari, K.; Koike, N.; Nohara, K.; Wirianto, M.; Uebanso, T.; Shimohata, T.; Shikishima, Y.; Miura, H.; Nii, Y.; Burish, M.J.; et al. The Polymethoxyflavone Sudachitin Modulates the Circadian Clock and Improves Liver Physiology. Mol. Nutr. Food Res. 2023, 67, 2200270. [Google Scholar] [CrossRef]
  40. Samet, J.M.; Spengler, J.D. Indoor Environments and Health: Moving into the 21st Century. Am. J. Public. Health 2003, 93, 1489–1493. [Google Scholar] [CrossRef]
  41. Mills, E.L.; Pierce, K.A.; Jedrychowski, M.P.; Garrity, R.; Winther, S.; Vidoni, S.; Yoneshiro, T.; Spinelli, J.B.; Lu, G.Z.; Kazak, L.; et al. Accumulation of Succinate Controls Activation of Adipose Tissue Thermogenesis. Nature 2018, 560, 102–106. [Google Scholar] [CrossRef]
  42. Xie, N.; Zhang, L.; Gao, W.; Huang, C.; Huber, P.E.; Zhou, X.; Li, C.; Shen, G.; Zou, B. NAD+ Metabolism: Pathophysiologic Mechanisms and Therapeutic Potential. Signal Transduct. Target. Ther. 2020, 5, 227. [Google Scholar] [CrossRef]
  43. Shafer, M.; Low, V.; Li, Z.; Blenis, J. The Emerging Role of Dysregulated Propionate Metabolism and Methylmalonic Acid in Metabolic Disease, Aging, and Cancer. Cell Metab. 2025, 37, 316–329. [Google Scholar] [CrossRef]
  44. Collins, S. β-Adrenergic Receptors and Adipose Tissue Metabolism: Evolution of an Old Story. Annu. Rev. Physiol. 2022, 84, 1–16. [Google Scholar] [CrossRef]
  45. Dong, S.; Jiang, M.; Sun, Q.; Xu, J.; Zhang, L.; Han, L.; Li, Y.; Zhou, Z.; Xu, Y. Aspartate Restrains Thermogenesis by Inhibiting the AMPK Pathway in Adipose Tissues. Food Funct. 2024, 15, 11564–11577. [Google Scholar] [CrossRef]
  46. Hasek, B.E.; Stewart, L.K.; Henagan, T.M.; Boudreau, A.; Lenard, N.R.; Black, C.; Shin, J.; Huypens, P.; Malloy, V.L.; Plaisance, E.P.; et al. Dietary Methionine Restriction Enhances Metabolic Flexibility and Increases Uncoupled Respiration in Both Fed and Fasted States. Am. J. Physiol.-Regul. Integr. Comp. Physiol. 2010, 299, R728–R739. [Google Scholar] [CrossRef]
  47. Cadet, J.; Douki, T.; Ravanat, J. Oxidatively Generated Damage to Cellular DNA by UVB and UVA Radiation. Photochem. Photobiol. 2015, 91, 140–155. [Google Scholar] [CrossRef]
  48. Santiago, J.L.; Muñoz-Rodriguez, J.R.; Cruz-Morcillo, M.A.D.L.; Villar-Rodriguez, C.; Gonzalez-Lopez, L.; Aguado, C.; Nuncia-Cantarero, M.; Redondo-Calvo, F.J.; Perez-Ortiz, J.M.; Galan-Moya, E.M. Characterization of Permeability Barrier Dysfunction in a Murine Model of Cutaneous Field Cancerization Following Chronic UV-B Irradiation: Implications for the Pathogenesis of Skin Cancer. Cancers 2021, 13, 3935. [Google Scholar] [CrossRef]
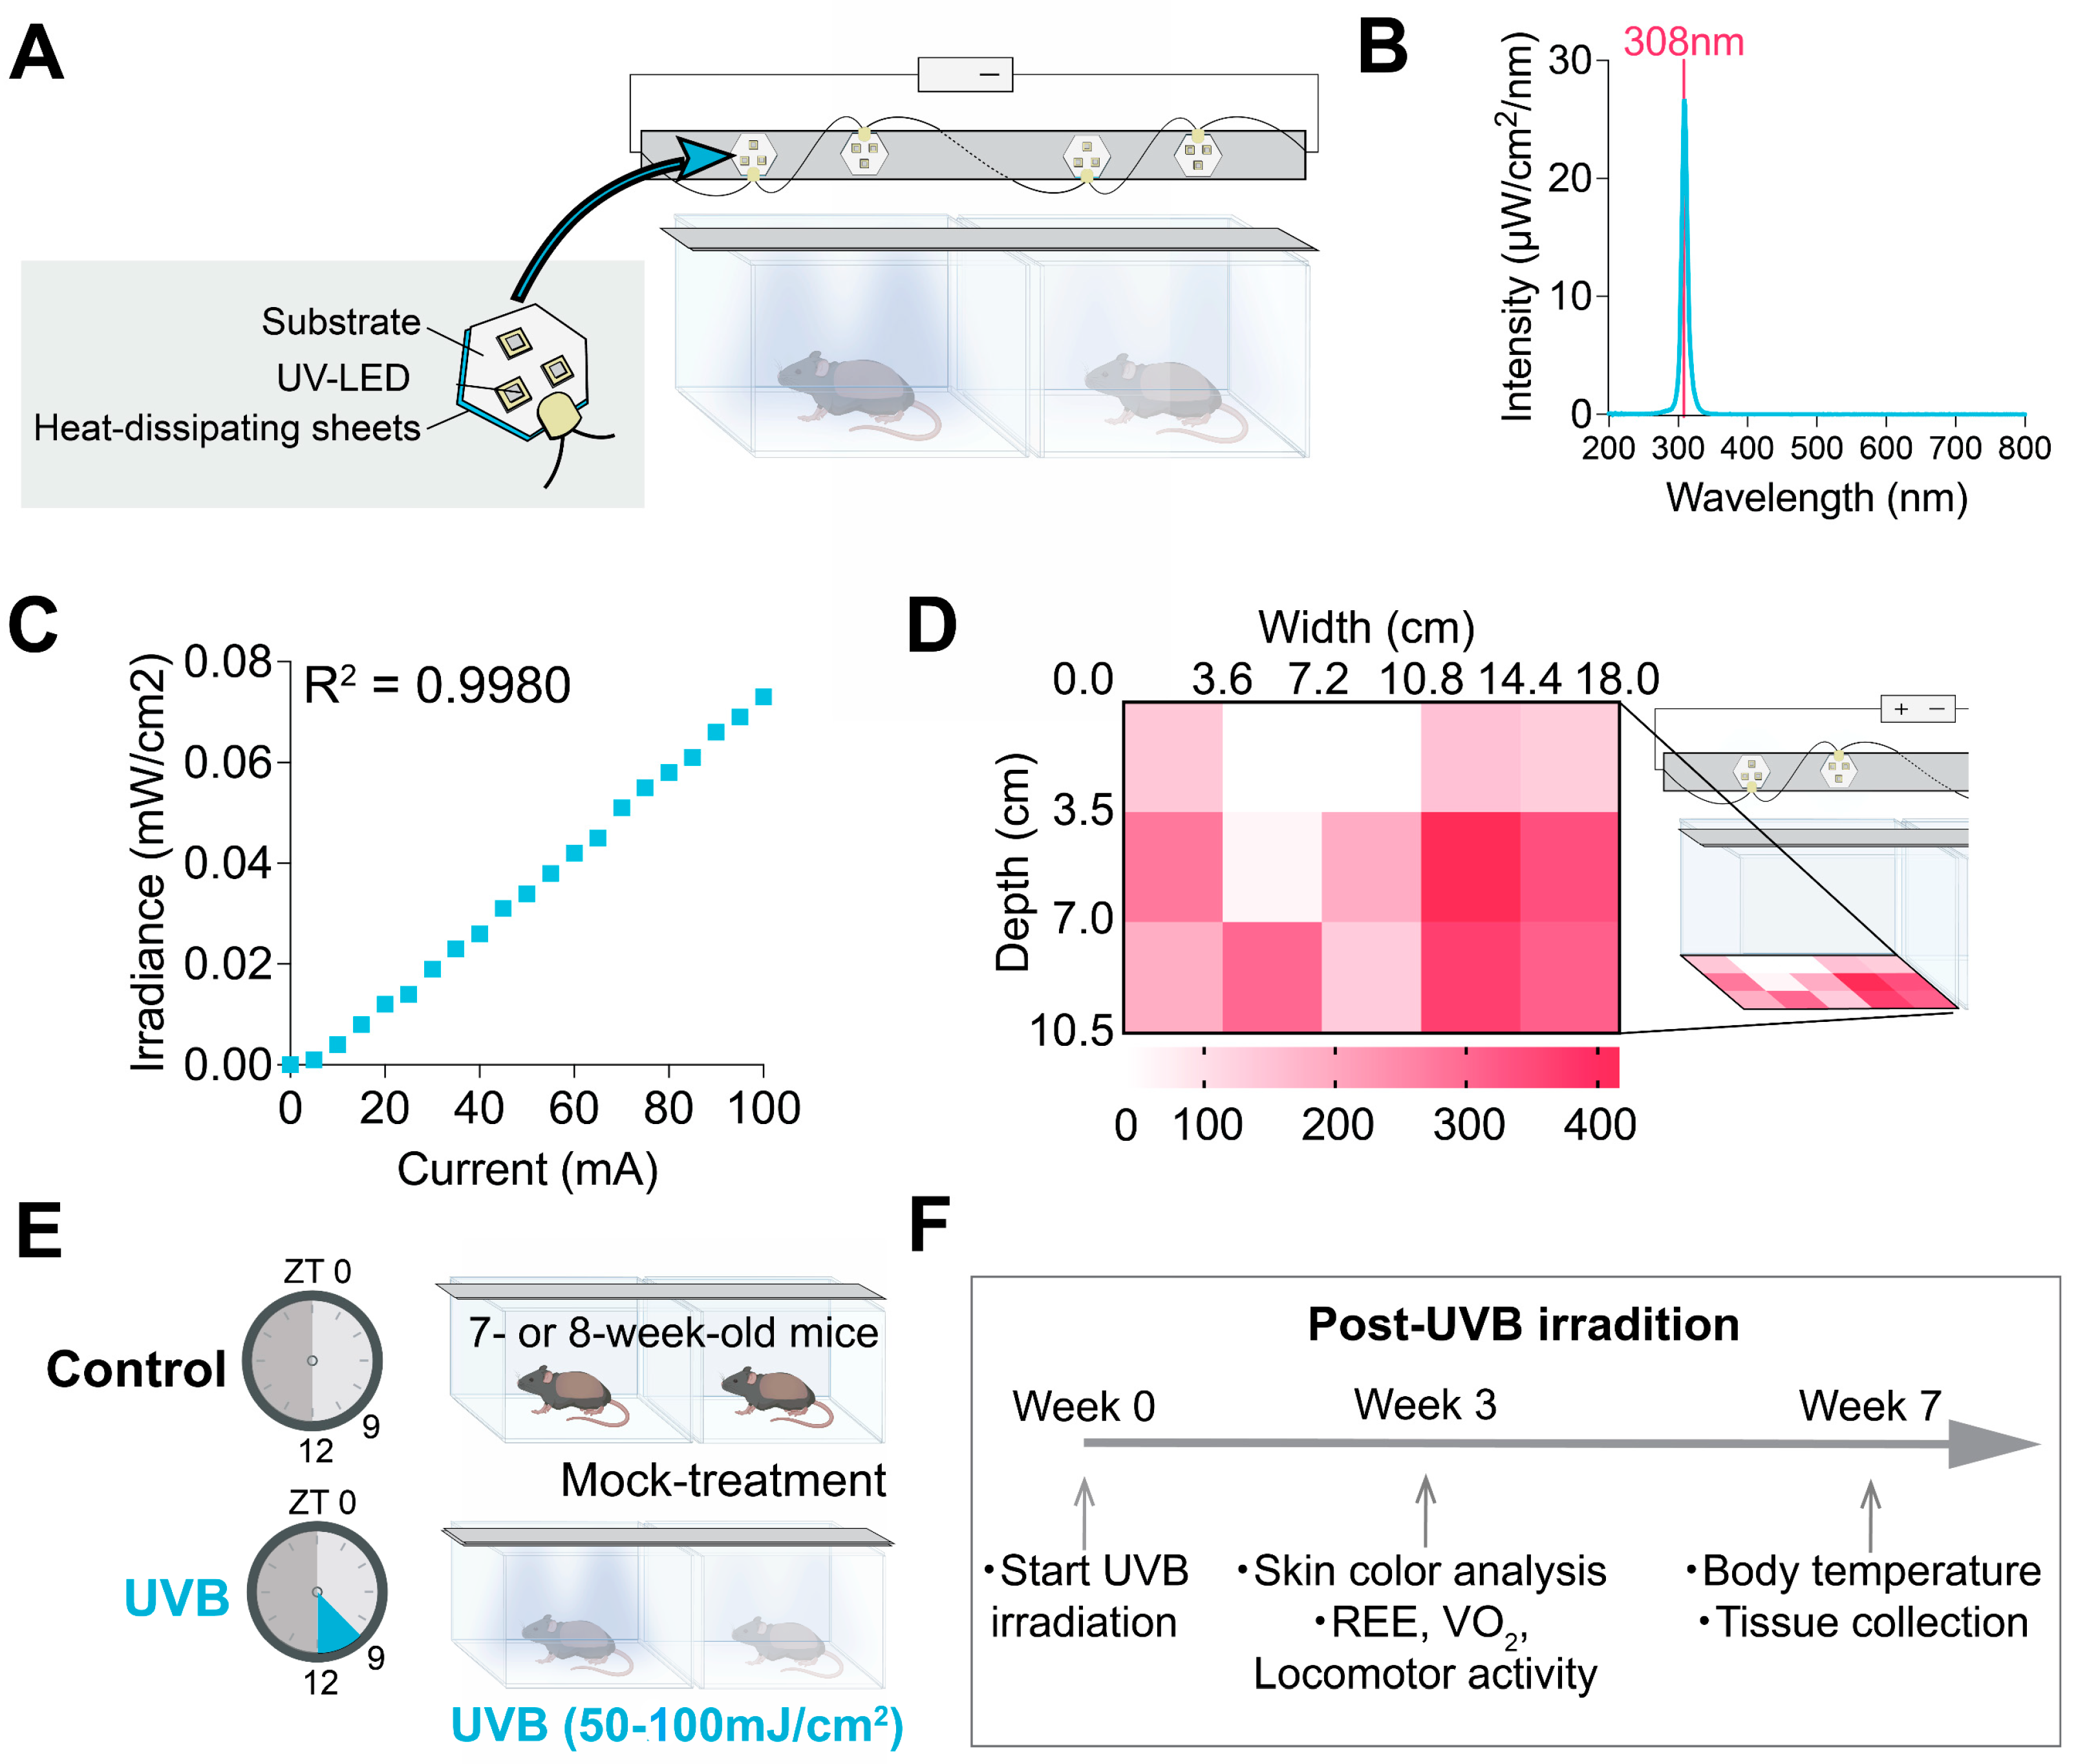
Figure 1. Custom ultraviolet B (UVB) irradiation device and experimental setup. (A) Schematic of the custom device designed to fit standard mouse cages. (B) Irradiance spectrum of the device (cyan line, spectrum; pink line, peak at 308 nm). (C) Linear relationship between irradiance and current. (D) Distribution of irradiance across the cage’s bottom surface (color gradient indicates irradiance levels; right schematic shows coordinate system). (E) Schematic of the daily UVB irradiation protocol. (F) Experimental schedule for monitoring locomotor activity, respiratory exchange ratio (RER), and oxygen consumption (VO2) in mice chronically exposed to UVB.
Applsci 15 11869 g001
Figure 3. Effects of UVB irradiation on locomotor activity, respiratory exchange ratio (RER), and oxygen consumption (VO2). (A) Locomotor activity traces. (B) Total locomotor activity during the light, UVB, and dark periods. (C) RER traces. (D) Average RER during the light, UVB, and dark periods. (E) VO2 traces. (F) Average VO2 during the light, UVB, and dark periods. The dots indicate individual mouse data points within each group. Data are presented as mean ± SEM (Control, n = 8; UVB, n = 5). Significant differences between the groups were assessed by an unpaired two-tailed Welch’s test (* p < 0.05). Black dots indicate the control group; cyan dots indicate the UVB group.
Applsci 15 11869 g003
Figure 4. Plasma metabolomic signatures following UVB irradiation. (A) PCA of plasma metabolite profiles (Control, n = 7; UVB, n = 8). Percentages indicate the variance explained by PC1 and PC2. (B) Volcano plot of 158 identified plasma metabolites. Metabolites with p < 0.05 (15 metabolites) are highlighted in cyan. Dashed lines indicate a twofold change and p < 0.05 (Welch’s test). (C) Volcano plot after multiple comparison correction using the Benjamini–Krieger–Yekutieli method (Welch’s test). (D) Plasma succinate concentrations in control and UVB groups. The dots indicate individual mouse data points within each group. Significant differences were assessed by unpaired two-tailed Welch’s test (* p < 0.05). (E) Pathway enrichment analysis. Fractions indicate the number of hits relative to the total number of compounds in each pathway. PCA, principal component analysis; PC1, principal component 1; PC2, principal component 2.
Applsci 15 11869 g004
Figure 5. Body surface temperature and thermogenic gene expression in interscapular brown adipose tissue (iBAT) after UVB irradiation. (A) Experimental protocol for infrared camera-based body surface temperature measurement. (BC) Surface body temperature at baseline, immediately after irradiation (0 h), and 3 h post-irradiation at 24 °C (B) and 30 °C (C). (D) mRNA expression of thermogenesis-related genes in iBAT. The dots indicate individual mouse data points within each group. Data are presented as mean ± SEM (Control, n = 8; UVB, n = 5). Significant differences between control and UVB groups were assessed by unpaired two-tailed Welch’s test (* p < 0.05). Control data are shown in black; UVB data are shown in cyan.
Applsci 15 11869 g005
Figure 6. mRNA expression in dorsal skin and subcutaneous fat after UVB irradiation. The dots indicate individual mouse data points within each group. Data are expressed as mean ± SEM (Control, n = 8; UVB, n = 8). Significant differences between control and UVB groups were determined by an unpaired two-tailed Welch’s test (* p < 0.05). ND, not detected.
Applsci 15 11869 g006
Table 1. Experimental animal cohorts, groups, assays, irradiation conditions, and corresponding data figures.
Cohort No.Groups (n, sex)Assay/MeasurementFluence
(mJ/cm2)
Period (Week)
Fluence
(mJ/cm2·Day−1)
1Control (n = 4, M)
UVB (n = 4, M)
Food intake
Skin color analysis
50
1–3
Figure S2
Figure 2A,B,F
2 *Control
(n = 4, M; n = 4, F)
UVB
(n = 4, M; n = 4, F)
Food intake
Tissue collection for RT-qPCR Blood collection for ELISA and metabolome
50
1–7
Figures S2–S4
Figure 2
Figure 4
Figure 5D
Figure 6
3Control (n = 4, M)
UVB (n = 4, M)
Food intake50
1
Figure S2
Figure 2F
4 #Control (n = 8, M)
UVB (n = 8, M)
Food intake
Metabolic measurement
Body temperature
100
1–7
Figure S2
Figure 2F
Figure 3
Figure 5A–C
* One female mouse was excluded from metabolomic analysis due to unavailable measurements. # Three mice in the UVB group were excluded due to higher-than-intended UVB exposure caused by a user-related timer configuration error, rather than a malfunction or instability of the UVB device itself. M, male; F, female; UVB, ultraviolet B; RT-qPCR, reverse transcription quantitative polymerase chain reaction; ELISA, enzyme-linked immunosorbent assay.
Disclaimer/Publisher’s Note: The statements, opinions and data contained in all publications are solely those of the individual author(s) and contributor(s) and not of MDPI and/or the editor(s). MDPI and/or the editor(s) disclaim responsibility for any injury to people or property resulting from any ideas, methods, instructions or products referred to in the content.