


Machine Learning Applications for Physical Activity and Behaviour in Early Childhood: A Systematic Review


Abstract
Featured Application
Abstract
1. Introduction
2. Materials and Methods
2.1. Experimental Approach to the Problem
2.2. Information Sources
2.3. Search Strategy
(Preschool OR kindergarten OR “early childhood”) AND (“machine learning” OR “deep learning” OR forecast* OR predicti*) AND (“microelectromechanical system*” OR MEMS OR accelerometer* OR wearable*)
2.4. Eligibility Criteria
2.5. Data Extraction
2.6. Assessment of Study Methodology
3. Results
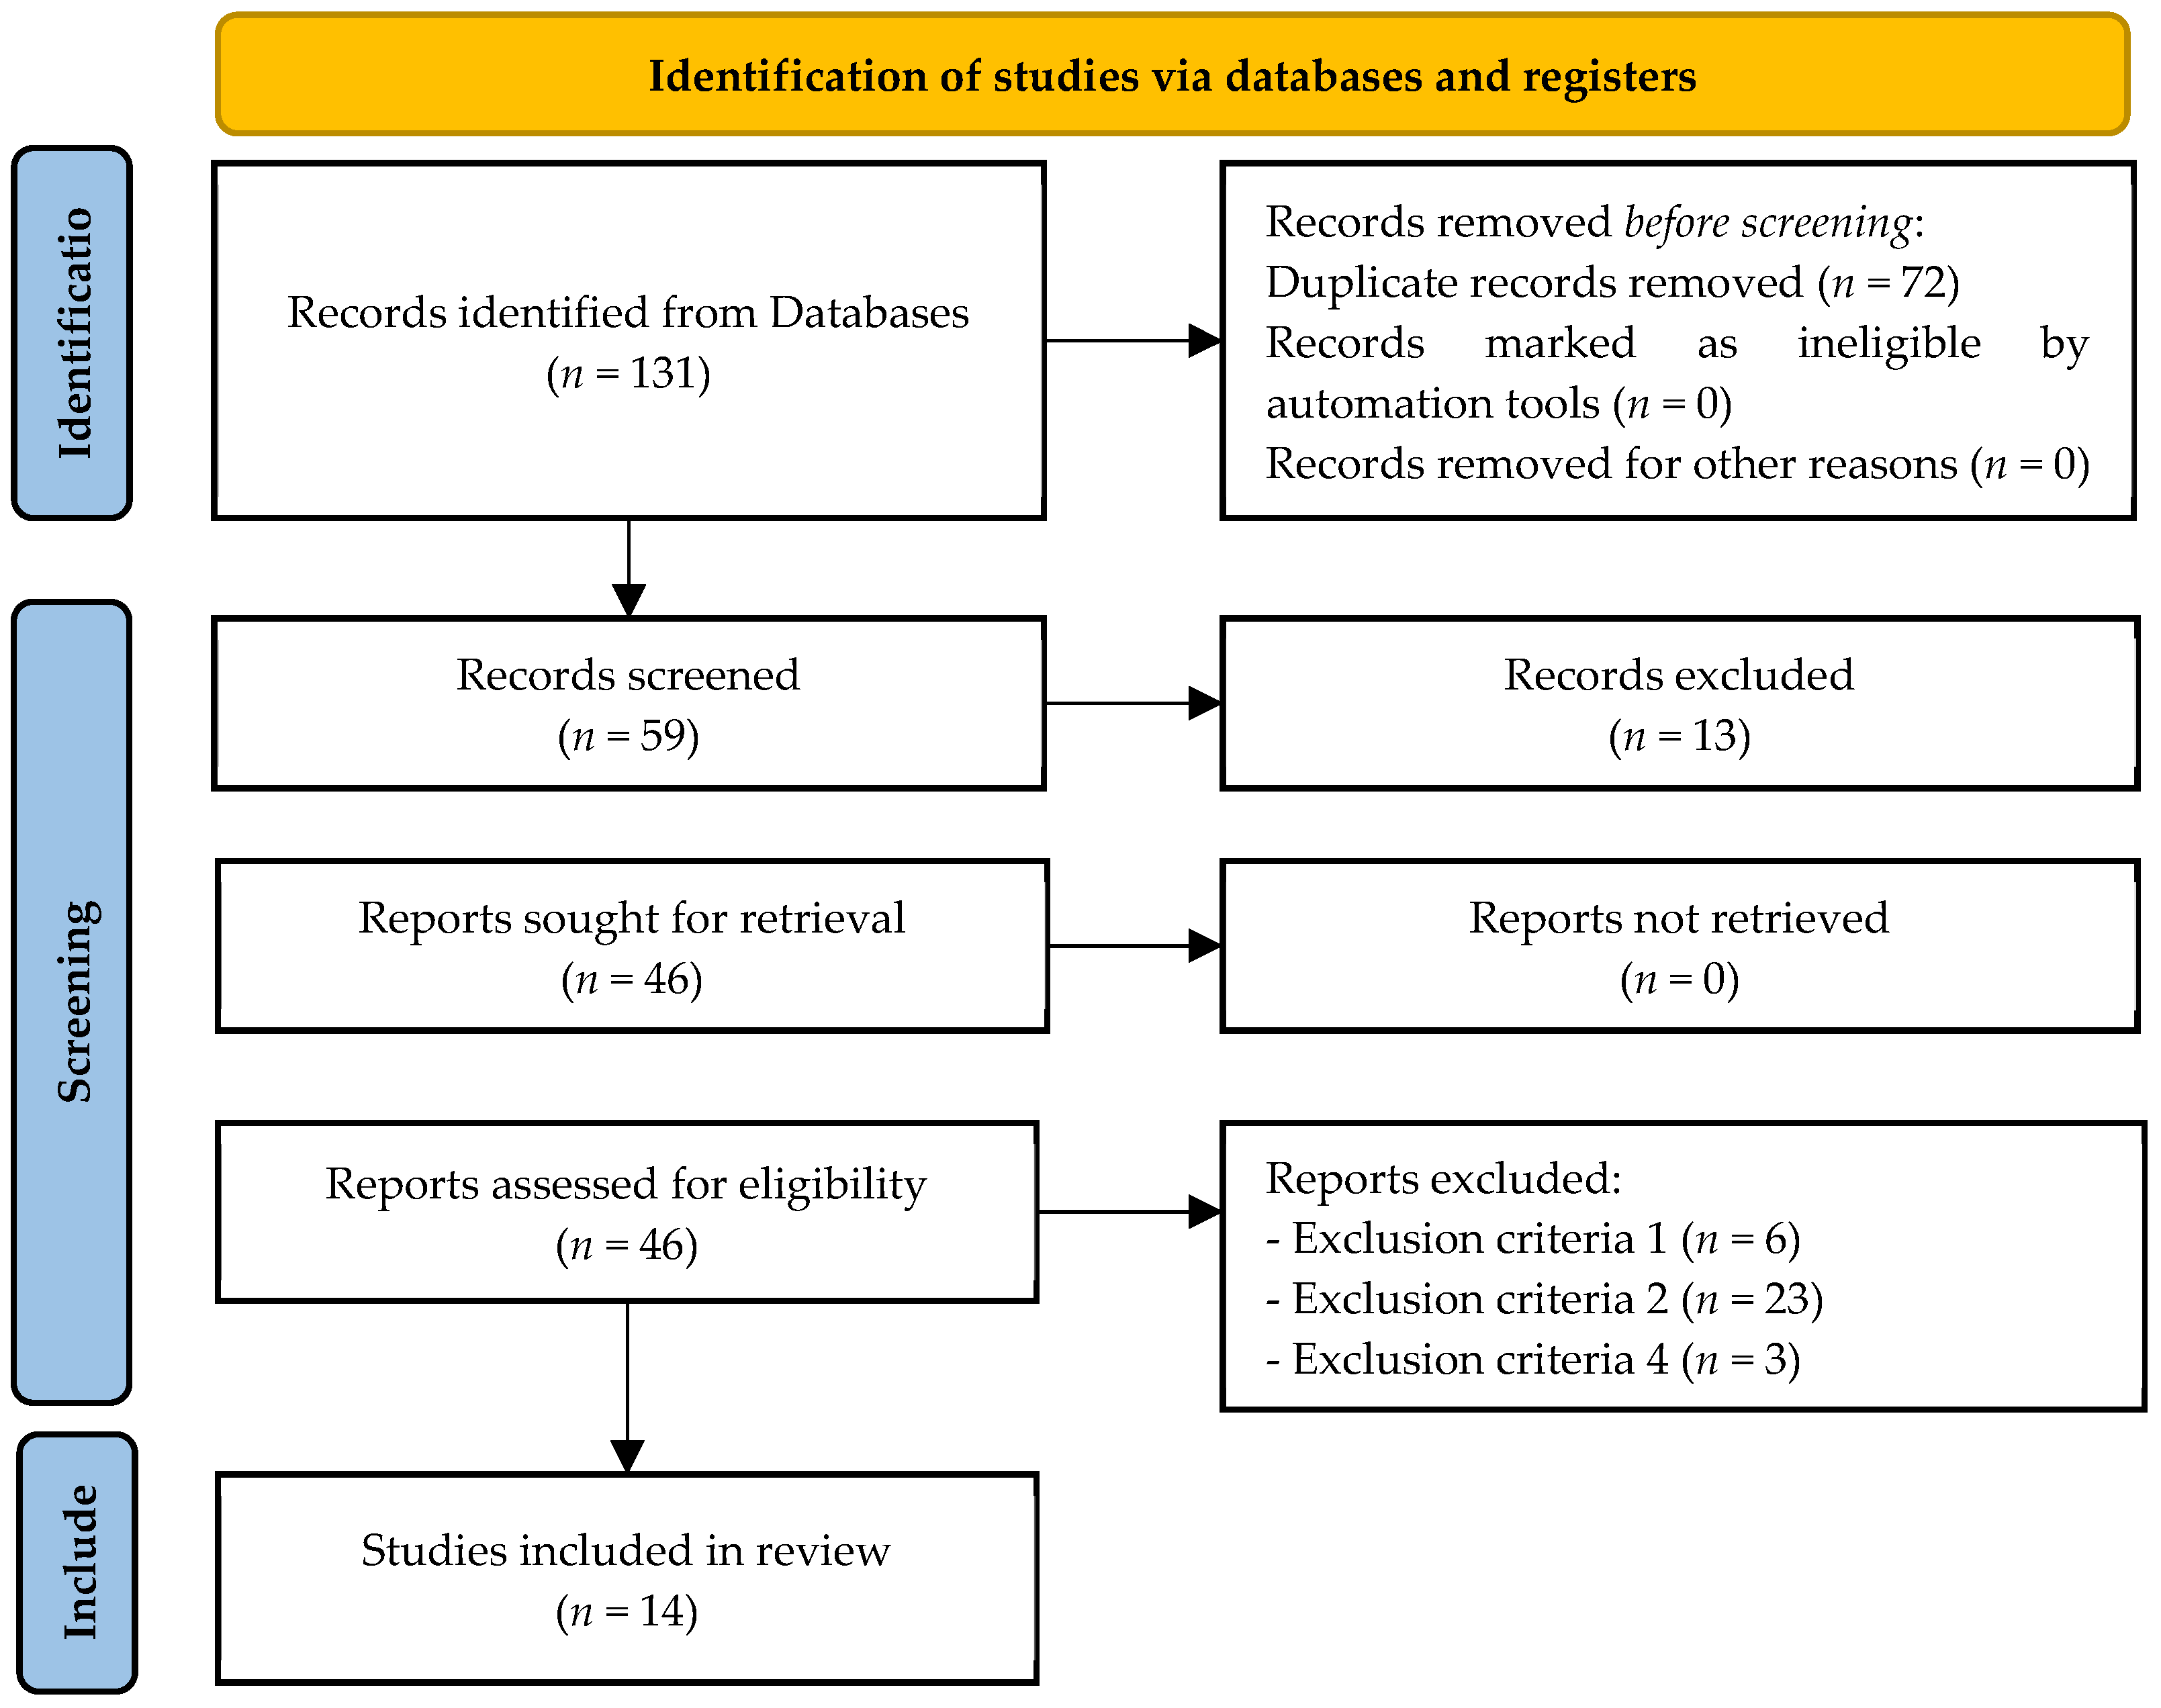
3.1. Identification and Selection of Studies
3.2. Quality Assessment
3.3. Study Characteristics
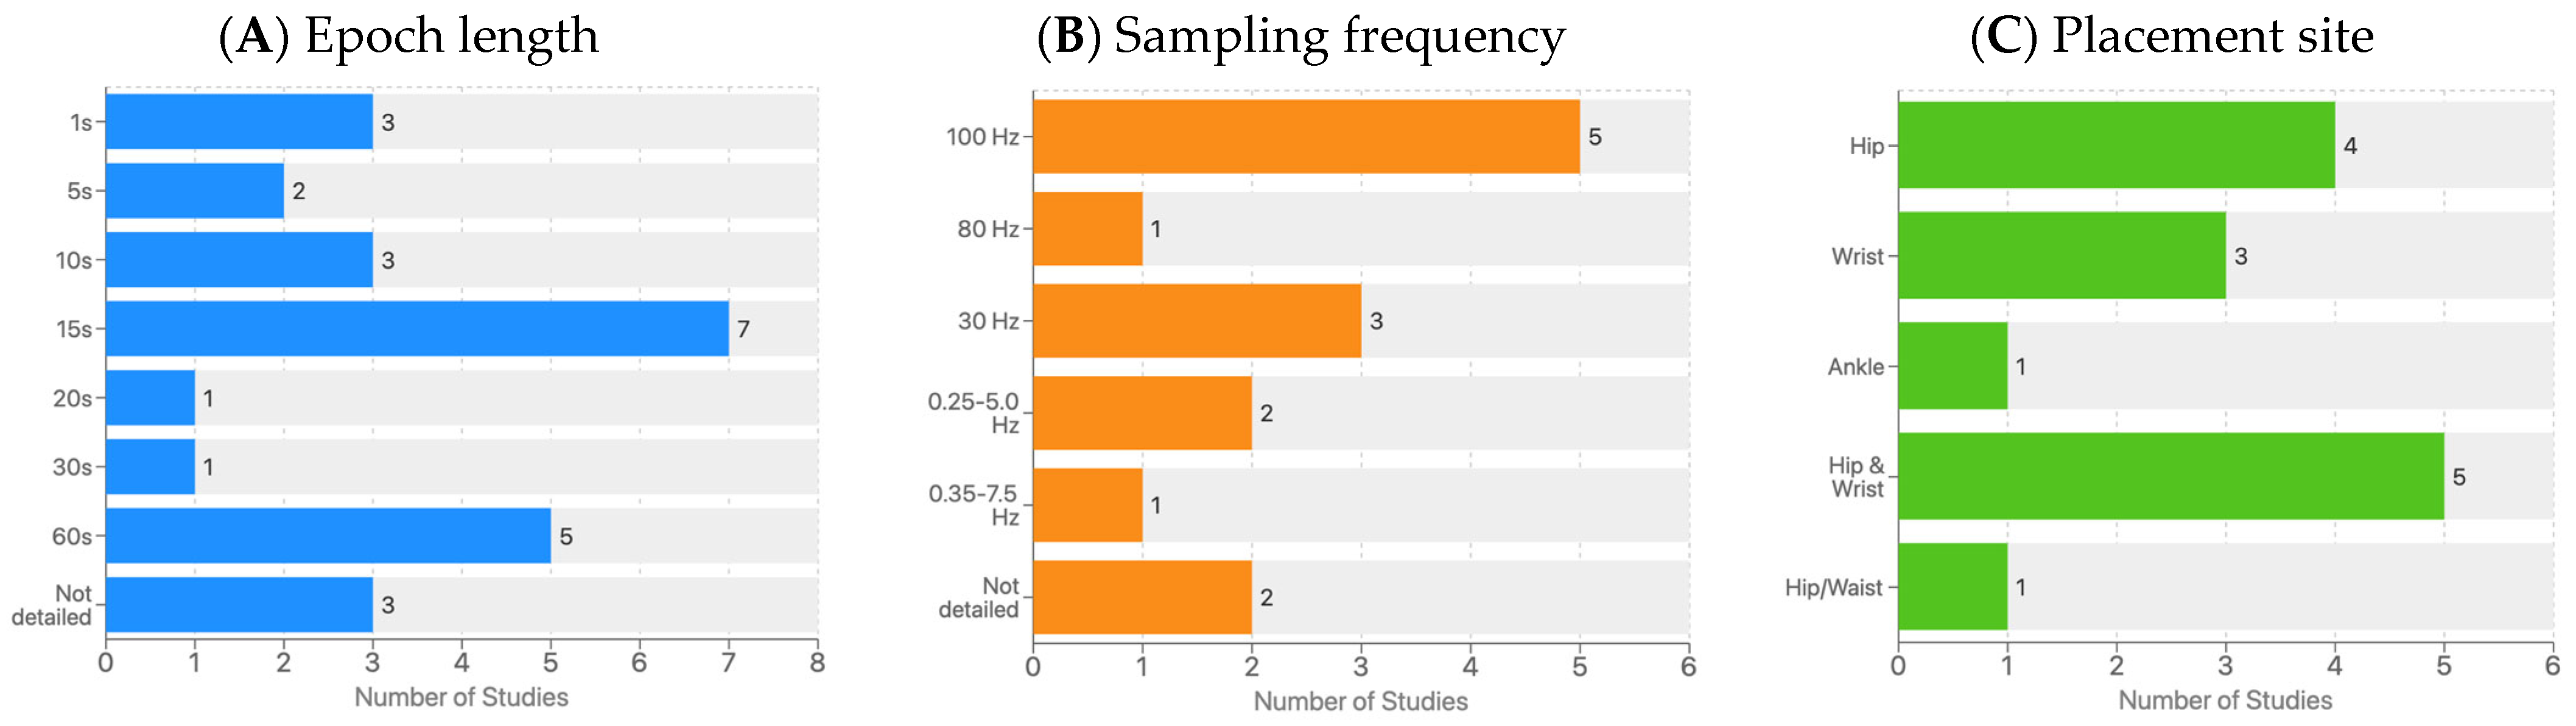
3.3.1. Sample
3.3.2. Data Collection Methods
3.3.3. Study Settings and Research Focus
3.3.4. Machine Learning Implementation
4. Discussion
4.1. Physical Activity
4.2. Sleep Monitoring
4.3. Methodological Considerations
4.4. Technical Implementation and Algorithm Selection
4.5. Limitations and Future Research Directions
5. Conclusions
Author Contributions
Funding
Institutional Review Board Statement
Informed Consent Statement
Data Availability Statement
Conflicts of Interest
References
- Martinez-Merino, N.; Rico-González, M. Effects of Physical Education on Preschool Children’s Physical Activity Levels and Motor, Cognitive, and Social Competences: A Systematic Review. J. Teach. Phys. Educ. 2024, 43, 696–706. [Google Scholar] [CrossRef]
- Baldini, V.; Gnazzo, M.; Maragno, M.; Biagetti, R.; Stefanini, C.; Canulli, F.; Varallo, G.; Donati, C.; Neri, G.; Fiorillo, A.; et al. Suicidal Risk among Adolescent Psychiatric Inpatients: The Role of Insomnia, Depression, and Social-Personal Factors. Eur. Psychiatry 2025, 68, e42. [Google Scholar] [CrossRef] [PubMed]
- Crumbley, C.A.; Ledoux, T.A.; Johnston, C.A. Physical Activity During Early Childhood: The Importance of Parental Modeling. Am. J. Lifestyle Med. 2020, 14, 32–35. [Google Scholar] [CrossRef] [PubMed]
- Jakobovich, R.; Berry, E.M.; Levita, A.; Levin-Zamir, D. Developing Healthy Lifestyle Behaviors in Early Age—An Intervention Study in Kindergartens. Nutrients 2023, 15, 2615. [Google Scholar] [CrossRef]
- Loprinzi, P.D.; Cardinal, B.J. Measuring Children’s Physical Activity and Sedentary Behaviors. J. Exerc. Sci. Fit. 2011, 9, 15–23. [Google Scholar] [CrossRef]
- Prieto-Botella, D.; Valera-Gran, D.; Santa-Marina, L.; Babarro, I.; Subiza-Pérez, M.; Casas, M.; Guxens, M.; Cárdenas-Fuentes, G.; Heude, B.; Bernard, J.Y.; et al. Validation of a Parent-Reported Physical Activity Questionnaire by Accelerometry in European Children Aged from 6 to 12 Years Old. Int. J. Environ. Res. Public Health 2022, 19, 9178. [Google Scholar] [CrossRef]
- Ahmadi, M.N.; Pavey, T.G.; Trost, S.G. Machine Learning Models for Classifying Physical Activity in Free-Living Preschool Children. Sensors 2020, 20, 4364. [Google Scholar] [CrossRef]
- Ahmadi, M.N.; Trost, S.G. Device-Based Measurement of Physical Activity in Pre-Schoolers: Comparison of Machine Learning and Cut Point Methods. PLoS ONE 2022, 17, e0266970. [Google Scholar] [CrossRef]
- Thornton, C.B.; Kolehmainen, N.; Nazarpour, K. Using Unsupervised Machine Learning to Quantify Physical Activity from Accelerometry in a Diverse and Rapidly Changing Population. PLoS Digit. Health 2023, 2, e0000220. [Google Scholar] [CrossRef]
- Hendry, D.; Rohl, A.L.; Rasmussen, C.L.; Zabatiero, J.; Cliff, D.P.; Smith, S.S.; Mackenzie, J.; Pattinson, C.L.; Straker, L.; Campbell, A. Objective Measurement of Posture and Movement in Young Children Using Wearable Sensors and Customised Mathematical Approaches: A Systematic Review. Sensors 2023, 23, 9661. [Google Scholar] [CrossRef]
- Lettink, A.; Altenburg, T.M.; Arts, J.; Van Hees, V.T.; Chinapaw, M.J.M. Systematic Review of Accelerometer-Based Methods for 24-h Physical Behavior Assessment in Young Children (0–5 Years Old). Int. J. Behav. Nutr. Phys. Act. 2022, 19, 116. [Google Scholar] [CrossRef]
- Yi, H.; Liu, T.; Lan, G. The Key Artificial Intelligence Technologies in Early Childhood Education: A Review. Artif. Intell. Rev. 2024, 57, 12. [Google Scholar] [CrossRef]
- Page, M.J.; McKenzie, J.E.; Bossuyt, P.M.; Boutron, I.; Hoffmann, T.C.; Mulrow, C.D.; Shamseer, L.; Tetzlaff, J.M.; Akl, E.A.; Brennan, S.E.; et al. The PRISMA 2020 Statement: An Updated Guideline for Reporting Systematic Reviews. BMJ 2021, 372, n71. [Google Scholar] [CrossRef]
- Rico-González, M.; Pino-Ortega, J.; Clemente, F.M.; Los Arcos, A. Guidelines for Performing Systematic Reviews in Sports Science. Biol. Sport 2022, 39, 463–471. [Google Scholar] [CrossRef] [PubMed]
- Slim, K.; Nini, E.; Forestier, D.; Kwiatkowski, F.; Panis, Y.; Chipponi, J. Original Article Methodological Index for Non-Randomized Studies (Minors): Development and validation of a new instrument. ANZ J. Surg. 2003, 73, 712–716. [Google Scholar] [CrossRef]
- Rico-González, M.; Martín-Moya, R.; Mendoza-Muñoz, M.; Carlos-Vivas, J. Preschool Children’s Adherence to the 24-Hour Physical Activity Guidelines: A Systematic Review Comparing the Sexes. Health Educ. J. 2024, 83, 695–704. [Google Scholar] [CrossRef]
- Hagenbuchner, M.; Cliff, D.P.; Trost, S.G.; Van Tuc, N.; Peoples, G.E. Prediction of Activity Type in Preschool Children Using Machine Learning Techniques. J. Sci. Med. Sport 2015, 18, 426–431. [Google Scholar] [CrossRef]
- Ahmadi, M.N.; Brookes, D.; Chowdhury, A.; Pavey, T.; Trost, S.G. Free-Living Evaluation of Laboratory-Based Activity Classifiers in Preschoolers. Med. Sci. Sports Exerc. 2020, 52, 1227–1234. [Google Scholar] [CrossRef]
- Ahmadi, M.N.; Chowdhury, A.; Pavey, T.; Trost, S.G. Laboratory-Based and Free-Living Algorithms for Energy Expenditure Estimation in Preschool Children: A Free-Living Evaluation. PLoS ONE 2020, 15, e0233229. [Google Scholar] [CrossRef]
- Zhao, W.; Adolph, A.L.; Puyau, M.R.; Vohra, F.A.; Butte, N.F.; Zakeri, I.F. Support Vector Machines Classifiers of Physical Activities in Preschoolers. Physiol. Rep. 2013, 1, e00006. [Google Scholar] [CrossRef]
- Clark, C.C.T.; Duncan, M.J.; Eyre, E.L.J.; Stratton, G.; García-Massó, X.; Estevan, I. Profiling Movement Behaviours in Pre-School Children: A Self-Organised Map Approach. J. Sports Sci. 2020, 38, 150–158. [Google Scholar] [CrossRef] [PubMed]
- Trost, S.G.; Cliff, D.P.; Ahmadi, M.N.; Tuc, N.V.; Hagenbuchner, M. Sensor-Enabled Activity Class Recognition in Preschoolers: Hip versus Wrist Data. Med. Sci. Sports Exerc. 2018, 50, 634–641. [Google Scholar] [CrossRef] [PubMed]
- Kwon, S.; O’Brien, M.K.; Welch, S.B.; Honegger, K. Physical Activity among U.S. Preschool-Aged Children: Application of Machine Learning Physical Activity Classification to the 2012 National Health and Nutrition Examination Survey National Youth Fitness Survey. Children 2022, 9, 1433. [Google Scholar] [CrossRef] [PubMed]
- Kuzik, N.; Spence, J.C.; Carson, V. Machine Learning Sleep Duration Classification in Preschoolers Using Waist-Worn ActiGraphs. Sleep Med. 2021, 78, 141–148. [Google Scholar] [CrossRef]
- Li, S.; Howard, J.T.; Sosa, E.T.; Cordova, A.; Parra-Medina, D.; Yin, Z. Calibrating Wrist-Worn Accelerometers for Physical Activity Assessment in Preschoolers: Machine Learning Approaches (Preprint). J. Med. Internet Res. 2019, 4, e16727. [Google Scholar] [CrossRef]
- Li, X.; Kane, M.; Zhang, Y.; Sun, W.; Song, Y.; Dong, S.; Lin, Q.; Zhu, Q.; Jiang, F.; Zhao, H. Circadian Rhythm Analysis Using Wearable Device Data: A Novel Penalized Machine Learning Approach. J. Med. Internet Res. 2021, 23, e18403. [Google Scholar] [CrossRef]
- Hammam, N.; Sadeghi, D.; Carson, V.; Tamana, S.K.; Ezeugwu, V.E.; Chikuma, J.; Van Eeden, C.; Brook, J.R.; Lefebvre, D.L.; Moraes, T.J.; et al. The Relationship between Machine-Learning-Derived Sleep Parameters and Behavior Problems in 3- and 5-Year-Old Children: Results from the CHILD Cohort Study. Sleep 2020, 43, zsaa117. [Google Scholar] [CrossRef]
- Abdollahi, A.; Li, X.; Merikanto, I.; Leppanen, M.; Vepsalainen, H.; Lehto, R.; Ray, C.; Erkkola, M.; Roos, E. Comparison of Actigraphy-Measured and Parent-Reported Sleep in Association with Weight Status among Preschool Children. J. Sleep Res. 2024, 33, e13960. [Google Scholar] [CrossRef]
- Van Loo, C.M.T.; Okely, A.D.; Batterham, M.J.; Hinkley, T.; Ekelund, U.; Brage, S.; Reilly, J.J.; Jones, R.A.; Janssen, X.; Cliff, D.P. Validation of Thigh-Based Accelerometer Estimates of Postural Allocation in 5-12 Year-Olds. J. Sci. Med. Sport 2017, 20, 273–277. [Google Scholar] [CrossRef]
- Petersen, B.A.; Erickson, K.I.; Kurowski, B.G.; Boninger, M.L.; Treble-Barna, A. Emerging Methods for Measuring Physical Activity Using Accelerometry in Children and Adolescents with Neuromotor Disorders: A Narrative Review. J. Neuroeng. Rehabil. 2024, 21, 31. [Google Scholar] [CrossRef]
- Bammann, K.; Thomson, N.K.; Albrecht, B.M.; Buchan, D.S.; Easton, C. Generation and Validation of ActiGraph GT3X+ Accelerometer Cut-Points for Assessing Physical Activity Intensity in Older Adults. The OUTDOOR ACTIVE Validation Study. PLoS ONE 2021, 16, e0252615. [Google Scholar] [CrossRef] [PubMed]
- Kossi, O.; Lacroix, J.; Ferry, B.; Batcho, C.S.; Julien-Vergonjanne, A.; Mandigout, S. Reliability of ActiGraph GT3X+ Placement Location in the Estimation of Energy Expenditure during Moderate and High-Intensity Physical Activities in Young and Older Adults. J. Sports Sci. 2021, 39, 1489–1496. [Google Scholar] [CrossRef] [PubMed]

| Item | Inclusion | Exclusion |
|---|---|---|
| Population | Children attending preschools or kindergartens. | Children who do not attend preschools or kindergartens. |
| Intervention or Exposure | The data were extracted from accelerometers. The data was processed using machine learning or deep learning algorithms. | The data were not extracted from accelerometers. The data were not processed or not was processed using machine learning or deep learning methods. Study protocols. |
| Comparation | Not applicable | Not applicable |
| Outcome[s] | Any result about machine learning application (validity or reliability studies, predictions, etc.). | Results non-related to machine learning/deep learning applications or machine learning/deep learning validation. |
| Other criteria | Peer-reviewed full-text studies published in original journal articles written in English or Spanish. | Non-peer reviewed journal articles. Non-original full-text studies (conference papers, etc.). Studies written in another language. |
| Reference | 1 | 2 | 3 | 4 | 5 | 6 | 7 | 8 | 9 | 10 | 11 | 12 | Score |
|---|---|---|---|---|---|---|---|---|---|---|---|---|---|
| Hagenbuchner et al. [17] | 2 | 2 | 2 | 2 | 2 | 2 | 0 | 0 | NA | NA | NA | 2 | 20/24 |
| Ahmadi et al. [18] | 2 | 2 | 2 | 2 | 2 | 2 | 0 | 0 | NA | NA | NA | 2 | 20/24 |
| Ahmadi et al. [19] | 2 | 2 | 2 | 2 | 2 | 2 | 0 | 0 | NA | NA | NA | 2 | 20/24 |
| Ahmadi et al. [7] | 2 | 2 | 2 | 2 | 2 | 2 | 0 | 0 | NA | NA | NA | 2 | 20/24 |
| Zhao et al. [20] | 2 | 2 | 2 | 2 | 2 | 2 | 0 | 0 | NA | NA | NA | 2 | 20/24 |
| Clark et al. [21] | 2 | 2 | 2 | 2 | 2 | 2 | 2 | 2 | NA | NA | NA | 2 | 24/24 |
| Ahmadi and Trost [8] | 2 | 2 | 2 | 2 | 2 | 2 | 0 | 0 | NA | NA | NA | 2 | 20/24 |
| Trost et al. [22] | 2 | 2 | 2 | 2 | 2 | 2 | 0 | 0 | NA | NA | NA | 2 | 20/24 |
| Kwon et al. [23] | 2 | 2 | 2 | 2 | 2 | 2 | 2 | 0 | NA | NA | NA | 2 | 22/24 |
| Kuzik et al. [24] | 2 | 2 | 2 | 2 | 2 | 2 | 2 | 0 | NA | NA | NA | 2 | 22/24 |
| Li et al. [25] | 2 | 2 | 2 | 2 | 2 | 2 | 0 | 0 | NA | NA | NA | 2 | 20/24 |
| Li et al. [26] | 2 | 2 | 2 | 2 | 2 | 2 | 0 | 0 | NA | NA | NA | 2 | 20/24 |
| Hammam et al. [27] | 2 | 2 | 2 | 2 | 2 | 2 | 0 | 0 | NA | NA | NA | 2 | 20/24 |
| Abdollahi et al. [28] | 2 | 2 | 2 | 2 | 2 | 2 | 2 | 0 | NA | NA | NA | 2 | 22/24 |
| Ref. | Participants | Activity Registration | Aim of Prediction | ML/DP Accuracy | Conclusions | Practical Application from Predicting | ||||
|---|---|---|---|---|---|---|---|---|---|---|
| Accelerometer | Hz and Epoch | Place | Attributes/Features/ Variables | Algorithm | % | |||||
| Machine Learning and Physical Activity | ||||||||||
| Hagenbuchner et al. [17] Year: 2015 | N° children: 11 Country: Australia Age: 3–6 years (4.8 ± 0.87) | Branch: ActiGraph GT3X+ (ActiGraph, Pensacola, FL, USA) Placement: right hip | Hz: 100 10 s 15 s 20 s 30 s 60 s | Laboratory | Participants completed 12 standardised activity trials (TV, reading, tablet game, quiet play, art, treasure hunt, cleaning up, active game, obstacle course, bicycle riding) over two laboratory visits. Activities were categorized into five activity classes: sedentary activities, light activities, moderate to vigorous activities, walking, and running. | Activity type | Standard feed-forward ANN | ANN: 69.7% (sedentary 82%, light 79%, MVPA 64%, walking 36%, running 46%) | Compared to the accuracy of a standard feed-forward ANN for recognizing and accurately predict activity type, a DL-inspired ensemble neural network provided the best accuracy among preschool children. | It can contribute to addressing important questions such as: (i) how much and which types of activity are important for health, (ii) how active are preschool children, (iii) what are the key determinants of physical activity, and (iv) which strategies are most effective for promoting physical activity in young children? |
| SOM | - | |||||||||
| DL Ensemble Network | DL: 82.6% (sedentary 84%, light 91%, MVPA 79%, walking 73%, running 73%) | |||||||||
| Ahmadi et al. [18] Year: 2020 | N° children: 31 Country: Australia Age: 3–5 years (4.0 ± 0.9) | Branch: ActiGraph GT3X+ accelerometer (ActiGraph Corporation; Pensacola, FL, USA) Placement: right hip and non-dominant wrist. | Hz: 100 | Free-living | Five activity classes: sedentary, light-intensity activities and games, walking, running, and MVPA. | To evaluate the accuracy of the automatic recognition of five activity classes | RF | Hip: 69.4% Wrist: 59.1% | ML activity classification models for preschool-aged children trained on laboratory-based activity trials do not generalize well to free-living conditions. | To improve the performance of activity classification models under free-living conditions, future studies should: (1) train models with free-living data; (2) use smaller sliding windows to accommodate the sporadic activity patterns of preschool children; and (3) explore the utility of temporal features, and feature fusion approaches from multiple sensors. |
| SVM | Hip: 66.4% Wrist: 59.3% | |||||||||
| General data | In comparison with laboratory, accuracy decreases 11–21%. Classification accuracy for sedentary 72–78%, light 58–79%, MVPA 71–84%, walk 9–15%, and run 66–75%. | |||||||||
| Ahmadi et al. [19] Year: 2020 | N° children: 25 Country: Australia Age: 3–5 years (4.1 ± 1.0) | Branch: ActiGraph GT3X+ accelerometer (ActiGraph Corporation; Pensacola, FL, USA) Placement: right hip and non-dominant wrist. | Hz: 100 | Laboratory Free-living | Two variations in the LAB models were evaluated: - Laboratory (LAB): an “off the shelf” model without additional training. - Retrained laboratory (retrained LAB): models retrained on free-living data, replicating the methodology used in the original calibration study. | Energy expenditure | RF, SVM, ANN | General RMSE for the free-living and retrained LAB models ranged from 0.63 to 0.67 kcals/min. Hip RMSE’s for the hip LAB (0.62–0.71), retrained LAB (0.58–0.62) and free-living models (0.61–0.65) were similar. Wrist Free-living SVM had a significantly higher RMSE (0.73 ± 0.29 kcals/min) than the retrained LAB SVM (0.63 ± 0.30 kcals/min) and LAB SVM (0.64 ± 0.18 kcals/min). RF The LAB (0.64 ± 0.28), retrained LAB (0.64 ± 0.25), and FL (0.62 ± 0.26) RF exhibited comparable accuracy. | ML energy expenditure prediction models trained on LAB and free-living data had similar accuracy under free-living conditions. Although the laboratory-based models generalized well to a free-living environment and exhibited acceptable accuracy at the group level of measurement, the strong evidence of proportional bias and wide prediction limits exhibited by all the models suggests that they may be inappropriate for predicting EE in individuals. | To improve predictive accuracy, future studies should train models using accelerometer data with enough training instances of physical activity with low and high energy expenditure for accurate prediction over the complete PA intensity continuum. The inclusion of physiological sensor data such as heart rate or person-level features such as height and weight may improve accuracy. |
| Ahmadi et al. [7] Year: 2020 | N° children: 31 Country: Australia Age: 3–5 years (4.0 ± 0.9) | Branch: ActiGraph GT3X+ accelerometer (ActiGraph Corporation; Pensacola, FL, USA) Placement: right hip and non-dominant wrist. | Hz: 100 | Free-living | Five activity classes: sedentary, light-intensity activities and games, walking, running, and MVPA. | PA classification | RF | 62.6–86.4% depending on prediction window of 1, 5, 10 or 15 s, with only minimal improvements beyond the 10 s windows. | RF activity classification models trained with free-living accelerometer data provide accurate recognition of young children’s movement behaviours under real-world conditions. The RF activity classifiers with prediction windows of 10 or 15 s provided the accurate recognition of five activity classes representative of young children’s movement behaviours. | Future studies should train models using accelerometer data collected over extended time periods and a wider range of settings to provide more movement diversity in the training data. Such studies should explore the inclusion of additional temporal features, such as the ratio of the dominant frequency for the current and adjacent windows or information/features from additional sensors such as heart rate monitors, gyroscopes, barometric pressure sensors, and GPS trackers. |
| Zhao et al. [20] Year: 2013 | N° children: 69 Country: USA Age: 3–5 years | Branch: ActiGraph GT3X+ activity monitor (ActiGraph, Pensacola, FL) Placement: right hip | Hz: 0.25–2.5 60 s | Free time under supervision | Sleep, watching TV, colouring, video games, puzzles, kitchen/toys, ball toss, active video games, dance, aerobics, running in place | PA classification | SVM | With sleep CVER: 24.70% Without sleep CVER: 20.16% Overall CVER: 15.56% | The SVM classifiers have a smaller 10-fold CV error rate than them SVM supersedes the classical classifier (multinomial logistic regression) in categorizing physical activities in preschool-aged children. | Using accelerometer data, SVM can be used to correctly classify physical activities typical of preschool-aged children with an acceptable classification error rate. |
| Clark et al. [21] Year: 2020 | N° children: 125 Country: - Age: 3–5 years (4.3 ± 0.5) | Branch: ActiGraph GT3X+ accelerometer (Actigraph, Pensacola, FL, USA) Placement: waist, above the right hip, | Hz: 100 1 s | 24 h activity | Anthropometrics, motor competence, PA at different intensities | Profiles of motor competence and movement behaviours | k-means cluster | Non-specified | The SOM analysis indicated five different profiles according to motor competence and PA. The results show that whilst differences in movement behaviours are already manifest in young children, resultant changes in adiposity are not clear, highlighting that basic anthropometric screening is insensitive, inadequate. | The authors of the present study assert that the focus should change from obesity monitoring, to one of “moving well”. Given the importance of this stage of life for future health, activity engagement and MC, it is of critical importance accurate profiles, particularly of relative low competence children, be ascertained, so that nuanced, early, interventions may be implemented. |
| SOM | ||||||||||
| Li et al. [25] Year: 2019 | N° children: 34 Country: USA Age: 3–5 years | Branch: ActiGraph GT3X+ accelerometer (Actigraph, Pensacola, FL, USA) Placement: wrist and hip | Hz: 30 15 s epoch and thereafter collapsed to 60 s epochs | Non-free-living setting | Sedentary behaviour, light PA, moderate PA, vigorous PA, MVPA | Establishing cut-points for wrist-worn accelerometry to assess PA | ROC | k-means cluster had the highest classification accuracy, with more than 70% of the total epochs being classified into the correct PA categories as examined by the hip reference. K-means cut-points also exhibited the most accurate estimates on SED, LPA, and VPA as the hip reference, whereas none of the three wrist methods were able to accurately assess MPA. | This study demonstrated that ML techniques have potential to distinguish PA intensity levels with the exception of moderate PA in preschool-aged children. | This study demonstrates the potential of ML approaches on establishing cut-points for wrist-worn accelerometry to assess PA in pre-schoolers |
| OLR | ||||||||||
| k-means cluster | ||||||||||
| Ahmadi and Trost [8] Year: 2022 | N° children: 31 Country: Australia Age: 3–5 years (4.0 ± 0.9) | Branch: ActiGraph GT3X+ accelerometer (Actigraph, Pensacola, FL, USA) Placement: wrist and hip | Hz: 0.25–5.0 15 s | Free-living | Sedentary activity, light intensity, and MVPA | PA intensity | RF | Sedentary and light: 83–88% MVPA: 68–78% | RF exhibited significantly higher agreement with ground truth PA intensity than other traditional methods such as cut-point methods. ML classification models showed equivalence (within ±0.5 SD) with directly observed time in sedentary, light, and MVPA. None of the cut point’s exhibited evidence of equivalence. | The authors encourage researchers to use the random forest physical activity classification models evaluated in this study. |
| Trost et al. [22] Year: 2018 | N° children: 31 Country: Australia Age: 3–6 years (4.8 ± 0.9) | Branch: ActiGraph GT3X+ accelerometer (Actigraph, Pensacola, FL, USA) Placement: wrist, hip, and combined wrist and hip | Hz: 0.25–5.0 15 s | Free-living | Sedentary activity, light intensity, MVPA, walking, and running | Activity class | RF | Hip: 0.80 (95% CI, 0.79–0.82) Wrist: 0.78 (95% CI, 0.77–0.80) Combined: 0.82 (95% CI, 0.80–0.83) | Recognition accuracy was consistently excellent for sedentary (>90%); moderate for light activity games, MVPA, and running (69–79%); and modest for walking (61–71%). | ML algorithms such as RF and SVM are useful for predicting PA class from accelerometer data collected in preschool children. Although classifiers trained on hip or wrist data provided acceptable recognition accuracy, the combination of hip and wrist accelerometer delivered better performance. Compared with sample-specific cut points for the hip or wrist, the ML algorithms provided higher classification accuracy for absolute PA intensity. |
| SVM | Hip: 0.81 (95% CI, 0.80–0.83) Wrist: 0.80 (95% CI, 0.79–0.80) Combined: 0.85 (95% CI, 0.84–0.86) | |||||||||
| Kwon et al. [23] Year: 2022 | N° children: 301 Country: USA Age: 3–5 years | Branch: ActiGraph GT3X+ accelerometer (Actigraph, Pensacola, FL, USA) Placement: wrist | Hz: 80 1 s 5 s 10 s 15 s | 24 h | Five activity classes: run, walk, other MVPA, LPA, and sedentary. | Daily time spent at MVPA (MVPA; the sum of minutes spent in running, walking, and other MVPA) and total PA (the sum of MVPA and light-intensity PA). | RF | Non-detailed | The study found that preschool-aged children engaged in 28 min/day of MVPA and 361 min/day of total PA. However, the authors do not centre their findings and conclusions on ML. | No practical applications about the use of ML in preschool was detailed |
| Machine Learning and Sleep | ||||||||||
| Kuzik et al. [24] Year: 2021 | N° children: 89 Country: Canada Age: 4.5 years | Branch: ActiGraph wGT3X-BT Placement: waist | Hz: 30 15 s | 24 h | Nap, sleep, and wake | Sleep duration | RF | 96.2% | This study demonstrated almost perfect agreement between free-living visual inspection ground truth measurements and several techniques for predicting sleep in preschool-aged children wearing waist-worn ActiGraph accelerometers. This is the first study to create a technique to classify sleep duration in this age group using this device. | A simplified formula to predict sleep was created that can greatly reduce computational demands. Hence, RF and Hidden Markov Modelling technique appears best for sleep classification; however, the simplified formula is optimal if computing power is limited. |
| Li et al. [26] Year: 2020 | N° children: 262 Country: USA Age: 0–2 years | Branch: Actiwatch-2 (Phillips Respironics Mini-Mitter) Placement: ankle | Hz: 0.35–7.5 1 min | 24 h | Activity rhythm | Sleep activity rhythms | PML | Non-detailed | The proposed PML algorithm can effectively conduct circadian rhythm analysis using time-series wearable device data. | Application of the method effectively characterized sleep–wake rhythm development and identified the association between daily rhythm formation and motor development during early childhood. PML can be extended to other types of circadian studies using information such as body temperature, heart rate, and hormone data. Therefore, the PML algorithm can be widely applied to other wearable device studies to help characterize periodic information. |
| Hammam et al. [27] Year: 2020 | N° children: 634 Country: Age: 3–5 years | Branch: ActiGraph GT3X-BT accelerometer (Actigraph, Pensacola, FL, USA) Placement: wrist | Hz: 30 60 s | 24 h | Activity | Sleep period | HMM | Non-detailed | This study utilized an ML approach to examine associations between objectively assessed childhood sleep duration and behaviour problems. We found significant associations between ML-derived sleep states and behavioural problems among preschool children. Children with longer sleep without movement had lower behavioural problems scores. Associations between sleep and behaviour problems were stronger among children with sleep-disordered breathing. | The findings highlight that the associations between sleep problems and behaviour problems may vary depending on how sleep problems are processed (actigraphy-algorithms or ML–sleep states) and the child’s medical history (SDB vs. no SDB). Also, we hope that our work will stimulate other researchers to examine (or re-examine) their own feature-rich datasets to identify additional sleep patterns or states. |
| Abdollahi et al. [28] Year: 2022 | N° children: 638 Country: Finland Age: 3–6 years (4.76 ± 0.89) | Branch: ActiGraph GT3X-BT accelerometer (Actigraph, Pensacola, FL, USA) Placement: wrist | Non-detailed | 24 h | Six variables were formed from actigraphy-measured sleep: (1) night time sleep onset, (2) morning wake-up, (3) sleep duration, (4) time spent asleep within sleep duration, (5) wake after sleep onset, (6) sleep efficiency, (7) sleep midpoint, and (8) weekend–weekday differences in sleep midpoint. | Sleep timing in association with weight status | HMM | HMM has been validated previously against polysomnography with 85.7% overall accuracy. Not detailed in this study. | Though the sleep estimation methods were consistent and correlated, actigraphy measures should be favoured as they are more objective and sensitive to identifying associations between sleep timing and weight status compared with parent reports. | Most commonly used actigraph sleep estimation methods are often heuristic, commercialized, and require the input of reported sleep times, which may make sleep research cumbersome and expensive in large study populations. This study highlights the potential of an openly accessible data-driven, unsupervised algorithm used to estimate nighttime sleep from actigraph data. Further studies are needed to better understand the associations with sleep timing and weight status. |
| Features | GT3X+ | Axivity AX3 | GENEActiv | SenseWear |
|---|---|---|---|---|
| Measurements | Acceleration in three axes, other variables such as energy expenditure, intensity of physical activity | Acceleration in three axes, high temporal resolution | Acceleration in three axes, high temporal resolution | Multiple variables including physical activity and energy expenditure |
| Primary Use | Scientific and clinical research | Scientific research | Scientific and clinical research | Clinical applications and personal wellness |
| Connectivity | Data transfer to mobile devices or computers | Data transfer via USB | Data transfer via USB or Bluetooth | Data transfer via USB or Bluetooth |
| Applications | Scientific and clinical research | Scientific research | Scientific and clinical research | Clinical applications and personal wellness |
Disclaimer/Publisher’s Note: The statements, opinions and data contained in all publications are solely those of the individual author(s) and contributor(s) and not of MDPI and/or the editor(s). MDPI and/or the editor(s) disclaim responsibility for any injury to people or property resulting from any ideas, methods, instructions or products referred to in the content. |
© 2025 by the authors. Licensee MDPI, Basel, Switzerland. This article is an open access article distributed under the terms and conditions of the Creative Commons Attribution (CC BY) license (https://creativecommons.org/licenses/by/4.0/).
Share and Cite
Rico-González, M.; Gómez-Carmona, C.D. Machine Learning Applications for Physical Activity and Behaviour in Early Childhood: A Systematic Review. Appl. Sci. 2025, 15, 6296. https://doi.org/10.3390/app15116296
Rico-González M, Gómez-Carmona CD. Machine Learning Applications for Physical Activity and Behaviour in Early Childhood: A Systematic Review. Applied Sciences. 2025; 15(11):6296. https://doi.org/10.3390/app15116296
Chicago/Turabian StyleRico-González, Markel, and Carlos D. Gómez-Carmona. 2025. "Machine Learning Applications for Physical Activity and Behaviour in Early Childhood: A Systematic Review" Applied Sciences 15, no. 11: 6296. https://doi.org/10.3390/app15116296
APA StyleRico-González, M., & Gómez-Carmona, C. D. (2025). Machine Learning Applications for Physical Activity and Behaviour in Early Childhood: A Systematic Review. Applied Sciences, 15(11), 6296. https://doi.org/10.3390/app15116296