1. Introduction
Deep geothermal resources in mines represent a renewable energy source with substantial reserves and significant development potential [
1,
2,
3]. Statistics indicate that geothermal resources within 3 km of coal mining areas nationwide amount to 379.539 billion tons of standard coal equivalent, equivalent to one-third of China’s proven coal reserves [
4]. However, in current deep mining practices, mine geothermal energy remains underutilized. Instead, it contributes to elevated underground temperatures, creating severe thermal hazards that endanger miners’ lives and impede safe coal production [
5,
6,
7]. Consequently, developing novel technical equipment capable of simultaneously achieving efficient cooling and thermal energy recovery has become an urgent need in deep coal mining. Addressing deep mine heat hazard mitigation, existing research primarily follows two technical pathways. The first involves artificial cooling technologies dominated by mechanical refrigeration. While effective at controlling temperatures, their high energy consumption costs and “heat transfer rather than utilization” approach struggle to meet green mining development requirements [
8,
9,
10,
11,
12]. The second involves geothermal resource utilization technologies, such as ground-source heat pump systems utilizing mine drainage water. However, their application is constrained by hydrogeological conditions and the systems’ large scale, making efficient coordination with dynamically advancing mining operations difficult [
13,
14,
15,
16,
17]. In recent years, phase change materials (PCMs) have demonstrated significant potential in mine heat hazard control due to their outstanding thermal management capabilities [
18,
19,
20,
21,
22].
Scholars worldwide have conducted extensive research on the application of PCMs in mitigating mine heat hazards. Wang et al. [
23] performed field experiments on a paraffin-based CPCM used in cooling uniforms for miners. Their results demonstrated that the CPCM exhibits excellent thermal performance in high-temperature mining environments, effectively reducing miners’ body temperature and improving thermal comfort. Mlynarczyk et al. [
24] evaluated the cooling effect of rescue underwear containing PCM using heat flux measurements and thermal imaging. They found that wearing a PCM-equipped T-shirt increased heat flux by an average of 15 W/m
2 within the first 20–30 min, significantly lowering skin temperature. Mika et al. [
25] conducted a field trial on using ice slurry as a PCM in central air conditioning systems for mines. Replacing chilled water with ice slurry in the existing pipeline system at the LW Bogdanka mine increased cooling capacity by 50% and noticeably reduced air temperature at the working face. Saleem et al. [
26] numerically investigated a solar thermal panel with nanofluid and PCM for a mine office building, showing that larger tube diameter reduced panel temperature and PCM melting, providing 56% and 18% of hot water in hot and cold seasons, respectively. Wu et al. [
27] explored the use of PCM in coal mine refuge chambers. Their study showed that PCM could maintain the indoor temperature at around 30 °C for 76 h, after which it gradually rose to 33 °C over 96 h. The material exhibited high heat absorption efficiency initially, which decreased over time. Choure et al. [
28] reviewed heat transfer enhancement techniques for PCM-based thermal storage, showing that structural optimizations and high-conductivity additives like graphene significantly improve thermal performance, with graphene increasing conductivity by up to 245.7% at low loadings. Yuan et al. [
29] proposed a novel hybrid cooling method combining latent heat thermal energy storage with pre-cooling of enclosures, analyzed using semi-analytical and numerical approaches. This method proved safe, stable, and reliable in special environments without power supply, while also reducing PCM usage and increasing the operational temperature difference. Wang et al. [
30] investigated the heat transfer and phase change behavior of cementitious backfill mixed with PCM. The cooling release process displayed distinct temporal stages and unique spatial distribution patterns. Lower initial liquid fractions resulted in longer melting times and a slower average temperature rise. Martin et al. [
31] investigated a method to enhance the thermal conductivity of phase change materials (PCMs) by compounding sodium acetate trihydrate with copper-based metal foam, developing a thermal energy storage device for waste heat recovery from internal combustion engines in mining machinery. They successfully achieved uniform heat storage throughout the entire volume of the storage unit, validating the feasibility of this composite structure. Roshani et al. [
32] studied the enhancement of geothermal heat exchanger performance by incorporating microencapsulated PCM into the backfill material. Their results demonstrated a significant reduction in the outlet fluid temperature of the heat exchanger and an approximately 7.5% improvement in system efficiency.
In summary, although PCM technology has been applied in coal mine cooling, existing research has primarily focused on individual protection or heat extraction from goaf backfilling, lacking innovative solutions for managing thermal hazards in complex roadways. Particularly, the performance characteristics and operational parameters of CPCM roadway cooling systems, as well as their compatibility with mine geothermal conditions, remain poorly understood. Addressing this research gap, the authors propose a novel cascaded CPCM roadway cooling system. This system employs a multi-stage gradient heat exchange mechanism to simultaneously reduce roadway thermal environment temperatures and efficiently harness mine geothermal resources. This paper establishes a numerical model of the novel cascaded CPCM roadway cooling system to analyze how installation and operational parameters influence its cooling performance. Key parameters—including ring pipe radius ratio, cascade spacing, phase transition temperature, and air guide plate angle—are optimized to explore CPCM’s integrated potential in mine heat hazard control and thermal energy recovery. These findings provide novel insights for advancing the green development of deep coal and geothermal resources. They hold promise for transforming mine geothermal energy from a “thermal hazard” into a valuable “thermal resource,” thereby promoting the sustainable development of mine energy systems.
3. Results and Analysis
3.1. Annular Tube Radius Ratio
The influence of different annular tube radius ratio on the average outlet temperature (
Tave), the solid phase percentage of CPCM (
φ), and the average monitoring surface temperature (
TEP) are shown in
Figure 5.
The study found that the average outlet temperature (Tave) increases with the annular tube radius ratio, but the rate of increase gradually diminishes. When the radius ratio increases from 1:3 to 2:3, Tave at the end of the operation period rises from 10.67 °C to 10.85 °C. During the cooling phase, Tave decreases as the pump operation time increases. The initial Tave value increases with a larger radius ratio. The initial Tave values for schemes C1 (1:3), C2 (1:2), C3 (3:5), and C10 (2:3) are 10.77 °C, 11.01 °C, 11.11 °C, and 11.14 °C, respectively. For a radius ratio of 1:2, Tave during the pump operation phase on the second day decreases from an initial 11.01 °C to a stable value of approximately 10.80 °C, representing a change of about 0.21 °C. For a radius ratio of 3:5, the initial Tave value on the second day is closest to that of the 2:3 ratio scheme. Although its cooling rate is slightly slower than the 2:3 scheme, both achieve similar stable temperatures, which are superior to the C1 and C2 schemes. Both the solid phase percentage of the CPCM (φ) and its utilization rate improve as the annular tube radius ratio increases. A smaller radius ratio is less conducive to the solid-state recovery of the CPCM, thereby hindering the cooling effect. Conversely, a larger radius ratio results in a more stable phase change cycle and higher phase change utilization. On the first day of operation, with a radius ratio of 1:3, the CPCM continuously absorbs ambient heat, and its φ stabilizes after reaching 67.42% at the end of the day. As the radius ratio increases from 1:2 to 2:3, the recovery rate of φ for the corresponding material also increases, rising from 80.25% to 89.03%. With a radius ratio of 2:3, the phase change cycle becomes more stable over time, and the rate of solid-phase change accelerates during the system operation period. The average temperature of the monitoring surface (TEP) decreases as the annular tube radius ratio increases. When the ratio is 1:3, the temperature difference at the monitoring surface is the smallest, indicating the poorest cooling effect. As the ratio increases, both the maximum and minimum TEP values across the different schemes decrease. The improvement in cooling effectiveness becomes less significant when the radius ratio increases from 3:5 to 2:3. For a ratio of 3:5, TEP after 5 days of operation is 31.06 °C, representing a temperature reduction of 8.94 °C. For a ratio of 2:3, TEP increases gradually over the operation time, reaching 30.46 °C at the end of the period. This scheme achieves the largest temperature reduction at the monitoring surface, amounting to 9.54 °C.
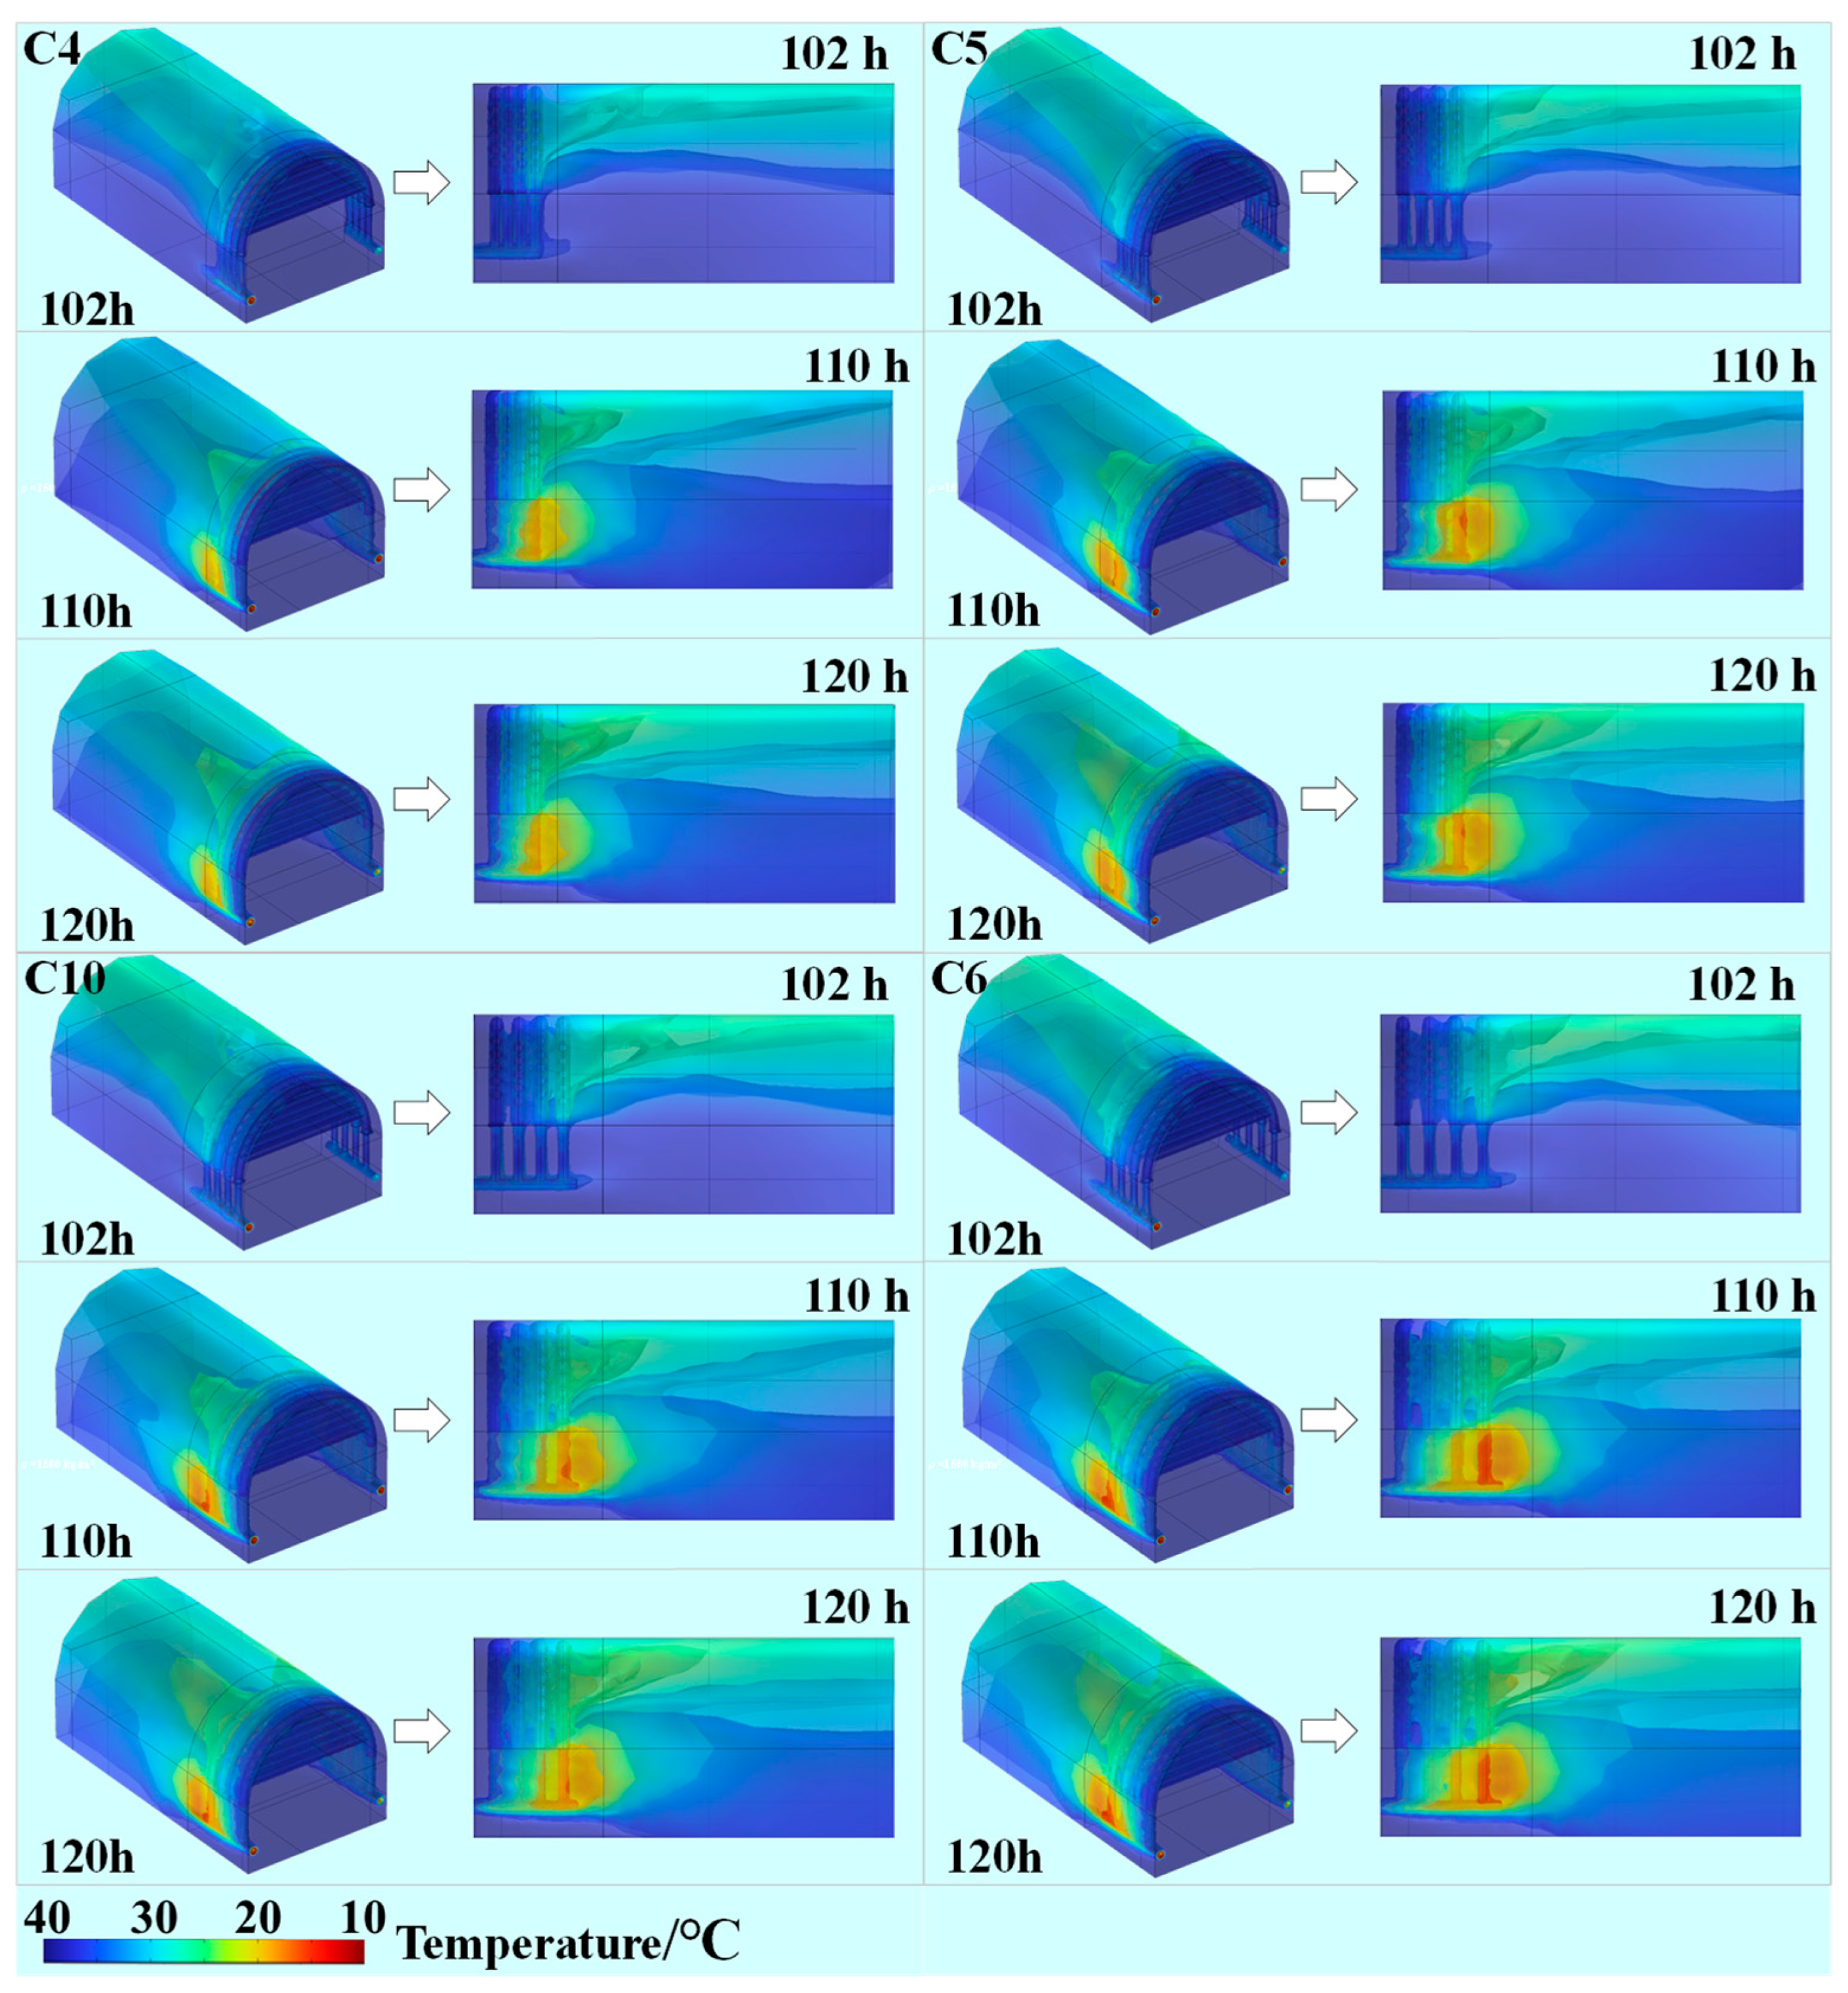
To further analyze the influence of the annular tube radius ratio on the temperature field within the roadway space, spatial distribution nephograms of the roadway temperature field under different annular tube radius ratios were generated based on numerical simulation results, as shown in
Figure 6.
The study found that during the cooling phase, the high-temperature thermal hazard was alleviated to varying degrees under all schemes compared to the initial condition. At 102 h of system operation, as the annular tube radius ratio increased, the average temperature within the roadway decreased progressively. The cooling zone was primarily concentrated in the upper part of the roadway. The scheme with a radius ratio of 2:3 resulted in the most extensive cooling coverage, indicating that a larger radius ratio favors the diffusion of low-temperature air. By 110 h, the temperature in the lower part of the roadway decreased with increasing radius ratio. The average temperature in the upper extended zone was 33.57 °C, while it was 37.82 °C in the lower extended zone. At 120 h, the extent of the low-temp zone in the upper roadway expanded further with larger radius ratios. For the 2:3 ratio scheme, the average temperature in the upper zone was 31.90 °C, representing the greatest temperature reduction and the most far-reaching cooling extent among all schemes. By comparing the temperature distribution nephograms of the different schemes at 102 h, 110 h, and 120 h, the following patterns were identified: In the initial stage of pump operation, high-temperature areas were predominantly concentrated in the lower roadway, while the thermal hazard in the upper part had been preliminarily mitigated. As pump operation time increased, the average temperature of the temperature field in the lower roadway decreased, and the low-temperature zone expanded further, eventually reaching about half the extent of the upper roadway’s expansion. Subsequently, until the pump stopped, the diffusion rate continuously decreased, with the primary direction of diffusion being from the upper to the lower roadway. A larger annular pipe radius ratio resulted in a faster diffusion rate from the upper to the lower roadway. In summary, the influence of the annular tube radius ratio on the cooling effect can be concluded as follows: A larger radius ratio leads to faster cooling in the upper roadway and a quicker final migration rate of the low-temperature zone toward the lower roadway. The cooling hierarchy in the upper section is superior to that in the lower section, with the lower expansion range being approximately half that of the upper expansion range.
In summary, the influence of the annular tube radius ratio on the performance of the roadway cooling system is as follows: the average outlet temperature increases with a larger radius ratio; the solid phase percentage and utilization rate of the CPCM improve as the radius ratio increases, with a larger ratio resulting in a more stable phase change cycle; the average temperature of the monitoring surface decreases as the radius ratio increases; within the roadway space temperature field, a larger radius ratio leads to a lower average roadway temperature and a wider cooling range, but beyond a certain point, the enhancement of the cooling effect diminishes.
3.2. Cascaded Tube Spacing
The influence of different cascaded tube spacing on the average outlet temperature (
Tave), the solid phase percentage of CPCM (
φ), and the average monitoring surface temperature (
TEP) are shown in
Figure 7.
The study found that the average outlet temperature (Tave) increases with larger cascaded tube spacing. While a greater cascaded tube spacing accelerates the rate of change in Tave, it also intensifies cooling challenges and degrades the heat exchange efficiency of the inner pipe. As system operation time extends, Tave gradually decreases by the end of the pump operation phase. At the conclusion of the pump operation on the third day, when the cascaded tube spacing increases from 0.3 m to 0.6 m, Tave rises correspondingly from 10.80 °C to 10.95 °C. The final Tave values at the end of the operation period for cascaded tube spacing of 0.3 m, 0.4 m, 0.5 m, and 0.6 m are 10.79 °C, 10.84 °C, 10.85 °C, and 10.94 °C, respectively. The Tave curve demonstrates relative stability when the cascaded tube spacing is set at 0.4 m or 0.5 m. The utilization rate of the CPCM improves with increased cascaded tube distance. When the pump is idle, a smaller cascaded tube distance reduces the system’s capacity to absorb ambient heat, thereby diminishing the cooling effect. During the pump idle period on the first day, the CPCM achieves its highest utilization rate at a cascaded tube distance of 0.6 m, with a range of φ 36.42%. Conversely, the phase change utilization is lowest at a 0.3 m distance, where the range of φ is only 27.64%. When the pump operates on the first day, the heat exchange rate within the pipe is fastest at a 0.6 m cascaded tube distance, allowing the φ of the CPCM to recover to approximately 89.9% after pump operation ceases. However, at a 0.3 m cascaded tube distance, the final recovery degree of the CPCM at the end of days 1–5 surpasses that of other schemes, with φ reaching a maximum of about 90.42%. The average monitoring surface temperature (TEP) initially increases and then decreases as the cascaded tube distance enlarges, peaking at a distance of 0.5 m. During the initial system operation phase, the influence of underground airflow is significant, and a smaller cascaded tube distance enhances natural ventilation effectiveness. At a 0.3 m cascaded tube distance, TEP measures 31.82 °C at the start of pump operation on the first day. As pump operation continues, TEP drops to 29.74 °C when the pump stops. The ultimate TEP after 5 days of operation is lowest at 29.69 °C for this configuration, indicating a marginally superior long-term cooling performance compared to other schemes. Consequently, the cooling effect weakens with increased cascaded tube distance. The average TEP reductions for cascaded tube distances of 0.3 m, 0.4 m, 0.5 m, and 0.6 m are 10.31 °C, 9.85 °C, 9.55 °C, and 9.71 °C, respectively.
To further analyze the influence of the cascaded tube distance on the temperature field within the roadway space, spatial distribution nephograms of the roadway temperature field under different cascaded tube distance were generated based on numerical simulation results, as shown in
Figure 8.
The study found that as the cascaded tube distance increases, the temperature diffusion pattern within the roadway at different time intervals demonstrates a characteristic where the upper section cools preferentially. The cooling initiation in the lower roadway section lags behind the upper section, and the cooling rate is slower in the lower part. At 102 h of operation, the spatial temperature distribution patterns in the roadway are nearly consistent across different schemes. For cascaded tube distances of 0.3 m, 0.4 m, 0.5 m, and 0.6 m, the average temperatures in the upper extended zone are 33.25 °C, 32.83 °C, 31.90 °C, and 32.25 °C, respectively, with a minimum temperature difference of only 0.35 °C. By 110 h, the low-temperature zone in the upper roadway section further expands, and the extent of the lower expansion zone increases with larger cascaded tube distances. The maximum temperature differences between various schemes are primarily concentrated near the cooling inner pipes in the lower roadway section. As the cascaded tube distance increases, the average temperature recorded at the 8th hour of pump operation on the fifth day progressively decreases. At a cascaded tube distance of 0.6 m, the average temperature near the inner pipe of the fourth stage is approximately 10 °C. In comparison, when the cascaded tube distance is increased by 0.1 m from 0.5 m, the extent of the lower expansion zone does not show a positive correlation with the increase, and the average temperatures within the lower expansion zones are nearly identical. At 120 h, the temperature variation patterns in the roadway space across different schemes align with those observed at the 8th hour of pump operation on the fifth day. As the cascaded tube distance increases, the low-temperature zone continues to expand. A limiting diffusion range appears at a cascaded tube distance of 0.5 m; beyond this point, further increases in the row distance result in negligible changes in temperature differential. In conclusion, the influence of cascaded tube distance on the cooling effect can be summarized as follows: As the cascaded tube distance increases, the upper roadway section experiences prioritized and continuous cooling. For the lower roadway section, a limiting diffusion range exists as the cascaded tube distance increases from 0.3 m to 0.5 m. The optimal cooling performance is achieved when the cascaded tube distance is 0.5 m.
In summary, the influence of cascaded tube distance on the cooling system performance is as follows: the average outlet temperature increases with larger row distances; the solid-phase utilization rate of CPCM improves with increased row distance; the average monitoring surface temperature initially rises and then decreases with greater row distance, while the cooling effect weakens; and within the roadway temperature field, the upper section cools preferentially, reaching its maximum diffusion range at a row distance of 0.5 m. Although increasing the cascaded tube distance generally enhances the overall cooling effect of the roadway, it should not be excessively large to avoid impeding heat exchange in the cooling system.
3.3. Phase Change Temperature
The influence of different
TCPCM-4 on the average outlet temperature (
Tave), the solid phase percentage of CPCM(
φ), and the average monitoring surface temperature (
TEP) are shown in
Figure 9.
The study found that the average outlet temperature (Tave) shows little variation with increasing CPCM phase change temperature. In the initial stage of system operation, heat exchange within the tube is significant, and Tave changes rapidly. When the CPCM phase change temperature is 25 °C, Tave decreases from 11.14 °C to 10.85 °C during the pump operation phase on the second day, a reduction of approximately 0.29 °C. When the CPCM phase change temperature increases from 25 °C to 31 °C, Tave exhibits minor fluctuations before heat exchange, rising from 11.14 °C to 11.2 °C before stabilizing. After heat exchange occurs, Tave remains stable, ultimately settling between 10.85 °C and 10.87 °C for all cases. The solid phase percentage of the CPCM (φ) increases with higher CPCM phase change temperatures, while the phase change utilization rate decreases. The cooling effect is most significant when the CPCM phase change temperature is relatively low, as the phase change occurs most fully under these conditions. At a CPCM phase change temperature of 25 °C, the range of φ is largest, with a maximum of 33.65% and a minimum of 30.78%, indicating the highest overall phase change utilization rate. Within the 5-day operation period, φ can recover up to 89.23%. In contrast, at a CPCM phase change temperature of 31 °C, the range of φ is significantly smaller, with a maximum of 12% and a minimum of 11.09%, and φ can recover up to 99.64%. However, compared to other schemes, the comprehensive utilization rate of the CPCM is lowest at this temperature. As the CPCM phase change temperature increases, the range of the average monitoring surface temperature (TEP) becomes larger. Lower CPCM phase change temperatures lead to faster TEP reduction rates, but the final stabilized TEP after cooling is higher. The maximum temperature differences of TEP within the fifth day for CPCM phase change temperatures of 25 °C, 27 °C, 29 °C, and 31 °C are 2.69 °C, 3.38 °C, 3.85 °C, and 4.46 °C, respectively. A lower CPCM phase change temperature results in a more balanced TEP distribution. At a CPCM phase change temperature of 25 °C, TEP after 5 days of operation is 30.46 °C, with a cumulative temperature reduction of 9.54 °C. The difference in the final TEP compared to the case with a CPCM phase change temperature of 31 °C is only 0.18 °C.
To further analyze the influence of the CPCM phase change temperatures on the temperature field within the roadway space, spatial distribution nephograms of the roadway temperature field under different CPCM phase change temperatures were generated based on numerical simulation results, as shown in
Figure 10.
The study found that during the cooling phase, the average temperature in the upper expansion zone of the roadway increases further as the CPCM phase change temperature rises. At 102 h of operation, the average temperatures in the upper expansion zone for CPCM phase change temperatures of 25 °C, 27 °C, 29 °C, and 31 °C were 32.61 °C, 32.81 °C, 33.09 °C, and 33.38 °C, respectively. The maximum temperature difference in the lower expansion zone among the different schemes was only 0.01 °C. Combined with the solid phase percentage variation curve, under identical geothermal geological conditions, a higher CPCM phase change temperature corresponds to a lower utilization rate of the composite phase change material. By 110 h of operation, the average temperature at the inner pipe of the fourth stage continuously decreased as the CPCM phase change temperature increased, reaching a trough of 10.39 °C at a CPCM phase change temperature of 29 °C. The temperature diffusion effect within the upper expansion zone was superior to other schemes at this temperature. At 120 h of operation, the spatial temperature variation patterns in the roadway were consistent across the different groups. The average temperature in the upper expansion zone was 33.16 °C, while it was 37.76 °C in the lower expansion zone. The solid phase percentage was highest at a CPCM phase change temperature of 31 °C and lowest at 25 °C. However, the phase change utilization rate was highest at 25 °C, indicating the most complete phase change occurrence. Excessively high CPCM phase change temperatures are not well-suited to the mine’s geothermal geological conditions, resulting in extremely low phase change utilization. Therefore, the influence of different CPCM phase change temperatures on the cooling effect can be summarized as follows: The selection of the CPCM phase change temperature should be based on the geothermal geological conditions of the specific mine. A CPCM phase change temperature of 25 °C provides the best cooling effect and the most complete phase change. As the CPCM phase change temperature increases, the utilization rate of the composite phase change material decreases.
In summary, the impact of CPCM phase change temperature on the CPCM roadway cooling system performance is as follows: A higher CPCM phase change temperature leads to a lower stabilized value of the average outlet temperature. The solid phase percentage increases with rising CPCM phase change temperature, while the phase change utilization rate decreases. The range of the average monitoring surface temperature increases with higher CPCM phase change temperatures, with the best cooling effect and maximum cumulative temperature reduction achieved at 25 °C. Within the roadway spatial temperature field, the selection of CPCM phase change temperature must consider the mine’s geothermal conditions. A temperature of 25 °C yields the optimal cooling effect, whereas higher temperatures reduce the utilization rate of the composite phase change material and deteriorate compatibility with the geothermal conditions.
3.4. Air Deflector Angle
The influence of different air deflector angle on the lower low-temp zone expansion distance (
SED), the average temperature of the monitoring line (
TEPL), and the average monitoring surface temperature
TEP are shown in
Figure 11.
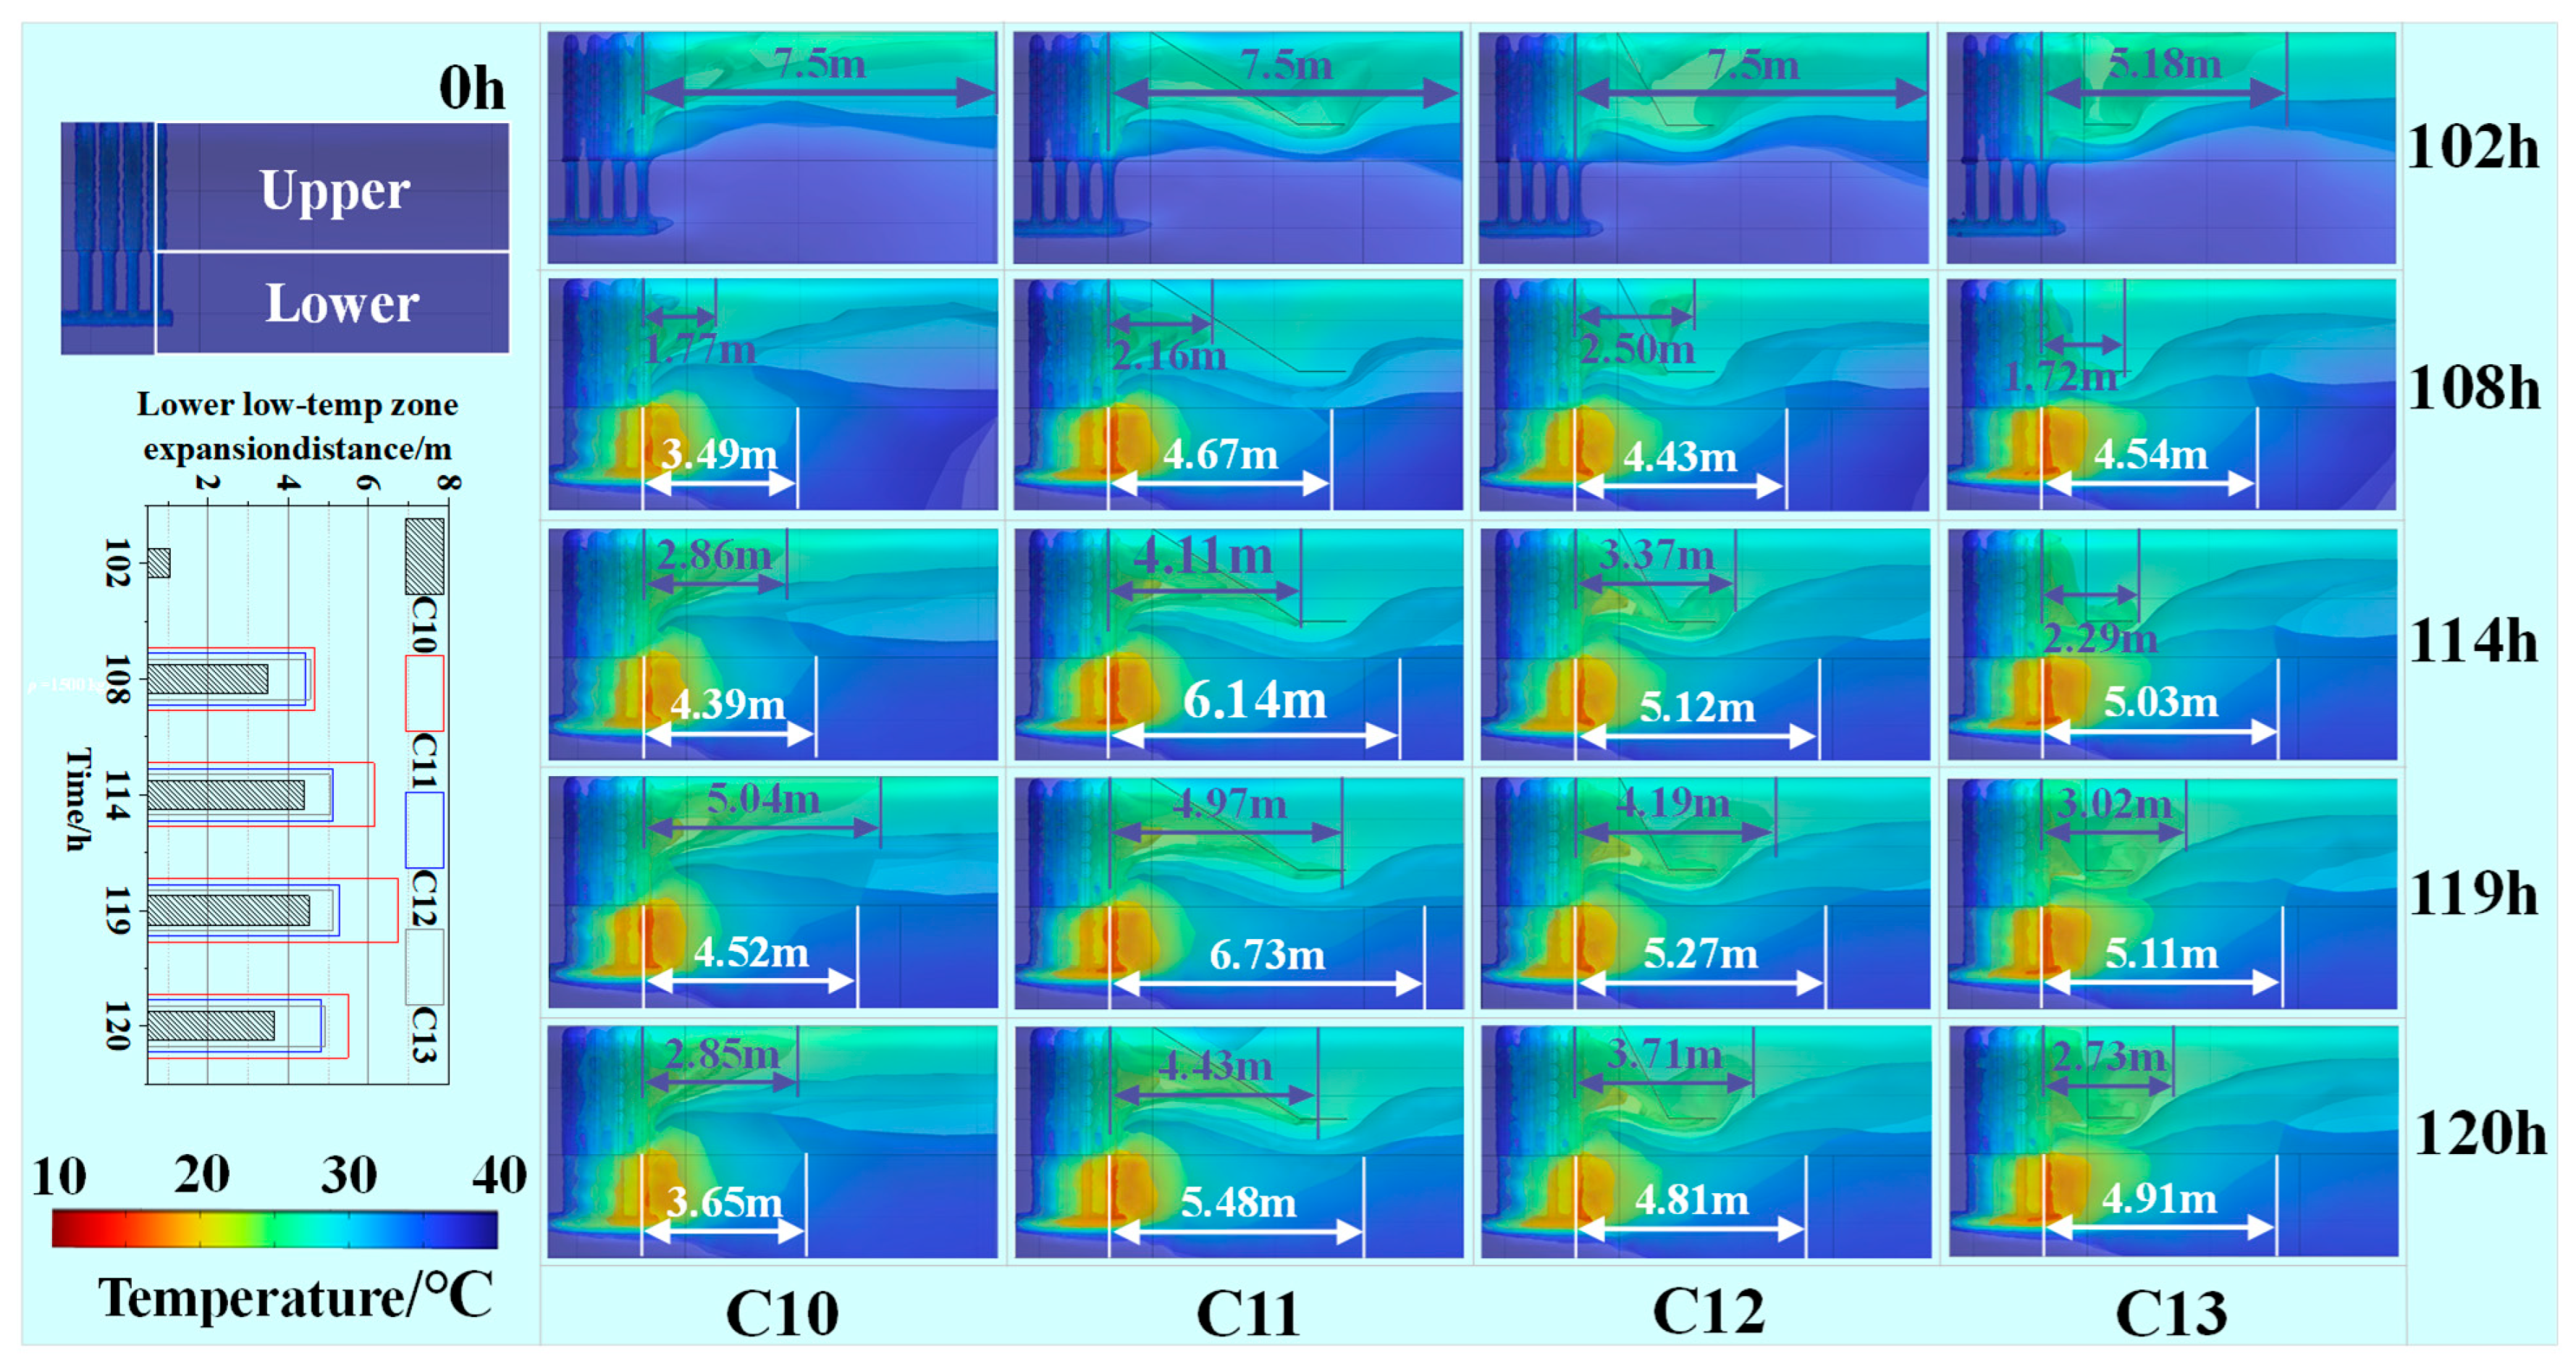
The study found that the growth rate of the lower low-temperature zone expansion distance (SED) initially increases and then decreases as the air deflector angle increases, peaking at a deflector angle of 30°. When no deflector was installed (C10), the roadway remained in a high-temperature environment at the 102 h cooling mark. As pump operation time extended, the SED eventually expanded to 4.52 m. After installing deflectors (C11, C12, C13), the cold airflow path was altered. In the initial cooling stage, the low-temperature zone, obstructed by the deflector structure, first concentrated in the space beneath the deflector, significantly reducing the local temperature and improving the high-temperature environment. Subsequently, the low-temperature zone began to expand, with an earlier expansion onset correlating to larger deflector angles. At a 90° deflector angle, the lower roadway’s low-temperature zone started expanding at 105 h, with an initial SED of 3.20 m. The maximum expansion distances for the lower low-temperature zone in groups C11, C12, and C13 were 6.73 m, 5.27 m, and 5.11 m, respectively. After deflector installation, the cooling effect in the space behind the deflector significantly enhanced. When deflector angles were 30°, 60°, and 90°, the TEPL values were all lower than those of the C10 scheme (no deflector). While improving the delayed cooling effect in the lower roadway, the cooling amplitude in the upper roadway further increased. The TEPL decreased first and then increased with larger deflector angles, reaching the maximum cooling at a 30° deflector angle. At the end of pump operation on the first day, the TEPL values for schemes C10 (no deflector), C11 (30°), C12 (60°), and C13 (90°) were 32.16 °C, 29.99 °C, 31.01 °C, and 31.63 °C, respectively. By the end of pump operation on the third day, the cooling rate of TEPL continuously decreased with increasing deflector angles, with the C13 group showing only a 0.45 °C improvement compared to the C10 group. At a 30° deflector angle, after 120 h of system operation, the TEPL was 29.84 °C, indicating a significantly enhanced cooling effect compared to the setup without a deflector, with a total reduction increase of 2.35 °C by the end of the operation period. The cooling effect at the monitoring surface location improved with larger deflector angles. After deflector installation, the flow path of the low-temperature zone changed, leading to a further reduction in the average monitoring surface temperature (TEP). At the end of pump operation on the first day, the TEP values at the locations for groups C10, C11, C12, and C13 were 34.12 °C, 33.70 °C, 32.93 °C, and 32.37 °C, respectively. When the pump stopped on the fourth day, the temperature recovery was highest for the C10 group (no deflector) at 36.02 °C. By the end of the system operation period, the TEP reductions for the different groups were 5.95 °C, 6.37 °C, 7.13 °C, and 7.73 °C, respectively, demonstrating that the cooling effect strengthens with increasing deflector angles.
To further analyze the influence of the air deflector angle on the temperature field within the roadway space, spatial distribution nephograms of the roadway temperature field and bar charts showing the expansion of the lower low-temperature zone under different air deflector angle were generated based on numerical simulation results, as shown in
Figure 12.
During the fifth day of system operation, the roadway temperature gradually recovered after the pump stopped. The inhibitory effect on temperature recovery initially increased and then decreased with larger deflector angles. At a deflector angle of 90°, the cross-sectional distance of the low-temperature zone in the upper roadway was only 5.18 m. As pump operation time increased, the enhancement effect of the deflector structure on the expansion of the lower low-temperature zone first increased and then decreased with larger deflector angles, achieving optimal performance at 30°. The maximum expansion distance during the operation period was 6.73 m, representing a 48.89% increase compared to the configuration without a deflector (C10). Combined with
Figure 11, the deflector structure improved the delayed cooling effect in the lower section without weakening the cooling effect in the upper section, while further reducing the temperature in the space behind the deflector. At 108 h of operation, the expansion distances of the lower low-temperature zone for the different deflector schemes (C11, C12, C13) increased by 33.81%, 26.93%, and 30.09%, respectively. By 114 h, the expansion rate of the C12 group compared to the C13 group increased by 0.03 m per hour relative to the rate at 108 h. The expansion distance of the lower low-temperature zone for the C11 group was 6.14 m. At 119 h, the expansion distances of the lower low-temperature zone for all schemes reached their optimal values: 4.52 m, 6.73 m, 5.27 m, and 5.11 m, respectively. The enhancement effect of the deflector schemes on the expansion of the lower low-temperature zone was significantly superior to the configuration without a deflector. At 120 h, after the pump stopped, the roadway temperature partially recovered, but both the cooling effect and the ability to delay high-temperature recovery were better in the deflector-equipped groups than in the configuration without a deflector. Therefore, the influence of different deflector angles on the cooling effect can be summarized as follows: The cooling effect in the lower roadway section initially improves and then diminishes with increasing deflector angles but remains superior to the configuration without a deflector. The deflector structure not only effectively enhances cooling in the lower section and mitigates its delayed effect but also does not weaken the cooling effect in the upper section. Additionally, it significantly slows down the temperature recovery rate in the roadway after the pump stops.
In summary, the impact of the air deflector on the cooling system performance is as follows: The expansion effect of the lower low-temperature zone initially increases and then decreases with larger deflector angles. The average temperature on the monitoring line (TEPL) first decreases and then rises with increasing deflector angles, achieving optimal performance at 30°, with a 48.89% increase in the lower low-temperature zone expansion distance (SED) and a maximum temperature reduction of 2.35 °C. The overall cooling effect on the monitoring surface continuously improves with larger angles, reaching its optimum at 90° with a 30.3% enhancement in cooling value. The installation of a deflector effectively alters the airflow path, improves the delayed cooling effect in the lower section without compromising the upper section’s cooling performance, and significantly delays the overall temperature recovery rate in the roadway after the pump stops. Considering the comprehensive underground operating conditions, a 60° angle for the air deflector is determined to be optimal.
Based on the previous analysis of the impact of key installation and operation parameters—such as the annular tube radius ratio, the cascaded tube spacing, the composite phase change temperature, and the air deflector angle—on the cooling performance of the roadway cooling system, the optimal combination of key installation and operation parameters has been determined as follows: an annular tube radius ratio of 2:3, a cascaded tube spacing of 0.5 m, a composite phase change temperature of 25 °C, and an air deflector angle of 60°.
