Article

A Fully Integrated System: Sentinel-2, Electromagnetic Induction and Laboratory Analyses for Mapping Mediterranean Topsoil Variability

1
PhD School in Agricultural, Forest and Food Sciences, University of Basilicata, Via dell’Ateneo Lucano 10, 85100 Potenza, Italy
2
Course of Agriculture, Pharmacy Department, University of Salerno, Via Giovanni Paolo II, 132, 84084 Fisciano, Italy
*
Author to whom correspondence should be addressed.
Appl. Sci. 2025, 15(21), 11796; https://doi.org/10.3390/app152111796
Submission received: 8 October 2025 / Revised: 31 October 2025 / Accepted: 3 November 2025 / Published: 5 November 2025
(This article belongs to the Special Issue Innovative Remote Sensing Technologies in Precision Agriculture)

Abstract

The accurate characterisation of soil spatial variability is essential for the development of site-specific and sustainable agricultural practices. This study proposes an integrated methodology for effective soil mapping in Mediterranean environments. A preliminary agronomic context assessment (climate and pedology) was followed by electromagnetic induction (EMI) surveying at 14, 7 and 3 kHz. EMI data were processed by ordinary kriging to model spatial structure; the 14 kHz conductivity map—resulting from the frequency most sensitive to topsoil characteristics—was adopted to guide subsequent analysis. Sentinel-2 imagery acquired under bare-soil conditions was screened using the Bare Soil Index (BSI) to confirm vegetation absence, then processed to derive the Clay Index (CI). Guided by the 14 kHz kriged surface, twelve sampling points were selected with ESAP to capture both homogeneous zones and areas of maximum variability. Soil was sampled at 30 cm and analysed for texture, pH, electrical conductivity (ECe) and carbon fractions. CI correlated strongly with apparent electrical conductivity (ECa) (R2 = 0.76; r = 0.87) and showed significant relationships with clay (R2 = 0.69; r = 0.83). The proposed approach provides a robust and scalable alternative to conventional soil mapping, turning routine proximal and satellite data into decision-ready layers for site-specific management.

1. Introduction

In Mediterranean agroecosystems, soils exhibit pronounced heterogeneity even across short spatial scales, arising from the interaction of complex geology, diverse topography and long-term human activity. Contrasting lithologies, such as limestone, marls and sandstones, result in a mosaic of soil types occurring in close proximity, as reported in northeast Tunisia where Regosols, Cambisols and Vertisols co-occur [1].
This intrinsic pedological complexity has been further shaped by millennia of cultivation, terracing, irrigation and amendments, while the fragmented structure of smallholder farming introduces additional variability through heterogeneous crop rotations and management practices under comparable climatic conditions [2]. Uneven water availability, driven by irregular rainfall and irrigation schedules, reinforces fine-scale gradients in soil moisture and salinity. As a result, Mediterranean dryland farming systems often present a patchwork of soil conditions, underscoring the critical need for high-resolution soil information, particularly in countries such as Italy where fields are typically small, steep and intensively managed.
The performance of crops, soil water dynamics and nutrient availability are all tightly linked to the spatial variability of soil properties. Variations in texture, structure and fertility even within a single field can lead to uneven crop growth and inefficient resource use. It is therefore crucial to understand and map this heterogeneity in order to implement site-specific management practices that optimise inputs and minimises environmental impacts [3].
Metwally et al., 2019 carried out a study using fuzzy clustering to delineate management zones in a hilly Chinese field and showed that adjusting practices to soil variability significantly improved resource utilisation [4]. Similarly, a study of 364 small farms in Greece found that differences in crops and cultivation practices at the sub-field scale greatly increased soil property variability [2]. In general, customised soil management based on high-resolution information is essential for improving yields and sustainability on heterogeneous farmland [3].
Conventional soil mapping—based on dense ground sampling and laboratory analyses—is prohibitively time-consuming and expensive for use at farm scale. Traditional soil surveys can take years to classify soils over a county, and they lack the resolution to capture intra-field variability relevant to precision agriculture.
Digital soil mapping techniques offer a solution by integrating easily obtained covariate data (such as remote sensing images or proximal sensor readings) to predict soil attributes continuously in space [3]. In recent years, remote sensing approaches have shown particular promise for rapid topsoil characterization. Multispectral satellite imagery (e.g., Sentinel-2) can provide spatially detailed proxies for surface soil properties across entire fields at metre-level resolution [1]. By focusing on periods when fields are bare, researchers extract soil reflectance signals that relate to topsoil parameters like texture, organic matter and mineral composition [5].
For example, absorption features in the short-wave infrared (around 2200 nm) are indicative of clay mineral content and several spectral indices have been developed to exploit this (such as the Simple Ratio Clay Index and Normalized Difference Clay Index) [1]. Using such indices, Sentinel-2 data was successfully used to map topsoil clay fractions and organic carbon in croplands [1,5]. It was demonstrated that Sentinel-2 imagery could predict common topsoil properties, like texture and carbon, in temperate and Mediterranean fields with reasonable accuracy when calibrated against field samples [5]. Likewise, it was shown that fusing multispectral images from multiple satellites improved clay content mapping in Tunisian soils, highlighting the value of spectral data for quantifying soil mineralogy [1]. Recent studies also investigated the use of Sentinel-2 spectral indices to estimate soil electrical properties, demonstrating that multispectral satellite data can effectively reproduce field-measured resistivity patterns in agricultural environments [6]. These studies underscore that “distal” sensors (satellites) can be a cost-effective source of high-resolution soil information, effectively replacing many physical samples with spectral predictors.
In parallel, proximal sensing technologies have been increasingly adopted to map subsurface soil variation. One widely used technique is electromagnetic induction (EMI) sensing, which measures the apparent electrical conductivity (ECa) of the soil without direct contact. ECa is an integrative property that correlates with several key soil attributes—notably texture (clay content), moisture content, salinity and bulk density [7].
In non-saline soils, variation in ECa is primarily controlled by soil water content, clay percentage and ionic concentration (related to Cation Exchange Capacity—CEC) [8]. Thus, EMI sensors can reveal spatial patterns in soil water holding capacity, compaction and fertility. Modern multi-coil EMI instruments allow simultaneous mapping of different effective depths, yielding a 3D view of soil electrical properties. The method has proven its worth in agriculture: for instance, a study reported that dense EMI surveys in Portuguese pastures captured the texture and moisture differences that affect pasture productivity, enabling the delineation of homogeneous management zones [8]. One advantage of EMI mapping is the ability to cover a field rapidly (often several hectares per hour) by towing the sensor on a sled or All-Terrain Vehicle (ATV), collecting georeferenced readings continuously.
These proximal measurements complement remote sensing by sensing deeper soil layers and properties that spectral indices might miss, like subsoil compaction or salinity. In this perspective, recent advances in low-cost sensing solutions, such as smartphone-based LiDAR and photogrammetry, have shown promising accuracy and operational applicability in hazelnut orchards [9]. These tools can be considered as complementary to both proximal and remote sensing workflows, facilitating integrated soil–plant monitoring at farm scale.
Both remote and proximal sensing approaches have been validated individually in agriculture and environmental studies, yet their integrated use remains relatively underexplored—especially in Mediterranean cropping systems. Most combined sensing studies so far have focused on other environments. In forestry and natural landscapes, researchers have begun to merge EMI with remote imagery to predict soil properties under tree canopies. For example, a recent study applied Sentinel-2 data and machine learning to successfully map soil conductivity in Japanese forests, demonstrating the synergy of “distal” and “proximal” data sources [10]. In tropical regions, where intense weathering and different clay minerals prevail, a few studies have likewise employed EMI alongside satellite indices to characterise soil variation. For instance, one study combined electromagnetic conductivity mapping with high-resolution imagery to study soil variation in teak plantations vs. native tropical forest, contexts which are quite distinct from Mediterranean drylands [11]. These examples indicate the potential benefits of sensor fusion, but for Mediterranean farmlands the literature is sparse. To date, only isolated cases exist (often focusing on a single index like NDVI for crop cover [11]). Few studies have integrated multi-sensor soil data with laboratory validation in our region to develop operational, reproducible soil mapping frameworks for farmers.
This work addresses current gaps by proposing and testing an integrated methodology for high-resolution soil mapping in a Mediterranean agricultural area. Sentinel-2 multispectral imagery—specifically a clay-sensitive index—is combined with multi-frequency electromagnetic induction surveys and laboratory analyses of soil samples. The study area in southern Italy provides a representative testbed of Mediterranean dryland conditions (calcareous soils and water-limited climate).
The objective is to evaluate the reliability of this sensor fusion in capturing mineral components of the topsoil. Remote and proximal sensor data are calibrated against ground-truth measurements to develop predictive models for key soil properties across the field. The practical applicability of the approach is assessed for delineating farmer-relevant management zones (for instance, areas with higher clay and organic matter that may retain more moisture versus lighter soils requiring different inputs).
In this way, the study contributes an operational workflow for soil mapping that leverages free satellite data and on-the-go proximal sensing, supporting technicians and producers in adopting data-driven soil management towards more sustainable and precise agriculture in Mediterranean environments.

2. Materials and Methods

2.1. Experimental Design

All activities were conducted during the bare-soil period to ensure optimal conditions for remote and proximal sensing. An initial characterisation of the agronomic context was performed, including climatic and pedological analyses. The overall workflow is outlined in Figure 1. Electromagnetic induction measurements were carried out with a multi-frequency HSSI EMP-400 profiler (Geophysical Survey Systems Inc., GSSI, Nashua, NH, USA) at three frequencies (14, 7 and 3 kHz) to investigate vertical soil homogeneity and identify subsurface patterns. These data supported the evaluation of surface soil variability via Sentinel-2 imagery, processed to calculate the Bare Soil Index (BSI) and the Clay Index (CI). In addition, Sentinel-1 radar backscatter (VV–VH difference) was analysed to assess potential effects of surface moisture and seasonal variability on the EMI measurements. Based on the spatial structure of EMI-derived apparent electrical conductivity (ECa), the free ESAP procedure was applied to identify 12 sampling sites, capturing both homogeneous and heterogeneous zones. Soil samples were collected at 30 cm depth and analysed for texture, pH, salinity, (ECe) and carbon fractions. Data were quality-controlled using the three-sigma rule and statistical analyses—including correlation analysis, principal component analysis (PCA) and regression modelling—were conducted in R (v 4.4.1, R Core Team, Vienna, Austria) to assess the relationships between ECa, pedological traits and spectral index.

2.2. Study Area

2.2.1. Geographical and Agronomic Context

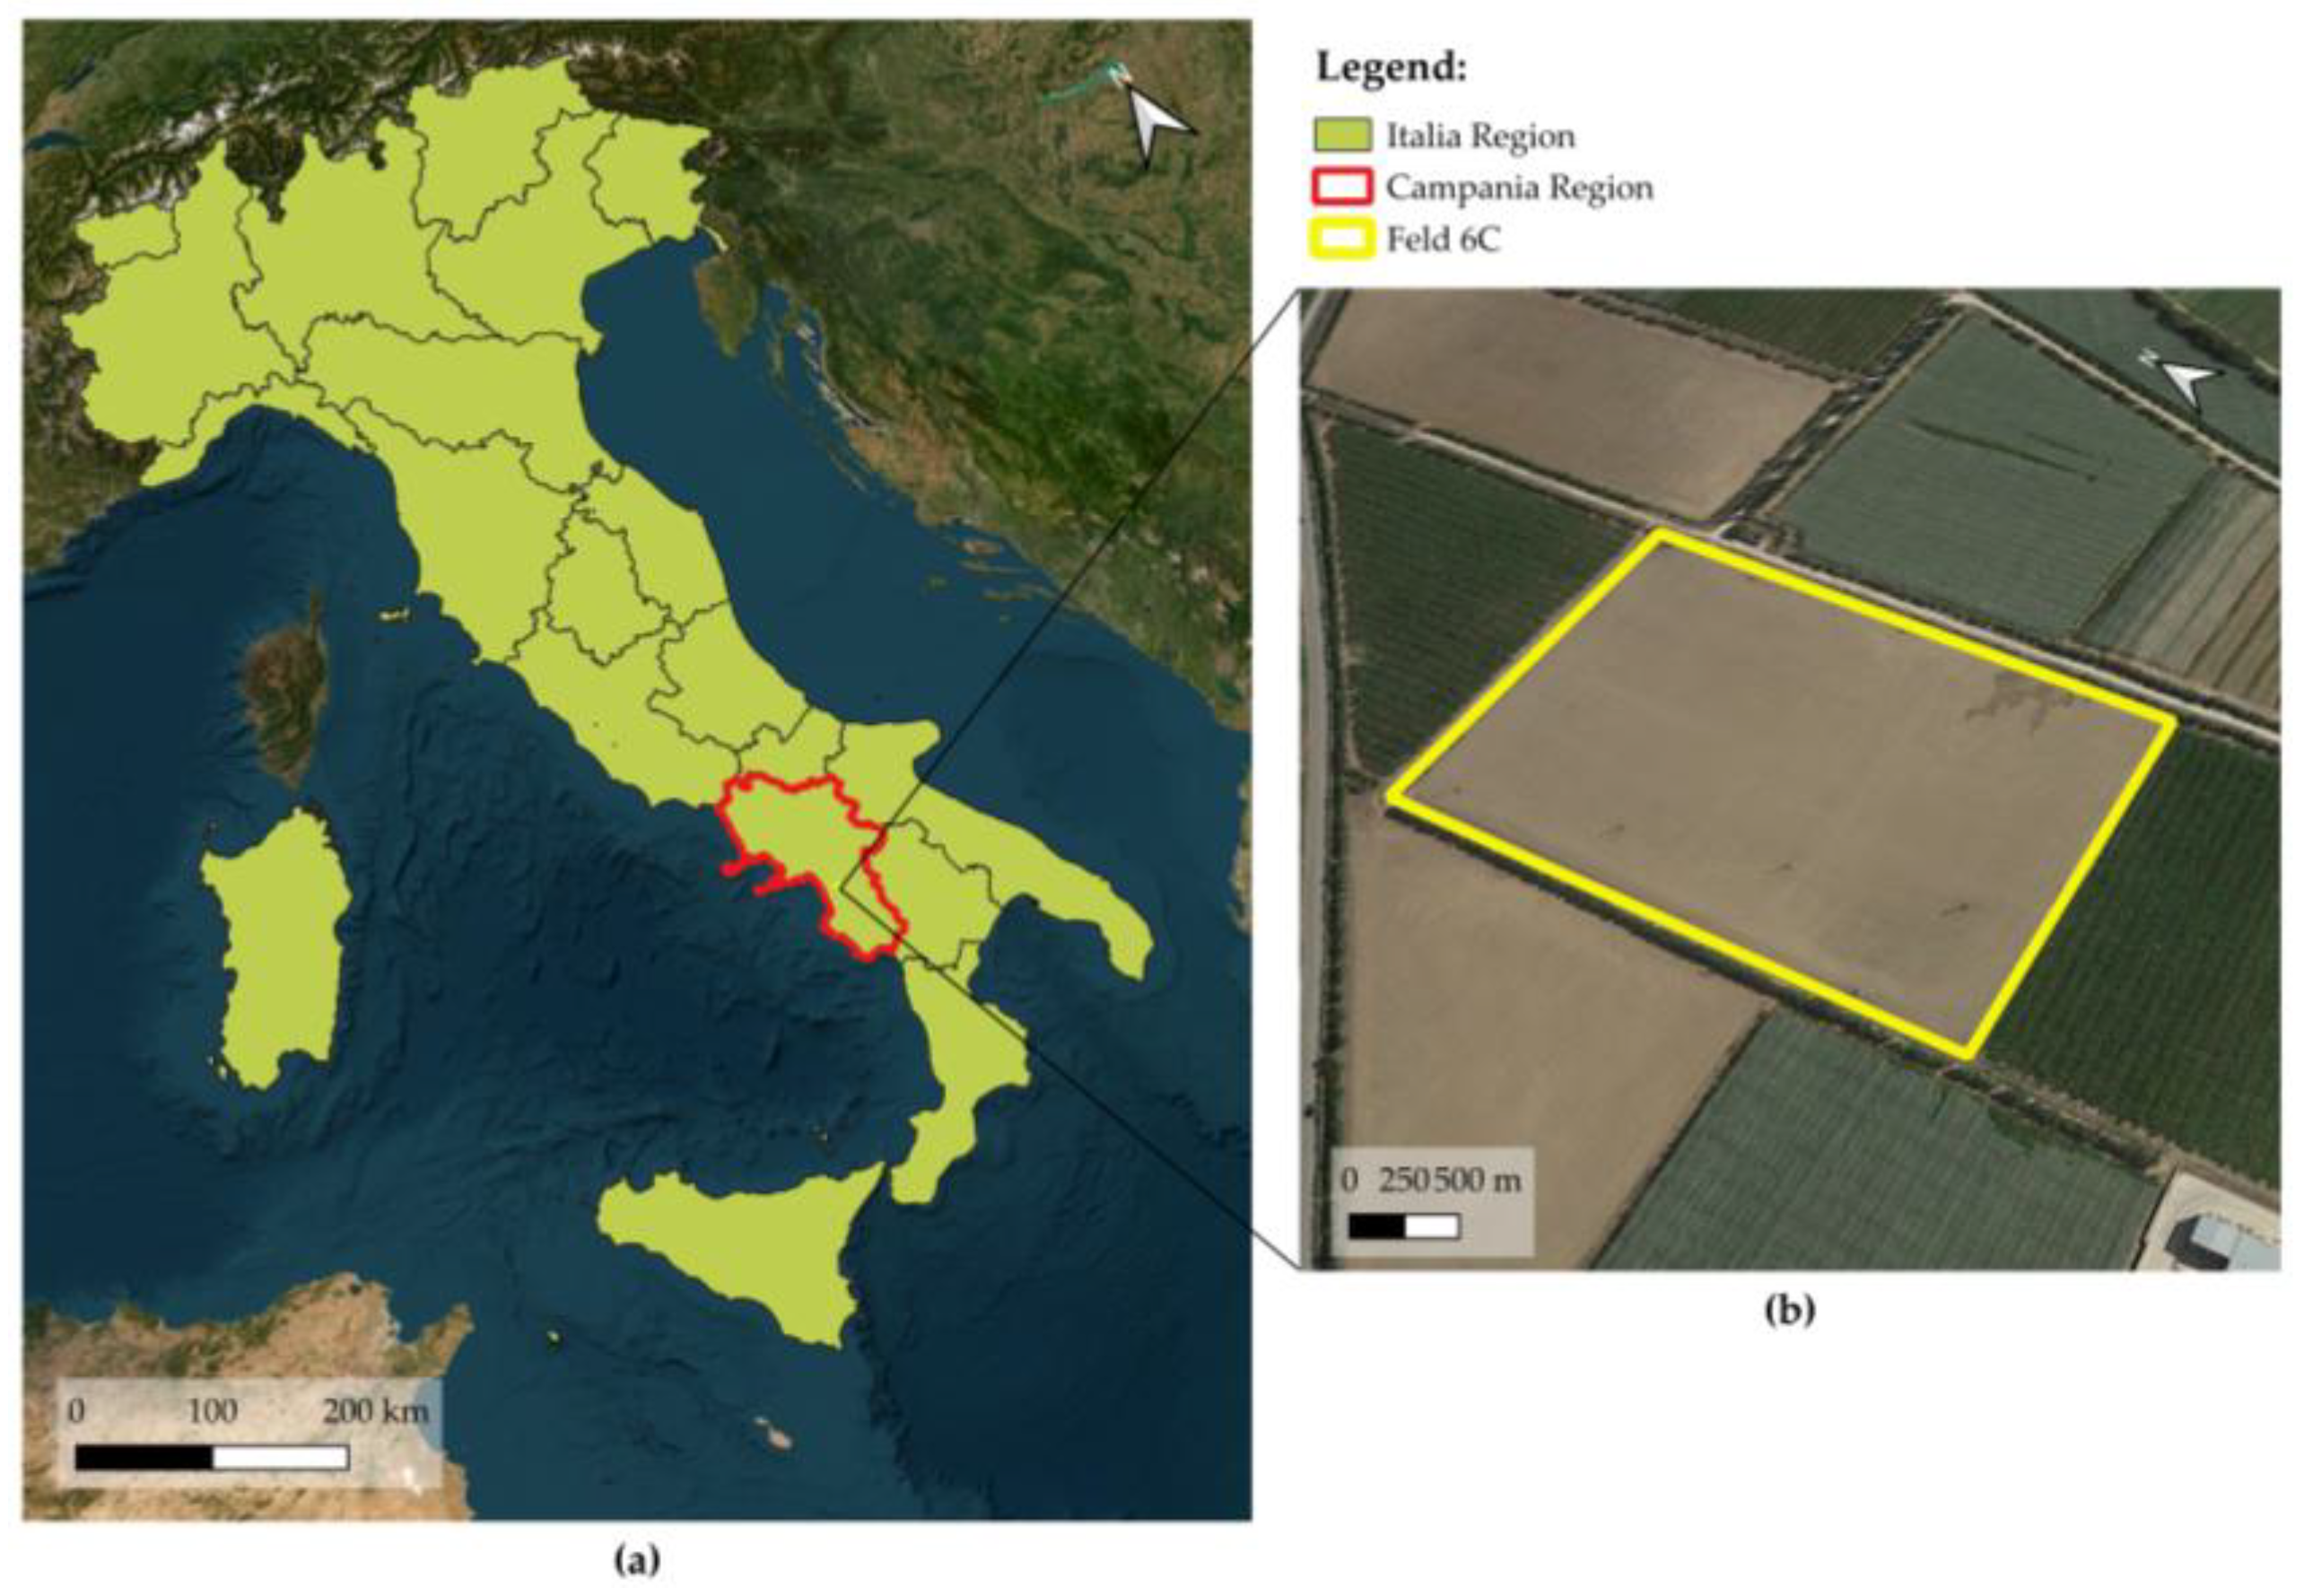
The research was conducted in the Sele Plain, a coastal alluvial basin in southern Italy (Campania region) that represents one of the most important agricultural districts of the Mediterranean. The area is intensively cultivated with fruit and vegetable crops and is characterised by high soil heterogeneity, largely shaped by long-term agricultural exploitation, sedimentary dynamics and irrigation practices. At the national and regional scale, the experimental site is located in the municipality of Eboli (Salerno province), as shown in Figure 2. The map was produced in QGIS (v 3.40.4, QGIS.ORG Association, Böschacherstrasse 10a, CH-8624 Grüt (Gossau ZH) Switzerland) using ISTAT vector files (shapefile format) available for public consultation and includes the georeferencing of field 6C. The field is situated at latitude 40°35′08″ N and longitude 15°03′54″ E, with an average elevation of 54 m a.s.l. and extends over approximately 2.5 ha.

2.2.2. Climate

The study area is characterised by a typical Mediterranean climate (Köppen classification Csa), with hot, dry summers and mild, wet winters. According to long-term climatic datasets, the average annual temperature in Eboli is approximately 15.2 °C, generally ranging between 5 °C and 33 °C, and only rarely falling below 1 °C or exceeding 36 °C [12]. Annual precipitation in the Sele plain, including Eboli, generally ranges between 800 and 1100 mm [13]. These climatic features confirm the marked seasonality typical of Mediterranean environments, with abundant rainfall in autumn and winter contrasting with hot and dry summers.
To provide a more detailed and up-to-date characterisation, climate data from the Eboli (SA) monitoring station (40°33′13.33″ N, 14°58′49.81″ E) were retrieved from the Agrometeo Campania portal [14] and analysed for the period 2019–2024. Data processing was performed in Python (v 3.12.1, Python Software Foundation, Wilmington, DE, USA), following ISPRA guidelines for climate indices.
Cleaning procedures included the generation of a continuous daily timeline to prevent temporal gaps, the removal of anomalous values using the Interquartile Range (IQR) method, the correction of impossible records (e.g., Tmin < −40 °C or Tmax > 50 °C) and the replacement of missing data with seasonal averages.
Internal consistency was verified by ensuring Tmax > Tmed > Tmin for each day. From the reconstructed dataset, several indices were calculated, including frost days (Tmin ≤ 0 °C), summer days (Tmax > 25 °C), hot days (Tmax > 35 °C), tropical nights (Tmin > 20 °C), cumulative precipitation, maximum, average and minimum temperatures. These indices are summarised in Table 1. A concise Python code excerpt illustrating the data cleaning and index computation workflow is reported in Appendix A for reproducibility.
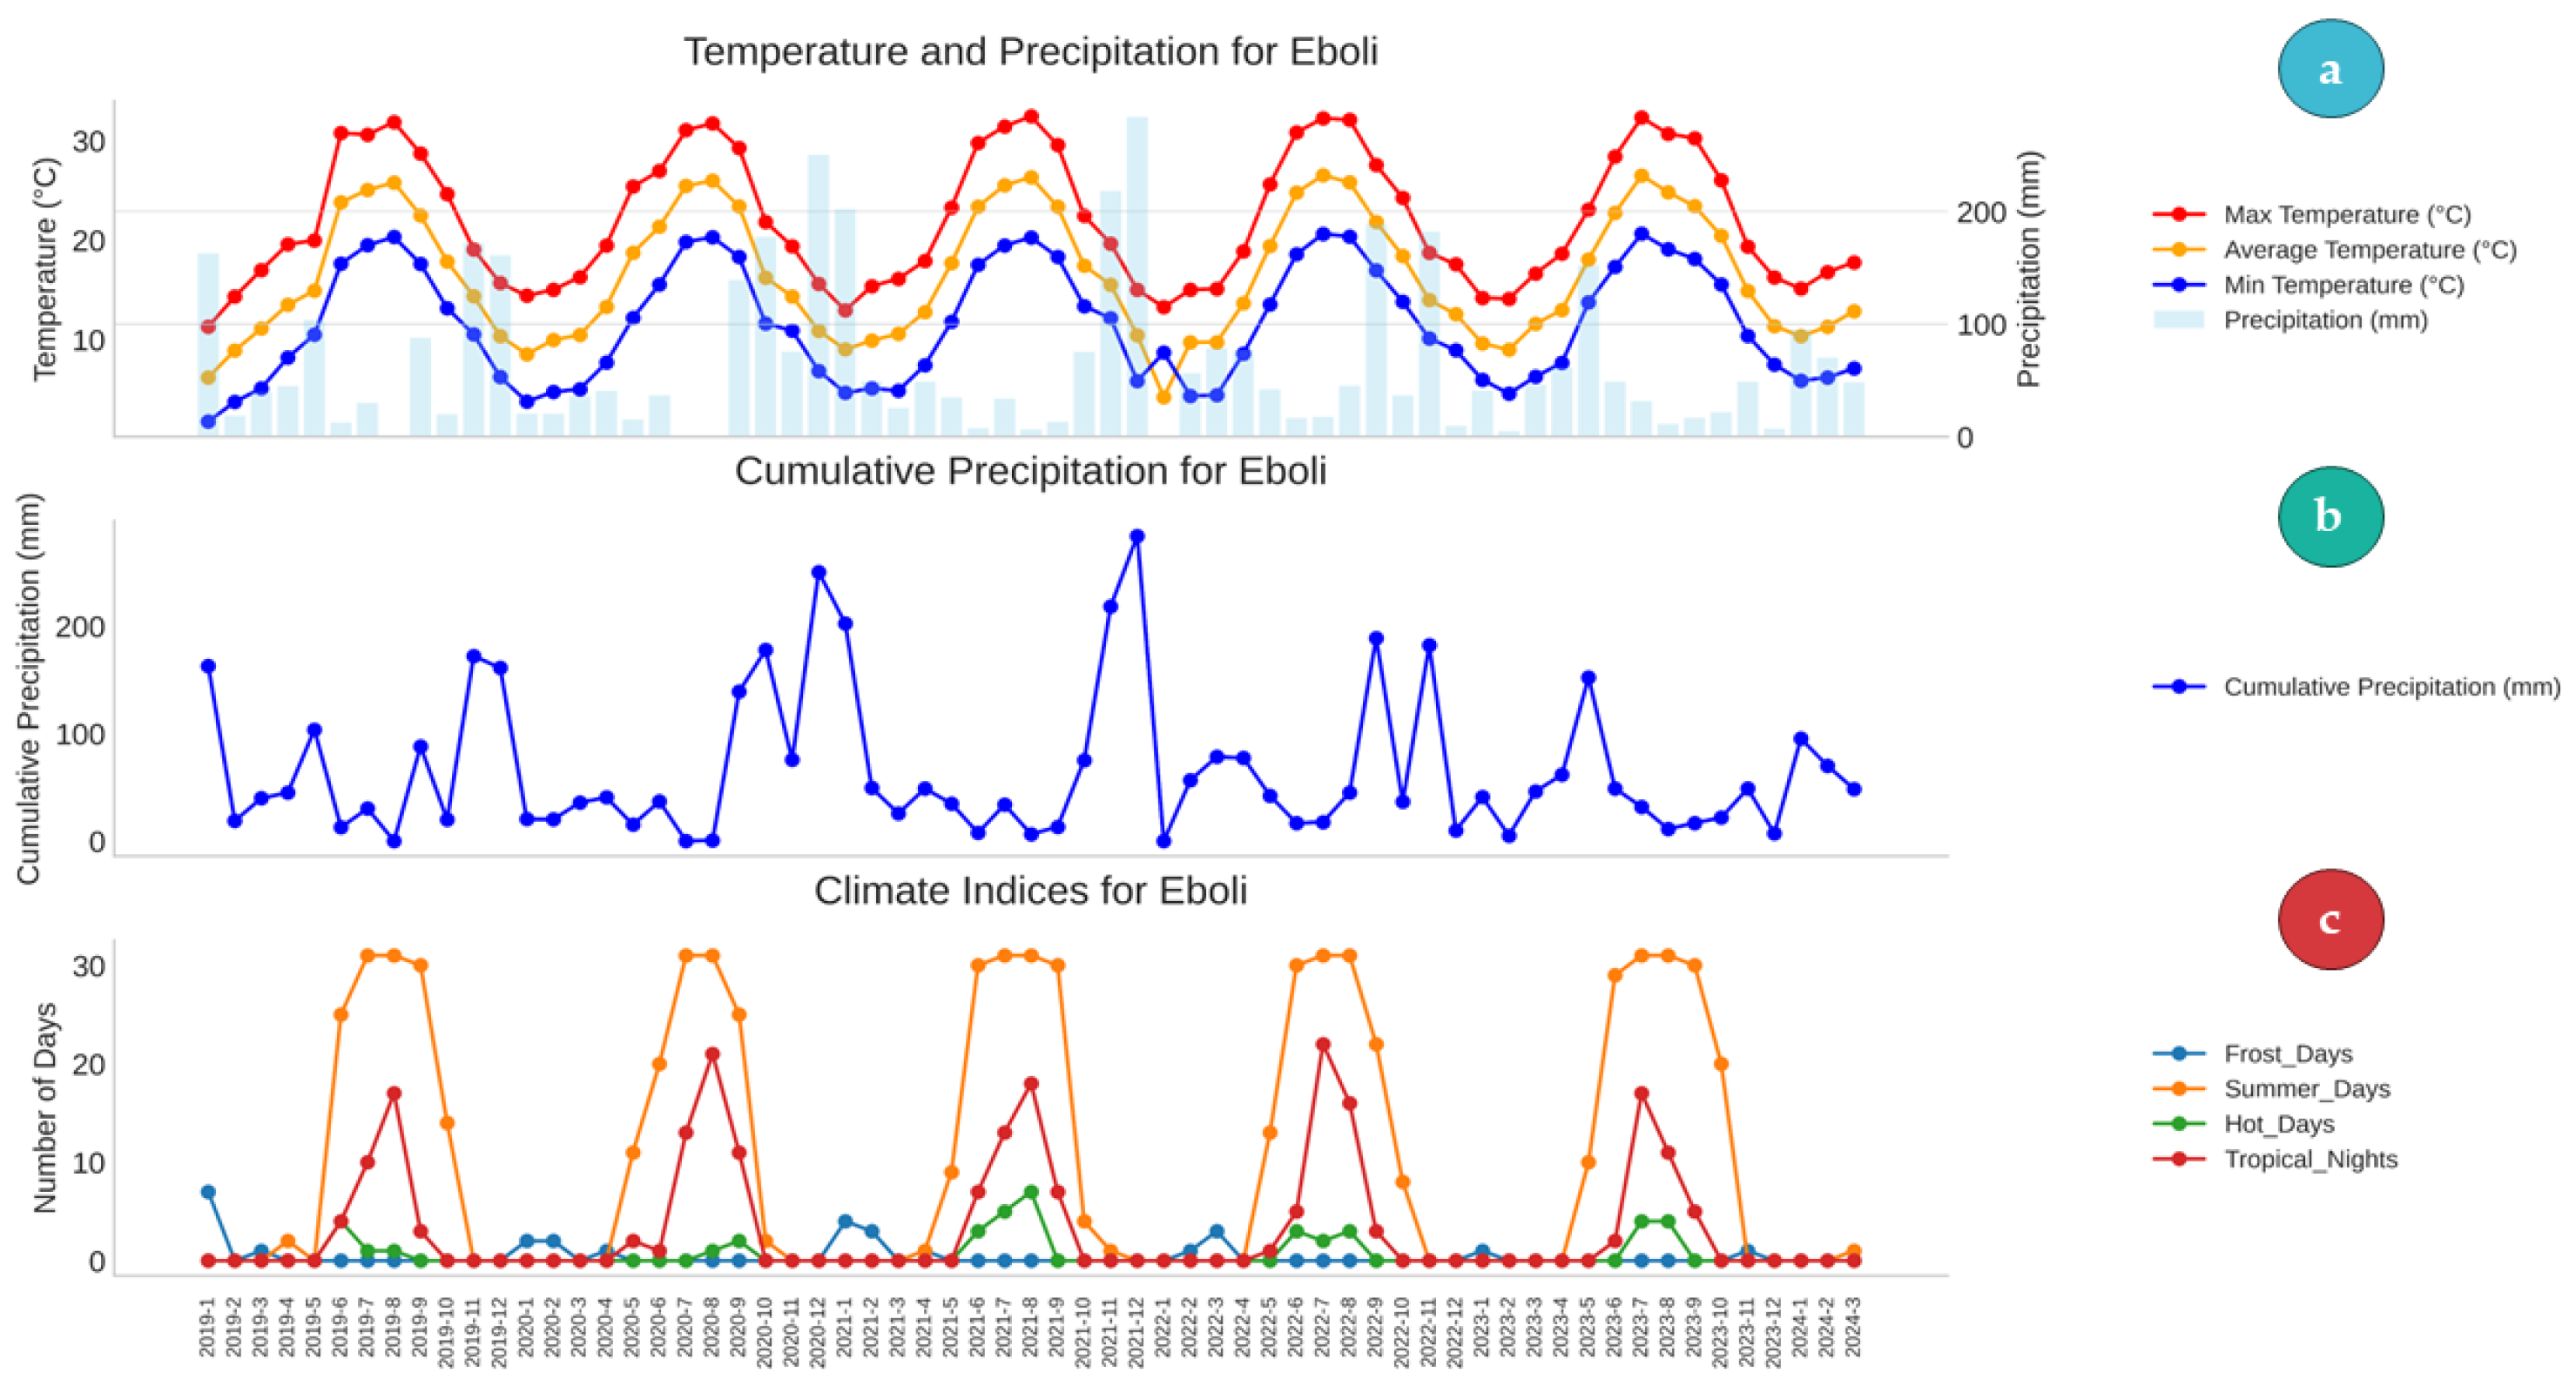
The results were visualised through line and scatter plots, illustrating seasonal cycles and interannual variability (Figure 3).
Figure 3a illustrated the seasonal cycle of maximum, average and minimum daily temperatures (Tmax, Tmed, Tmin) and corresponding monthly precipitation, represented by blue bars, showing the typical Mediterranean climatic pattern with warm and dry summers and mild, rainy winters, as well as a tendency towards increased summer heat extremes.
Figure 3b presents cumulative monthly precipitation, which reveals marked irregularity, alternating intense rainfall events with drought periods.
Figure 3c shows the monthly distribution of frost days, summer days, hot days and tropical nights, highlighting the predominance of frost days in winter and the increasing frequency of hot days and tropical nights in recent summers.
Overall, the comparison between long-term climatic reconstructions and the recent dataset (2019–2024) indicates that the area maintains the typical Mediterranean climatic regime, though with a tendency towards more frequent summer heat extremes and irregular rainfall distribution.
These trends underline the importance of targeted water management and adaptive agricultural strategies to mitigate the impacts of climate variability.

2.2.3. Soil Characteristics

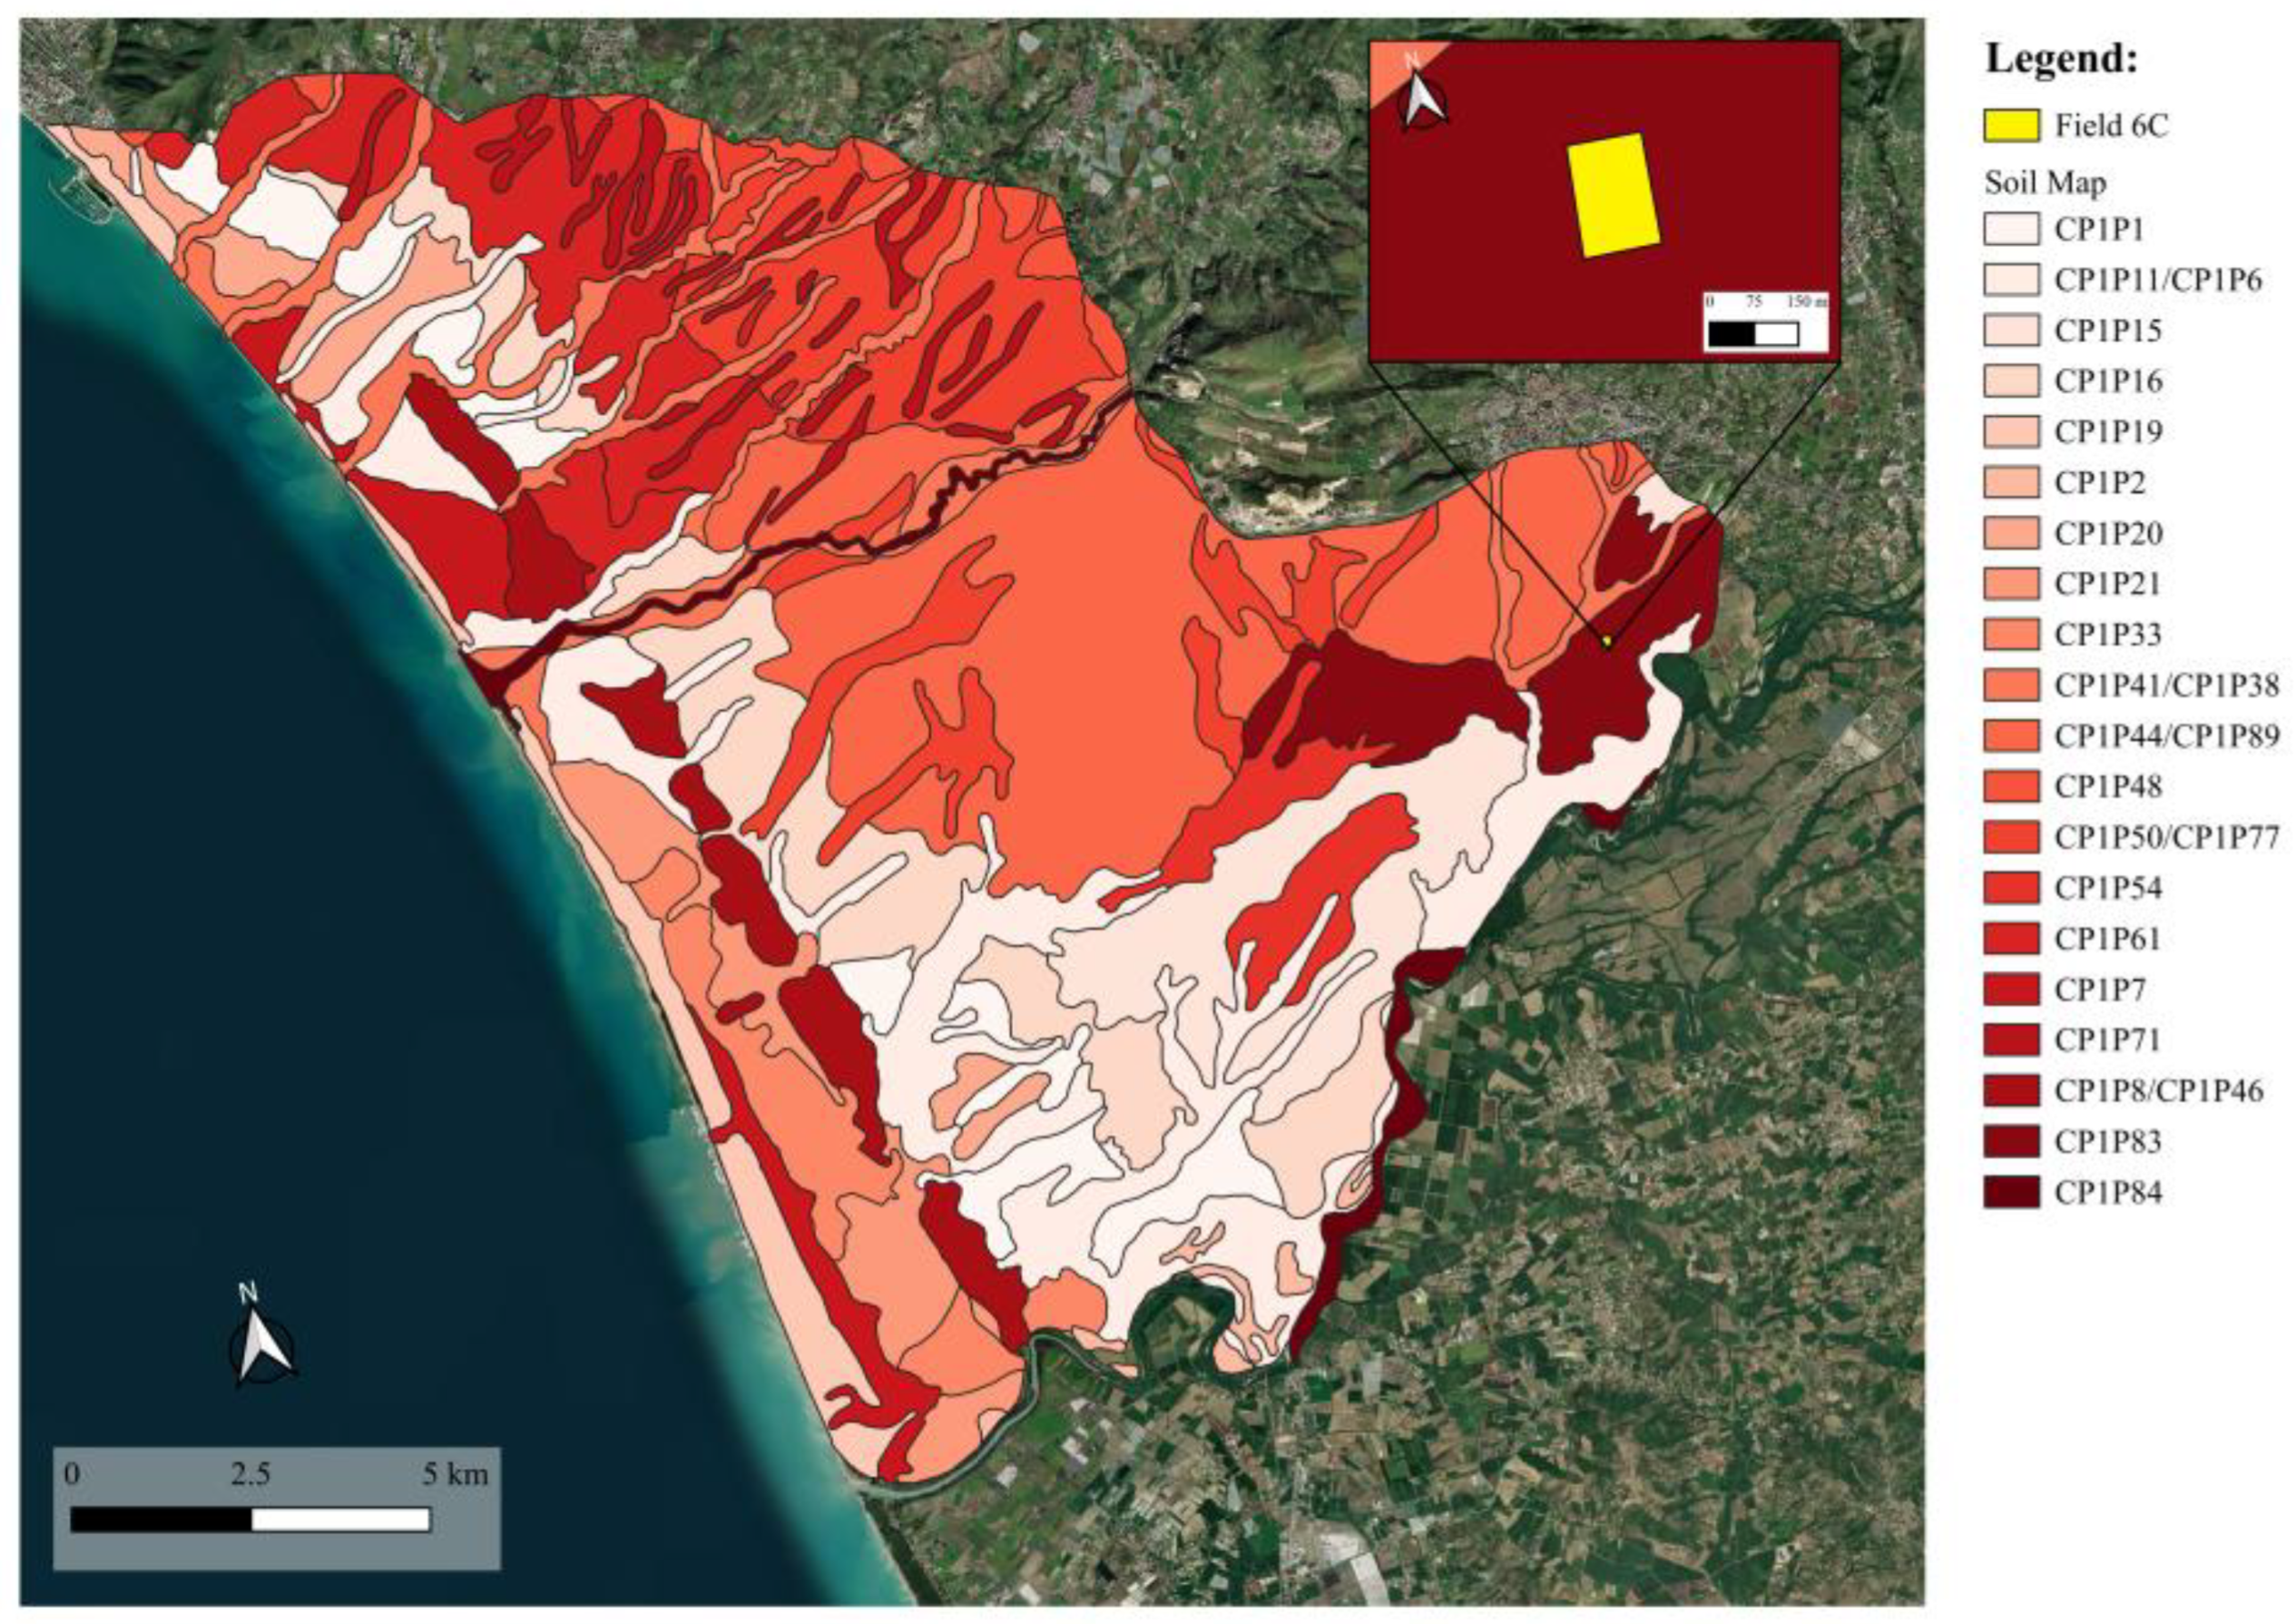
A preliminary characterisation of soil variability was carried out using QGIS on the Soil Map of the Sele plain (scale 1:50,000) provided by the Campania Region [15] (Figure 4). This map, which represents the right bank of the Sele river, served as a reference for subsequent analyses conducted with EMI technology and Sentinel-2 satellite imagery.
The Soil Map describes the distribution and classification of soils within homogeneous pedolandscapes, providing essential information on their taxonomic and morphological features.
Field 6C lies within the soil-mapping unit KIW0 (“Kiwi Sud”) and is represented by the pedological profile CP1P83, which comprises three depth intervals (Table 2 and Table 3). Soil is clayey and classified according to IUSS WRB as Pachic Phaeozem.
The surface horizon (0–30 cm) has a clay-loam texture, light olive brown colour, subangular blocky structure, abundant CaCO3, alkaline pH (8.6) and high resistance and plasticity.
The subsurface horizon (30–85 cm) maintains a clay-loam texture, with colours ranging from light olive brown to greyish brown, medium subangular blocky structure, carbonate accumulations, common fine tubular macropores and pH 8.2.
The deepest horizon (85–150 cm) shows a loam texture, yellowish brown to light olive brown colour, medium subangular blocky structure, organic coatings on aggregates, frequent carbonate concentrations and alkaline pH (8.1).
Across all horizons, the soil is resistant, moderately adhesive and strongly calcareous, conditions that limit both drainage and rooting depth.
These data were used solely to contextualise the pedological setting.

2.3. Methods

2.3.1. Proximal Sensing: Electromagnetic Induction (EMI) Survey

Electromagnetic induction (EMI) is a non-invasive geophysical technique widely used in precision agriculture and soil science for rapid mapping of subsurface properties. The system operates by inducing currents in the ground through a transmitting coil and measuring the resultant secondary magnetic field using a receiving coil. This secondary field is typically decomposed into two components: the in-phase component, which is sensitive to magnetic susceptibility and buried metallic objects, and the quadrature component, which is approximately proportional to the apparent electrical conductivity (ECa) of the soil. The latter is especially informative for assessing soil texture, moisture content and salinity at field scale [16,17,18].
In addition to classical references, further studies have demonstrated the capacity of EMI surveys to characterise agricultural soils under different management contexts, strengthening its role as a proximal integrator of texture and salinity [17]. In this study, data were collected using the multi-frequency EMI sensor (GSSI Profiler EMP-400) operating in the range of 1–16 kHz.
The instrument records both in-phase and quadrature responses, allows vertical or horizontal dipole configurations and integrates a WAAS-enabled GNSS receiver via Bluetooth for real-time georeferencing under field conditions [19,20].
EMI Data Acquisition
Before field deployment, the instrument underwent a diagnostic check and a short warm-up phase to ensure the stabilisation of the sensor coils; a static null reading was taken over a metal-free area to confirm baseline accuracy.
The EMI survey was conducted during the bare-soil phase preceding the planting of the Tango © mandarin orchard, when the field was free of vegetation.
Before data collection, weather conditions were verified to ensure the absence of rainfall in the preceding day and to select a suitable acquisition window. According to daily meteorological data from the Eboli station (ISPRA network, 2019–2024), total rainfall in the first week of April 2020 was only 2.6 mm, with no precipitation recorded in the four days preceding the survey. Cumulative rainfall in the ten days prior to acquisition was below 10 mm, confirming dry, bare-soil conditions typical of early spring in Mediterranean area.
Measurements were taken in the warm morning hours to account for residual nocturnal moisture while avoiding excessive surface heating later in the day. Under these conditions, apparent electrical conductivity (ECa) reliably reflected intrinsic soil properties—mainly texture and salinity—without interference.
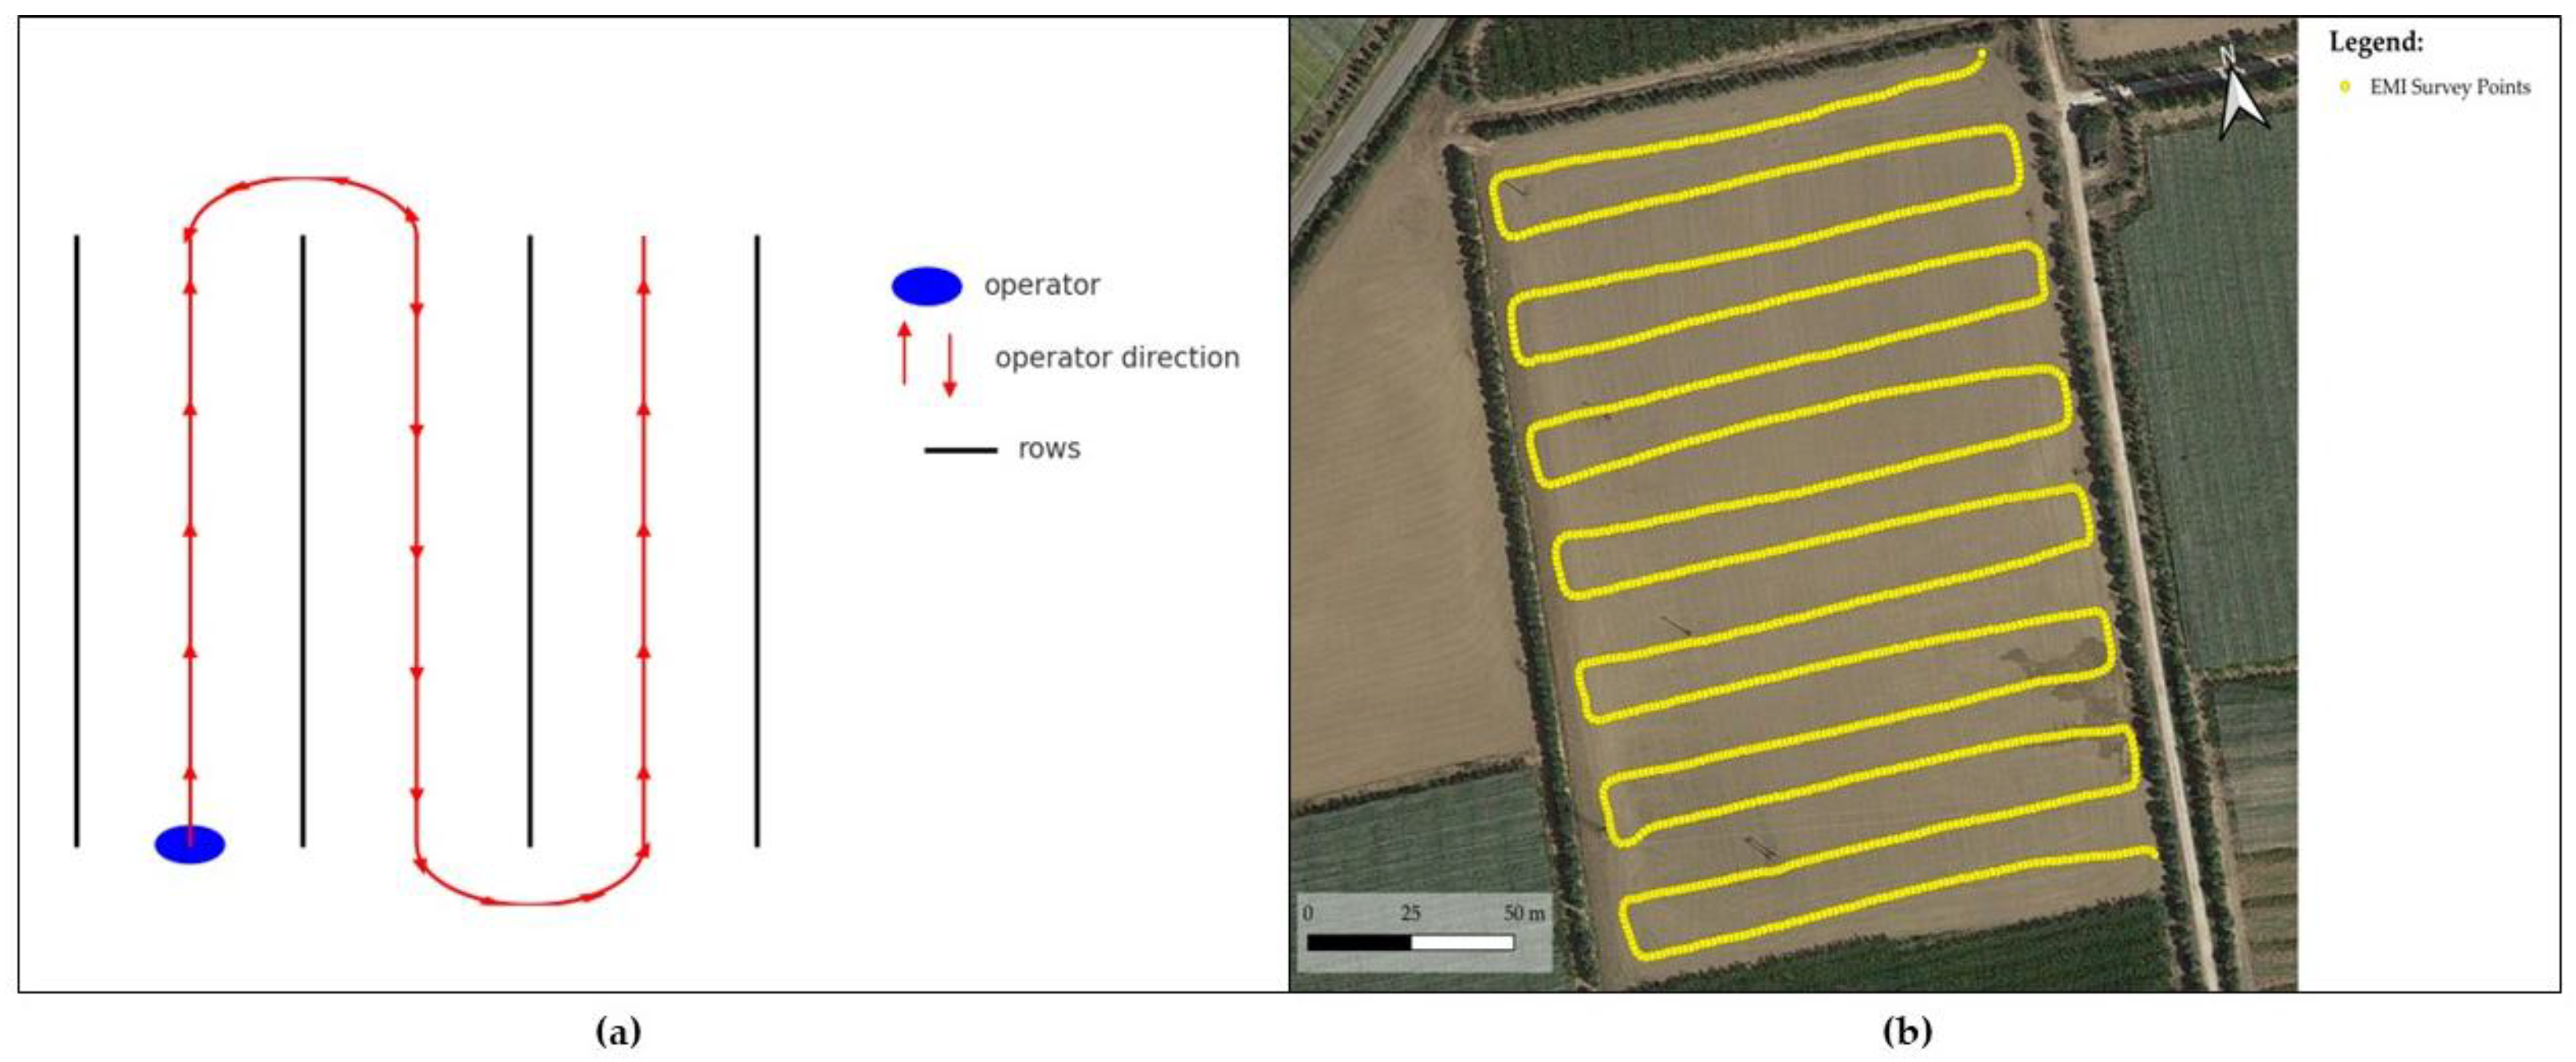
Data were collected by walking along parallel transects on a predefined grid layout to ensure full spatial coverage (Figure 5a,b).
The EMP-400 was operated in vertical dipole mode (VDM) at three selected frequencies: 14, 7 and 3 kHz. These frequencies probe progressively deeper soil horizons—higher frequencies emphasise shallower layers and lower ones penetrate more deeply—according to the induction number and bulk conductivity [16,21].
The instrument was held at approximately 20 cm above ground level; acquisition was performed at 4–5 km h−1 with a 0.75 s logging interval. A total of 3158 measurements were recorded across ~2.5 ha, yielding an average density of ≈1260 points ha−1. All measurements followed the complete calibration protocol recommended by the manufacturer, including both field and operator calibration. The system maintained a stable signal baseline through continuous internal calibration routines [19]. Under standard low-induction-number configurations, signal repeatability typically falls within ±2 ppm for both in-phase and quadrature components. Based on published evaluations of frequency-domain EMI systems, the practical resolution of the EMP-400 is approximately 1 mS m−1, while effective sensitivity in field conditions may be influenced by electrical noise and zero-level drift.
In the present study, all manufacturer-recommended calibration routines were performed, and internal compensation systems were active during data acquisition; therefore, a conservative per-reading instrumental uncertainty of ±1–2 mS m−1 was assumed, consistent with the nominal resolution and published drift-correction analyses [22].
EMI Data Processing
The raw EMI data were initially processed using MagMap2000 (version 4.86, Geophysical Survey Systems Inc., Nashua, NH, USA), the proprietary software for managing and exporting Profiler EMP-400 data.
Initial quality control included inspection of calibration status, removal of spurious readings and export to plain-text format for GIS-based processing. As a preliminary step, the georeferenced EMI survey points were visualised in QGIS to verify spatial distribution and alignment with field boundaries, as illustrated in Figure 5b.
Processed data were analysed in QGIS using the Smart-Map plugin, which supports semivariogram generation and spatial interpolation via ordinary kriging (OK) [23,24]. OK was applied on a 10 × 10 m output grid to match the spatial resolution of Sentinel-2 imagery. A custom workflow in the QGIS Model Designer comprised the creation of square grid polygons, point-to-polygon joins and cell-based aggregation of ECa values. Final ECa rasters for each frequency were generated from the quadrature component, with all values expressed in mS m−1.

2.3.2. Soil Sampling and Laboratory Analyses

To characterise spatial soil heterogeneity, a sampling strategy was designed using the free ESAP-RSSD (v 2.35R, USDA Agricultural Research Service—George E. Brown, Jr. Salinity Laboratory, Riverside, CA, USA) software applied to the georeferenced EMI dataset. The 14 kHz apparent electrical conductivity was chosen as the ancillary variable for optimisation due to its sensitivity to the upper soil horizon, and the data were centred and scaled prior to analysis.
The design, computed with a minimum inter-site spacing constraint to prevent clustering, identified twelve optimal locations providing maximum coverage of the observed ECa range and distribution [25,26].
The single analytical unit consisted of a composite sample obtained from three subsamples collected at 30 cm depth, positioned at the vertices of an equilateral triangle inscribed within a circle of 2 m radius. This sampling depth was selected as it corresponds to the principal rooting zone of most Mediterranean crops, where the majority of water uptake and nutrient exchanges occur, and where soil salinity and textural variations have the greatest agronomic relevance. This depth was selected to ensure comparability with the shallow-sensitivity EMI channel, which was adopted as the reference layer for integrating laboratory measurements with geophysical and satellite-derived data.
Composite soil samples were air-dried overnight and subsequently sieved to 2 mm, thereby separating the coarse fraction (>2 mm) from the fine fraction (<2 mm). All laboratory determinations were performed on the fine fraction.
Soil pH and electrical conductivity (ECe) were measured in soil–water suspensions (1:1, w/v) after 15 min of mechanical stirring followed by 10 min of centrifugation. Total organic carbon (TOC) content was determined by dichromate oxidation according to the Walkley and Black procedure. Organic matter (OM) content was estimated from TOC by applying the Van Bemmelen conversion factor (OM = TOC × 1.724) [27].
Soil texture was determined after chemical dispersion with sodium hexametaphosphate (SHMP) and anhydrous sodium carbonate (Na2CO3), followed by particle-size separation and quantification [28]. Laboratory results were then used to validate and calibrate the geophysical and remote-sensing data.

2.3.3. Moisture Influence and Correction of EMI Data

To evaluate the potential influence of near-surface soil moisture on apparent electrical conductivity (ECa) measurements, Sentinel-1 C-band synthetic aperture radar (SAR) data were processed and analysed in QGIS as an independent proxy of surface wetness. The analysis employed imagery acquired by the Sentinel-1A platform in Interferometric Wide (IW) swath mode and dual polarization (VV and VH), processed at Ground Range Detected (GRD) level and distributed through the Copernicus Open Access Hub.
The Level-1 GRD product provided gamma0 backscatter coefficients (σ0, in decibels) at 10 m spatial resolution, ensuring consistent coverage of the study area under surface conditions comparable to those of the EMI survey. The difference between co-polarized (VV) and cross-polarized (VH) backscatter coefficients (VV–VH, in dB) was adopted as a proxy for surface soil moisture, where lower VV–VH values correspond to wetter surfaces due to stronger depolarization effects. This index has been widely used in soil moisture retrieval studies as it enhances the sensitivity of radar signals to dielectric variations while mitigating roughness effects [29]. Backscatter values were extracted at the same georeferenced sampling points used for EMI and laboratory analyses. A linear model was fitted between ECa at 14 kHz and the radar-derived backscatter difference, according to:
E C a = α + β ( S 1 d B )
where ECa (mS m−1) is the apparent electrical conductivity, S1dB (dB) is the Sentinel-1 backscatter moisture index, α is the intercept, and β is the regression coefficient expressing the magnitude of the moisture effect. When significant, a centred correction can be applied to remove the linear component associated with transient surface moisture:
E C a c o r r = E C a β ( S 1 d B S 1 d B ¯ )
where S 1 d B ¯ denotes the mean of the radar moisture index across all observations. This centred correction preserves the overall mean of the ECa dataset while reducing short-term variability associated with near-surface soil moisture differences. The procedure was employed here as a methodological verification of EMI data stability prior to further spatial and statistical analyses.

2.3.4. Remote Sensing Data: Satellite Imagery and Index Derivation

Multispectral Sentinel-2 imagery was processed to derive spectral indices representative of surface soil characteristics. The dataset comprised Sentinel-2A (MSI) Level-2A products (relative orbit 79) processed by ESA (CloudFerro) and provided as 16-bit GeoTIFF files at 10–20 m spatial resolution, referenced to the UTM Zone 33N coordinate system (EPSG:32633). The selected scene, acquired on 7 April 2020 at 10:00 a.m. local time, depicted the area before orchard establishment, when no vegetation was present.
Under these conditions, surface reflectance could be considered fully representative of soil characteristics. To objectively confirm the absence of vegetation, the Bare Soil Index (BSI) was computed, showing positive values consistent with bare-soil conditions.
After this verification, the Clay Index (CI) was derived from the same imagery through raster band-math operations in QGIS. Both indices were calculated using Sentinel-2 spectral bands (Table 4) according to the following equations:
BSI = ((ρRed + ρSWIR1) − (ρNIR + ρBlue))/((ρRed + ρSWIR1) + (ρNIR + ρBlue))
CI = ρSWIR2/ρSWIR1
The BSI is sensitive to vegetation and moisture, with values below 0 typically associated with vegetated or moist surfaces, values above 0.1 indicating the presence of bare soil and values greater than 0.3 corresponding to highly reflective, sparsely vegetated surfaces such as arid, sandy, or gypseous soils [30]. The CI enhances the spectral response of clay minerals with diagnostic absorption in the shortwave infrared region [1].
The resulting raster layers were exported for integration with EMI-derived datasets [2,17]. Finally, CI pixel values were extracted at the soil-sampling point locations in QGIS and used as inputs for the subsequent statistical analyses to evaluate their relationship with soil physicochemical properties and spatial variability.

2.3.5. Statistical Analysis

Spatial data were processed in QGIS, whereas all statistical analyses were conducted in R environment. The initial data screening involved applying the three-sigma rule to each numeric variable; observations beyond ±3 standard deviations from the mean were set to missing and pairwise deletion was applied for subsequent correlation calculations [31,32].
Apparent electrical conductivity (ECa) was defined as the response variable for all modelling procedures. The analytical workflow proceeded in sequential steps.
First, bivariate relationships between ECa and candidate covariates—including texture fractions, ECe, TOC, OM and spectral indices—were quantified with Pearson’s r.
Effect sizes and the corresponding coefficients of determination (R2) were compiled in a ranked summary.
Collinearity among the covariates, including the Sentinel-2 Clay Index (CI), was visualised with a Pearson correlation heatmap. Variables were automatically arranged by similarity of correlation (1 − |r|) to highlight interdependent patterns. To mitigate multicollinearity and reduce dimensionality, covariates were ranked by |r (ECa, x)|. The top-k predictors were retained for Principal Component Analysis (PCA), with the specific k reported in the Results.
Before PCA, rows with any remaining missing values were removed (listwise deletion) and all variables were standardised. Sampling adequacy and sphericity were verified using the Kaiser–Meyer–Olkin (KMO) [33] statistic and Bartlett’s test [34,35]. PCA was performed on the correlation matrix after excluding ECa.
Finally, predictive modelling was used to link the multivariate structure to ECa. An ordinary least-squares (OLS) regression model was fitted (ECa ~ PC1), where PC1 was the first principal component. Model assumptions were verified through standard residual diagnostics (linearity, homoscedasticity, normality and influence) [36].
Additionally, targeted bivariate OLS models were fitted for ECa against clay, the Clay Index (CI) and TOC to elucidate key individual relationships. All computations and visualisations were performed in R using standard libraries, including stats, ggplot2 [37], psych [38], REdaS [39] and pheatmap [40].

2.3.6. ECa–CI Data Fusion and Derivation of Management Zones

To demonstrate the practical applicability of the integrated proximal–satellite approach, a GIS-based workflow was developed to generate a management-oriented decision layer from the fusion of apparent electrical conductivity (ECa) and spectral clay information (CI).
The 14 kHz ECa raster and the Sentinel-2 Clay Index raster were combined through a normalization–fusion process, allowing their integration on a common numerical scale. Both variables, originally expressed in different units, were range-normalized to the 0–1 interval according to:
x n o r m = x x m i n x m a x x m i n
The normalized layers were averaged with equal weights to produce the ECa–CI fusion surface, subsequently classified into three clusters using the SAGA GIS “Clustering for Grids” algorithm integrated in QGIS. The number of clusters was determined using the elbow criterion of within-cluster variance, combined with agronomic interpretability, as proposed in recent soil management applications [41]. The resulting classified raster was then prepared for conceptual interpretation as a management decision layer (Section 3.8).

3. Results

3.1. Apparent Electrical Conductivity (ECa)

A basic descriptive analysis of the ECa dataset showed a clear depth-dependent trend: mean apparent conductivity increased as operating frequency decreases, from ~75 mS m−1 at 14 kHz to ~96 mS m−1 at 3 kHz (Table 5). This behaviour is consistent with the greater clay and moisture content typically observed in deeper horizons. Variability likewise increased at lower frequencies, indicating enhanced small-scale heterogeneity with depth. Importantly, the relative spatial pattern was conserved across frequencies: areas that were more conductive near the surface remained comparatively more conductive in depth, while resistive zones maintained the same behaviour. The spatial interpolation of ECa measurements was performed by ordinary kriging using the Smart-Map plugin for QGIS. The interpolation used an isotropic linear semivariogram model, and the corresponding parameters and cross-validation statistics are reported in Appendix B.
This pattern was evident in the kriged maps (Figure 6), where the highest conductivity zones expanded and intensified at 3 kHz compared to 14 kHz, suggesting links to subsurface clay-rich or wetter layers, whereas low-conductivity patches remained consistently stable across depths. Overall, the EMI survey highlighted substantial within-field contrasts (33–164 mS m−1) but also confirmed a vertically homogeneous spatial structure.
For this reason, the 14 kHz dataset, representative of the topsoil, was selected as the reference EMI layer for comparison with Sentinel-2 indices and laboratory measurements at 30 cm depth.

3.2. Laboratory Soil Analyses

The twelve soil sampling locations selected with ESAP-RSSD procedure, using the 14 kHz ECa channel as the selection variable, are shown in Figure 6d. Laboratory analyses of the soil samples collected at 30 cm depth provide reference data for soil texture and chemistry (Table 6).
The soils were predominantly clayey, with clay content ranging from 403 to 439 g kg−1 (mean 419 g kg−1, CV 2.9%).
Sand varied between 305 and 451 g kg−1 (mean 390 g kg−1, CV 13.0%), while silt ranged from 111 to 272 g kg−1 (mean 192.5 g kg−1, CV 27.6%). According to the USDA classification, most samples fell within the clay-loam to clay classes.
The relatively high and spatially consistent clay fraction reflected the alluvial setting and contributed to the elevated apparent electrical conductivity (ECa) observed in the field.
Coarse fragments (>2 mm, “skeleton”) ranged from 79 to 184 g kg−1 (mean 129.2 g kg−1, CV 23.6%), corresponding to approximately 7.9–18.4% by mass, indicating a moderate gravel content that did not dominate the soil matrix.
Soil pH values were uniformly neutral to slightly alkaline (7.7–8.0, mean 7.9), as expected in carbonate-influenced alluvial soils of the region. Electrical conductivity (ECe) ranged from 86.6 to 213.4 mS m−1 (i.e., 0.87–2.13 dS m−1; mean 1.48 dS m−1). These levels indicated non-saline to, at most, slightly saline conditions under common agronomic thresholds.
Soil organic carbon parameters indicated moderate fertility. Total organic carbon (TOC) ranged from 13.4 to 17.0 g kg−1 (mean 15.4 g kg−1), corresponding to organic matter (OM) of 23.1–29.2 g kg−1 (mean 26.4 g kg−1; ≈2.31–2.92%).
Variability in TOC was limited (CV 6.8%) and its positive association with clay content supported stabilisation of organic matter within finer fractions.
Overall, the soils at the site were neutral to slightly alkaline clay loams, with low salinity and moderate organic matter. Variability in sand and silt, together with differences in organic carbon, may have influenced local nutrient and moisture dynamics, whereas the consistently high clay content provided a homogeneous background for interpreting geophysical and spectral signals.
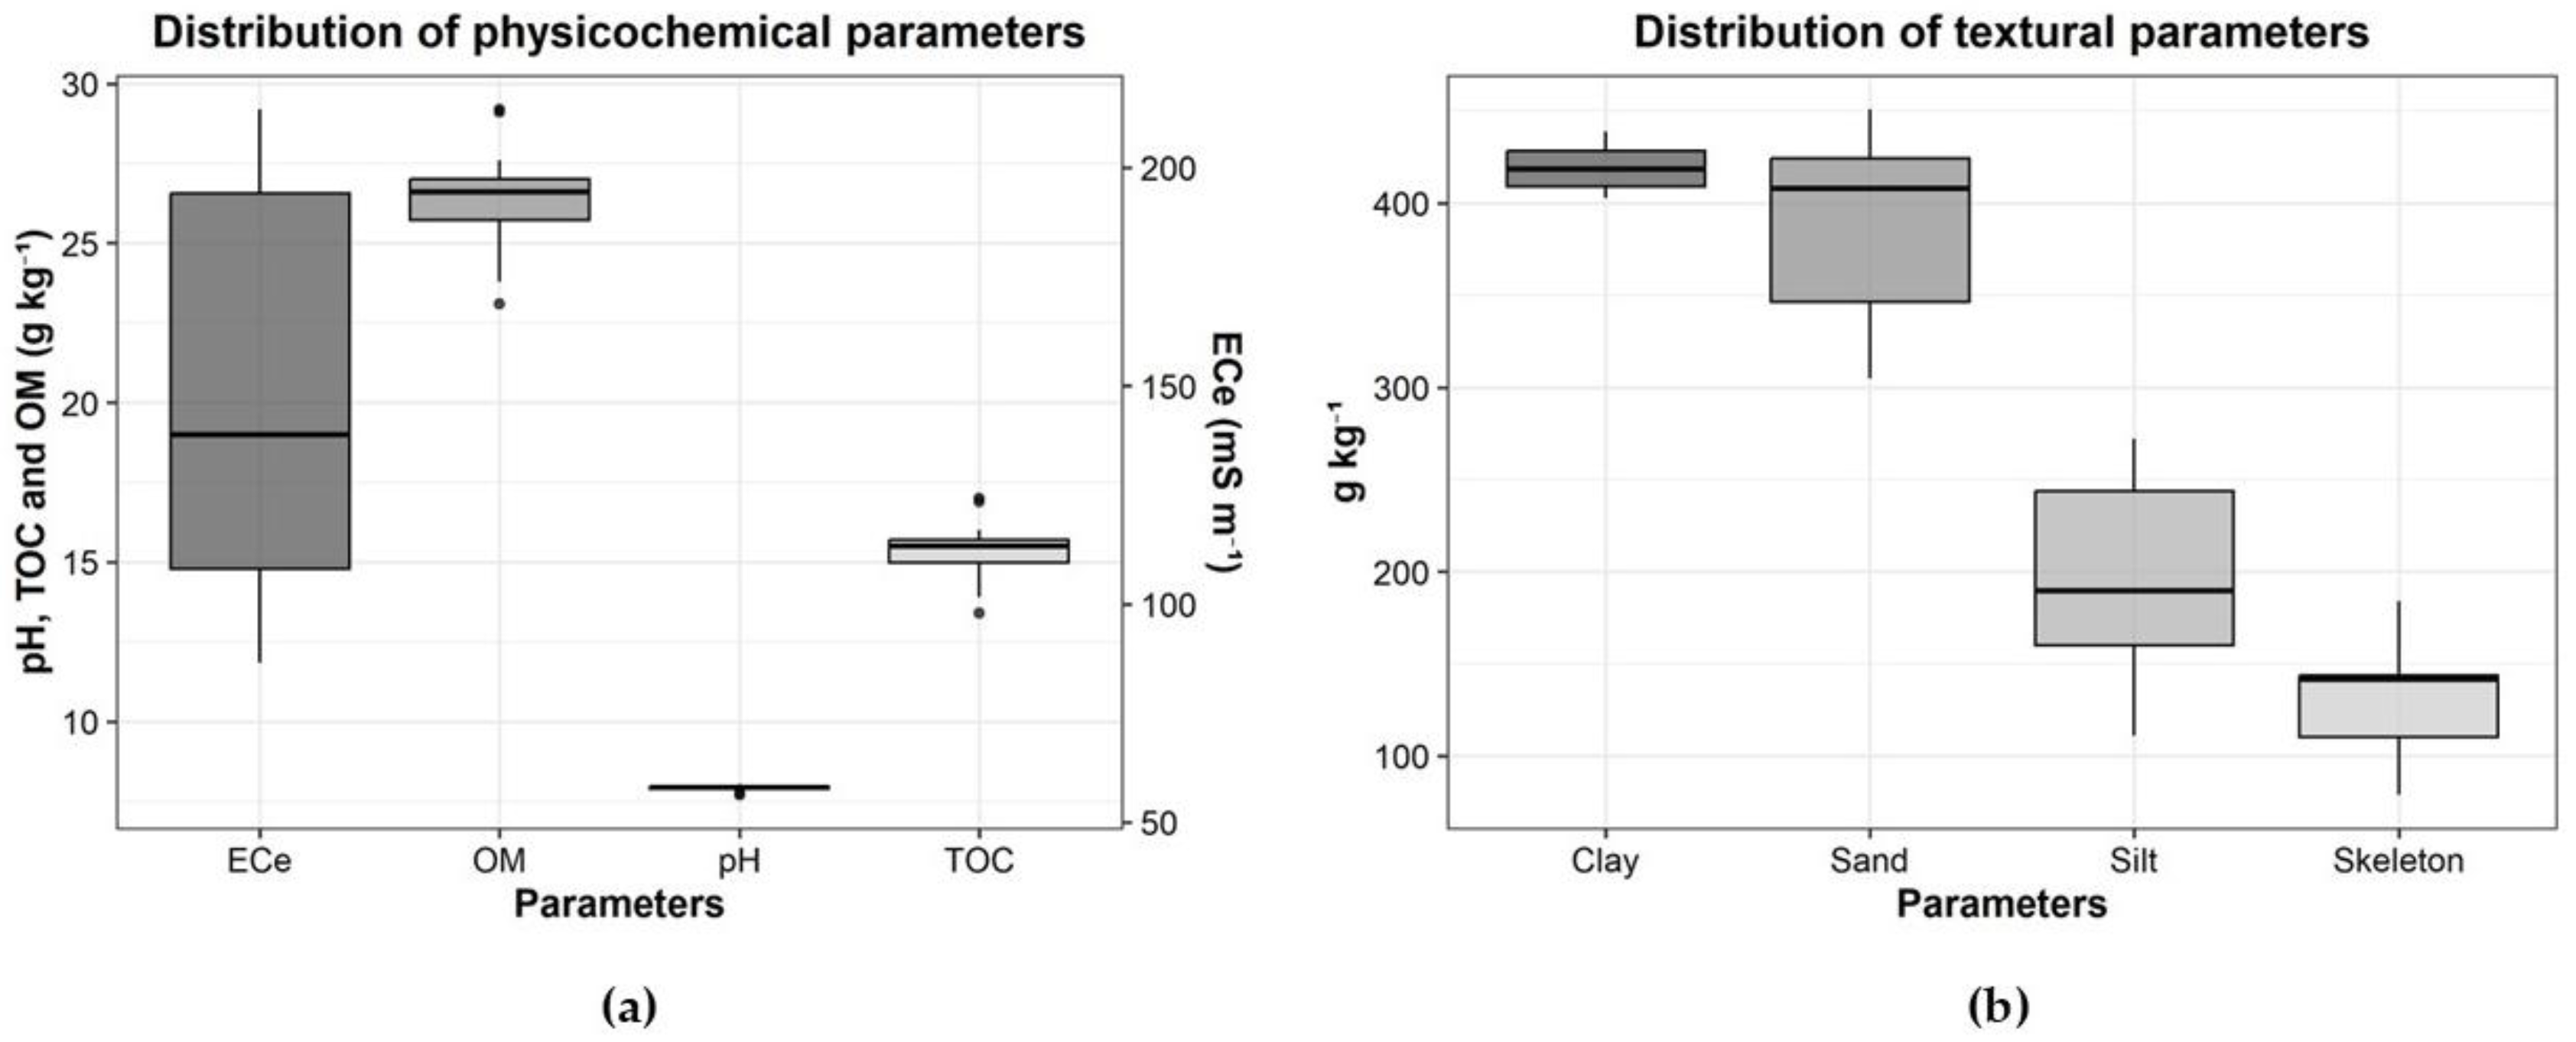
The central tendency and variability of the measured physical-chemical properties at 30 cm depth are depicted in Figure 7. Figure 7a reports the chemical variables (pH, ECe, TOC, OM), whereas Figure 7b shows the physical fractions (clay, sand, silt, skeleton).
The boxplots are consistent with Table 6, highlighting the limited variability of clay, the comparatively wider dispersion of sand and silt, and the larger spread observed for ECe among the chemical parameters.

3.3. Soil Moisture Influence on ECa Measurements

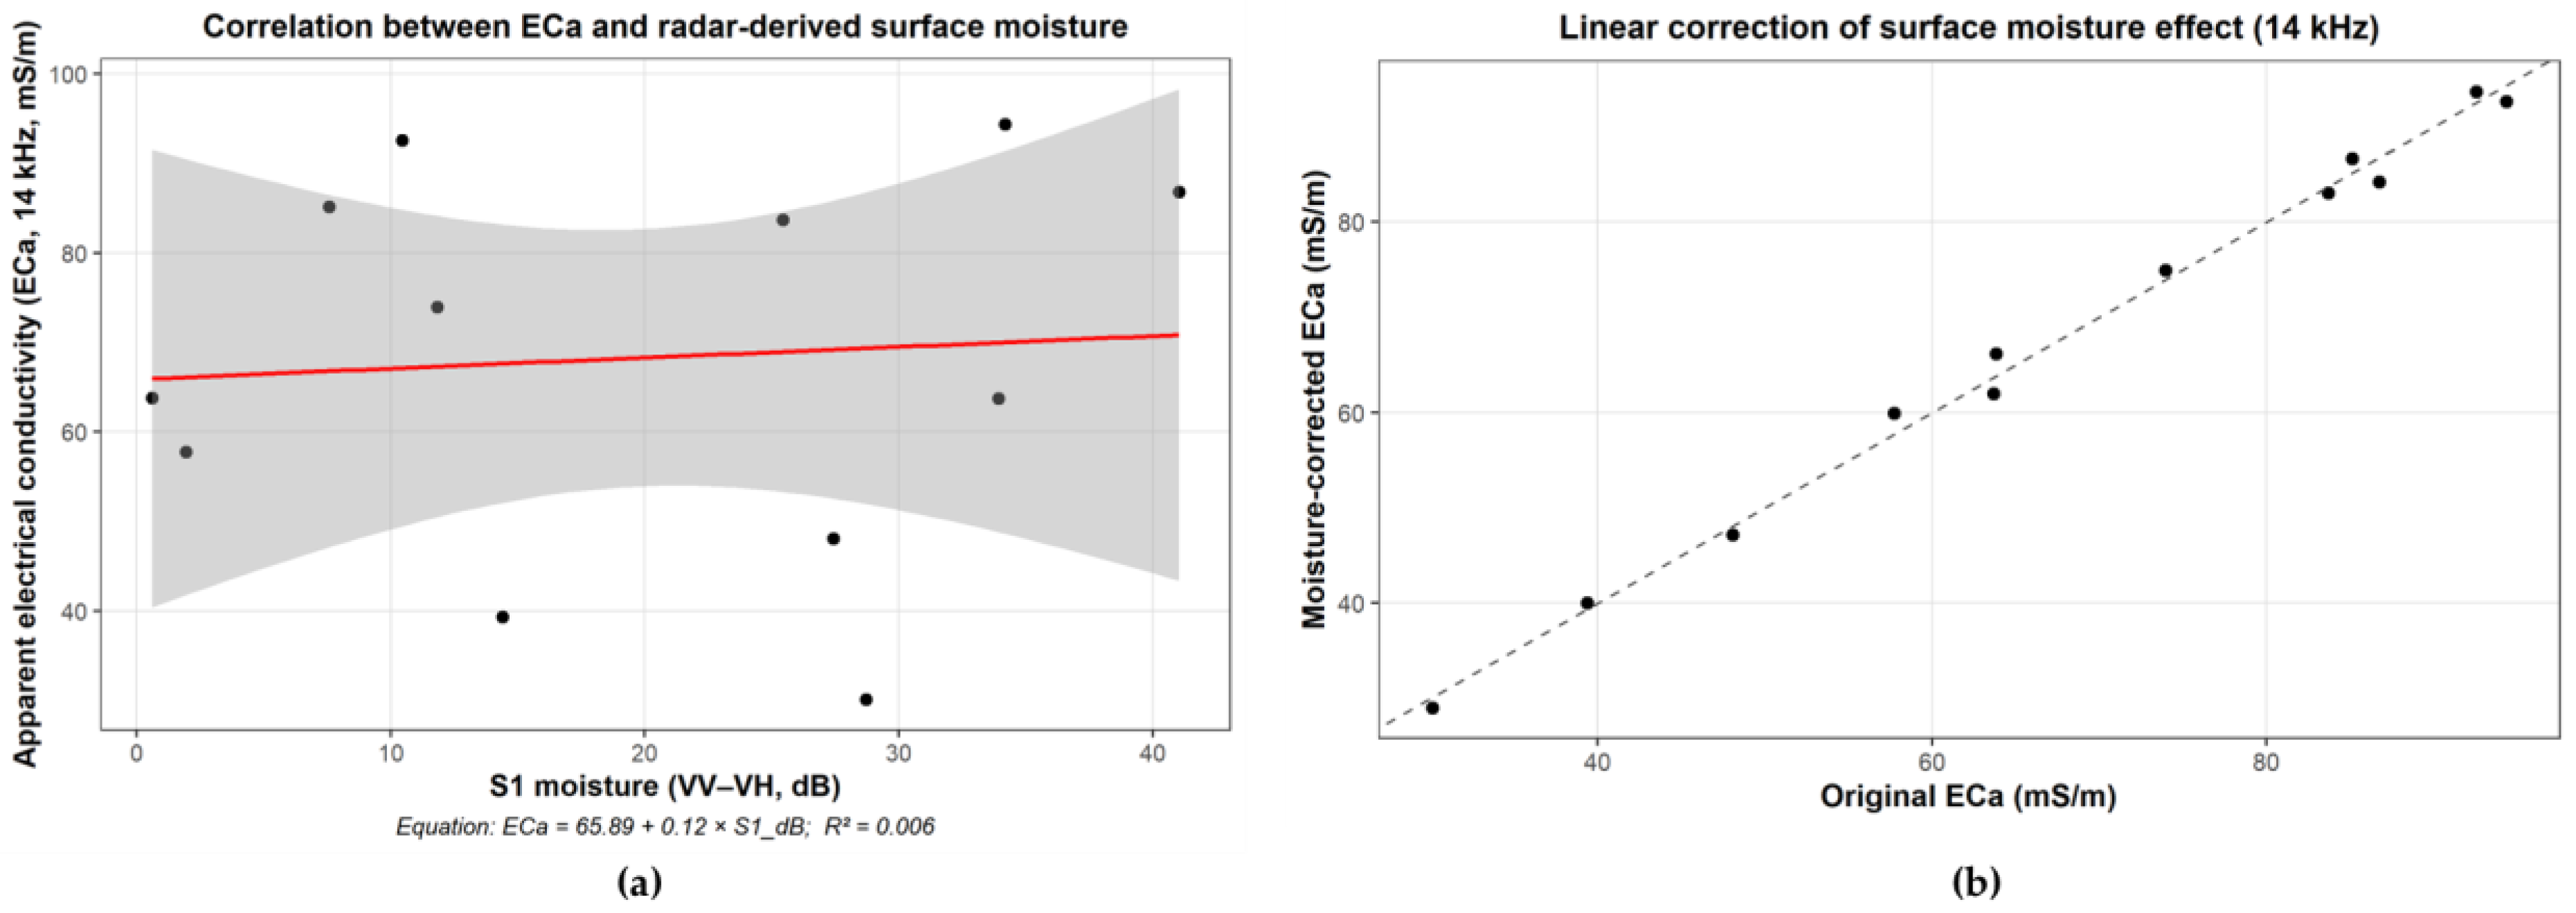
The regression analysis between ECa (14 kHz) values and the Sentinel-1 backscatter difference (VV–VH, dB) revealed a weak and non-significant relationship (p > 0.05), indicating that soil moisture during the survey did not significantly affect EMI measurements. Consequently, the correction procedure was retained only as a methodological verification, and the original ECa values were used for subsequent analyses.
Figure 8 illustrates the correlation between ECa and the Sentinel-1 VV–VH index (Figure 8a) and the comparison between original and moisture-corrected ECa values (Figure 8b), both confirming the negligible effect of surface moisture on the 14 kHz dataset.
The absence of a significant correlation between ECa and Sentinel-1 moisture indices is consistent with the moderate water-holding capacity of the studied soil (Appendix C), characterized by an available water content (AWC) of approximately 0.15 m3 m−3.
These hydraulic properties confirm that, under the dry survey conditions, spatial variations in ECa mainly reflected textural and soluble-ion contrasts rather than transient moisture effects.

3.4. Sentinel-2 Spectral Indices

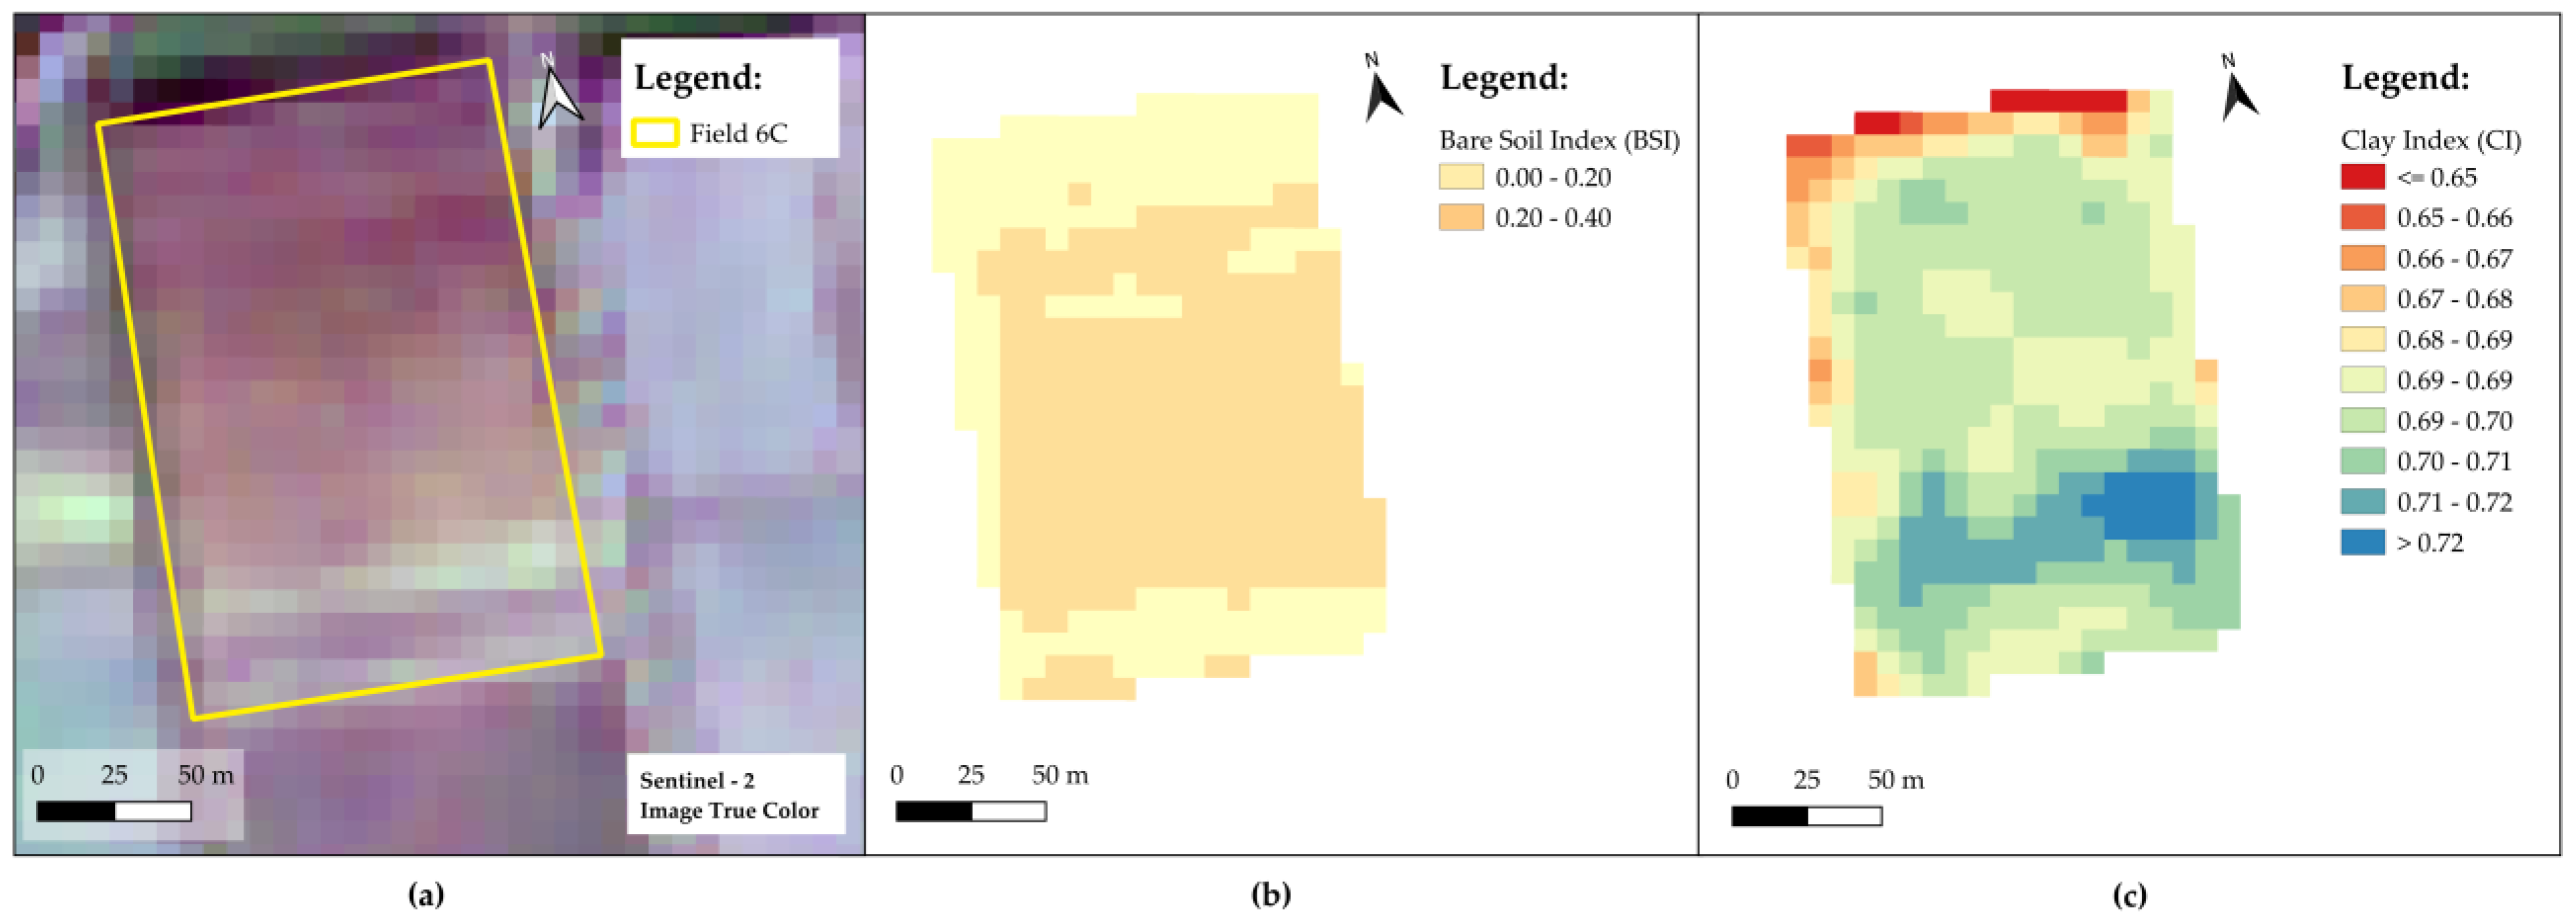
Under bare-soil conditions, Sentinel-2 spectral indices showed clear spatial patterns that correspond to soil variability in the field. The Bare Soil Index (BSI) values in the selected image were uniformly high (>0.2) across Field 6C, confirming that the field was free of green vegetation at the time of imaging (Figure 9b). This verification of bare-soil status was essential to ensure the reliability of the Clay Index (CI) analysis.
The CI map (Figure 9c) reveals distinct spatial variability across Field 6C, with values typically ranging from approximately 0.65 to 0.72 and local maxima exceeding 0.72. Higher CI values are concentrated in the southern and south-eastern portions of the field, suggesting relatively higher clay content in these areas, whereas lower CI values (<0.65) occur in the central–northern sectors, indicating sandier or less clay-rich topsoil. The spatial pattern of CI closely matches the high-ECa zones identified by the EMI survey.

3.5. Correlation Analysis

Based on the twelve ESAP-RSSD sampling sites defined from the 14 kHz ECa surface, pairwise Pearson correlations were computed for all variables to examine the interdependence between soil laboratory parameters and the satellite-derived index.
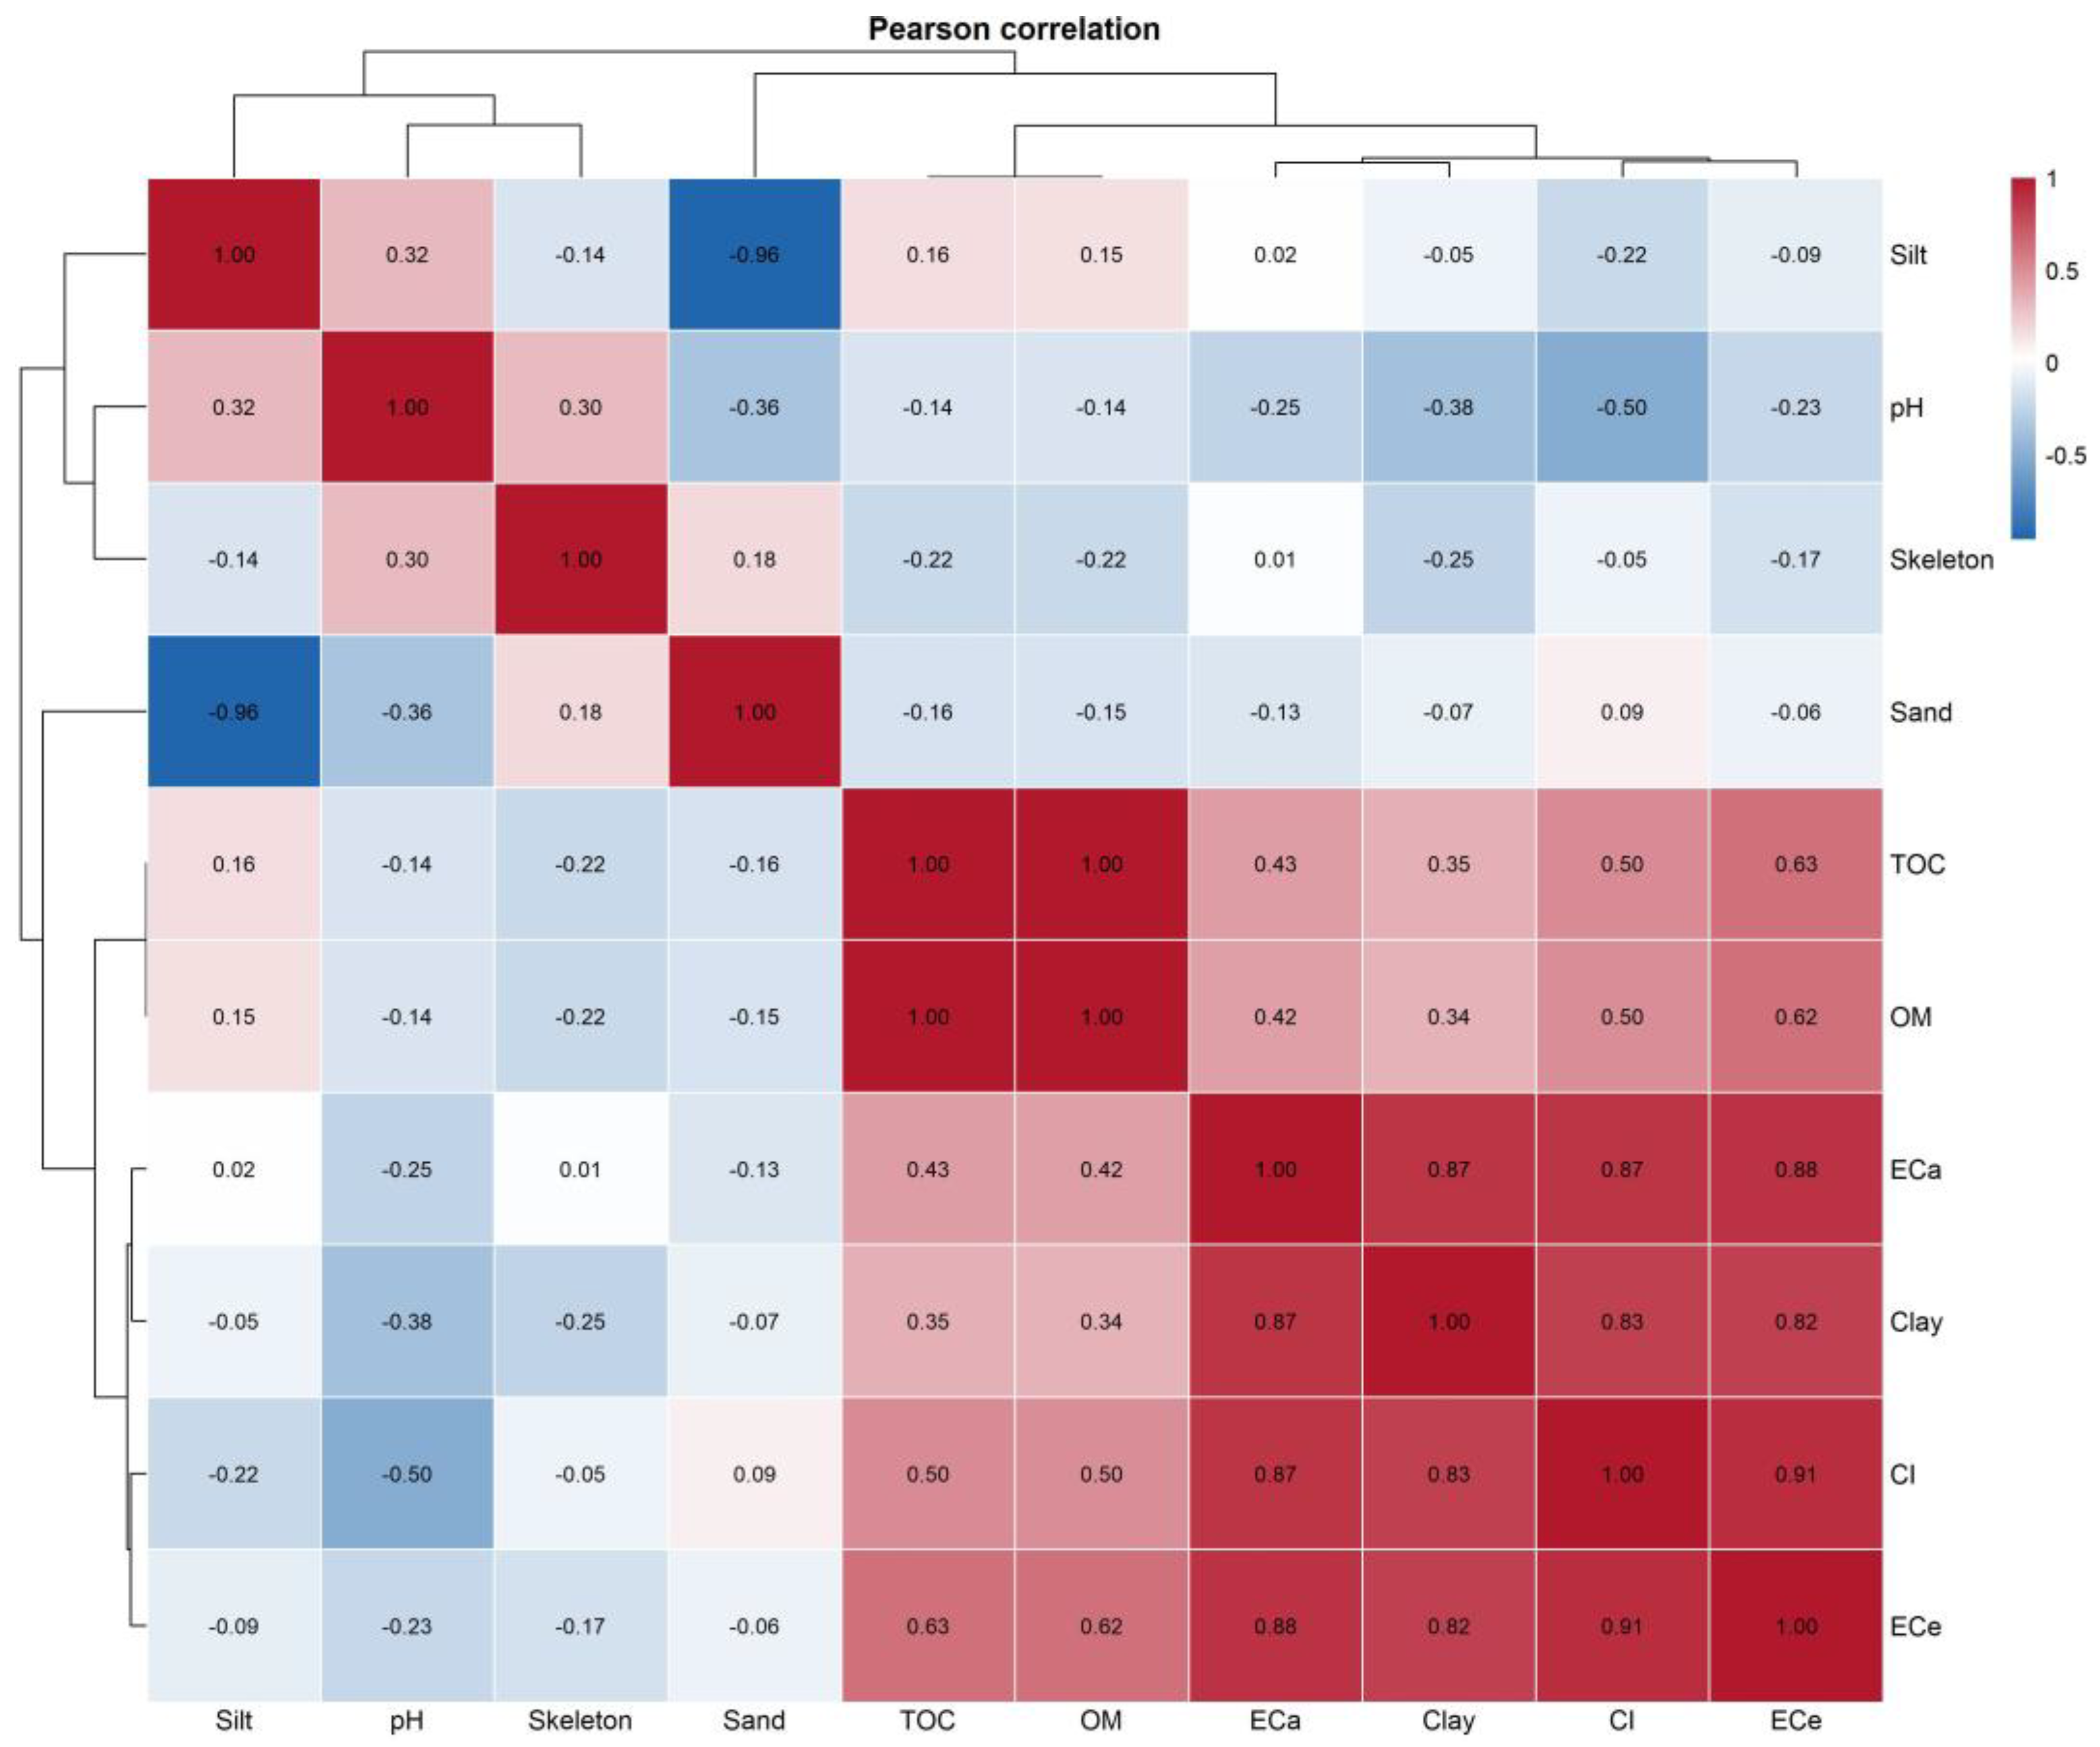
The correlation matrix (Figure 10) highlights coherent associations among textural, chemical and spectral attributes, with a clear grouping of clay, ECe, CI, TOC and OM in the same positive cluster. Positive correlations are shown in red and negative in blue.
Subsequently, apparent electrical conductivity (ECa, mS m−1) was used as the reference variable to quantify its specific relationships with individual soil and spectral variables. The results showed that ECa is strongly and positively associated with soil salinity (ECe; r = 0.88, R2 = 0.78), clay content (r = 0.87, R2 = 0.76) and the Sentinel-2 Clay Index (CI; r = 0.87, R2 = 0.76) (Table 7; Figure 9).
Moderate positive correlations were found with total organic carbon (TOC; r = 0.43, R2 = 0.19) and organic matter (OM; r = 0.42, R2 = 0.18), while weak or negligible relationships were observed with pH (r = −0.25, R2 = 0.06), sand (r = −0.13, R2 = 0.02), silt (r = 0.02, R2 ≈ 0.00) and coarse fragments (Skeleton; r = 0.01, R2 ≈ 0.00).
The observed patterns are consistent with the well-established sensitivity of ECa to both texture and salinity and confirm the Sentinel-2 Clay Index (CI) as a reliable satellite-derived proxy of near-surface mineral variability. The main trends were illustrated by the ordinary least squares (OLS) scatter plots shown in Figure 11, highlighting the close correspondence between ECa and both clay content and CI, and additionally the strong linear relationship between CI and clay content.

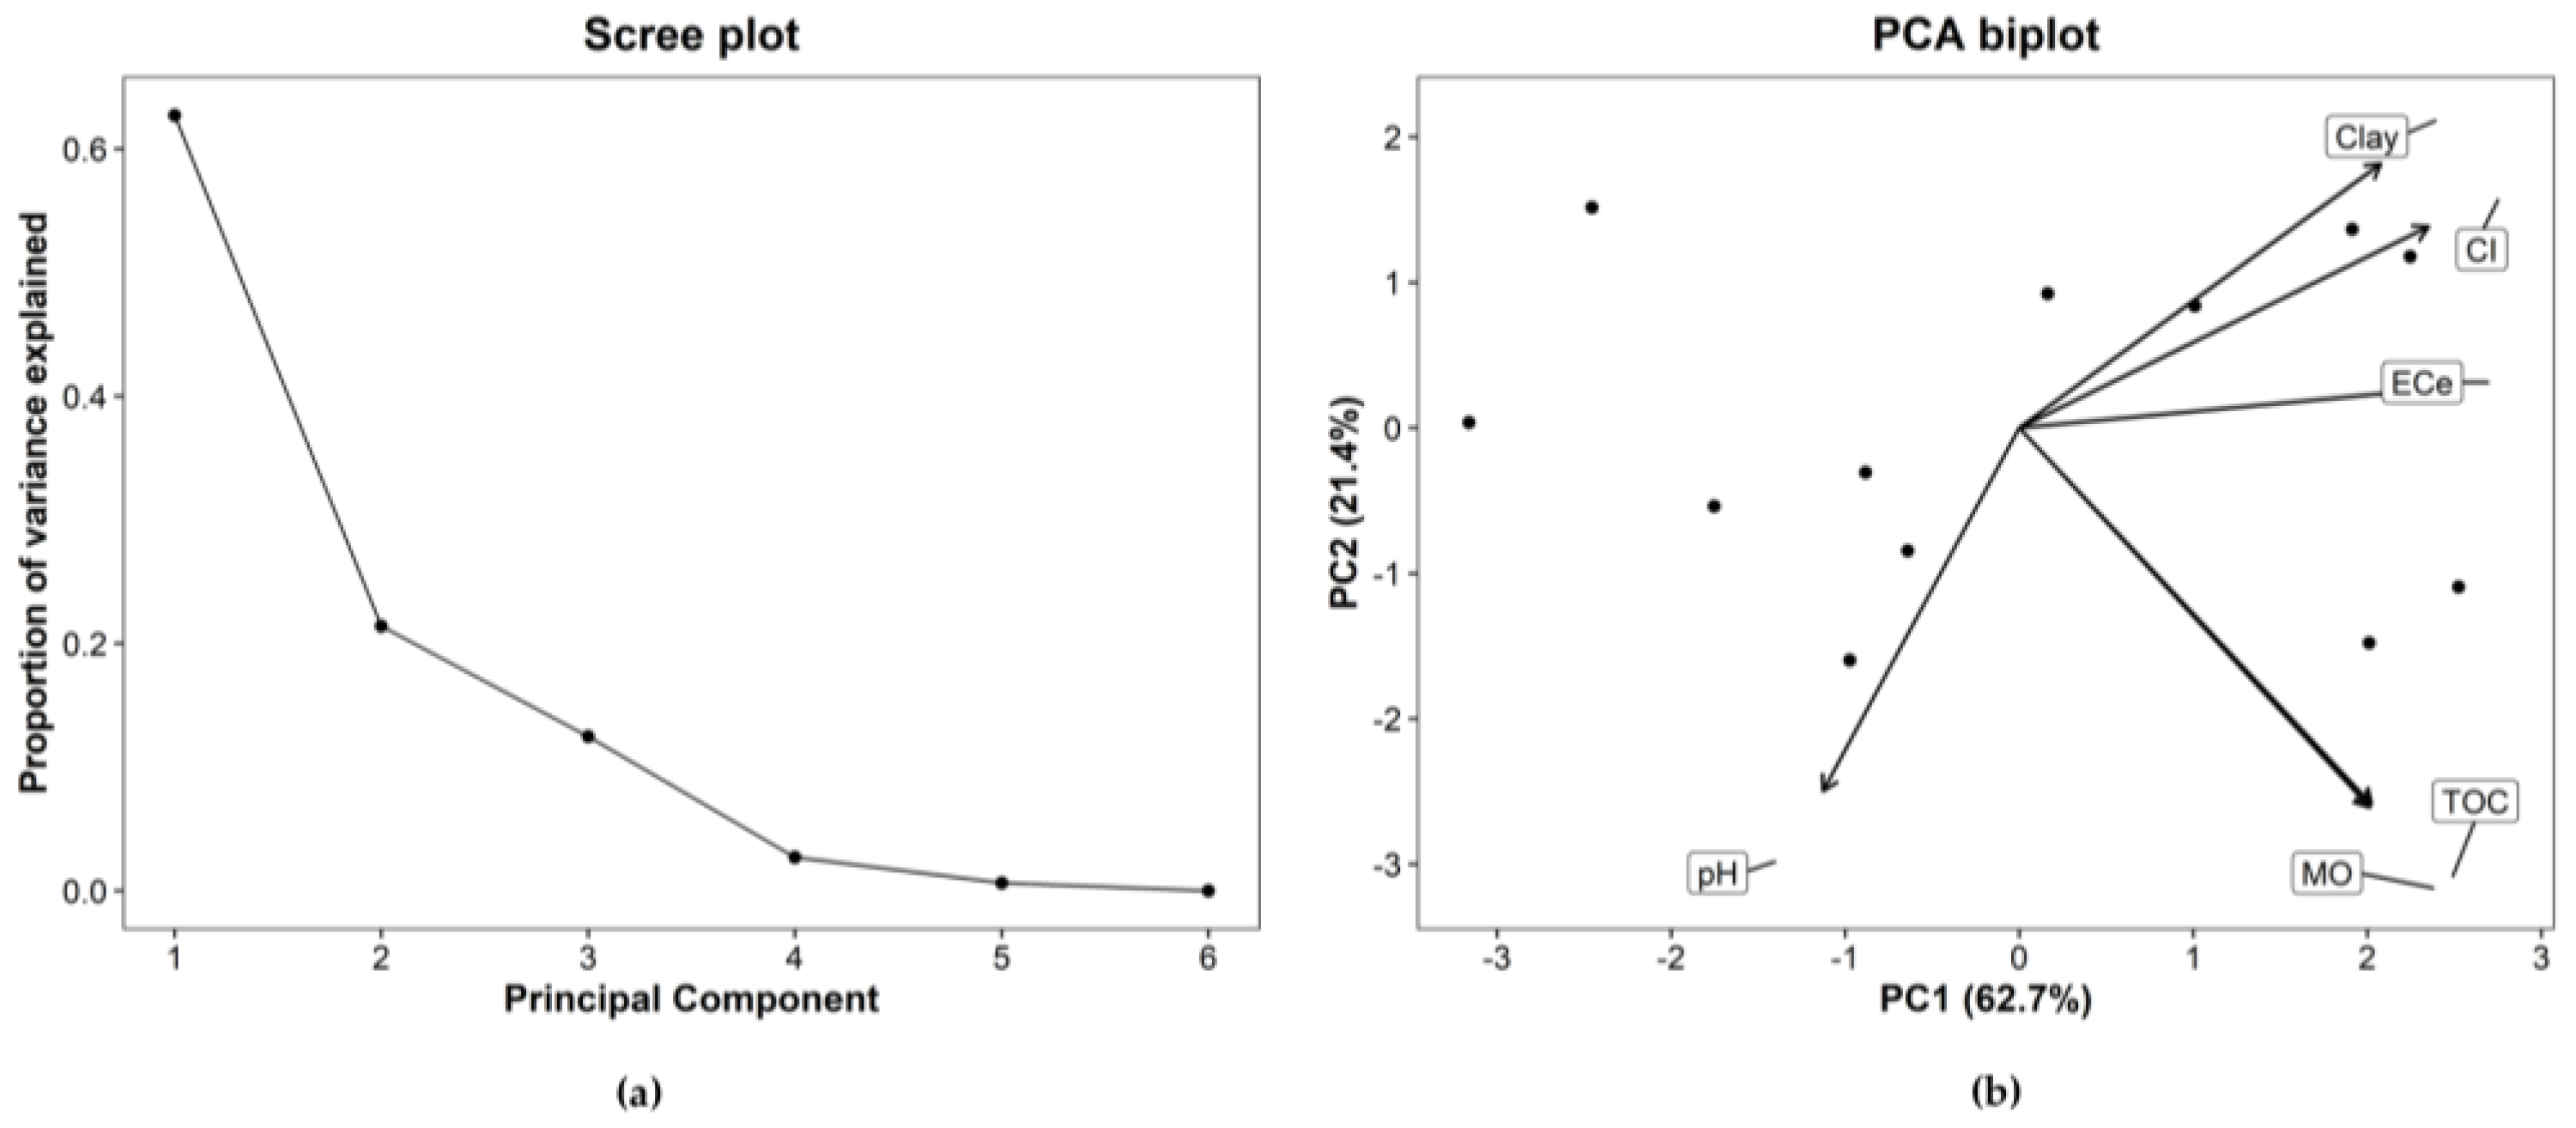
3.6. Principal Component Analysis (PCA)

The dataset was suitable for dimensionality reduction (KMO = 0.61; Bartlett’s χ2 = 93.12, df = 15, p < 0.001). Based on the ranked Pearson correlations with ECa, the six most correlated variables (k = 6)—ECe, clay, CI, TOC, OM and pH—were retained for Principal Component Analysis. The scree plot showed a marked drop after the first axis. PC1 explains 62.7% of the total variance and PC2 21.4% (Figure 12a). Loadings indicated that PC1 captures a joint gradient of salinity–texture–organic fraction, with positive contributions from ECe (0.48), CI (0.47), clay (0.42), TOC (0.40) and OM (0.40), and a negative loading for pH (–0.23) (Table 8). PC2 contrasted TOC (–0.52), OM (–0.52) and pH (–0.50) with clay (0.36) and CI (0.28). As per design, ECa was excluded from the PCA feature set; in the biplot (Figure 12b) it aligned with the direction of CI, clay, ECe and TOC, consistently with the correlation results.

3.7. Regression Models

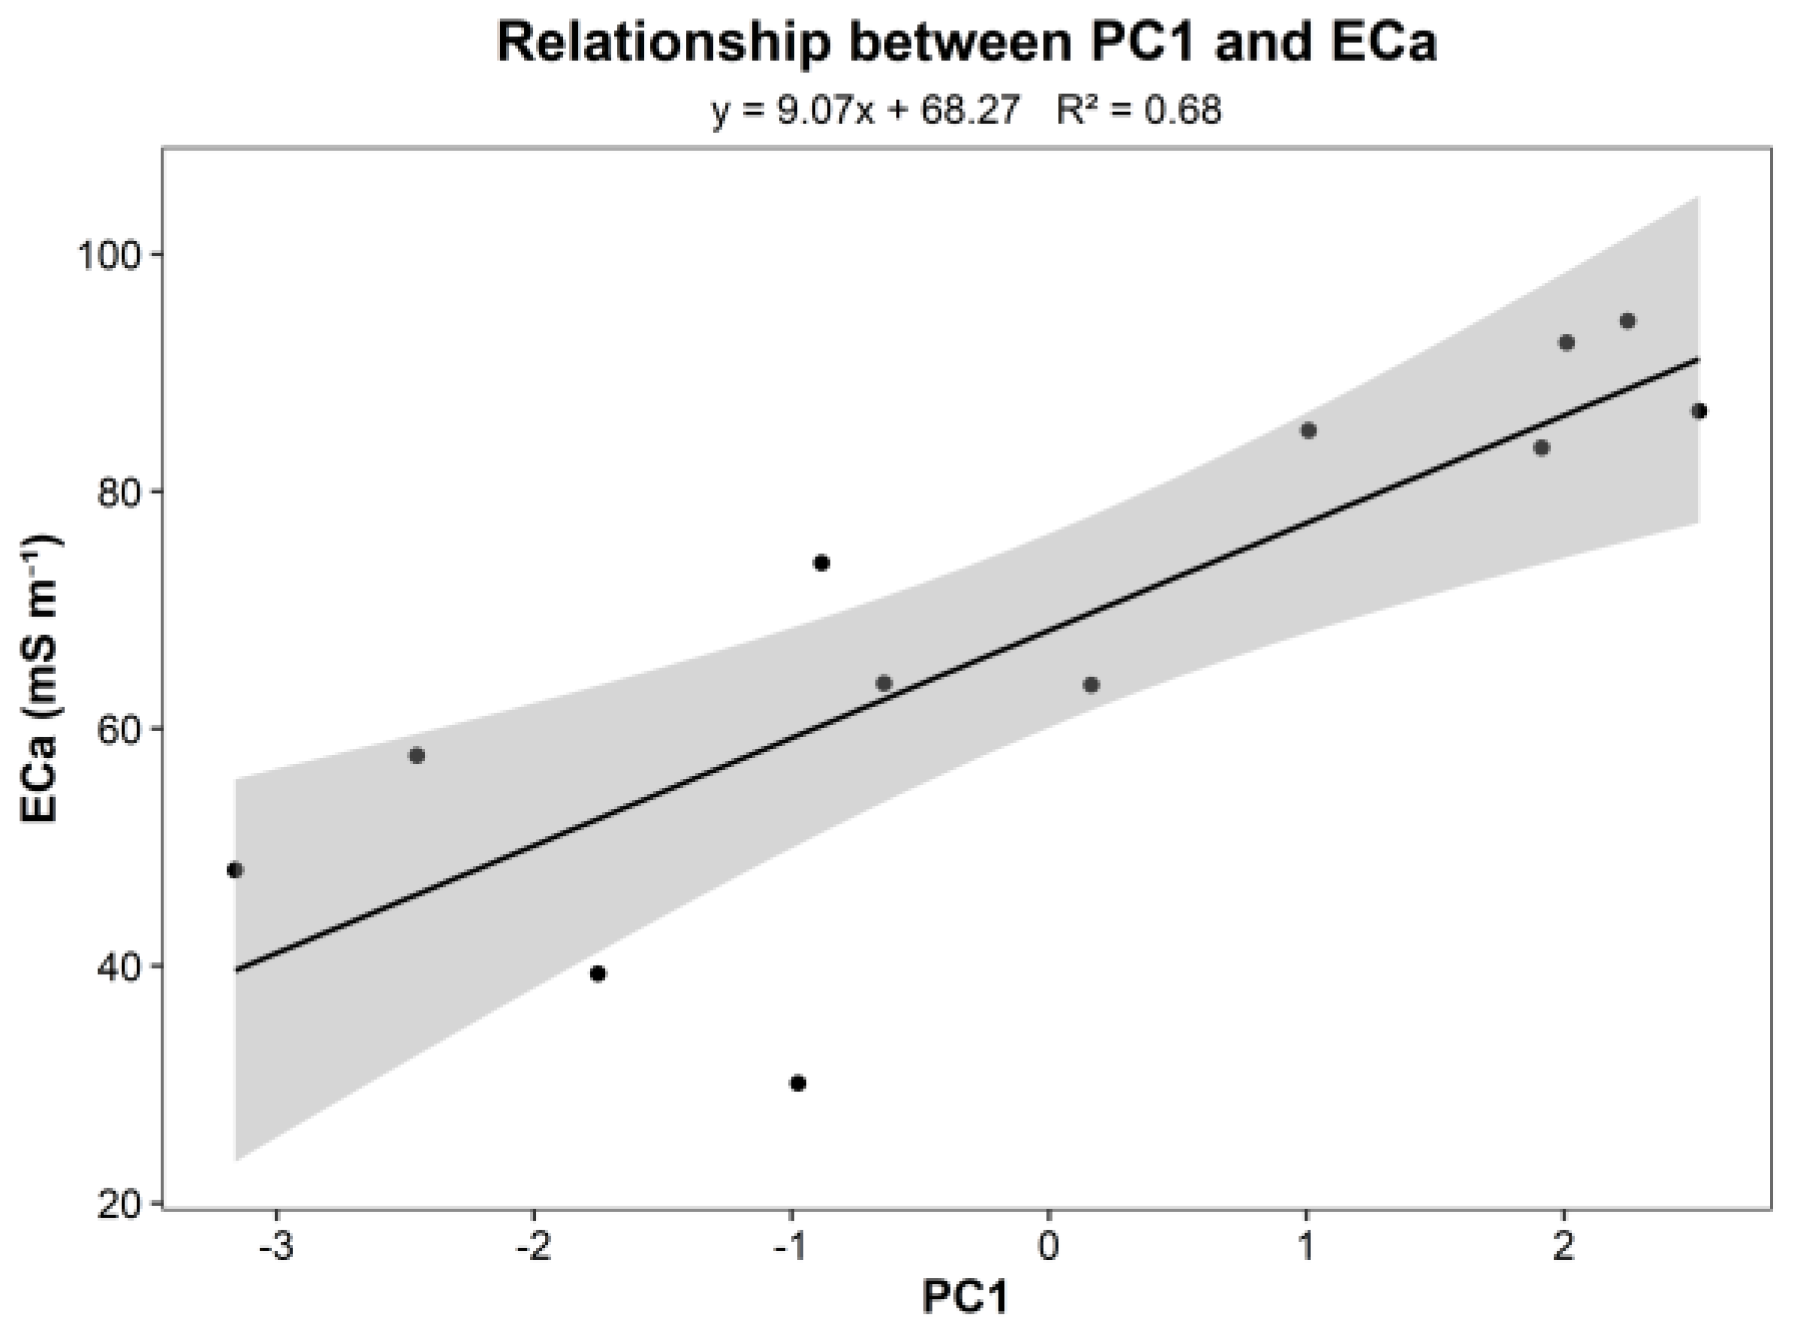
A linear model was fitted to relate apparent electrical conductivity to the synthetic gradient obtained from PCA (ECa ~ PC1). The association was positive and significant (y = 9.07x + 68.27; R2 = 0.68; n = 12), indicating that higher PC1 scores—characterised by finer texture, higher salinity and larger organic fraction—correspond to higher ECa (Figure 13). Residual diagnostics did not reveal major departures from linearity or homoscedasticity and no influential outliers were detected. Using PC1 as predictor mitigated multicollinearity among clay, ECe, CI and TOC, yielding a stable and interpretable one-parameter model.

3.8. Field-Scale Zoning Based on ECa–CI Fusion

The GIS-based ECa–CI fusion produced three homogeneous zones clearly reflecting field-scale variations in soil texture and composition (Figure 14). The resulting spatial pattern was consistent with the gradients previously observed in the ECa–clay and ECa–CI relationships, confirming that the integrated layer effectively captured the combined influence of electrical and spectral soil properties.
Areas classified in the highest ECa–CI zone corresponded to portions of the field characterized by finer textures and higher clay content, where the predominance of clay minerals indicates greater cation-exchange capacity and stronger structural stability. In contrast, lower ECa–CI values were associated with coarser-textured soils containing a reduced proportion of clay and exchangeable minerals.
From an agronomic standpoint, this zoning provides a basis for differentiated management strategies. Higher ECa–CI areas may require moderate input levels and careful monitoring to avoid surface compaction and aeration issues, while lower ECa–CI zones could benefit from enhanced organic matter inputs and lighter, more frequent irrigation or fertigation to sustain nutrient availability. This field-scale classification demonstrates how the integration of proximal and satellite data can be translated into a decision-support map for variable-rate irrigation and fertilization planning, providing a reproducible and transparent tool for site-specific management.

4. Discussion

4.1. Integration of Proximal and Satellite Data

This study demonstrates an operational workflow that integrates EMI surveying with free Sentinel-2 imagery to map soil variability at farm scale in Mediterranean conditions. The results confirm the working hypothesis that apparent electrical conductivity (ECa) effectively captures textural and salinity gradients, while the Sentinel-2 Clay Index (CI) reproduces near-surface mineral variability in a spatially coherent pattern with EMI data and laboratory measurements.
The correlation matrix (Figure 10) highlights coherent associations among textural, chemical and spectral attributes, with clay, ECe, CI, TOC and OM forming a clear positive cluster. The ranked summary (Table 7) confirms that ECa was most strongly and positively correlated with soil salinity (ECe), clay content and the Sentinel-2 Clay Index (CI).
These relationships are further supported by the ordinary least-squares regressions (Figure 11a,b), which illustrate the close correspondence between ECa and both clay content and CI and additionally the strong linear relationship between CI and clay content. The 14 kHz ECa surface—representative of the shallower response—served as a common layer to guide sampling and to confront proximal and distal signals (Figure 6c,d), anchoring the workflow to the topsoil where management interventions are most effective.

4.2. Interpretation of Spatial Patterns

At field scale, ECa showed consistent and interpretable associations with clay content and with the electrical conductivity (ECe), reflecting finer texture and higher ionic content in more conductive areas. The strong correspondence among CI, ECa and clay content confirms that bare-soil multispectral indices can serve as reliable first-order proxies for texture mapping, provided that rigorous bare-soil verification is performed (Figure 9b).
The multivariate analysis strengthened this interpretation. The first principal component (PC1) integrated a coherent gradient of salinity-texture-organic fraction, with positive loadings from ECe, CI, clay and TOC (Table 8). This gradient can be interpreted as a pedophysical continuum that directly affects soil functioning and management. Areas with higher PC1 scores correspond to finer-textured and more conductive soils, generally richer in clay and soluble ions, with greater water-holding and nutrient-retention capacity but lower permeability. Conversely, lower PC1 values represent coarser, better-drained soils with lower ECa and CI, typically requiring higher irrigation frequency and nutrient replenishment. From an agronomic standpoint, this axis thus delineates management zones differing in water dynamics and fertility potential, offering a functional link between soil variability and precision irrigation or fertilisation planning.
ECa aligned with this axis in the biplot (Figure 12b). A simple linear model linking ECa to PC1 (Figure 13) summarised the dominant soil gradient effectively, mitigated multicollinearity and provided an interpretable predictor that can be updated as new covariates or time points are incorporated.

4.3. Methodological Reliability and Workflow Design

Two methodological choices underpin the robustness and transferability of the workflow. First, the a priori appraisal of vertical homogeneity with multi-frequency EMI justified the use of the 14 kHz surface as a topsoil proxy for ESAP-guided sampling and cross-sensor comparison; the preservation of relative spatial patterns across 14, 7 and 3 kHz (Figure 6) indicated stable lateral contrasts within the shallow profile.
Second, enforcing the Bare Soil Index as a gating step before computing CI (formulas and bands in Table 4) reduced vegetation and moisture confounding and improved the stability of spectral estimates.
Under Mediterranean conditions—characterized by fine-scale pedological mosaics, carbonate influence, and seasonal water stress—the workflow offers a practical and reproducible framework for routine farm-scale diagnostics. Compared with conventional soil mapping approaches, which require more complex logistics and higher costs, the integration of EMI with free Sentinel-2 data provides a rapid, accessible, and interpretable solution for assessing topsoil variability.
The distribution of laboratory variables (Figure 7) showed an informative spread relative to the objectives and supported a compact yet effective calibration (Table 6). The study design focused on one field and one season to provide clarity of implementation and interpretation. Spectral indices were computed under strict bare-soil screening (Figure 8b) and depth attribution followed widely adopted effective-depth assumptions supported by the multi-frequency coherence (Figure 6). This deliberately streamlined design facilitates replication, adoption and scaling in operational settings.

4.4. Limitations and Methodological Safeguards

Nevertheless, some limitations must be acknowledged. The restricted spatial extent (one field) and the single-season window constrain the generalisability of the results. Mediterranean soils are highly variable through time, and seasonal shifts in moisture could modify EMI–spectral relationships.
Similarly, the calibration relied on a relatively small number of samples, which, although carefully stratified via ESAP, may not fully capture extreme conditions.
However, the sampling design was specifically conceived to minimise small-scale heterogeneity. Each analytical unit consisted of a composite sample derived from three subsamples collected at 30 cm depth, positioned at the vertices of an equilateral triangle with a 2 m radius. This geometric layout ensured local spatial averaging and reduced the impact of micro-variability in soil texture and moisture. These aspects underline the importance of temporal replication and multi-site validation to strengthen extrapolation before large-scale application.

4.5. Comparison with Literature and Broader Implications

When contrasted with recent literature, the present findings reinforce and extend earlier observations. In line with studies in China and Greece [2,4], this work confirms that even small-scale heterogeneity has strong implications for soil management, but it differs by demonstrating an integrated, sensor-fusion workflow specifically adapted to Mediterranean drylands. Compared to earlier work using Sentinel-2 alone for clay or carbon mapping [1,5], the combination with EMI improves depth-awareness and cross-validates distal proxies against proximal integrators. Furthermore, while EMI has been successfully applied in Portuguese pastures and other European contexts [8], its coupling with multispectral indices and laboratory measurements under Mediterranean field conditions remains poorly documented.
The negligible influence of soil moisture on ECa was quantitatively verified through two complementary approaches.
First, Sentinel-1 radar data (VV–VH backscatter difference) were analysed as a proxy for surface humidity, showing no significant correlation (p > 0.05) with the 14 kHz ECa layer. This confirmed that EMI measurements were unaffected by near-surface moisture during the dry survey period. Second, hydraulic parameters derived from laboratory data (Appendix C)—estimated using the pedotransfer functions of Saxton and Rawls (2006) [42]—indicated low volumetric water content close to the wilting range, consistent with the <10 mm rainfall recorded in the ten days preceding the survey.
Under these conditions, ECa variability primarily reflected textural and ionic differences, with minimal short-term moisture interference.
The strong coherence among EMI, CI, and laboratory variables (clay, ECe, TOC) therefore represents stable pedophysical contrasts rather than transient hydrological effects. Overall, this study provides new experimental validation of the feasibility of combining proximal and distal sensing for soil diagnostics in Mediterranean agriculture.
The proposed workflow leverages free Sentinel-2 imagery together with rapid EMI acquisition, aligning with the current shift toward cost-efficient, scalable, and data-driven soil monitoring frameworks [43,44].

5. Conclusions

This study presented an operational, reproducible workflow that integrates electromagnetic induction (EMI) surveying with free Sentinel-2 multispectral imagery to map soil variability at farm scale in Mediterranean conditions.
The results confirmed that apparent electrical conductivity (ECa) effectively captured fine-scale textural and salinity gradients, while the Sentinel-2 Clay Index (CI) reproduced near-surface mineral variability in a spatially coherent pattern consistent with EMI data and laboratory measurements.
The strong correlation between ECa, CI, and soil parameters such as clay content, ECe, and TOC demonstrates the complementarity between proximal and satellite sensing for the identification of soil management zones.
The proposed framework offers a practical and transparent tool for transforming routinely available observations into decision-ready layers for zoning and targeted management. Emphasis on simplicity, data accessibility, and methodological clarity enables rapid deployment, replication, and integration into existing agronomic workflows. Compared with conventional soil mapping procedures, this approach reduces logistical complexity and cost while maintaining interpretability and accuracy. The workflow also provides a clear baseline for continuous soil monitoring under Mediterranean conditions, where fine-scale heterogeneity and seasonal variability strongly influence crop response.
Future developments will focus on temporal replication and depth-aware EMI inversions to extend both the temporal and vertical domains of analysis. These efforts will explicitly link soil spatial patterns with canopy structure and vigour. LiDAR and UAV acquisitions will be employed to quantify canopy volume and vigour, and to relate these metrics to EMI- and Sentinel-2-derived soil gradients through joint spatial and mixed-effects models across key phenological stages. Such integration will enable the creation of dynamic, data-driven decision-support systems that facilitate variable-rate irrigation, fertilisation, and sustainable field management.

Author Contributions

Conceptualization, G.C. and A.L.; methodology, A.L.; software, A.L., G.D.R. and E.G.; validation, A.L., G.C., G.D.R. and E.G.; formal analysis, A.L. and G.C.; investigation, A.L. and G.D.R.; resources, G.C.; data curation, A.L. and G.D.R.; writing—original draft preparation, A.L. and G.D.R.; writing—review and editing, A.L., G.D.R., G.C. and E.G.; visualization, A.L., G.D.R., G.C. and E.G.; supervision, G.C.; project administration, G.C.; funding acquisition, G.C. All authors have read and agreed to the published version of the manuscript.

Funding

The research was funded by O.P. MELODIA, project “Arte”, CUP B28H24013830004.

Data Availability Statement

The data presented in this study are available on request from the corresponding author.

Acknowledgments

This study was carried out within the PhD program in Agricultural, Forest and Food Sciences at the University of Basilicata, in association with the University of Salerno. The authors acknowledge Giovanni Battista Mellone for allowing the research to be carried out at KIWI-SUD Farm located in Eboli (Salerno Province).

Conflicts of Interest

The authors declare no conflicts of interest.

Appendix A. Python Code for Climate Data Cleaning and Analysis

The following Python scripts were used to process daily climate data from the Eboli (SA) monitoring station for the period 2019–2024.
The code is reported in its original form (variable and function names in Italian) as used during the analysis.
English comments and docstrings were added for clarity.
All operations were performed according to ISPRA guidelines for the computation of climate indices.
The preprocessing routines were designed to ensure temporal continuity, removal of anomalous or impossible values, and basic gap-filling based on seasonal averages.

Appendix A.1. Data Pre-Processing

This script performs a sequential cleaning of the raw dataset.
It first checks the presence of all calendar dates within the study period (2019–2024) and, if any day is missing, a new row is added with the corresponding date and empty (NaN) values to maintain a continuous daily timeline.
Outliers are then removed using the Interquartile Range (IQR) method, and physically impossible records (e.g., Tmin < −40 °C, Tmax > 50 °C, Precip < 0 mm) are set to NaN.
Missing values are filled using a day-of-year mean substitution, which replaces each missing record with the average value for that day across all available years.
This procedure preserves the seasonal cycle of each variable without introducing synthetic variability.
Finally, internal consistency is verified by ensuring that Tmax > Tmed > Tmin for every day.
 
"""
Appendix A.1—Data pre-processing
Author: Alessandra Lepore
Last modified: 21/06/2025
Python version: 3.12.1
"""
import pandas as pd
import numpy as np
 
def riempi_date_mancanti(df, start_year, end_year):
       """
       Fill missing dates between start_year and end_year to ensure a continuous daily timeline.
       """
       intervallo_date = pd.date_range(start=f’{start_year}−01-01’, end=f’{end_year}−12-31’)
       df[‘Date’] = pd.to_datetime(df[‘Data’], format=‘%d/%m/%Y’, errors=‘coerce’)
       df.set_index(‘Date’, inplace=True)
       df = df.reindex(intervallo_date).reset_index().rename(columns={‘index’: ‘Date’})
       return df
 
def rimuovi_outliers(df, colonna, fattore = 1.5):
       """
       Remove outliers using the Interquartile Range (IQR) method.
       """
       Q1, Q3 = df[colonna].quantile([0.25, 0.75])
       IQR = Q3 − Q1
       low, high = Q1 − fattore*IQR, Q3 + fattore*IQR
       df.loc[(df[colonna] < low) | (df[colonna] > high), colonna] = np.nan
       return df
 
def controlla_valori_impossibili(df):
       """
       Identify and replace impossible meteorological records (e.g., Tmin < −40 °C, Tmax > 50 °C, Precip < 0 mm).
       """
       mask = ((df[‘Tmax’] > 50) | (df[‘Tmax’] < −30) |
                    (df[‘Tmin’] > 40) | (df[‘Tmin’] < −40) |
                    (df[‘Precip’] > 800) | (df[‘Precip’] < 0))
       df.loc[mask, [‘Tmax’,’Tmin’,’Precip’]] = np.nan
       tmax_tmin_zero = (df[‘Tmax’] == 0) & (df[‘Tmin’] == 0)
       df.loc[tmax_tmin_zero, [‘Tmax’,’Tmin’]] = np.nan
       return df
 
def stima_valori_mancanti_media_stagionale(df):
       """
       Estimate missing values using seasonal (day-of-year) mean replacement.
       """
       for c in [‘Tmax’,’Tmed’,’Tmin’,’Precip’]:
             df[‘dayofyear’] = df[‘Date’].dt.dayofyear
             df_mean = df.groupby(‘dayofyear’)[c].transform(‘mean’)
             df[c] = df[c].fillna(df_mean)
             df.drop(columns=[‘dayofyear’], inplace=True)
       return df
 
def verifica_condizione_tmax_tmed_tmin(df):
       """
       Ensure internal consistency: Tmax > Tmed > Tmin.
       """
       mask = (df[‘Tmax’] > df[‘Tmed’]) & (df[‘Tmed’] > df[‘Tmin’])
       df.loc[~mask, [‘Tmax’,’Tmed’,’Tmin’]] = np.nan
       return df

Appendix A.2. Climate Indices Calculation

This section computes annual climate indicators following ISPRA methodology:
frost days (Tmin ≤ 0 °C), summer days (Tmax > 25 °C), hot days (Tmax > 35 °C), tropical nights (Tmin > 20 °C), cumulative precipitation, and mean temperature values.
"""
Appendix A.2—Climate indices calculation
"""
import pandas as pd
def calcola_indici_climatici(df):
"""
Compute climate indices and aggregate them by year.
"""
df[‘frost_days’] = (df[‘Tmin’] <= 0).astype(int)
df[‘summer_days’] = (df[‘Tmax’] > 25).astype(int)
df[‘hot_days’] = (df[‘Tmax’] > 35).astype(int)
df[‘tropical_nights’] = (df[‘Tmin’] > 20).astype(int)
 
indici_annuali = df.groupby(df[‘Date’].dt.year).agg(
frost_days=(‘frost_days’,’sum’),
summer_days=(‘summer_days’,’sum’),
hot_days=(‘hot_days’,’sum’),
tropical_nights=(‘tropical_nights’,’sum’),
precip_cum=(‘Precip’,’sum’),
tmax_mean=(‘Tmax’,’mean’),
tmin_mean=(‘Tmin’,’mean’),
tmed_mean=(‘Tmed’,’mean’)
).reset_index(names=‘Year’)
return indici_annuali
# Example of usage
if __name__ == “__main__”:
df = pd.read_csv(“Processed_Eboli.csv”)
df[‘Date’] = pd.to_datetime(df[‘Date’])
indici = calcola_indici_climatici(df)
indici.to_csv(“Climate_Indices_Eboli.csv”, index=False)

Appendix A.3. Graphical Visualisation

Temperature, precipitation, and climate indices were visualised using custom Python scripts developed with the Matplotlib (v3.9.0) library. Plots were generated from the cleaned and reconstructed dataset (Appendix A.1 and Appendix A.2) and summarised the main climatic patterns observed at the Eboli (SA) station during 2019–2024.
The visualisation consisted of three panels:
(a)
Temperature and Precipitation for Eboli, combining mean, maximum, and minimum daily temperatures (°C) with cumulative monthly precipitation (mm) on a dual y-axis.
(b)
Cumulative Precipitation for Eboli, displaying the temporal trend of total monthly rainfall.
(c)
Climate Indices for Eboli, reporting monthly counts of frost days (Tmin ≤ 0 °C), summer days (Tmax > 25 °C), hot days (Tmax > 35 °C), and tropical nights (Tmin > 20 °C).
Each panel was plotted using the ggplot style of Matplotlib, with consistent colour palettes, labelled axes, and legends for clarity. Figures were exported at 600 dpi resolution in PNG format for publication.

Appendix B. Kriging Interpolation and Validation of EMI Data

The interpolation of apparent electrical conductivity (ECa) data collected at 3, 7 and 14 kHz was performed using the Smart-Map plugin for QGIS. Ordinary kriging was applied with an isotropic linear semivariogram model, which provided the best fit to the experimental data. Model performance was evaluated by cross-validation, showing high accuracy and spatial consistency across all frequencies.
Table A1. Summary of semivariogram and cross-validation parameters for the ordinary kriging interpolation of apparent electrical conductivity (ECa) data at three operating frequencies.
Frequency (kHz)Model Type1 Range
(m)
NuggetSillRMSE
(mS m−1)
R2Regression Equation (Cross-Validation)
3Isotropic linear≈120≈40≈1402.8810.918y = 1.024x − 2.223
7Isotropic linear≈120≈35≈1202.3420.935y = 1.035x − 2.714
14Isotropic linear≈120≈30≈1252.1510.949y = 1.027x − 1.848
1 Range indicates the distance beyond which spatial autocorrelation becomes negligible; Nugget represents the semivariance at zero distance, accounting for measurement error or microscale variability; Sill denotes the total semivariance where the model stabilises; RMSE is the root mean square error from cross-validation; R2 indicates the coefficient of determination between observed and predicted values; the regression equation describes the relationship obtained from leave-one-out cross-validation.
All interpolated maps were produced on a 10 m grid and subsequently used for data fusion with Sentinel-2 indices. The high R2 values and low RMSE confirmed the robustness of the spatial models and the reliability of the resulting ECa layers.

Appendix C. Estimated Soil Hydraulic Parameters

Appendix C.1. Regional Pedological Profile (CP1P83)

The hydraulic properties of the regional pedological reference profile CP1P83, representative of the 0–30 cm horizon, were estimated using the pedotransfer functions (PTFs) developed by Saxton and Rawls (2006) [42], which relate soil water retention characteristics to texture and organic matter content. The input data for sand, silt, clay and organic carbon were taken from the official Soil Survey of the Campania Region.
The particle density was set at 2.65 g cm−3, as recommended by the FAO Guidelines for Soil Description (2006) [45] for mineral soils, and used as a reference value to derive total porosity. The bulk density of the surface horizon was fixed at 1.29 g cm−3, consistent with both the CP1P83 dataset and the typical range reported for clay-loam topsoils in Mediterranean environments.
The volumetric water contents at field capacity (θ33, corresponding to a matric potential of −33 kPa) and at the permanent wilting point (θ1500, corresponding to −1500 kPa) were estimated directly from the PTFs. The available water content (AWC) was then derived as the difference between θ33 and θ1500, while the saturation water content (θs) was calculated from the ratio between bulk and particle densities. The resulting porosity was expressed as the fraction of the soil volume occupied by pores and was therefore considered equivalent to θs.
The plant-available water (PAW) for the 0–30 cm horizon was obtained by multiplying AWC, expressed in cubic metres of water per cubic metre of soil, by the layer thickness (300 mm). All water contents were also expressed in percentage by volume to facilitate comparison with other datasets.
For CP1P83, the volumetric water content at field capacity was 0.390 m3 m−3 (39.0% v/v) and that at the permanent wilting point was 0.234 m3 m−3 (23.4% v/v), yielding an AWC of 0.156 m3 m−3 (15.6% v/v). The corresponding PAW was therefore 46.8 mm.
With a bulk density of 1.29 g cm−3 and a particle density of 2.65 g cm−3, total porosity (θs) was approximately 0.513, or 51.3% v/v. Minor numerical differences (<0.1%) between computed and tabulated values result solely from rounding.
Table A2. Estimated soil hydraulic parameters for the 0–30 cm horizon of profile CP1P83. Values were calculated using the pedotransfer functions of Saxton and Rawls (2006) [42] based on measured texture and organic carbon content.
ProfileDepth
(cm)
TextureOrganic Carbon
(g kg−1)
1 θ1500
(% v/v)
θ33
(% v/v)
θs
(% v/v)
AWC
(% v/v)
Bulk Density (ρb) (g cm−3)PAW
(mm)
CP1P830–30Clay-loam
(22.3% sand, 38.4% silt, 39.3% clay)
1723.43951.315.51.2946.6
1 θ1500: volumetric water content at −1500 kPa (permanent wilting point). θ33: volumetric water content at −33 kPa (field capacity). θs: saturation water content. AWC: available water content (θ33 − θ1500). Bulk density (ρb) estimated assuming a particle density of 2.65 g cm−3. PAW: plant-available water in the 0–30 cm layer, obtained by multiplying AWC (m3 m−3) by horizon thickness (300 mm).

Appendix C.2. Field Sampling Locations: Estimation Procedure and Internal Consistency

For the twelve field sampling locations used for laboratory analyses, composite soil samples were prepared by combining three subsamples collected at the vertices of an equilateral triangle within the 0–30 cm horizon. The same pedotransfer functions by Saxton and Rawls (2006) [42] were applied to the laboratory-measured sand, silt, clay and organic carbon fractions to estimate the water contents at field capacity and at the permanent wilting point for each composite sample. To ensure comparability with the regional reference profile, the bulk density was kept constant at 1.29 g cm−3, reflecting the homogeneous clay-loam texture of the study area. The available water content for each sample was calculated as the difference between the two estimated volumetric water contents, and the plant-available water was subsequently derived by multiplying this value by the depth of the sampled layer (300 mm). Across the twelve field samples, θ1500 ranged between 0.22 and 0.25 m3 m−3, while θ33 varied between 0.36 and 0.41 m3 m−3. The mean available water content was 0.153 ± 0.009 m3 m−3, corresponding to an average plant-available water of 46.0 ± 2.7 mm. These results are consistent with those obtained for the regional profile CP1P83 (Table A3), confirming the reliability of the pedotransfer-based estimates. The observed agreement between the regional profile and the field-sampled data indicates a coherent internal calibration of the estimation procedure and supports the use of CP1P83 as a valid pedological benchmark for the study area.
Table A3. Estimated soil hydraulic parameters for the twelve composite soil samples (0–30 cm horizon), derived from the pedotransfer functions of Saxton and Rawls (2006) [42].
Sample ID1 θ1500 (m3 m−3)θ33 (m3 m−3)AWC (m3 m−3)PAW (mm)
10.230.370.1442
20.240.380.1443
30.230.390.1648
40.220.370.1545
50.240.40.1648
60.230.390.1647
70.230.380.1546
80.240.40.1648
90.220.360.1443
100.230.390.1647
110.250.410.1648
120.240.40.1647
Mean ± SD0.23 ± 0.010.39 ± 0.020.15 ± 0.0146 ± 2
1 θ1500: volumetric water content at −1500 kPa (permanent wilting point); θ33: at −33 kPa (field capacity); AWC: available water content (θ33 − θ1500); PAW: plant-available water in the 0–30 cm layer (AWC × 300 mm).

References

  1. Gasmi, A.; Gomez, C.; Chehbouni, A.; Dhiba, D.; Elfil, H. Satellite multi-sensor data fusion for soil clay mapping based on the spectral index and spectral bands approaches. Remote Sens. 2022, 14, 1103. [Google Scholar] [CrossRef]
  2. Kosma, C.; Triantafyllidis, V.; Zotos, A.; Pittaras, A.; Kouneli, V.; Karydogianni, S.; Mavroeidis, A.; Kakabouki, I.; Beslemes, D.; Tigka, E.L.; et al. Assessing spatial variability of soil properties in Mediterranean smallholder farming systems. Land 2022, 11, 557. [Google Scholar] [CrossRef]
  3. Dharumarajan, S.; Hegde, R.; Janani, N.; Singh, S.K. The need for digital soil mapping in India. Geoderma Reg. 2019, 16, e00204. [Google Scholar] [CrossRef]
  4. Metwally, M.S.; Shaddad, S.M.; Liu, M.; Yao, R.-J.; Abdo, A.I.; Li, P.; Jiao, J.; Chen, X. Soil properties spatial variability and delineation of site-specific management zones based on soil fertility using fuzzy clustering in a hilly field in Jianyang, Sichuan, China. Sustainability 2019, 11, 7084. [Google Scholar] [CrossRef]
  5. Vaudour, E.; Gomez, C.; Fouad, Y.; Lagacherie, P. Sentinel-2 image capacities to predict common topsoil properties of temperate and Mediterranean agroecosystems. Remote Sens. Environ. 2019, 223, 21–33. [Google Scholar] [CrossRef]
  6. Elnashar, A.; Hussein, H.; Goma, R.; El Baroudy, A.; Belal, A. Potential of Sentinel-2 Images for Estimating of Soil Resistivity over Agricultural Fields. Remote Sens. Appl. Soc. Environ. 2019, 15, 100243. [Google Scholar] [CrossRef]
  7. Serrano, J.; Shahidian, S.; Moral, F.; Marques da Silva, J.; Paixão, L. Integration of soil electrical conductivity and indices obtained through satellite imagery for differential management of pasture fertilization. AgriEngineering 2019, 1, 567–585. [Google Scholar] [CrossRef]
  8. Serrano, J.; Shahidian, S.; Paixão, L.; Marques da Silva, J.; Moral, F. Management zones in pastures based on soil apparent electrical conductivity and altitude: NDVI, soil and biomass sampling validation. Agronomy 2022, 12, 778. [Google Scholar] [CrossRef]
  9. Grobler, E.; Celano, G. Photogrammetric and LiDAR Scanning with iPhone 13 Pro: Accuracy, Precision and Field Application on Hazelnut Trees. Sensors 2025, 25, 5629. [Google Scholar] [CrossRef]
  10. Win, K.; Sato, T.; Hiroshima, T. Applicability of remote sensing and machine learning for predicting bulk soil electrical conductivity under different forest types in central Japan. Soil Adv. 2025, 3, 100045. [Google Scholar] [CrossRef]
  11. Bréchet, L.; Oatham, M.; Wuddivira, M.; Robinson, D.A. Determining spatial variation in soil properties in teak and native tropical forest plots using electromagnetic induction. Vadose Zone J. 2012, 11, vzj2011.0102. [Google Scholar] [CrossRef]
  12. Climate-Data.org. Climate: Eboli (Campania, Italy). Available online: https://en.climate-data.org/europe/italy/campania/eboli-14220/ (accessed on 25 September 2025).
  13. Capozzi, V.; Russo, F.; Mariani, L.; Montanari, A. Signals of change in the Campania region rainfall regime: An analysis of extreme precipitation indices (2002–2021). Meteorol. Appl. 2023, 30, e2168. [Google Scholar] [CrossRef]
  14. Regione Campania. Agrometeo Campania—Eboli (SA) Monitoring Station. Available online: https://agricoltura.regione.campania.it/meteo/dati_2025/eboli_2025.html (accessed on 16 September 2025).
  15. Regione Campania. I Suoli della Piana del Sele—Destra Idrografica; Progetto Carta dei Suoli della Campania 1:50.000; Regione Campania—Assessorato Agricoltura: Napoli, Italy, 2012. [Google Scholar]
  16. McNeill, J.D. Electromagnetic Terrain Conductivity Measurement at Low Induction Numbers; Technical Note TN-6; Geonics Limited: Mississauga, ON, Canada, 1980; Available online: https://geonics.com/pdfs/technicalnotes/tn6.pdf (accessed on 2 November 2025).
  17. Doolittle, J.A.; Brevik, E.C. The use of electromagnetic induction techniques in soils studies. Geoderma 2014, 223, 33–45. [Google Scholar] [CrossRef]
  18. Corwin, D.L.; Lesch, S.M. Applications of apparent soil electrical conductivity in precision agriculture. Comput. Electron. Agric. 2005, 46, 11–43. [Google Scholar] [CrossRef]
  19. GSSI. EMP-400 Profiler: User Manual; Geophysical Survey Systems Inc.: Nashua, NH, USA, 2023. [Google Scholar]
  20. GSSI. Profiler EMP-400—Product Page/Brochure. Available online: https://www.geophysical.com (accessed on 9 October 2025).
  21. Saey, T.; Simpson, D.; Vermeersch, H.; Cockx, L.; Van Meirvenne, M. Comparing the EM38DD and DUALEM-21S Sensors for Depth-to-Clay Mapping. Soil Sci. Soc. Am. J. 2009, 73, 7–12. [Google Scholar] [CrossRef]
  22. Tazifor, M.; von Hebel, C.; Zimmermann, E. Model-Based Correction of Temperature-Dependent Measurement Errors in Frequency Domain Electromagnetic Induction (FDEMI) Systems. Sensors 2022, 22, 3882. [Google Scholar] [CrossRef]
  23. Pereira, G.W.; Valente, D.S.M.; Queiroz, D.M.D.; Coelho, A.L.D.F.; Hurtado, S.M.C.; Costa, M.M.; Grift, T. Smart-Map: An Open-Source QGIS Plugin for Digital Mapping Using Machine Learning Techniques and Ordinary Kriging. Agronomy 2022, 12, 1350. [Google Scholar] [CrossRef]
  24. QGIS Python Plugins Repository—Smart-Map. Available online: https://plugins.qgis.org (accessed on 25 September 2025).
  25. Lesch, S.M.; Rhoades, J.D.; Corwin, D.L. ESAP-95 Version 2.01R: User Manual and Tutorial Guide; Research Report No. 146; U.S. Salinity Laboratory, USDA-ARS: Riverside, CA, USA, 2000. Available online: https://www.ars.usda.gov/arsuserfiles/20360500/pdf_pubs/P1702.pdf (accessed on 25 September 2025).
  26. USDA-ARS. ESAP Software Suite: XP-Release Version 2.35—User Guide; U.S. Salinity Laboratory, USDA-ARS: Riverside, CA, USA, 2003. Available online: https://irrigationtoolbox.com/NEH/UserGuides/ESAP2Point35.pdf (accessed on 25 September 2025).
  27. Walkley, A.; Black, I.A. An examination of the Degtjareff method for determining soil organic matter and a proposed modification of the chromic acid titration method. Soil Sci. 1934, 37, 29–38. [Google Scholar] [CrossRef]
  28. Pauwels, J.M.; Van Ranst, E.; Verloo, M.; Mvondo Ze, A. Méthode d’Analyse de Sols et de Plantes, Gestion de Stock de Verrerie et de Produits Chimiques. Manuel de Laboratoire de Pédologie; Publications Agricoles, AGCD: Bruxelles, Belgium, 1992; p. 28. [Google Scholar]
  29. Nativel, S.; Ayari, E.; Rodriguez-Fernandez, N.; Baghdadi, N.; Madelon, R.; Albergel, C.; Zribi, M. Hybrid Methodology Using Sentinel-1/Sentinel-2 for Soil Moisture Estimation. Remote Sens. 2022, 14, 2434. [Google Scholar] [CrossRef]
  30. Rikimaru, A.; Roy, P.S.; Miyatake, S. Tropical Forest cover density mapping. Trop. Ecol. 2002, 43, 39–47. [Google Scholar]
  31. Pukelsheim, F. The three-sigma rule. Am. Stat. 1994, 48, 88–91. [Google Scholar] [CrossRef]
  32. Little, R.J.A.; Rubin, D.B. Statistical Analysis with Missing Data, 3rd ed.; Wiley: Hoboken, NJ, USA, 2019. [Google Scholar] [CrossRef]
  33. Kaiser, H.F. An index of factorial simplicity. Psychometrika 1974, 39, 31–36. [Google Scholar] [CrossRef]
  34. Jolliffe, I.T.; Cadima, J. Principal component analysis: A review and recent developments. Philos. Trans. R. Soc. A 2016, 374, 20150202. [Google Scholar] [CrossRef]
  35. Bartlett, M.S. Tests of significance in factor analysis. Br. J. Psychol. 1950, 3, 77–85. [Google Scholar] [CrossRef]
  36. Fox, J.; Weisberg, S. An R Companion to Applied Regression, 3rd ed.; SAGE: Thousand Oaks, CA, USA, 2019; Available online: https://www.john-fox.ca/Companion/ (accessed on 2 November 2025).
  37. Wickham, H. ggplot2: Elegant Graphics for Data Analysis, 2nd ed.; Springer: Cham, Switzerland, 2016. [Google Scholar] [CrossRef]
  38. Revelle, W. psych: Procedures for Psychological, Psychometric, and Personality Research, R package version 2.5.6; Northwestern University: Evanston, IL, USA, 2025; Available online: https://cran.r-project.org/package=psych (accessed on 1 October 2025).
  39. Maier, M.J. REdaS: Companion Package to the Book “R: Einführung Durch Angewandte Statistik”; R Package Version 0.9.4. 2022. Available online: https://cran.r-project.org/package=REdaS (accessed on 25 September 2025).
  40. Kolde, R. pheatmap: Pretty Heatmaps. R Package Version 1.0.13. 2025. Available online: https://cran.r-project.org/package=pheatmap (accessed on 25 September 2025).
  41. Bougiouklis, J.N.; Barouchas, P.E.; Petropoulos, P.; Tsesmelis, D.E.; Moustakes, N. Precision soil sampling strategy for the delineation of management zones in olive cultivation using unsupervised machine learning methods. Sci. Rep. 2025, 15, 89395. [Google Scholar] [CrossRef]
  42. Saxton, K.E.; Rawls, W.J. Soil Water Characteristic Estimates by Texture and Organic Matter for Hydrologic Solutions. Soil Sci. Soc. Am. J. 2006, 70, 1569–1578. [Google Scholar] [CrossRef]
  43. Abou Najm, M.R.; Al-Mashaqbeh, I.A.; Al-Karablieh, E.K.; Kandakji, T.; Shatnawi, A.; Al-Zubi, Y.; Masri, Z. Sensor fusion of proximal and remote sensing data improves soil management zone delineation and prediction of soil properties. Soil Tillage Res. 2024, 242, 105866. [Google Scholar] [CrossRef]
  44. Win, K.; Sato, T.; Hiroshima, T.; Matsumoto, K.; Takahashi, S.; Yamamoto, Y. Integrating proximal geophysical surveys with Sentinel-2 imagery improves soil property mapping across agroecosystems. SOIL 2025, 11, 655–670. [Google Scholar] [CrossRef]
  45. FAO. Guidelines for Soil Description, 4th ed.; Food and Agriculture Organization of the United Nations: Rome, Italy, 2006. [Google Scholar]
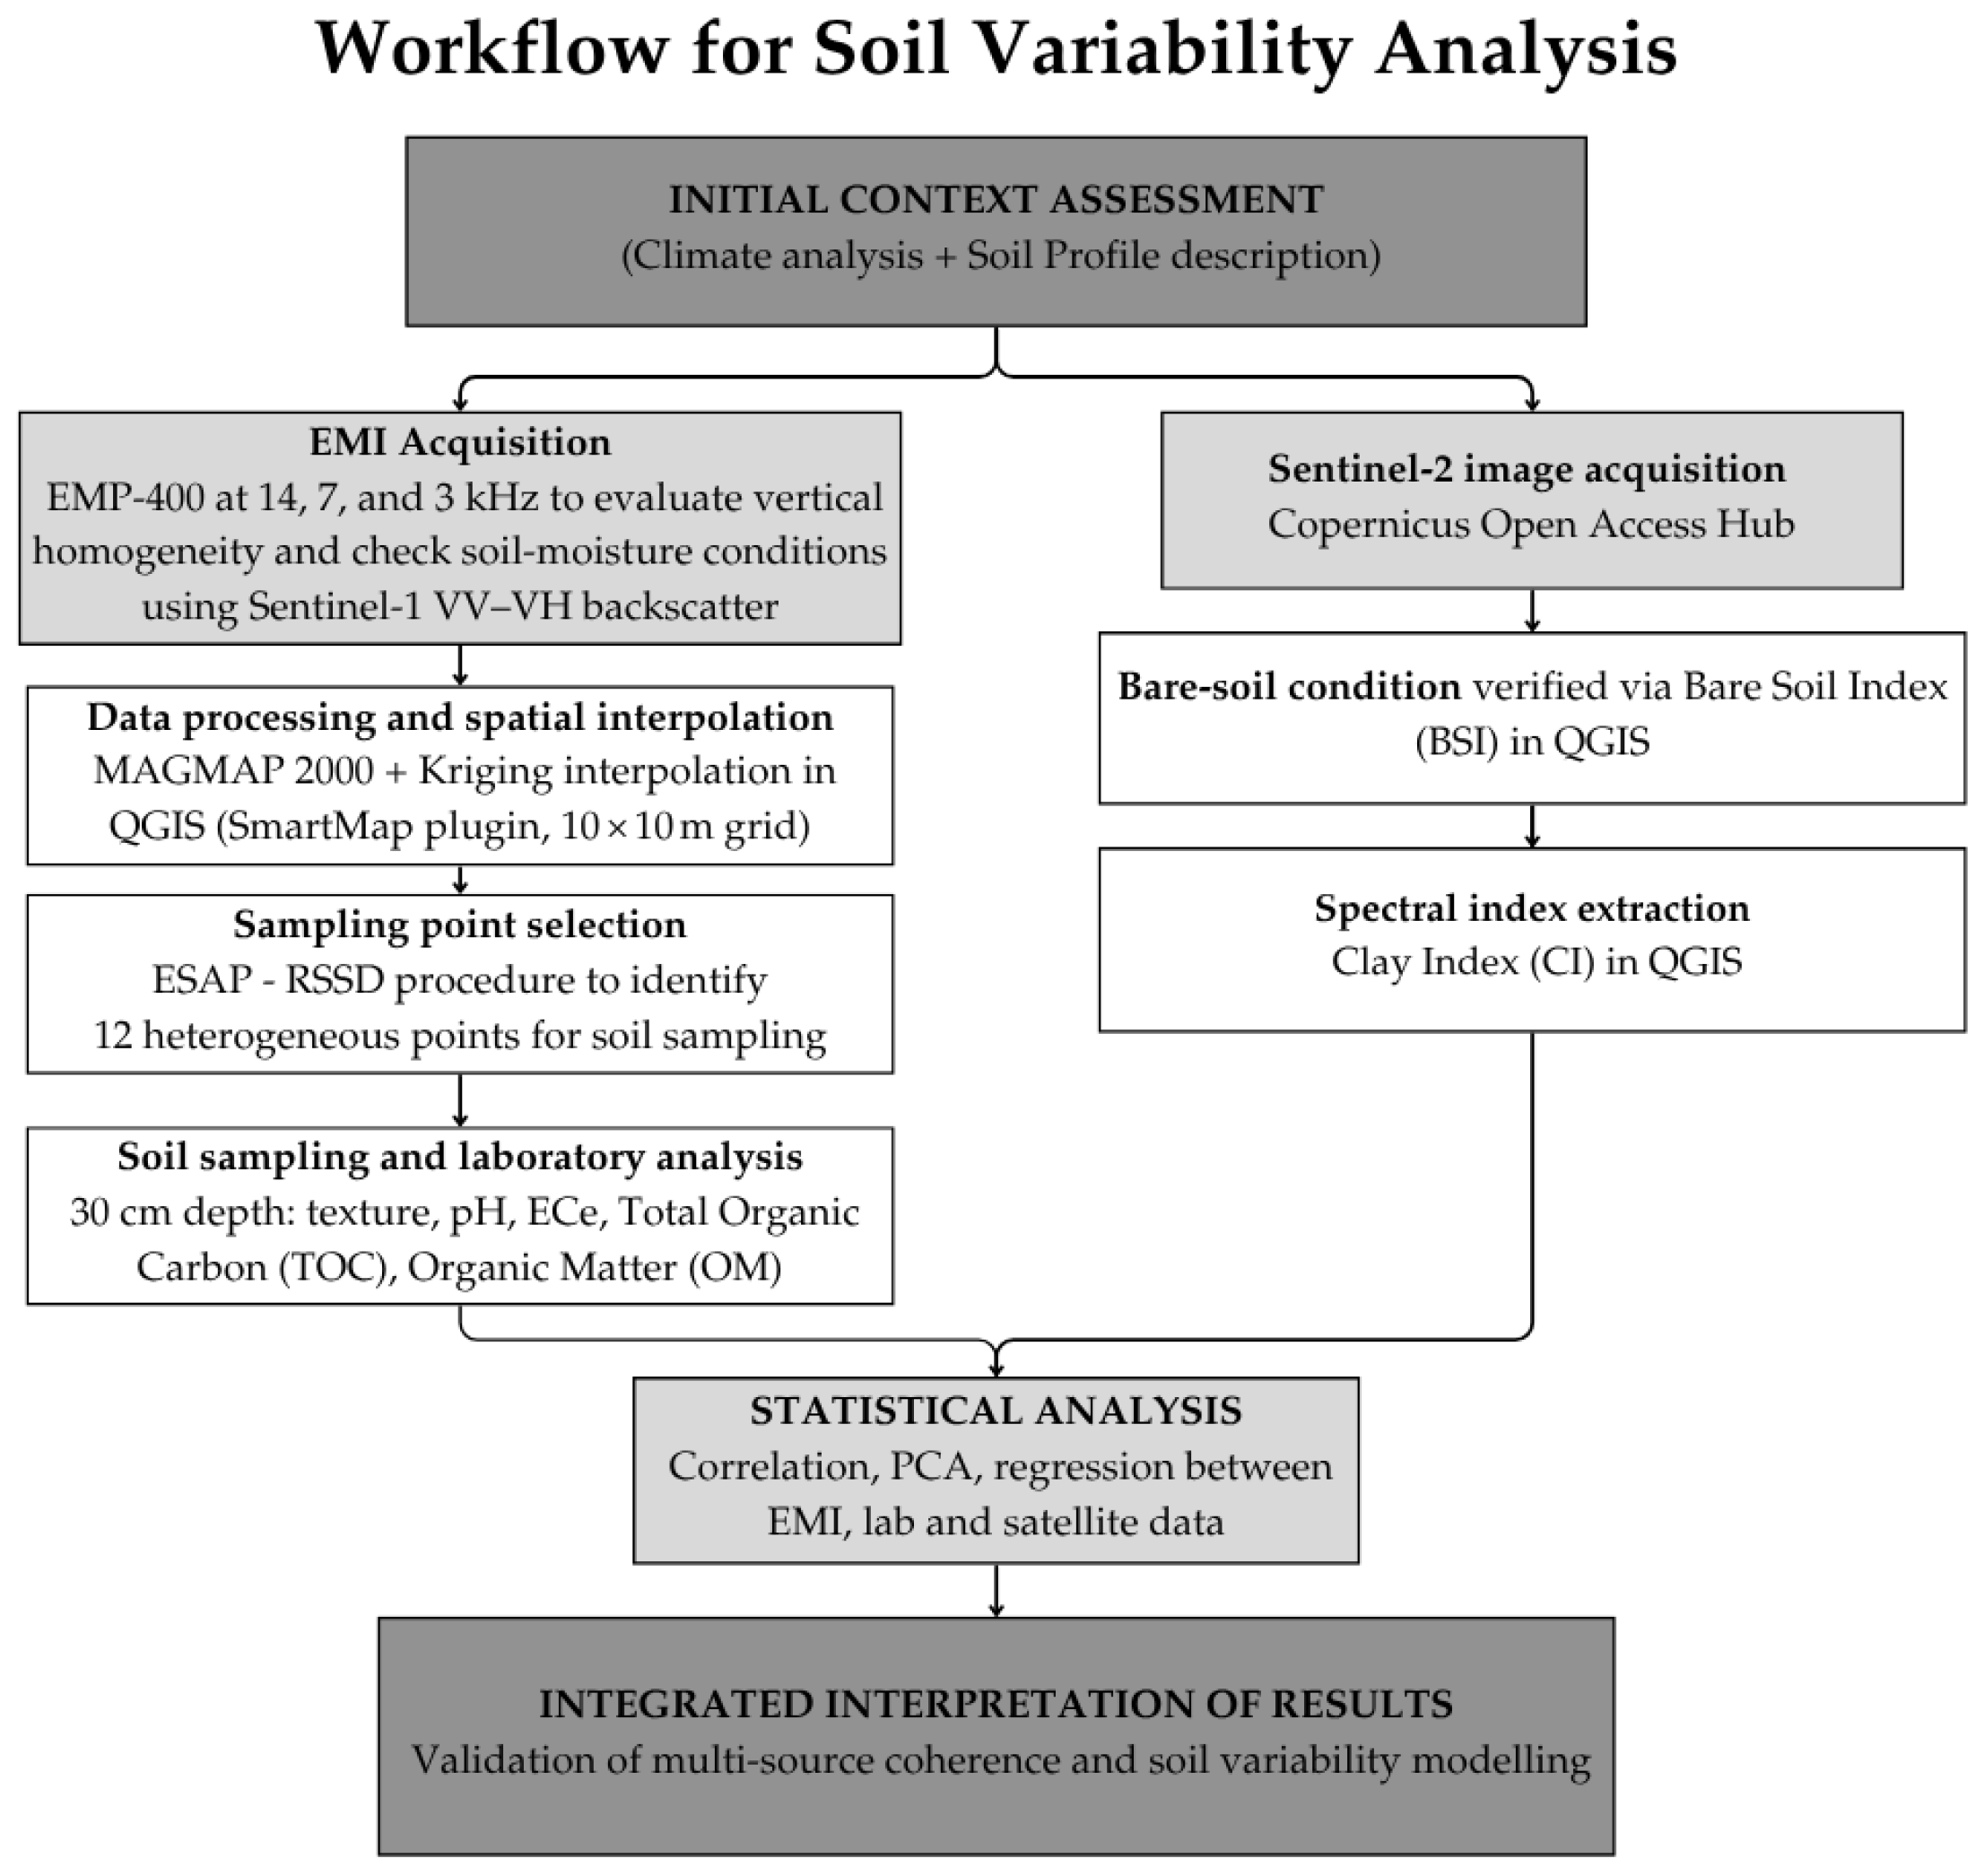
Figure 1. Workflow of methodology. The diagram summarises the sequential steps of the experimental design, integrating climate and soil profile characterisation, proximal (EMI), with Sentinel-1 moisture verification, and remote (Sentinel-2) sensing, spatial data processing with interpolation, soil sampling with laboratory analyses, followed by statistical modelling to evaluate soil variability and assess coherence across data sources.
Applsci 15 11796 g001
Figure 2. (a) Location of the experimental site in southern Italy (Sele Plain, Campania); the Campania Region is outlined in red and Italian regions are shown in green for clarity. (b) Orthophotograph of Field 6C (Eboli, Salerno) obtained from Google Earth (2024) and georeferenced in QGIS. The field boundary is delineated in yellow, with the north arrow and scale bar included for spatial reference. The base image is provided for illustrative purposes only and was not used for analytical processing.
Applsci 15 11796 g002
Figure 3. Climate characterisation of the study area from the Eboli (SA) station (2019–2024). The x-axis shows the monthly dates in all three panels. (a) Seasonal cycle of maximum, mean and minimum air temperatures (°C) with corresponding monthly precipitation (mm). (b) Cumulative monthly precipitation (mm), highlighting interannual variability with alternating peaks and drought periods. (c) Monthly counts of climate indices: frost days (Tmin ≤ 0 °C), summer days (Tmax > 25 °C), hot days (Tmax > 35 °C), and tropical nights (Tmin > 20 °C).
Applsci 15 11796 g003
Figure 4. Soil map of the Sele Plain (1:50,000; Campania Region) produced in QGIS. Field 6C is represented by the yellow polygon and falls within pedological profile CP1P83. A red sequential colour scale depicts and classifies the different soil map units across the plain.
Applsci 15 11796 g004
Figure 5. (a) Schematic layout of the EMI survey. The red polyline with arrows indicates the operator’s path and direction; the blue symbol marks the start point; black lines depict planned transects. (b) Georeferenced EMI survey points displayed over a high-resolution satellite image.
Applsci 15 11796 g005
Figure 6. Apparent electrical conductivity (ECa, mS m−1) surfaces derived by ordinary kriging from EMI measurements in Field 6C. (a) 14 kHz map capturing near-surface heterogeneity; (b) 7 kHz map representing intermediate depth; (c) 3 kHz map reflecting the deeper response; (d) design of the twelve soil-sampling locations (red points) selected according ESAP-RSSD method, overlaid on the kriged 14 kHz ECa map (indicated by the red arrow in panel c).
Applsci 15 11796 g006
Figure 7. Boxplots of soil physicochemical and textural properties at 30 cm depth (n = 12). Panel (a) shows pH, TOC and OM (g kg−1), and ECe (mS m−1; right-hand y-axis). Panel (b) shows sand, silt, clay and skeleton (g kg−1). Boxes represent the interquartile range with the median; whiskers correspond to 1.5 × IQR and outliers are shown as black dots.
Applsci 15 11796 g007
Figure 8. Relationship between apparent electrical conductivity (ECa, 14 kHz) and Sentinel-1 radar-derived surface moisture (VV–VH, dB). (a) Linear regression between ECa and the Sentinel-1 backscatter difference (Equation (1)). (b) Comparison between original and moisture-corrected ECa values (Equation (2)). The weak correlation (p > 0.05) indicates that near-surface soil moisture did not significantly affect ECa measurements collected during the field survey. The linear fit is represented by the red line, and individual observations are shown as black dots.
Applsci 15 11796 g008
Figure 9. (a) Sentinel-2 true colour image of Field 6C (outlined in yellow). (b) Bare Soil Index (BSI) map derived from the same image, showing uniformly high values (>0.2) across the field, thereby confirming the absence of green vegetation at the time of acquisition and validating the conditions for reliable spectral index computation. (c) Spatial distribution of spectral Clay Index (CI).
Applsci 15 11796 g009
Figure 10. Heatmap of Pearson correlation coefficients among all variables, with hierarchical clustering of rows and columns. Positive correlations are shown in red, negative correlations in blue.
Applsci 15 11796 g010
Figure 11. Ordinary least-squares (OLS) relationships between key variables. Scatter plots show (a) CI vs. ECa, (b) Clay vs. ECa and (c) Clay vs. CI. Shaded areas denote 95% confidence intervals. In-panel labels report the regression equation and R2; n = 12.
Applsci 15 11796 g011
Figure 12. PCA results. (a) Scree plot; PC1 = 62.7%, PC2 = 21.4%. (b) Biplot of PC1–PC2 (scores = points; loadings = vectors). Variables associated with finer texture, higher salinity and higher organic fraction point in the direction of PC1.
Applsci 15 11796 g012
Figure 13. Relationship between apparent electrical conductivity (ECa, mS m−1; EMI) and the first principal component (PC1), which summarises the joint gradient of clay, salinity and organic fraction. Shaded areas denote 95% confidence intervals.
Applsci 15 11796 g013
Figure 14. Management zones derived from the fusion of normalized 14 kHz apparent electrical conductivity (ECa) and Sentinel-2 Clay Index (CI) rasters. The map shows three classes (low, medium, high ECa–CI) corresponding to spatial variations in soil texture and mineralogical composition. The basemap includes field boundaries, scale bar and north arrow.
Applsci 15 11796 g014
Table 1. Summary of climatic indices (Source: ISPRA; elaboration of Agrometeo Campania data).
Climate IndexCalculation Criterion
Frost DaysCount of days with Tmin <= 0 °C
Summer DaysCount of days with Tmax > 25 °C
Hot DaysCount of days with Tmax > 35 °C
Tropical NightsCount of days with Tmin > 20 °C
Cumulative PrecipitationSum of daily precipitation amounts
Maximum TemperatureDaily maximum air temperature (Tmax)
Average TemperatureDaily mean air temperature (Tmed)
Minimum TemperatureDaily minimum air temperature (Tmin)
Table 2. Basic physical and chemical properties of the soil profile CP1P83 (Pachic Phaeozem).
ProfileDepth
(cm)
Sand
(g kg−1)
Silt
(g kg−1)
Clay
(g kg−1)
pHCEC 1
(meq kg−1)
Organic Carbon
(g kg−1)
CP1P830–302233843938.625717
CP1P8330–852634043338.22518
CP1P8385–1503034662318.12607
1 CEC: cation exchange capacity.
Table 3. Carbonate content and exchangeable cations in the soil profile CP1P83 (Pachic Phaeozem).
ProfileDepth
(cm)
Total
Carbonates
(g kg−1)
Exchangeable Sodium
(meq kg−1)
Exchangeable
Potassium
(meq kg−1)
Exchangeable Calcium
(meq kg−1)
Exchangeable Magnesium
(meq kg−1)
CP1P830–3027815.236.9150.354.5
CP1P8330–852707.26.9209.824.0
CP1P8385–1502551.84.9226.726.4
Table 4. Sentinel-2 spectral bands employed for the calculation of the Bare Soil Index (BSI) and Clay Index (CI), with corresponding spectral region, central wavelength and spatial resolution.
BandSpectral RegionCentral Wavelength (ρ, nm)Spatial Resolution (m)
BlueVisible49010
RedVisible66510
NIRNear infrared84210
SWIR1Shortwave IR161020
SWIR2Shortwave IR219020
Table 5. Summary statistics of apparent electrical conductivity (ECa) values derived from quadrature response at three operating frequencies obtained by GSSI Profiler EMP-400.
Frequency (kHz)MinMeanMaxStd. Dev 1
14 kHz33.774.8107.575.9
7 kHz40.082.7114.183.8
3 kHz50.995.8163.597.0
Std. Dev 1: standard deviation. ECa values are in mS m−1.
Table 6. Summary statistics of soil properties (30 cm depth; n = 12).
Soil Propertiesn 1MinMeanMaxStd. DevSEMCV
pH127.77.98.00.10.01.2
ECe1286.6148.3213.445.313.130.6
Skeleton127912918430.58.823.6
Sand1230539045150.914.713.0
Silt1211119327253.115.327.6
Clay1240341943912.13.52.9
TOC1213.415.417.01.00.36.8
OM1223.126.429.21.80.56.8
n 1, number of samples; ECe, electrical conductivity, reported in mS m−1; Skeleton, Sand, Silt and Clay, g kg−1; TOC and OM, g kg−1. Min, minimum; Mean, arithmetic mean; Max, maximum; Std. Dev, standard deviation; SEM, standard error of the mean; CV, coefficient of variation.
Table 7. Pearson correlation coefficients (r) and determination coefficients (R2) between apparent electrical conductivity (ECa, mS m−1, EMI), soil laboratory parameters and Sentinel-2 spectral index. ECa was used as the reference variable for the correlation analysis. Values are computed on the twelve ESAP-RSSD sampling sites.
VariablerR2
1 ECe0.8840.781
Clay0.8720.761
CI0.8720.760
TOC0.4340.188
OM0.4200.177
pH−0.2500.063
Sand−0.1310.017
Silt0.0240.001
Skeleton0.0120.000
1 ECe, electrical conductivity, reported in mS m−1; Skeleton, Sand, Silt and Clay, g kg−1; TOC and OM, g kg−1.
Table 8. Loadings (standardised) on the first two principal components. Positive values denote variables contributing to the same direction as the component.
VariablePC1PC2
1 ECe0.480.05
Clay0.420.36
CI0.470.28
TOC0.4−0.52
OM0.4−0.52
pH−0.23−0.5
1 ECe, electrical conductivity, reported in mS m−1; Clay, g kg−1; TOC and OM, g kg−1.
Disclaimer/Publisher’s Note: The statements, opinions and data contained in all publications are solely those of the individual author(s) and contributor(s) and not of MDPI and/or the editor(s). MDPI and/or the editor(s) disclaim responsibility for any injury to people or property resulting from any ideas, methods, instructions or products referred to in the content.