1. Introduction
As a result of compressional metamorphism associated with the uplift of the Qinghai–Tibet and Pamir Plateaus, followed by prolonged tectonic exhumation, extensive gneiss formations are exposed in cold, high-altitude regions of China, such as Qinghai [
1,
2,
3], Tibet [
4,
5], and Xinjiang [
6,
7]. For instance, the Tianshan Mountains [
8,
9], Altai Mountains [
10], Himalayas [
5], and Kunlun Mountains [
11] all feature large gneiss outcrop zones, which are also renowned metallogenic belts hosting abundant metal and non-metal deposits [
12,
13,
14]. Consequently, many mines in these high-altitude regions are situated within gneiss formations, resulting in the formation of numerous high and steep gneiss slopes in open-pit mines [
15,
16,
17]. The stability of these slopes is one of the critical factors ensuring mining safety.
Gneiss, composed of alternately arranged light-colored minerals such as quartz and feldspar, and dark-colored minerals like mica and amphibole, exhibits a banded structure and highly heterogeneous mechanical properties. Coupled with the synergistic effects of freeze–thaw cycles, groundwater seepage induced by rainfall and snowmelt, and mining blasting in cold and mining environments, the rock mass is prone to failure along the gneissic foliation, leading to the overall instability of open-pit slopes [
18,
19,
20,
21,
22]. On 29 March 2013, at the Jiama Mine in Tibet, China, rock mass degradation and instability caused by factors such as freeze–thaw cycles and mining blasting triggered a slope failure with a collapse volume exceeding 2 million cubic meters. Eighty-three on-site workers were buried, resulting in significant loss of life and property [
23]. On 22 June 2020, a slope failure occurred at a high and steep gneiss slope in the Jinbao Open-Pit Mine in Xinjiang, with a collapse volume of 4315.6 m
3. Thanks to timely early warnings, no casualties occurred, but economic losses exceeded 40 million RMB. On 14 September 2023, another landslide (hereinafter referred to as the 14 September 2023 landslide) occurred at the same mine, with a volume of 1.0 × 10
5 m
3. This incident buried a large amount of equipment, halted production until April 2024, and caused economic losses exceeding 100 million RMB [
24]. Therefore, it is particularly urgent to study the failure mechanisms of gneiss slopes in open-pit mines located in cold regions at high altitudes or high latitudes.
Currently, the primary research approach in this field involves conducting indoor rock mechanics tests—such as direct shear tests, triaxial tests, and scanning electron microscopy (SEM) observations—to investigate the structural and strength deterioration laws of gneiss [
25,
26,
27,
28,
29,
30]. For example, Wang et al. [
31] carried out a test on the freeze–thaw cycle of gneiss, which showed that the internal cracks of rock would increase and expand continuously after the freeze–thaw cycle, resulting in the deterioration of rocky slope stability. Yang et al. [
32] studied the influence of F-T cycles on the creep properties of saturated gneiss. The experimental results showed that the increase in the number of F-T cycles increased the creep deformation of gneiss gradually, while the creep failure stress, creep duration, and long-term strength decreased significantly. Ciampittiello et al. [
33] analyzed daily rainfall data from meteorological stations across four subbasins related to 38 landslides occurring between 1980 and 2017 and found that intense rainfall acts as a concomitant trigger for landslides in certain contexts. Similarly, Achu et al. [
34] attributed a massive landslide in the Mundakkai–Chooralmala region on 30 July 2024 to extreme rainfall, highly weathered and sheared geological conditions, and specific slope morphologies. Kang et al. [
35] performed split Hopkinson pressure bar tests on gneiss and concluded that dynamic compressive loading considerably reduces its fracture resistance.
These investigations largely focus on the effects of individual or multiple factors—including unloading [
36], immersion [
37], freeze–thaw cycles [
38], seismic activity [
39,
40], high temperatures [
41,
42], and high in situ stress [
43]. Subsequently, based on experimental results, researchers often employ numerical modeling and physical model experiments [
44] to analyze how rock mass degradation influences slope stability [
25,
26,
27,
28,
29,
30]. However, due to limitations in experimental methods, there is currently no test that truly replicates the condition under the freezing-thawing, groundwater, and mining blasting experienced by rock masses in cold regions. Therefore, neither the degradation parameters and laws of rock masses in such an environment, nor their impact on slope stability, has been determined. Given this context, this study investigates failure mode and mechanisms of the 14 September 2023 landslide at the Jinbao Mine in Xinjiang. Leveraging existing experimental data from multi-factor direct shear tests [
45] and multi-field coupling tests [
46] on gneiss conducted by the authors, along with field monitoring and numerical simulations, we aim to reveal its deformation failure mode and mechanism. The research seeks to provide theoretical support for stability assessment and risk prediction of gneiss open-pit slopes.
2. Geological Settings
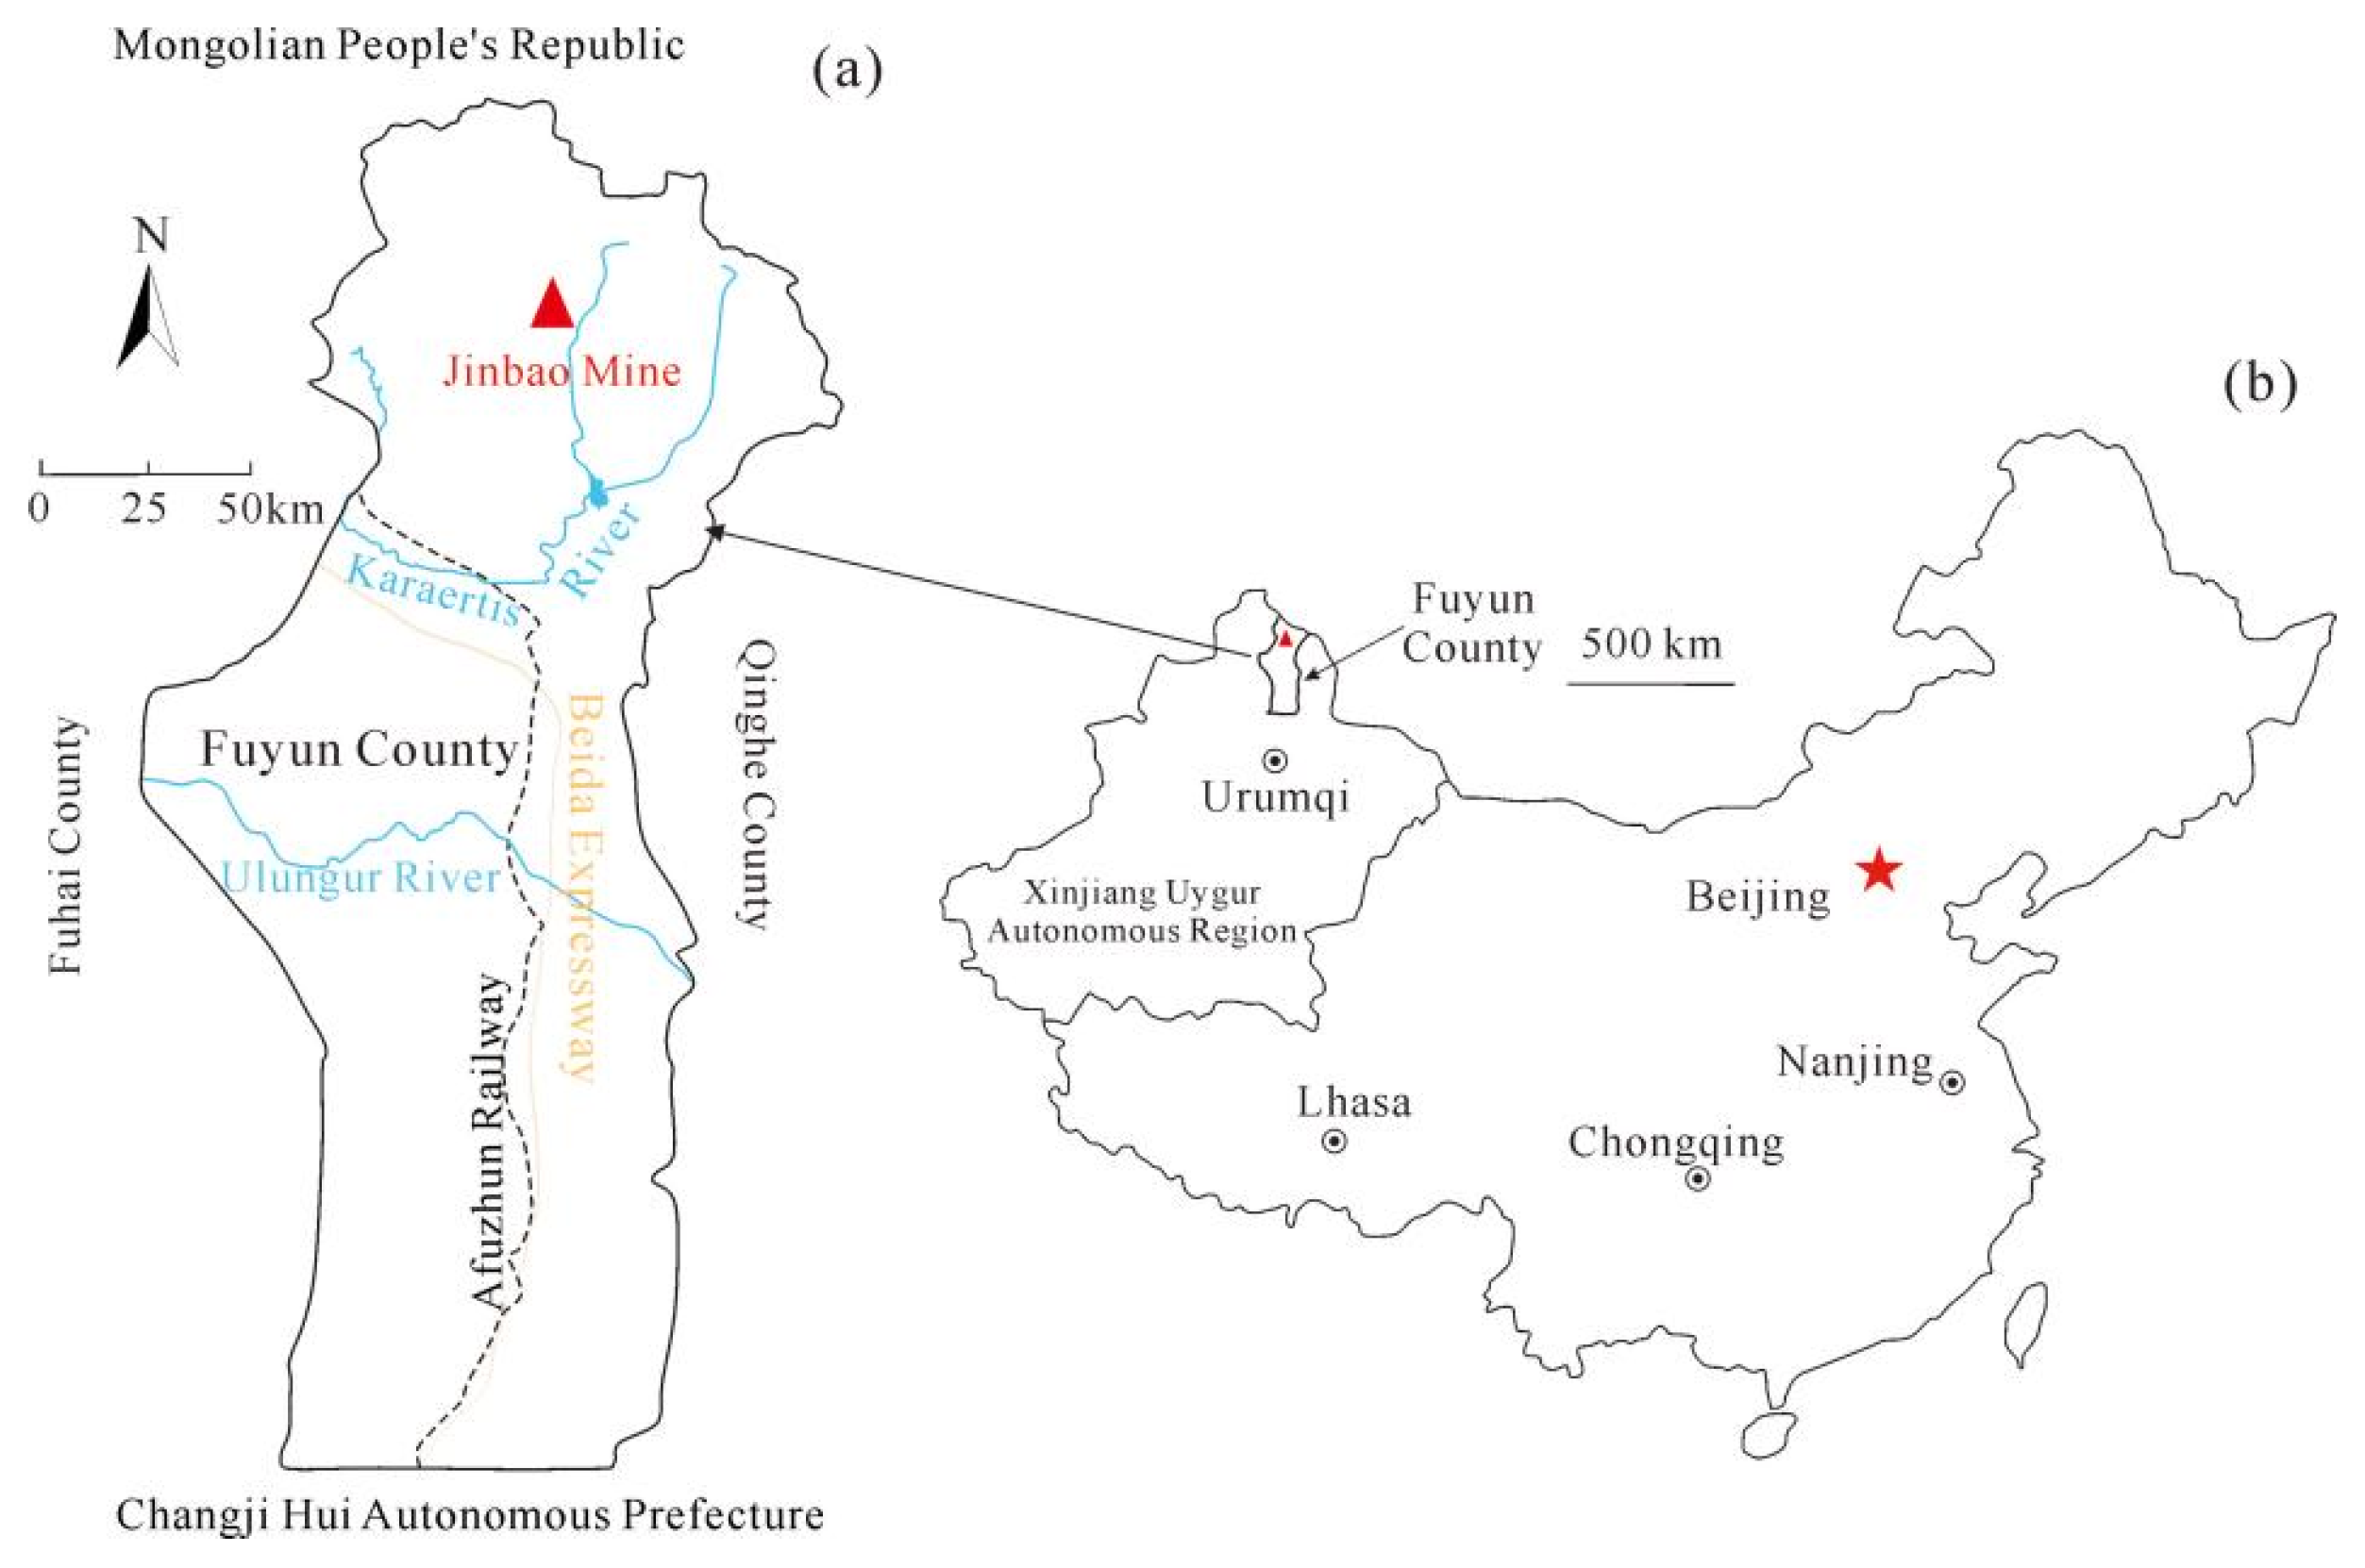
The Jinbao Mine is located approximately 75 km southeast of Altay City and about 70 km northwest of Fuyun County in Xinjiang (
Figure 1), with coordinates ranging from 89°00′41″ to 89°02′15″ E and 47°30′47″ to 47°31′31″ N, and it fell under the administrative jurisdiction of Kuerte Township, Fuyun County, Altay Prefecture, Xinjiang Uygur Autonomous Region.
The Jinbao Mine is located in a region characterized by tectonically eroded low-to-medium mountain topography. Prior to excavation, the site elevation ranged between 1000 and 1400 m. After over a decade of mining, an open pit has been formed with its long axis roughly oriented east–west. The pit measures approximately 1900 m in length and 770 m in width at the top, tapering to about 130 m in length and 48 m in width at the bottom. The closed-loop contour is at an elevation of 1080 m, and the pit floor is at 852 m.
The mining design specifies a bench height of 24 m with slope angles ranging from 51° to 65°. These parameters were subject to minor adjustments during excavation based on actual geological conditions. A fault traverses the entire mining area; however, it is relatively small in scale, has a minor impact on the stability of the open-pit slopes, and is located outside the area of the 14 September 2023 landslide.
The open-pit mine is primarily composed of gneiss. This rock is mineralogically composed of light-colored minerals (plagioclase and quartz) and dark-colored minerals (amphibole and biotite), with minor accessory phases including magnetite, rutile, and garnet. Texturally, plagioclase occurs as irregular grains (0.01–0.3 mm), quartz as finer granules (0.01–0.1 mm), and amphibole as green prisms (0.5–1 mm).
Groundwater in the Jinbao mining area is primarily recharged by the lateral groundwater, rainfall, and snowmelt. The groundwater table fluctuates between elevations 964 m and 985 m. Continuous manual pumping is employed at the pit bottom to keep the working area dry, with a pumping rate of about 4000 m3/d in the wet season and 2000 m3/d in the dry season. However, numerous springs are still observed discharging on the slope surface, which points to a significant presence of perched water within the fracture systems.
The mining area experiences a northern temperate continental climate, characterized by dry and windy springs, short summers and autumns, as well as a long and cold winter, with significant temperature variations. The mean annual precipitation is 212.56 mm, of which the average rainfall is 158.3 mm, predominantly concentrated between June and August. The maximum daily rainfall ranges from 14.8 mm to 37.3 mm, often accompanied by thunderstorms and short-duration heavy rain. In recent years, extreme precipitation events have occurred frequently, with single-day rainfall amounts repeatedly breaking historical records. Winter lasts approximately six months, from late October to late April, with snow cover thickness generally exceeding 70 cm. The annual temperature typically ranges from −30 °C to 30 °C. The highest summer temperature can reach 39 °C, while the lowest winter temperature on record was −51 °C during the winter of 1961. The freezing period spans from November to March of the following year. In most areas of the Jinbao Mine, the maximum freeze–thaw depth is only 0.72~1.62 m. However, at slope locations with well-developed fissures, repeated cycles of snowmelt water infiltration and freezing in the winter can cause the freeze–thaw depth within the fractures to exceed 4 m [
24].
3. Characteristics and Failure Mode of the Landslide
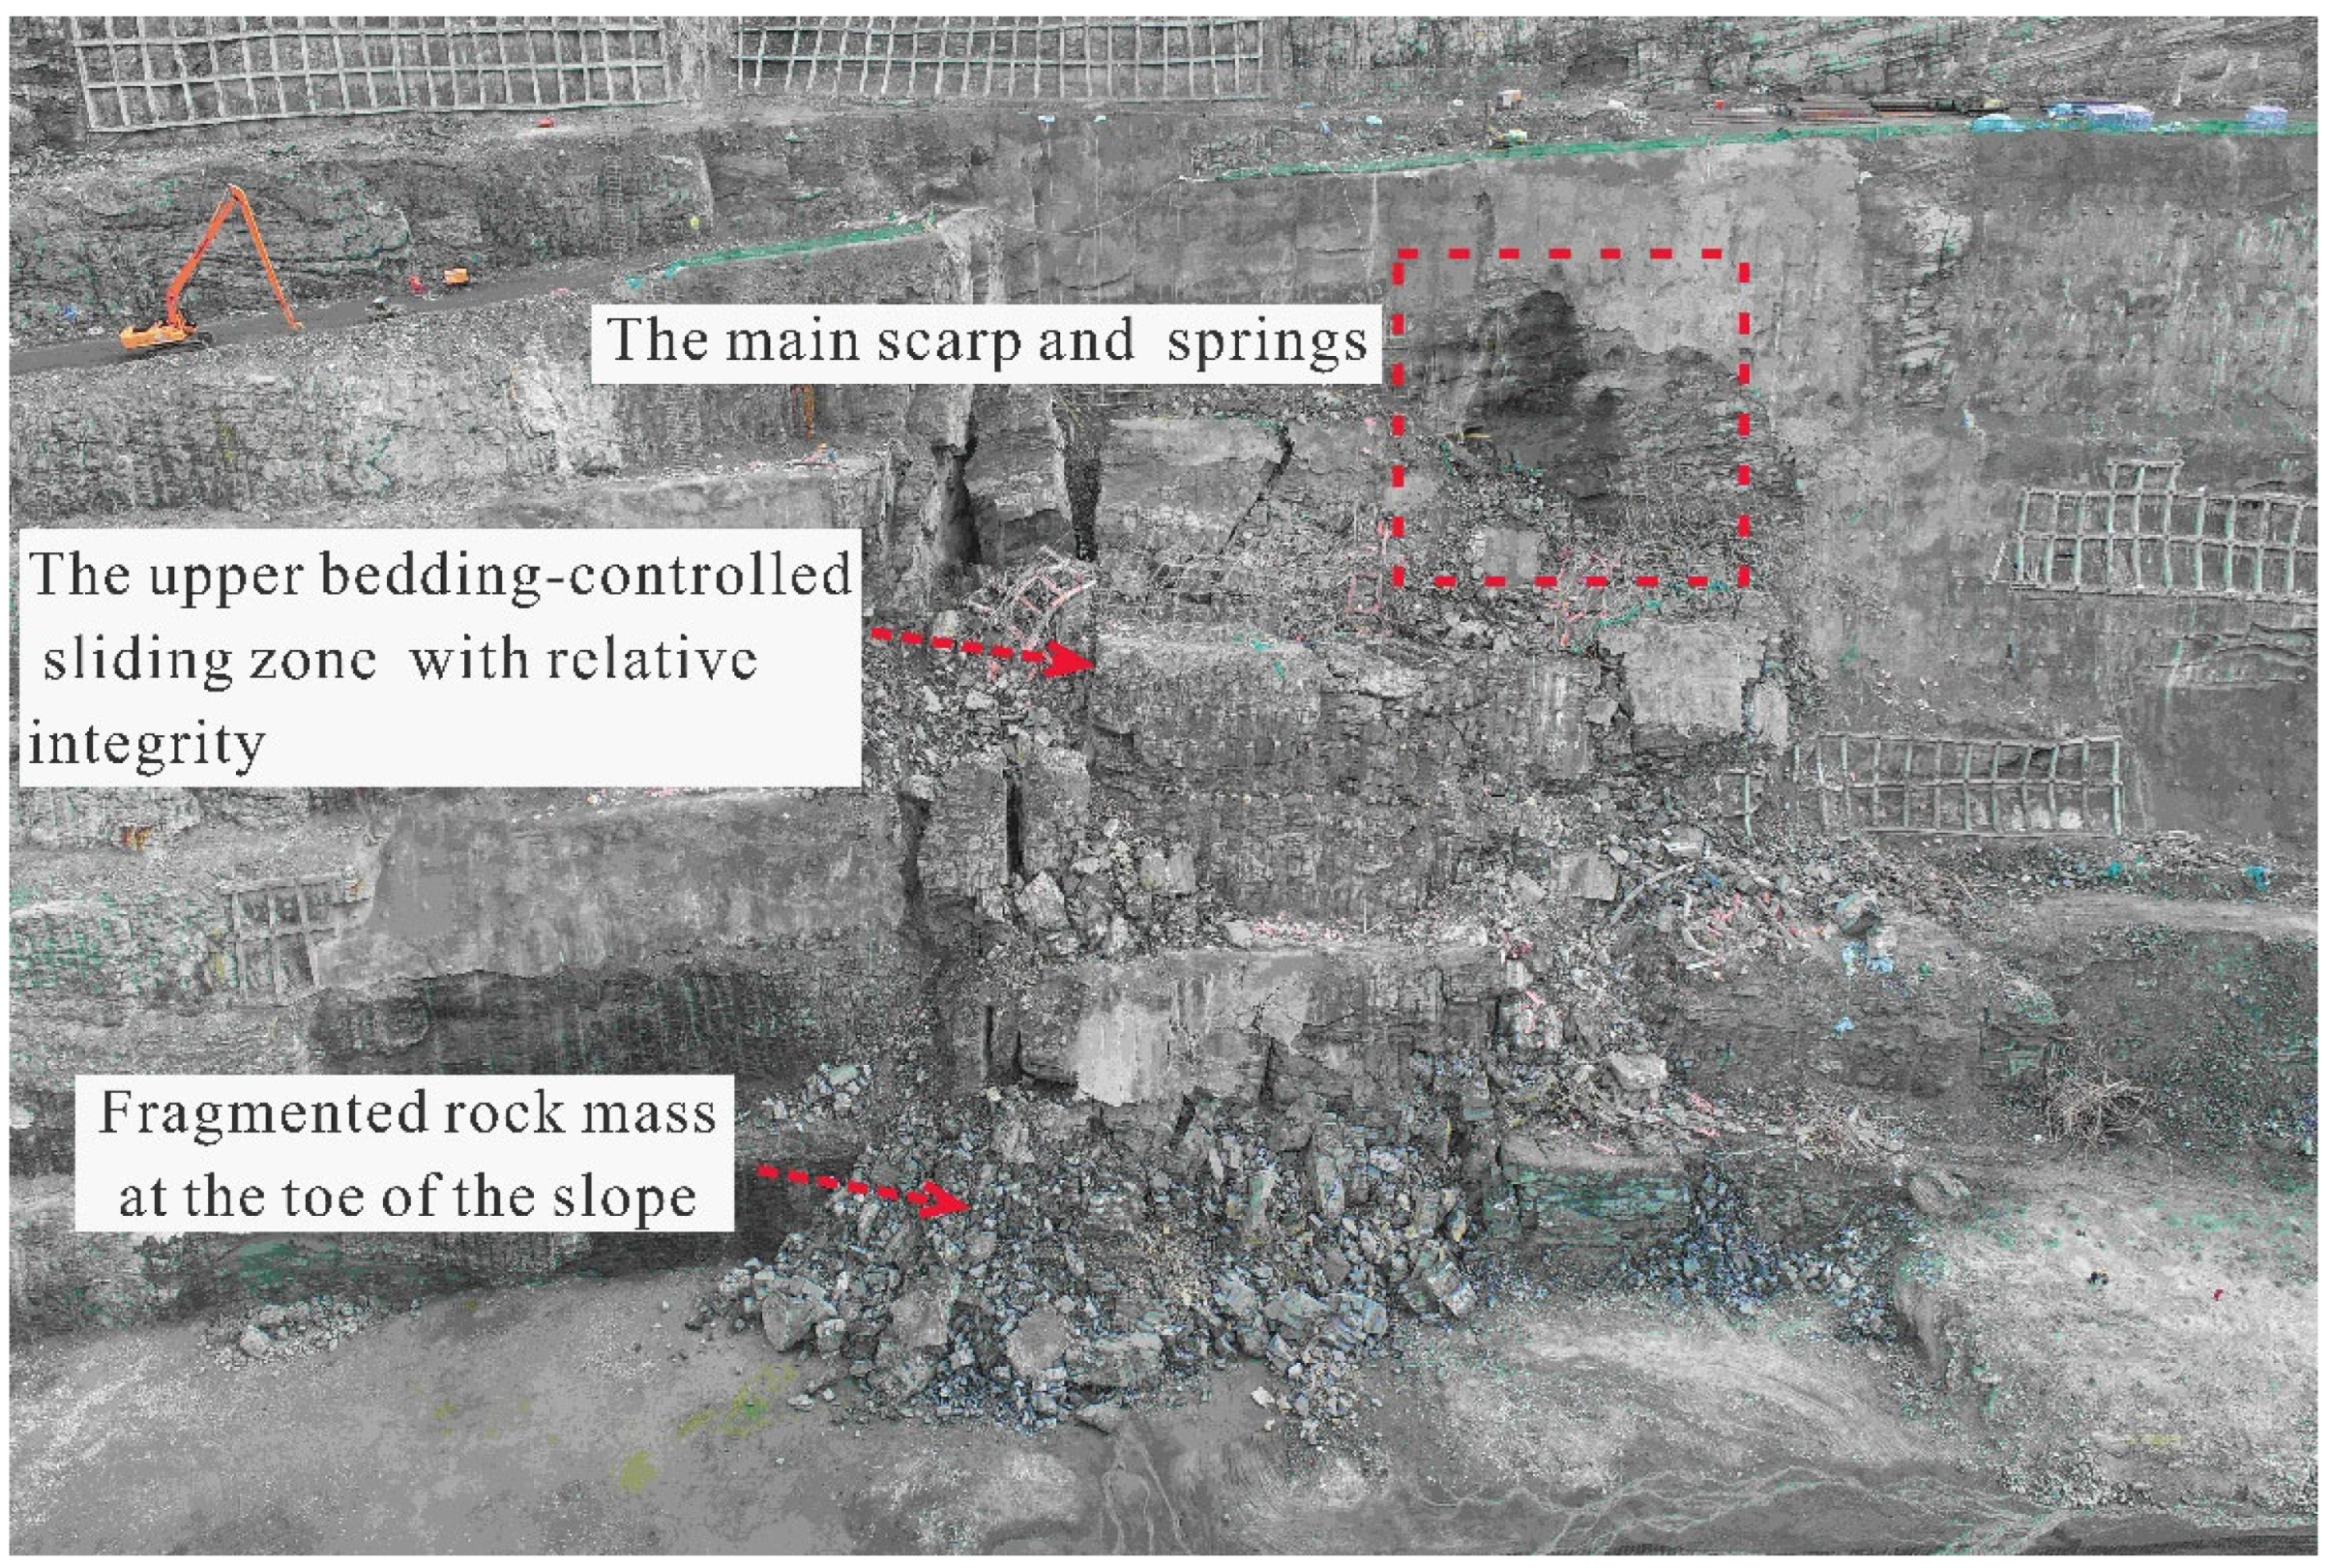
The 14 September 2023 landslide occurred at the toe of the southern pit wall of the mine (
Figure 2). It had a crest elevation of 930 m and a base elevation of 852 m, resulting in a height difference of 78 m. The landslide area involved four slope levels (
Figure 3a), numbered sequentially from the toe upwards as levels 1 to 4. Levels 1 and 2 each have a height of 15 m, while levels 3 and 4 are each 24 m high. All levels have a slope angle of approximately 66°. The slope orientation and angle are roughly coincident with the dip direction and angle of the gneissic foliation (
Figure 3b). Consequently, the original slope prior to the failure was a steeply inclined dip slope.
The landslide covered an area of approximately 20,000 m2, with an average thickness of about 5 m, yielding a volume of approximately 10 × 104 m3. After the failure, the height of the back scar was about 20 m, and the maximum movement distance was approximately 55 m.
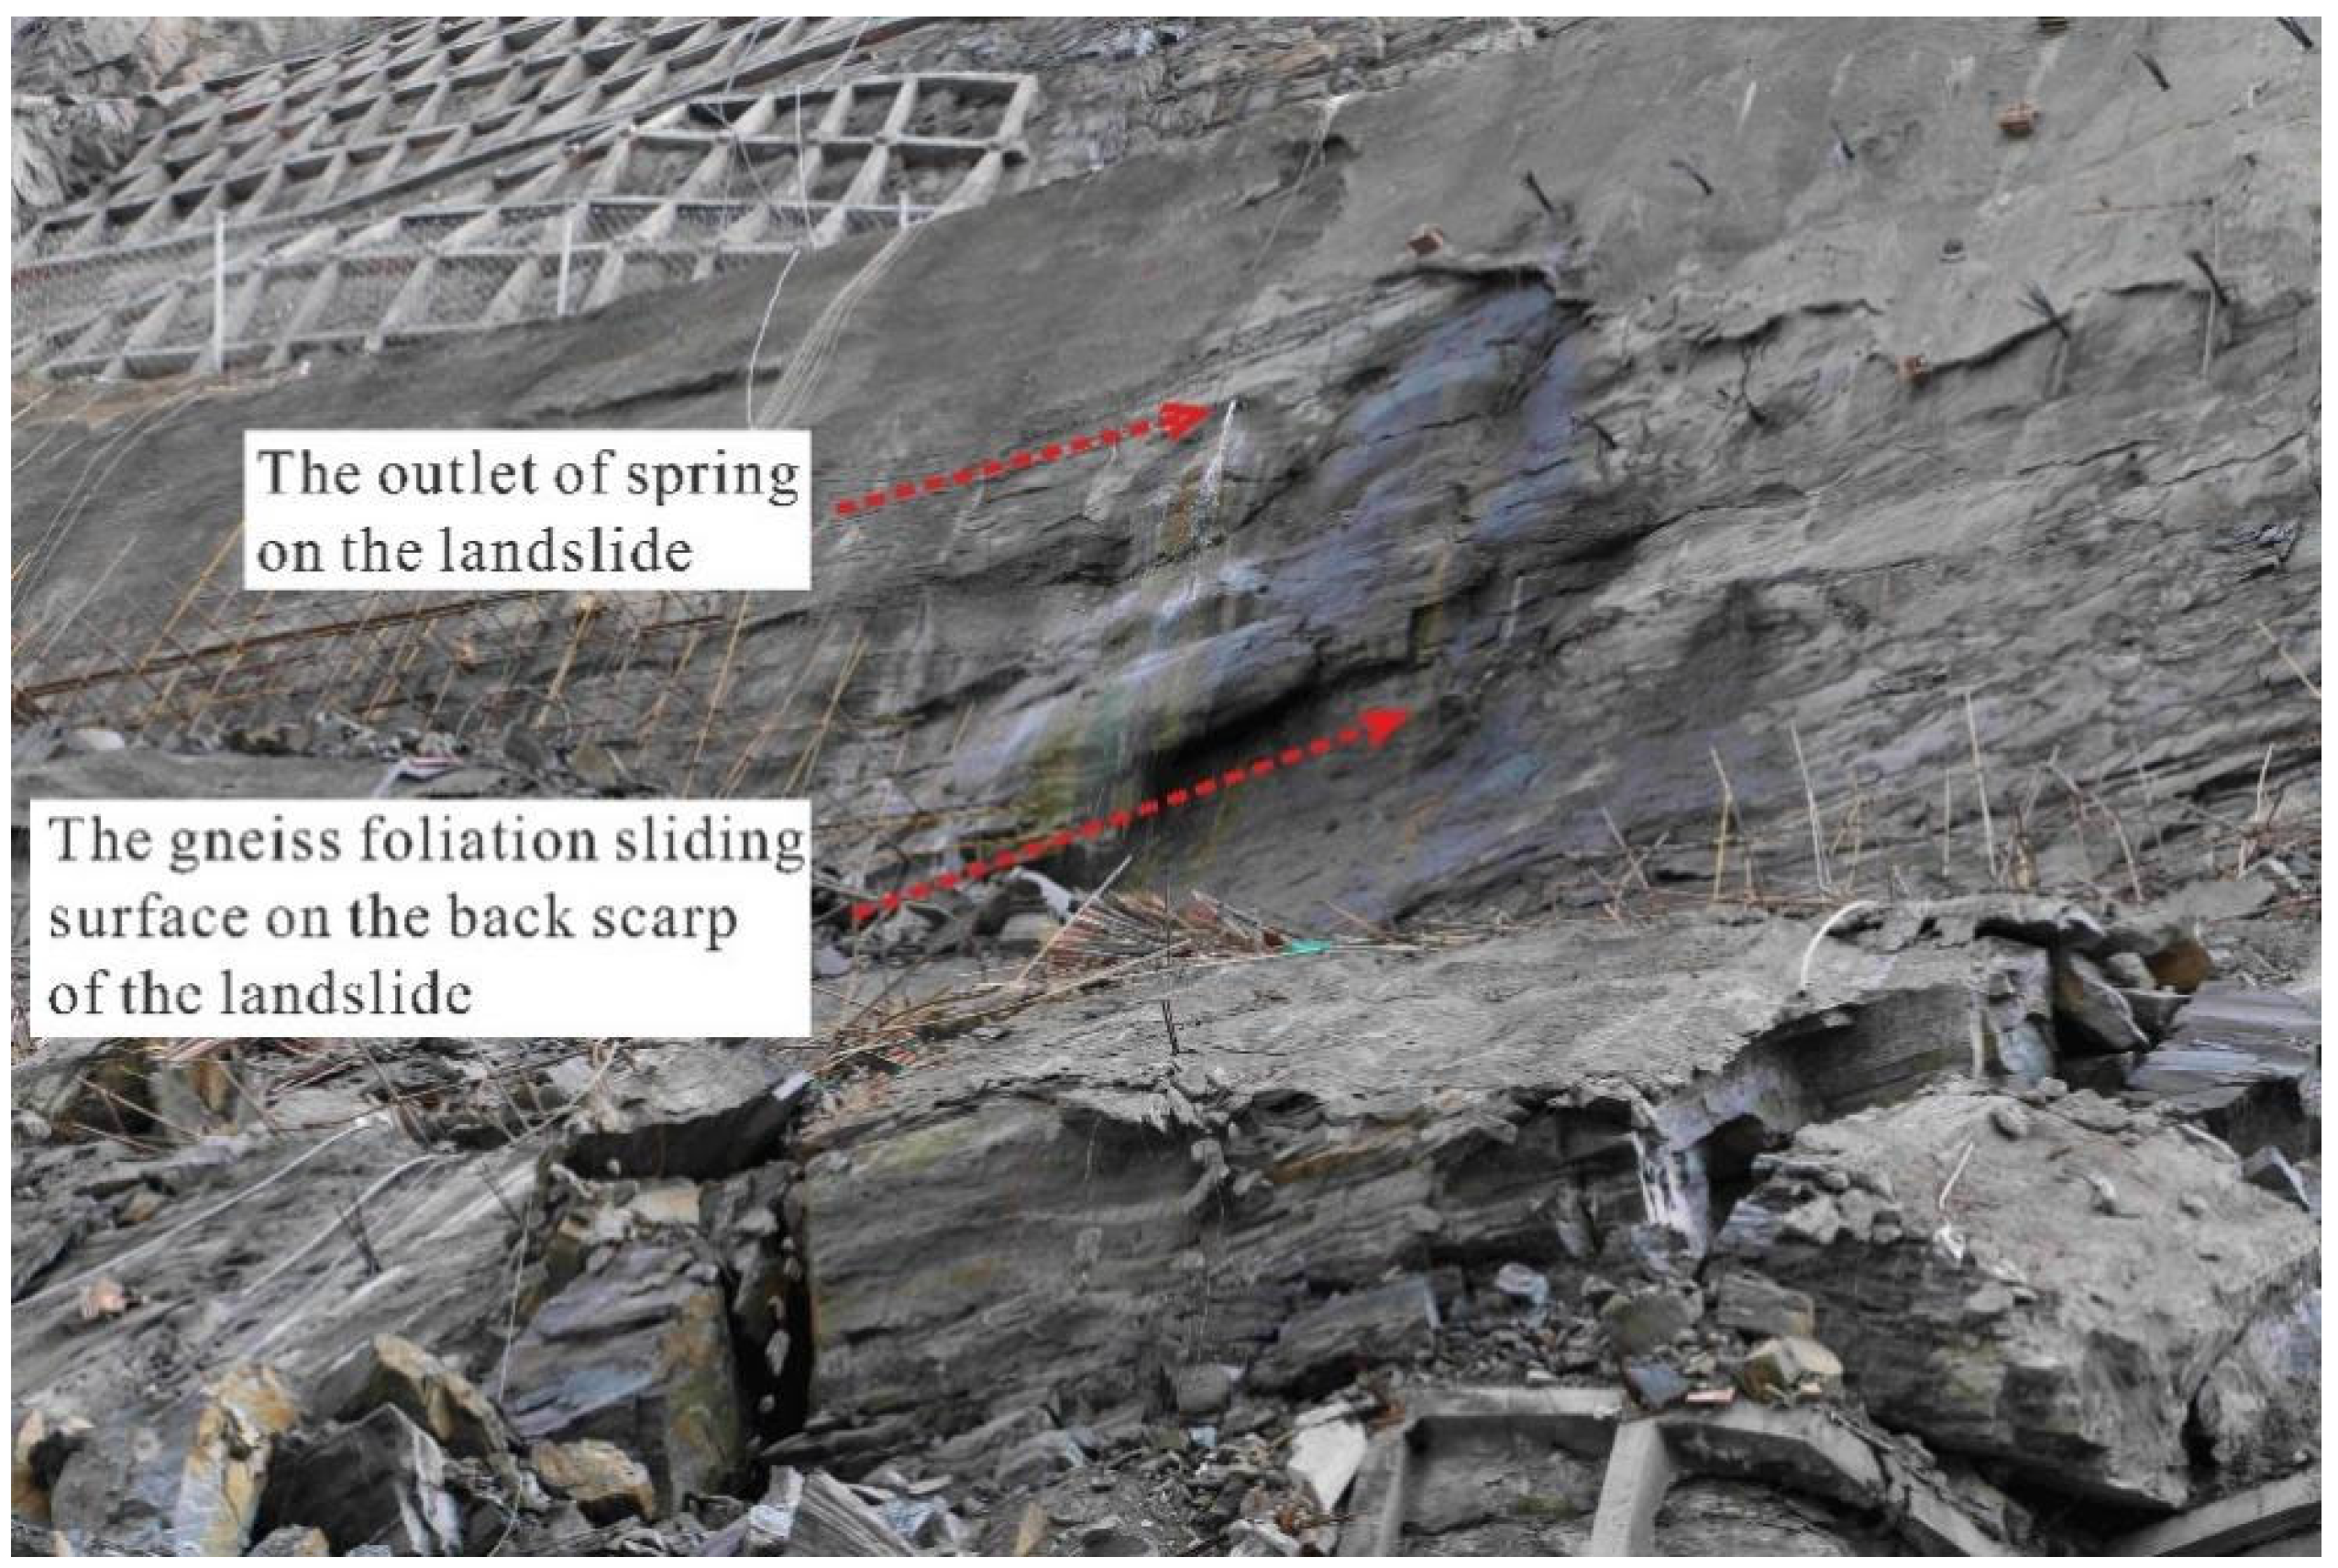
The failure surface primarily followed the gneissic foliation. As observed in the back scarp of the landslide in
Figure 4, the lithology of the rupture surface consists mainly of dark bands composed of minerals such as biotite and amphibole. Before the landslide, the thickness of the original dark bands ranged from approximately 10~30 cm. The rupture surface is located within the dark band and appears highly irregular after failure.
Although artificial pumping has been implemented during mining operations to lower the groundwater table, fractures within the rock mass remain water-saturated during the rainy season, with water discharging centrally in the form of springs.
Figure 4 is an enlarged view of the area within the red dashed box in
Figure 2. It shows several spring orifices located on the main scarp of the landslide, where water discharges concentrically. The largest spring was about 70 m above the slope toe and had an estimated flow rate of 10~30 L/min, indicating that the slope fractures are saturated with perched water. The photo was taken on 21 May 2023, a period that is neither the rainy season nor the snowmelt season. This suggests that during either of those seasons, the increased lateral groundwater recharge and direct precipitation would result in a higher perched water level and greater water volume within the slope’s fractures.
Field investigations indicated that the sliding rock mass moved as a coherent block through a process of subsidence, with the overall structure of the landslide deposit remaining largely intact. The original slope levels and benches are still distinguishable. Specifically, the upper portion of the deposit, which corresponds to the 2nd to 4th levels of the original slope, is relatively intact, whereas the lower toe section corresponding to the 1st level of the original slope is highly fragmented (
Figure 2 and
Figure 4), indicating that the slope toe was subjected to intense compression prior to the instability failure.
Starting in 2009, the fifth year after the commencement of mining, AI-based image monitoring was deployed at the top of the north wall of the Jinbao Mine to track deformation of the southern wall. High-precision imaging capable of resolving 1-micron features was employed to capture sequential images of the wall at 1-s intervals. An artificial intelligence system automatically performs differential analysis between consecutive frames to quantify slope displacement and deformation rates during the acquisition period. The monitoring system generates automated alerts when either displacement magnitude or deformation velocity exceeds predetermined threshold values. Blast vibration monitors were positioned at various points for the purpose of monitoring the X, Y, and Z directional velocities produced by each blast. To analyze the deformation and failure mechanisms of the 14 September 2023 landslide, this study selected four AI monitoring points along a representative cross-section, numbered sequentially from top to bottom as 1 to 4 (
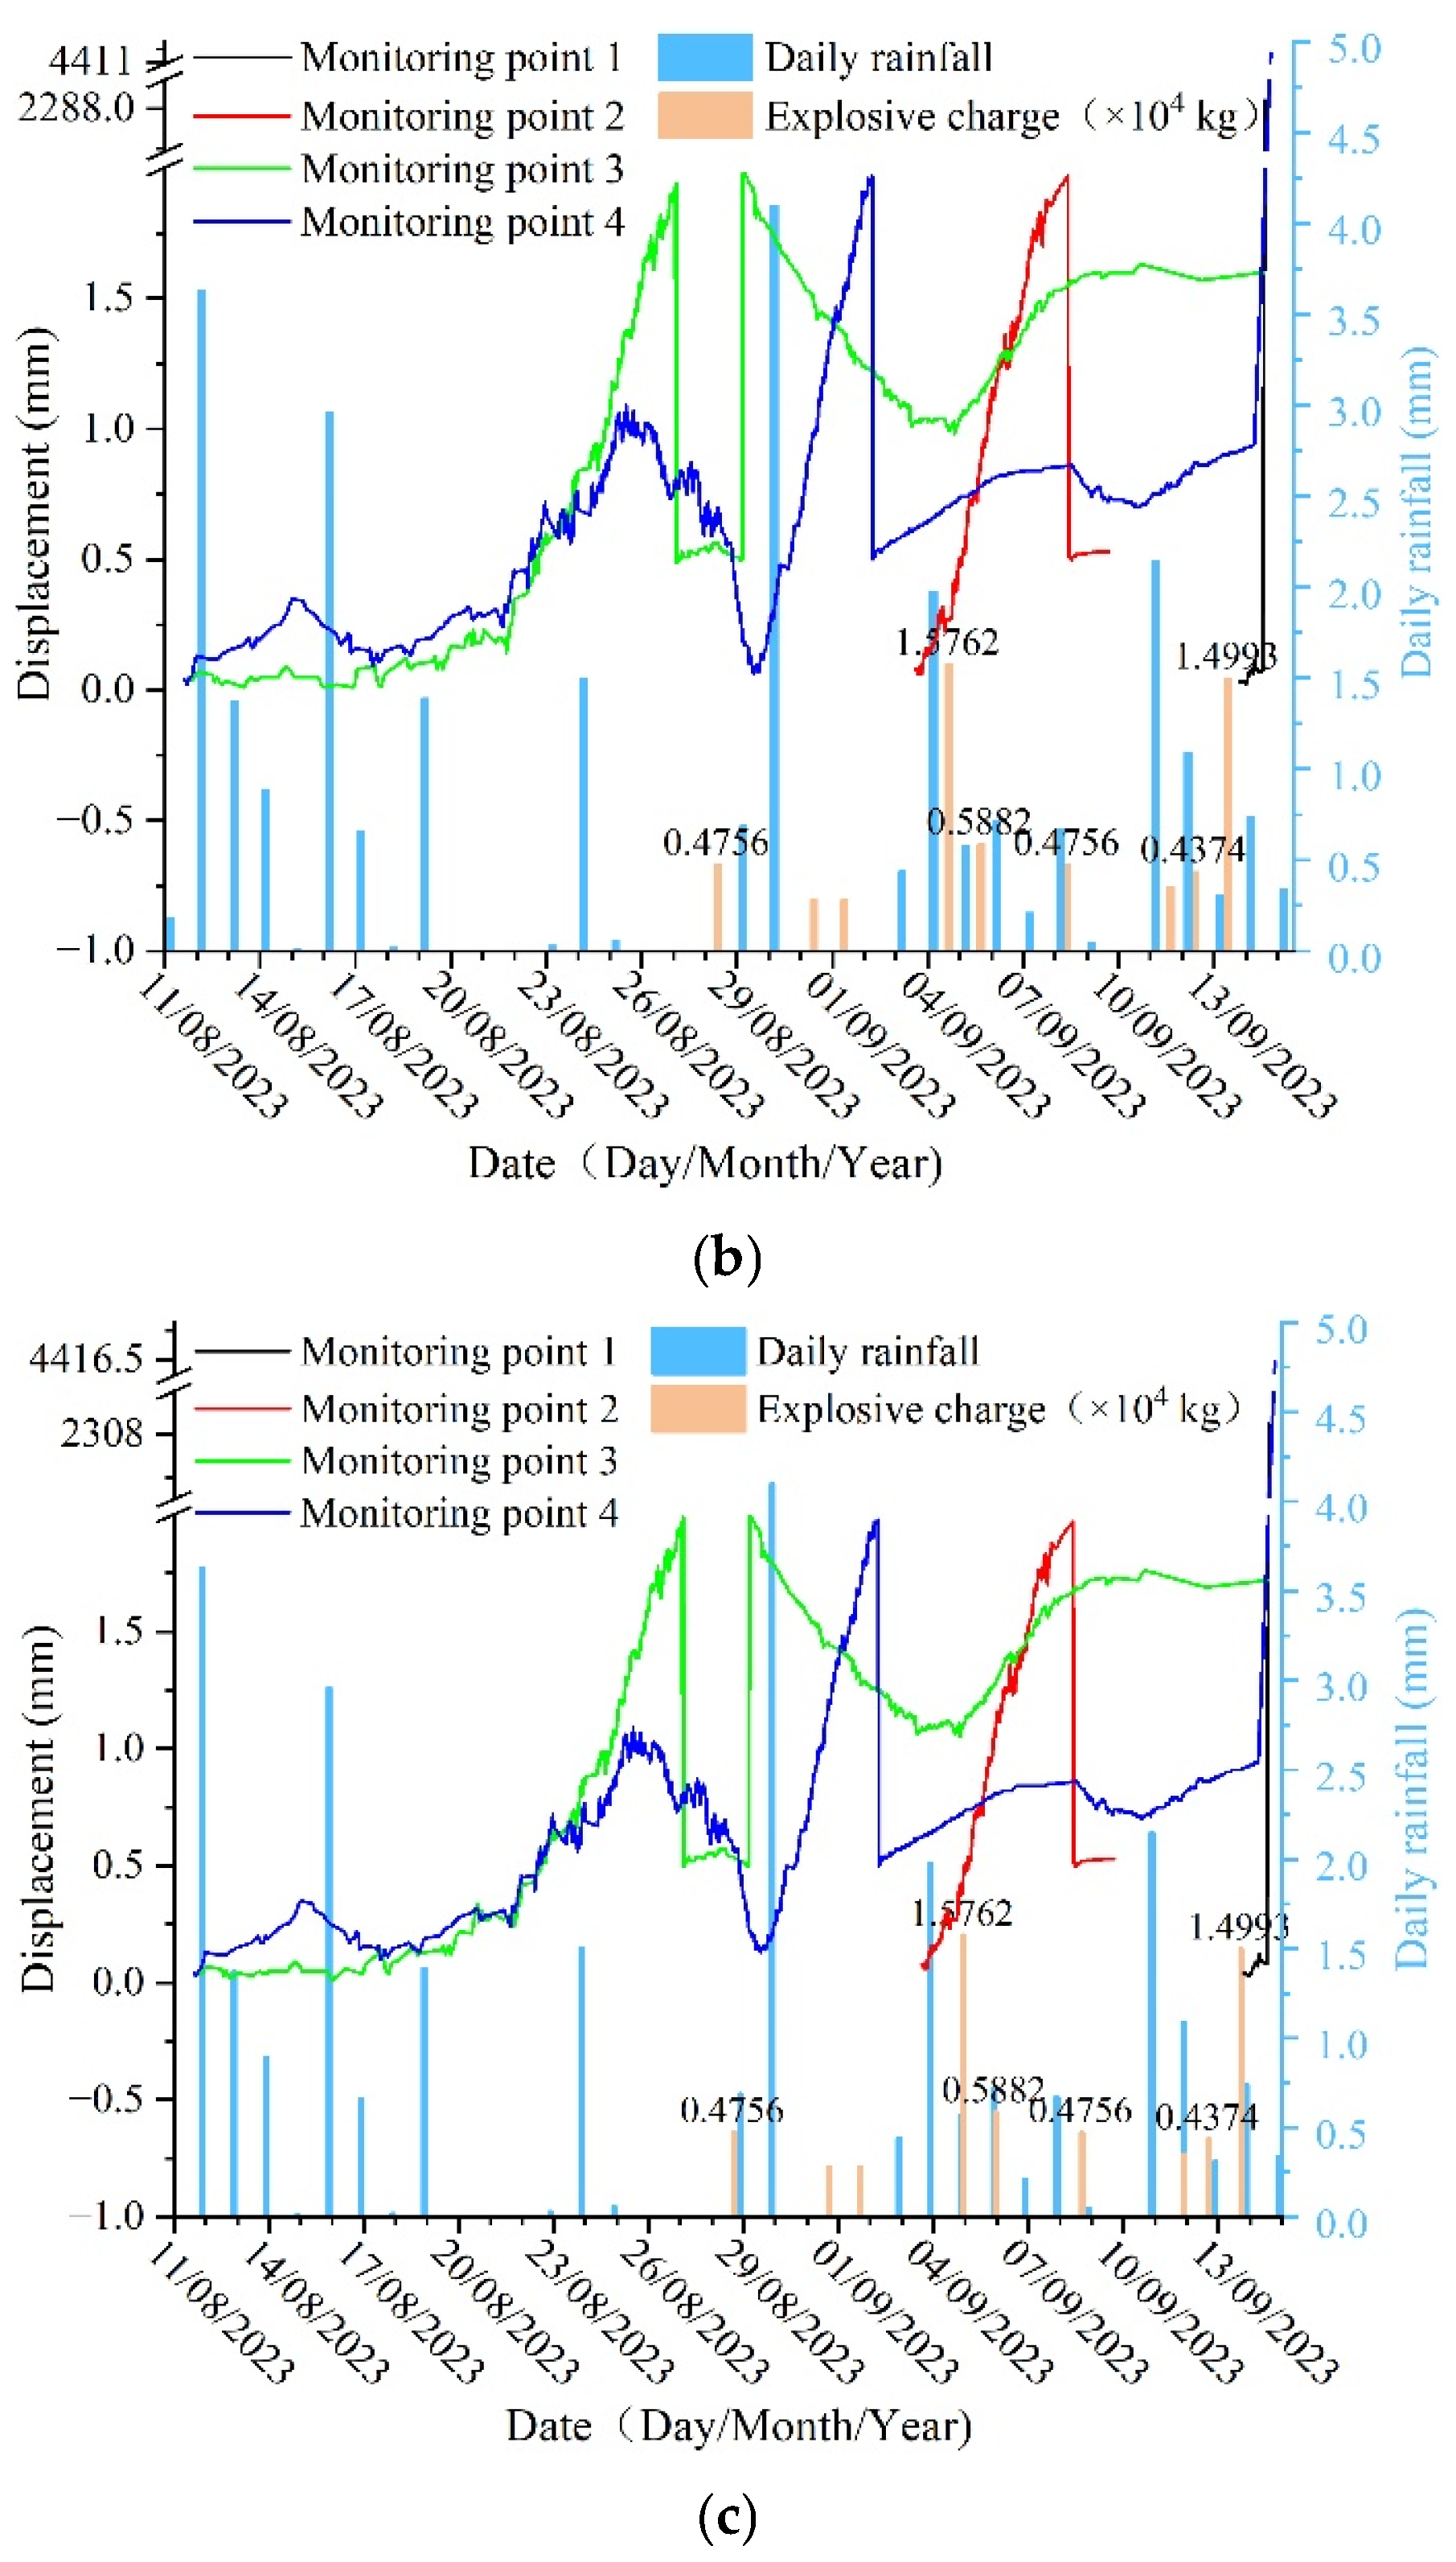
Figure 3a). The displacement data of these monitoring points recorded between 11 August and 14 September 2023 were plotted together with daily rainfall and the explosive charge per blast event in
Figure 5. According to monitoring records, blasting occurred approximately every two days, with a maximum average charge per blast segment of 0.7 kg. Due to equipment malfunctions, Monitoring Point 1 only captured data on 13 and 14 September, while Monitoring Point 2 recorded data from 3 to 9 September.
The figure indicates that intermittent rainfall occurred in the mining area starting 11 August, with daily precipitation remaining below 5 mm. This rainfall led to a gradual increase in displacement at monitoring points 3 and 4, although the total accumulated displacement was relatively small—approximately 1~2 mm, respectively. The displacement was primarily horizontal, with negligible vertical movement. From 24 to 28 August, almost no rainfall was recorded, during which the slope displacement began to decrease. Beginning on 28 August, both blasting activities and rainfall resumed in the mining area. Under the combined influence of these two factors, slope displacement started to increase again, accompanied by significant fluctuations. For instance, under the influence of rainfall and blasting from 28 to 30 August, the total and horizontal displacements at points 3 and 4 rapidly increased to around 2 mm, then quickly decreased to below 0.5 mm. Similarly, at monitoring point 2, the total and horizontal displacements rose sharply to approximately 2 mm between 4 and 7 September, before rapidly falling back to about 0.5 mm. Finally, on 14 September, triggered by blasting, the slope became unstable. The displacements at monitoring points 1 and 4 increased abruptly and dramatically. The displacement curves terminated when point 1 reached a total displacement of 2308.48 mm and point 4 reached 4416.37 mm, as the excessive displacement caused loss of monitoring positioning.
During the monitoring period, the fluctuations in slope displacement corresponded well with the timing of rainfall and blasting events. This correlation was particularly evident during three specific intervals: 11~23 August, 29 August~7 September, and 11~14 September. From 11 to 23 August, displacement increased gradually under the influence of rainfall alone, with a minor total increment of only 1~2 mm. After the rainfall ceased, the displacement subsequently decreased. During the period of 29 August to 7 September, displacement began to increase again under the combined effects of rainfall and blasting, though the total magnitude remained relatively small, ranging between 2~3 mm. Once these activities stopped, the displacement rapidly declined. Between 11 and 14 September, under renewed rainfall and blasting, monitoring points 2, 3, and 4 experienced a more significant increase in displacement followed by a subsequent decrease. On 14 September, a blast was conducted with an explosive charge of 1.493 kg, which triggered the overall instability failure of the slope. It is noteworthy that neither the rainfall intensity nor the explosive charge on 14 September was the maximum recorded during the monitoring period. This suggests that although previous individual blasting and rainfall events induced only minor displacements, their repeated cumulative action progressively weakened the rock mass strength. Consequently, the slope’s stability gradually decreased until the catastrophic failure occurred on 14 September. Furthermore, the Jinbao Mine had been excavated for over a decade, subjecting the slope rock mass to numerous seasonal freeze–thaw cycles. From a long-term perspective, the degradation of rock mass strength due to these freeze–thaw actions is also a significant contributing factor to the 14 September 2023 landslide.
Figure 5 also indicates that displacement was notably larger and initiated earlier in the lower part of the slope compared to the upper sections. During the rainfall period from 11 to 23 August, displacement at monitoring point 4 occurred earlier and was greater than at point 3. Subsequently, under the combined influence of rainfall and blasting, the total displacements at these two points intermittently surpassed each other. From 3 to 10 September, the total displacement at point 2 was less than that at points 3 and 4. When point 1 suddenly became active on 13~14 September, its total displacement was significantly smaller than that at point 4. This displacement pattern allows the landslide to be identified as a typical retrogressive failure. The lower section of the slope deformed first, followed by the upper section, which lost support and began to slide, ultimately leading to the overall failure of the slope.
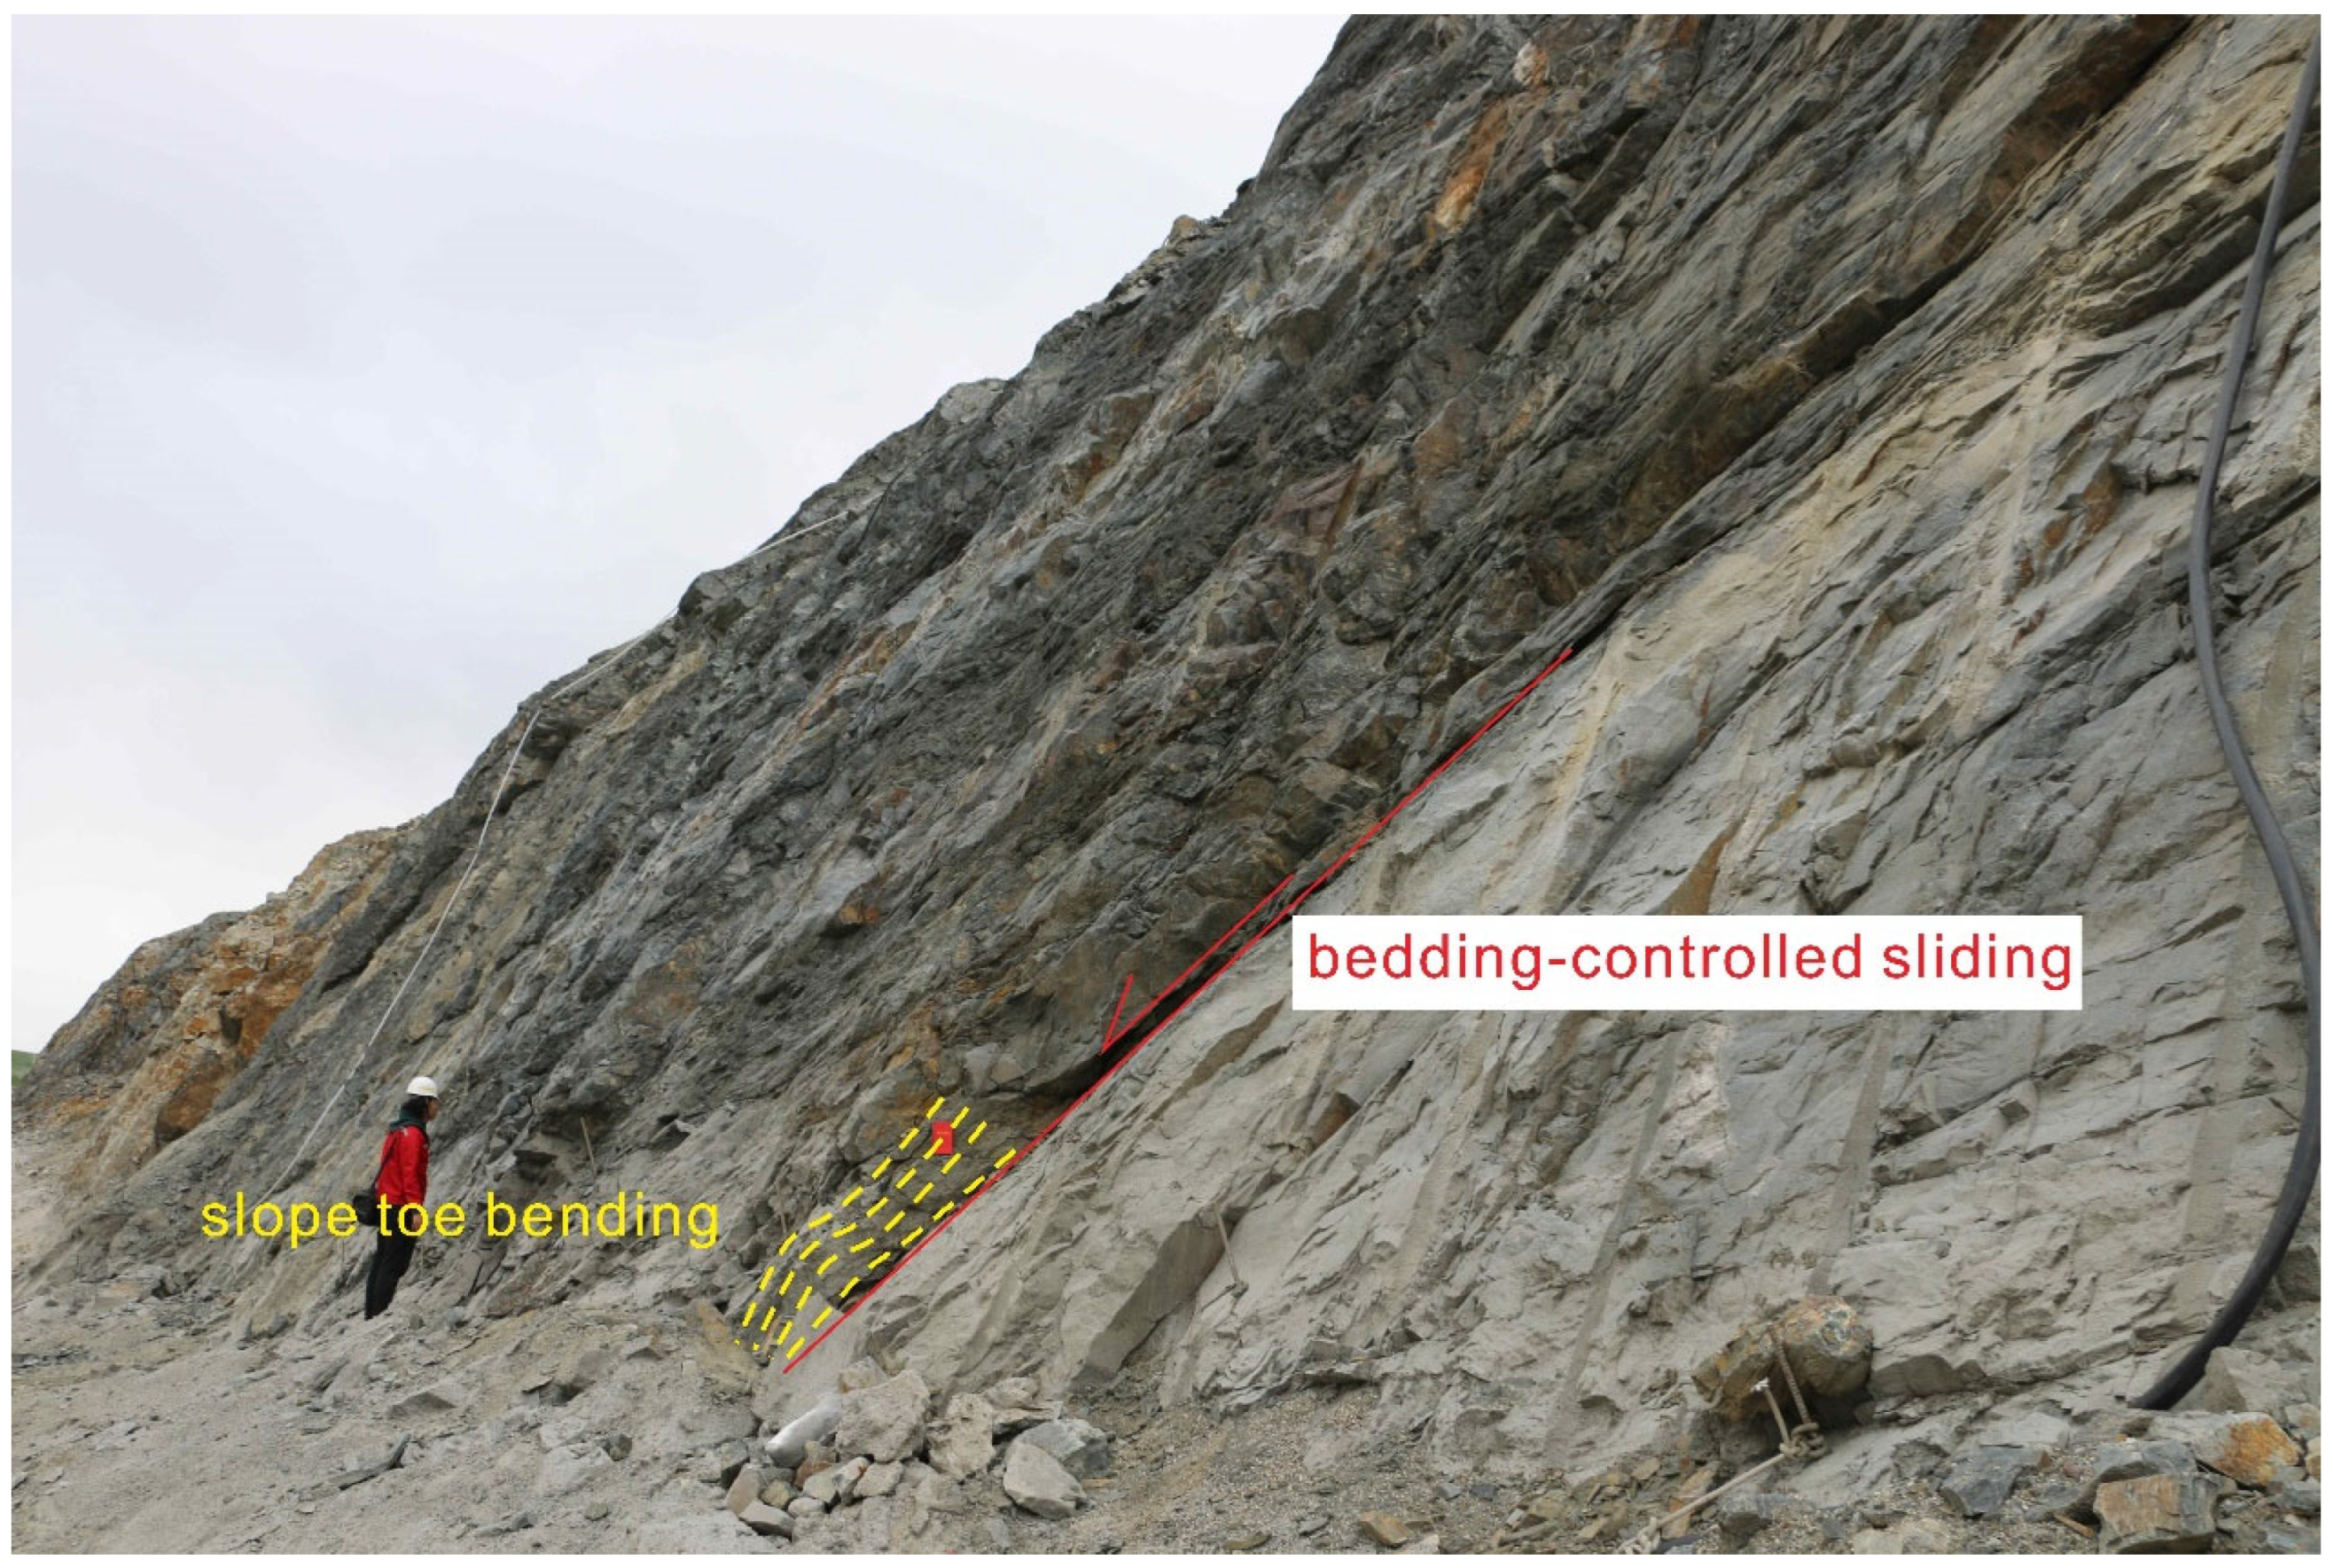
Based on the deformation and failure characteristics described above, it can be concluded that the deformation and failure mode of the 14 September 2023 landslide is a typical case of upper-section bedding-controlled sliding combined with toe buckling and crushing failure. The upper section of the slope slid along the gneissic foliation under gravitational forces, progressively transferring increasing load onto the rock mass at the slope toe. This led to gradual bending and fracturing of the toe material, and ultimately a catastrophic buckling failure. Consequently, the upper slope mass, now unsupported, subsided as a coherent block along the failure surface defined by the gneissic foliation. Currently, several slopes on the southern side of the Jinbao Mine are undergoing deformation in this same mode, characterized by sliding along the foliation in the upper sections and progressive bending at the toe (
Figure 6).
4. Numerical Modeling on Failure Mechanisms
4.1. Numerical Model and Simulation Scheme
As evidenced by the above analysis, the 14 September 2023 landslide was primarily the result of the long-term combined effects of rainfall, freeze–thaw cycles, and blasting. To investigate the mechanical properties of the landslide rock mass, the authors have previously conducted direct shear tests on the gneissic foliation under conditions of water immersion, freeze–thaw cycles, and blasting loads [
45], as well as multi-field coupled triaxial tests on the gneiss under the combined actions of freeze–thaw, seepage, and blasting loads [
46], based on the actual geo-environmental conditions of the Jinbao Mine. Based on the results of these two types of experiments, this study employs numerical simulation to determine the stability evolution process of the 14 September 2023 landslide and to reveal its failure mechanisms.
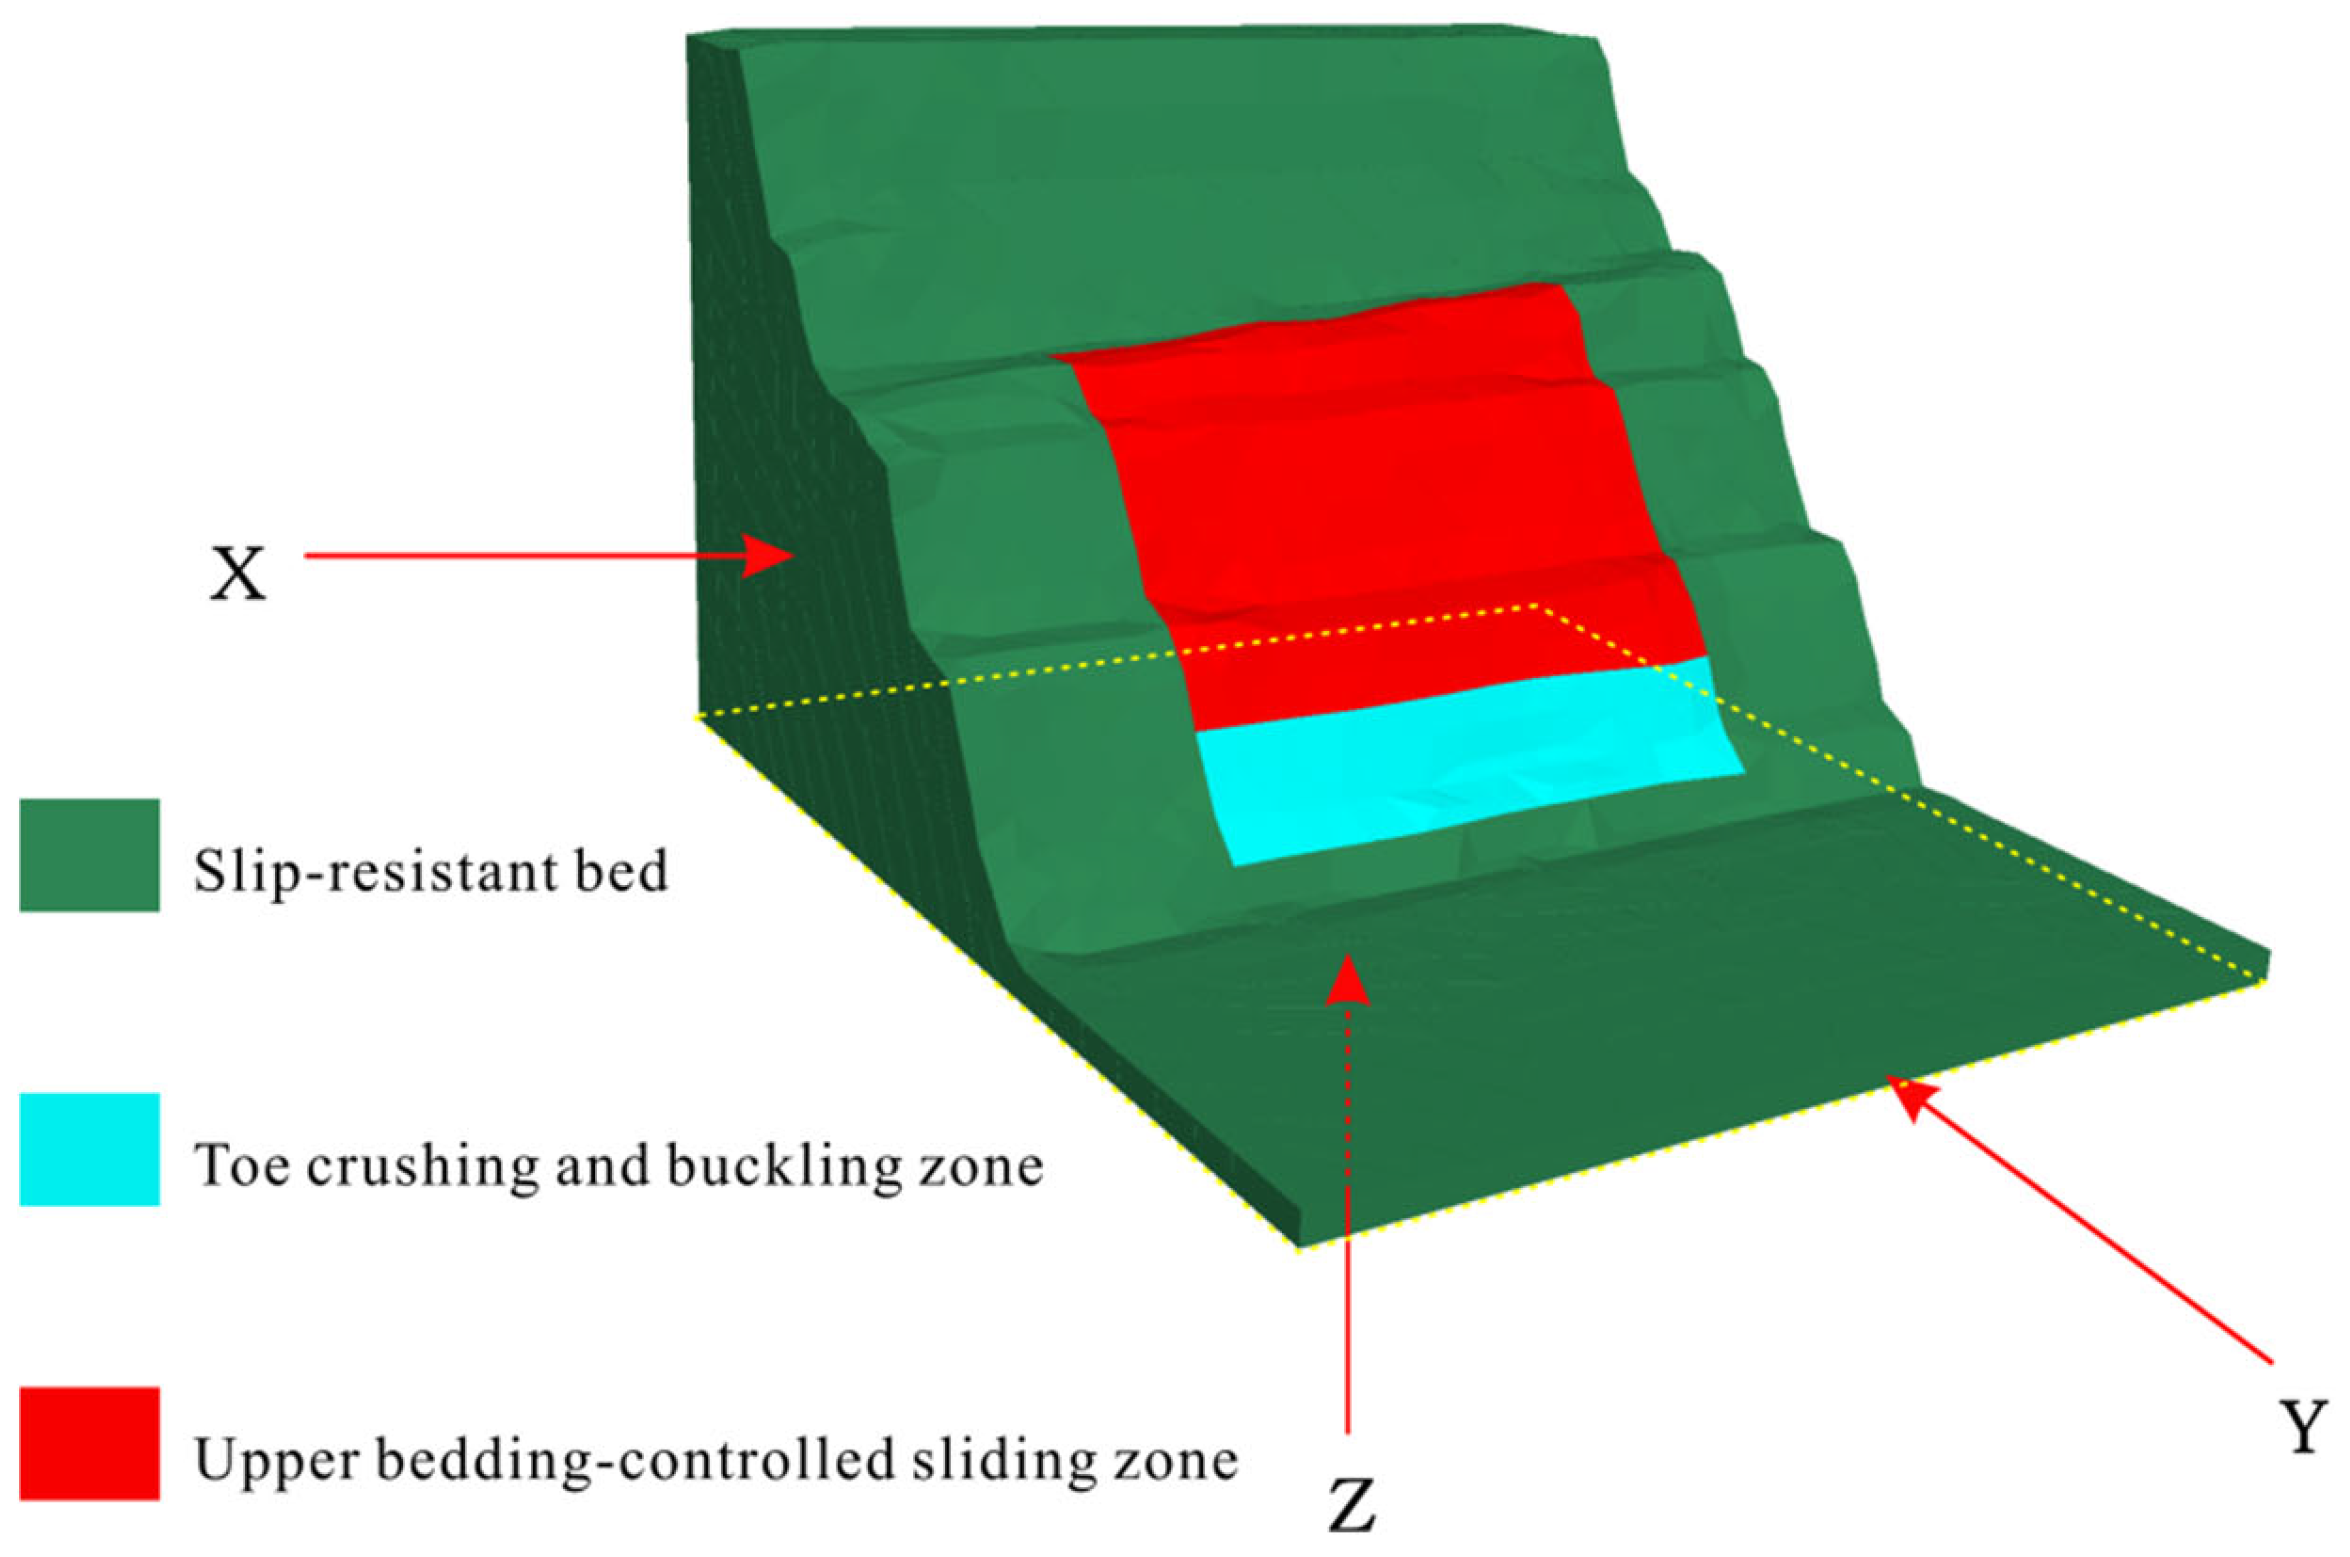
The discrete element numerical software 3DEC 7.0 was used for this simulation. Based on the geological model of the 14 September 2023 landslide, a numerical model was established as shown in
Figure 7. A global coordinate system was defined with the positive
Y-axis oriented toward north, the positive
X-axis oriented toward east, and the negative
Z-axis aligned with the gravitational direction (
Figure 8). The final model measures 160 m in the X-direction, 190 m in the Y-direction and 110 m in the Z-direction. The boundary conditions defined the base and lateral surfaces as fixed by applying a zero normal velocity constraint, and the slope surface as a traction-free boundary. A non-uniform tetrahedral mesh was adopted to balance computational accuracy and efficiency, with finer elements (1–2 m) applied to critical zones within the landslide mass and coarser discretization (5–10 m) used in boundary regions.
The entire model is divided into three parts: the blue section represents the slip-resistant bed, which does not participate in deformation or sliding; the red section represents the upper bedding-controlled sliding zone; and the green section represents the toe crushing and buckling zone. To simplify the model, and in accordance with the deformation and failure characteristics of the two sliding sections, one set of structural planes was defined for the upper sliding zone, while two sets were defined for the toe failure zone. The shear strength parameters for the structural planes were obtained from direct shear tests on the gneissic foliation. The mechanical parameters for the rock blocks enclosed by these structural planes were derived from the multi-field coupled triaxial tests.
The study established the following three scenarios:
➀ Natural conditions
This scenario simulates the slope without the influence of rainfall, freeze–thaw cycles, or blasting. The mechanical parameters for both the structural planes and the rock blocks in the upper bedding-controlled sliding zone and the lower toe crushing/buckling zone of the numerical model were selected based on their natural state (
Table 1).
➁ Rainfall and freeze–thaw conditions
This scenario considers the effects of rainfall immersion, seepage, and freeze–thaw cycles on the slope. Since the rainy season in the mining area lasts for three months and the region has undergone 20 years of seasonal freeze–thaw cycles since mining, the strength parameters of the structural planes in the model were selected based on 90 days of immersion and 20 freeze–thaw cycles. Additionally, since the height from the toe of the landslide to the crest of the southern wall is approximately 300 m, and assuming the fissures in the slope are fully saturated during the rainy season, the seepage pressure acting on the slope rock mass is approximately 3 MPa. The parameters for the rock blocks were selected based on results from tests involving 20 freeze–thaw cycles under 3 MPa seepage pressure (
Table 1).
➂ Rainfall, freeze–thaw and blasting conditions
This scenario incorporates the combined effects of rainfall immersion, seepage, freeze–thaw cycles, and blasting loads. The parameters for the structural planes were selected based on results from tests on the gneissic foliation under conditions of 90 days of immersion, 20 freeze–thaw cycles, and blasting loads. The parameters for the rock blocks were selected based on results from tests under conditions of 20 freeze–thaw cycles, 3 MPa seepage pressure, and blasting loads (
Table 1). The velocity time-history curve generated by the final blast prior to slope failure was applied as the dynamic boundary condition for the numerical model. As illustrated in
Figure 8, the velocity time-history curves along the X, Y, and Z directions were input into the cross-sections of the model’s bottom surface, side surfaces, and the base of the front slope, respectively. Both the blasting loads used in the tests and the curves in
Figure 9 were based on the signal monitored at Point 5 on 14 September 2023 (
Figure 3a).
4.2. Numerical Model Calibration
Local damping was employed to calibrate the aforementioned numerical model. The calibration methodology primarily involved iteratively running simulations for the slope under the rainfall, freeze–thaw and blasting scenario using multiple local damping coefficients within a specified range and at certain intervals. When the simulated post-failure movement distance and back scarp height of the slope matched the field observations, the corresponding local damping coefficient was deemed appropriate. The numerical model utilizing this calibrated damping coefficient was thus considered the validated model.
For geotechnical materials, the critical damping ratio typically ranges from 2% to 5% [
47,
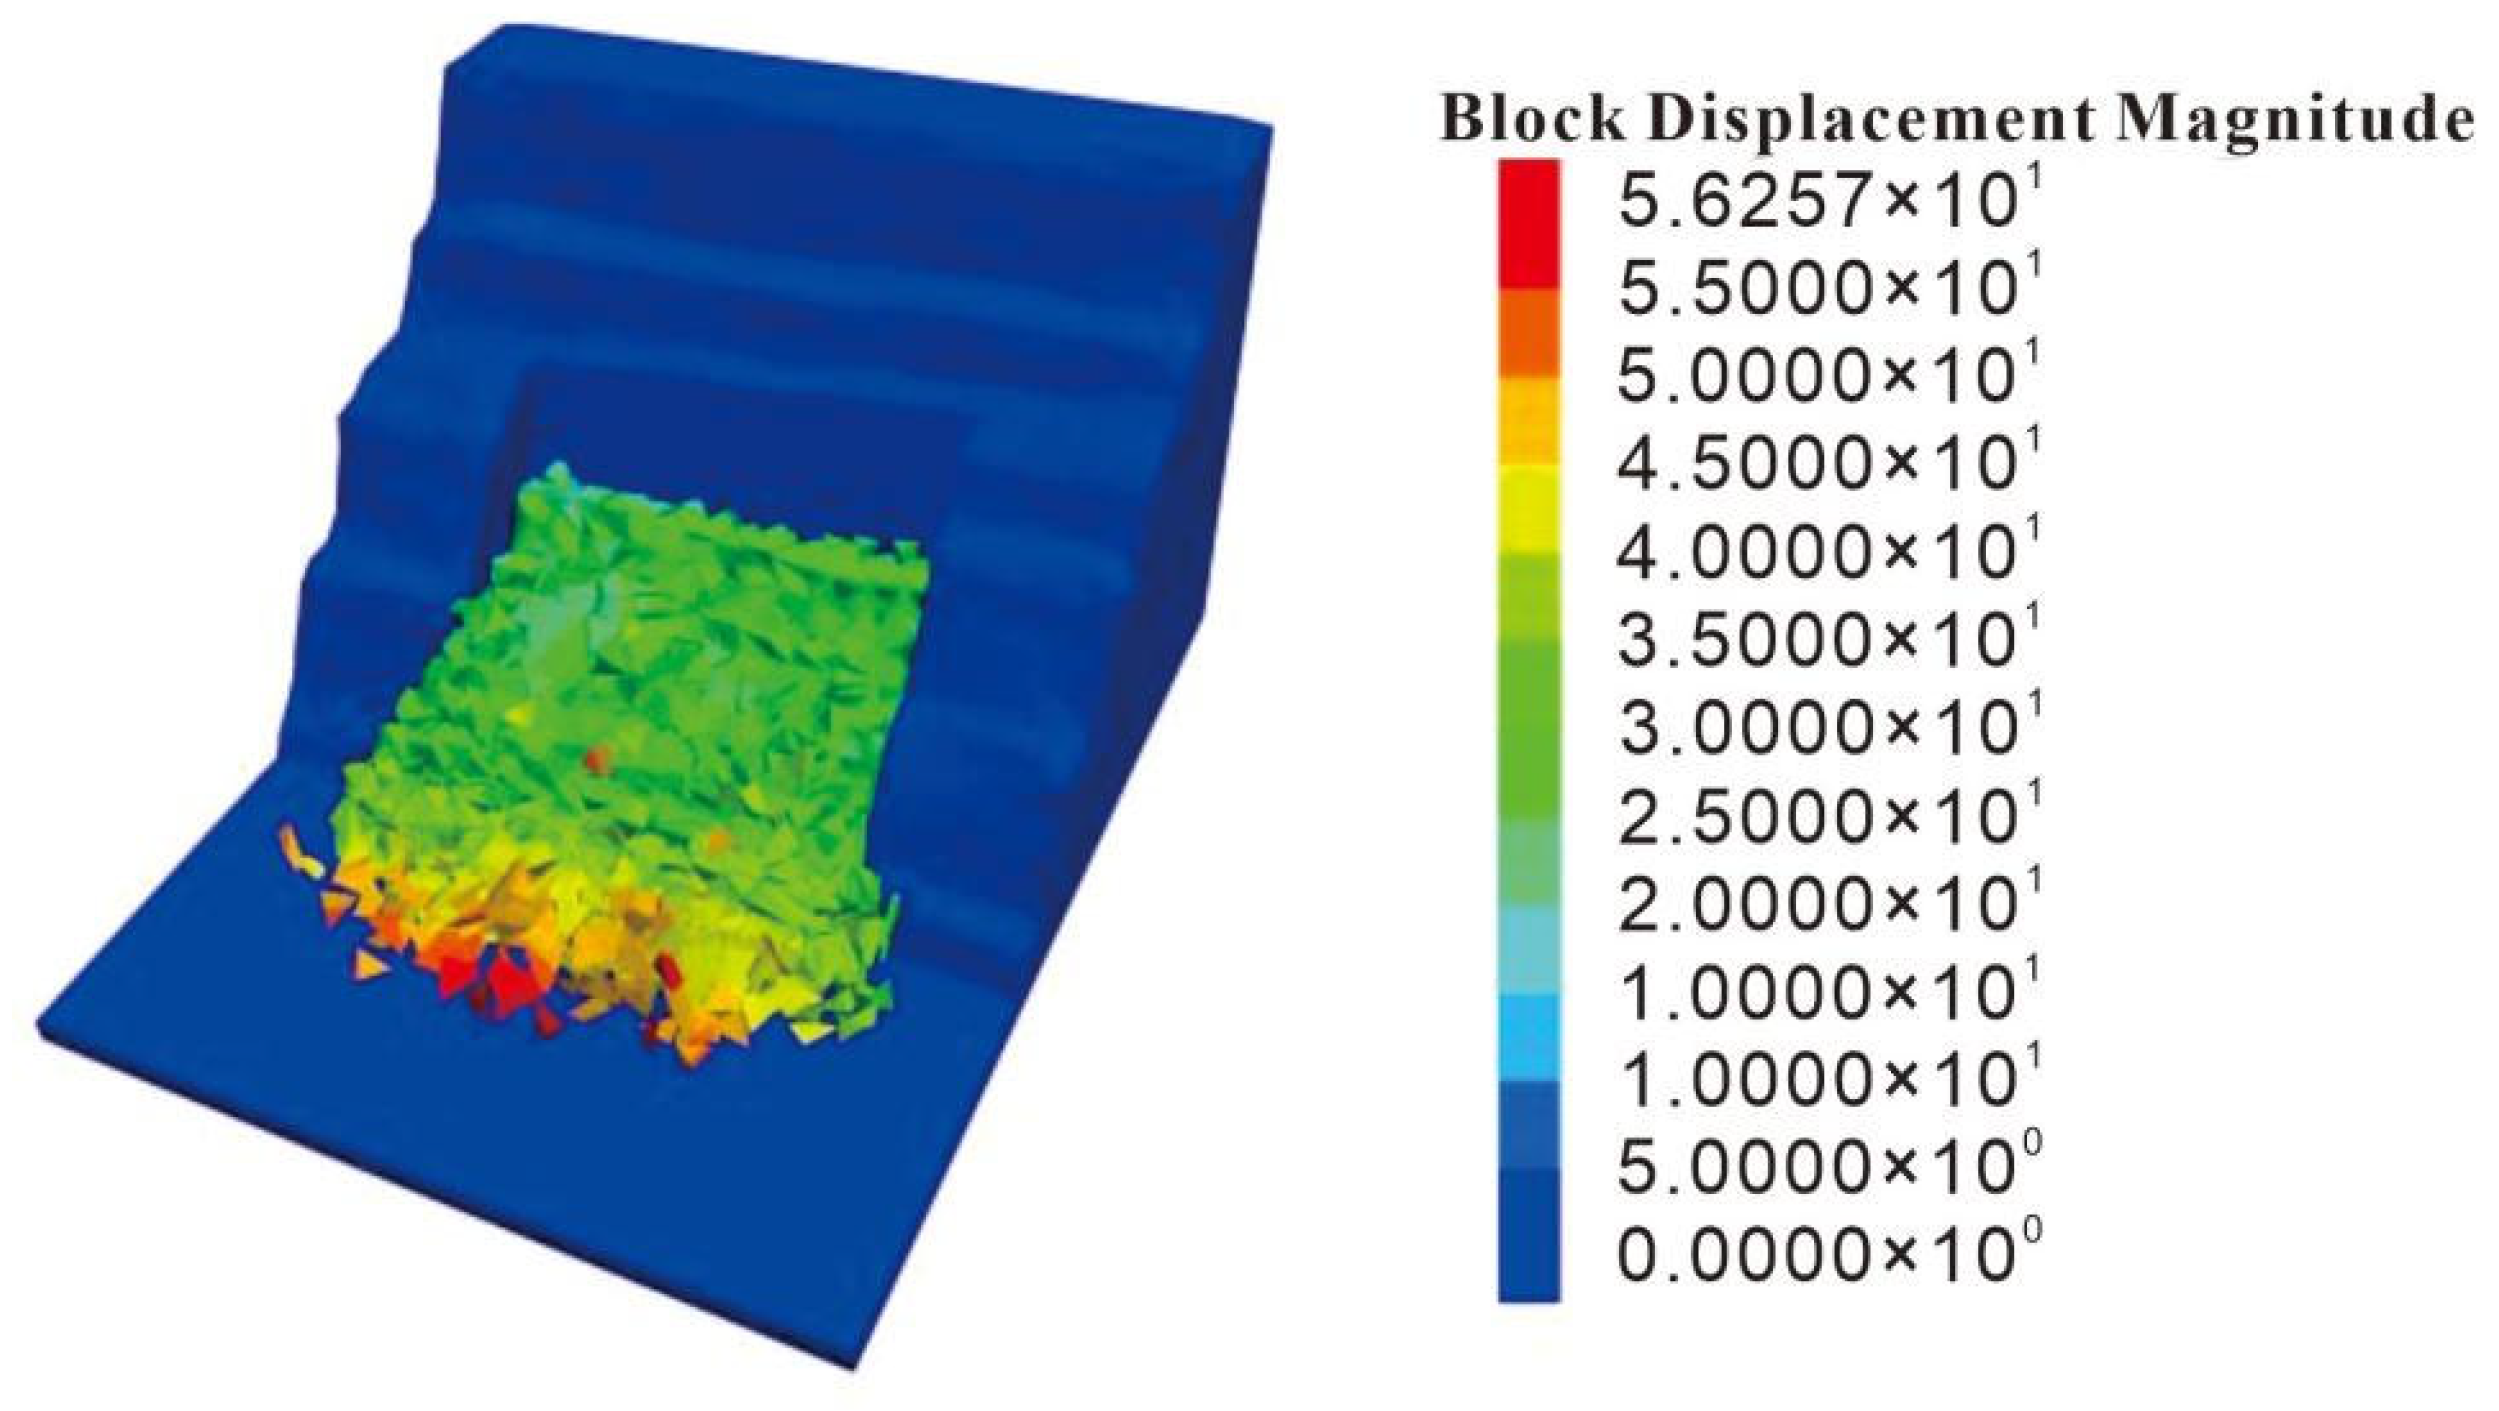
48]. The corresponding local damping coefficient, calculated using Equation (1), falls within the range of 0.0628 to 0.1571. Consequently, ten damping coefficient values within the range of 0.06 to 0.15 (inclusive), at intervals of 0.01, were selected for simulations under the rainfall, freeze–thaw and blasting scenario. Through iterative simulations, a local damping coefficient of 0.12 was identified as yielding the best agreement with the actual landslide event. At this value, the numerical results (
Figure 10) showed a landslide movement distance of 56.26 m and a back scarp height of 21–24 m, which are close to the actual values of approximately 55 m and 20 m, respectively. Therefore, the damping coefficient for the numerical model was finalized at 0.12.
where
,
is the damping coefficient and critical damping ratio, respectively.
4.3. Results and Analysis
(1) Slope displacement and stability under natural conditions
Under natural conditions, the maximum displacement, reaching 0.32 m, was located at the surface of the third level within the bedding-controlled sliding zone (
Figure 11). This is attributed to the gravitational-driven sliding of the surface rock mass along the gneissic foliation. The maximum shear strain increment in the slope was generally small, with a peak value of 0.00689. A linear shear surface developed along the foliation in the upper sliding zone, while an approximately circular-arc shear surface formed in the lower toe crushing zone.
Furthermore, significant tensile cracks are observable at the slope crest. These cracks connect with the linear shear surface in the upper zone and the arc-shaped shear surface at the toe, collectively forming a potential rupture surface. The factor of safety of the slope under natural conditions was calculated as 1.28, indicating that the slope was in a stable state.
(2) Slope displacement and stability under rainfall and freeze–thaw conditions
Compared to the natural condition, both the extent of deformation and the magnitude of displacement increased significantly under the combined effects of rainfall and freeze–thaw cycles. The zone of maximum displacement expanded from the third slope level under natural conditions to encompass both the third and fourth levels, with the maximum displacement value rising to 2.98 m. Beyond this primary zone, displacement values gradually decreased; however, over most of the area corresponding to the eventual 14 September 2023 landslide, displacements exceeded 1 m (
Figure 12).
The maximum shear strain increment in the slope increased markedly compared to the natural condition, reaching a peak value of 0.021. The shear strain was concentrated in the upper bedding-controlled sliding zone. While it primarily developed along the gneissic foliation, it now propagated across two to three foliation layers. This cross-layer propagation is attributed to the reduced strength of both the structural planes and the rock blocks caused by rainfall infiltration and freeze–thaw cycles. Similarly, in the lower toe crushing zone, the maximum shear strain increment increased to 0.012, developing in an arcuate pattern within the fractured rock. At the slope crest, tensile cracks formed due to the weakened rock mass, connecting with the surfaces of maximum shear strain increment in the upper sliding zone and the toe zone, thereby forming a continuous potential rupture surface.
Compared to the natural condition, the potential rupture surface became more distinct, and the shear strain increments along this surface increased significantly. The factor of safety of the slope under this scenario was calculated as 1.117, indicating that the slope remained in a stable state, albeit with a significantly reduced safety margin.
(3) Deformation and failure process under rainfall, freeze–thaw and blasting conditions
Under the combined influence of rainfall, freeze–thaw cycles, and blasting loads, slope deformation intensified. By the calculation step of 30,000, cracking along the structural planes and through discrete elements became highly pronounced throughout the slope mass.
In the upper bedding-controlled sliding zone, cracking was most evident along the structural planes corresponding to the faces of the 2nd, 3rd, and 4th slope levels, effectively dividing the entire slope into three distinct sections (
Figure 13a). The two inner sections retained relatively good integrity. In contrast, the outer section exhibited a high degree of fragmentation. Particularly at the slope toe, the rock mass failure developed not only along the two predefined sets of structural planes but also through the discrete elements themselves, resulting in a high degree of fragmentation.
The displacement distribution showed that most cyan or yellow discrete elements, indicating displacements between 2.5 and 3.75 m, were located within the toe crushing zone. The foremost part of the toe had already experienced local failure, with a small number of rock masses shearing out beyond the slip-resistant bed. Displacements decreased significantly towards the interior of the slope. Although localized failure had occurred at this stage, a continuous failure surface between the sliding mass and the stable bed had not yet fully developed. Consequently, the slope had not undergone overall instability.
At a calculation step of 90,000, the sliding mass exhibited further fragmentation (
Figure 13b). The rock mass at the slope toe was completely fragmented and disintegrated, while the relative positions of the original structure and rock masses in other sections remained discernible.
The displacement contour plot revealed that displacements in the toe area were generally larger than those in the upper bedding-controlled sliding zone. The toe rock mass had sheared out completely from the slip-resistant bed and was left unsupported. The maximum displacement reached 26.23 m. In the upper sliding zone, movement occurred primarily along the internal structural planes, with displacements mainly ranging between 2.5 and 7 m. An enlarged view of the base of this zone clearly shows that the bottom of the slab-like rock masses had fractured, and a cavity had formed between them and the underlying stable bed. This indicates that the sliding mass had undergone overall movement relative to the stable base, signifying that the slope had experienced global failure at this stage.
The final deposition morphology of the landslide obtained from the numerical simulation is shown in
Figure 10. The results show a final back scarp height of approximately 21–24 m and a maximum runout distance of 56.26 m. The majority of the deposit came to rest within a runout distance of 20 to 40 m.
4.4. Discussion
The numerical simulation results indicate that the 14 September 2023 landslide was the result of the combined effects of rainfall, freeze–thaw cycles, and blasting. Under natural conditions, the slope’s factor of safety was 1.28. This factor decreased to 1.117 under the influence of rainfall and freeze–thaw cycles. Ultimately, the slope experienced failure under the combined actions of rainfall, freeze–thaw cycles, and blasting loads.
Prior to the 2023 event, the slope had been subjected to years of rainfall, freeze–thaw cycles, and blasting. Experimental results [
45,
46] show that the shear and compressive strengths of both the gneissic foliation and the rock mass were significantly reduced by the repeated action of these factors. Since neither the explosive charge nor the rainfall intensity on the day of the failure was the maximum recorded since the slope’s formation, it can be concluded that, besides the triggering effect of the blast, the long-term weakening of the gneissic foliation and rock mass strength by rainfall, freeze–thaw, and blasting was the primary cause of the landslide.
The simulation results show that under both the natural condition and the condition combining rainfall and freeze–thaw, the maximum displacement occurred in the 3rd and 4th levels of the slope, with displacement distribution primarily controlled by the slope geometry. Under the freeze–thaw, rainfall and blasting conditions, however, the maximum displacement shifted to the slope toe, and the displacement distribution became governed by both the slope geometry and the weakened rock mass parameters. This further proves that the reduction in the strength of the foliation and the rock mass was a key factor in the slope instability.
Under the long-term combined effects of rainfall, blasting, and freeze–thaw cycles, the shear strength of the gneissic foliation decreased. This reduction led to a decrease in the anti-sliding force and an increase in the sliding force within the upper bedding-controlled sliding zone, causing the rock mass to slide along the foliation. Consequently, the load transferred to the rock mass at the slope toe progressively increased. Under prolonged compression, the toe rock mass experienced bending, which intensified over time. Coupled with the strength reduction caused by the repeated action of rainfall, blasting, and freeze–thaw cycles, the toe rock mass gradually fractured and ultimately failed in a buckling mode. This led to the loss of support for the upper mass, which then subsided along the foliation, precipitating the landslide’s overall instability.
Due to the limitations of the discrete element numerical method, the simulation involved simplifications. Based on the failure characteristics, one set of structural planes was defined in the upper bedding-controlled sliding zone and two sets in the toe crushing zone, which may deviate from the actual conditions. Furthermore, the simulation simplified the effect of groundwater seepage, considering only its impact on the shear strength of the gneiss due to immersion and seepage, without accounting for the influence of seepage forces on the overall stress and strain fields. However, as the numerical model was validated, these simplifications do not undermine the study’s conclusions regarding the failure characteristics and mechanisms of the landslide.
Our numerical simulation was conducted with two primary objectives: first, to simulate slope stability by varying the mechanical parameters of the rock mass under different conditions, thereby investigating the effects of seepage, freeze–thaw cycles, and blasting on slope stability; second, to reproduce the kinematic characteristics of the slope after instability. Simulating buckling behavior was not a primary goal of this study. Consequently, the slope toe was treated in a simplified manner by introducing two sets of structural planes with higher density compared to the upper bedding-controlling sliding zone, allowing simulation of its fragmentation and failure behavior without addressing buckling behavior. Moreover, simulating buckling in 3DEC would require discretizing the slope toe into extremely small blocks, which was not pursued in this model due to computational efficiency considerations. Additionally, establishing an analytical or semi-analytical formulation for the buckling failure [
49,
50] would greatly benefit the instability prediction and prevention design of these landslides. However, this study only demonstrates the phenomenon through monitoring data and field evidence, without specifically analyzing its mechanism or developing such a formulation. This represents a limitation of the current research and should be addressed in future studies.
5. Conclusions
Based on previously conducted direct shear tests of the gneissic foliation and multi-field coupled tests of the gneiss, this study investigated the failure mode and mechanisms of the 14 September 2023 landslide at the Jinbao Mine using field monitoring and numerical simulation. The main conclusions are as follows:
(1) The deformation and failure mode of the landslide is identified as upper-section bedding-controlled sliding combined with toe buckling and crushing failure. The upper rock mass slid along the gneissic foliation under gravity, progressively loading the slope toe, which led to gradual bending, fracturing, and ultimately buckling failure. Consequently, the unsupported upper mass subsided as a coherent block along the failure surface defined by the foliation.
(2) The combined action of rainfall, freeze–thaw cycles, and blasting loads was the primary cause of the landslide. The long-term influence of these factors reduced the strength of the foliation in the upper sliding zone, decreasing the anti-sliding force and increasing the sliding force, which progressively raised the load on the toe rock mass. Similarly, these factors reduced the shear and compressive strength of the toe rock mass, making it more susceptible to buckling under the increased load. Additionally, the blasting loads directly increased the sliding force, triggering the final failure.
In conclusion, the primary triggering mechanisms of the 14 September 2023 landslide included rainfall, freeze–thaw cycle, and blasting. Consequently, corresponding prevention and mitigation strategies should be enacted to prevent similar future accidents. The main measures focus on constructing drainage systems to minimize rainfall influence, implementing prestressed anchor cables for reinforcement the potential rupture surface, and establishing a monitoring and early warning system for risk alerts.
