Article

Haptic Reproduction of Virtual Textures Based on Ultrasonic Interference Principle

1
Research Center of Fluid Machinery Engineering and Technology, Jiangsu University, Zhenjiang 212013, China
2
School of Electrical and Information Engineering, Jiangsu University, Zhenjiang 212013, China
3
School of Civil Engineering and Mechanics, Jiangsu University, Zhenjiang 212013, China
4
Institute of Ultrasonic Testing, Jiangsu University, Zhenjiang 212013, China
*
Authors to whom correspondence should be addressed.
Appl. Sci. 2025, 15(21), 11742; https://doi.org/10.3390/app152111742
Submission received: 16 August 2025 / Revised: 23 October 2025 / Accepted: 31 October 2025 / Published: 4 November 2025

Abstract

Ultrasonic phased arrays have shown promise in generating virtual texture haptics through haptics feedback points. However, factors such as skin vibration speed, amplitude variations, acoustic interference, and energy loss can influence textural haptics. In this study, using Spatiotemporal Modulation (STM), virtual textures are produced through movement of the focal point. The acoustic field of the ultrasonic phased array as well as the stress and strain experienced by the skin during texture perception are simulated by numerical analysis. At the same time, psychophysical experiments are conducted by volunteers to evaluate these textures. The experimental results indicate that as the focal rotation frequency increases, regions closer to the center experience more significant shear wave effects, resulting in longer shear wave propagation, reduced tangential stress amplitude, and a larger affected area. Moreover, as the frequency of the shear wave interference shifts, it results in increasingly complex textural representations.

1. Introduction

Haptic feedback technology has revolutionized the interaction between users and electronic devices by simulating the physical tactile experience [1,2]. It not only enhances the user’s perception of device operation, but also improves the overall user experience [3]. Haptic feedback technology is increasingly used in a wide range of application scenarios, from smartphones to virtual reality devices to medical rehabilitation, where it plays an indispensable role. Among them, the main contact technologies are haptic gloves [4,5,6], stylus pens [7], and touch screen systems [8,9]. Since these haptic feedback technologies require the user to wear or hold a device, which reduces the naturalness and comfort of the interaction [10] and performs poorly in terms of generating a perception of surface texture, in recent years, people have preferred to opt for non-contact haptic feedback [11]. The main non-contact haptic feedback technologies are air jet [12,13], laser [14] and ultrasound. Although some researchers have managed to recreate surface textures such as grass, stone bridges, wooden roofs, and water, the air jets used make it difficult to rapidly reposition focal points for rendering three-dimensional objects, and the resulting textures remain excessively coarse [12]. For instance, a typical air jet system produces a diffuse impact area with a diameter of approximately 9 cm at the target, whereas a 40 kHz ultrasonic phased array can generate a tightly focused point with a diameter of about 8.6 mm [15,16,17,18]. In addition, the air jet system lacks the focal point programmability offered by ultrasonic phased arrays. Furthermore, its higher noise, larger size, and lower stability are disadvantages that can negatively affect the user experience [19,20,21,22,23,24]. In contrast, laser-based systems perform poorly in rendering both 3D shapes and surface textures compared to the other two technologies [25,26,27]. However, existing haptic feedback technologies only achieve force perception and cannot perceive texture features on the surface of an object [28,29,30]. Although the performance of the ultrasonic system is a compromise between the air jet system and the laser system, with good performance in all aspects, it can be considered a good alternative to the air jet system. Ultrasonic haptic systems can be autonomously controlled to generate a focal point with high spatial and temporal resolution while maintaining safety [31,32]. However, the minimum size of the tactile feedback point is constrained by both the wavelength of the ultrasonic waves and the physical dimensions of the transducers [33,34,35]. Due to these inherent limitations, ultrasonic haptic devices are unable to produce extremely small focal points, making it difficult to simulate very fine textures [24].
Ultrasonic texture feedback is achieved by using the sound pressure distribution generated by an ultrasonic array [36,37,38,39]; the device can generate discrete haptic feedback points in the air, which can produce a tactile perception similar to the surface texture of an object [40,41]. This tactile perception is realized by generating a stress field in space, and a variety of tactile perceptions can be synthesized by controlling the parameters of these stress fields, including texture perception [42]. At present, domestic and international research on texture features’ (surface texture) perception of ultrasonic haptics is in its initial stage, and researchers have successively proposed AM (Amplitude Modulation), LM (Lateral Modulation) [43] and STM (Spatiotemporal Modulation) [44] in recent years, among which STM uses the method of moving the focal point to generate haptic feedback [45]; the rapid movement of the focal point can simulate haptic texture perception. Ablart et al. investigated how the rendering frequency and size of simple haptic shapes influence the perception of surface texture and users’ emotional responses [46]. Beattie et al. proposed a method for extracting STM rendering frequency and intensity parameters from graphical surface textures. The analysis focuses solely on the sweeping frequency’s impact on texture perception, overlooking other potentially relevant variables. More recently, Reardon et al. explained from the perspective of ultrasonic interactions with viscoelastic skin why ultrasonic haptic feedback is sometimes perceived as “fuzzy” or blurred [47].
Skin is a viscoelastic material composed of collagen fibers, elastin fibers, and liquid fat [48], combining the properties of an elastic solid with those of a viscous fluid [49]. When an ultrasonic focal point is moved over the skin, the viscoelastic medium generates a shear shockwave, which produces a Mach cone and an interference phenomenon [50], extending the range of haptic perception and the spatial resolution of the sensory field [47]. When investigating subjects who have not experienced ultrasonic haptics, some subjects may mistakenly believe that the ultrasonic focal point depicts a textured surface, resulting in a texture perception [51]. Furthermore, previous studies have demonstrated that the speed of the focal point’s movement greatly affects the tactile perception of texture roughness [52,53,54]. Therefore, this paper hypothesizes that acoustic interference and loss of acoustic energy will produce texture perception at different locations within the perceptual range of the skin with different velocities and amplitudes. Perceiving the surface of an unfamiliar object primarily involves the perception of its surface texture, which is mainly discriminated by detecting surface features such as friction coefficient, wetness, and surface roughness [55,56,57]. Among these, roughness is particularly helpful for perceiving texture characteristics [58]. In this paper, a 16 × 16 ultrasonic phased array was designed with STM to create tactile perceptions of different texture features, such as roughness and hardness, using ultrasound. A skin numerical model was built based on COMSOL 6.3 and the stress–strain of the skin under ultrasonic acoustic radiation pressure was analyzed. Finally, psychophysical experiments were conducted to evaluate the effect of ultrasonic haptic feedback.

2. Materials and Methods

To systematically evaluate the performance and user experience of the ultrasonic haptic feedback system, this chapter designs and conducts a series of experiments. These experiments progress from technical verification and simulation analysis to subjective human evaluation, aiming to comprehensively quantify its output capability and realism.

2.1. Ultrasonic Haptic Feedback Technology Focus Size Measurement and Accuracy of Excitation Load Experiments

Ultrasonic phased arrays for ultrasonic haptic feedback are based on the principle of acoustic wave phase control, by controlling the initial phase of the ultrasonic transducer array, so that the acoustic wave emitted by each ultrasonic transducer has the same phase when it reaches a certain point in the space, so that the acoustic pressure can be superimposed on the enhancement of the point, which produces a convergent superposition effect is called the focal point [59,60,61]. Considering the influence of the planar array’s area and the ultrasound transducer’s emission angle on the focal point, a 16 × 16 array comprising 256 elements was selected. Each element has a radius of 5.0 ± 0.3 mm, with a center-to-center spacing of 11 mm between adjacent elements. A driving voltage of 10 V was applied. When multiple ultrasonic transducers are arranged in an array, and by precisely controlling the delay of the emission time, it is possible to achieve an in-phase superposition of sound waves at specific points in space, thus creating a focus area in the near-field region. A 40 kHz ultrasonic wave, for example, has a wavelength of approximately 8.6 mm, so the focal point formed is not a point but a surface, contributing to a detailed textured touch.
The air flow field above the ultrasonic phased array was observed using the texture shadowing technique shown in Figure 1c. By analyzing the morphology of the air flow field, the diameter of the focal point was determined in order to simulate a delicate virtual textured haptic. During the experiment, an LED lamp with a power of 3 W was used to emit white light, which traveled through the air flow field located above the ultrasonic haptic feedback device (ultrasonic phased array), and passed through the focusing of a K9 glass lens with a diameter of 203 mm and a focal length of 750 mm, and was finally reflected back to the 4K camera.
The mechanical properties of the skin are primarily determined by the dermis. The palm of the human hand measures approximately 100 mm × 100 mm, and the combined maximum thickness of the epidermis and dermis can reach up to 4.15 mm. Therefore, a geometric block of 100 mm × 100 mm × 5 mm was used to simulate the skin. Given that the focal diameter is approximately 15 mm, a circular region with a diameter of 15 mm was defined on the skin surface to represent the focal zone. Fixed constraints were applied along the four edges of the bottom layer of the skin to ensure more accurate displacement measurements. The shear wave frequency involved in this study ranges from 50 Hz to 250 Hz. The mesh size was determined by the highest frequency (250 Hz) in order to guarantee simulation accuracy for all frequency components of interest. Accordingly, the mesh size was set to λs/10, resulting in a maximum element size of 1.2 mm. The final model consists of 35,592 elements. The SLS model can characterize both creep and stress relaxation behaviors of the skin. Therefore, the SLS model was employed for skin modeling. The material density of the skin model is 1030 kg/m3, the Poisson’s ratio is 0.495, the high-frequency modulus is 12.5 kPa, the low-frequency modulus is 20 kPa, and the viscosity is 3.42 Pa·s.
A laser Doppler vibrometer was used for verifying the texture simulation by ultrasonic phased arrays, as shown in Figure 1d. Rat and porcine skin were chosen as the skin model because they are similar to human skin in terms of physical properties such as modulus of elasticity and hardness [62]. The skin of mice with dimensions of approximately 5 cm × 5 cm and a thickness of 0.5 mm and the skin of pigs with dimensions of 8 cm × 8 cm and a thickness of 4 mm were used in the experiments. The depilated mouse skin was placed on top of the pig skin to simulate the epidermal layer of human skin, while the pig skin was used to simulate the dermis and subcutaneous tissues, which was done in order to reduce the reflection of the pressure wave on the hard surface and to avoid secondary interference with the experiment. A thin layer of silver powder was evenly applied to the mouse skin surface to enable diffuse reflection of light back to the receiver. In the experimental setup, the ultrasonic haptic feedback device was placed 20 cm above the skin sample to ensure that the focal point could be precisely projected onto the skin surface. Its vibration velocity was measured using a laser Doppler vibrometer for comparison with the COMSOL skin model. The device rotated the focal point at a frequency of 100 Hz (i.e., 100 tactile stimuli were generated at 8 different locations per second, moving at a speed of about 12.56 m/s) to simulate the tactile perception of different textures.
The 40 kHz ultrasonic wave generates instantaneous acoustic pressure at the focal point, and the acoustic radiation pressure is the envelope of the instantaneous acoustic pressure, and the relationship between the two is shown in Figure 1e [17,63,64]. The 40 kHz instantaneous acoustic pressure is modulated into 50–250 Hz acoustic radiation pressure at each focal point, and in order to simplify the model, the acoustic radiation pressure is used as the ultrasonic excitation load, and its waveform is a rectangular square wave. If the formation of 50 Hz acoustic radiation pressure, i.e., the stimulus time for traversing each focal point is 0.0025 s. The excitation load is cycled according to the focal point position, and the number of cycles per second is expressed in terms of the rotational frequency, as shown in Figure 1f. Table 1 illustrates the relationship between the focal point moving speed and the focal point rotation frequency, the reason why the rotation frequency is used to indicate the speed of movement, because the human perceive of touch is very sensitive to the frequency, the rotation frequency can be easily linked to the tactile perception of frequency.

2.2. Setting of Monitoring Point and Monitoring Surface for Skin Texture-Aware Simulation

To ensure that the numerical simulation results accurately reflect human tactile perception, the location of the extracted data in the simulation was deliberately chosen to match the distribution of human tactile receptors. When simulating texture haptics, it is crucial to understand how the tactile receptors respond to different surface features. The number of focal points is 8, the trajectory is circular, the radius of the trajectory is 2 cm, and the direction of the trajectory is clockwise, as shown in Figure 2a. For the setting of monitoring points, considering that the maximum sensory field of tactile receptors is about 4 mm [65], one monitoring point is set every 4 2   mm starting from the center of the circle (0, 0). There are two monitoring points at the focal position, three monitoring points from the focal position towards the center of the circle, and three monitoring points from the center of the circle towards the edge, as shown in Figure 3c. Since all parameters of the focal point do not change during the moving process and the moving trajectory is a circle, the values of each variable are periodically the same at the position of the same length from the center of the circle, so the stress–strain situation of each monitoring point can reflect the situation at the position of the same length from the center of the circle. The purpose of setting up monitoring points is to horizontally compare the stress–strain situation at different locations under the same focal rotation frequency, and to vertically compare the changes in stress–strain at the same monitoring location under different focal rotation frequencies. Tactile perception of human mainly relies on four types of tactile receptors: Meissner corpuscles, Pacinian corpuscles, Merkel cell-axon complexes, and Ruffini endings, which are mainly distributed in the dermis (Pacinian corpuscles are distributed in the subcutaneous tissues, next to the dermis) [66]. In order to minimize data error, the data were extracted to a depth of 1/2 of the dermis thickness, so the monitoring surface was set to be a plane which is 2 mm from the upper surface, as shown in Figure 2b. The purpose of setting the monitoring surface is to reflect more intuitively the different textures of the skin under different focal rotation frequencies due to the different interference effects of shear waves.
Velocity reflects the speed of movement of the mass point in the skin, while displacement reflects the length of the distance traveled by the mass point, and the combination of the two can reflect the vibration of the skin very well. The physical quantities chosen to analyze the skin from the stress point of view are normal stress and tangential stress. Normal stress describes the force per unit area when an object is subjected to pressure, i.e., the stress caused by the pressure in the normal direction. Tangential stress describes the maximum value of tangential stress in a material, i.e., the maximum value of tangential stress perpendicular to the direction normal to the surface. Stress and strain are in correspondence, where stress is high the strain is also high, so the trend of stress is also the trend of strain.

2.3. Experiment on the Evaluation of Human Realistic Haptics with Ultrasonic Haptic Feedback

A psychophysical experiment was used to tactilely evaluate the effect of ultrasonic tactile feedback. The experimental subjects were university students, a total of 23 people, including 14 male and 9 female, with an average age of 23 years old and no trauma to the hands.
Before conducting the formal experiment, subjects performed a 5 min pre-experiment, i.e., to familiarize themselves with the tactile perception of ultrasonic haptic feedback. During the pre-test, the subjects felt the stimuli of 50 Hz, 100 Hz, 150 Hz, 200 Hz, and 250 Hz rotating at the focal point in sequence, with a time interval of 30 s and a stimulation time of 30 s, as shown in Figure 1b. During the experiment, the subjects remained in a relaxed state and expressed their feelings in order to strengthen their sensory memories. According to the perceptions described by the subjects, most of them mentioned ‘airflow hitting the hand’, ‘wind blowing’ and ‘tingling vibration’. These perceptions will be quantified uniformly in the formal experiment to compare the trend of tactile perception with the frequency of focal rotation.
Subjects wore earplugs and closed eyes throughout the experiment to minimize auditory and visual effects on the experiment. The perceptual experiment consisted of discrete trials using predefined focal rotational frequencies ranging from 50 to 250 Hz in 50 Hz increments. In each trial, a 30 s stimulus was delivered to the participant’s palm, followed by a 30 s response interval for collecting perceptual feedback. The feedback was in the form of ratings of pressure perception and vibration perception, which were chosen because tactile receptors are sensitive to pressure and vibration. Pressure was defined as the strength of the airflow hitting the palm or the strength of the airflow blowing upwards, and vibration was defined as whether the vibration could be clearly felt. All tactile perceptions (including pressure and vibration perceptions) produced by the first stimulus, i.e., the 50 Hz stimulus, were used as reference items, and their pressure and vibration perceptions were fixed to a score of 5. If the pressure perception became stronger and the vibration was noticeable, the scores were rated from 5 to 10, and vice versa, if the pressure perception became weaker and the vibration was not noticeable, the scores were rated from 0 to 5. In order to establish the precise relationship between perception-scoring, the difference between the tactile perception produced by the first stimulus (50 Hz) and the tactile perception produced by the second stimulus (100 Hz) was defined as the unit 1 of scoring, so that when scoring the tactile perception of the 100 Hz stimulus, only the operation of adding 1, subtracting 1, or adding 0 can be carried out on the 5, and the tactile perception scoring of stimuli after 100 Hz needs to refer to the tactile perception represented by unit 1.
The cognitive experiment consisted of five blocks. Each block included two distinct focal rotational frequencies—one serving as the target stimulus and the other as the non-target. Prior to each block, participants were repeatedly exposed to the sensations generated by these two frequencies, which were designated as “Tactile Sensation 1” and “Tactile Sensation 2”. This familiarization continued until the participants could reliably distinguish between the two sensations. Following this, the two rotational frequencies were presented five times each in a randomized order. On each trial, participants were asked to identify whether the elicited sensation was more like “Tactile Sensation 1” or “Tactile Sensation 2”. The experimental sequence is shown in Table 2.

3. Results

We begin by examining the tactile feedback characteristics generated by the ultrasound itself, progressively delve into the mechanical simulation of its interaction with the skin, and ultimately evaluate its perceptual effects through subjective human experiments, thereby providing a comprehensive and multi-faceted discussion of the system’s overall performance.

3.1. Tactile Texture Feedback Generated by Ultrasonic

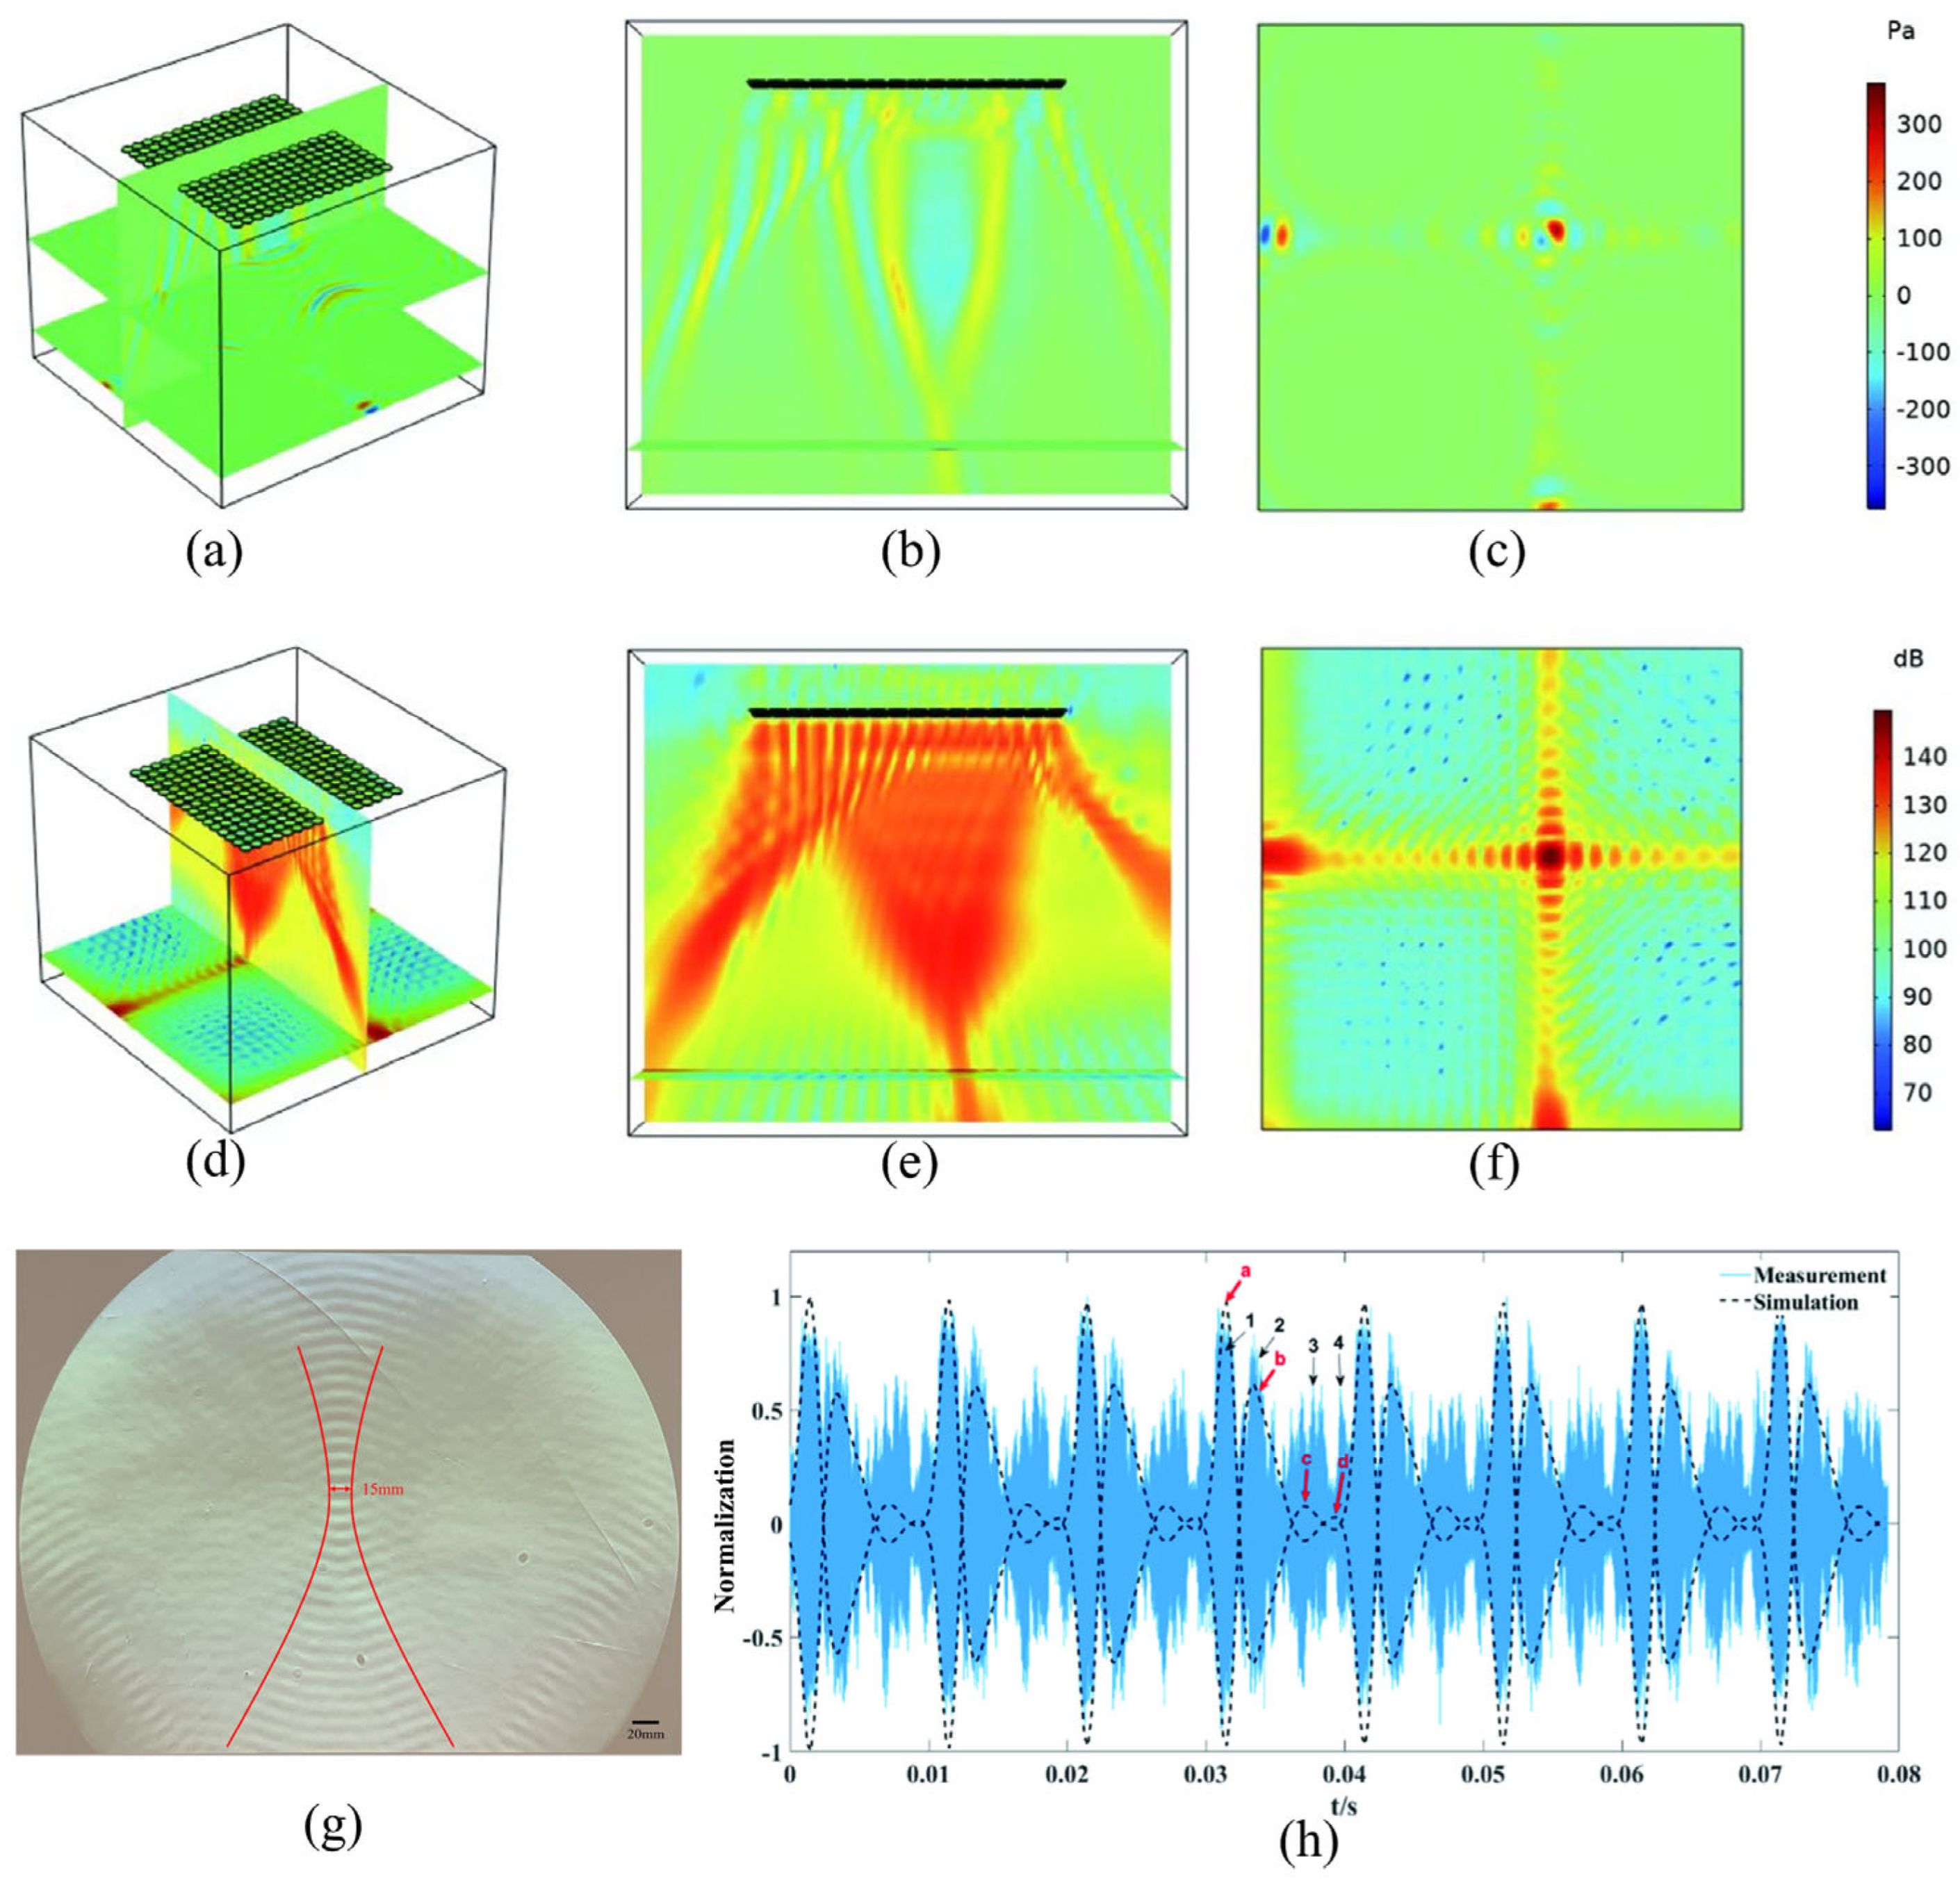
Figure 3a,d show the interference and superposition of sound waves in the near-field region, where the sound pressure distribution is complex and variable. Air is a lossy medium, and the attenuation coefficient of ultrasonic waves in air is proportional to the square of the ultrasonic frequency, the higher the frequency, the faster the energy attenuation when the ultrasonic waves propagate in air [67]. It can be seen from Figure 3b,e that side flaps and gratings are generated when ultrasonic waves are focused in air. The generation of side flaps is closely related to the geometrical characteristics of the array, the spacing of the array elements, the wavelength of the acoustic wave and the excitation mode. Due to the physical size of typical ultrasonic transducers (with a radius of ~5 mm), the minimum achievable spacing falls below the required half-wavelength (e.g., <4.3 mm for 40 kHz sound). This physical constraint prevents the complete elimination of side lobes, allowing only for their partial reduction. Figure 3c,f illustrate that in the vicinity of the focal point, the sound pressure peaks, creating a region of high intensity sound pressure, which stimulates the skin to produce fine tactile feedback. When the hand is placed at the focal point, the hand blocks the propagation of the acoustic wave, causing part of the energy of the acoustic wave to be converted into the mechanical vibration energy of the skin, which in turn produces a fine textured tactile perception on the skin as shown in Figure 1a,b. Meanwhile, the emission angle of the ultrasonic transducer is considered in this paper to ensure that the acoustic wave energy is effectively transmitted to the skin rather than dissipated in the air, and the stability of the acoustic wave transmission is ensured.
In order to investigate how ultrasound produces a detailed texture perception when perceived on the skin, the dimensions of the texture-generating focal point in the ultrasonic haptic feedback system were measured in this paper, and the diameter of the focal point was measured to be approximately 15 ± 0.8 mm by the image of captured air density shown in Figure 3g. In addition, an animal skin model was used to measure the vibration velocity of the skin under ultrasonic waves, which was normalized to the numerical simulation results and a comparative analysis shown in Figure 3h was performed. The experimental data are represented by solid lines and the simulation data are represented by dashed lines. The experimental data show four spike regions (labeled as ‘1’, ‘2’, ‘3’, ‘4’), while the simulation data also show the corresponding four spike regions (labeled as ‘a’ ‘b’ ‘c’ ‘d’). By comparing the experimental and simulation data, and the spikes appear at the same time in the experimental and simulation data. Therefore, the simulation is valid and correct. In the first spike region, the amplitudes of ‘1’ and ‘a’ are almost the same, but in the second, third and fourth spike regions, the amplitudes of the experimental data are generally higher than the simulated data. This difference may be due to the thinness of the skin samples, where the pressure wave penetrated the skin and was reflected back after encountering a hard surface, causing secondary stimulation of the samples and leading to an increase in the amplitude of the vibration.

3.2. Simulation of Skin Stress–Strain of Ultrasonic Haptic Feedback

Figure 4 shows simulation of the skin stress–strain. Observations are mainly made from two directions, normal refers to the direction perpendicular to the skin, i.e., the Z direction, and tangential refers to the direction parallel to the skin, i.e., the X direction (or Y direction). The next three aspects of shear wave propagation velocity, stress and strain of the skin are discussed and analyzed, respectively.
Shear wave propagation velocity: The variation in normal velocity shows that when the focal point is in the stimulated state, the skin produces shear waves that spread outward and the number of interacting shear waves increases as the rotation frequency becomes larger. At a rotation frequency of 50 Hz, up to three focal points and their shear waves can be seen, and at a rotation frequency of 250 Hz, the observable focal points and their shear waves reach seven. At the same time, the propagation range of shear waves also has more obvious characteristics. Comparing the propagation ranges of shear waves under five rotation frequencies at the same moment, it can be found that the propagation ranges of shear waves are larger when the rotation frequencies are 100 Hz and 150 Hz, but they are not uniform, whereas the distribution of shear waves is more uniform when the rotation frequencies are increased to 200 Hz and 250 Hz. The reason for this phenomenon may be the matching of the impulse magnitude of the focal point to the skin and the viscoelastic nature of the skin. For the tangential velocity, when the focal rotation frequency is 50Hz, the tangential velocity amplitude is the largest, but the range is smaller. At a focal rotation frequency of 150 Hz, the effect of tangential shear wave interaction starts to become apparent. As the focal rotation frequency increases, the focal stimulation time becomes shorter, the impulse generated becomes smaller, the spacing between the peaks of the tangential velocity wave becomes shorter, and the amplitude of the tangential velocity becomes smaller.
Strain of the skin: It can be seen that the amplitude of normal displacement becomes smaller and smaller as the rotation frequency of each focus increases. Due to the viscoelastic properties of the skin, the skin is prone to back-and-forth vibration with small displacements, and at this time, although the normal displacement has the same trend as the normal velocity, the change in normal displacement is not as rapid as that of the normal velocity. For tangential displacement, as the rotation frequency increases, the excitation area of the maximum tangential displacement is gradually decreasing, and the amplitude of the maximum tangential displacement is also slowly becoming smaller. Due to the fact that when the focal points of different rotation frequencies act on the skin, the faster the rotation frequency, the shorter the focal point action time, which makes the amplitude of the tangential displacement smaller, but the number of reciprocations becomes more and more complex, making the tangential displacement texture image change more and more complex, and the area of the maximum tangential displacement decreases. The stress relaxation property of the skin makes the skin deform at a faster rate when external acoustic radiation pressure is applied to the skin, and the skin returns to its original state slowly when the acoustic radiation pressure disappears. The relaxation time is 0.17 ms.
Stress of the skin: It can be seen from the variation in normal stress that the amplitude of normal stress at the focal point does not change much at different rotation frequencies, and the interference pattern of shear wave in the skin becomes more and more complicated as the rotation frequency of the focal point increases. The normal stress distribution is mostly concentrated at one point or a certain region at frequencies of 50 Hz, 100 Hz, 150 Hz and 200 Hz, and the distribution is more uneven, whereas at 250 Hz, the distribution of normal stress is more uniform than that at the other rotational frequencies, showing a regular spiral shape. For tangential stress, when the focal rotation frequency is 50 Hz, the distribution of tangential stress is concentrated in the focal region and the shear wave is not obvious. When the rotation frequency is 100 Hz and 150 Hz, the difference between the tangential stress in the tail region and the focal region is reduced, and at this time, the interference effect of the shear wave is obvious, the distribution range is wide, and the texture pattern is clear. When the rotation frequency is 200 Hz and 250 Hz, the shear wave tail region is prolonged, and almost the first and the last are connected. Comparing the distribution of tangential stress at the same moment with different rotation frequencies, the faster the focal rotation frequency, the wider the area of tangential stress distribution and the smaller the magnitude of tangential stress. The faster the focal rotation frequency, the shorter the action time of the focal point, the smaller the impulse, and therefore the smaller the tangential stress amplitude.

3.3. Stress–Strain Conditions of Monitoring Points

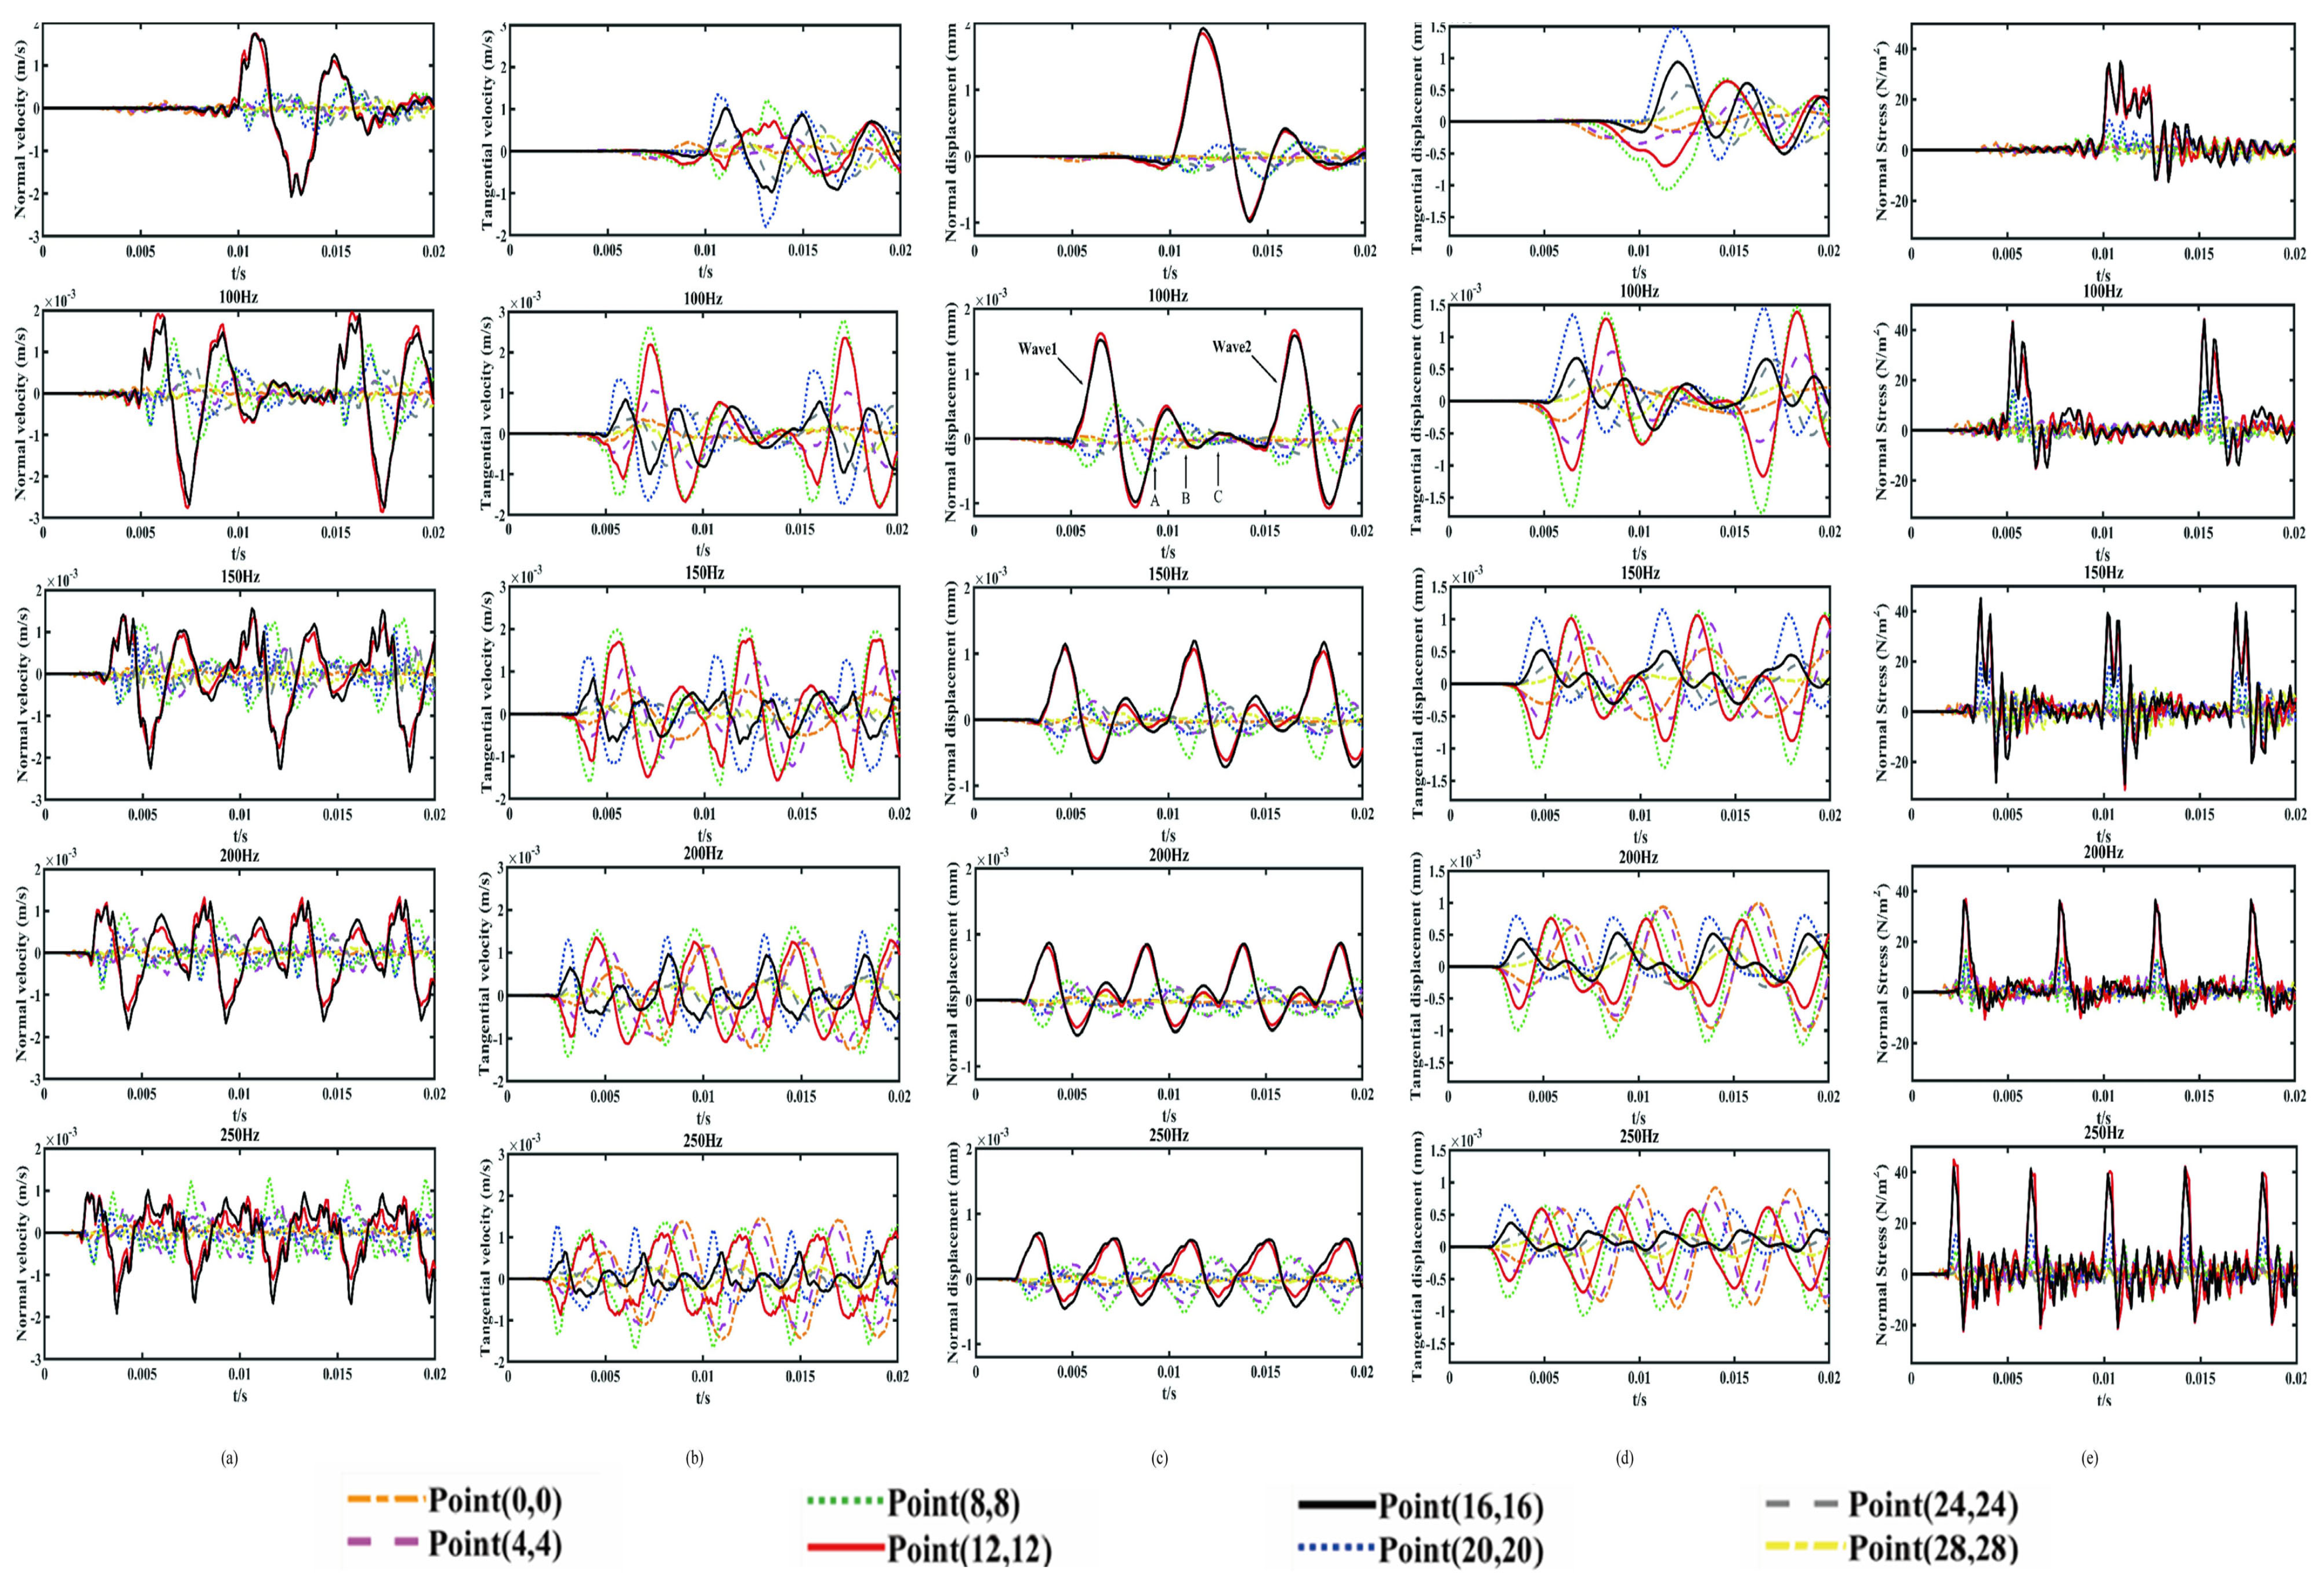
Normal velocity: It can be seen from Figure 5 that the amplitude of the two monitoring points, (12, 12) and (16, 16), changes most drastically regardless of the rotation frequency, and the two curves basically coincide. This is related to the fact that they are both on the focal action surface. Since the direction of the acoustic radiation pressure exerted by the focal point is normal, when the focal point is in the stimulated state, the two points have the same velocity in the normal direction; when the focal point moves to another position, their normal velocities will be slightly different due to the influence of the stimulation of the other focal points in the surrounding area; and when the focal point is cycling back again, the normal vibrational velocities of the two points will remain the same again, and so on. The normal velocity amplitudes at the monitoring points (8, 8), (20, 20), (4, 4) and (24, 24) are slightly smaller. It is worth noting that the difference in normal velocity amplitude between these four monitoring points is larger when the rotation frequency is 50 Hz, 100 Hz and 150 Hz, while the difference in amplitude is smaller when the rotation frequency is 200 Hz and 250 Hz, which indicates that the faster the rotation speed, the more uniform the normal velocity.
Tangential Velocity: When the focal point is in the stimulated state, a shear wave normal to the skin is generated within the skin and spreads around the focal point because the skin is viscoelastic. Since the focal point moves in a circular trajectory, there is more shear wave aggregation in the region from the focal point to the center of the circle. When the focal point moves slowly, such as 50 Hz, 100 Hz and 150 Hz, the monitoring points with larger amplitude of tangential velocity are mainly (8, 8), (12, 12), (16, 16) and (20, 20), which is related to their proximity to the focal point. When the rotation speed of the focal point becomes faster, such as 200 Hz and 250 Hz, the tangential velocity amplitudes of the other six monitoring points are similar, except for the monitoring points (24, 24) which are farther away from the focal point and arrive at fewer shear waves (28, 28), when the distribution of the tangential velocities is the most uniform. The tangential velocity has the largest magnitude when the rotation frequency is 100 Hz. In addition, the change in tangential variables should also consider the interaction between shear waves and shear waves, when the peak and crest (or trough and trough) of two shear waves meet, their amplitudes will be superimposed and become larger, while when the peak and trough meet, their amplitudes will cancel each other and then become smaller.
Normal displacement: It can be seen that the normal displacement amplitude of the monitoring points (12, 12) (16, 16) is basically the same and larger than the other monitoring points, which is due to the fact that the two monitoring points are in the focal point area, so no matter what the frequency of rotation of the focal point is, the amplitude of their normal displacements is the largest. As the rotation frequency of the focal point increases, the normal displacement amplitude of the two points decreases, which may be related to the time of the action of acoustic radiation pressure, i.e., the impulse. As the acoustic radiation pressure at the focal point is unchanged, the higher the rotation frequency of the focal point is, the shorter the time of acoustic radiation pressure in a rotation cycle, the smaller the impulse, the impulse and the time of action are basically proportional to the normal displacement amplitude and the focal point of the time of action are also basically proportional to those in Figure 5. In addition, it can be seen from the waveform that with the increase in the rotation frequency, the waveform has a tendency to shift left. The waveform of 50 Hz is similar to that of Wave1 T 100 Hz; when Wave2 shifts left to C, it is similar to that of 150 Hz, when Wave2 shifts left to B, it is similar to that of 200 Hz, and when Wave2 shifts left to A, it is similar to that of 250 Hz, which indicates that the normal displacement at the focus is affected by the focus next to it. This indicates that the normal displacement at the focus is less affected by the focus next to it. The monitoring points (8, 8) and (20, 20), which are located inside and outside the focal point, do not show the same consistency as that of the focal point (12, 12) and (16, 16), except for the difference between the two at 50 Hz, the amplitude and speed of change in the normal displacement of the monitoring point (8, 8) are larger than that of the monitoring point (20, 20) at the rest of the rotation frequency, especially at 150 Hz. While the normal displacement changes of other monitoring points (0, 0) (28, 28) (4, 4) (24, 24) are not obvious. It is noteworthy that the variance of normal displacement of each monitoring point is the smallest at 250 Hz. This indicates that the larger the focal point rotation frequency, the more pronounced is the spreading of normal pressure to the region around the focal point.
Tangential displacement: When the acoustic radiation pressure acts on the surface of the skin, the skin deforms and produces a shear force, and under the action of the shear force, the skin undergoes a relative displacement inside the skin, i.e., tangential displacement. Figure 5 presents the tangential displacement changes of the eight monitoring points at each rotation frequency, from which it can be seen that the fastest responses are at the monitoring points (8, 8) and (20, 20) because they are closest to the focal point and are not subject to the forced normal compression of the acoustic radiation pressure. In the figure, the tangential displacement of point (8, 8) (12, 12) is negative first because its direction of change is opposite to the positive direction of the X-axis, and similarly, the tangential displacement of point (20, 20) (16, 16) is positive first because its direction of change is the same as the positive direction of the X-axis. It is worth noting that the monitoring point (0, 0), the tangential displacement amplitude is getting larger and larger as the frequency of focal rotation increases, which may be related to the superposition of shear waves. Due to the increasing speed of the focal stimulus, the shear waves with the same frequency and direction and simultaneous difference are continuously superimposed, and all of them eventually converge at (0, 0), thus making the amplitude of tangential displacement larger and larger. From the figure, it can also be seen that with the increase in the focal rotation frequency, the closer to the center of the circle the tangential displacement amplitude of the inner region of the focus is larger, which indirectly proves the transmission and superposition of shear waves.
Normal stress: The changes in normal stress at the eight monitoring points at different focal rotation frequencies can be seen. In terms of amplitude, the maximum magnitude of normal stress at the five focal rotation frequencies does not differ much because when the skin is compressed, its normal stress will keep increasing, and when the skin is compressed to the limit, the normal stress and the acoustic radiation pressure reach equilibrium, and the two are equal. In terms of waveforms, it can be seen that the maximum magnitude spikes at 50 Hz, 100 Hz and 150 Hz occur twice consecutively, while the maximum magnitude spikes at 200 Hz and 250 Hz occur once.

3.4. Evaluation of Human Tactile Perception on Ultrasonic Virtual Texture

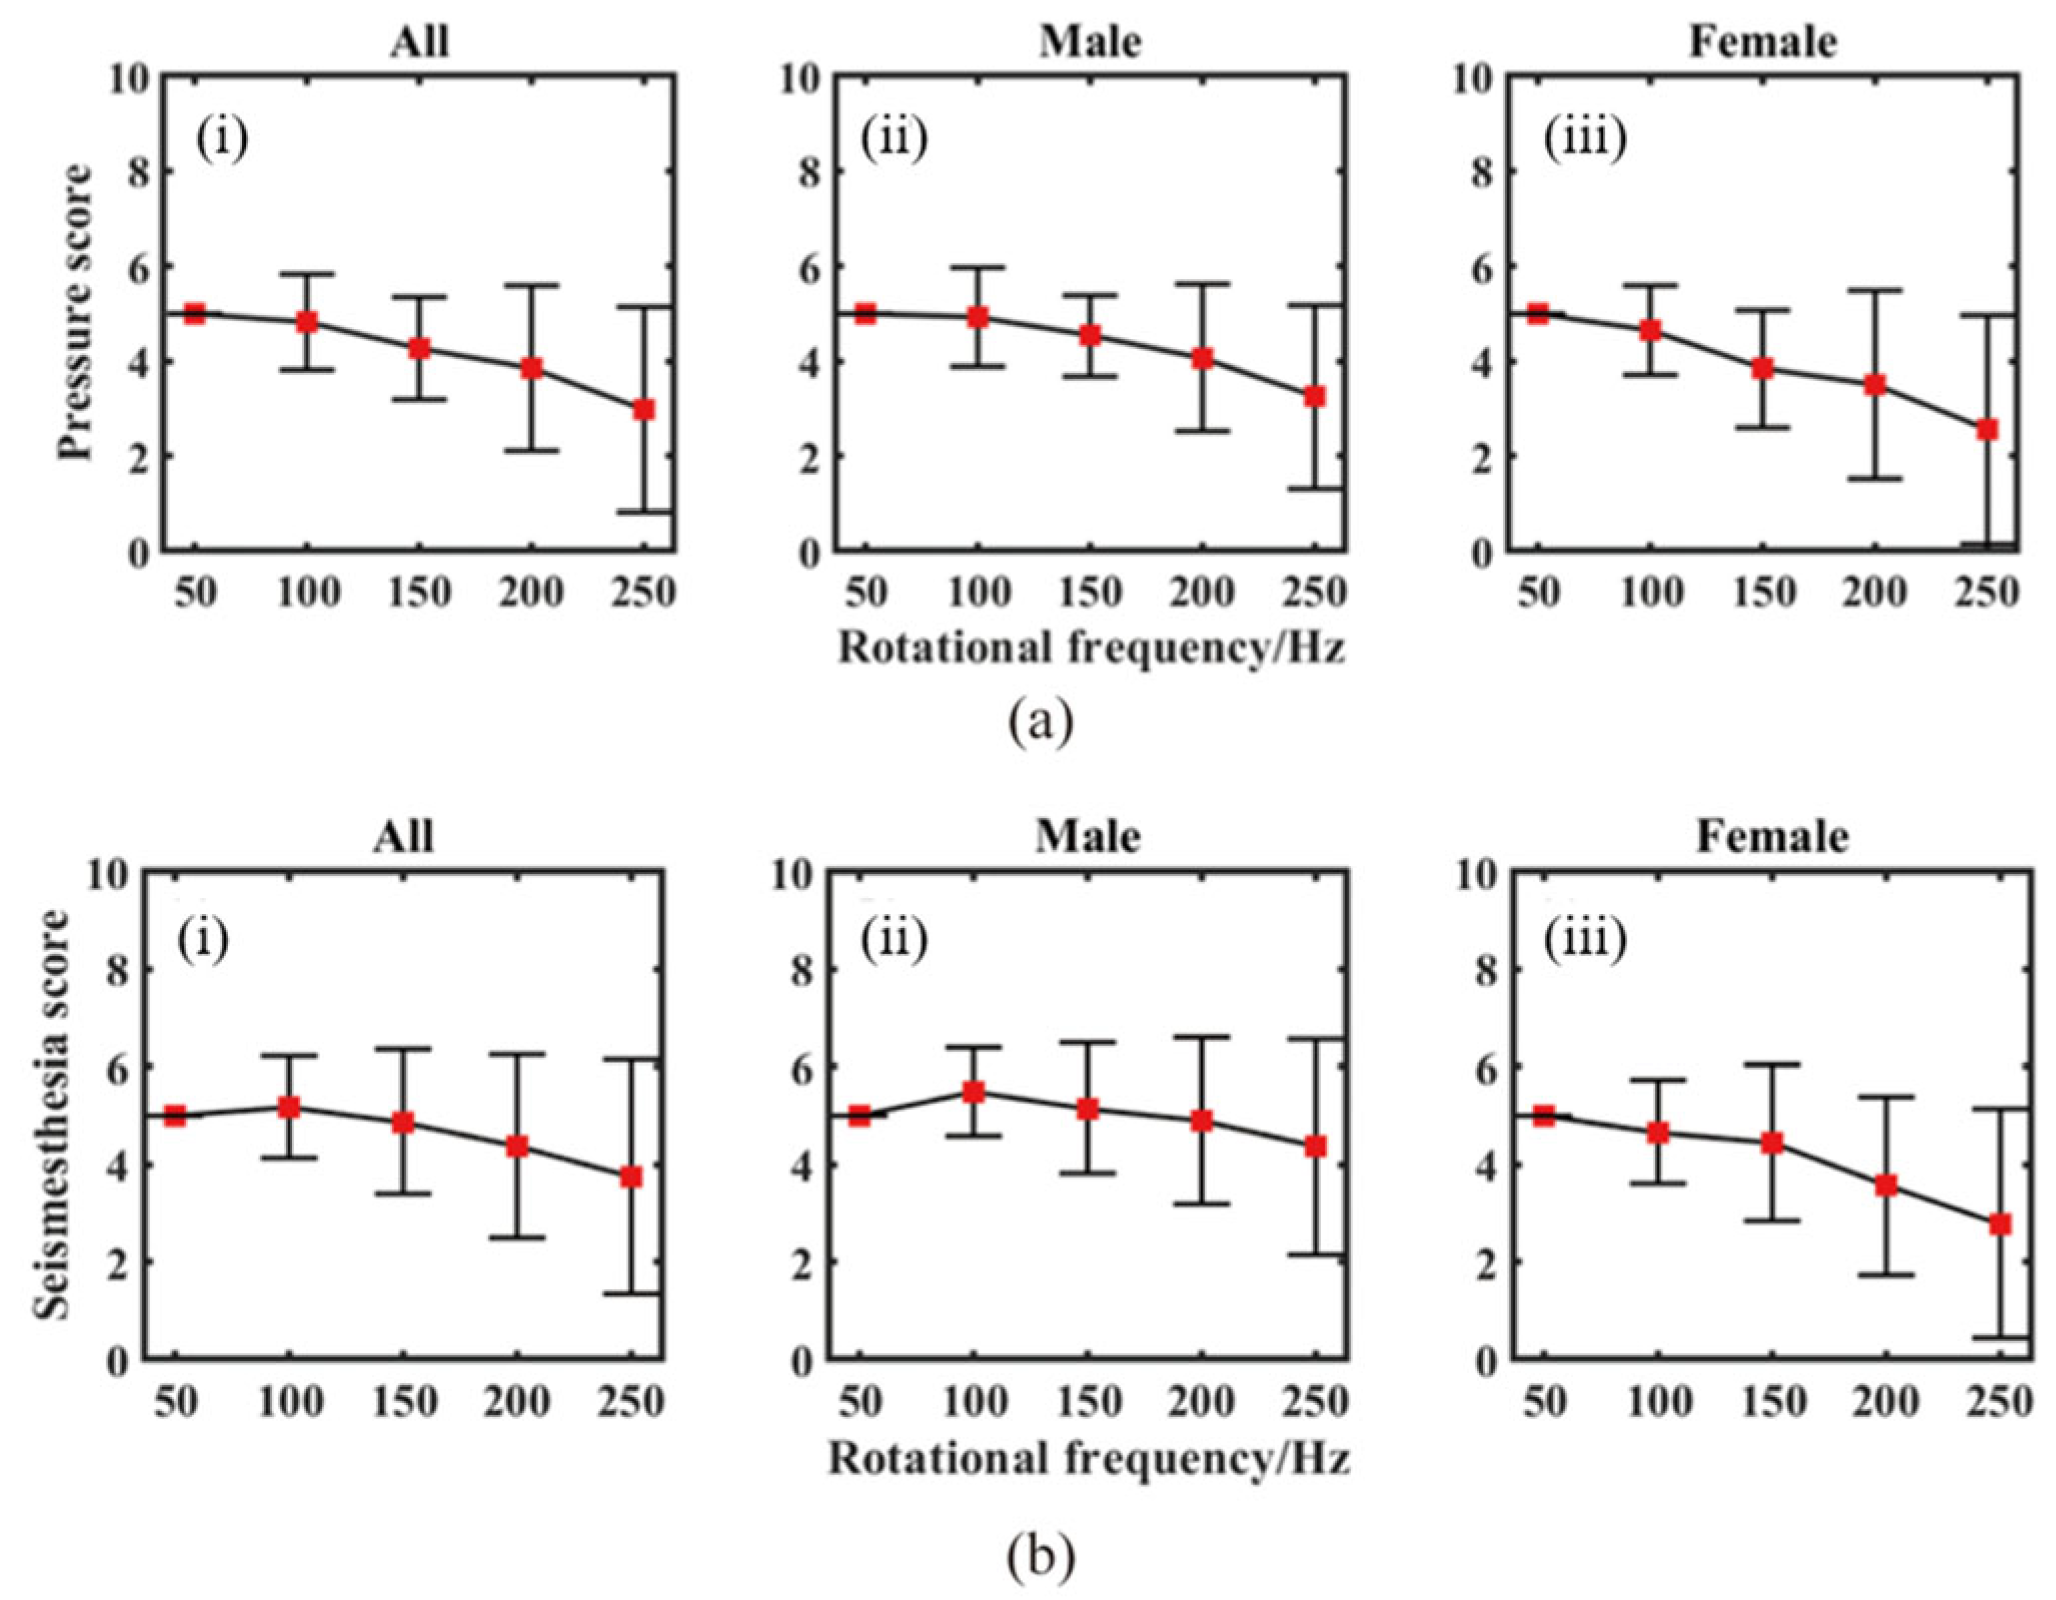
Figure 6a demonstrates the subjects’ ratings of pressure perception at different rotation frequencies. The mean pressure sensation score tends to decrease as the frequency of focal rotation increases, both for the pressure sensation scores of all subjects and for the pressure sensation scores of males (females) only. When focal points of different frequencies are applied to the skin, the normal pressure on the skin is approximately the same, but the duration of the focal point’s action decreases with increasing frequency. Slow-adapting tactile receptors in the body, such as SAI (Merkel cell–axon complex) and SAII (Ruffini corpuscles), are very sensitive to sustained pressure stimuli [68]. As the frequency of focal rotation increases, the duration of action of the focal point on the skin within a single cycle becomes shorter, resulting in a lower pressure perception score. In addition, when the skin is subjected to normal pressure, tangential stresses are generated due to the viscoelastic properties of the skin. Figure 4 shows a strong correspondence between the trends in pressure perception scores and those of normal displacement and tangential stress. This correlation points to these parameters as more accurate descriptors of pressure perception. These findings suggest that the skin’s response to dynamic pressure changes is closely related to tactile perception and contribute to the understanding of how the skin converts mechanical stimuli into tactile information.
Figure 6b demonstrates the subjects’ ratings of vibration perception at different rotation frequencies. The male subjects tended to perceive the vibration perception as more pronounced at 100 Hz than at 50 Hz, but it diminished as the frequency of focal rotation increased. In contrast, female subjects generally perceived a decrease in vibration perception with increasing focal rotation frequency. The gender difference may be related to the sensitivity of the skin to vibration. Meissner corpuscles are sensitive to low-frequency vibrations (2–60 Hz), whereas Pacinian corpuscles are sensitive to high-frequency vibrations (40–700 Hz). Since all focal rotation frequencies in the experiment activated these receptors, the perception of vibratory perception may be related to the elastic modulus of the skin. The modulus of elasticity of female skin is typically higher than that of male [69], which means that female skin may be more sensitive in response to vibration, especially at low frequencies. The perception of vibration perceive is also related to the threshold of the receptors, and as the frequency of focal rotation increases, the human body’s ability to perceive vibration decreases, which may be one of the reasons for the decrease in vibration perceive scores for 150–200 Hz stimuli. A comparison with Figure 4 reveals that the trend in vibration perception scores aligns with those of tangential velocity and tangential stress, suggesting that these are key factors influencing vibration perception.
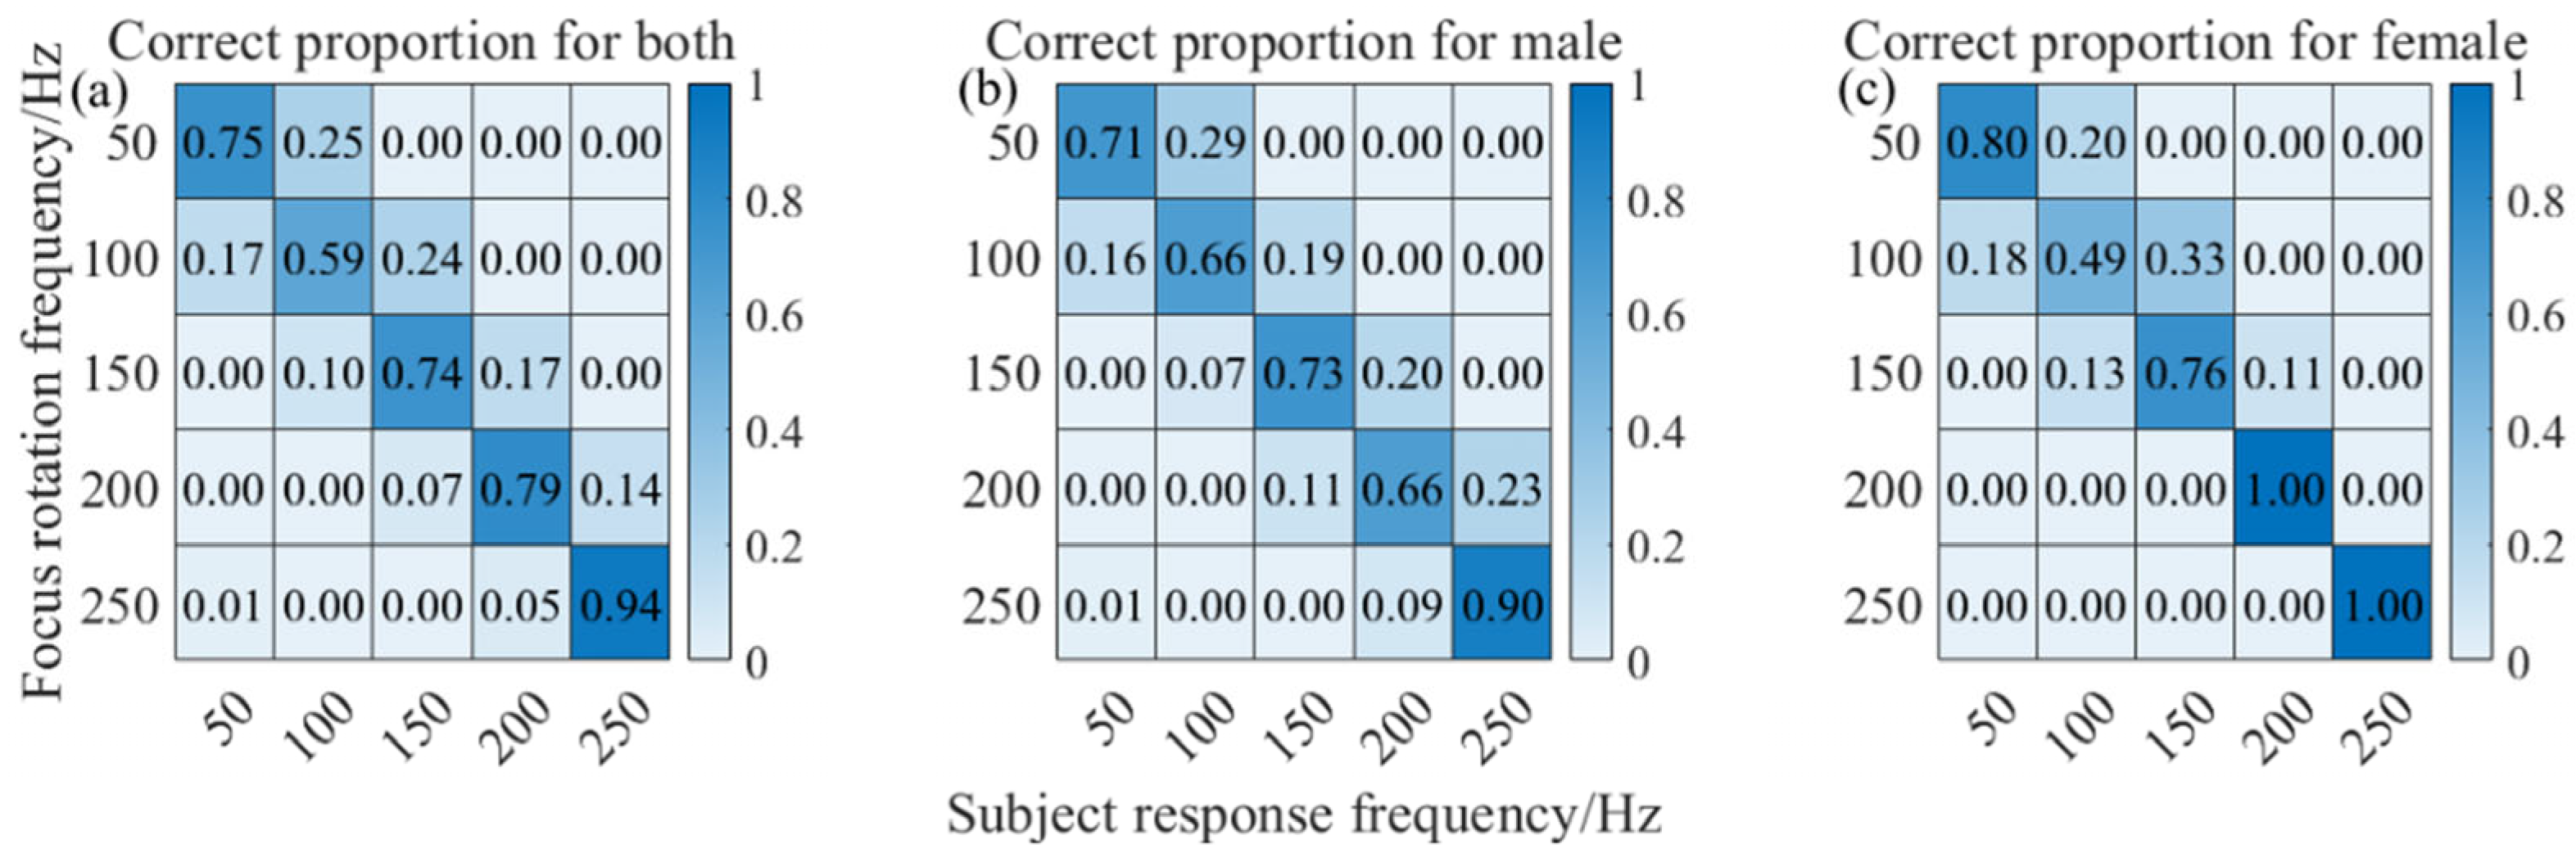
Figure 7 shows the results of the cognitive experiment. The subjects were asked to choose the corresponding frequency according to the tactile perception. It can be seen that the positive response rate of all subjects is above 50%, and the positive response rate of male subjects is above 66%, while the positive response rate of females is lower only in the second set of experiments (100 Hz and 150 Hz) (49%), and the rest of the positive response rate is above 76%, which suggests that the virtual textures presented in this paper are able to have texture characteristics and can be perceived and distinguished. However, the results also show that the tactile perception generated by the 100 Hz focal rotation frequency is similar to that generated by the 150 Hz focal rotation frequency, which is difficult to distinguish. After the experiments, some subjects gave feedback that the cognitive experiment has better effect on the feedback of tactile perception, because the stimulus time and interval time of the cognitive experiment are shorter, while the stimulus time and interval time of the perceptual experiment are longer, and the experimental process requires subjects to keep their arms at the horizontal level, so the tactile perception will be numb with the prolongation of the time, and in addition, the interval time is longer than the tactile memory time, which will result in the forgetfulness of the perception. Overall, the subjects could distinguish the tactile perception of two adjacent stimuli.

4. Discussion

In contrast to the work of Ablart and Beattie, which primarily investigated the effect of focal traversal frequency on roughness perception, our experiment further validates the relationship between acoustic pressure amplitude and perceived compliance (hardness/softness), as well as the influence of focal motion velocity on roughness [46]. The results demonstrate that ultrasonic feedback can generate distinct tactile textures under STM mode. Through a series of psychophysical and cognitive experiments, we observed that pressure perception decreased as focal rotation frequency increased, likely due to the shorter duration of interaction at higher frequencies. Due to the elasticity of the skin, when the focal point is applied for a long time, if the elasticity built up in the skin is greater than the acoustic radiation pressure, there will be a small rebound of the skin to maintain the original state, and the normal stress decreases during the rebound process, and then when the elasticity decreases to a level less than the acoustic radiation pressure, the skin is compressed, and therefore the normal stress increases again until the focal point is no longer applied to the skin. Moreover, gender differences in vibration perception were noted, with male and female subjects exhibiting different sensitivities to vibration based on the frequency of the ultrasonic stimulation. This variation is likely influenced by the skin’s viscoelastic properties and receptor response characteristics.
In terms of shear wave propagation, the study found that the skin’s stress and strain responses varied with focal rotation frequencies, reflecting the complex interaction between the ultrasonic waves and the skin’s mechanical properties. These findings suggest that the skin’s dynamic response to pressure and vibration stimuli plays a critical role in shaping tactile perception, particularly in the context of virtual textures generated by ultrasonic feedback. The cognitive experiments confirmed the ability of subjects to differentiate between adjacent stimuli, further supporting the feasibility of using ultrasonic waves to generate realistic and distinguishable tactile sensations. However, the difficulty in distinguishing between stimuli at 100 Hz and 150 Hz frequencies points to a potential area for further research. In conclusion, this research contributes to the understanding of ultrasonic tactile feedback and its potential applications in haptic technology. The findings highlight the importance of considering the complex interplay between frequency, stress–strain behavior, and sensory perception when designing ultrasonic systems for virtual texture generation. Further exploration of the influence of other physical parameters, such as skin elasticity and receptor distribution, may provide deeper insights into optimizing ultrasonic tactile feedback systems for practical applications in fields such as virtual reality, medical devices, and tactile displays.

Author Contributions

K.L. and W.R. realized the hardware design and software design and implemented the driver circuits. K.L., K.F. and S.Z. designed the simulation models of acoustic pressure and stress–strain of the skin. S.C. compiled the results. Original writing, reviewing and editing was carried out by W.F., A.L., Y.W. and N.Y. was responsible for supervising the work. All authors have read and agreed to the published version of the manuscript.

Funding

The National Natural Science Foundation of China (No. 52475190 and No. 62271235), China Postdoctoral Science Foundation Funded Project (No. 2024M751165); The Tribology Science Fund of State Key Laboratory of Tribology in Advanced Equipment (No. SKLTKF24B17).

Institutional Review Board Statement

The study was conducted in accordance with the Declaration of Helsinki, and approved by the Jiangsu University Hospital Ethics Committee of JSDX20240313098 on 13 March 2024. The animal study protocol was approved by the Jiangsu University Hospital Ethics Committee of UJS-IACUC-AP-2025031405 on 14 March 2025.

Informed Consent Statement

Informed consent was obtained from all subjects involved in the study.

Data Availability Statement

Data will be made available on request.

Conflicts of Interest

The authors declare no competing interests.

References

  1. Sun, Z.; Zhu, M.; Shan, X.; Lee, C. Augmented tactile-perception and haptic-feedback rings as human-machine interfaces aiming for immersive interactions. Nat. Commun. 2022, 13, 5224. [Google Scholar] [CrossRef] [PubMed]
  2. Lim, K.; Lee, J.; Kim, S.; Oh, M.; Koh, C.S.; Seo, H.; Hong, Y.-M.; Chung, W.G.; Jang, J.; Lim, J.A.; et al. Interference haptic stimulation and consistent quantitative tactility in transparent electro tactile screen with pressure-sensitive transistors. Nat. Commun. 2024, 15, 7147. [Google Scholar] [CrossRef] [PubMed]
  3. Wan, C.; Cai, P.; Guo, X.; Wang, M.; Matsuhisa, N.; Yang, L.; Lv, Z.; Luo, Y.; Loh, X.J.; Chen, X. An artificial sensory neuron with visual-haptic fusion. Nat. Commun. 2020, 11, 4602. [Google Scholar] [CrossRef]
  4. Yu, M.; Cheng, X.; Peng, S.; Cao, Y.; Lu, Y.; Li, B.; Feng, X.; Zhang, Y.; Wang, H.; Jiao, Z.; et al. A self-sensing soft pneumatic actuator with closed-Loop control for haptic feedback wearable devices. Mater. Des. 2022, 223, 111149. [Google Scholar] [CrossRef]
  5. Luo, Y.; Liu, C.; Lee, Y.J.; DelPreto, J.; Wu, K.; Foshey, M.; Rus, D.; Palacios, T.; Li, Y.; Torralba, A.; et al. Adaptive tactile interaction transfer via digitally embroidered smart gloves. Nat. Commun. 2024, 15, 868. [Google Scholar] [CrossRef]
  6. Shor, D.; Zaaijer, B.; Ahsmann, L.; Weetzel, M.; Immerzeel, S.; Eikelenboom, D.; Hartcher-O’Brien, J.; Aschenbrenner, D. Designing haptics: Improving a virtual reality glove with respect to realism, performance, and comfort. Int. J. Autom. Technol. 2019, 13, 453–463. [Google Scholar] [CrossRef]
  7. Kyung, K.-U.; Lee, J.-Y.; Park, J.; Srinivasan, M.A. WUBI-PEN: Sensory feedback stylus interacting with graphical user interface. PRESENCE Virtual Augment. Real. 2012, 21, 142–155. [Google Scholar] [CrossRef]
  8. Chen, D.; Song, A.; Tian, L.; Fu, L.; Zeng, H. FW-Touch: A finger wearable haptic interface with a MR foam actuator for displaying surface material properties on a touch screen. IEEE Trans. Haptics 2019, 12, 281–294. [Google Scholar] [CrossRef]
  9. Hu, Y.; Liu, P.; Amoah, A.E.; Wu, W.; Li, P. Control system of a performance test-bed for frost protection wind machines. Int. J. Agric. Biol. Eng. 2016, 9, 36–43. [Google Scholar]
  10. Kim, W.; Xiong, S. Pseudo-haptics and self-haptics for freehand mid-air text entry in VR. Appl. Ergon. 2022, 104, 103819. [Google Scholar] [CrossRef]
  11. Hoshi, T.; Takahashi, M.; Iwamoto, T. Noncontact Tactile Display Based on Radiation Pressure of Airborne Ultrasound. IEEE Trans. Haptics 2010, 3, 155–165. [Google Scholar] [CrossRef] [PubMed]
  12. Sodhi, R.; Poupyrev, I.; Glisson, M.; Israr, A. AIREAL: Interactive tactile experiences in free air. ACM Trans. Graph. 2013, 32, 1–10. [Google Scholar] [CrossRef]
  13. Jiang, Y.; Li, H.; Xiang, Q.; Chen, C. Comparison of PIV Experiment and Numerical Simulation on the Velocity Distribution of Intermediate Pressure Jets with Different Nozzle Parameters. Irrig. Drain. 2017, 66, 510–519. [Google Scholar] [CrossRef]
  14. Frueh, C.; Jain, S.; Zakhor, A. Data processing algorithms for generating textured 3D building facade meshes from laser scans and camera images. Int. J. Comput. Vis. 2005, 61, 159–184. [Google Scholar] [CrossRef]
  15. Almqvist, M.; Holm, A.; Persson, H.W.; Lindström, K. Characterization of air-coupled ultrasound transducers in the frequency range 40 kHz–2 MHz using light diffraction tomography. Ultrasonics 2000, 37, 565–575. [Google Scholar] [CrossRef]
  16. Li, Z.; He, W.; Huang, X.; Hu, X.; Chen, H.; Zhang, Y.; Shi, J.; Zou, X. Contactless printing of food micro-particles controlled by ultrasound. J. Food Eng. 2025, 388, 112375. [Google Scholar] [CrossRef]
  17. Gao, J.; Tunio, M.H.; Chen, Y.; He, R. Design and experiment of low-frequency ultrasonic nozzle integrating air-assistant system and acoustic levitation mechanism. Int. J. Agric. Biol. Eng. 2020, 13, 25–33. [Google Scholar] [CrossRef]
  18. Harvey, G.; Gachagan, A. Noninvasive field measurement of low-frequency ultrasonic transducers operating in sealed vessels. IEEE Trans. Ultrason. Ferroelectr. Freq. Control 2006, 53, 1749–1758. [Google Scholar] [CrossRef]
  19. Young, G.; Milne, H.; Griffiths, D.; Padfield, E.; Blenkinsopp, R.; Georgiou, O. Designing Mid-Air Haptic Gesture Controlled User Interfaces for Cars. Proc. ACM Hum. -Comput. Interact. 2020, 4, 1–23. [Google Scholar] [CrossRef]
  20. Hu, Y.; Asante, E.A.; Lu, Y.; Mahmood, A.; Buttar, N.A.; Yuan, S. Review of air disturbance technology for plant frost protection. Int. J. Agric. Biol. Eng. 2018, 11, 21–28. [Google Scholar] [CrossRef]
  21. Chai, X.; Xu, L.; Sun, Y.; Liang, Z.; Lu, E.; Li, Y. Development of a cleaning fan for a rice combine harvester using computational fluid dynamics and response surface methodology to optimise outlet airflow distribution. Biosyst. Eng. 2020, 192, 232–244. [Google Scholar] [CrossRef]
  22. Mao, H.; Ma, G.; Han, L.; Hu, J.; Gao, F.; Liu, Y. A whole row automatic pick-up device using air force to blow out vegetable plug seedlings. Span. J. Agric. Res. 2020, 18, e211. [Google Scholar] [CrossRef]
  23. Wu, S.; Liu, J.; Wang, J.; Hao, D.; Wang, R. The Motion of Strawberry Leaves in an Air-Assisted Spray Field and its Influence on Droplet Deposition. Trans. ASABE 2021, 64, 83–93. [Google Scholar] [CrossRef]
  24. Subramanian, S.; Seah, S.A.; Shinoda, H.; Hoggan, E.; Corenthy, L. Mid-Air Haptics and Displays: Systems for Un-instrumented Mid-air Interactions. In Proceedings of the 2016 CHI Conference Extended Abstracts on Human Factors in Computing Systems, San Jose, CA, USA, 7–12 May 2016. [Google Scholar]
  25. Liu, H.; Zhu, H. Evaluation of a Laser Scanning Sensor in Detection of Complex-Shaped Targets for Variable-Rate Sprayer Development. Trans. ASABE 2016, 59, 1181–1192. [Google Scholar]
  26. Jun, J.H.; Park, J.R.; Kim, S.P.; Min Bae, Y.; Park, J.Y.; Kim, H.S.; Choi, S.; Jung, S.J.; Park, S.H.; Yeom, D.-I.; et al. Laser-induced thermoelastic effects can evoke tactile sensations. Sci. Rep. 2015, 5, 11016. [Google Scholar] [CrossRef]
  27. Grammatikopoulos, L.; Kalisperakis, I.; Karras, G. Automatic multi-image photo-texturing of 3d surface models obtained with laser scanning. In Proceedings of the CIPA International Workshop on “Vision Techniques Applied to the Rehabilitation of City Centers”, Torino, Italy, 26 September–1 October 2005. [Google Scholar]
  28. Bermejo, C.; Hui, P. A survey on haptic technologies for mobile augmented reality. ACM Comput. Surv. 2022, 54, 1–35. [Google Scholar] [CrossRef]
  29. Wee, C.; Yap, K.M.; Lim, W.N. Haptic interfaces for virtual reality: Challenges and research directions. IEEE ACCESS 2021, 9, 112145–112162. [Google Scholar] [CrossRef]
  30. Yang, T.H.; Kim, J.R.; Jin, H.; Gil, H.; Koo, J.H.; Kim, H.J. Recent Advances and Opportunities of Active Materials for Haptic Technologies in Virtual and Augmented Reality. Adv. Funct. Mater. 2021, 31, 2008831. [Google Scholar] [CrossRef]
  31. Pelivanov, I.; Buma, T.; Xia, J.; Wei, C.-W.; O’Donnell, M. A new fiber-optic non-contact compact laser-ultrasound scanner for fast non-destructive testing and evaluation of aircraft composites. J. Appl. Phys. 2014, 115, 113105. [Google Scholar] [CrossRef]
  32. Lakhiar, I.A.; Liu, X.; Wang, G.; Gao, J. Experimental study of ultrasonic atomizer effects on values of EC and pH of nutrient solution. Int. J. Agric. Biol. Eng. 2018, 11, 59–64. [Google Scholar] [CrossRef]
  33. Iwamoto, T.; Tatezono, M.; Shinoda, H. Non-contact method for producing tactile perception using airborne ultrasound. Lect. Notes Comput. Sci. 2008, 5024, 504–513. [Google Scholar]
  34. Korres, G.; Eid, M. Haptogram: Ultrasonic point-cloud tactile stimulation. IEEE Access 2016, 4, 7758–7769. [Google Scholar] [CrossRef]
  35. Wilson, G.; Carter, T.; Subramanian, S.; Brewster, S.A. Perception of ultrasonic haptic feedback on the hand: Localisation and apparent motion. In Proceedings of the SIGCHI Conference on Human Factors in Computing Systems, New York, NY, USA, 22–27 April 2006. [Google Scholar]
  36. Howard, T.; Marchal, M.; Pacchierotti, C. Ultrasound Mid-Air Haptics for Touchless Interfaces; Springer International Publishing: Berlin/Heidelberg, Germany, 2022; pp. 147–183. [Google Scholar]
  37. Zhang, L.; Hu, Y.; Wang, B.; Xu, X.; Yagoub, A.E.A.; Fakayode, O.A.; Ma, H.; Zhou, C. Effect of ultrasonic pretreatment monitored by real-time online technologies on dried preparation time and yield during extraction process of okra pectin. J. Sci. Food Agric. 2021, 101, 4361–4372. [Google Scholar] [CrossRef] [PubMed]
  38. Vidal, F.P.; John, N.W.; Healey, A.E.; Gould, D.A. Simulation of ultrasound guided needle puncture using patient specific data with 3D textures and volume haptics. Comput. Animat. Virtual Worlds 2008, 19, 111–127. [Google Scholar] [CrossRef]
  39. Park, C.; Lee, Y.; Yoon, S.H. UltraBoard: Always-available Wearable Ultrasonic Mid-air Haptic Interface for Responsive and Robust VR Inputs. Proc. ACM Interact. Mob. Wearable Ubiquitous Technol. 2025, 9, 1–31. [Google Scholar] [CrossRef]
  40. Freeman, E. Enhancing Ultrasound Haptics with Parametric Audio Effects. In Proceedings of the 2021 International Conference on Multimodal Interaction, Montreal, QC, Canada, 18–22 October 2021. [Google Scholar]
  41. Basdogan, C.; Giraud, F.; Levesque, V.; Choi, S. A Review of Surface Haptics: Enabling Tactile Effects on Touch Surfaces. IEEE Trans. Haptics 2020, 13, 450–470. [Google Scholar] [CrossRef]
  42. Montano-Murillo, R.; Pittera, D.; Frier, W.; Georgiou, O.; Obrist, M.; Cornelio, P. It sounds cool: Exploring sonification of mid-air haptic textures exploration on texture judgments, body perception, and motor behaviour. IEEE Trans. Haptics 2024, 17, 237–248. [Google Scholar] [CrossRef]
  43. Takahashi, R.; Hasegawa, K.; Shinoda, H. Tactile stimulation by repetitive lateral movement of midair ultrasound focus. IEEE Trans. Haptics 2020, 13, 334–342. [Google Scholar] [CrossRef]
  44. Frier, W.; Ablart, D.; Chilles, J.; Long, B.; Giordano, M.; Obrist, M.; Subramanian, S. Using spatiotemporal modulation to draw tactile patterns in mid-air. Lect. Notes Comput. Sci. 2018, 10893, 270–281. [Google Scholar]
  45. Shen, Z.; Morgan, Z.; Vasudevan, M.K.; Obrist, M.; Plasencia, D.M. Controlled-STM: A two-stage model to predict user’s perceived intensity for multi-point spatiotemporal modulation in ultrasonic mid-air haptics. In Proceedings of the 2024 CHI Conference on Human Factors in Computing Systems, New York, NY, USA, 11–16 May 2024. [Google Scholar]
  46. Ablart, D.; Frier, W.; Limerick, H.; Georgiou, O.; Obrist, M. Using ultrasonic mid-air haptic patterns in multi-modal user experiences. In Proceedings of the 2019 IEEE International Symposium on Haptic, Audio and Visual Environments and Games (HAVE), Subang Jaya, Malaysia, 3–4 October 2019; IEEE: Piscataway, NJ, USA, 2019; pp. 1–6. [Google Scholar]
  47. Reardon, G.; Dandu, B.; Shao, Y.; Visell, Y. Shear shock waves mediate haptic holography via focused ultrasound. Sci. Adv. 2023, 9, eadf2037. [Google Scholar] [CrossRef]
  48. Sakaguchi, S.; Konyo, M. Skin viscoelasticity effects on the periodic mechanical stimuli propagation between skin layers. J. Mech. Behav. Biomed. Mater. 2024, 152, 106416. [Google Scholar] [CrossRef] [PubMed]
  49. Wong, W.L.E.; Joyce, T.J.; Goh, K.L. Resolving the viscoelasticity and anisotropy dependence of the mechanical properties of skin from a porcine model. Biomech. Model. Mechanobiol. 2016, 15, 433–446. [Google Scholar] [CrossRef] [PubMed]
  50. Chilles, J.; Frier, W.; Abdouni, A.; Giordano, M.; Georgiou, O. Laser doppler vibrometry and fem simulations of ultrasonic mid-air haptics. In Proceedings of the IEEE World Haptics Conference, Tokyo, Japan, 9–12 July 2019. [Google Scholar]
  51. Zhang, R.; Abbott, J.J. Vibrotactile display of patterned surface textures with kinesthetic haptic devices using balanced impulses. IEEE Trans. Haptics 2021, 14, 776–791. [Google Scholar] [CrossRef]
  52. Saleem, M.K.; Yilmaz, C.; Basdogan, C. Tactile perception of virtual edges and gratings displayed by friction modulation via ultrasonic actuation. IEEE Trans. Haptics 2020, 13, 368–379. [Google Scholar] [CrossRef]
  53. Zhou, W.; Sarpong, F.; Zhou, C. Use of Ultrasonic Cleaning Technology in the Whole Process of Fruit and Vegetable Processing. Foods 2022, 11, 2874. [Google Scholar] [CrossRef]
  54. Chu, S.; Tu, H. Understanding the effects of tactile grating patterns on perceived roughness over ultrasonic friction modulation surfaces. Hum. Factors 2022, 65, 1718–1739. [Google Scholar] [CrossRef]
  55. Skedung, L.; Danerlöv, K.; Olofsson, U.; Johannesson, C.M.; Aikala, M.; Kettle, J.; Arvidsson, M.; Berglund, B.; Rutland, M.W. Tactile perception: Finger friction, surface roughness and perceived coarseness. Tribol. Int. 2011, 44, 505–512. [Google Scholar] [CrossRef]
  56. Hendriks, C.P.; Franklin, S.E. Influence of surface roughness, material and climate conditions on the friction of human skin. Tribol. Lett. 2009, 37, 361–373. [Google Scholar] [CrossRef]
  57. Zhang, Z.; Tang, X.; Li, J.; Yang, W. The effect of dynamic friction with wet fabrics on skin wetness perception. Int. J. Occup. Saf. Ergon. 2020, 26, 370–383. [Google Scholar] [CrossRef]
  58. Lieber, J.D.; Bensmaia, S.J. High-dimensional representation of texture in somatosensory cortex of primates. Proc. Natl. Acad. Sci. USA 2019, 116, 3268–3277. [Google Scholar] [CrossRef] [PubMed]
  59. Zhang, L.; Hu, Y.; Gao, X.; Xu, X.; Zhang, H.; Yagoub, A.E.A.; Ma, H.; Zhou, C. Influence of sweeping frequency ultrasonic pretreatment on pulsed vacuum drying characteristics and microstructure of okra based on real-time monitoring. J. Food Process. Eng. 2021, 44, e13622. [Google Scholar] [CrossRef]
  60. Yu, Y.; Wang, Y.; Okonkwo, C.E.; Chen, L.; Zhou, C. Multimode ultrasonic-assisted decontamination of fruits and vegetables: A review. Food Chem. 2024, 450, 139356. [Google Scholar] [CrossRef]
  61. Gao, J.; Xu, K.; He, R.; Chen, X.; Tunio, M.H. Development and experiments of low frequency ultrasonic electrostatic atomizing nozzle with double resonators. Int. J. Agric. Biol. Eng. 2022, 15, 39–48. [Google Scholar] [CrossRef]
  62. Wang, Z.; Wang, Q.; Wang, L.; Xu, W.; He, Y.; Li, Y.; He, S.; Ma, H. Improvement of skin condition by oral administration of collagen hydrolysates in chronologically aged mice. J. Sci. Food Agric. 2017, 97, 2721–2726. [Google Scholar] [CrossRef] [PubMed]
  63. Shen, Y.; Zhu, H.; Liu, H.; Chen, Y.; Ozkan, E. Development of a laser-guided, embedded-computercontrolled, air-assisted precision sprayer. Trans. ASABE 2017, 60, 1827–1838. [Google Scholar] [CrossRef]
  64. Liang, Q.; Ren, X.; Ma, H.; Li, S.; Xu, K.; Oladejo, A.O. Effect of Low-Frequency Ultrasonic-Assisted Enzymolysis on the Physicochemical and Antioxidant Properties of Corn Protein Hydrolysates. J. Food Qual. 2017, 2017, 2784146. [Google Scholar] [CrossRef]
  65. Johansson, R.S.; Vallbo, Å.B. Tactile sensory coding in the glabrous skin of the human hand. Trends Neurosci. 1983, 6, 27–32. [Google Scholar] [CrossRef]
  66. Abraira, V.E.; Ginty, D.D. The sensory neurons of touch. Neuron 2013, 79, 618–639. [Google Scholar] [CrossRef]
  67. The Third Joint Eurohaptics Conference and Symposium on Haptic Interfaces for Virtual Environment and Teleoperator Systems. Robot. Autom. Mag. 2008, 15, 5. [CrossRef]
  68. Handler, A.; Ginty, D.D. The mechanosensory neurons of touch and their mechanisms of activation. Nat. Rev. Neurosci. 2021, 22, 521–537. [Google Scholar] [CrossRef] [PubMed]
  69. Abdouni, A.; Djaghloul, M.; Thieulin, C.; Vargiolu, R.; Pailler-Mattei, C.; Zahouani, H. Biophysical properties of the human finger for touch comprehension: Influences of ageing and gender. R. Soc. Open Sci. 2017, 4, 170321. [Google Scholar] [CrossRef] [PubMed]
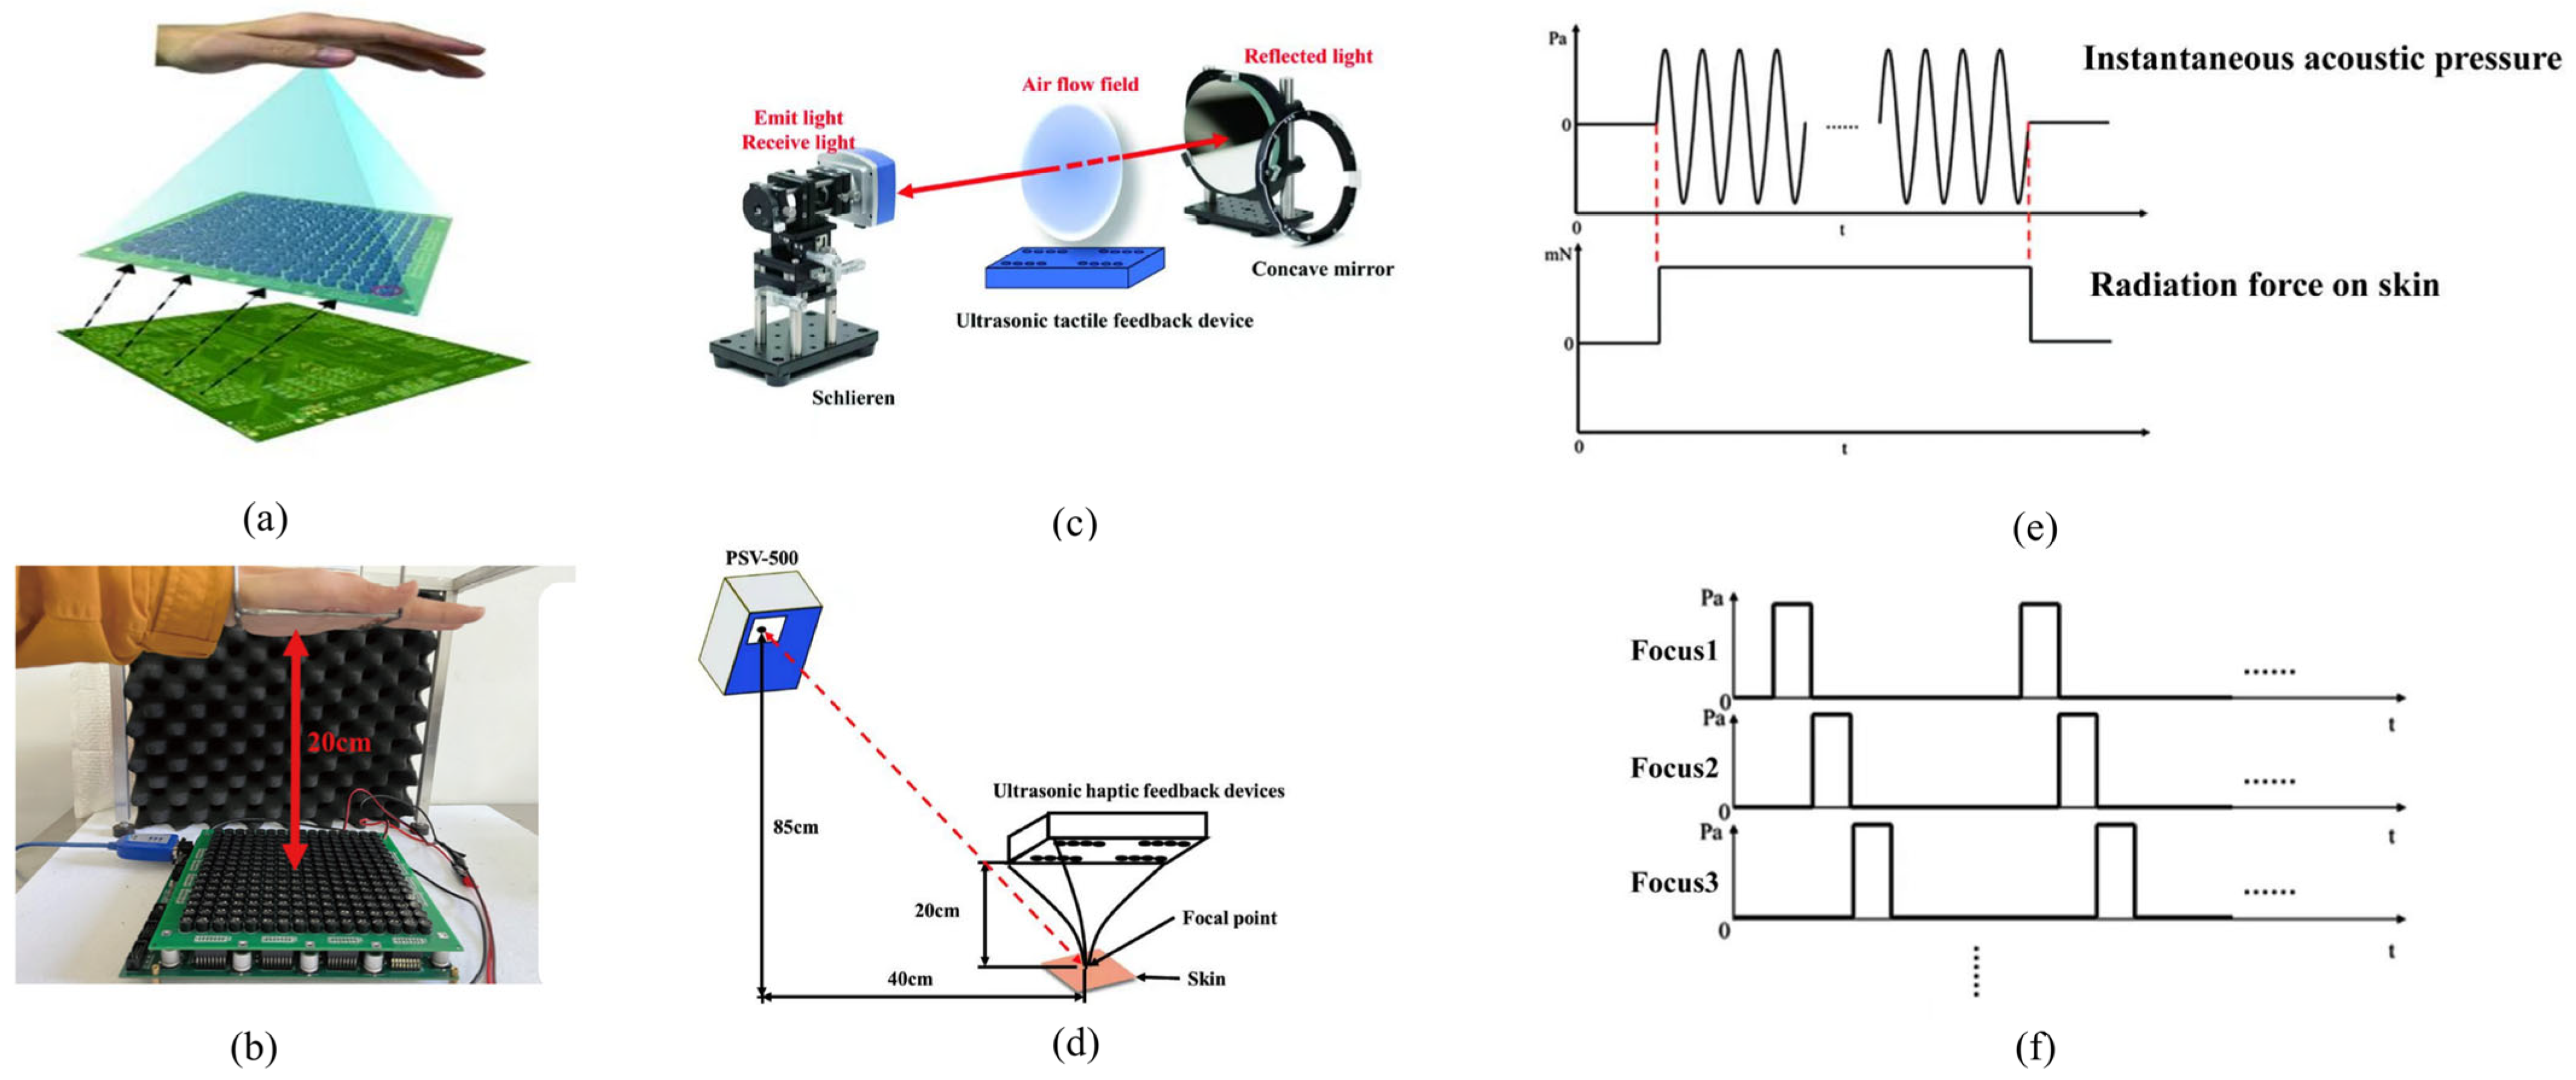
Figure 1. Ultrasonic focus point size measurement and load correctness verification testbed. (a) sensing with the palm of your hand when focusing ultrasound; (b) experimental scene diagram; (c) observing the airflow field above an ultrasonic phased array using a schlieren system; (d) experimental diagram for load correctness verification; (e) schematic diagram of relationship between instantaneous sound pressure and sound radiation pressure at 50 Hz; (f) time domain excitation load signals at different focus positions at 50 Hz.
Applsci 15 11742 g001
Figure 2. Selected (a) model size diagram; (b) monitoring surface; (c) monitoring point.
Applsci 15 11742 g002
Figure 3. Acoustic field distribution of ultrasonic phased arrays when focused in air and energy conversion when skin blocks propagation and how ultrasound waves acting on the skin when focused in air. (a) sound pressure at interference and superposition of sound waves in the near-field region; (b) sound pressure when ultrasonic waves are focused in air producing side flaps and gratings; (c) sound pressure when the sound pressure peaks and creates a high–intensity sound pressure region; (d) sound pressure level at interference and superposition of sound waves in the near–field region; (e) sound pressure level when ultrasonic waves are focused in air producing side flaps and gratings; (f) sound pressure level when the sound pressure peaks and creates a high–intensity sound pressure region; (g) the airflow field above an ultrasonic phased array; (h) normalized experimental and simulated vibration velocity.
Applsci 15 11742 g003
Figure 4. Stress−strain in the monitoring surface at different stimulation frequencies. (a) normal velocity; (b) tangential velocity; (c) normal displacement; (d) tangential displacement; (e) normal stress; (f) tangential stress.
Applsci 15 11742 g004
Figure 5. Stress–strain conditions of monitoring points. (a) normal velocity; (b) tangential velocity, (c) normal displacement; (d) tangential displacement; (e) tresca stress.
Applsci 15 11742 g005
Figure 6. Results of perceptual experiments in the evaluation of real human touch with ultrasonic haptic feedback: (a) score of pressure perception at different focal rotation frequencies; (b) score of vibration perception at different focal rotation frequencies.
Applsci 15 11742 g006
Figure 7. The results of cognitive experiments in the evaluation of real human touch with ultrasonic haptic feedback. (a) correct proportion for both; (b) correct proportion for male; (c) correct proportion for female.
Applsci 15 11742 g007
Table 1. Focus moving frequency and focus moving speed.
Rotation Frequency (Hz)Movement Speed (m/s)Rotation Frequency (Hz)Movement Speed (m/s)
506.2820025.12
10012.5625031.4
15018.83
Table 2. Experimental sequence table.
GroupsNum.1Num.2FirstSecondThirdForthFifth
Gro.150 Hz100 Hz50 Hz100 Hz50 Hz50 Hz100 Hz
Gro.2100 Hz150 Hz100 Hz100 Hz150 Hz100 Hz150 Hz
Gro.3150 Hz200 Hz150 Hz150 Hz200 Hz150 Hz200 Hz
Gro.4200 Hz250 Hz200 Hz250 Hz200 Hz200 Hz250 Hz
Gro.5250 Hz50 Hz250 Hz250 Hz50 Hz250 Hz50 Hz
Disclaimer/Publisher’s Note: The statements, opinions and data contained in all publications are solely those of the individual author(s) and contributor(s) and not of MDPI and/or the editor(s). MDPI and/or the editor(s) disclaim responsibility for any injury to people or property resulting from any ideas, methods, instructions or products referred to in the content.