Abstract
With the acceleration of urbanization, the demand for construction land has increased sharply. High and steep slope excavation has become an important way to provide construction sites, but its stability is directly related to engineering safety and the surrounding environment. Therefore, the difficulty of how to maintain slope stability during excavation is the focus of our current research. In this paper, based on the high and steep rock slope of a special building in a city in southern China, the PSO-BP (particle swarm optimization-back propagation neural network) algorithm is used to predict the support parameters of the slope, whose safety factor does not meet the requirements. The numerical simulation results show that the safety factor after optimized support is 21.1% higher than that before support, the slope dissipation energy is reduced by 53.1%, the displacement in the direction of zz and xx is reduced by 99.3% and 98. 7%, and the fitting degree between the support parameters predicted by the algorithm and the actual support parameters is good, which shows that the algorithm can provide a scientific and reliable basis for optimizing the slope reinforcement parameters, shortening the time of slope reinforcement design and improving the slope stability.
1. Introduction
As inclined surfaces formed by gravity and other external forces on the surface of the earth, slopes are widely found on mountains, hills, and plains and even in cities. A slope’s stability is not only related to the ecological balance of the natural environment but is also an important guarantee of the safety of human social and economic activities [1]. With the acceleration of urbanization and the vigorous development of infrastructure construction, the stability of the slope leaves us facing severe challenges [2]. Once a slope is unstable, it will cause huge casualties, property losses, and ecological environment damage. Therefore, it is of great significance for disaster prevention and mitigation and for the protection of people’s lives and property to carry out slope stability analysis, accurately assess the safety status of the slope, and take reasonable steps in terms of support for a slope with a substandard safety factor [3].
With the continuous advancement of infrastructure construction, slope reinforcement engineering plays an increasingly important role in ensuring the quality and safety of a project. Therefore, it is necessary to use big data and intelligent prediction methods to quickly analyze slope reinforcement parameters [4]. At present, there are many kinds of slope reinforcement methods to adapt to different geological conditions, engineering requirements, and environmental requirements. Common slope reinforcement methods include gravity retaining wall [5], bolt support [6], shotcrete support [7], soil nailing wall, and various combined support methods [8,9,10,11,12]. In terms of the treatment measures for slope instability, anti-slide piles, anchor cables, anchor bolts, frame beams and so on play an important role. They have different characteristics and are widely used in slope reinforcement. The prestressed anchor cable frame beam support system has been widely used in the field of geotechnical engineering because of its significant synergistic effect and can be used in combination with other supporting structures [13,14,15,16].
Domestic and foreign scholars have carried out systematic research work on the slope reinforcement technology of the prestressed anchor cable frame beam. Cao et al. [17] improved and optimized the current design and calculation method through the analysis of the construction sequence and the actual stress conditions of the prestressed anchor cable frame beam. Xia Xiong [18] discussed the applicable conditions of the prestressed anchor cable frame type ground beam, divided the calculation stage of beam internal force, and determined the calculation method of each stage. Fang Ligang [19] used the finite element method to carry out numerical analysis, and put forward the law of the influence of the directionality of the bedding on the supporting structure. The finite element analysis software such as [20] provides a reference for the analysis of three-dimensional problems of complex interaction between rock and soil and structure. Ma Hongsheng et al. [21] used FLAC3D to simulate the slope reinforced by a prestressed anchor cable frame, and revealed the stress relationship between rock and soil, prestressed anchor cable, and frame beam. Fu Xiao [22] studied the dynamic response characteristics of slope and supporting structure by the shaking table model test. Wei Shaowei et al. [23] clarified the mechanism of slope reinforcement with an assembled anchor cable frame structure by means of numerical simulation, theoretical derivation, and field test. Yufei, Z. [24] studied the shear characteristics of jointed rock mass and the shear fracture law of the prestressed anchor cable through large-scale indoor direct shear testing. Xuhe, G. [25] monitored the prestress loss of a slope anchor cable through an anchor cable meter with built-in vibrating wire sensor, which provided a new method for predicting the prestress loss of an anchor cable. Based on a variety of failure modes, Xu Guang, D. [26] et al. established a stability analysis model of composite structures considering both prestressing and pile effects, and proposed a dynamic search algorithm for the model. Zhuangfu, Z. [27] put forward the calculation method of horizontal displacement of a frame prestressed anchor supporting a loess fill slope, combined with the deformation characteristics of a flexible retaining structure. Based on the Boussinesq problem in elastic mechanics, Wendong, Y. [28] derived the elastic solutions of the unloading displacement of a slope and the anchoring force of a prestressed anchor cable after excavation. Yong, H. [29] proposed a new three-dimensional stability evaluation method for the prestressed anchor cable slope by combining limit analysis with the strength reduction method (SRM). Based on the limit equilibrium theory and the improved Bishop method, Jun, Z. [30] derived the calculation formula of the stability coefficient under the circular slip surface, gave the corresponding search method of the most dangerous slip surface, and improved the calculation formula of the pullout force of the anchor plate. Hang, Z.Q. [31] proposed a pseudo-plastic failure model of the prestressed anchor cable considering the change in tension and the movement of the anchor head. Xiao-Gang, W. [32] deeply analyzed the shear deformation and shear characteristics of anchored joints at different stages through large-scale anchored joint shear tests, and proposed a three-stage shear deformation model of anchor cables. By comparing the engineering characteristics of the traditional landslide control method and the new support system, Qin [33] pointed out that the prestressed anchor cable frame beam has significant advantages in controlling slope deformation by comparing the engineering characteristics of the traditional landslide control method and the new support system.
In summary, it can be seen that the current research on slope reinforcement mostly focuses on the mechanical properties of each support structure or their combination. There are few studies on the optimization and prediction of support parameters using new methods such as machine learning. Therefore, this paper intends to adopt the PSO-BP (Particle Swarm Optimization-Back Propagation Neural Network) algorithm to predict slope reinforcement parameters, in order to shorten the time of slope reinforcement design, improve slope stability, and reduce material waste and construction costs.
2. Introduction to Slope
2.1. Topography
This research is based on a confidential project under construction in a city in southern China. Its stability requirements are extremely high. The site topography is mountainous and hilly. Due to the mining excavation at the slope’s trailing edge, a high rock slope has been formed. Since 2006, the backfill has started to form the present landform. The east, north, and west of the site is surrounded by mountains, and the south side is the exit. The terrain is low in the southwest and high in the northeast. The trailing edge of the slope is high in the north and low in the south, which is distributed in a stepped shape: high around the edges and low in the middle. Due to rainstorm erosion and other reasons relating to the surface of the site, erosion marks can be seen on the surface and gullies can be seen locally. The highest point is located at the top of the mountain on the north side of the survey area, with an altitude of 333.49 m, and the lowest point is located on the south side of the survey area, with an altitude of about 94 m. The relative height difference is greater than 200 m. Its topographic map is shown in Figure 1 below:
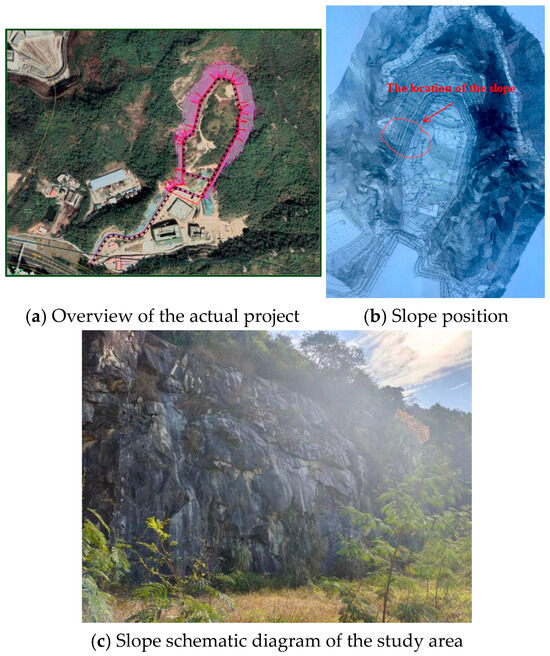
Figure 1.
Slope topographic map.
2.2. Acquisition of Rock Mechanics Parameters of Slope
2.2.1. Sample Acquisition
In the process of on-site sampling of the rock block, there was a need to select unweathered and complete rock, avoid fissures and fracture zones, adopt a borehole coring method (50 mm and 100 mm), and ensure rock integrity. After sampling, the number and sampling information are marked. The samples taken on site are shown in Figure 2 below:
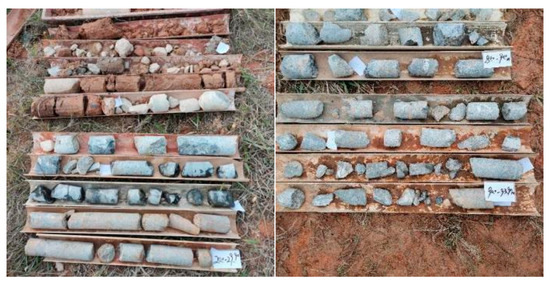
Figure 2.
Borehole sampling sample.
2.2.2. Sample Preparation
Due to space reasons, this paper only shows some test data and the test process for slightly weathered granite. The schematic diagram of the processed part of the specimen is shown in Figure 3. The height and diameter of the specimen were measured by vernier caliper. The height range of the uniaxial test specimen was 98–101.5 mm, the diameter was 49.1–50.4 mm, and the length range of the direct shear test specimen was 49.1–50.3 mm.
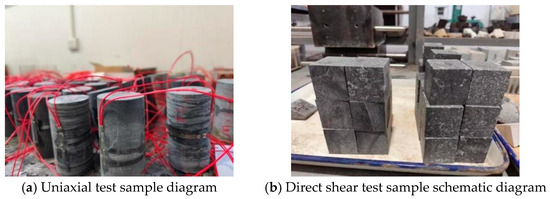
Figure 3.
Standard sample diagram.
2.2.3. Test Scheme
As shown in Table 1, the uniaxial compression test adopts displacement loading of 0.005 mm/s, and the direct shear test is divided into five levels of loading. The normal pressures are 2.6, 3.9, 6.2, 8.3, and 10.5 MPa, respectively.

Table 1.
Test plan.
2.2.4. Test Results
Through direct shear and uniaxial compression experiments on natural rock samples in each rock stratum, the mechanical parameters of each rock stratum were obtained, as shown in Table 2:
Table 2.
Rock mechanics parameters.
3. Slope Stability Analysis
In this paper, FLAC 3D 6.0 software is used to analyze the slope stability under natural conditions. The specific modeling process is as follows: (1) Rhino imports contour lines, and establishes a lattice through a certain line segment in equal proportion through contour lines; (2) the ground surface is generated by the mesh_patch command; (3) the ground surface that can be meshed is generated by shearing the cloth curtain; (4) import the x_t format file generated by Rhino through Mias-gts; (5) the profile curve imported into the site is used as the division of the lower strata of the surface; (6) the model is generated by cutting and merging some columns; (7) generate hexahedral mesh and export it to fpn file; and (8) the fpn-FLAC 3D plug-in is used to convert to the computational grid suitable for FLAC 3D. The specific model is shown in Figure 4, and the parameters of the model are shown in Table 2.
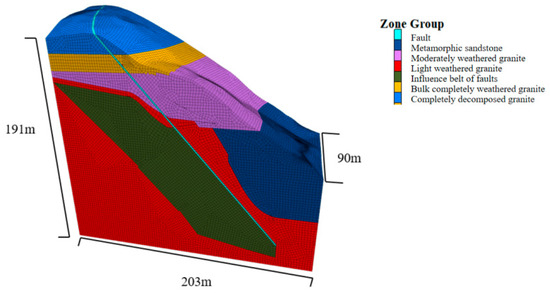
Figure 4.
Numerical calculation model.
3.1. Analysis of Initial Ground Stress
Because the in situ stress is not tested in this experiment, the self-weight stress is only considered in the process of model establishment. The initial stress cloud diagram is shown in Figure 5. The maximum compressive stress value at the bottom of the z-direction model is 4.78 MPa, and the stress in the x direction is 2.90 MPa, which is consistent with the value calculated. In addition, due to the influence of weak interlayer, the model has large compressive stress. From the horizontal stress cloud diagram, it can be seen that the compressive stress in the area with weak interlayer is obviously larger than that in other areas, and the compressive stress concentration occurs in the local area of the model.
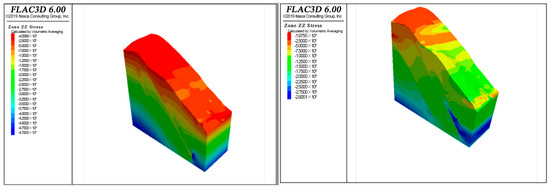
Figure 5.
The initial ground stress cloud of slope.
3.2. Slope Excavation Stability Analysis
The actual excavation of the slope that is planned will use the non-excavation method to excavate in ten steps, so the numerical simulation is also divided into ten steps for comparative analysis. In addition, due to space reasons, this analysis is mainly aimed at the first, sixth, and eleventh steps.
3.2.1. Stress Analysis
Slope excavation will break the stress balance of the original rock mass, resulting in stress redistribution. This redistribution occurs not only on the surface of the slope, but also deep in the interior of the slope. In the process of excavation, near the toe of the slope, xx stress will appear as the compressive stress concentration phenomenon; when the 11th step of excavation is completed, the value is 2.24 MPa. As shown in Figure 6, the tensile stress appears on the slope surface during the excavation process. As the excavation continues, the tensile stress gradually increases. At the end of the excavation, the tensile stress in the zz and xx directions at the slope surface is 0.12 MPa and 0.38 MPa.
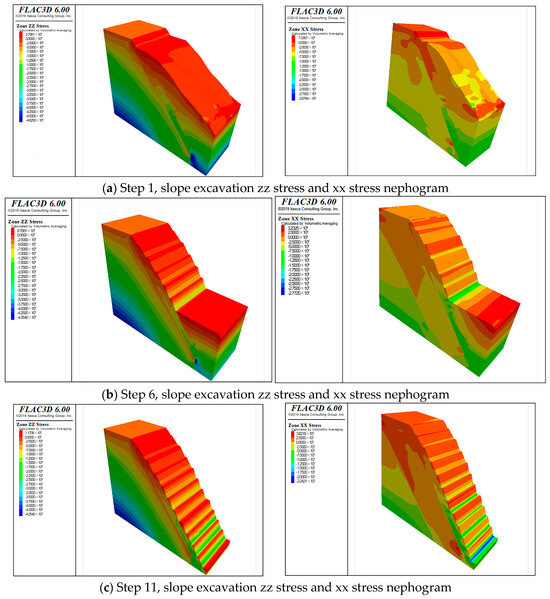
Figure 6.
The zz stress and xx stress nephogram during slope excavation.
3.2.2. Excavation Displacement Analysis
The displacement change in the fault slope after excavation is a complex geological engineering problem that is affected by many factors. The geological conditions of the slope are important factors affecting the displacement change during excavation. The displacement curves of the displacement monitoring points at the top of the slope and the X and Z directions of the slope are shown in Figure 7. It can be seen that the displacements in both directions increase rapidly at the beginning of excavation and then tend to be stable. After the excavation is completed, the settlement displacement of the top of the slope is 3.91 cm, and the displacement in the x direction of the slope is 3.12 cm.
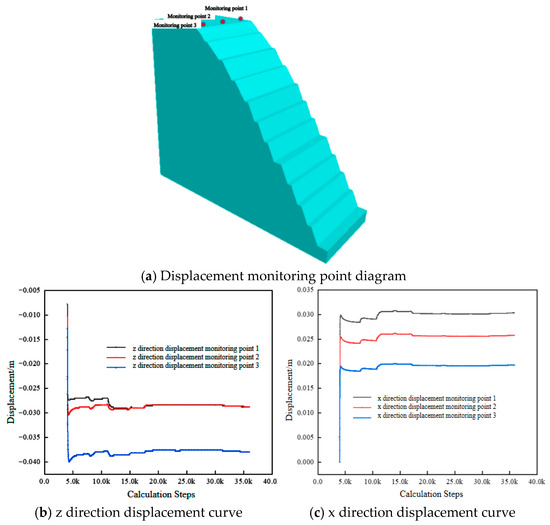
Figure 7.
Slope displacement monitoring points and curve diagram.
3.2.3. Analysis of Plastic Zone and Maximum Shear Strain
As shown in Figure 8, the plastic zone and the maximum shear strain cloud diagram after the excavation are completed. The plastic zone is mainly manifested in four forms: shear-n, shear-p, tension-n, and tension-p. Since the top of the slope is mainly distributed as fully weathered granite and massive strongly weathered granite, a plastic zone is formed during the excavation process. However, when the excavation is to the slightly weathered granite area, the plastic zone gradually decreases. During the excavation process, due to the formation of the high and steep slope, according to the stress results, it can be seen that the local compressive stress concentration occurs at the slope angle to produce local damage. Combined with the maximum shear strain, it can be seen that the maximum shear strain is not connected, but there is local damage.
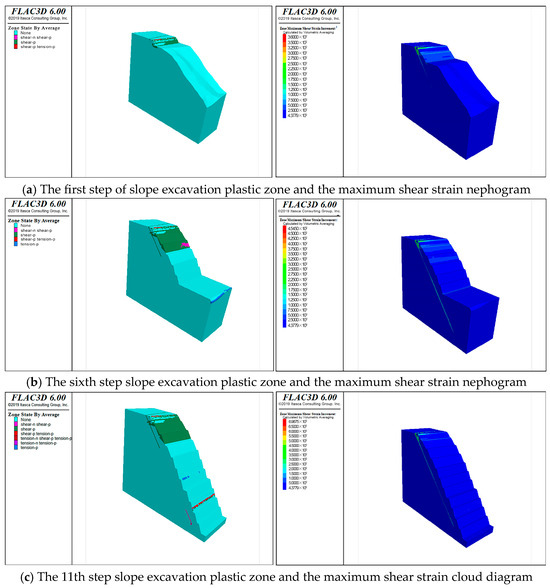
Figure 8.
Slope excavation plastic zone and maximum shear strain nephogram.
3.2.4. Analysis of Slope Dissipation Energy
In slope engineering, dissipative energy analysis has been widely used in landslide stability assessment, and Extra cloud map is generated through fish secondary development. As shown in Figure 9, the dissipation energy distribution cloud diagram shows that the dissipation energy value is 6.54 × 10³ J/m3 after the excavation is completed. It can be seen from the Figure that the slope top area is prone to damage.

Figure 9.
Dissipative energy cloud diagram of slope excavation.
3.2.5. Slope Safety Factor Analysis
As shown in Figure 10. According to the calculation of strength reduction method, the safety factor of slope under unsupported conditions is 1.293. According to the Technical Code for Building Slope Engineering (GB 50330-2013) [34], the safety factor of high and steep rock slope should be greater than 1.3. Therefore, this slope does not conform to the relevant national norms under the natural unsupported conditions.
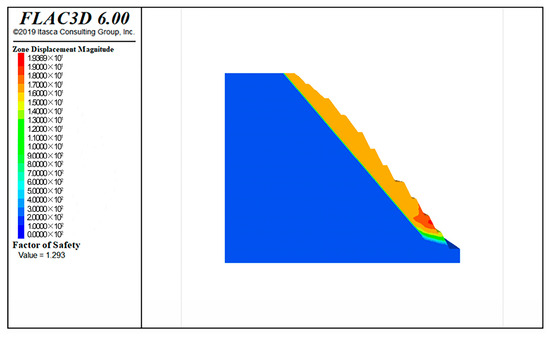
Figure 10.
Slope safety factor.
4. Prediction of Slope Reinforcement Parameters Based on PSO-BP Optimization Algorithm
In this paper, the particle swarm optimization (PSO) algorithm is introduced, which is a mature algorithm that can quickly approach an optimal solution through global search and random optimization of particle swarm. The flow chart of the PSO-BP algorithm is shown in the Figure, and the optimization process is as follows.
- Determine the structure of the BP neural network.
- (1)
- Firstly, the structure of the BP neural network is determined, including input layer nodes, output layer nodes, and hidden layer nodes.
- Initialize the parameters of the PSO algorithm.
- (1)
- Initialization of particle swarm:Each dimension of the particle corresponds to the weight and threshold of the BP network. Randomly generate particles in the search space of weights and thresholds.
- (2)
- Parameter setting:The number of particles N, the maximum number of iterations T; inertia weight ω; learning factors c1 and c2; and initial velocity and position.
- Calculate the fitness function.
- (1)
- The weights and thresholds of the particle representation are assigned to the BP neural network.
- (2)
- The BP network is used to predict the training data, and the value of the objective function is calculated as the fitness.
- Update the position and velocity of particles.
- Judge convergence conditions.
- (1)
- Judge whether the algorithm converges according to the change in fitness value.
- (2)
- When the fitness change is less than the set threshold, or reaches the maximum number of iterations, the optimization is terminated.
- Output the optimal solution.
- (1)
- Output the BP network weights and thresholds corresponding to the optimal solution.
- (2)
- The optimized BP network is used to predict and evaluate the slope reinforcement scheme, and the optimized support design parameters are output.
4.1. Model Training
After constructing the prediction model, model training is the key to ensuring its good generalization ability. In order to meet the requirements of model training and testing, a total of 64 sets of sample data were prepared (Table 3 shows only part of the data). Among all the data, 56 sets of data were randomly selected as training samples, and the remaining 8 sets of data were used as test samples.
Table 3.
Test samples.
4.2. Algorithm Verification and Analysis
4.2.1. Analysis of Fitness Curve
Particle swarm optimization (PSO), as an optimization algorithm, can effectively make up for the limitations of traditional neural networks when combined with neural networks. As shown in the Figure 11, when the number of iterations is 38, the optimal value of fitness is reached. The loss function value of the neural network and neural network are a single variable optimization trajectory, which directly describes the change in objective function value. The fitness curve of the evolutionary algorithm reflects the evolution trend of the whole population, so there is no fitness curve.
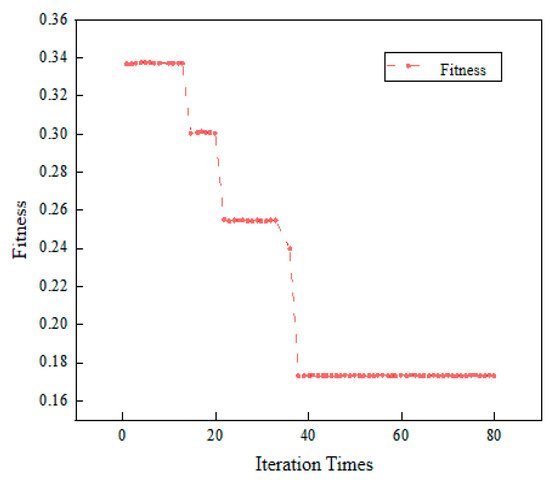
Figure 11.
Fitness curve.
4.2.2. Verification of Supporting Parameters
The PSO-BP model is used to predict the specific parameters of each support method. The predicted results are compared with the actual results, as shown in Figure 12 below. It can be seen that the predicted values of the PSO-BP model for the length, spacing, and row spacing of the anchor cable are close to the actual values. In order to further verify the accuracy of this model, the relevant data are fitted, and the results are shown in Figure 13. It can be seen from the diagram that the PSO-BP model has a good prediction effect in the optimization of slope reinforcement. The correlation coefficient R = 0.85975 indicates that the predicted value has a strong linear correlation with the real value. Most of the scatter points in the Figure are distributed near the ideal straight line, Y = T, and the proximity of the red fitting line to the ideal straight line further verifies the accuracy of the model. However, some scatter points deviate from the ideal straight line, indicating that there are some errors in individual data points, which may be related to the complexity of sample distribution or geological conditions. In general, the model has a high fitting effect, which can provide a scientific and reliable basis for the optimization of slope reinforcement parameters, and has room for further improvement.
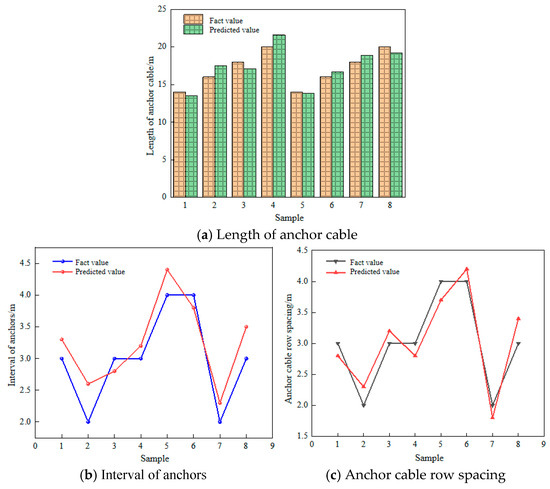
Figure 12.
Comparison of predicted values and actual values of various support parameters.
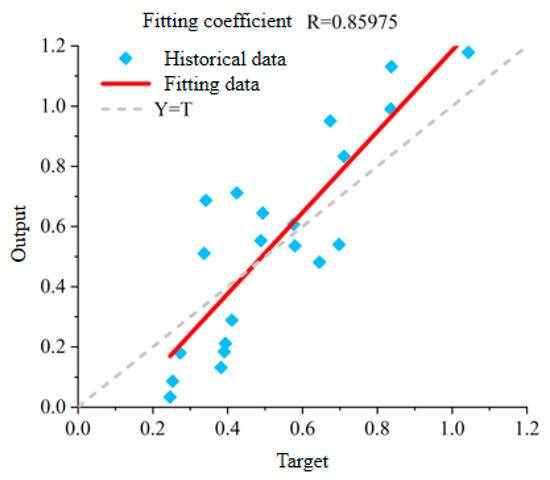
Figure 13.
PSO-BP method output data fitting diagram.
4.2.3. Model Accuracy Test
In this paper, the multivariate evaluation indexes commonly used in the neural network model are selected for comprehensive evaluation. The specific quantitative parameters are root mean square error (RMSE), determination coefficient (R2), mean absolute percentage error (MAPE), and mean absolute error (MAE). Through analysis and calculation, As shown in Table 4, it can be seen that R2 is 0.932, RMSE is 0.563, MAPE is 2.36%, and MAE is 0.3169. Therefore, PSO-BP can significantly improve the optimization results of slope reinforcement.
Table 4.
Test results of each parameter.
4.2.4. Prediction of Slope Reinforcement Parameters
Because the accuracy of the model is tested, the slope reinforcement parameters shown in Table 5 are obtained by PSO-BP prediction according to the above calculation results.
Table 5.
Predicting support parameters.
4.3. Analysis of Slope Stability Under Supporting Action
Due to the particularity of the actual project, the safety factor of the slope is much larger than the national standard value of 1.3, and the safety factor must reach 1.5. Therefore, it is necessary to analyze the stability and safety factor of the reinforced slope. Figure 14 is the schematic diagram of the reinforced slope, and its parameters are shown in Table 6 and Table 7.
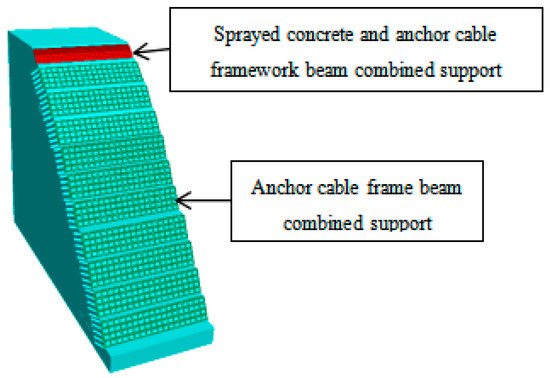
Figure 14.
Slope reinforcement design.
Table 6.
Physical and mechanical parameters of anchor cable.
Table 7.
Calculation parameters of beam element.
4.3.1. Slope Stress Analysis Under the Action of Supporting
Due to the length of this article, this stress cloud diagram is only shown in steps 1, 6, and 11 for analysis, as before. As shown in Figure 15, The stress change in the slope under the action of support is a complex process. Under the action of support, the slope is in a state of compressive stress as a whole. When the excavation reaches the slope toe, the zz stress is 38.4 Kpa, and the xx stress is 5.3 Kpa. Compared with the tensile stress state in the unsupported state, the xx stress of the slope appears as compressive stress concentration at the slope angle, but there is no tensile stress phenomenon. Therefore, it is considered that the slope is in a stable state under the support of the slope.
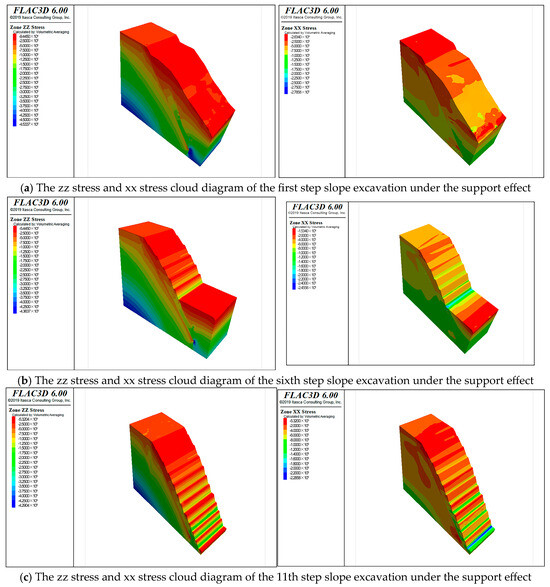
Figure 15.
Slope stress cloud diagram under support action.
4.3.2. Analysis of Slope Displacement Under Supporting Action
One of the main functions of the supporting structure is to limit the displacement of the slope, thereby improving the stability of the slope. When the slope is supported, its displacement is usually significantly reduced. The displacement monitoring points set at the top of the slope are consistent with those without support. The displacement curves in the X and Z directions are shown in Figure 16. With the gradual excavation of the slope, the displacement gradually increases. When the excavation reaches the bottom of the slope, the subsidence displacement in the z direction is 2.6 mm, which is 99.3% lower than that without support. The deformation displacement in the x direction is 3.8 mm, which is 98.7% lower than that without support.
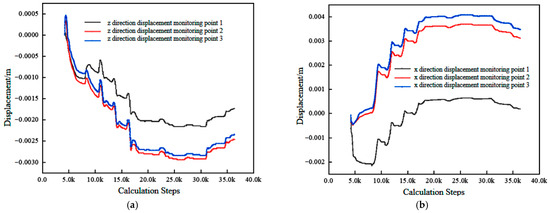
Figure 16.
Displacement monitoring curve of slope excavation under supporting effect. (a) Excavation z direction displacement monitoring curve under supporting effect. (b) Excavation x-direction displacement monitoring curve under supporting effect.
4.3.3. Analysis of Plastic Zone and Maximum Shear Strain Cloud Diagram Under Support Action
The supporting structure reduces the concentration of shear strain inside the slope by bearing and transmitting shear force. Figure 17 shows the plastic zone and the maximum shear strain cloud map of the slope under the support. The plastic zone and the maximum shear strain are significantly reduced compared with the slope without support, and the slope is considered to be in a stable state.
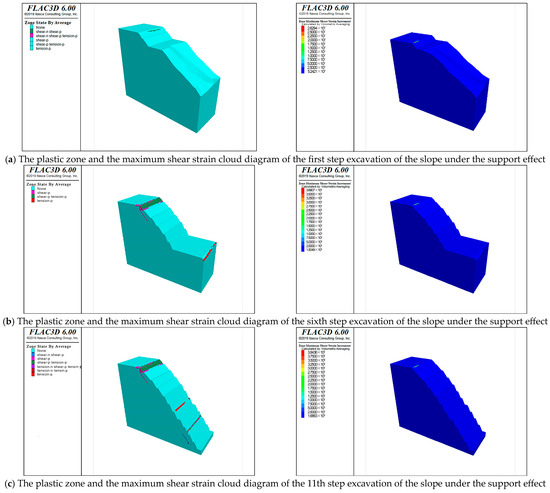
Figure 17.
Plastic zone and maximum shear strain cloud diagram during slope excavation.
4.3.4. Analysis of Slope Dissipation Energy Under Supporting Effect
As shown in Figure 18, Under the action of support, it can be seen from the dissipation energy cloud map 18 that the slope damage area is significantly reduced, and the dissipation energy value is 3.07 × 10³ J/m3, which is 53.1% lower than that of the unsupported state.
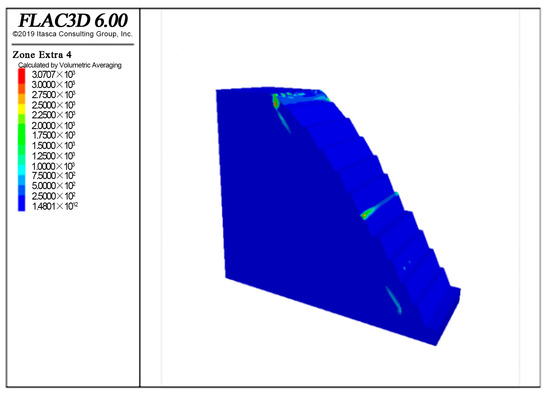
Figure 18.
Dissipative energy cloud diagram under support action.
4.3.5. Analysis of Axial Force of Anchor Cable Under Support
Two anchor cables near each of the above three displacement monitoring points are selected for monitoring, as shown in Figure 19, which is the axial force curve of the anchor cable after the excavation is completed. According to the axial force curve of the anchor cable, it can be seen that the axial force of the anchor cable increases significantly in the early stage of excavation due to the formation of the free surface. With the continuous excavation, the axial force of the anchor cable changes gently, and there is no area where the axial force increases significantly, which indicates that the slope is in a stable state.
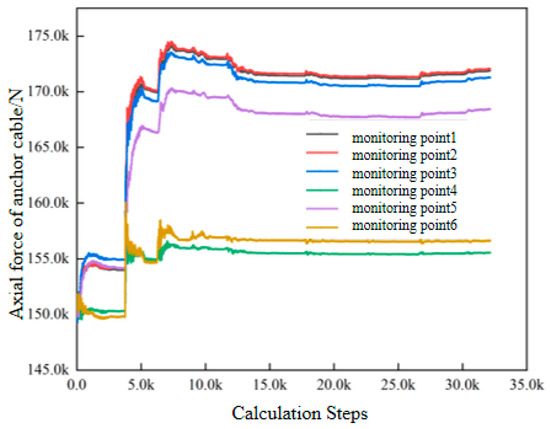
Figure 19.
The axial force curve of anchor cable under the action of support.
4.3.6. Analysis of Slope Safety Factor Under Supporting Action
The safety factor cloud diagram of slope excavation under the action of supporting is shown in Figure 20. Through the calculation of strength reduction method, the safety factor of slope excavation under the action of supporting is 1.566, which is 21.1% higher than that without supporting, and meets the safety reserve requirements of the slope of the special building.
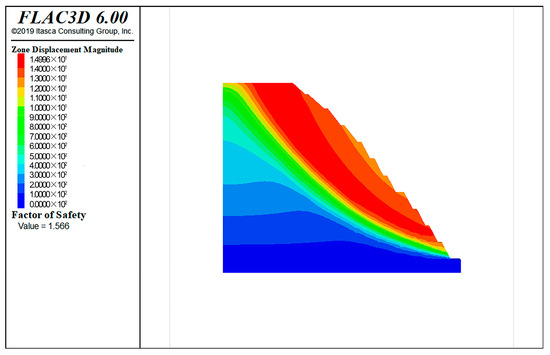
Figure 20.
Safety factor cloud diagram.
5. Conclusions
In this study, the PSO-BP method was adopted to determine the parameters of slope reinforcement, and the feasibility and accuracy of this method in the prediction of optimized parameters for slope support were verified. However, the prediction speed still needs to be improved. In addition, in the subsequent research, we expect to achieve rapid prediction of this method and automatic classification prediction for different types of slopes. Meanwhile, the following are some of the conclusions drawn from our research:
- The PSO-BP model was established, its iteration reached the optimal value of fitness 38 times, and the correlation coefficient R = 0.85975 between the prediction result and the actual numerical fitting was determined. The model evaluation index R2 = 0.932, RMSE = 0.563, MAPE = 2.36%, and MAE = 0.3169 what indicate that the PSO-BP model has a good prediction effect;
- There is no tensile stress state in each part of the slope after support, and the shear plastic zone and shear stress zone are greatly reduced compared with the unsupported state;
- After the excavation of the slope after the support is completed, the displacement of the xx and zz directions is reduced by 98.7% and 99.3% compared with the unsupported state, the dissipated energy is reduced by 53.1%, and the safety factor is increased by 21.1%;
- The axial force of the anchor cable during the slope excavation process is within the normal range, indicating that the supporting structure is intact and the stability of the slope excavation is effectively improved.
Author Contributions
Y.Z.: investigation, methodology, resources, data curation, formal analysis, validation, and writing—original draft, revision, and editing; X.W.: conceptualization, writing—review, project administration, and formal analysis; J.Z.: suggestions at the beginning, review of manuscripts, and logic analysis; X.C.: methodology, resources, and data curation; H.W.: computer algorithm and suggestions at the beginning; and Y.C.: supervision and writing—review. All authors have read and agreed to the published version of the manuscript.
Funding
This research was funded by the Science and Technology Research and Development Plan of the China Railway Co., Ltd. (2022-Major Project-07), grant number 2022-Major Project-07 and Research of China Railway, grant number KF2025-077.
Institutional Review Board Statement
Not applicable.
Informed Consent Statement
Not applicable.
Data Availability Statement
The original contributions presented in this study are included in the article.
Acknowledgments
Thank you for the computing power support provided by the Supercomputing Center of Central South University; thank you for the site provided by the School of Civil Engineering, Central South University; and thank you for the technical and manual support provided on site.
Conflicts of Interest
Author Honggang Wu was employed by the company Northwest Research In-stitute Co. Ltd. of CREC. The remaining authors declare that the research was conducted in the absence of any commercial or financial relationships that could be construed as a potential conflict of interest. The authors declare that this study received funding from China Railway Co., Ltd. The funder was not involved in the study design, collection, analysis, in-terpretation of data, the writing of this article, or the decision to submit it for publication.
References
- Wu, G.; Nie, X.; Li, Z.; Hou, Z.; Jiang, S.; Ruan, S.; Zhao, L. Research status, problems and prospects of geotechnical composite slope. Non Ferr. Met (Min. Part) 2025, 77, 1–12. [Google Scholar]
- Gao, Y.; Wang, Y.; Zhang, F.; Ji, J.; Chen, L.; Ni, J.; Zhang, W.; Song, J.; Yang, S. Research progress of slope engineering dam engineering. J. Civ. Eng. 2024, 57, 97–118. [Google Scholar]
- Shen, L.; Liao, J.; Zhang, Y. Review of slope stability analysis and evaluation methods. Min. Res. Dev. 2005, 24–27. [Google Scholar] [CrossRef]
- Long, X. Study on the Influence of Excavation Disturbance on the Stability of High Bedding Fractured Rock Slope with Multi-Layer Argillized Interlayer; Kunming University of Science and Technology: Kunming, China, 2023. [Google Scholar]
- He, F.; Mu, R.; Han, L. Cracking deformation monitoring and stability analysis of gravity retaining wall in a project. Eng. Investig. 2025, 4, 1–8. [Google Scholar]
- Ou, Y.; Wang, B.; Xiong, H.; Feng, Y. Application of intensive micro-pile group-anchor combined supporting structure in slope engineering. Eng. Investig. 2025, 53, 16–22. [Google Scholar]
- Hu, T.; Liu, Y.; Chen, H. Construction technology of soft rock high slope under the condition of Siwarik geological area. Subgrade Eng. 2024, 146–150. [Google Scholar] [CrossRef]
- Zou, X. Treatment of subgrade slope disease under adverse geological conditions of expressway. J. Disaster Prevent. Mitigat. Eng. 2025, 45, 259. [Google Scholar]
- Lin, Y.; Yang, G.; Yang, X.; Zhao, L.H.; Shen, Q.; Qiu, M.M. Response of gravity retaining wall with anchoring frame beam supporting a steep rock slope subjected to earthquake loading. Soil Dynam. Earthq. Eng. 2017, 92, 633–649. [Google Scholar] [CrossRef]
- Du, Y.; Li, H.; Chicas, S.D.; Huo, L. Progress and perspectives of geotechnical anchor bolts on slope engineering in China. Front. Environ. Sci. 2022, 10, 928064. [Google Scholar] [CrossRef]
- Qiao, P.; Zhou, Z. Best practices of using shotcrete for wall fascia and slope stabilization (phase 1 study). Repos. Open Sci. Access Portal 2017, 72, 52–61. [Google Scholar]
- Budania, R.; Arora, R.P.; Ce, C. Soil nailing for slope stabilization: An overview. Int. J. Eng. Sci. 2016, 3877, 55–62. [Google Scholar]
- Tian, X.; Song, Z.; Huaizheng, W.; Cheng, Y.; Wang, J. Deformation and mechanical characteristics of tunnel-slope systems with existing anti-slide piles under the replacement structure of pile-wall. Tunnell. Undergr. Space Technol. 2024, 153, 105995. [Google Scholar] [CrossRef]
- Shi, K.; Wu, X.; Liu, Z.; Dai, S. Coupled calculation model for anchoring force loss in a slope reinforced by a frame beam and anchor cables. Eng. Geol. 2019, 260, 105245. [Google Scholar] [CrossRef]
- Zhang, J.J.; Niu, J.Y.; Fu, X.; Cao, L.C.; Yan, S.J. Failure modes of slope stabilized by frame beam with prestressed anchors. Eur. J. Environ. Civil Eng. 2022, 26, 2120–2142. [Google Scholar] [CrossRef]
- Liu, S. Experimental Study on Physical Model of Prestressed Anchorage Mechanism of Fractured Rock Slope. E3S Web of Conferences. EDP Sci. 2022, 352, 01087. [Google Scholar]
- Cao, X.; Zhou, D. A new design method of prestressed anchor cable frame beam in soft rock high slope. Highw. Traffic Technol. 2004, 21, 25–28. [Google Scholar]
- Xia, X.; Zhou, D. Application of prestressed anchor cable frame type ground beam in slope reinforcement. Roadbed Eng. 2006, 68–70. [Google Scholar]
- Fang, L.; Duan, L.; Liang, K.; Qu, G. Study on interaction between transversely isotropic rock slope and prestressed anchor cable frame beam. J. Rock Mech. Eng. 2008, 1, 135–143. [Google Scholar]
- Dai, Z.; Shi, J.; Lu, C. Numerical analysis of stability of landslide reinforced by prestressed anchor cable frame beam. J. Railw. Sci. Eng. 2014, 11, 9–16. [Google Scholar]
- Ma, H.; Zhuang, W.; Fan, G.; Huang, Z. Numerical analysis of slope reinforcement with prestressed anchor cable frame. Zhongwai Highway. 2016, 36, 18–21. [Google Scholar]
- Fu, X.; Ji, W.; Zhang, J.; Cao, L.; Fang, G. Seismic dynamic response of plane sliding slope reinforced by anchor cable frame beam. Geotechn. Mechan. 2018, 39, 1709–1719. [Google Scholar]
- Wei, S.; Cai, D.; Yao, J.; Shi, Y.; Lv, S. Key techniques for design and construction of prefabricated prestressed anchor cable frame structure. Railway Build. 2022, 62, 15–24. [Google Scholar]
- Zhao, Y.; Nie, Y.; Wang, W.; Jiang, L. Analysis of shear characteristics of prestressed anchor cable and shear resistance of anchor joint plane. IOP Conf. Ser. Earth Environ. Sci. 2021, 861, 022063. [Google Scholar] [CrossRef]
- Gao, X.; Tian, W.; Li, J.; Qi, H.; Zhang, Z. Research on Prediction Model of Prestress Loss of Anchor Cable in Soil-Rock Dual-Structure Slope. Adv. Mater. Sci. Eng. 2021, 2021, 4986245. [Google Scholar] [CrossRef]
- Dong, X.; Zheng, L.I.; Cui, Z.; Zhou, C. Stability analysis of the pile-prestressed anchor composite structure based on failure mode. Eng. Failure Anal. 2022, 137, 106223. [Google Scholar] [CrossRef]
- Zhao, Z.; Zhu, Y.; Ye, S. Calculation of horizontal displacement of loess fill slope supported by frame prestressed anchors based on minimum potential energy method. Sci. Rep. 2022, 12, 11281. [Google Scholar] [CrossRef]
- Yang, W.; Wang, X.; Liu, N.; Wang, Q. An analytical solution for the time-dependent anchoring force in prestressed cables due to rock creep. Mechan. Time Depend. Mater. 2023, 27, 367–399. [Google Scholar] [CrossRef]
- Hong, Y.; Shao, Z.; Wu, K.; Jiang, S. An extended 3D limit analysis of slope stability considering prestressed anchor cables reinforcement. Arch. Civil Mechan. Eng. 2023, 23, 59. [Google Scholar] [CrossRef]
- Zhang, J.; Li, W.; Ye, S. Stability analysis of filled-slope reinforced by frame with prestressed anchor-plates under static action. Appl. Sci. 2023, 13, 1615. [Google Scholar] [CrossRef]
- Qian, Z.; Zou, J.; Wei, X. A novel plastic failure model of prestressed anchor cables for upper bound stability analyses of rotational reinforced slopes. Eur. J. Environ. Civil Eng. 2023, 27, 2150–2169. [Google Scholar] [CrossRef]
- Wang, X.G.; Zhao, Y.F.; Nie, Y.; Lin, X.-C.; Sun, X.-S. The shear resistance mechanism of prestressed anchor cables in slope reinforcement. Int. J. Rock Mechan. Min. Sci. 2023, 170, 105520. [Google Scholar] [CrossRef]
- Qin, F.Y.; Tu, J.S.; Ge, Q.Y. Study on retaining work of the engineering landslide. In Applied Mechanics and Materials; Trans Tech Publications Ltd.: Zurich, Switzerland, 2012; Volume 166, pp. 2566–2569. [Google Scholar]
- GB 50330-2013; Technical Code for Building Slope Engineering. Ministry of Housing and Urban-Rural Development of the People’s Republic of China: Chongqing, China, 2013.
Disclaimer/Publisher’s Note: The statements, opinions and data contained in all publications are solely those of the individual author(s) and contributor(s) and not of MDPI and/or the editor(s). MDPI and/or the editor(s) disclaim responsibility for any injury to people or property resulting from any ideas, methods, instructions or products referred to in the content. |
© 2025 by the authors. Licensee MDPI, Basel, Switzerland. This article is an open access article distributed under the terms and conditions of the Creative Commons Attribution (CC BY) license (https://creativecommons.org/licenses/by/4.0/).