Article

On the Process Optimization, Microstructure Characterization and Mechanical Performance of Ti65 Titanium Alloy Produced by Laser Powder Bed Fusion

1
China Machinery Institute of Advanced Materials (Zhengzhou) Co., Ltd., Zhengzhou 450001, China
2
Beijing National Innovation Institute of Lightweight Ltd., Beijing 101400, China
3
State Key Laboratory of Advanced Forming Technology and Equipment, China Academy of Machinery Science and Technology, Beijing 100044, China
4
Machinery Technology Development Co., Ltd., Beijing 100044, China
5
Beijing Institute of Power Machinery, Beijing 100074, China
*
Author to whom correspondence should be addressed.
Appl. Sci. 2025, 15(21), 11717; https://doi.org/10.3390/app152111717
Submission received: 29 September 2025 / Revised: 25 October 2025 / Accepted: 26 October 2025 / Published: 3 November 2025

Abstract

Ti65 high-temperature titanium alloy, known for its exceptional high-temperature mechanical properties and oxidation resistance, demonstrates considerable potential for aerospace applications. Nevertheless, conventional manufacturing techniques are often inadequate for achieving high design freedom and fabricating complex geometries. This study presents a systematic investigation into the process optimization, microstructure characterization, and mechanical performance of Ti65 alloy produced by laser powder bed fusion (LPBF). Via meticulously designed single-track, multi-track, and bulk sample experiments, the influences of laser power (P), scanning speed (V), and hatch spacing (h) on molten pool behavior, defect formation, microstructural evolution, and surface roughness were thoroughly examined. The results indicate that under optimized parameters, the specimens attain ultra-high dimensional accuracy, with a near-full density (>99.99%) and reduced surface roughness (Ra = 3.9 ± 1.3 μm). Inadequate energy input (low P or high V) led to lack-of-fusion defects, whereas excessive energy (high P or low V) resulted in keyhole porosity. Microstructural analysis revealed that the rapid solidification inherent to LPBF promotes the formation of fine acicular α′-phase (0.236–0.274 μm), while elevated laser power or reduced scanning speed facilitated the development of coarse lamellar α′-martensite (0.525–0.645 μm). Tensile tests demonstrated that samples produced under the optimized parameters exhibit high ultimate tensile strength (1489 ± 7.5 MPa), yield strength (1278 ± 5.2 MPa), and satisfactory elongation (5.7 ± 0.15%), alongside elevated microhardness (446.7 ± 1.7 HV0.2). The optimized microstructure thereby enables the simultaneous achievement of high density and superior mechanical properties. The fundamental mechanism is attributed to precise control over volumetric energy density, which governs melt pool mode, defect generation, and solidification kinetics, thereby tailoring the resultant microstructure. This study offers valuable insights into defect suppression, microstructure control, and process optimization for LPBF-fabricated Ti65 alloy, facilitating its application in high-temperature structural components.

1. Introduction

Titanium alloys are widely utilized in extreme service environments such as aerospace and energy equipment due to their low density, high specific strength, excellent corrosion resistance, and high-temperature stability [1,2,3]. Typical applications include gas turbine engine blades and high-temperature load-bearing components [4,5]. With the increasing demands for lightweight design and enhanced high-temperature performance in next-generation aircraft, conventional titanium alloys (e.g., Ti6Al4V) struggle to meet the stringent requirements for long-term service above 600 °C [6,7,8,9]. In this context, Ti65 is a novel high-temperature titanium alloy developed by the Institute of Metal Research, Chinese Academy of Sciences. Its composition is tailored through synergistic adjustments of elements such as Al and Mo to impart excellent high-temperature oxidation resistance, creep resistance, and mechanical stability [10,11]. Consequently, while heat treatment is not a prerequisite for oxidation resistance, it can be applied to further optimize this characteristic. It is regarded as a candidate material for next-generation high-temperature titanium alloys. However, traditional manufacturing processes including casting, forging, and powder metallurgy exhibit inherent limitations in producing complex structural components from high-temperature titanium alloys [12,13]. These processes not only limit design freedom, but also incur high processing costs and severe material waste, significantly hindering the widespread engineering application of Ti65 alloys [14].
In recent years, laser powder bed fusion (LPBF) technology has emerged as a novel approach for the precision manufacturing of complex titanium alloy components, leveraging its layer-by-layer additive manufacturing principle [15,16,17]. Owing to its high precision, superior material utilization, and exceptional capability in fabricating intricate geometries, LPBF has found extensive applications in aerospace, medical, and automotive industries [18,19,20]. This technology employs high-energy laser beams to selectively melt metal powders, combined with rapid solidification characteristics, effectively refining grains and tailoring microstructural textures to enhance mechanical properties [21,22,23]. However, the LPBF process is characterized by its multiphysics-coupled nature, involving complex interactions among molten pool dynamics, heat transfer, and phase transformations. The resulting forming quality is highly dependent on the synergistic optimization of key process parameters, including laser power (P), scanning speed (V), and hatch spacing (h) [24,25,26]. For instance, Wei et al. achieved a relative density of up to 99.95% in Ti-5Al-2Sn alloy through optimization of single-track cladding parameters [27], and Thijs et al. notably reduced porosity in Ti6Al4V via cross-hatching scanning strategies [28]. Yang et al. examined the influence of melt pool mode on the formability, microstructure, and mechanical properties of LPBF-produced Ti6Al4V, proposing a modified threshold criterion for keyhole formation [29]. Similarly, Luo et al. introduced high-density dislocations into the β-titanium alloy TNZTS by regulating melt pool modes, leading to enhanced strength through dislocation strengthening [30]. Despite these advances, current research remains predominantly focused on conventional titanium alloys processed via LPBF. In contrast, studies on additive manufacturing of novel high-temperature titanium alloys such as Ti65 have largely utilized laser directed energy deposition (LDED) technology. For example, Li et al. fabricated Ti65 samples employing various interlayer rotation angles and conducted systematic analyses of the resultant microstructural and mechanical variations [31]; He et al. explored the effects of both low and high laser power parameters, along with different heat treatment schedules, on the microstructure and properties of LDED-fabricated Ti65 alloy [14,32]; Sun et al. investigated the high-temperature oxidation behavior of LDED-fabricated Ti65, developing a predictive model for oxidation weight gain and oxygen diffusion layer thickness as functions of temperature and time, thereby enabling quantitative assessment of the oxidation process [33,34]. To the best of the authors’ knowledge, no study related to LPBF of Ti65 has been published, indicating that the underlying mechanisms governing the LPBF processing of Ti65 high-temperature titanium alloy remain insufficiently explored. There is a critical need for systematic investigations into the correlations between process parameters, microstructure evolution, and mechanical properties in LPBF-fabricated Ti65.
This study systematically investigated the processing optimization, melt pool behavior, and defect evolution mechanisms during LPBF fabrication of Ti65 alloy, meanwhile revealing the regulatory effects of energy input density on microstructural characteristics. Through hierarchical single-track, single-layer, and bulk sample experiments, the influence of laser power, scanning speed, and hatch spacing on melt pool geometry, forming quality (density, surface roughness), and microstructure was quantitatively analyzed. The research aims to establish a comprehensive LPBF processing map for Ti65 alloy, providing insights for defect suppression and microstructural optimization, thereby promoting its engineering applications in high-temperature structural components [35,36].

2. Materials and Methods

2.1. Powder Materials

The Ti65 alloy powder used in this study was prepared via the Electrode Induction Gas Atomization (EIGA) method (Ti65 alloy powder, Xi’an Bright Laser Technologies Co., Ltd., Xi’an, China). The powder exhibited a particle size distribution ranging from 0 to 25 μm and an apparent density of 2.56 g/cm3. The microscopic morphology of the powder, characterized using a scanning electron microscope (SEM; Phenom XL G2, Thermo Fisher Scientific Inc., Waltham, MA, USA), is shown in Figure 1a. All powder particles exhibit a spherical morphology. The particle size distribution, measured using a laser diffraction analyzer (Mastersizer 3000, Malvern Panalytical Ltd., Malvern, UK), is presented in Figure 1b, demonstrating a typical Gaussian distribution with D10, D50, and D90 values of 7.14 μm, 14.19 μm, and 23.98 μm, respectively. Furthermore, the chemical composition of the powder was analyzed by inductively coupled plasma optical emission spectroscopy (ICP-OES; iCAP PRO, Thermo Fisher Scientific Inc., USA), as summarized in Table 1. Despite the flowability challenges typically associated with ultrafine powders, the high sphericity and narrow size distribution of the Ti65 powder contributed to adequate powder spreading uniformity during the LPBF process, thereby providing a fundamental material basis for high-quality fabrication.

2.2. Experimental Process

The experiments were conducted using an LPBF system developed from LiM-X260A with a tailored fine laser spot diameter of 50 μm (LiM-X260A, Tianjin Leiming Laser Technology Co., Ltd, Tianjin, China). The system is equipped with a fiber laser unit (IPG Photonics, 500 W) operating at a wavelength of 1064 nm. The effective build volume of the chamber is 260 mm × 260 mm × 430 mm. A Ti6Al4V titanium alloy substrate was utilized, and the Ti65 powder was subjected to vacuum drying at 120 °C for 4 h prior to experimentation to enhance flowability and reduce oxygen content. The printing process was conducted under an argon protective atmosphere with oxygen content strictly controlled below 100 ppm to prevent oxidation and contamination.
A hierarchical experimental strategy including single-track, single-layer, and multi-layer scanning was implemented. The key processing parameters laser power (P), scanning speed (V), and hatch spacing (h) were systematically varied within the following ranges: P = 60–140 W, V = 600–1400 mm/s, and h = 30–75 μm. In the initial stage, single-track laser melting experiments were performed to systematically characterize the surface morphology and geometric features of the melt tracks (including width, depth, height, and depth-to-width ratio). This enabled a comprehensive evaluation of the energy input effects under varying laser power (P) and scanning speed (V) combinations on melt track quality. Subsequently, single-layer multi-track experiments were conducted within the optimized parameter window from the single-track tests. Four hatch spacing values (30 μm, 45 μm, 60 μm, and 75 μm) were systematically investigated to elucidate the relationship between overlap rate and hatch spacing, thereby determining the optimal hatch spacing for high-quality single-layer fabrication. In the final stage, multi-layer multi-track experiments were carried out to fabricate cubic specimens (8 mm × 8 mm × 8 mm), guided by prior experimental results. Post-processing involved electrical discharge machining to remove the specimens from the substrate, followed by ultrasonic cleaning in anhydrous ethanol, mechanical grinding, and chemical polishing to for subsequent microstructural and performance analyses.

2.3. Characterization

The characterization of the as-fabricated samples was conducted through a systematic and multi-dimensional methodology, including molten pool morphology, relative density, surface quality, microstructure, and mechanical properties. In the characterization of single-track experiments, the surface morphology of the as-deposited tracks was first examined using the SEM to evaluate the continuity of the melt tracks and the distribution of adhered particles. Cross-sectional samples were then prepared by sectioning perpendicular to the laser scanning direction, followed by embedding in epoxy resin. These cross-sections underwent sequential grinding and polishing using an automatic grinding-polishing machine (YMPZ-2, Shanghai Metallographic Machinery Equipment Co., Ltd., Shanghai, China). After polishing, the samples were etched with Kroll’s reagent (HF:HNO3:H2O = 2:8:90 by volume) for 15 s to reveal microstructural features. The geometric parameters of the molten pool, including width (W), depth (D), height (H), and depth-to-width ratio (D/W), were quantitatively characterized using both optical microscopy (OM; Axio scope 5, Carl Zeiss AG, Jena, Germany) and SEM. Each parameter was averaged over 10 measurements to minimize random errors. For the evaluation of forming quality of the cubic specimens, the relative density was measured using ImageJ2.0 software to process OM-acquired images. Additionally, surface roughness was comprehensively characterized using a surface roughness tester combined with a 3D video microscope (HIROX KH7700, Hirox Co., Ltd., Tokyo, Japan). The arithmetic average roughness (Ra) and maximum profile height (Rz) were quantified to evaluate the surface topography under different process parameters. To further investigate the microstructural evolution of LPBF-fabricated Ti65 alloy, polished cubic samples were examined via SEM. This analysis focused on variations in grain morphology, size, and phase composition under different process parameter combinations. The hierarchical characterization approach ensured a robust understanding of the interplay between process conditions and material properties.
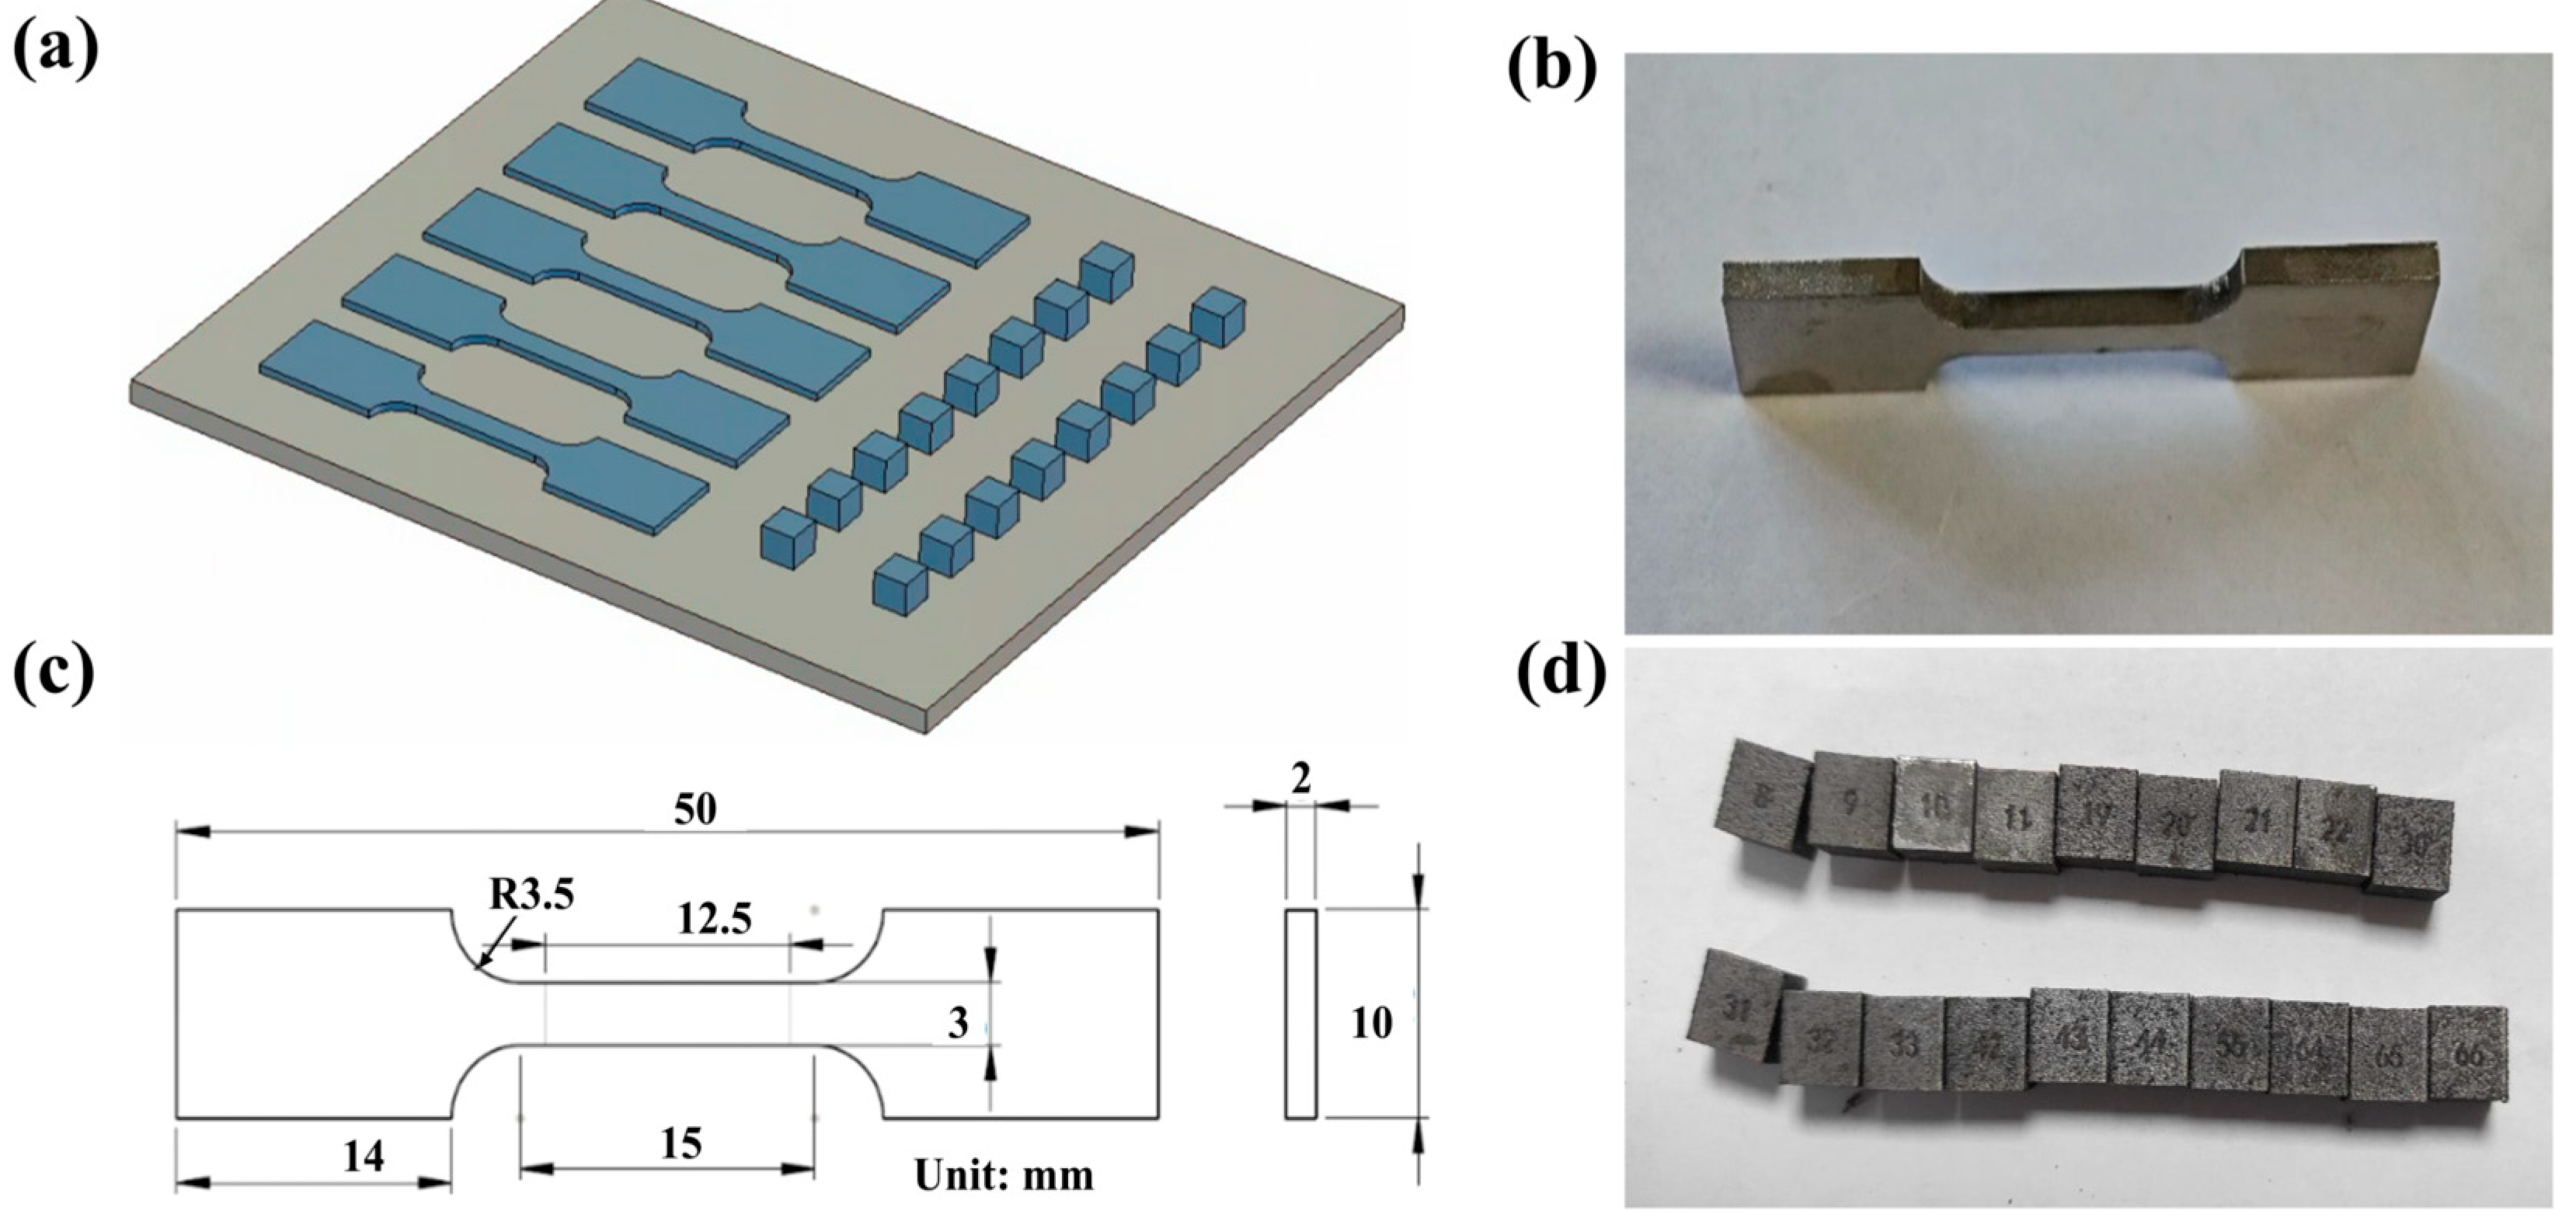
Schematic diagrams of the tensile and cube specimens are provided in Figure 2, wherein the dimensions of the tensile specimen are illustrated in Figure 2c. The tensile test was conducted using an electromechanical universal testing machine (E45.105, MTS Systems (China) Co., Ltd., Shanghai, China). Before the test, the specimens were polished, with a loading rate of 0.75 mm/min. Each sample underwent three tensile tests, and the fracture surface morphology was observed under SEM. Hardness testing was conducted using an integrated microhardness tester (XHVT-1000Z, Shanghai Shangcai Testing Machine Co., Ltd., Shanghai, China), with each sample tested six times and the average value recorded. Phase identification was performed by X-ray diffraction (XRD; SmartLab SE, Rigaku Corporation, Tokyo, Japan) using Cu Kα radiation. The scans were conducted in the 2θ range of 20° to 90° at a scanning speed of 5°/min.

3. Results and Discussion

3.1. Surface Morphology of Single Tracks

The LPBF process is based on the sequential accumulation of laser-scanned lines into layers and ultimately into three-dimensional structures. The formation of stable and continuous single tracks is critical for ensuring effective overlap between adjacent tracks and interlayer bonding, thereby directly influencing the quality of the final component. Based on investigations into LPBF process parameters and powder melting mechanisms, the morphology of single tracks can be categorized into three distinct types: discontinuous and unstable tracks, tracks with distorted deformation, and continuous, stable, and smooth tracks.
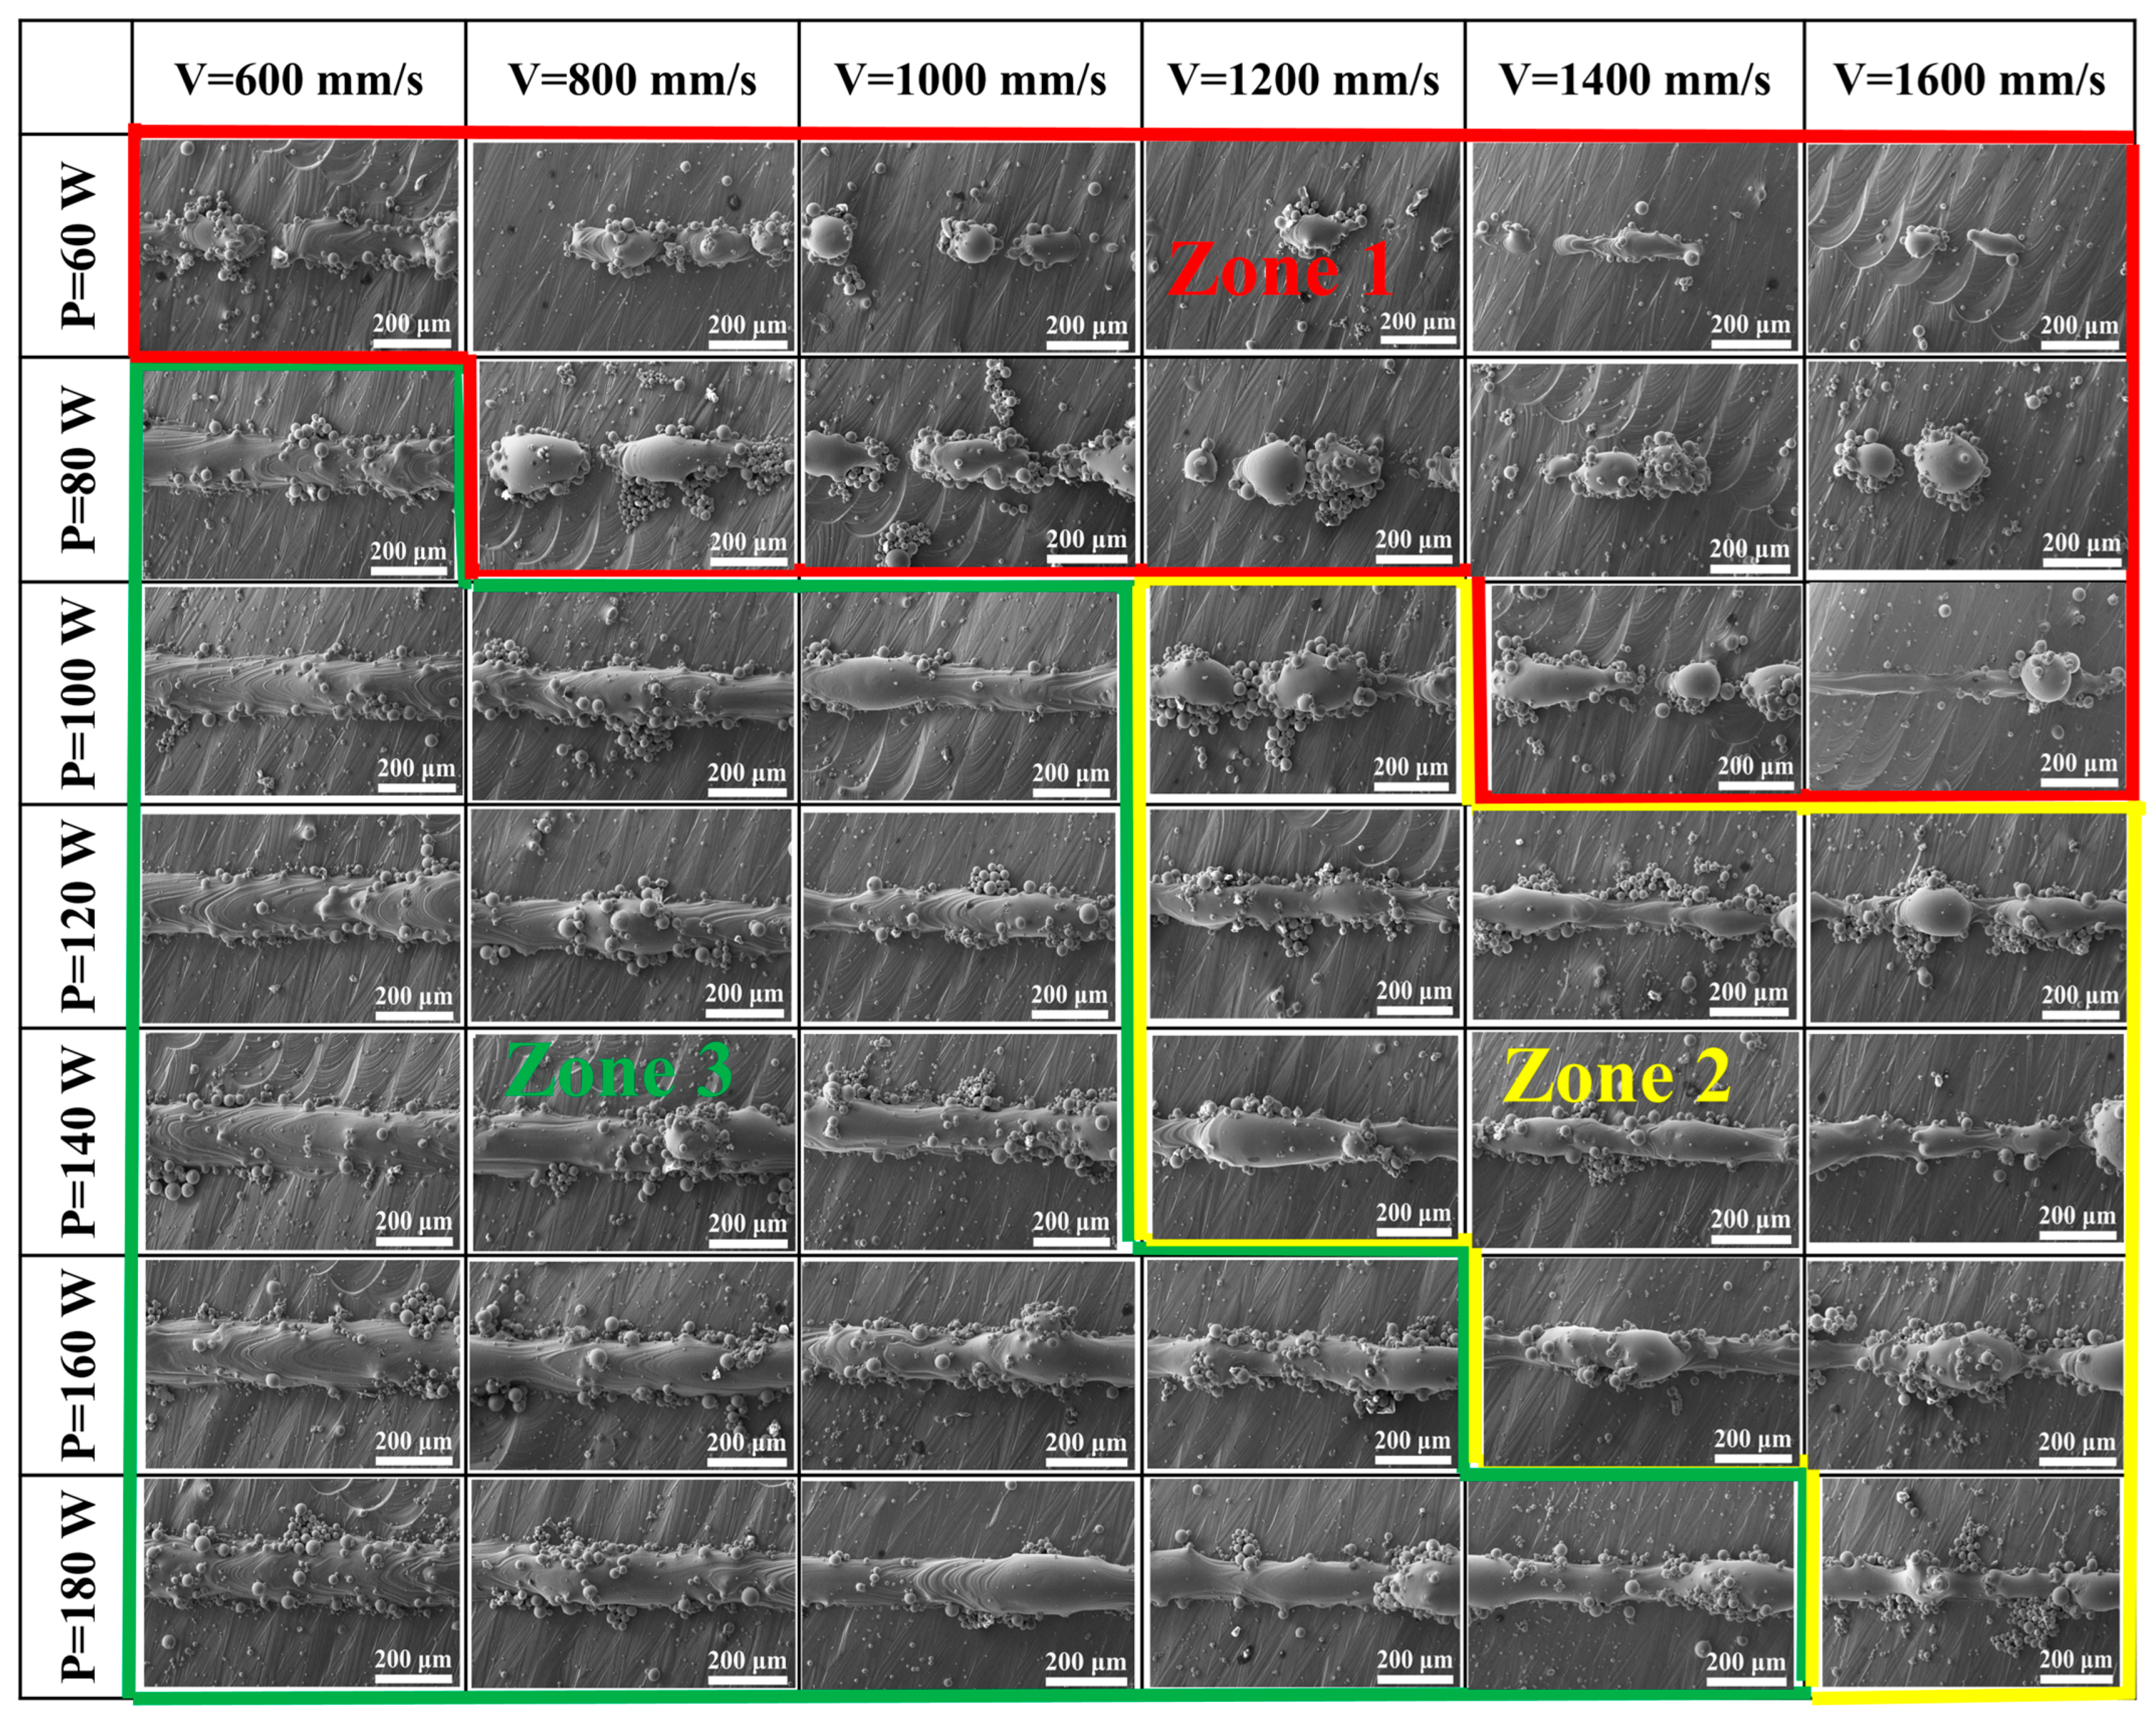
As shown in Figure 3, the laser power (P) and scanning speed (V) significantly influence the morphology and quality of single tracks. In Region I (P < 80 W, V > 1200 mm/s), the tracks exhibited pronounced discontinuity, characterized by alternating regions of partially sintered powder particles and lack-of-fusion zones. This phenomenon arises from insufficient energy density (E = P/V), where the laser power failed to overcome the melting enthalpy of the powder, while high scanning speeds reduce the effective heating time, leading to inadequate wetting of the molten materials [37]. Xiong et al. demonstrated that when the linear energy density (E) falls below 0.05 J/mm, the viscous flow of molten metal cannot overcome surface tension effects, resulting in fragmented tracks [38]. In the parameter range of Region II (P = 80–120 W, V = 800–1000 mm/s), track continuity improves, but periodic balling phenomena emerge. According to the Plateau–Rayleigh instability theory, excessive energy input destabilizes the balance between surface tension and inertial forces within the molten pool, causing the molten metal to split into droplets prior to solidification to minimize surface energy [39]. Furthermore, excessively high laser power (P > 120 W) or low scanning speeds (V < 800 mm/s) induce turbulent flow in the molten pool, producing distorted tracks and residual stress accumulation. In contrast, Region III (highlighted in green) exhibits stable and continuous tracks, attributed to optimal synergy between laser power and scanning speed. Here, the energy input and laser dwell time are appropriately balanced, allowing complete melting of the powder, stable molten pool dynamics, and smooth solidification. The resulting tracks display uniform geometry with minimal defects.
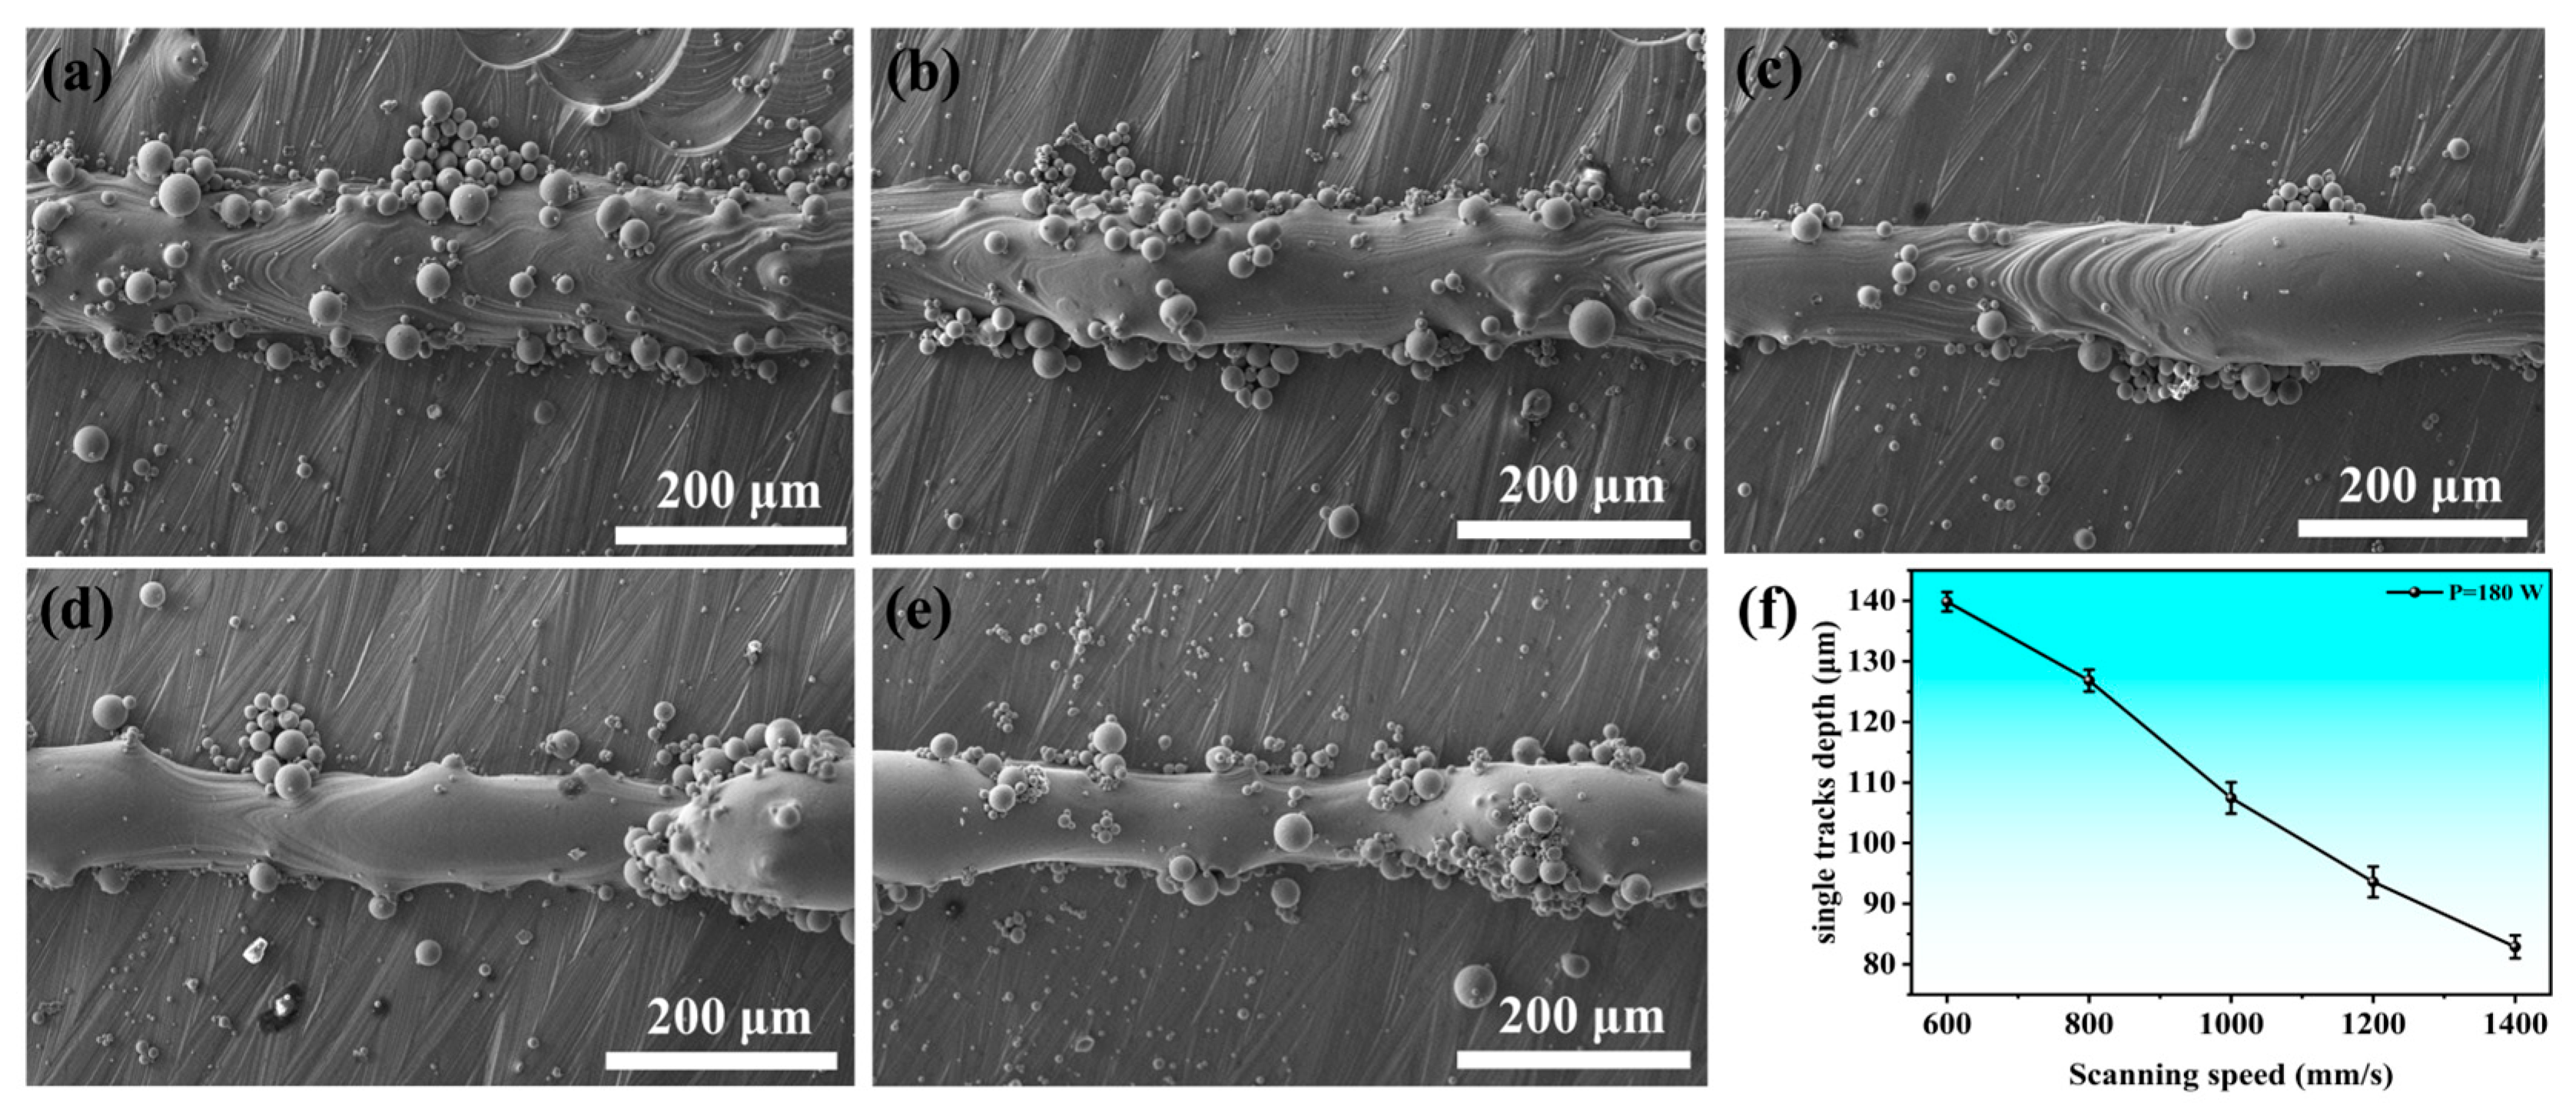
Figure 4 illustrates the variation in single-track width under a fixed laser power of 160 Wand varying scanning speeds (V = 600–1400 mm/s). As the scanning speed increases, the track width decreases from 139.8 ± 1.6 μm to 82.9 ± 1.8 μm. This trend is attributed to the reduced energy absorption per unit volume at higher speeds, which lowers molten pool temperature, increases metal viscosity, and restricts lateral spreading of the liquid phase before rapid solidification [27,37].

3.2. Geometric Characteristic of Molten Pool

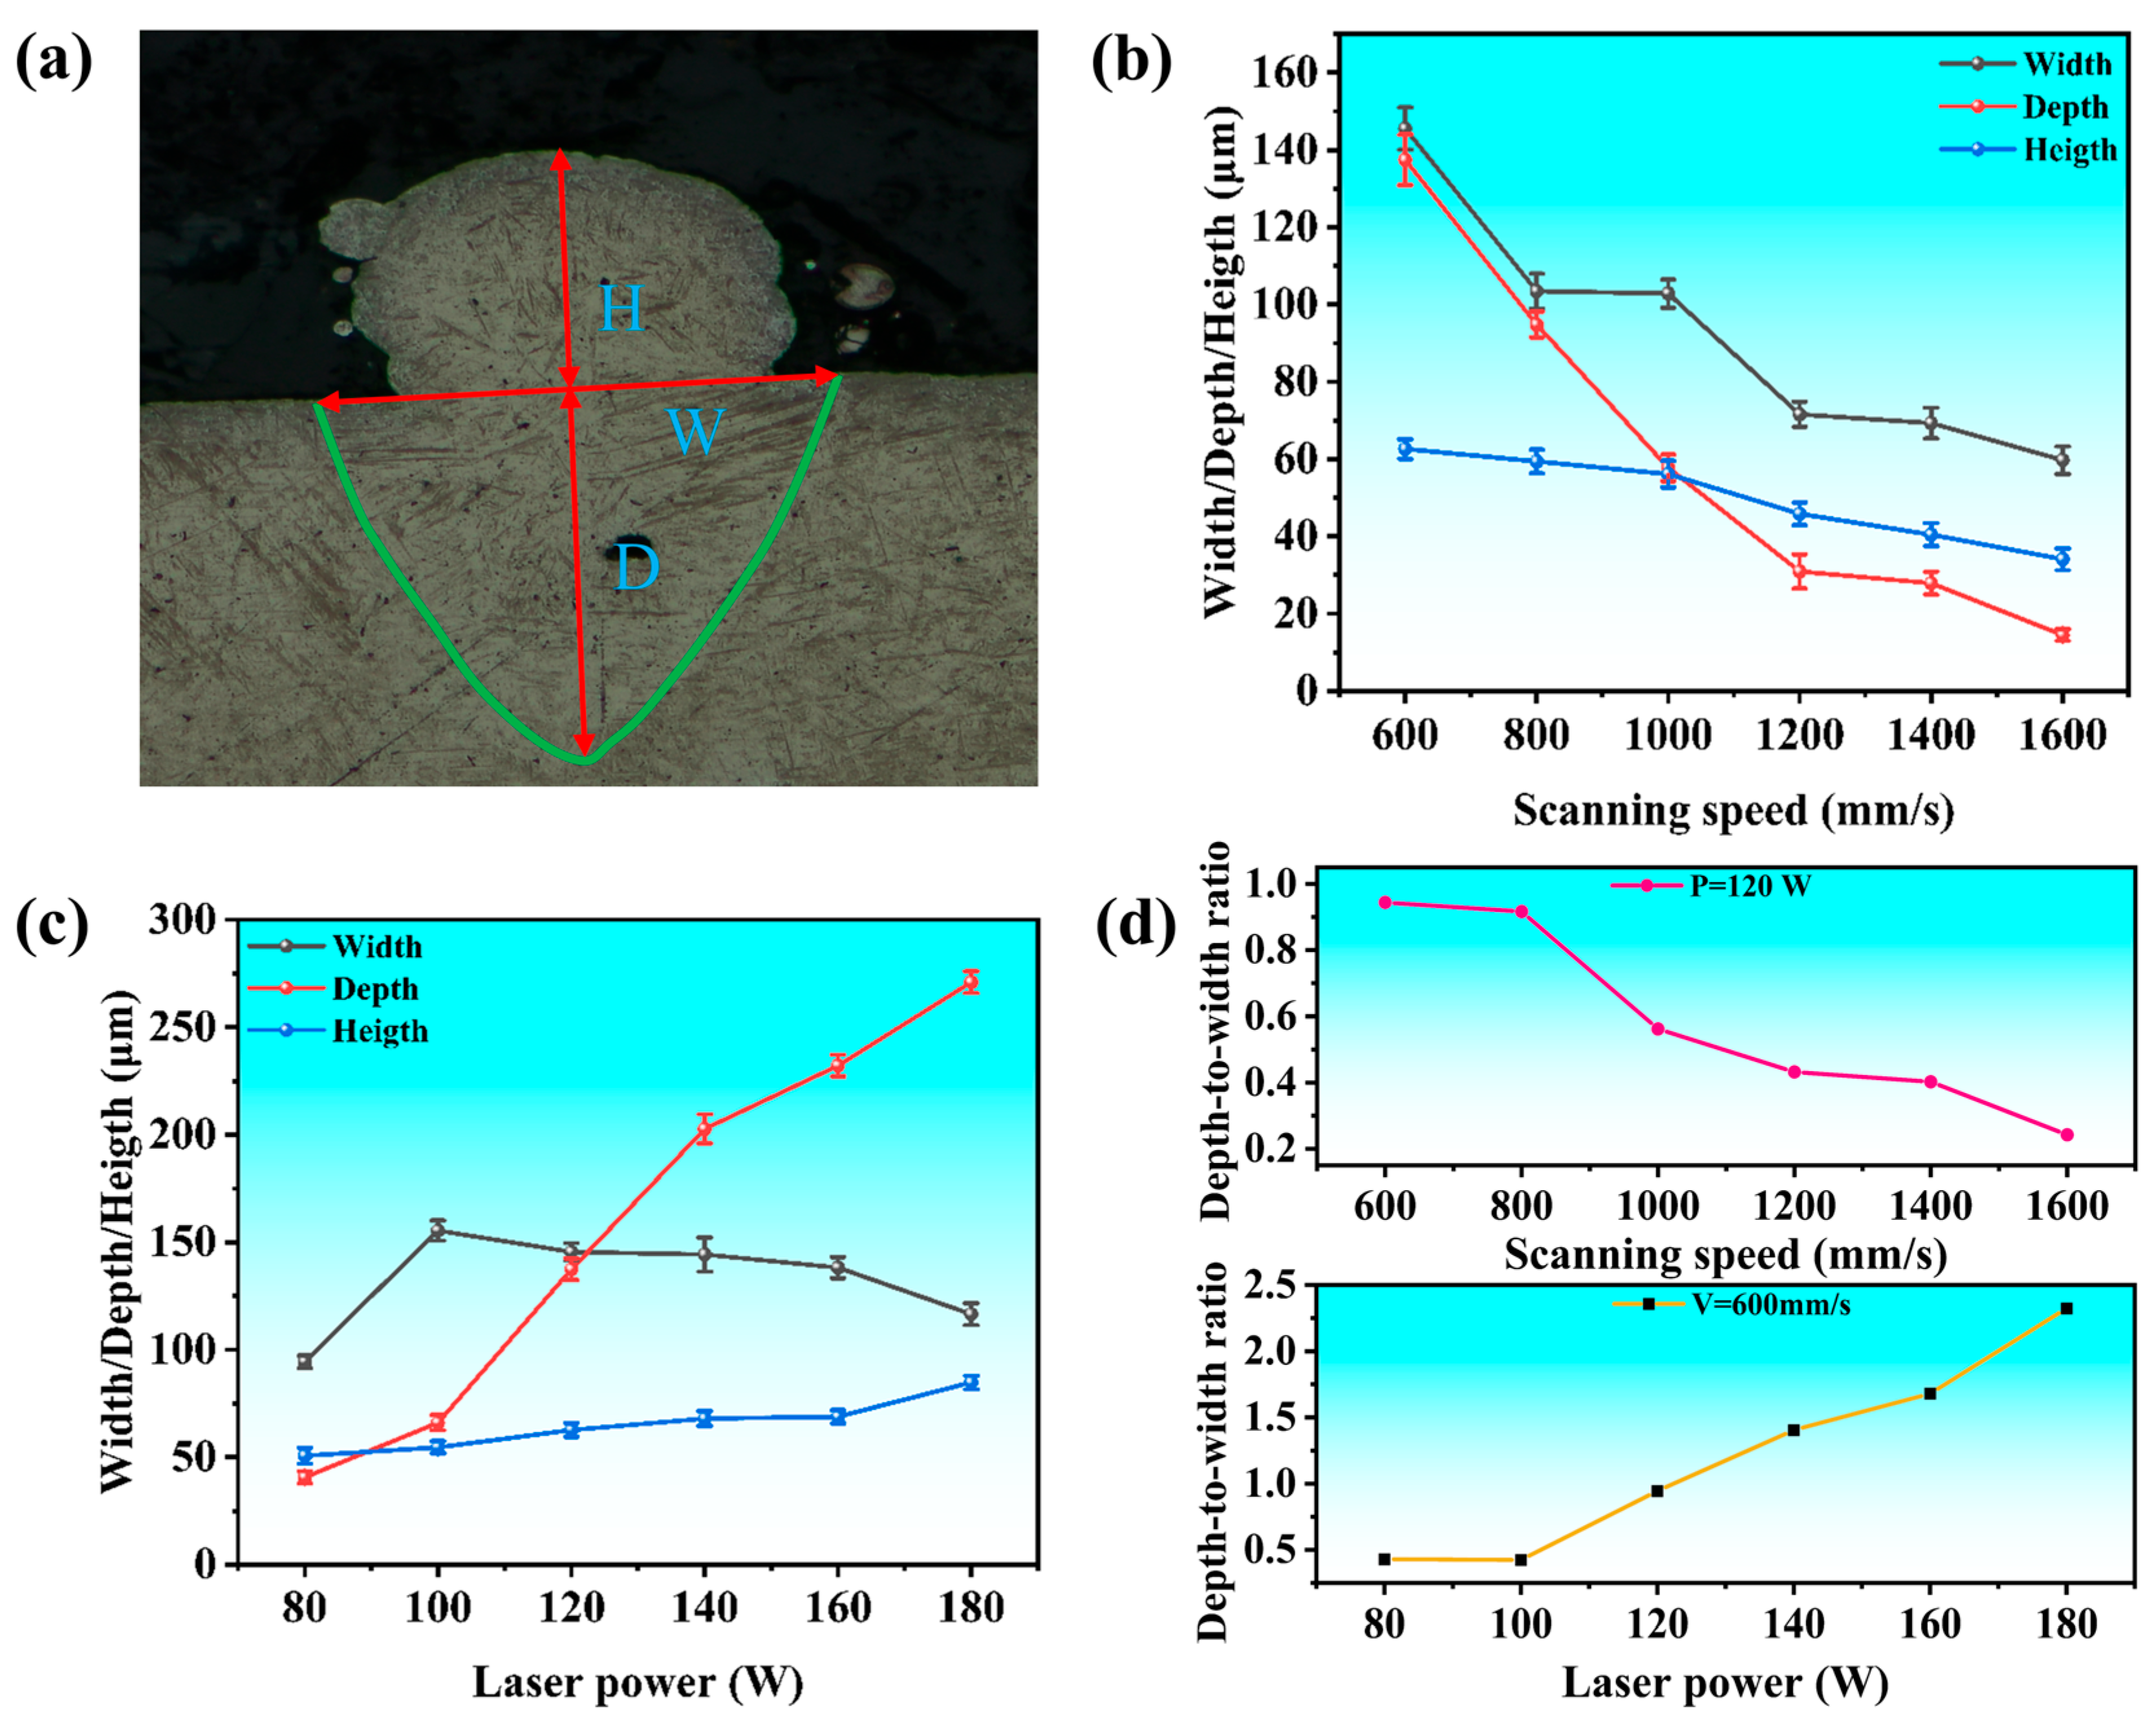
The geometric characteristics of the molten pool are critical indicators in the LPBF process, directly influencing the metallurgical bonding quality and dimensional accuracy of fabricated components [30,40]. By analyzing the cross-sectional morphology of single-track melt pools, this study quantitatively elucidates the effects of laser power (P) and scanning speed (V) on key geometric parameters, including width (W), depth (D), height (H), and depth-to-width ratio (D/W). These parameters exhibit pronounced nonlinear variations with changes in P and V.
Figure 5b demonstrates the evolution of molten pool geometry under a fixed laser power of 120 W and varying scanning speeds (600–1400 mm/s). As the scanning speed increases from 600 to 1400 mm/s, the molten pool width decreases linearly from 145.5 ± 5.4 μm to 59.8 ± 3.6 μm, while the depth sharply reduces from 137.4 ± 6.5 μm to 14.5 ± 1.5 μm. Concurrently, the height decreases from 62.6 ± 2.5 μm to 34.1 ± 2.8 μm, and the depth-to-width ratio (D/W) declines from 0.94 (a near-elliptical pool) to 0.24 (shallow and wide pool). This behavior originates from the significant reduction in volumetric energy density at higher scanning speeds, which shortens the powder heating time, increases thermal gradients, elevates liquid metal viscosity, and restricts vertical expansion of the molten pool. Conversely, under a fixed scanning speed of 600 mm/s and increasing laser power (60–140 W), the molten pool geometry exhibits distinct trends (Figure 5c). The width initially increases from 94.5 ± 2.9 μm to 155.4 ± 4.7 μm at 100 W, then decreases to 116.5 ± 5.1 μm at 140 W. Meanwhile, the depth rises from 40.6 ± 2.7 μm to 270.9 ± 4.9 μm, the height grows from 50.6 ± 3.7 μm to 84.7 ± 4.2 μm, and the D/W ratio surges from 0.4 (shallow pool) to 2.3 (deep and narrow pool). This non-monotonic trend reflects the complex thermal interactions governed by laser power: moderate power enhances powder melting and pool depth [41], while excessive power promotes the transition to a keyhole melting mode. In this regime, the intense vaporization of metal generates significant vapor recoil pressure that depresses the molten pool surface, creating a deep and narrow cavity. This keyhole effect is responsible for the observed increase in depth and the concomitant reduction in width [42].
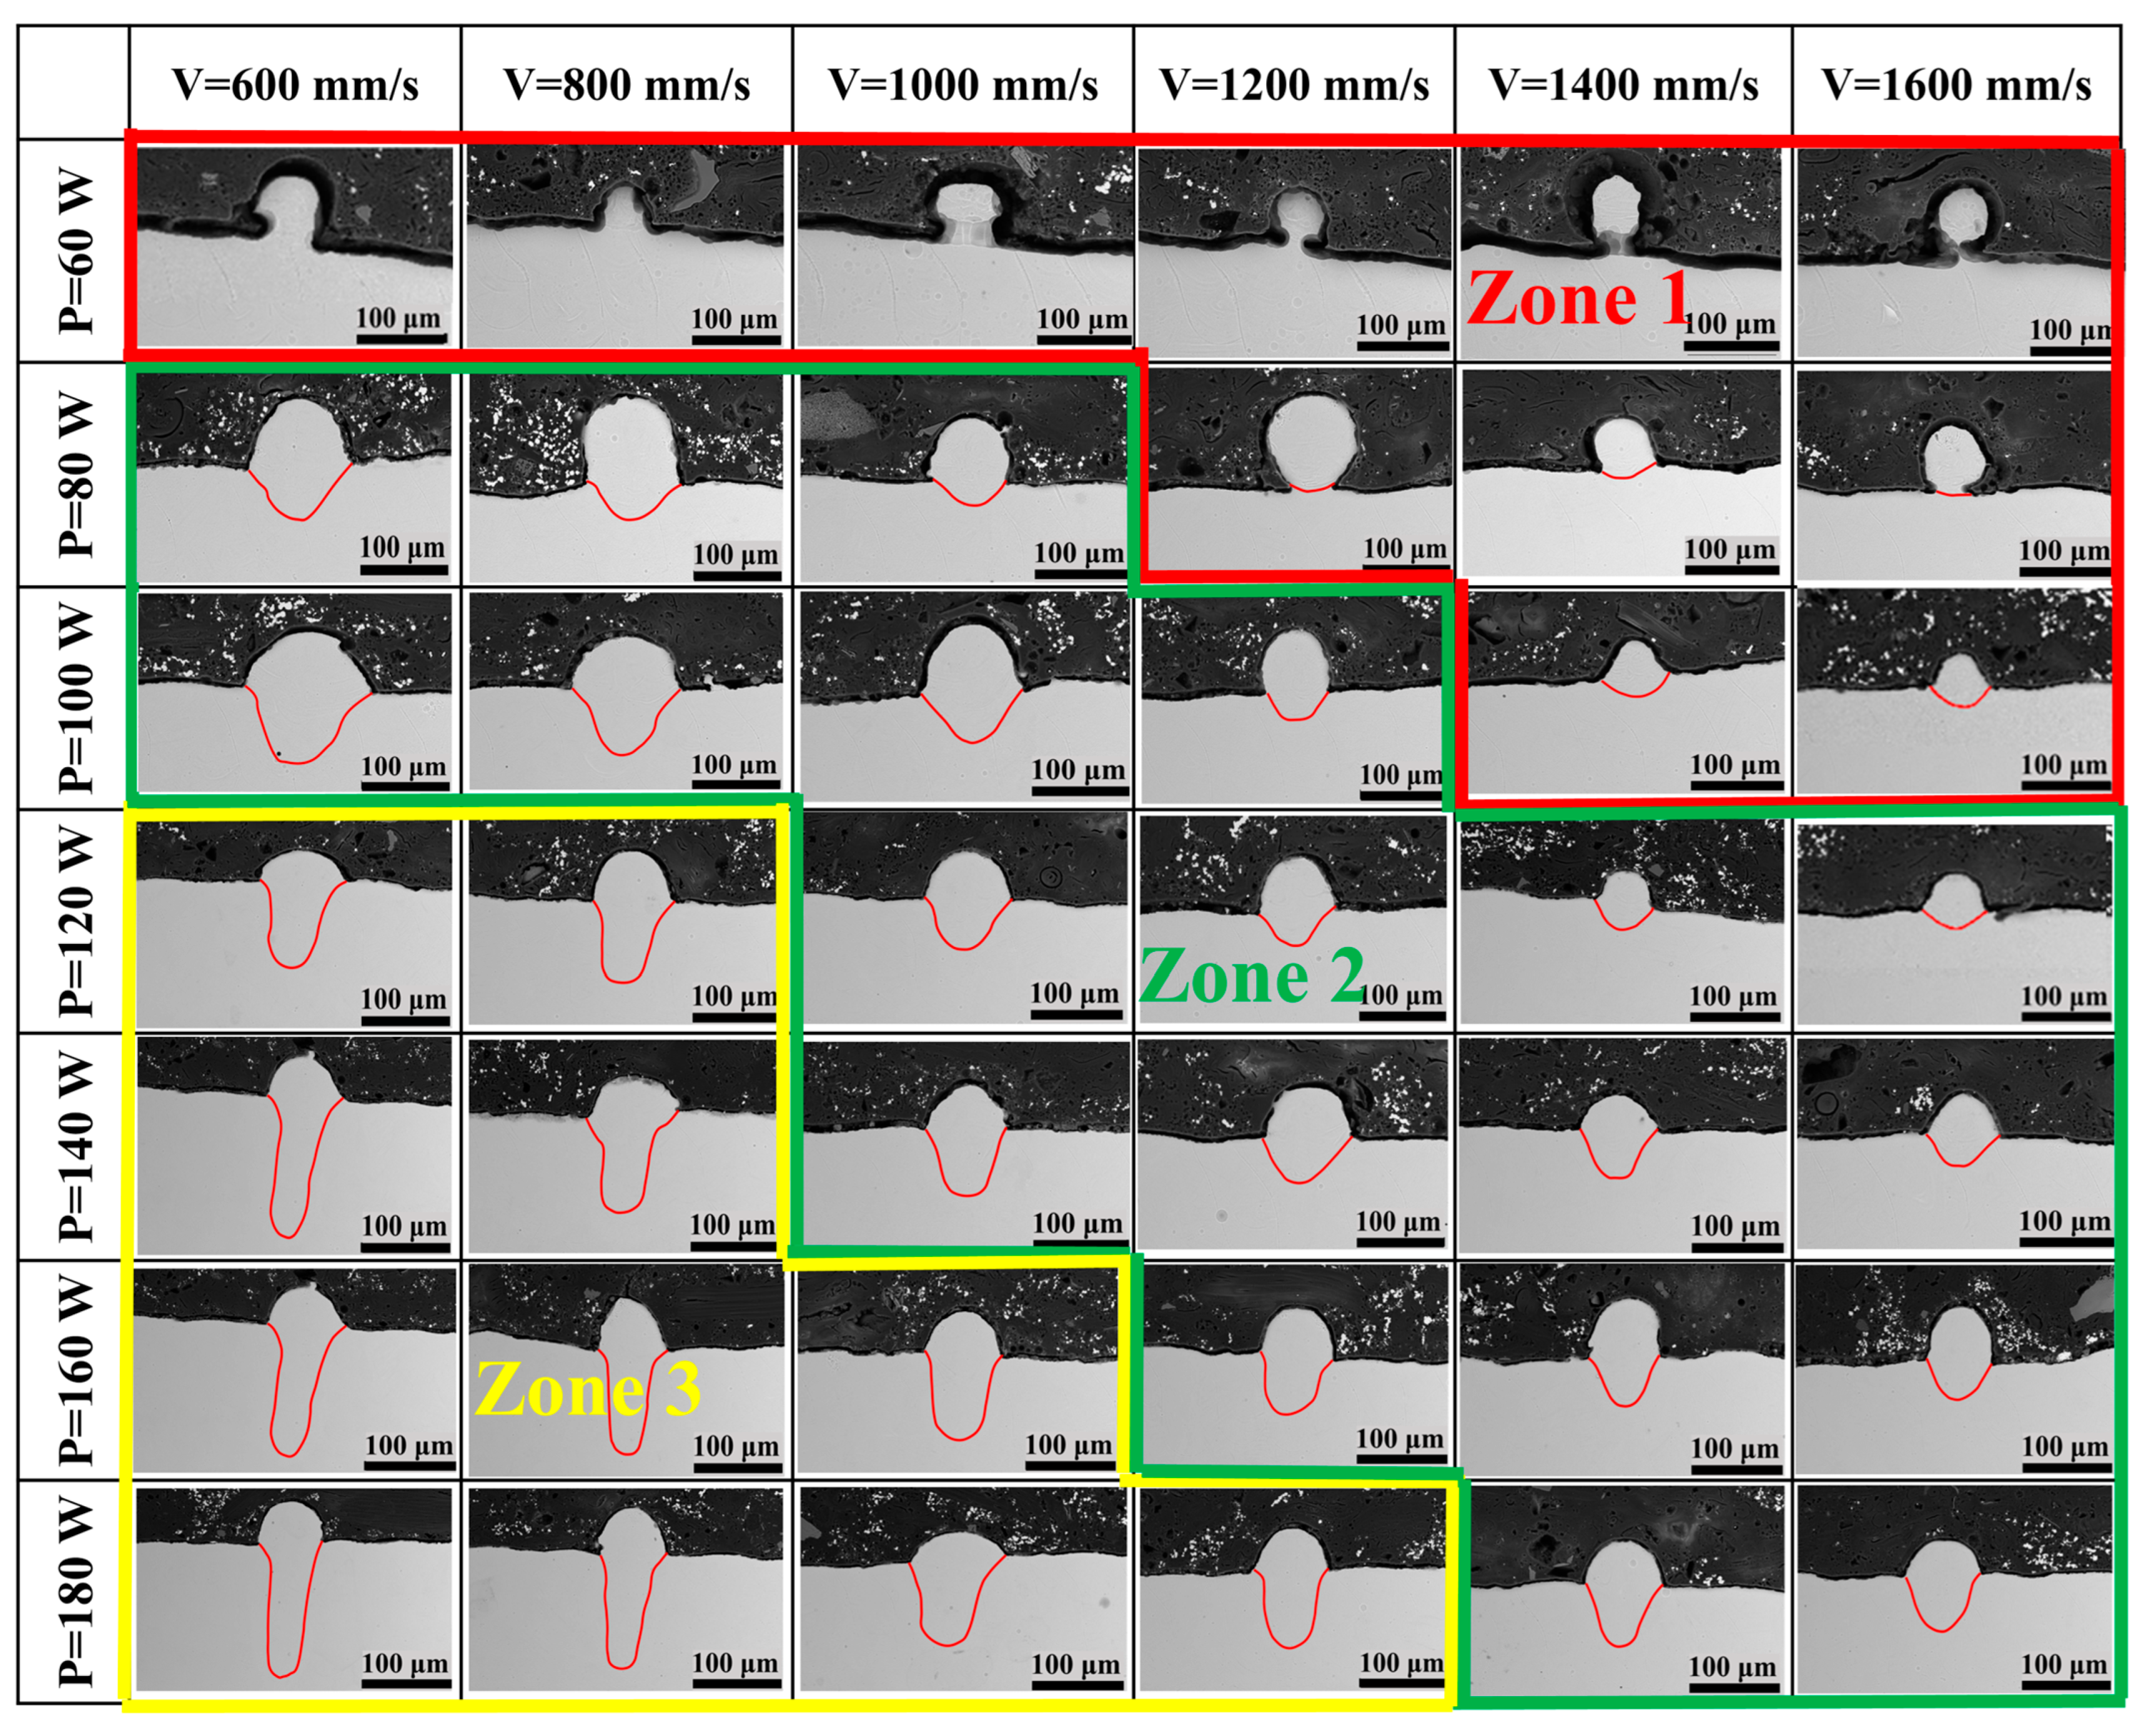
Figure 6 classifies molten pool morphologies into three regimes based on energy input: Conduction mode (E < critical threshold): Low E (P < 80  W or V > 1200  mm/s) produces shallow, elliptical pools (D/W < 0.5) with discontinuous fusion interfaces, prone to lack-of-fusion defects. Transition mode (critical threshold < E < keyhole threshold): Moderate E (P = 80–120 W, V = 800–1000 mm/s) yields near-elliptical pools (D/W = 0.5–1.2) with stable fluid flow and optimal metallurgical bonding. Keyhole mode (E > keyhole threshold): High E (P > 120 W or V < 800 mm/s) generates deep, narrow pools (D/W > 1.2) where vapor recoil pressure exceeds surface tension, forming dynamic keyholes. Thus, process optimization requires maintaining D/W within 0.5–1.2 to balance defect suppression and bonding strength.

3.3. Surface Morphology of Multi Tracks

Following the analysis of single-track scanning, the parameter range for laser power and scanning speed was identified, and the study then focused on the forming quality at the single-layer level, where the periodic overlap between adjacent tracks becomes a critical factor. The overlap between two adjacent tracks, defined as the overlapping condition, significantly influences the surface quality of the single-layer forming. This is because the overlapping region between adjacent tracks undergoes multiple cycles of melting and solidification, leading to changes in the microstructure. The width of the single track varies with different laser energy inputs, which in turn affects the optimal laser hatch spacing required to form a smooth and flat surface. Therefore, under different combinations of laser power and scanning speed, the hatch spacing that achieves optimal surface quality varies. The overlap ratio between two adjacent tracks is negatively correlated with the hatch spacing; that is, for a given melt pool width, increasing the hatch spacing reduces the overlap ratio. Building upon the previous analysis of single-track morphology and molten pool geometry, an optimal parameter combination (P = 100 W, V = 1000 mm/s) that produced continuous tracks and favorable melt pools was selected to investigate. The effect of hatch spacing (30 μm, 45 μm, 60 μm, and 75 μm) on the surface morphology and defect evolution of single-layer multi-track specimens was systematically investigated, with the results shown in Figure 7.
When the laser power was 100 W and the scanning speed was 1000 mm/s, adjusting the hatch spacing revealed distinct surface morphologies. At a hatch spacing of 30 μm, excessive overlap caused severe balling between tracks, resulting in an irregular “peaks and valleys” surface morphology. This was attributed to the small hatch spacing, which led to the accumulation of molten pools and repeated remelting of solidified regions, triggering droplet splashing and balling. As the hatch spacing increased to 45 μm, the overlap ratio (defined as the percentage of overlapping area between adjacent tracks) decreased by approximately 10%, which significantly reduced the balling effect and resulted in a relatively smooth surface. Further increasing the hatch spacing to 60 μm mitigated the balling effect, yielding a cleaner surface with tighter inter-track bonding. However, when the hatch spacing was excessive (75 μm), the overlap ratio became too low, leaving some areas lack-of-fusion and creating significant depressions and lack-of-fusion regions between tracks, which formed uneven gaps and substantially reduced the density and mechanical properties of the as-formed component.
In summary, the hatch spacing plays a pivotal role in determining the surface morphology of multi-track specimens. Both insufficient and excessive hatch spacing can lead to defects such as balling and incomplete fusion, respectively [43]. Only by maintaining the hatch spacing within an appropriate range can high-quality forming be achieved. The study demonstrated that a hatch spacing of 60 μm enables good overlap while avoiding balling and incomplete fusion defects, thereby producing a flat and dense formed component. This finding offers crucial process guidance for the application of LPBF in the manufacturing of complex structural components, aiding in the optimization of processing parameters to enhance the quality and performance of the LPBF-components.

3.4. Surface Morphology of Cubic Samples

3.4.1. Relative Density of Samples

Based on the optimized process parameters from single-track cladding and single-layer scanning experiments, this study further investigated the synergistic regulatory mechanisms of laser power (60–140 W) and scanning speed (600–1400 mm/s) on the relative density of Ti65 alloy bulk samples through multi-layer multi-track experiments. As shown in Figure 8, under fixed parameters of hatch spacing (60 μm), the relative density of the formed samples exhibited significant nonlinear characteristics with variations in process parameters, ranging from 97.3% to 99.99%. Notably, several parameter combinations achieved densities above 99.99% due to the rounding in the plot legend, yet the combination of 100 W and 1000 mm/s consistently yielded the highest densification, approaching full theoretical density, indicating an optimal balance between molten pool dynamics and energy input efficiency.
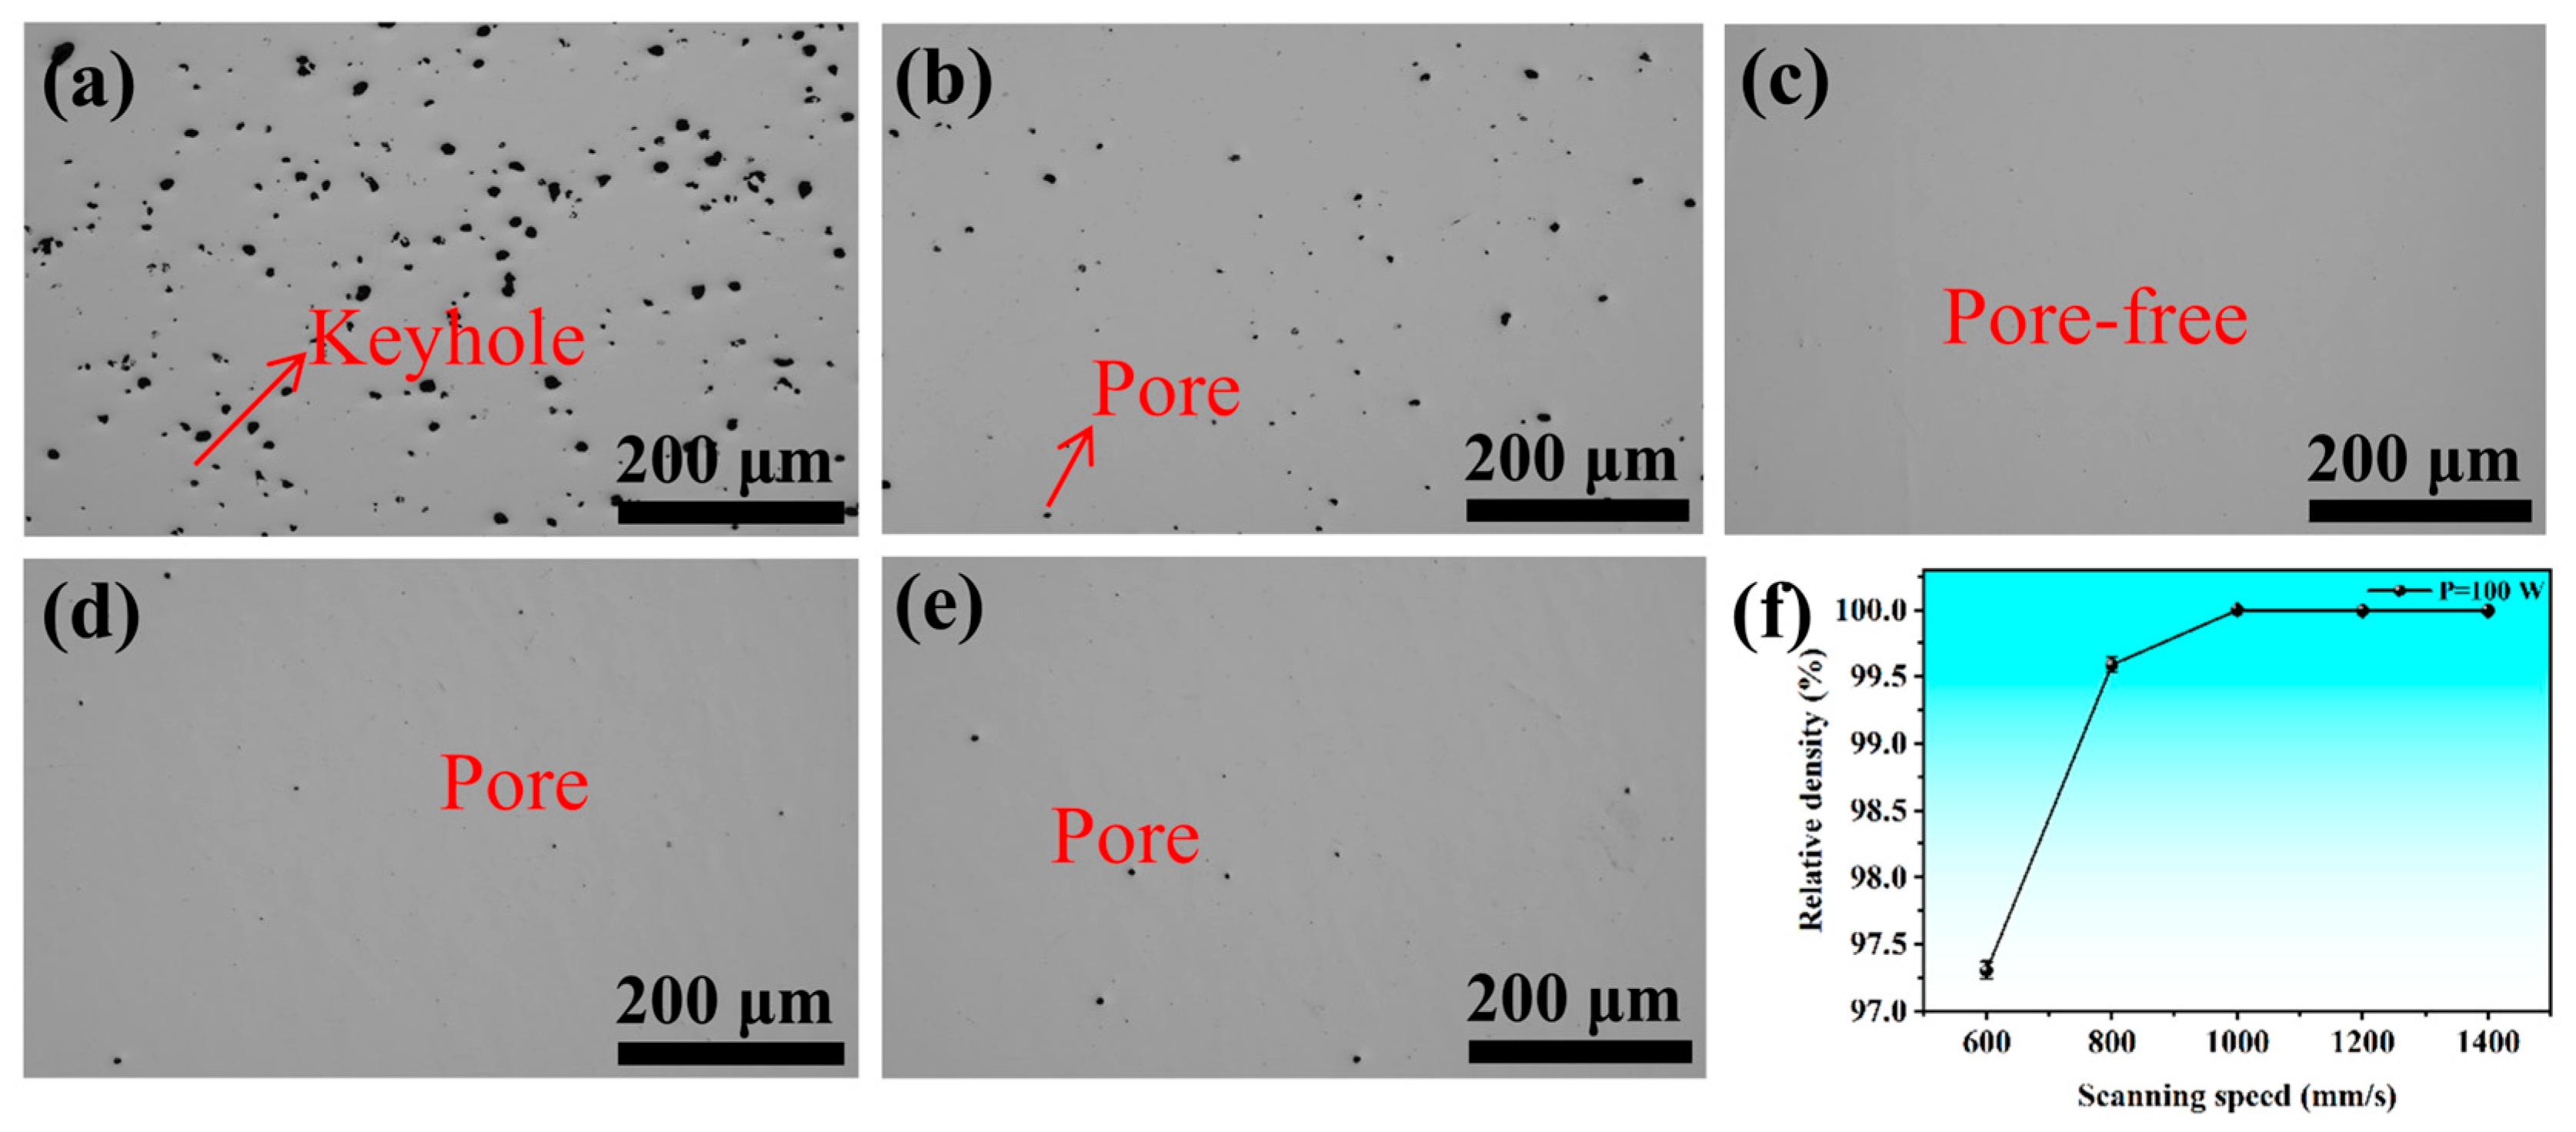
To further elucidate the influence of laser power on the densification of Ti65, experiments were conducted at a fixed scanning speed of 1000 mm/s and hatch spacing of 60 μm while incrementally increasing the laser power from 60 W to 140 W. As illustrated in Figure 9, lack-of-fusion regions dominated the surface at 60 W (Figure 9a); as shown in Figure 9b, at a laser power of 80 W, the defects transitioned from irregular lack-of-fusion pores to more spherical pores. At 100 W, the surface exhibited no defects (Figure 9c), whereas keyhole porosity reemerged at higher powers (120–140 W, Figure 9d,e). The relative density initially increased from 99.44% to 99.99% and then gradually decreased to 99.89%, peaking at 100 W (Figure 9f). This trend arises because increasing laser power enhances volumetric melting and reduces molten pool surface tension and viscosity, improving fluidity. However, excessive power induces powder spattering and keyhole instability. By maintaining a laser power of 100 W, the defect characteristics under low (600 mm/s) and high (1400 mm/s) scanning speeds were analyzed. As shown in Figure 10, at a lower scanning speed of 600 mm/s (Figure 10a), the high volumetric energy input promoted keyhole melting mode, resulting in the formation of irregular keyhole pores due to excessive energy accumulation and vapor recoil-induced melt pool instability. In contrast, at a higher scanning speed of 1400 mm/s (Figure 10e), the significantly reduced energy input led to insufficient melting of the powder, giving rise to spherical pores. Optimal densification was achieved at an intermediate scanning speed of 1000 mm/s (Figure 10c), where the energy input was balanced to ensure complete powder melting without keyhole instability. The relative density increased from 97.3% to 99.99% as the scanning speed rose from 600 mm/s to 1000 mm/s but declined to 99.91% at 1400 mm/s (Figure 10f). This behavior stems from the dual effects of energy input density: low scanning speeds prolong molten pool existence, promoting keyhole and gas entrapment, whereas excessive speeds reduce energy input, leading to incomplete fusion [44].
In summary, variations in relative density are closely linked to energy input density [45,46]. Moderate energy input ensures complete powder melting and solidification, enabling robust metallurgical bonding, while insufficient or excessive energy inputs result in lack-of-fusion defects or keyhole porosity, respectively. Through precise control of laser power (100 W), scanning speed (1000 mm/s), and hatch spacing (60 μm), high-density fabrication of Ti65 alloy (>99.99%) was achieved. This parametric mapping and defect evolution analysis provide theoretical guidance for optimizing LPBF processes to fabricate high-density Ti65 components.

3.4.2. Surface Roughness of the Sample

Surface roughness is one of the critical indicators for evaluating the quality of LPBF fabricated components, directly influencing their service performance and post-processing requirements. Building upon the optimized relative density range (>99.99%), this study systematically investigated the regulatory mechanisms of laser power (60–140 W) and scanning speed (600–1400 mm/s) on the surface morphology of Ti65 alloy. The evolution of the side surface roughness under different process parameters was quantitatively characterized using the arithmetic average roughness (Ra) and maximum profile height (Rz). The measurements were performed with a traverse length of 6 mm, employing a cutoff wavelength of 1.2 μm to accurately assess the surface topography.
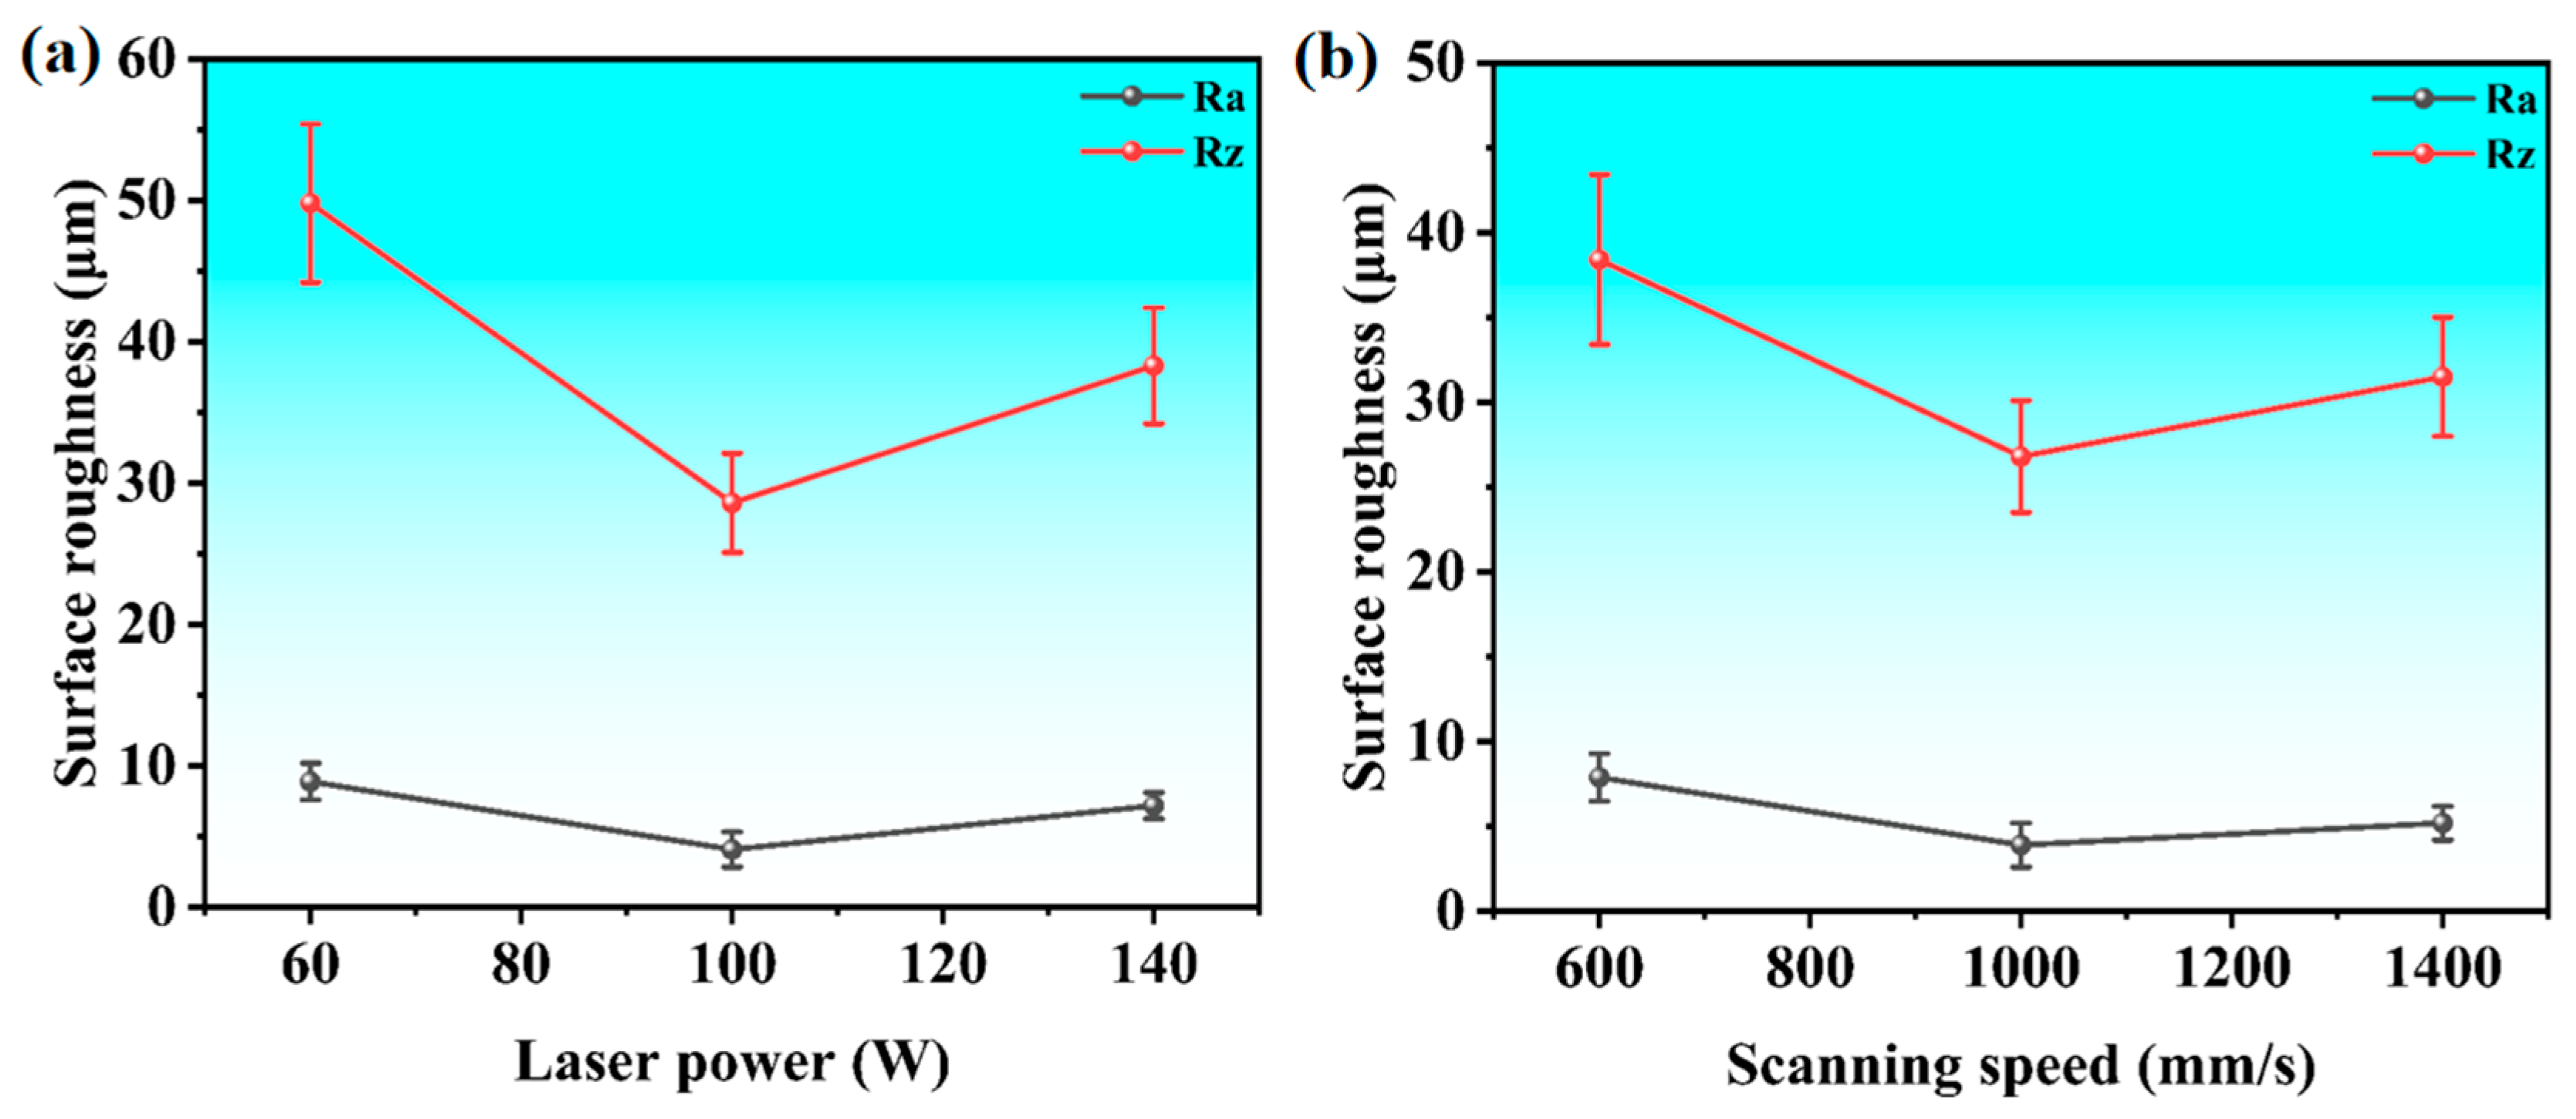
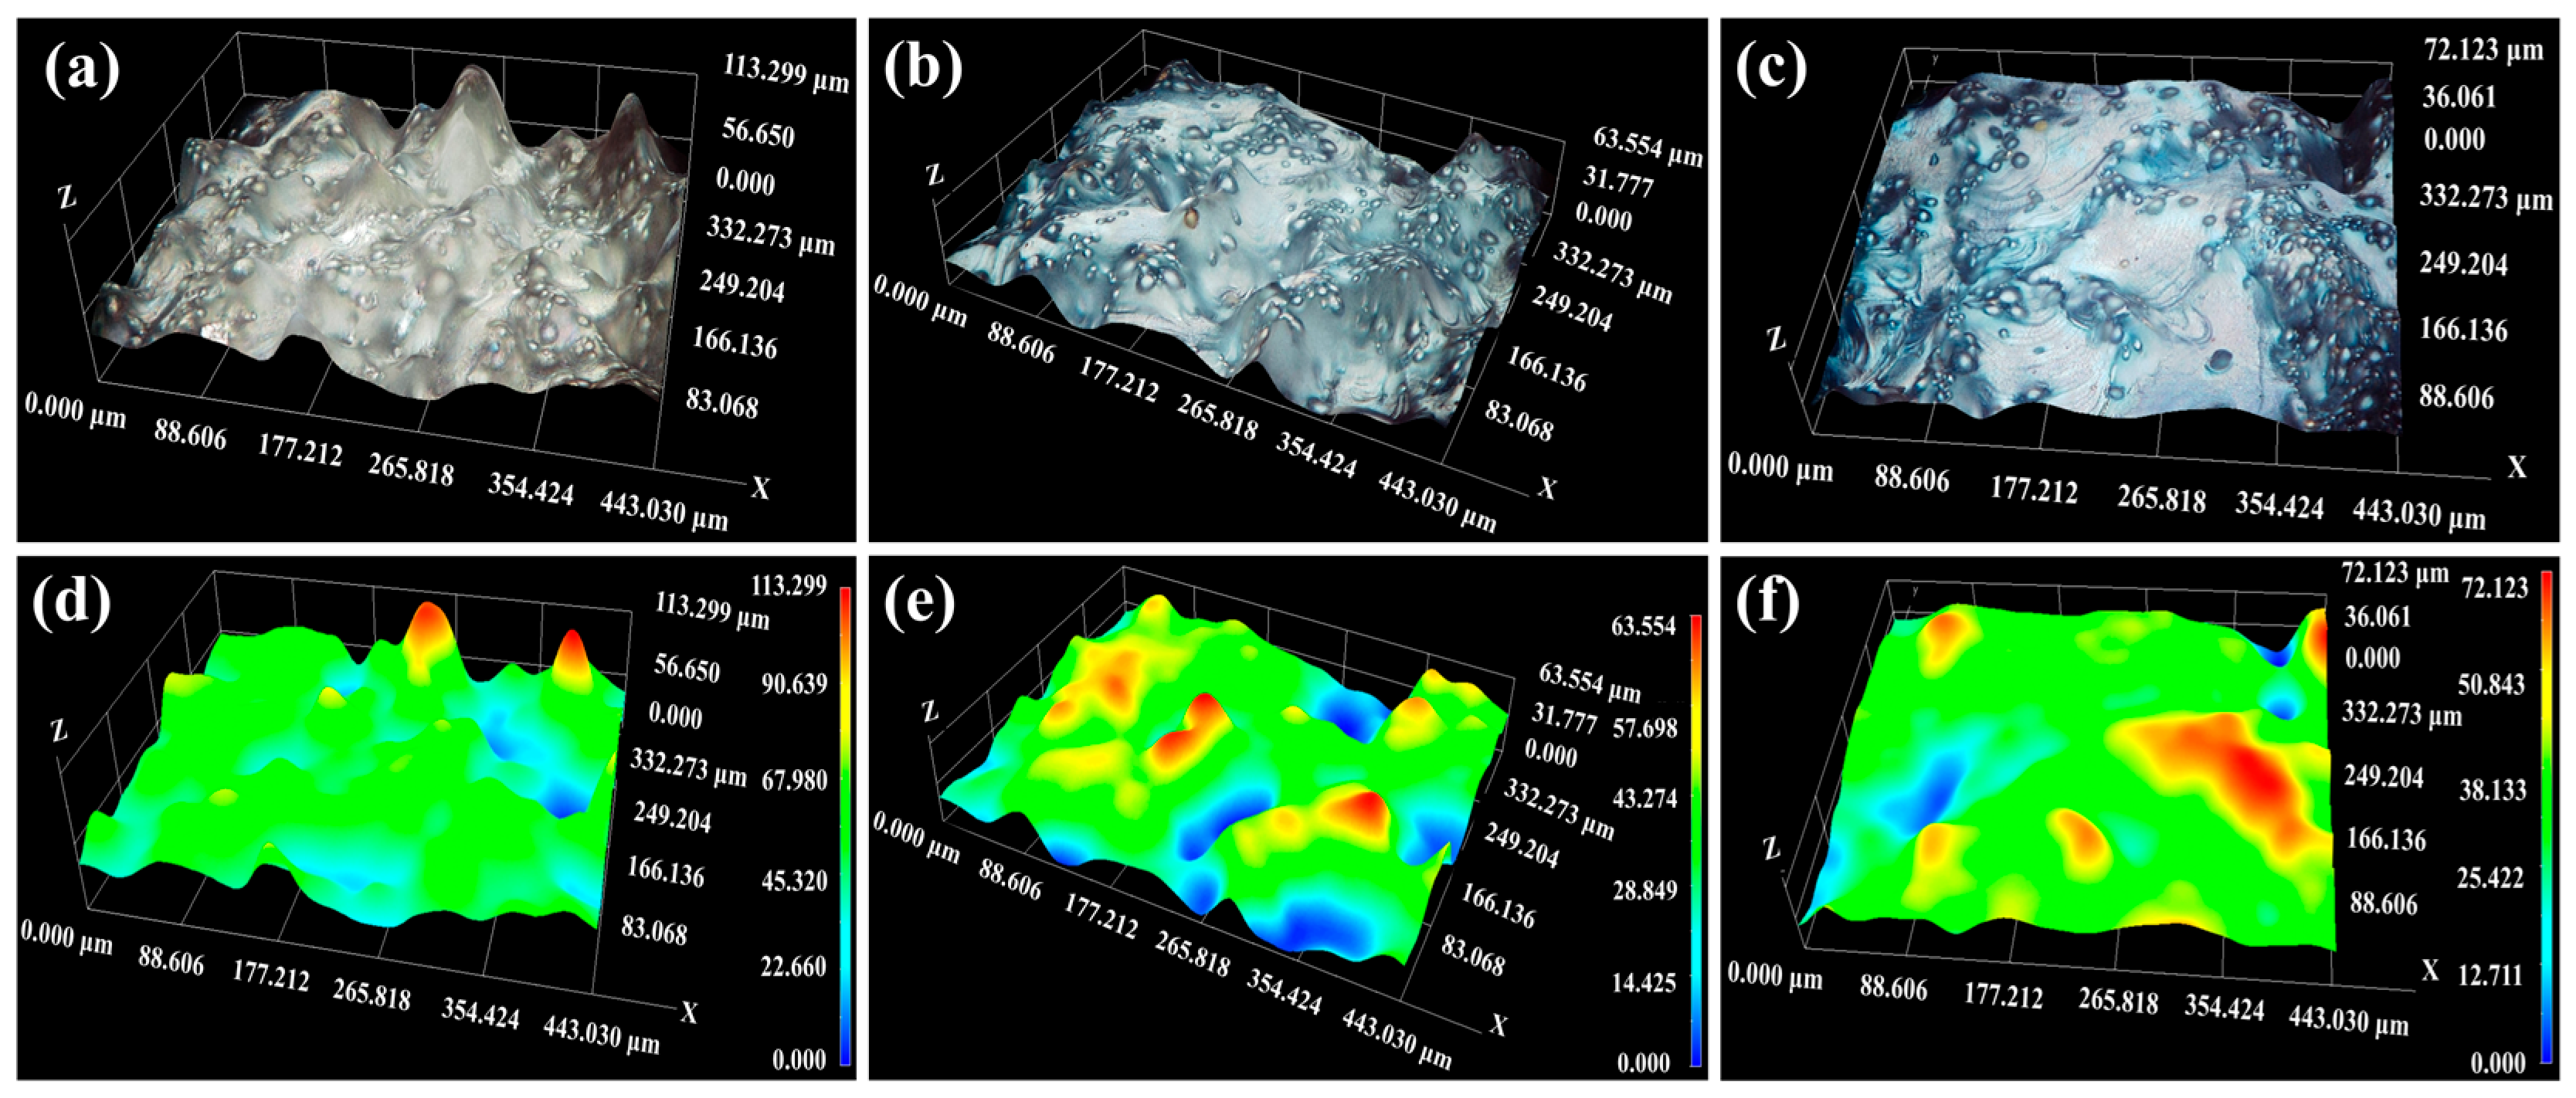
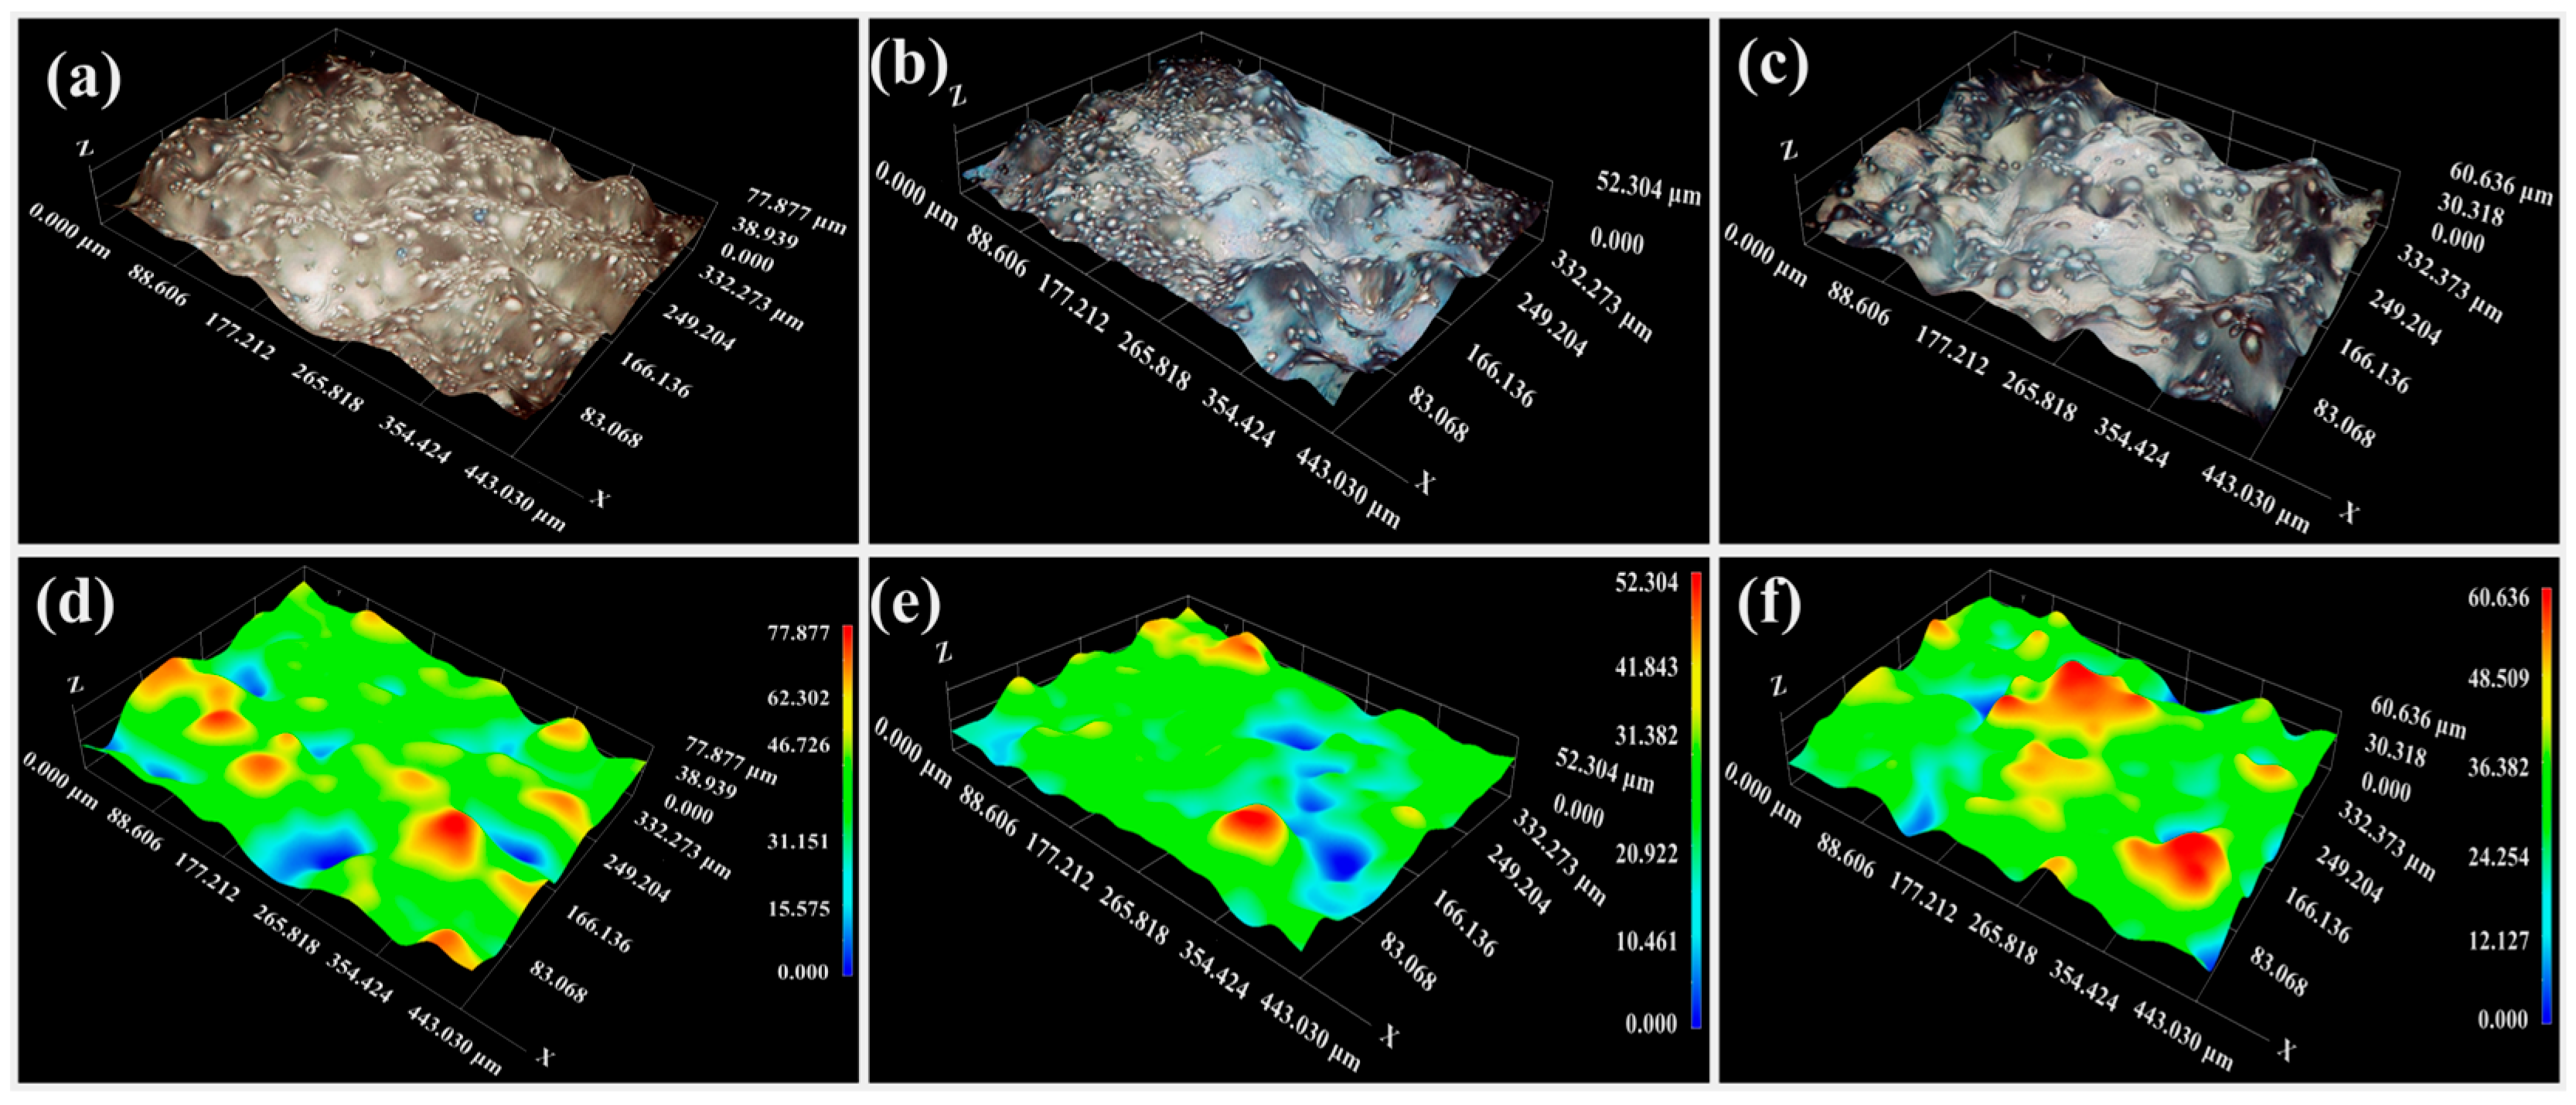
Under fixed parameters of scanning speed (1000 mm/s), hatch spacing (60 μm), the influence of laser power on surface roughness were investigated (Figure 11a). As the laser power increased from 60 W to 100 W, the Ra value sharply decreased from 8.9 ± 1.3 μm to 4.1 ± 1.2 μm, and the Rz value reduced from 49.8 ± 5.6 μm to 28.6 ± 3.5 μm, indicating that moderate energy input significantly improved track continuity (Figure 12b,e). Three-dimensional topography of the surface (Figure 12a,d) revealed that at a low power of 60 W, the tracks exhibited discrete sintering features with densely distributed lack-of-fusion powder and spheroidization defects, attributed to insufficient energy density-induced deterioration of molten pool wettability. When the power increased to 140 W, the Ra and Rz values rebounded to 7.2 ± 0.9 μm and 38.3 ± 4.1 μm, respectively (Figure 12c,f). The enlarged molten pool surface area and intensified turbulence of the liquid metal under high power exacerbated powder adhesion effects, while prolonged solidification time led to irregular expansion of track boundaries, thereby degrading surface flatness. This phenomenon corroborates the nonlinear coupling mechanism between energy density and molten pool dynamics: although increased power enhances penetration, excessive energy input destabilizes the surface tension-inertia force equilibrium, inducing molten pool instability. At a fixed laser power of 100 W, the surface roughness displayed a “V-shaped” distribution as the scanning speed increased (Figure 11b). As the speed changed from 600 mm/s to 1000 mm/s, the Ra value decreased from 7.9 ± 1.4 μm to 3.9 ± 1.3 μm, and the Rz value declined from 38.4 ± 4.9 μm to 26.8 ± 3.3 μm (Figure 13b,e). At low speed (600 mm/s), prolonged molten pool existence caused remelting and accumulation of overmelted metal droplets (Figure 13a,d), forming localized convex-concave structures. Conversely, at high speed (1400 mm/s), the abrupt reduction in energy density caused the molten pool cooling rate to exceed the critical threshold, disrupting track continuity (Figure 13c,f) and increasing surface roughness to Ra = 5.2 ± 1.1 μm. Notably, the inverse relationship between laser power and scanning speed highlights the dual-threshold sensitivity of surface roughness to energy input. The surface roughness of Ti65 alloy is synergistically controlled by laser power and scanning speed, with extremum points corresponding to the dynamic equilibrium between energy density thresholds and molten pool stability. Moderate energy input ensures complete melting and uniform spreading of metal powder, forming a smooth surface. In contrast, insufficient or excessive energy inputs result in lack-of-fusion defects or overmelting, respectively, thereby increasing surface roughness.

3.5. Microstructural Analysis

In the LPBF fabrication of Ti65 high-temperature alloy, process parameters play a decisive role in the formation and evolution of microstructures. As illustrated in Figure 14, systematic analysis of the synergistic effects of laser power (60–140 W) and scanning speed (600–1400 mm/s) elucidates the regulatory mechanisms of energy input on molten pool thermodynamics and solidification behavior, thereby clarifying the formation principles of microstructural characteristics.
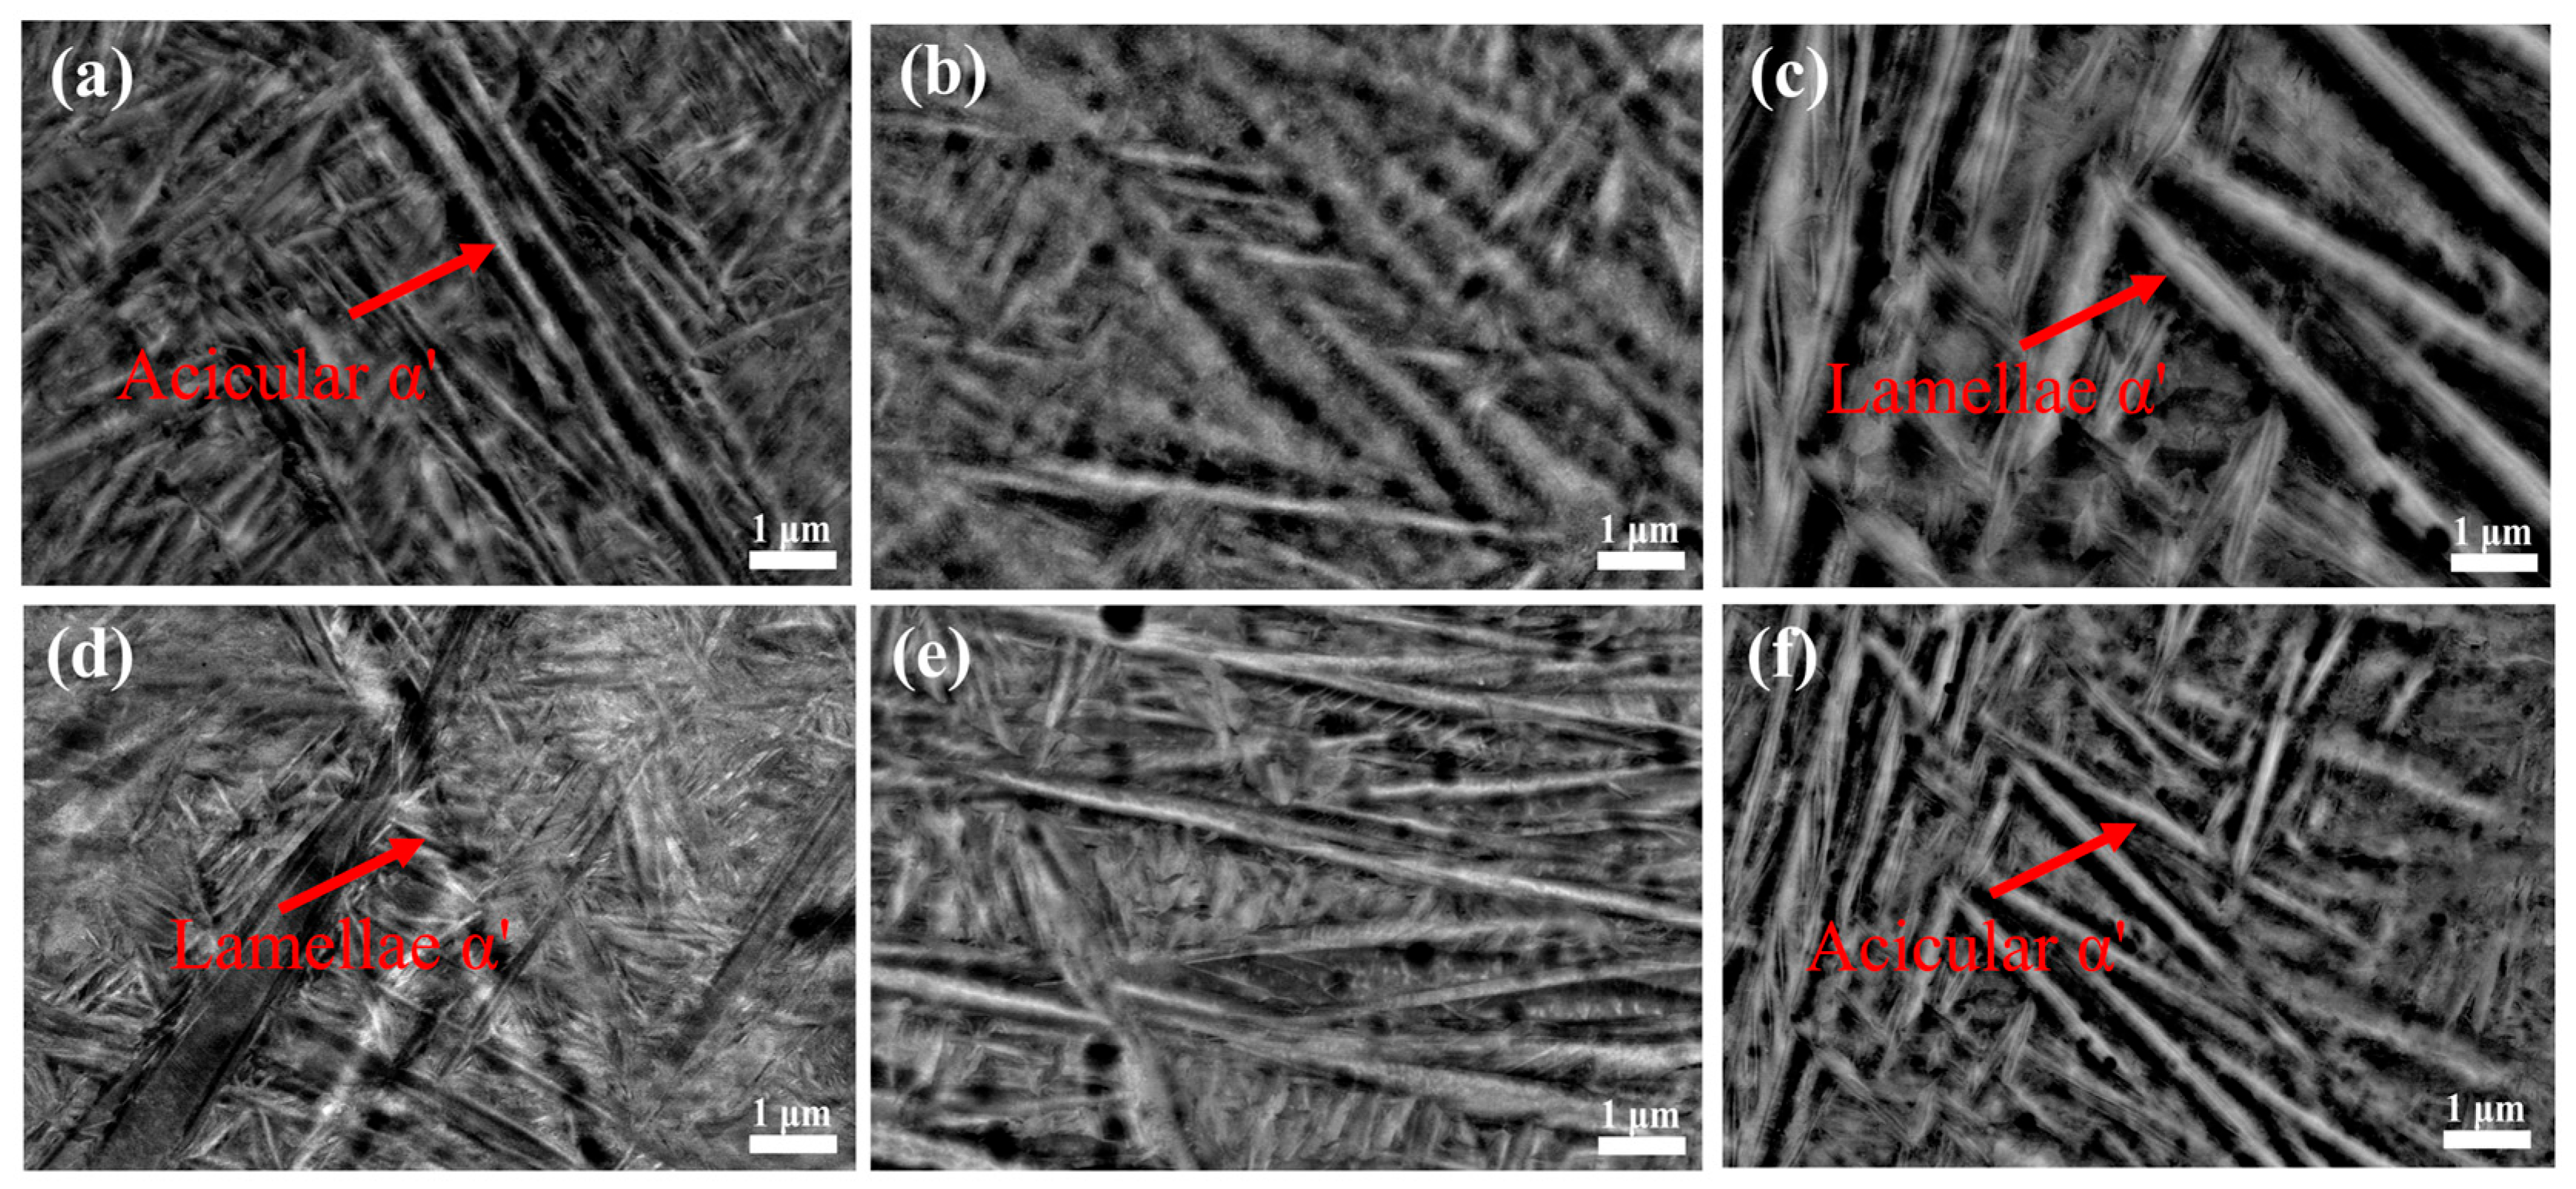
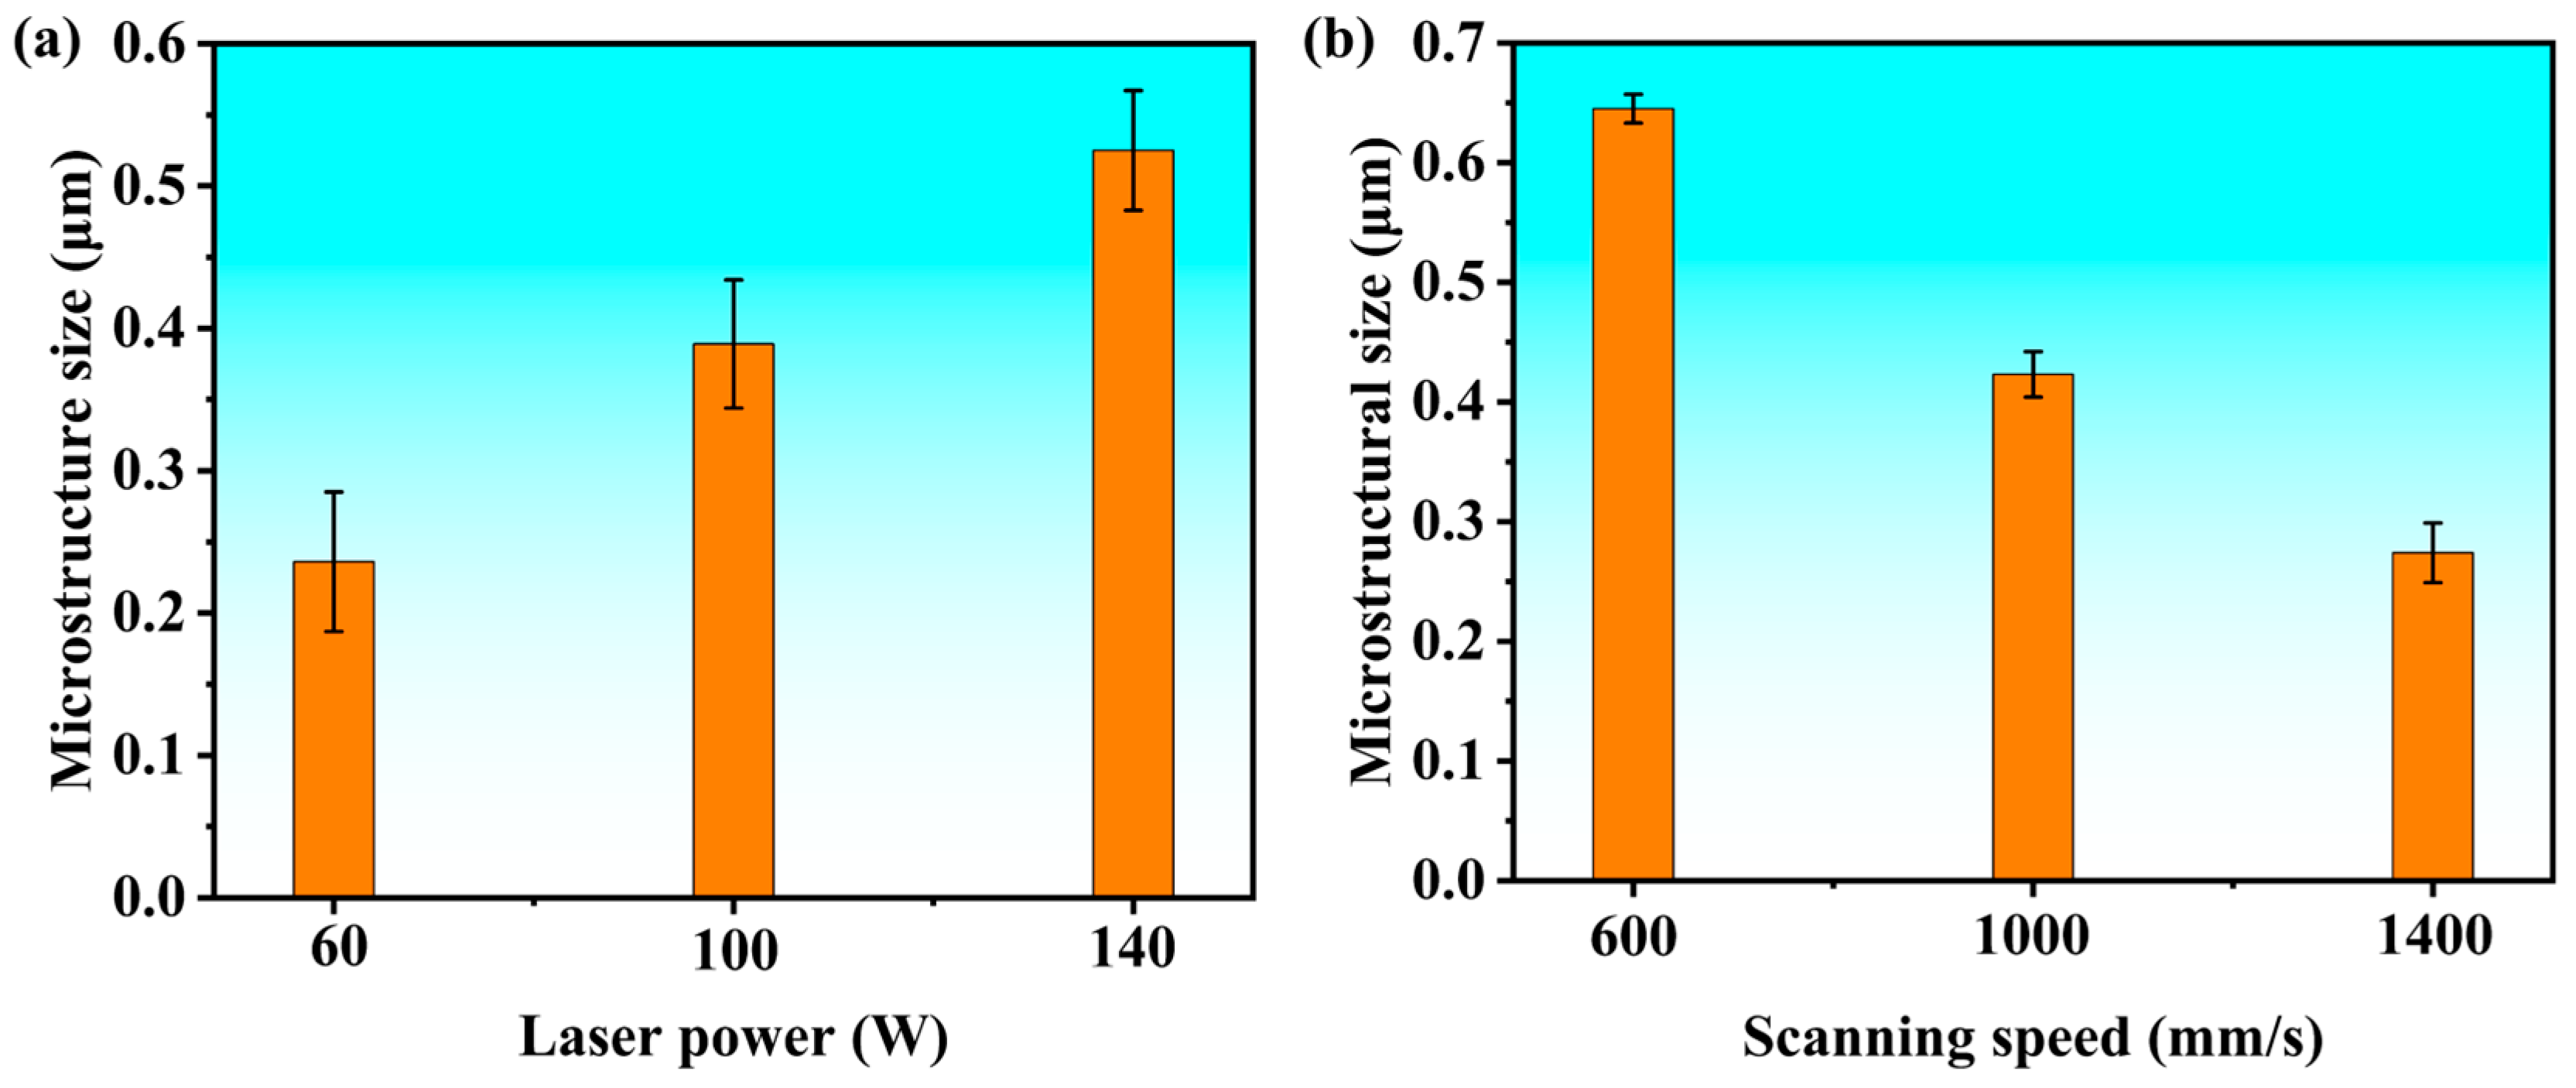
Under fixed scanning speed (1000 mm/s) and hatch spacing (60 μm), the microstructure exhibited significant variations with changes in laser power. At a low laser power of 60 W (Figure 14a), the relatively low molten pool temperature and shallow penetration depth resulted in a microstructure dominated by fine acicular α′ grains. As the laser power increased to 100 W (Figure 14b), martensitic transformation occurred, yielding a hybrid microstructure comprising fine acicular α′-martensite and coarse lamellar α′-martensite. The acicular morphology originates from the non-diffusional shear transformation under high cooling rates, whereas the coarser lamellar structure is associated with the coarsening of α′ phase due to local thermal cycles within the melt pool. Further increasing the power to 140 W (Figure 14c) enlarged the dimensions of the martensitic α′-phase. Quantitative analysis of grain width, as summarized in Figure 15, revealed an increasing trend from 0.236 ± 0.049 μm at 60 W to 0.525 ± 0.042 μm at 140 W. This phenomenon is attributed to the limited energy input at lower power, which promotes the formation of distinct grain boundaries. In contrast, higher power elevates molten pool temperature and penetration depth, enabling remelting of fine grains and their subsequent coarsening. At a fixed laser power of 100 W and hatch spacing of 60 μm, variations in scanning speed also exerted pronounced effects on the microstructure, as further illustrated in Figure 15. At a low scanning speed of 600 mm/s (Figure 14d), the relatively high energy input facilitated the formation of coarse α′-phase with a width of 0.645 ± 0.012 μm. Conversely, increasing the scanning speed to 1400 mm/s (Figure 14f) refined the microstructure, yielding slender acicular α′-phase grains with reduced widths (0.274 ± 0.025 μm). Fundamentally, lower laser power or higher scanning speeds reduce energy density, accelerating cooling rates. This rapid cooling promotes the nucleation of fine acicular α′-phase clusters along grain boundaries, constrained by boundary interactions [32]. Conversely, higher laser power or lower scanning speeds prolong the cooling period from the β-phase to the α′ + β two-phase region, allowing dislocations and defects within grains to act as high-energy sites for the growth of coarse lamellar α′-phase. In summary, energy input density governs the microstructural characteristics of LPBF-fabricated Ti65 alloy. By precisely controlling laser power and scanning speed, the morphology and dimensions of grains can be effectively tailored, enabling optimization of material performance while maintaining high densification.
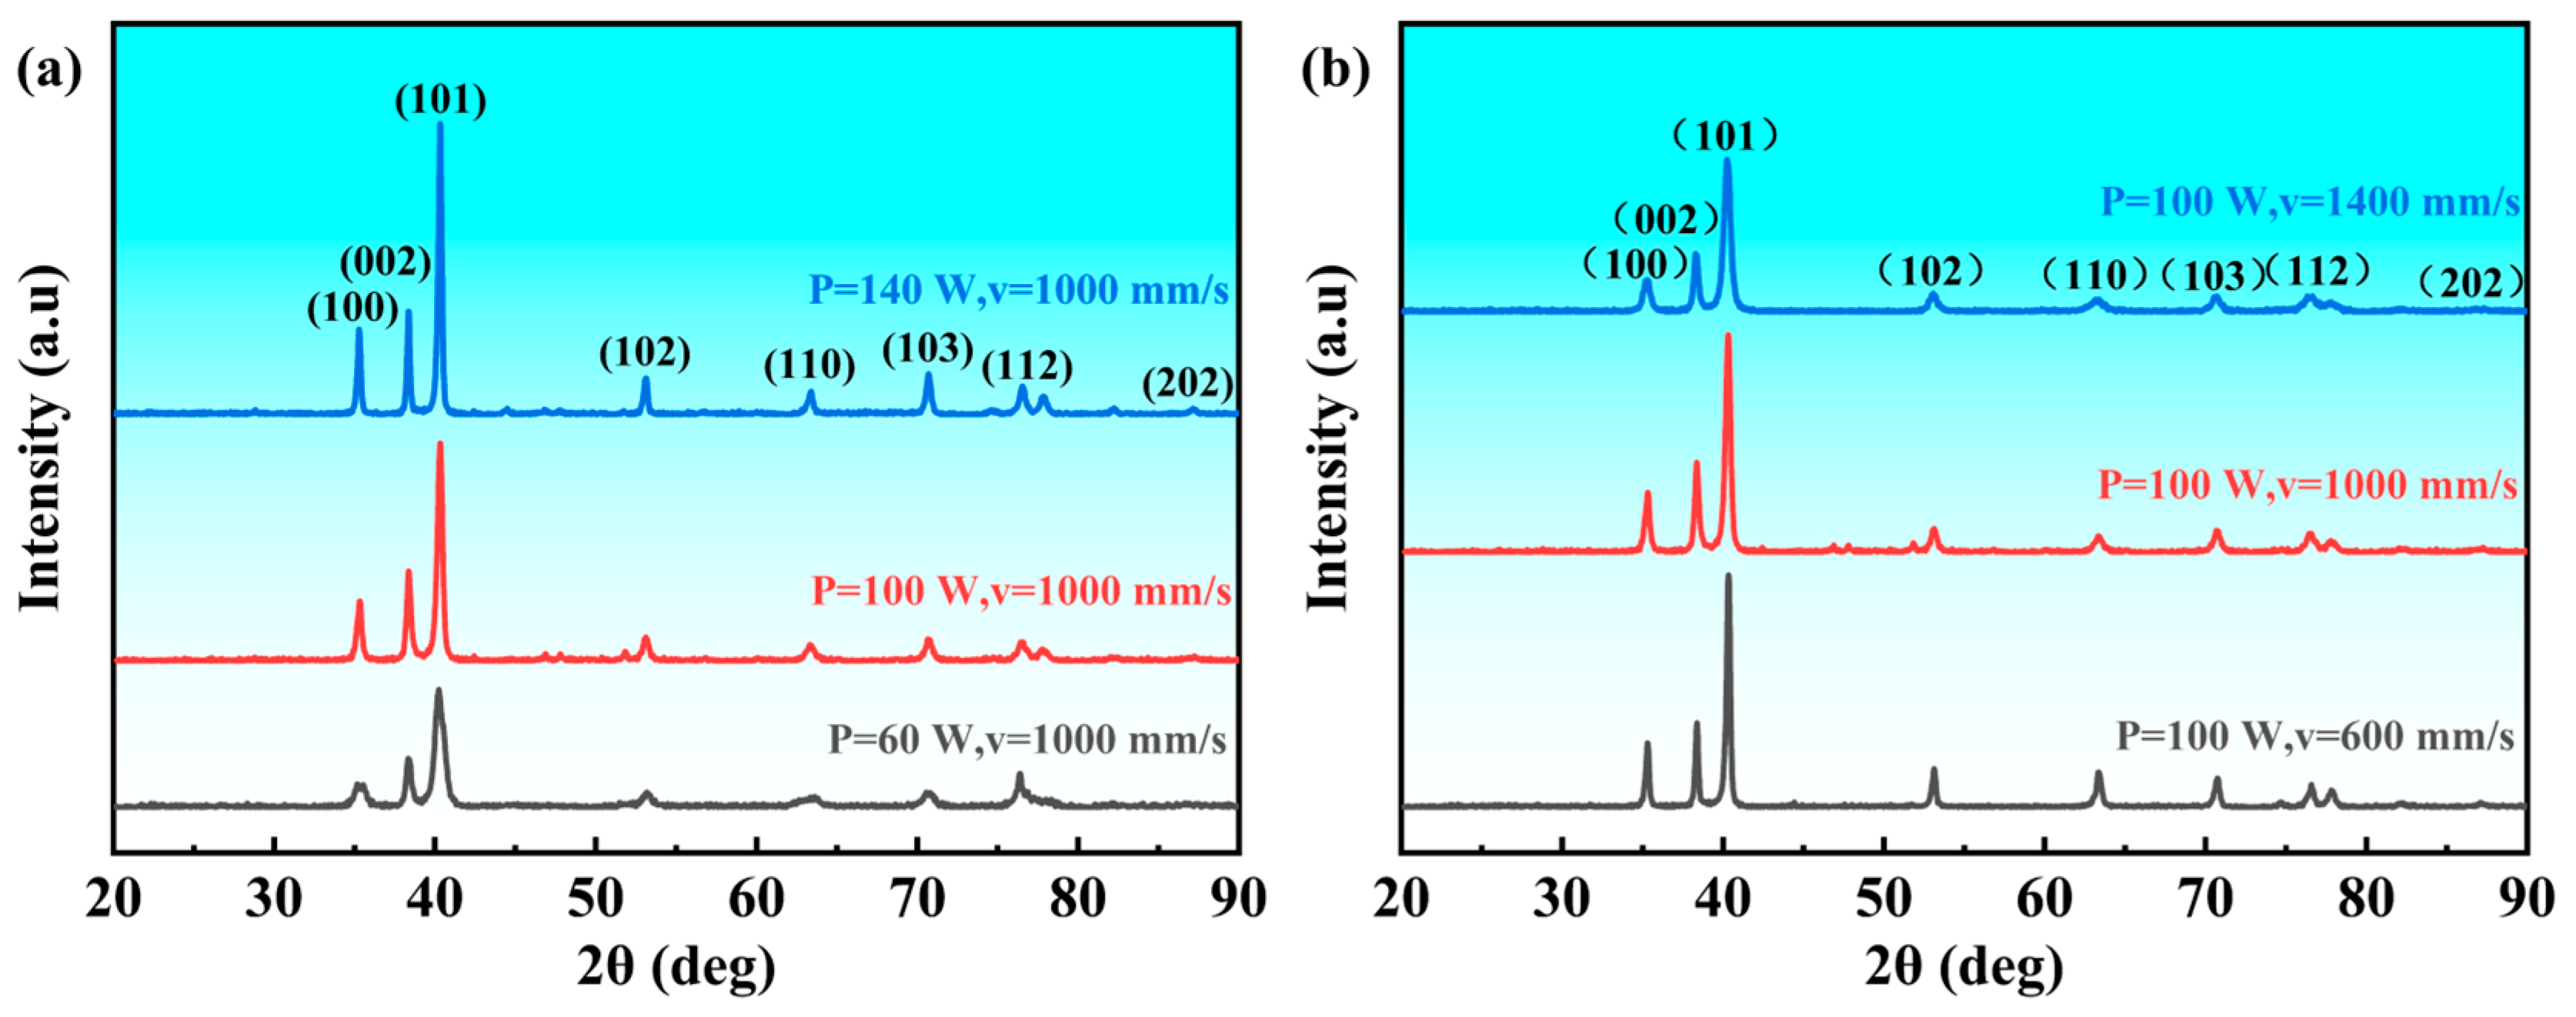
Figure 16 presents the XRD patterns of LPBF-processed Ti65 alloy under varying laser powers and scanning speeds. In Figure 16a, the XRD spectra under different laser powers (60 W, 100 W, and 140 W) at a fixed scanning speed of 1000 mm/s consistently exhibit dominant peaks corresponding to the α′-martensite phase, confirming the prevalence of martensitic transformation due to rapid cooling inherent to LPBF. As the laser power increases, a slight shift in peak positions and variations in relative intensities are observed, indicative of changes in lattice strain and preferred orientation. Notably, the absence of β-phase peaks suggests complete transformation to α′, consistent with the high cooling rates. In Figure 16b, the influence of scanning speed (600 mm/s, 1000 mm/s, and 1400 mm/s) at a fixed laser power of 100 W is illustrated. Higher scanning speeds result in broader and less intense α′ peaks, reflecting finer grain size and increased microstrain associated with accelerated cooling. Conversely, lower scanning speeds lead to sharper peaks, implying coarser microstructures and reduced residual stress.

3.6. Mechanical Performance

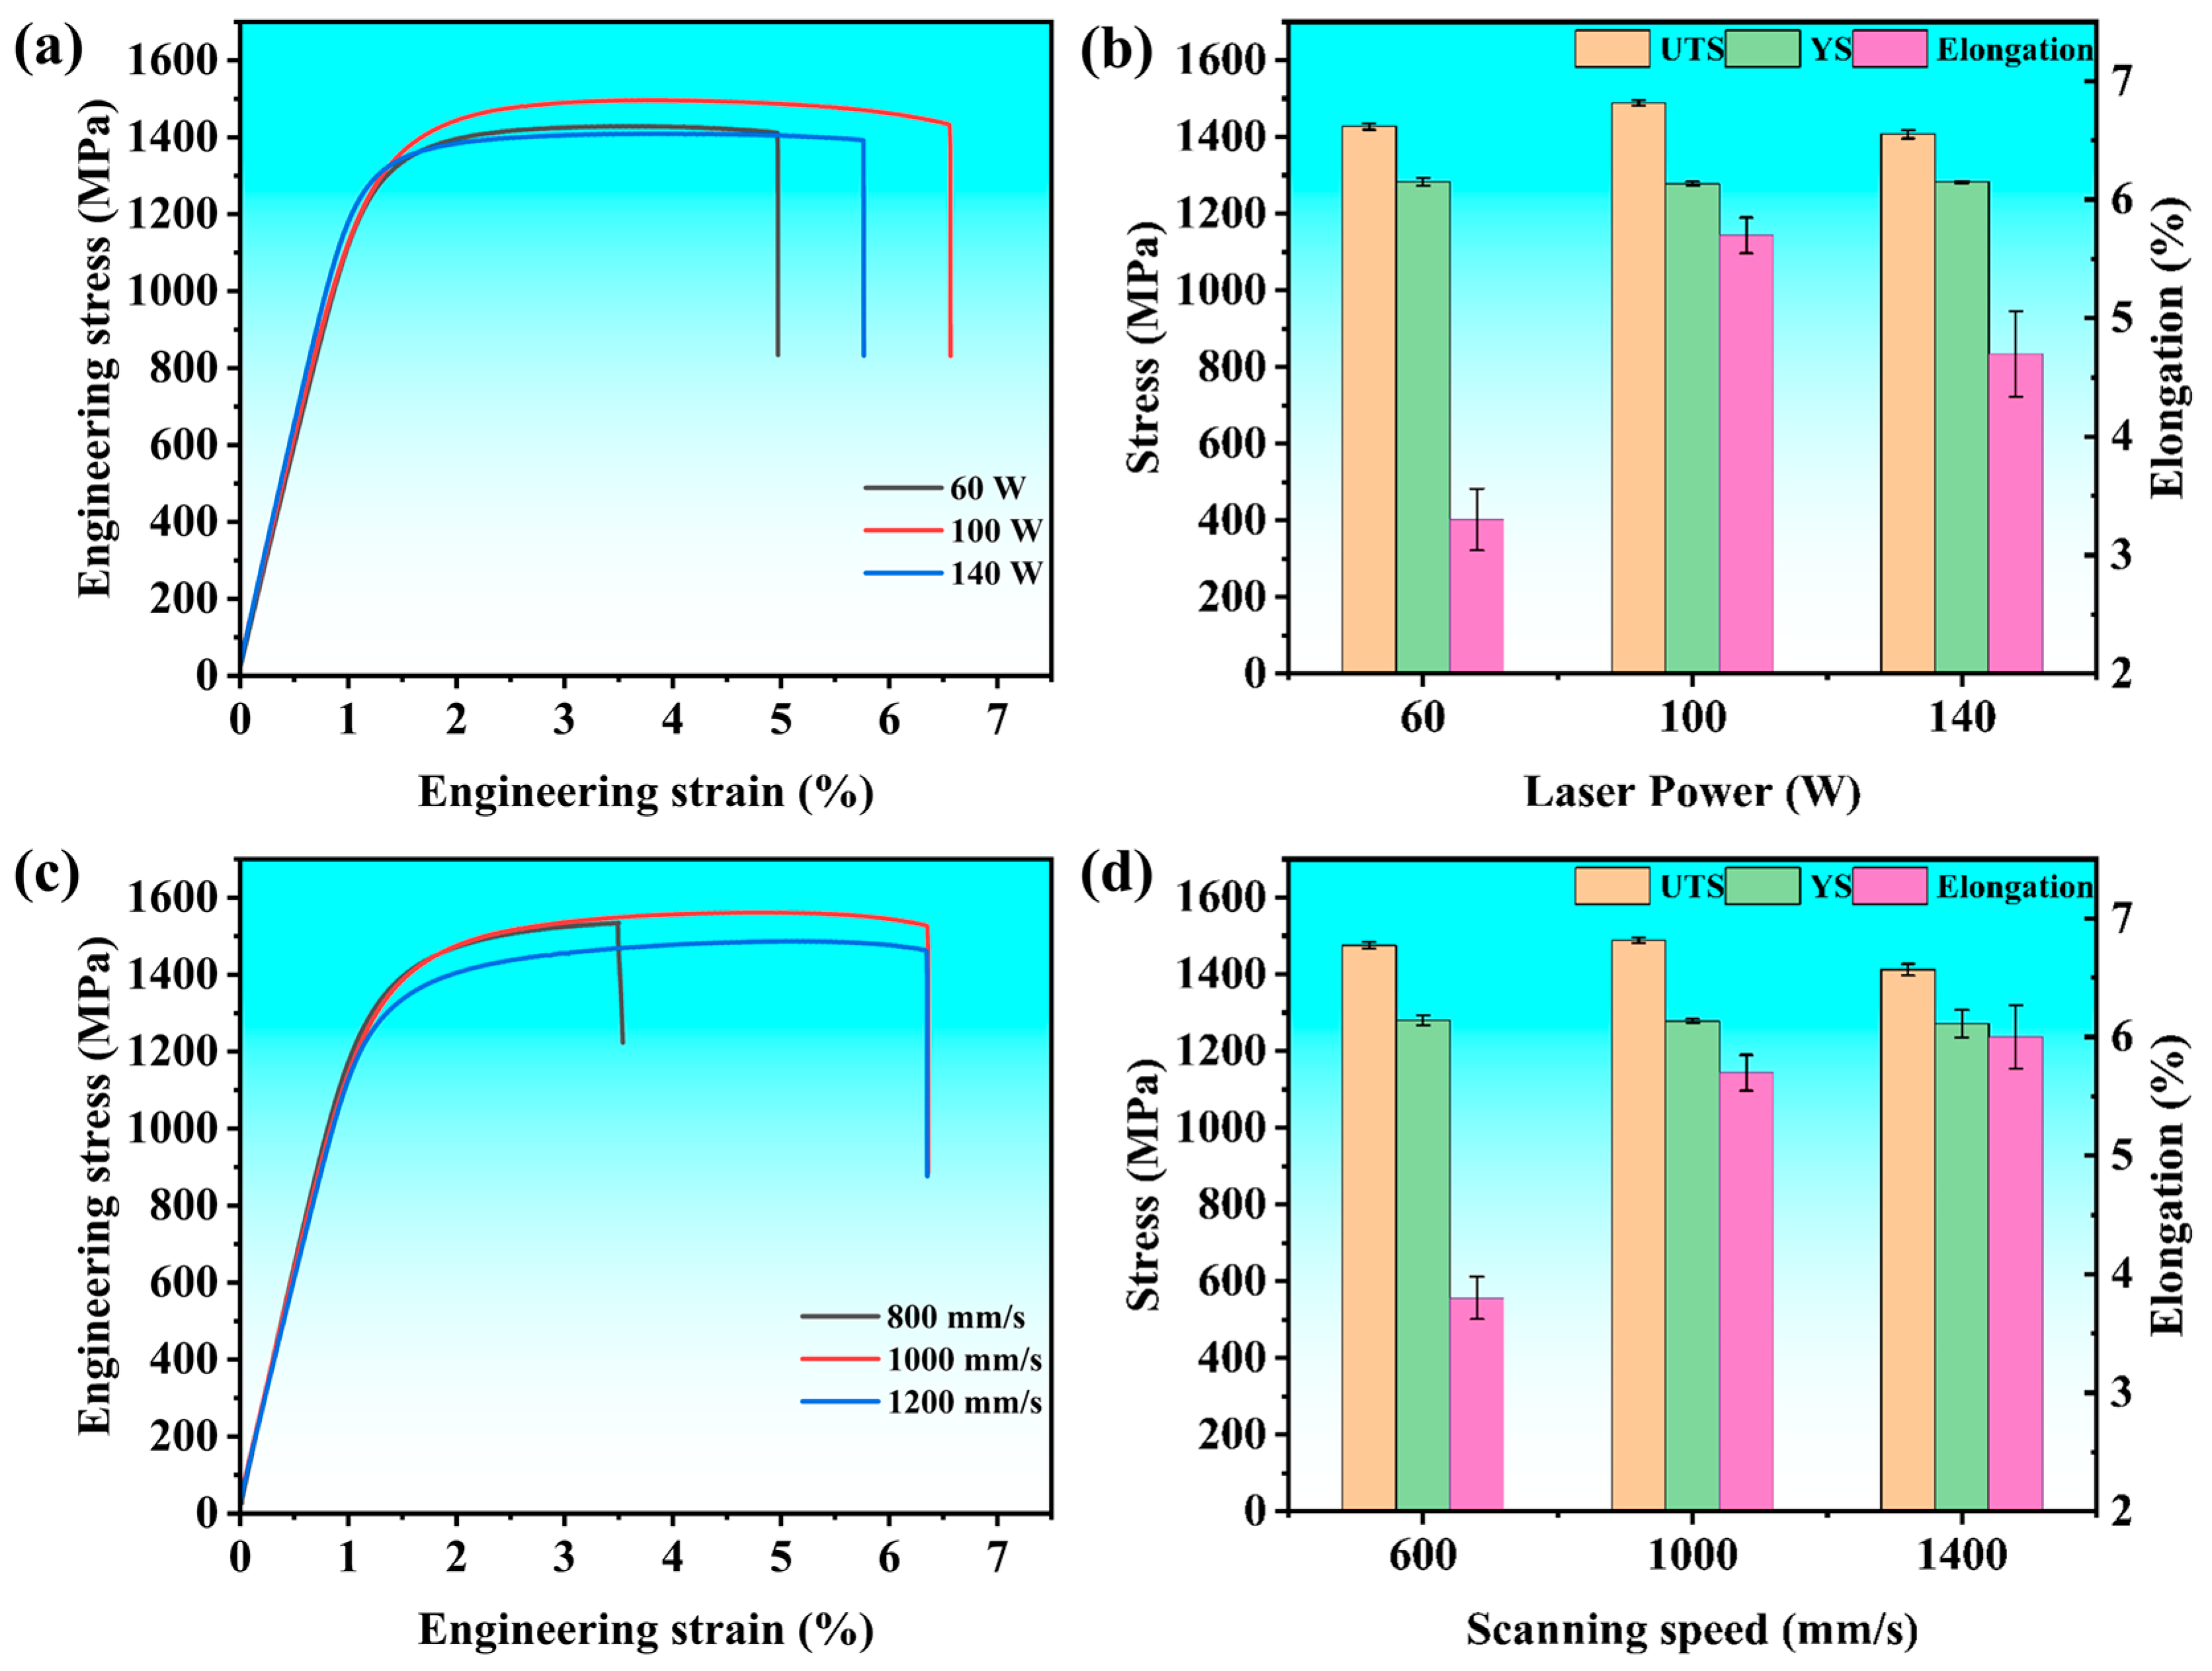
Figure 17 illustrates the engineering stress–strain curves of Ti65 alloy specimens fabricated under different process parameter combinations, and Table 2 summarizes the corresponding mechanical property data. A comprehensive analysis of Figure 17 and Table 2 reveals a significant correlation between the mechanical properties of LPBF processed Ti65 alloy and the applied process parameters, particularly in terms of ultimate tensile strength (UTS), yield strength (YS), elongation, and microhardness. As listed in Table 2, under the optimized parameters (laser power: 100 W, scanning speed: 1000 mm/s), the specimen exhibits superior mechanical properties with a UTS of 1489 ± 7.5 MPa, YS of 1278 ± 5.2 MPa, and elongation of 5.7 ± 0.15%. These excellent properties are attributed to the nearly full densification (>99.99%) and the refined mixed microstructure comprising both fine acicular and coarse lamellar α′-martensite, which collectively enhance strength and accommodate plastic deformation. In contrast, at a lower laser power of 60 W (scanning speed: 1000 mm/s), the UTS and YS decrease to 1427 ± 8.1 MPa and 1283 ± 10.4 MPa, respectively, while the elongation drops to 3.3 ± 0.26%. The degraded performance is correlated with the presence of lack-of-fusion defects and a finer acicular α′ microstructure, which, despite its intrinsic strength, is compromised by porosity acting as stress concentrators, leading to premature failure.
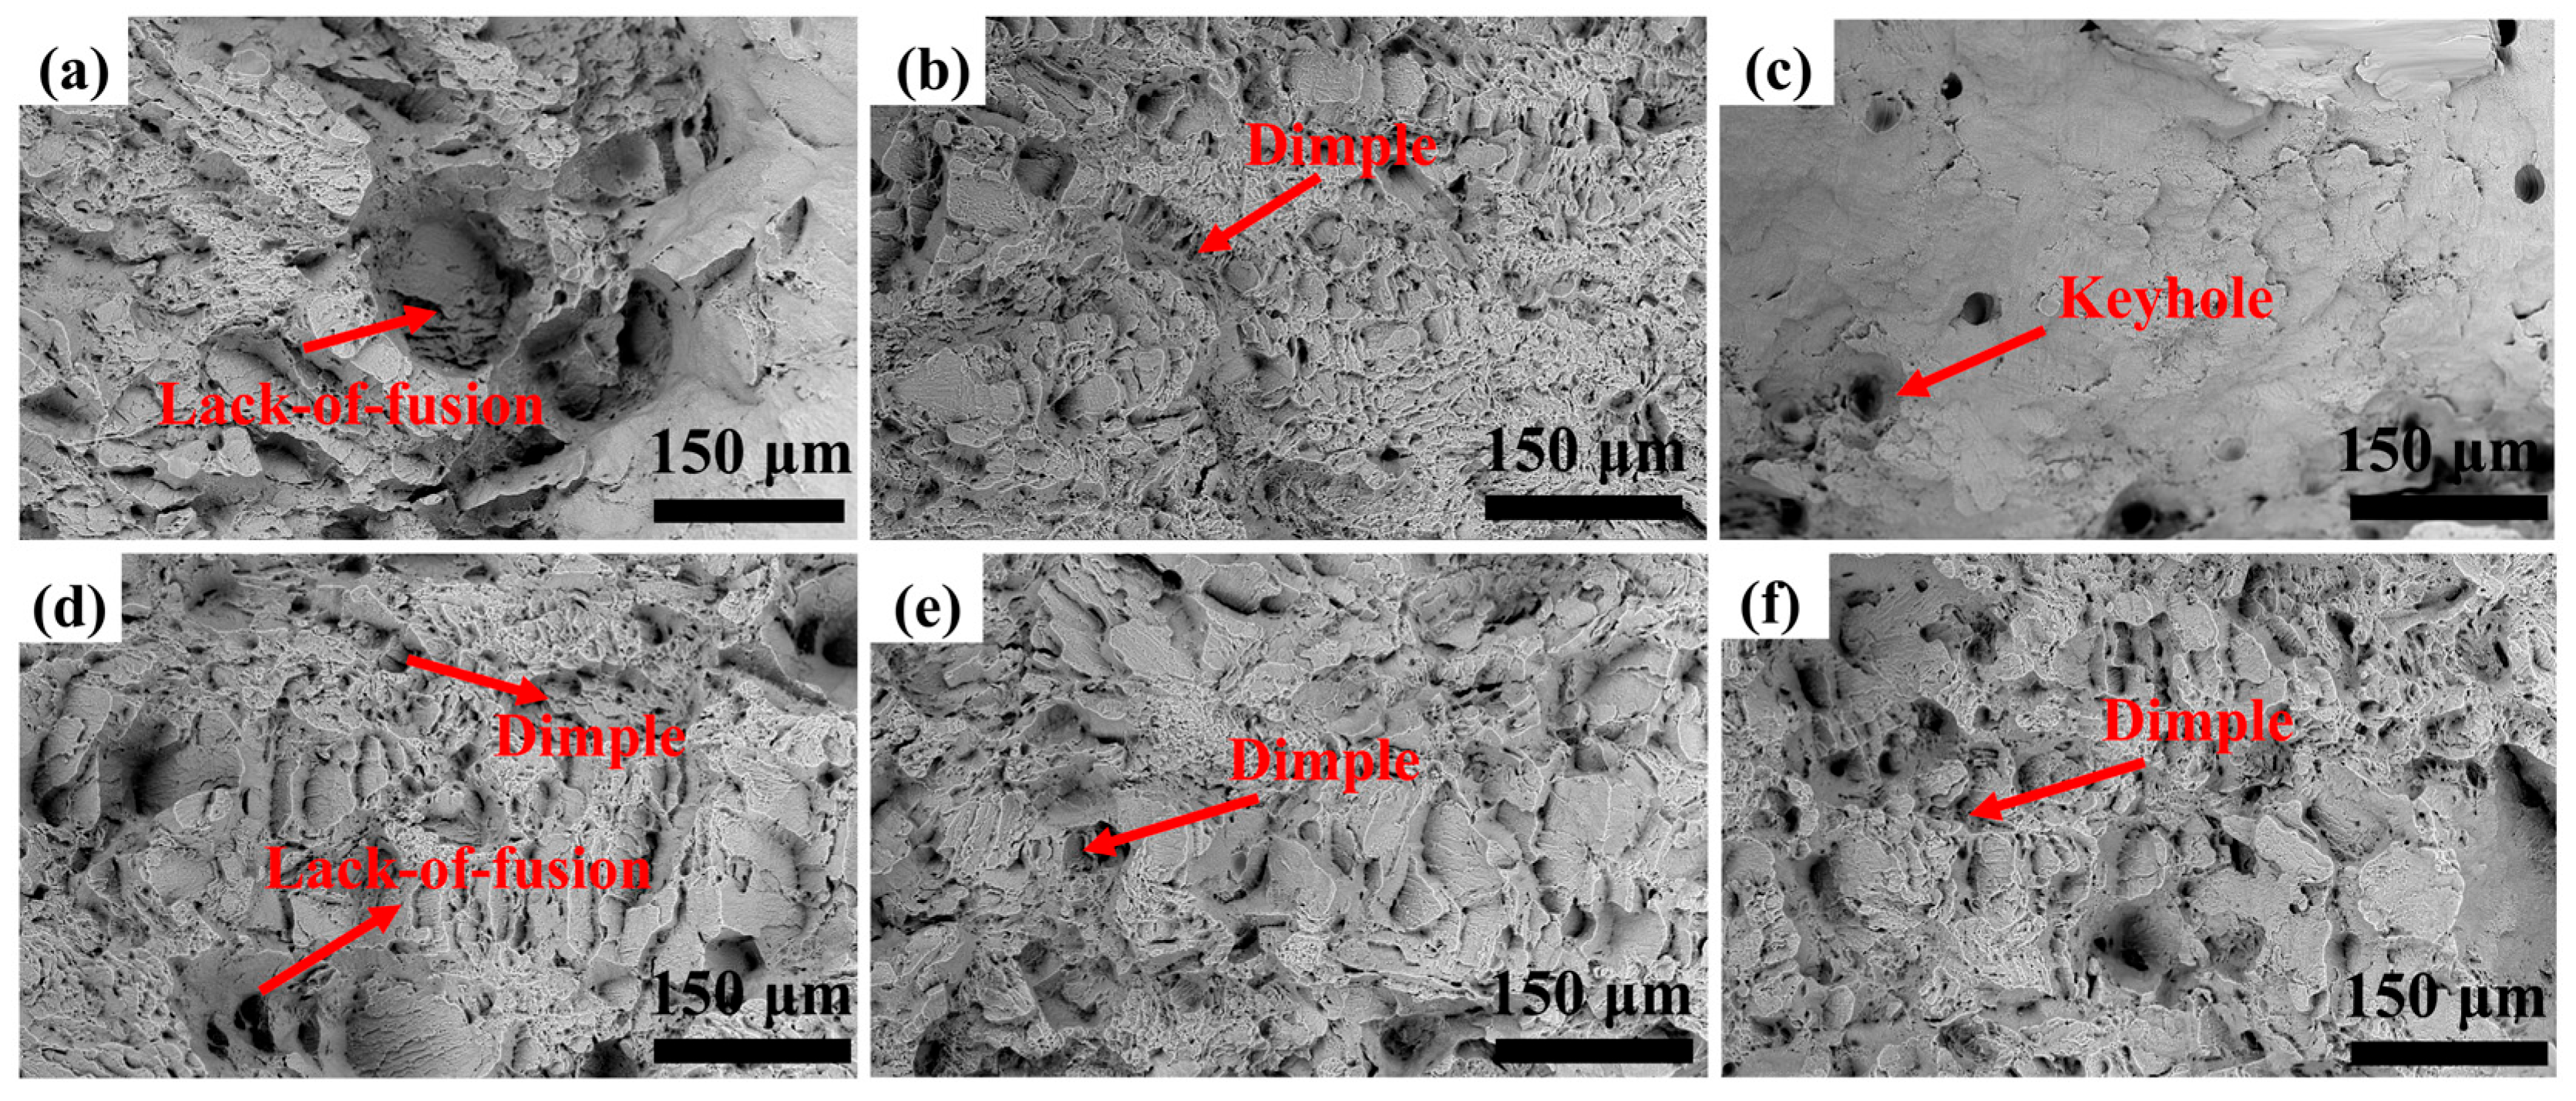
When the laser power increases to 140 W (scanning speed: 1000 mm/s), the UTS further declines to 1407 ± 11.1 MPa, accompanied by a reduced elongation of 4.7 ± 0.36%. This decline is associated with keyhole porosity and coarsened α′-martensite resulting from excessive energy input which reduces the effective load-bearing area and facilitates crack propagation. The fracture morphologies in Figure 18 provide further insights into deformation and failure mechanisms. For specimens fabricated at 60 W (Figure 18a), the fracture surface displays numerous lack-of-fusion regions, where cracks propagate along defect interfaces, exhibiting quasi-cleavage fracture characteristics. This correlates with the low elongation observed in tensile tests. In contrast, specimens processed under optimal parameters (100 W, 1000 mm/s) exhibit densely distributed dimples (Figure 18b), indicative of ductile fracture via microvoid coalescence, which aligns with their high elongation and uniform microstructure. However, at 140 W (Figure 18c), fine keyhole pores act as crack initiation sites, accelerating fracture and reducing ductility [47]. Scanning speed also exerts a notable influence: At 600 mm/s (Figure 18d), the fracture surface exhibits a mixed morphology of lack-of-fusion regions and dimples, suggesting a transition between brittle and ductile failure modes. As the speed increases to 1400 mm/s (Figure 18f), the dimple density rises, reflecting enhanced ductility due to refined grain structures.
Microhardness is closely linked to microstructural characteristics. The refined acicular α′-phase and lamellar α′-martensite effectively hinder dislocation motion, thereby enhancing hardness [48]. Specimens with low energy input (60 W, 1400 mm/s) exhibit the lowest hardness (400.1 ± 6.1 HV0.2), attributed to stress concentration at lack-of-fusion defects. Conversely, specimens with excessive energy input (140 W, 600 mm/s) show reduced hardness (427.8 ± 2.2 HV0.2) due to coarsened lamellar α′-martensite and keyhole defects. The peak hardness (446.7 ± 1.7 HV0.2) is achieved under optimized parameters (100 W, 1000 mm/s), where fine-grained strengthening and high densification synergistically enhance mechanical properties. These findings underscore the critical role of energy density thresholds in balancing defect suppression, microstructural refinement, and mechanical performance optimization.

4. Discussion

4.1. Microstructural Evolution and Controlling Mechanisms

The microstructure of LPBF-fabricated Ti65 alloy is predominantly governed by the transient thermal cycles and rapid solidification inherent to the process. Under optimized parameters, the interplay of sufficient energy input and high cooling rates promotes the formation of fine acicular α′-martensite, a non-equilibrium phase resulting from substantial undercooling and diffusion-limited transformation. To quantitatively assess microstructural evolution, the Williamson–Hall (W-H) analysis was performed using the relationship expressed in Equation (1) [49]. As summarized in Table 3, increasing laser power from 60 W to 140 W (at 1000 mm/s) coarsens crystallites from 28.3 nm to 45.1 nm while reducing microstrain from 5.11 × 10⁻³ to 3.21 × 10⁻³, consistent with α′ martensite coarsening observed in Figure 14. Conversely, elevating scanning speed from 600 mm/s to 1400 mm/s (at 100 W) refines crystallites to 32.5 nm but increases microstrain to 5.28 × 10⁻³, indicative of defect retention under rapid solidification. These trends, further reflected in the XRD peak broadening shown in Figure 16, volumetric energy density governs microstructural evolution: high energy input (high P, low V) promotes defect annihilation and grain coarsening, whereas low energy input (low P, high V) retains lattice defects through rapid solidification.
β cos θ = K λ / D + 4 ε sin ( θ )
where β represents the full width at half maximum, θ the Bragg angle, K the shape factor (0.9), λ the X-ray wavelength (Cu Kα, 0.15406 nm), D the crystallite size, and ε the microstrain.

4.2. Mechanical Performance and Comparative Analysis

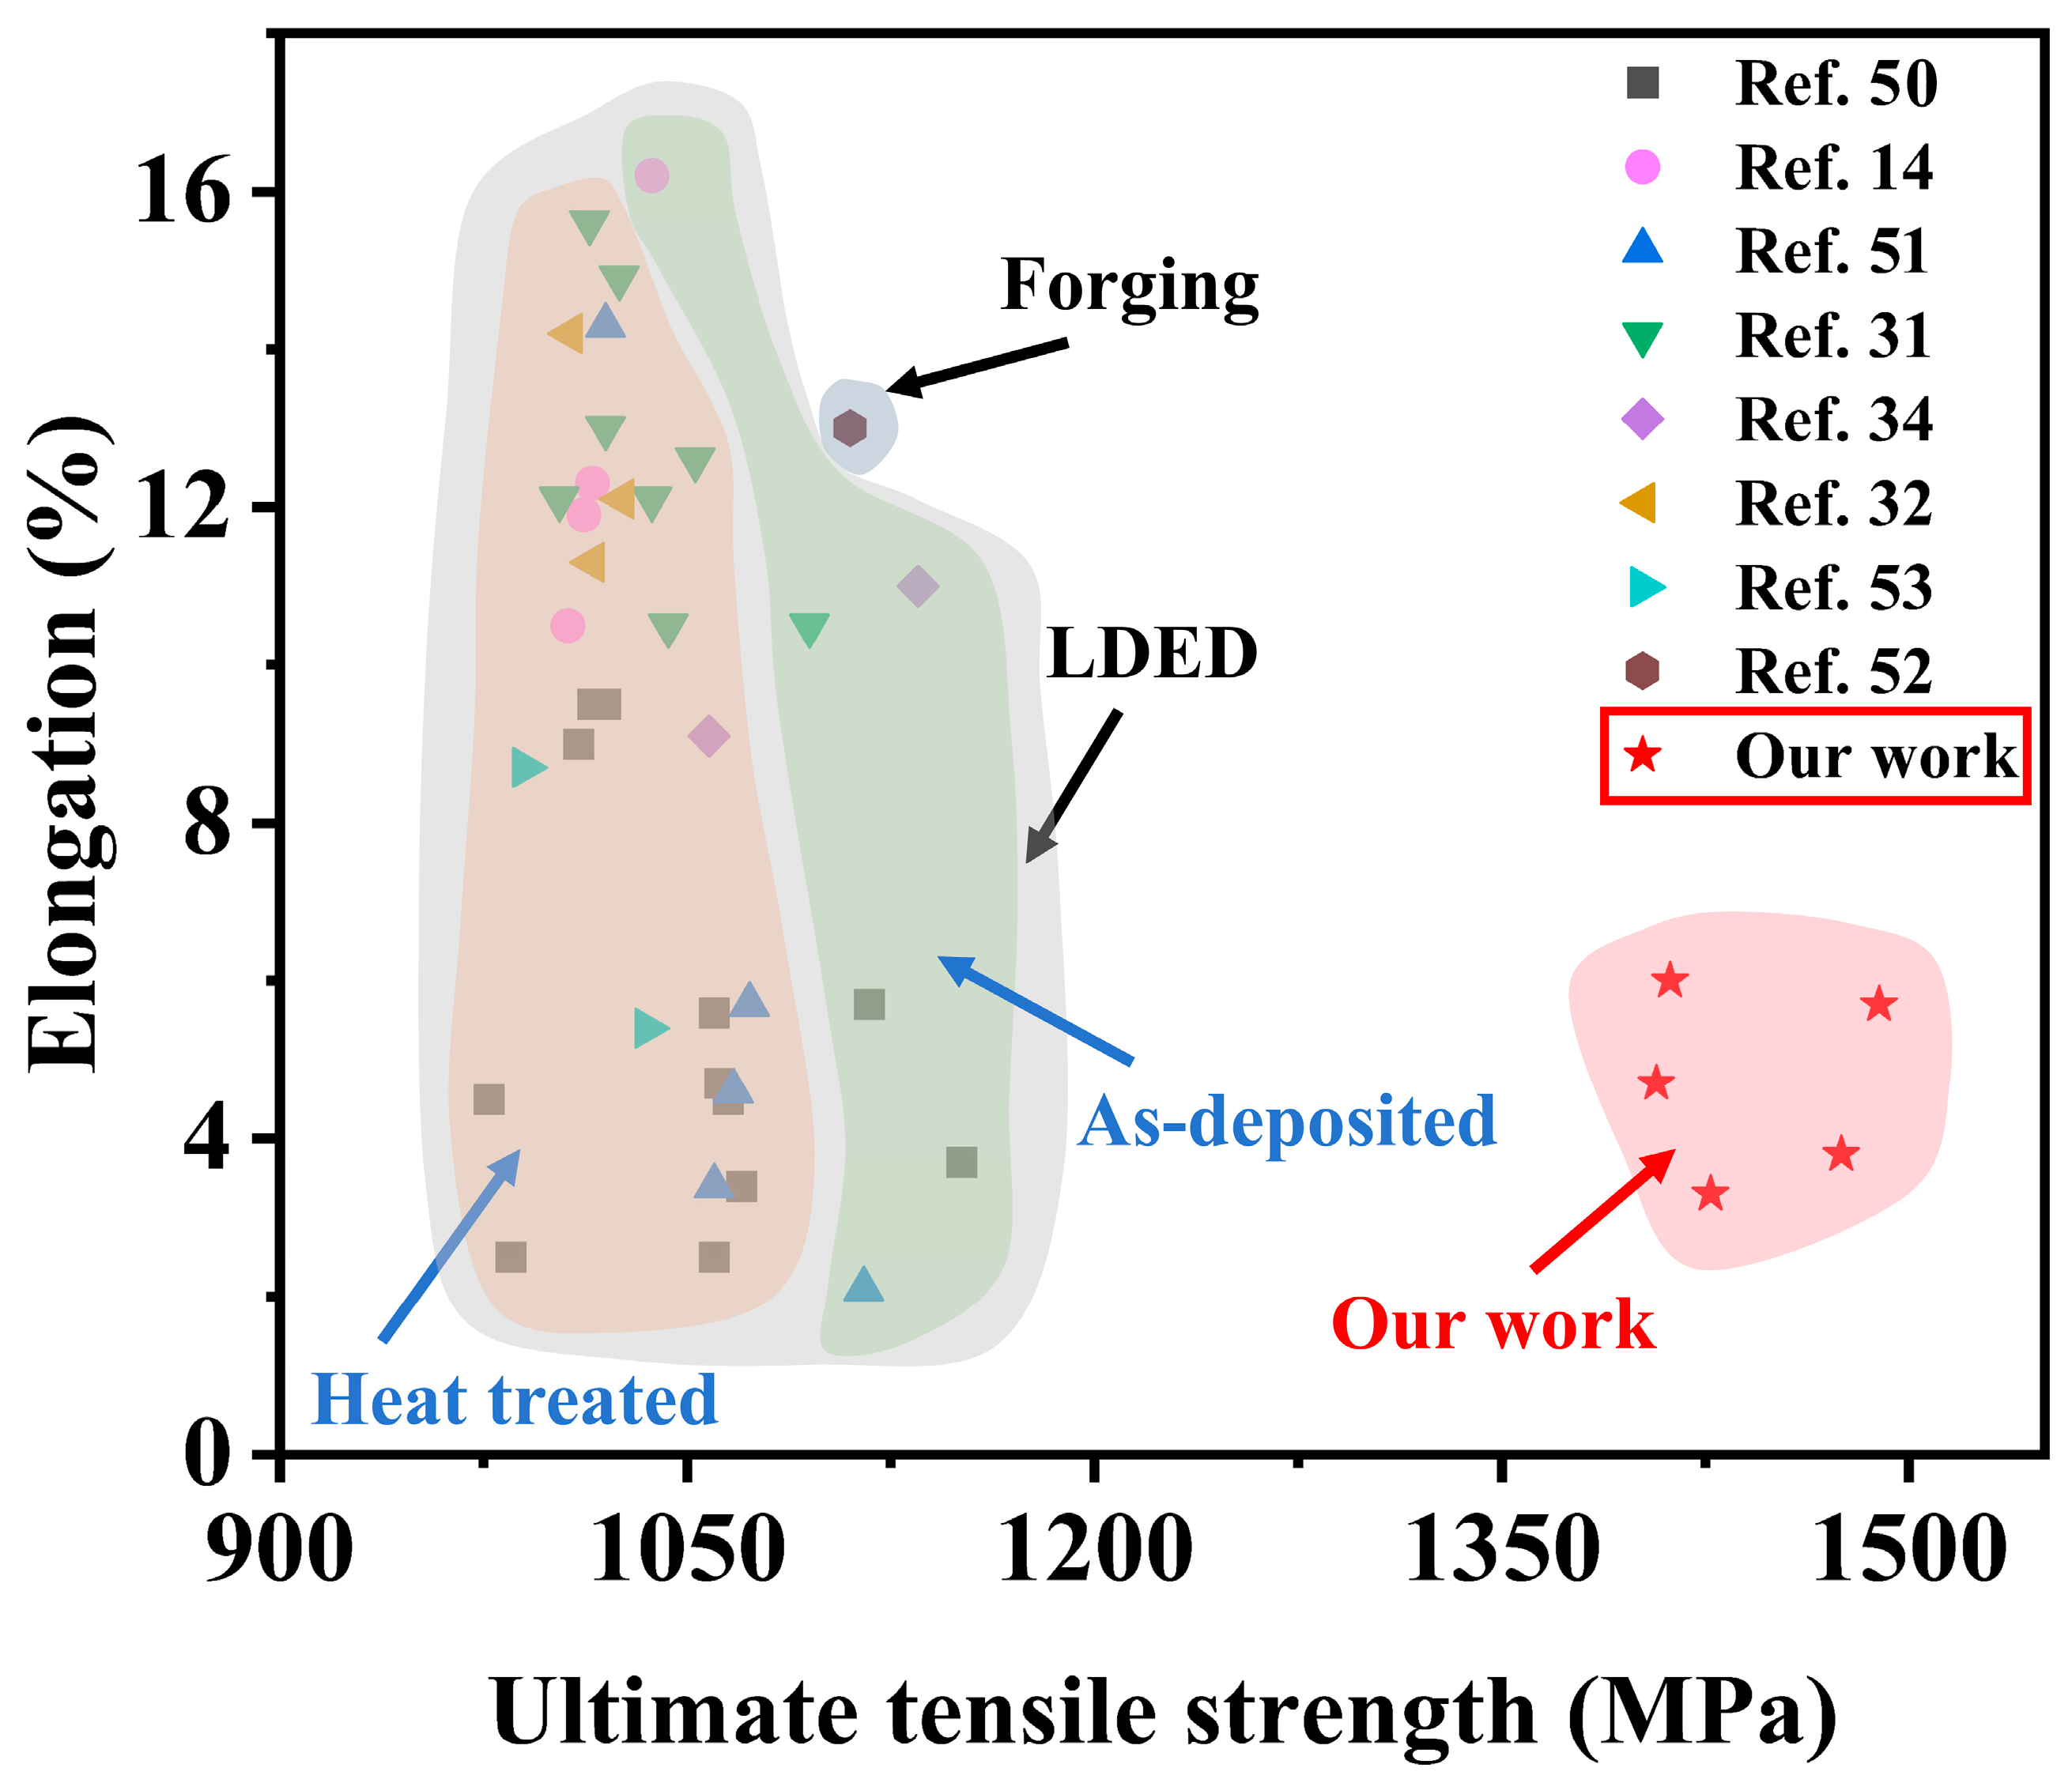
The mechanical properties of the as-fabricated Ti65 samples are predominantly determined by the resultant microstructure and achieved relative density. The optimized sample, characterized by near-full densification and a refined mixture of acicular α′-martensite, exhibits a superior combination of ultimate tensile strength and microhardness. This enhancement is primarily attributed to a composite strengthening mechanism, involving grain refinement and phase transformation strengthening. Figure 19 illustrates a schematic comparison of the mechanical properties of Ti65 alloy in the as-deposited and heat-treated conditions produced by different processes, including forging, LDED, and LPBF [14,31,32,34,50,51,52,53]. It can be observed that the Ti65 alloy fabricated by LPBF exhibits significantly higher tensile strength approximately 1.5 times that of samples produced by forging and LDED. This enhancement is primarily attributed to the markedly refined grain structure resulting from the extremely high cooling rates inherent to the LPBF process.
This study demonstrates significant advantages of the LPBF process for Ti65 alloy: the extremely high cooling rates promote the formation of fine acicular α′-martensite, resulting in room-temperature strength that notably surpasses that achieved by traditional forging and laser directed energy deposition, alongside demonstrating great potential for manufacturing complex geometries. However, the process also exhibits inherent limitations. Firstly, this work has not yet addressed the performance evolution and underlying mechanisms of this metastable microstructure under high-temperature service conditions, leaving its long-term thermal stability uncertain. Secondly, the process-inherent high thermal gradients readily induce residual stresses, which, under certain parameters, can lead to micro-crack initiation, posing a potential threat to the component’s fatigue life.

5. Conclusions and Outlook

5.1. Conclusions

This study systematically investigated the interplay between process parameters and microstructural characteristics of Ti65 high-temperature titanium alloy fabricated by LPBF. The regulatory mechanisms of process parameters on molten pool morphology, densification, surface quality, microstructural evolution, and mechanical properties were revealed. The primary conclusions are summarized as follows:
(1)
Synergistic regulation of key process parameters effectively enhanced the forming quality. Through single-track, multi-track, and cubic sample experiments, the effects of laser power, scanning speed, and hatch spacing on molten pool behavior, defect formation, and microstructural evolution were elucidated. The optimized parameter combination (100 W laser power, 1000 mm/s scanning speed, 60 μm hatch spacing) achieved near-full densification (>99.99%) with minimal surface roughness (Ra = 3.9 ± 1.3 μm).
(2)
Microstructural evolution is predominantly governed by the synergistic effects of laser power and scanning speed. Microstructural analysis reveals that under low power or high scanning speed conditions, rapid cooling promotes the formation of fine acicular α′ phase (width: 0.236–0.274 μm), whereas under high power or low scanning speed conditions, it favors the development of coarse lamellar α′ martensite (width: 0.525–0.645 μm). This demonstrates that volumetric energy density serves as a critical factor in controlling the morphology and dimensions of the Ti65 alloy’s microstructure.
(3)
The mechanical properties were directly governed by the resulting microstructure. Specimens fabricated under the optimized parameters exhibited excellent mechanical performance, achieving an ultimate tensile strength of 1489 ± 7.5 MPa, yield strength of 1278 ± 5.2 MPa, elongation of 5.7 ± 0.15%, and microhardness of 446.7 ± 1.7 HV0.2, which is attributed to the synergistic effect of near-full densification and the refined mixed microstructure.

5.2. Outlook

This work lays the groundwork for the application of LPBF-fabricated Ti65 in high-temperature components. Future research should focus on evaluating the alloy’s long-term high-temperature performance under realistic service conditions. Furthermore, developing tailored post-processing heat treatments to optimize the stability of the non-equilibrium microstructure and balance the strength–ductility–creep relationship will be crucial. Finally, fabricating and testing complex, topology-optimized structural components will be essential to bridge the gap between laboratory-scale achievements and the industrial adoption of LPBF-processed Ti65 alloys.

Author Contributions

Investigation, data curation, formal analysis, validation and writing—original draft, Y.M.; Methodology, review and editing, X.W.; Supervision and funding acquisition, J.W.; Validation and investigation, H.W.; Investigation and Validation, P.G.; Funding acquisition, L.L.; Formal analysis, C.L.; Supervision, funding acquisition, T.M.; Supervision, funding acquisition, J.N.; Supervision, funding acquisition, Z.Z. All authors have read and agreed to the published version of the manuscript.

Funding

This work was supported by the Beijing Natural Science Foundation (Grant No. L245024), the China Postdoctoral Science Foundation (Grant No. 2024M761107), and the Key Research and Development Project of Henan Province (Grant No. 221111310300).

Institutional Review Board Statement

Not applicable.

Informed Consent Statement

Not applicable.

Data Availability Statement

The original contributions presented in the study are included in the article; further inquiries can be directed to the corresponding author.

Conflicts of Interest

Authors Yuan Meng, Xianglong Wang, Haojie Wang, Ping Gan, Lei Lu, Chengjie Li were employed by China Machinery Institute of Advanced Materials (Zhengzhou) Co., Ltd. Authors Yuan Meng, Xianglong Wang, Haojie Wang, Ping Gan, Lei Lu, Chengjie Li were employed by Beijing National Innovation Institute of Lightweight Ltd. Author Jinjun Wu was employed by Machinery Technology Development Co., Ltd. The remaining authors declare that the research was conducted in the absence of any commercial or financial relationships that could be construed as a potential conflict of interest. All authors have read and agreed to the published version of the manuscript.

References

  1. Blakey-Milner, B.; Gradl, P.; Snedden, G.; Brooks, M.; Pitot, J.; Lopez, E.; Leary, M.; Berto, F.; du Plessis, A. Metal Additive Manufacturing in Aerospace: A Review. Mater. Des. 2021, 209, 110008. [Google Scholar] [CrossRef]
  2. Peters, M.; Kumpfert, J.; Ward, C.H.; Leyens, C. Titanium Alloys for Aerospace Applications. Adv. Eng. Mater. 2003, 5, 419–427. [Google Scholar] [CrossRef]
  3. Meng, B.; Wan, M.; Zhao, R.; Zou, Z.; Liu, H. Micromanufacturing Technologies of Compact Heat Exchangers for Hypersonic Precooled Airbreathing Propulsion: A Review. Chin. J. Aeronaut. 2021, 34, 79–103. [Google Scholar] [CrossRef]
  4. Zhang, L.-C.; Chen, L.-Y.; Wang, L. Surface Modification of Titanium and Titanium Alloys: Technologies, Developments, and Future Interests. Adv. Eng. Mater. 2020, 22, 1901258. [Google Scholar] [CrossRef]
  5. Yang, Q.; Sun, J.; Gao, Y.; Lu, Y.; Shen, Z.; Ma, L.; Yang, T.; Meng, F. Integrated Design and Performance of Microwave Absorbing-Mechanical Load Bearing: Metasurface Aramid Unidirectional Cloth Composites Based on PEDOT: PSS Conductive Ink. Adv. Compos. Hybrid. Mater. 2025, 8, 250. [Google Scholar] [CrossRef]
  6. Kang, L.; Yang, C. A Review on High-Strength Titanium Alloys: Microstructure, Strengthening, and Properties. Adv. Eng. Mater. 2019, 21, 1801359. [Google Scholar] [CrossRef]
  7. Li, S.; Deng, T.; Zhang, Y.; Liang, Y.; Li, R.; Dong, T. Review on the Creep Resistance of High-Temperature Titanium Alloy. Trans. Indian Inst. Met. 2021, 74, 215–222. [Google Scholar] [CrossRef]
  8. Zhao, D.; Fan, J.; Zhang, Z.; Liu, X.; Wang, Q.; Chen, Z.; Tang, B.; Kou, H.; Jia, S.; Li, J. Microstructure and Texture Variations in High Temperature Titanium Alloy Ti65 Sheets with Different Rolling Modes and Heat Treatments. Materials 2020, 13, 2466. [Google Scholar] [CrossRef]
  9. Chi, S.; Zhu, R.; Du, P.; Yuan, B.; Peng, C.; Zhang, L.; Chen, J. Enhanced Mechanical Properties of Near-α Ti60 Alloy by Laser Powder Bed Fusion. J. Mater. Res. Technol. 2025, 35, 3968–3979. [Google Scholar] [CrossRef]
  10. Zhang, Z.; Fan, J.; Tang, B.; Kou, H.; Wang, J.; Wang, X.; Wang, S.; Wang, Q.; Chen, Z.; Li, J. Microstructural Evolution and FCC Twinning Behavior during Hot Deformation of High Temperature Titanium Alloy Ti65. J. Mater. Sci. Technol. 2020, 49, 56–69. [Google Scholar] [CrossRef]
  11. Frazier, W.E. Metal Additive Manufacturing: A Review. J. Mater. Eng. Perform. 2014, 23, 1917–1928. [Google Scholar] [CrossRef]
  12. Vaezi, M.; Seitz, H.; Yang, S. A Review on 3D Micro-Additive Manufacturing Technologies. Int. J. Adv. Manuf. Technol. 2013, 67, 1721–1754. [Google Scholar] [CrossRef]
  13. Attar, H.; Calin, M.; Zhang, L.C.; Scudino, S.; Eckert, J. Manufacture by Selective Laser Melting and Mechanical Behavior of Commercially Pure Titanium. Mater. Sci. Eng. A 2014, 593, 170–177. [Google Scholar] [CrossRef]
  14. He, B.; Sun, J.; Yang, G.; Li, C.; Yi, J.; Li, X.; Ni, J. Microstructure and Mechanical Properties of Laser-Deposited Ti65 near-Alpha Titanium Alloy. Appl. Phys. A 2022, 128, 825. [Google Scholar] [CrossRef]
  15. DebRoy, T.; Wei, H.L.; Zuback, J.S.; Mukherjee, T.; Elmer, J.W.; Milewski, J.O.; Beese, A.M.; Wilson-Heid, A.; De, A.; Zhang, W. Additive Manufacturing of Metallic Components—Process, Structure and Properties. Prog. Mater. Sci. 2018, 92, 112–224. [Google Scholar] [CrossRef]
  16. Gisario, A.; Kazarian, M.; Martina, F.; Mehrpouya, M. Metal Additive Manufacturing in the Commercial Aviation Industry: A Review. J. Manuf. Syst. 2019, 53, 124–149. [Google Scholar] [CrossRef]
  17. Tepylo, N.; Huang, X.; Patnaik, P.C. Laser-Based Additive Manufacturing Technologies for Aerospace Applications. Adv. Eng. Mater. 2019, 21, 1900617. [Google Scholar] [CrossRef]
  18. Dubey, D.; Singh, S.P.; Behera, B.K. A Review on Recent Advancements in Additive Manufacturing Techniques. Proc. Inst. Mech. Eng. Part E J. Process Mech. Eng. 2024. [Google Scholar] [CrossRef]
  19. He, T.; Yip, W.S.; Yan, E.H.; Tang, J.; Rehan, M.; Teng, L.; Wong, C.H.; Sun, L.; Zhang, B.; Guo, F.; et al. 3D Printing for Ultra-Precision Machining: Current Status, Opportunities, and Future Perspectives. Front. Mech. Eng. 2024, 19, 23. [Google Scholar] [CrossRef]
  20. Xiao, Z.; Yang, Y.; Xiao, R.; Bai, Y.; Song, C.; Wang, D. Evaluation of Topology-Optimized Lattice Structures Manufactured via Selective Laser Melting. Mater. Des. 2018, 143, 27–37. [Google Scholar] [CrossRef]
  21. Chandravanshi, V.; Sarkar, R.; Kamat, S.V.; Nandy, T.K. Effects of Thermomechanical Processing and Heat Treatment on the Tensile and Creep Properties of Boron-Modified Near Alpha Titanium Alloy Ti-1100. Metall. Mater. Trans. A 2013, 44, 201–211. [Google Scholar] [CrossRef]
  22. Ding, C.; Shi, Q.; Liu, X.; Zheng, L.; Li, R.; Hang, Z.; Yu, B.; Wu, W. Microstructure and Mechanical Properties of PM Ti600 Alloy after Hot Extrusion and Subsequent Annealing Treatment. Mater. Sci. Eng. A 2019, 748, 434–440. [Google Scholar] [CrossRef]
  23. Ford, S.; Despeisse, M. Additive Manufacturing and Sustainability: An Exploratory Study of the Advantages and Challenges. J. Clean. Prod. 2016, 137, 1573–1587. [Google Scholar] [CrossRef]
  24. King, W.E.; Anderson, A.T.; Ferencz, R.M.; Hodge, N.E.; Kamath, C.; Khairallah, S.A.; Rubenchik, A.M. Laser Powder Bed Fusion Additive Manufacturing of Metals; Physics, Computational, and Materials Challenges. Appl. Phys. Rev. 2015, 2, 041304. [Google Scholar] [CrossRef]
  25. Sabzi, H.E.; Aboulkhair, N.T.; Liang, X.; Li, X.-H.; Simonelli, M.; Fu, H.; Rivera-Díaz-del-Castillo, P.E.J. Grain Refinement in Laser Powder Bed Fusion: The Influence of Dynamic Recrystallization and Recovery. Mater. Des. 2020, 196, 109181. [Google Scholar] [CrossRef]
  26. Zanini, F.; Bonato, N.; Michieletto, D.; Alberti, L.; Carmignato, S. Laser Powder Bed Fusion Process Optimization for the Production of High-Performance and Efficient High-Silicon Steel Electrical Motor Components. Prog. Addit. Manuf. 2025, 10, 6581–6592. [Google Scholar] [CrossRef]
  27. Wei, K.; Wang, Z.; Zeng, X. Preliminary Investigation on Selective Laser Melting of Ti-5Al-2.5Sn α-Ti Alloy: From Single Tracks to Bulk 3D Components. J. Mater. Process Technol. 2017, 244, 73–85. [Google Scholar] [CrossRef]
  28. Thijs, L.; Verhaeghe, F.; Craeghs, T.; Van Humbeeck, J.; Kruth, J.-P. A Study of the Microstructural Evolution during Selective Laser Melting of Ti–6Al–4V. Acta Mater. 2010, 58, 3303–3312. [Google Scholar] [CrossRef]
  29. Yang, J.; Han, J.; Yu, H.; Yin, J.; Gao, M.; Wang, Z.; Zeng, X. Role of Molten Pool Mode on Formability, Microstructure and Mechanical Properties of Selective Laser Melted Ti-6Al-4V Alloy. Mater. Des. 2016, 110, 558–570. [Google Scholar] [CrossRef]
  30. Luo, X.; Yang, C.; Fu, Z.Q.; Liu, L.H.; Lu, H.Z.; Ma, H.W.; Wang, Z.; Li, D.D.; Zhang, L.C.; Li, Y.Y. Achieving Ultrahigh-Strength in Beta-Type Titanium Alloy by Controlling the Melt Pool Mode in Selective Laser Melting. Mater. Sci. Eng. A 2021, 823, 141731. [Google Scholar] [CrossRef]
  31. Li, B.; Li, X.; Yin, J.; Ren, Y.; Wang, Y.; Yang, G. Influence of Scanning Strategies on Microstructure, Texture and Mechanical Properties of Ti65 High-Temperature Titanium Alloy by Laser Deposition Manufacturing. J. Manuf. Process 2025, 136, 162–176. [Google Scholar] [CrossRef]
  32. He, B.; Sun, J.; Ren, Y.; Li, C.; Yang, G.; Li, X.; Ni, J. Effect of Heat Treatment on Microstructure and Mechanical Properties of Laser-Deposited Ti65 near-Alpha Titanium Alloy. J. Mater. Res. 2022, 37, 1464–1474. [Google Scholar] [CrossRef]
  33. Sun, J.; Lu, H.; Wang, Z.; Luo, K.; Lu, J. High-Temperature Oxidation Behaviour of Ti65 Titanium Alloy Fabricated by Laser Direct Energy Deposition. Corros. Sci. 2024, 229, 111866. [Google Scholar] [CrossRef]
  34. Sun, J.; Lu, H.; Zhang, H.; Luo, K.; Lu, J. Effect of Thermal Exposure on Microstructure and Mechanical Properties of Ti65 High-Temperature Titanium Alloy Deposited by Laser Direct Energy Deposition. Mater. Sci. Eng. A 2024, 908, 146757. [Google Scholar] [CrossRef]
  35. Wang, X.; Li, S.Q.; Liu, J.N. Study on Rotating Bending Fatigue Property of Ti65 Titanium Alloy. Mater. Sci. Forum 2016, 849, 347–352. [Google Scholar] [CrossRef]
  36. Yue, K.; Liu, J.; Zhu, S.; Wang, L.; Wang, Q.; Yang, R. Origins of Different Tensile Behaviors Induced by Cooling Rate in a near Alpha Titanium Alloy Ti65. Materialia 2018, 1, 128–138. [Google Scholar] [CrossRef]
  37. Read, N.; Wang, W.; Essa, K.; Attallah, M.M. Selective Laser Melting of AlSi10Mg Alloy: Process Optimisation and Mechanical Properties Development. Mater. Des. (1980–2015) 2015, 65, 417–424. [Google Scholar] [CrossRef]
  38. Xiong, Z.; Li, H.; Yang, H.; Yang, Y.; Liu, Y.; Cui, L.; Li, X.; Masseling, L.; Shen, L.; Hao, S. Micro Laser Powder Bed Fusion of NiTi Alloys with Superior Mechanical Property and Shape Recovery Function. Addit. Manuf. 2022, 57, 102960. [Google Scholar] [CrossRef]
  39. Dornelas, P.H.G.; Santos, T.G.; Oliveira, J.P. Micro-Metal Additive Manufacturing—State-of-Art and Perspectives. Int. J. Adv. Manuf. Technol. 2022, 122, 3547–3564. [Google Scholar] [CrossRef]
  40. Wei, P.; Wei, Z.; Chen, Z.; Du, J.; He, Y.; Li, J.; Zhou, Y. The AlSi10Mg Samples Produced by Selective Laser Melting: Single Track, Densification, Microstructure and Mechanical Behavior. Appl. Surf. Sci. 2017, 408, 38–50. [Google Scholar] [CrossRef]
  41. Patel, S.; Vlasea, M. Melting Modes in Laser Powder Bed Fusion. Materialia 2020, 9, 100591. [Google Scholar] [CrossRef]
  42. Wang, J.; Zhu, R.; Liu, Y.; Zhang, L. Understanding Melt Pool Characteristics in Laser Powder Bed Fusion: An Overview of Single- and Multi-Track Melt Pools for Process Optimization. Adv. Powder Mater. 2023, 2, 100137. [Google Scholar] [CrossRef]
  43. Guo, D.; Lambert-Garcia, R.; Hocine, S.; Fan, X.; Greenhalgh, H.; Shahani, R.; Majkut, M.; Rack, A.; Lee, P.D.; Alex Leung, C.L. Correlative Spatter and Vapour Depression Dynamics during Laser Powder Bed Fusion of an Al-Fe-Zr Alloy. Int. J. Extrem. Manuf. 2024, 6, 055601. [Google Scholar] [CrossRef]
  44. Khairallah, S.A.; Anderson, A.T.; Rubenchik, A.; King, W.E. Laser Powder-Bed Fusion Additive Manufacturing: Physics of Complex Melt Flow and Formation Mechanisms of Pores, Spatter, and Denudation Zones. Acta Mater. 2016, 108, 36–45. [Google Scholar] [CrossRef]
  45. Qi, T.; Zhu, H.; Zhang, H.; Yin, J.; Ke, L.; Zeng, X. Selective Laser Melting of Al7050 Powder: Melting Mode Transition and Comparison of the Characteristics between the Keyhole and Conduction Mode. Mater. Des. 2017, 135, 257–266. [Google Scholar] [CrossRef]
  46. Yadroitsev, I.; Krakhmalev, P.; Yadroitsava, I.; Johansson, S.; Smurov, I. Energy Input Effect on Morphology and Microstructure of Selective Laser Melting Single Track from Metallic Powder. J. Mater. Process Technol. 2013, 213, 606–613. [Google Scholar] [CrossRef]
  47. Gao, P.; Wang, Z.; Zeng, X. Effect of Process Parameters on Morphology, Sectional Characteristics and Crack Sensitivity of Ti-40Al-9V-0.5Y Alloy Single Tracks Produced by Selective Laser Melting. Int. J. Lightweight Mater. Manuf. 2019, 2, 355–361. [Google Scholar] [CrossRef]
  48. Wei, L.; Miao, B.; Liu, Z.; Su, H.; Ming, K.; Zheng, X.; Wang, F.; Zheng, S. The Dependence of Strength and Strain Hardening on Dislocation-Interface Interaction in Dual-Phase Titanium Alloys. Scr. Mater. 2024, 252, 116249. [Google Scholar] [CrossRef]
  49. Ezairi, S.; Elouafi, A.; Lmai, F.; Tizliouine, A. Structural, Magnetic and Magnetocaloric Effect of Pyrochlore Iridate Er2Ir2O7. Phys. Scr. 2023, 98, 065803. [Google Scholar] [CrossRef]
  50. Sun, J.; Lu, H.; Liang, Y.; Zhang, H.; Luo, K.; Lu, J. Evolution of Microstructure and Mechanical Properties of Ti65 High-Temperature Titanium Alloy after Additive Manufacturing and Annealing. Mater. Sci. Eng. A 2024, 913, 147002. [Google Scholar] [CrossRef]
  51. Sun, J.; Lu, H.; Liang, Y.; Luo, K.; Lu, J. Effects of Different Heat Treatment Temperatures on the Microstructure and Mechanical Properties of Additive Manufacturing Ti65 Alloys. Mater. Charact. 2025, 219, 114592. [Google Scholar] [CrossRef]
  52. Yin, J.; Li, X.; Guan, F.; Li, P.; Yang, G. Research on Microstructure and High-Temperature Performance of Novel Ti65 Titanium Alloy with V-Groove Connection in Laser Additive Manufacturing. Trans. Indian Inst. Met. 2024, 77, 3627–3639. [Google Scholar] [CrossRef]
  53. Li, J.; Jiang, W.; Xia, C.; Deng, Y.; Gao, Y.; Yang, C. Microstructural Evolution and Subsequent Mechanical Properties of Ti65 Titanium Alloy during Long-Term Thermal Exposure. Metals 2024, 14, 854. [Google Scholar] [CrossRef]
Figure 1. (a) Morphology of Ti65 powders revealed by scanning electron microscopy (SEM); (b) powder size distribution.
Applsci 15 11717 g001
Figure 2. (a) Schematic illustration of the tensile and cubic specimens; (b) macroscopic view of a tensile test specimen; (c) dimensional specifications of the tensile test specimen; (d) macroscopic view of a cube specimen.
Applsci 15 11717 g002
Figure 3. Surface morphologies of the as-deposited Ti65 single tracks under three different combinations of process parameters.
Applsci 15 11717 g003
Figure 4. Single channel width at 160 W laser power for different scanning speeds: (a) V = 600 mm/s; (b) V = 800 mm/s; (c) V = 1000 mm/s; (d) V = 1200 mm/s; (e) V = 1400 mm/s; (f) the changing trend.
Applsci 15 11717 g004
Figure 5. (a) Characteristic parameters of the molten pool; (b) measured depth, width and height of molten pools under various scanning speeds; (c) laser powers; (d) depth to width ratio of the molten pool.
Applsci 15 11717 g005
Figure 6. Geometric characteristic of molten pools for as-deposited Ti65 single tracks under different processing parameter combinations.
Applsci 15 11717 g006
Figure 7. The overlapping morphology of the molten channel under different hatch spacing: (a) h = 30 μm; (b) h = 45 μm; (c) h = 60 μm; (d) h = 75 μm.
Applsci 15 11717 g007
Figure 8. Relative density of Ti65 varies under different parameters.
Applsci 15 11717 g008
Figure 9. Relative density at 1000 mm/s scanning speed under different laser power: (a) P = 60 W; (b) P = 80 W; (c) P = 100 W; (d) P = 120 W; (e) P = 140 W; (f) the changing trend.
Applsci 15 11717 g009
Figure 10. Relative density at 100 W laser power under different scanning velocities: (a) V = 600 mm/s; (b) V = 800 mm/s; (c) V = 1000 mm/s; (d) V = 1200 mm/s; (e) V = 1400 mm/s; (f) the changing trend.
Applsci 15 11717 g010
Figure 11. Side surface roughness Ra and Rz: (a) Effect of scanning power; (b) Effect of scanning speed.
Applsci 15 11717 g011
Figure 12. Macroscopic morphology of the side surface under different laser powers at fixed scanning speed (1000 mm/s) and hatch spacing (60 μm): (a,d) P = 60 W; (b,e) P = 100 W; (c,f) P = 140 W.
Applsci 15 11717 g012
Figure 13. Macroscopic morphology of the side surface under different scanning speeds at fixed laser power (100 W) and hatch spacing (60 μm): (a,d) V = 600 mm/s; (b,e) V = 1000 mm/s; (c,f) V = 1400 mm/s.
Applsci 15 11717 g013
Figure 14. Microstructure of cubic samples: (a) P = 60 W, V = 1000 mm/s; (b) P = 100 W, V = 1000 mm/s; (c) P = 140 W, V = 1000 mm/s; (d) P = 100 W, V = 600 mm/s; (e) P = 100 W, V = 1000 mm/s; (f) P = 100 W, V = 1400 mm/s.
Applsci 15 11717 g014
Figure 15. Microstructural dimensions of α′ phase at different laser powers (a) and scanning speeds (b).
Applsci 15 11717 g015
Figure 16. XRD analysis of the LPBF processed samples with variations in laser power (a) and scanning speed (b).
Applsci 15 11717 g016
Figure 17. Mechanical properties of specimens under different process parameters: (a,c) engineering stress strain curves; (b,d) tensile performance data.
Applsci 15 11717 g017
Figure 18. The fracture characteristic at different laser power: (a) 60 W; (b) 100 W; (c) 140 W; the fracture characteristic at different scanning speeds: (d) 600 mm/s; (e) 1000 mm/s; (f) 1400 mm/s.
Applsci 15 11717 g018
Figure 19. Mechanical properties of Ti65 titanium alloy prepared by different processes [14,31,32,34,50,51,52,53].
Applsci 15 11717 g019
Table 1. Chemical composition of Ti65 powder (wt%).
ElementsAlSnZrTaMoSiNbWCTi
Powders (wt%)5.833.382.70.480.320.270.320.620.035Bal
Table 2. Mechanical properties of specimens under different process parameters.
P (W)V (mm/s)UTS (MPa)YS (MPa)Elongation (%)Microhardness (HV)
6010001427 ± 8.11283 ± 10.43.3 ± 0.26400.1 ± 6.1
10010001489 ± 7.51278 ± 5.25.7 ± 0.15446.7 ± 1.7
14010001407 ± 11.11282 ± 3.24.7 ± 0.36427.8 ± 2.2
1006001475 ± 8.81280 ± 13.13.8 ± 0.18421.0 ± 3.7
10010001489 ± 7.51278 ± 5.25.7 ± 0.15446.7 ± 1.7
10014001412 ± 10.61271 ± 25.76.0 ± 0.27414.7 ± 1.5
Table 3. Crystallite size and microstrain of LPBF-processed Ti65 alloy determined by the Williamson–Hall method.
P (W)V (mm/s)Crystallite Size (nm)Microstrain (ε × 10−3)
60100028.3 ± 1.95.11 ± 0.12
100100039.7 ± 2.83.65 ± 0.14
140100045.1 ± 3.23.21 ± 0.48
10060050.6 ± 2.22.86 ± 0.07
100140032.5 ± 1.55.28 ± 0.08
Disclaimer/Publisher’s Note: The statements, opinions and data contained in all publications are solely those of the individual author(s) and contributor(s) and not of MDPI and/or the editor(s). MDPI and/or the editor(s) disclaim responsibility for any injury to people or property resulting from any ideas, methods, instructions or products referred to in the content.