Article

Comprehensive Dynamic Assessment of a Masonry Building

by
Michał Teodorczyk
*,
Łukasz Gołębiowski
and
Jarosław Szulc
Building Structures, Geotechnics and Concrete Department, Instytut Techniki Budowlanej, Filtrowa 1, 00-611 Warsaw, Poland
*
Author to whom correspondence should be addressed.
Appl. Sci. 2025, 15(21), 11699; https://doi.org/10.3390/app152111699
Submission received: 22 September 2025 / Revised: 27 October 2025 / Accepted: 28 October 2025 / Published: 1 November 2025

Abstract

Residential buildings near transport corridors are exposed to traffic-induced vibrations that can affect their safety. This paper presents a dynamic diagnosis of a masonry building located near a grade-separated junction. The study aimed to determine whether traffic-induced vibrations were responsible for the diagonal cracking of plaster observed in a dormer wall. The methodology included simultaneous acceleration measurements on the ground and building, traffic recording, 3D laser scanning for geometric reconstruction, and finite element modelling with soil–structure interaction. Time history and modal analyses were performed for various soil stiffness values. The results show that vibrations are predominantly attenuated at the soil–building interface, whereas soil flexibility markedly lowers the fundamental (lowest) natural frequencies of the building. The effect of soil stiffness on wall shear stress was more significant than that of dynamic action in load combinations. A comparison of the principal stress trajectories with the observed cracking patterns suggests that the damage was primarily due to the support condition of the wall. Traffic-induced vibrations are not the main cause of the observed damage. The integrated diagnostic procedure was effective in distinguishing vibration effects from other structural factors and was useful in assessing building safety.

1. Introduction

Residential buildings located near communication corridors, such as roads, are subject to dynamic impacts from vehicle traffic. The intensity of road and rail transport continues to increase, as does the weight of carried loads. This intensifies the effects and the risks from traffic-induced vibrations propagating to buildings. Analysing the impact of vibrations on the technical condition of buildings is crucial to their safe and economic use [1,2].
Traffic-induced vibrations arise from human activity. These vibrations travel through the ground and are transferred to building structures through the foundations in contact with the soil [3]. The excited vibrations propagate in wave motion through the media in the form of longitudinal, transverse, and surface waves. Waves close to the ground surface are Rayleigh waves. They typically carry most vibrations generated by vehicle traffic. These waves have a cylindrical wavefront, generating horizontal and vertical ground movements [4,5]. A vibrating building may take a specific mode which depends on its dynamic properties, e.g., mass, natural frequency, and degree of damping. Under traffic-induced excitation, these vibration modes are similar to the natural modes of a building [6,7].
When analysing the impact of vibrations, we should consider what type of damage they may cause to the building. Vibrations can cause non-structural damage, such as cracks in plaster and partition walls or cladding detachment [3,8]. They can also damage load-bearing elements, including cracks and fractures in foundations, load-bearing walls, wall connections, and near the corners of openings [3,8]. The level of vibrations generated by vehicle traffic on roads is rarely high enough to cause such damage directly. Building elements are also exposed to changes in temperature, humidity, and ground settlement. They may be kept in poor technical condition or subjected to improper repairs. Therefore, even a low level of traffic-induced vibration may cause damage when it coincides with an existing state of stress or deformation [4,9].
This study investigated traffic-induced vibrations. It tested whether they were decisive in the plaster cracks on the dormer wall of a residential building. To address this question, a comprehensive dynamic structure diagnosis was conducted in accordance with the Polish [8] and Eurocode [10] standards. Particular attention was paid to the shear behaviour of the masonry wall. A finite element model with soil-structure interaction was developed for different soil stiffness values. The results were compared with a no-interaction case using rigid supports. The directions of the principal stresses were determined and compared with the orientation of the cracks visible on the dormer wall plaster (Figure 1). Additionally, the influence of soil stiffness on the fundamental natural frequencies of buildings was assessed. For further insight, we determined a reduction factor from simultaneous measurements. Traffic-induced vibrations were recorded at the ground level in the building and in the adjacent soil.

2. Background

The requirements for calculating and assessing the impact of traffic-induced vibrations on building structures are regulated by international standards [7,9]. The European standard [11] refers exclusively to seismic vibrations (earthquakes). It cannot be directly applied to traffic-induced vibrations and their effects on buildings. Standards [7,9] indicate that traffic-induced vibrations can be described in terms of time variations. These are expressed using displacement, velocity, or acceleration functions. Therefore, it is necessary to use empirical methods and numerical modelling. In the standard [9], the criteria for permissible vibrations in buildings relate to the serviceability limit state. This may include minor damage such as cracks or spalling of the plaster. The standard [7] indicates the possibility of correlating vibration criteria with visible building damage. This correlation uses the maximum values of the vibration velocity or acceleration. Therefore, some countries have their own standards with additional guidelines, such as the German [12] and Polish [8] standards. These specify the maximum vibration levels to ensure building safety within their national contexts.
The German standard [12] provides an approximate assessment of the impact of vibrations on building structures. This assessment used a frequency-vibration velocity diagram. The diagram has three boundary lines for building categories: category one (commercial and industrial), category two (residential), and category three (historic). The Polish standard [8] allows two methods of assessment: approximate and full. The approximate method defines two dynamic impact scales for two types of buildings based on their dimensions. These scales are presented in frequency–vibration velocity or frequency-vibration acceleration diagrams with four boundaries. Any exceeding of a boundary line denotes a greater effect on the building. The effect ranges from negligible vibrations to those that could lead to failure or even collapse. To address the limitations in the Polish standard [8], a full assessment is recommended, for example, using numerical analyses [13]. A full assessment of the impact of ground vibrations on a structure can be applied to all types of buildings. It consists of determining the inertial forces and their effects on the structure. These forces are calculated on the dynamic response of the building to kinematic excitation. The calculation uses either the direct integration method of the equations of motion (Time History Analysis) [3,14] or the response spectrum method [6,15]. The building model is then subjected to inertial forces in combination with static loads. Structural elements are verified against both the ultimate and serviceability limit states [3,8].
Dynamic diagnostics of an existing building consist of determining whether there is a relationship between observed effects and their cause. The diagnostic process includes collecting information about the building, for example, its structural system, element dimensions, and construction materials. Such data may be obtained from archival sources, for example, technical documentation [3,16]. If these are not available, a full survey of the building must be conducted. This often uses traditional measurement methods, which can significantly extend the work. Modern technology offers faster alternatives through 3D laser scanning. It is a spatial measurement technique based on reverse engineering. The geometry of the structure is captured as a point cloud and subsequently converted into a CAD model [17,18]. A spatial numerical model is then developed with a level of accuracy that reflects the real structure. This is particularly challenging in the cases of complex or irregular geometry. In parallel, an assessment of the building’s technical condition and observed damage is carried out. It may also be supported by 3D laser scanning [19,20] or by archival reports from periodic inspections. A fundamental step is the selection of measuring equipment and the determination of measurement points. Then, building vibrations are recorded in the form of three-component vibrograms [3,6,16]. Kinematic excitation applies to the FEM model on the elements representing the foundation. The final issue is to determine whether the effect of vibrations is significant enough to include it in structural checks. It has been proposed [21] that the effect can be considered negligible when the maximum equivalent stress from vibrations is less than 5% of the material strength.
When performing a dynamic diagnosis of an existing residential building, it is useful for research to test transmission. Check whether the ground motion is fully transmitted or altered at the soil-foundation interface. The relationship between ground surface and foundation vibrations is described by the soil-structure transfer function [7,13]. This function can be predicted or measured. To measure it, simultaneous vibration recordings must be performed on the building and the adjacent ground. Next, calculate the reduction factor. It is the ratio of the vibration amplitude at the foundation to that at the ground surface near the building. For most traffic-induced vibrations, this factor is generally less than or equal to 1 [6,7,22]. The ground measurement point should not be too close to the building because structural movements may distort the data. Also, it should not be too close to the vibration source because wave interference can occur there. A study [23] recommended placing ground sensors approximately 2.0 m in front of the building. It also advised selecting vibration records with similar dominant frequencies in the ground and the building for computing the reduction factor. Rocking may occur when ground-dominant frequencies in front of the building match the building’s natural frequencies. It may also occur when they are simply close. In such cases, building vibration amplitudes at ground level may exceed those of the ground in front of the building [7,23].
Assessment of soil–structure interaction is carried out using two numerical methods: the direct method and the substructure method [7]. In the first approach, the direct method models the soil and structure as a single system using the finite element method. Using this method, ref. [24] found that nearby aboveground structures have little effect on the seismic response of the analysed structure. The neighbouring underground structures exert a significant influence. On the other hand, ref. [25] showed that a building located directly above a railway track is more exposed to train-induced vibrations. Buildings situated adjacent to the track are less exposed. In the second approach, the substructure method treats the soil and structure as two separate systems. Their interaction is represented by suitably chosen soil stiffness coefficients. Using this method, ref. [26] demonstrated that soil flexibility affects the fundamental natural frequency of tall buildings. Lower soil stiffness results in longer vibration periods. In contrast, we found [27] that soil stiffness influences the stress state of a structure subjected to mining-induced vibrations. The lowest stress values were observed for rigid supports. Therefore, the choice of numerical method depends on the complexity of the structural geometry, the available soil data and the level of detail required.

3. Materials and Methods

3.1. Subject of the Study

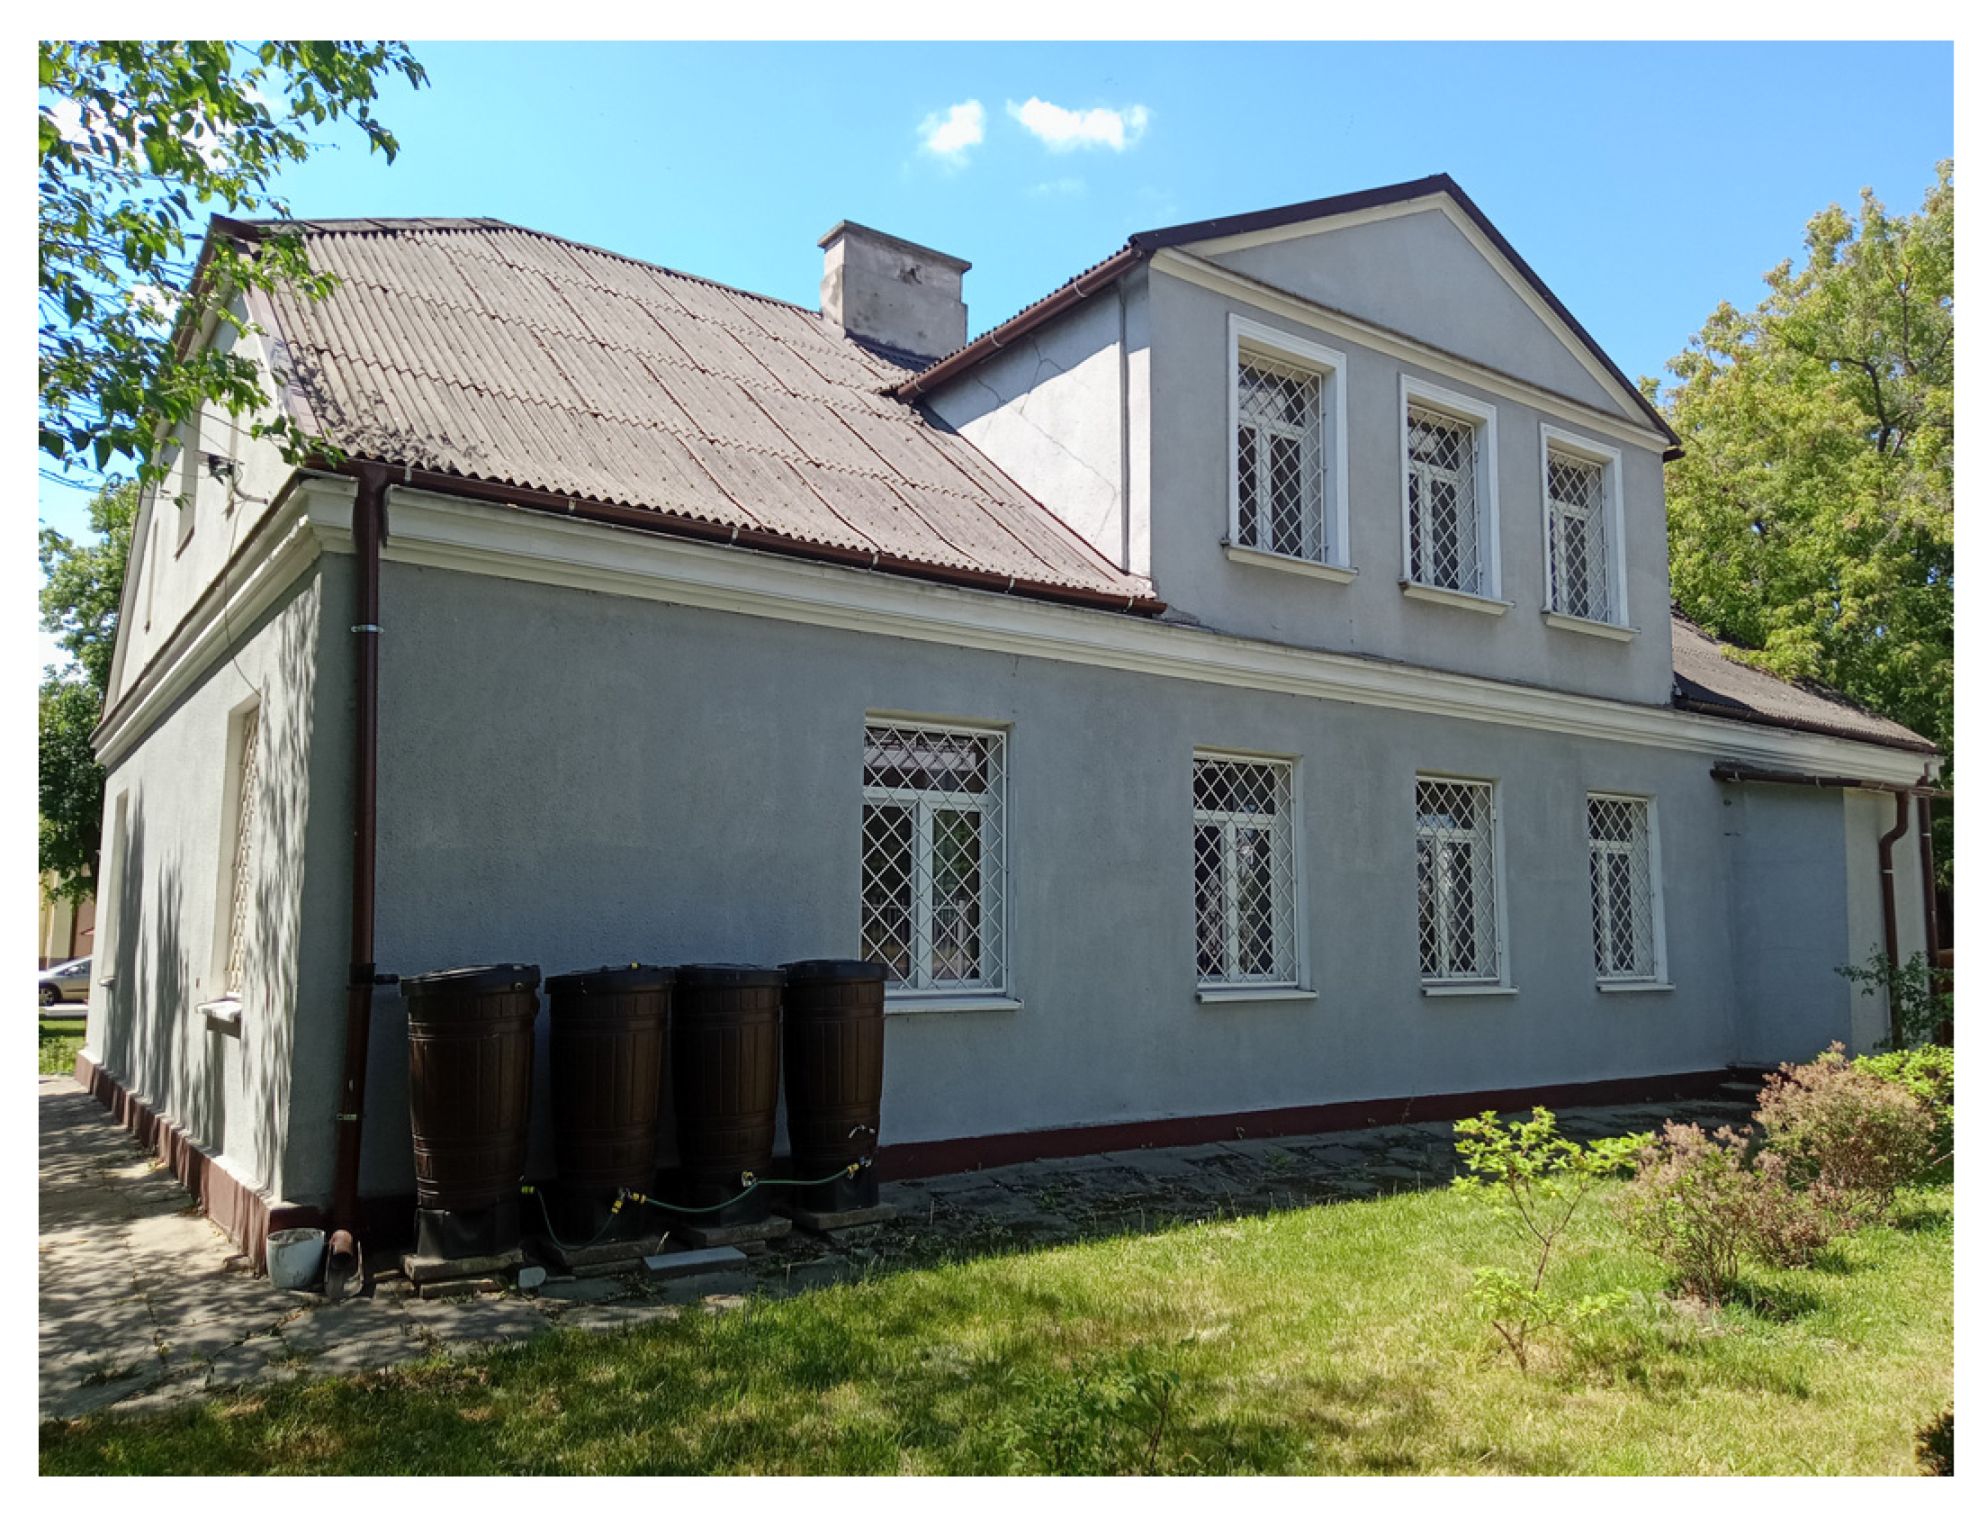
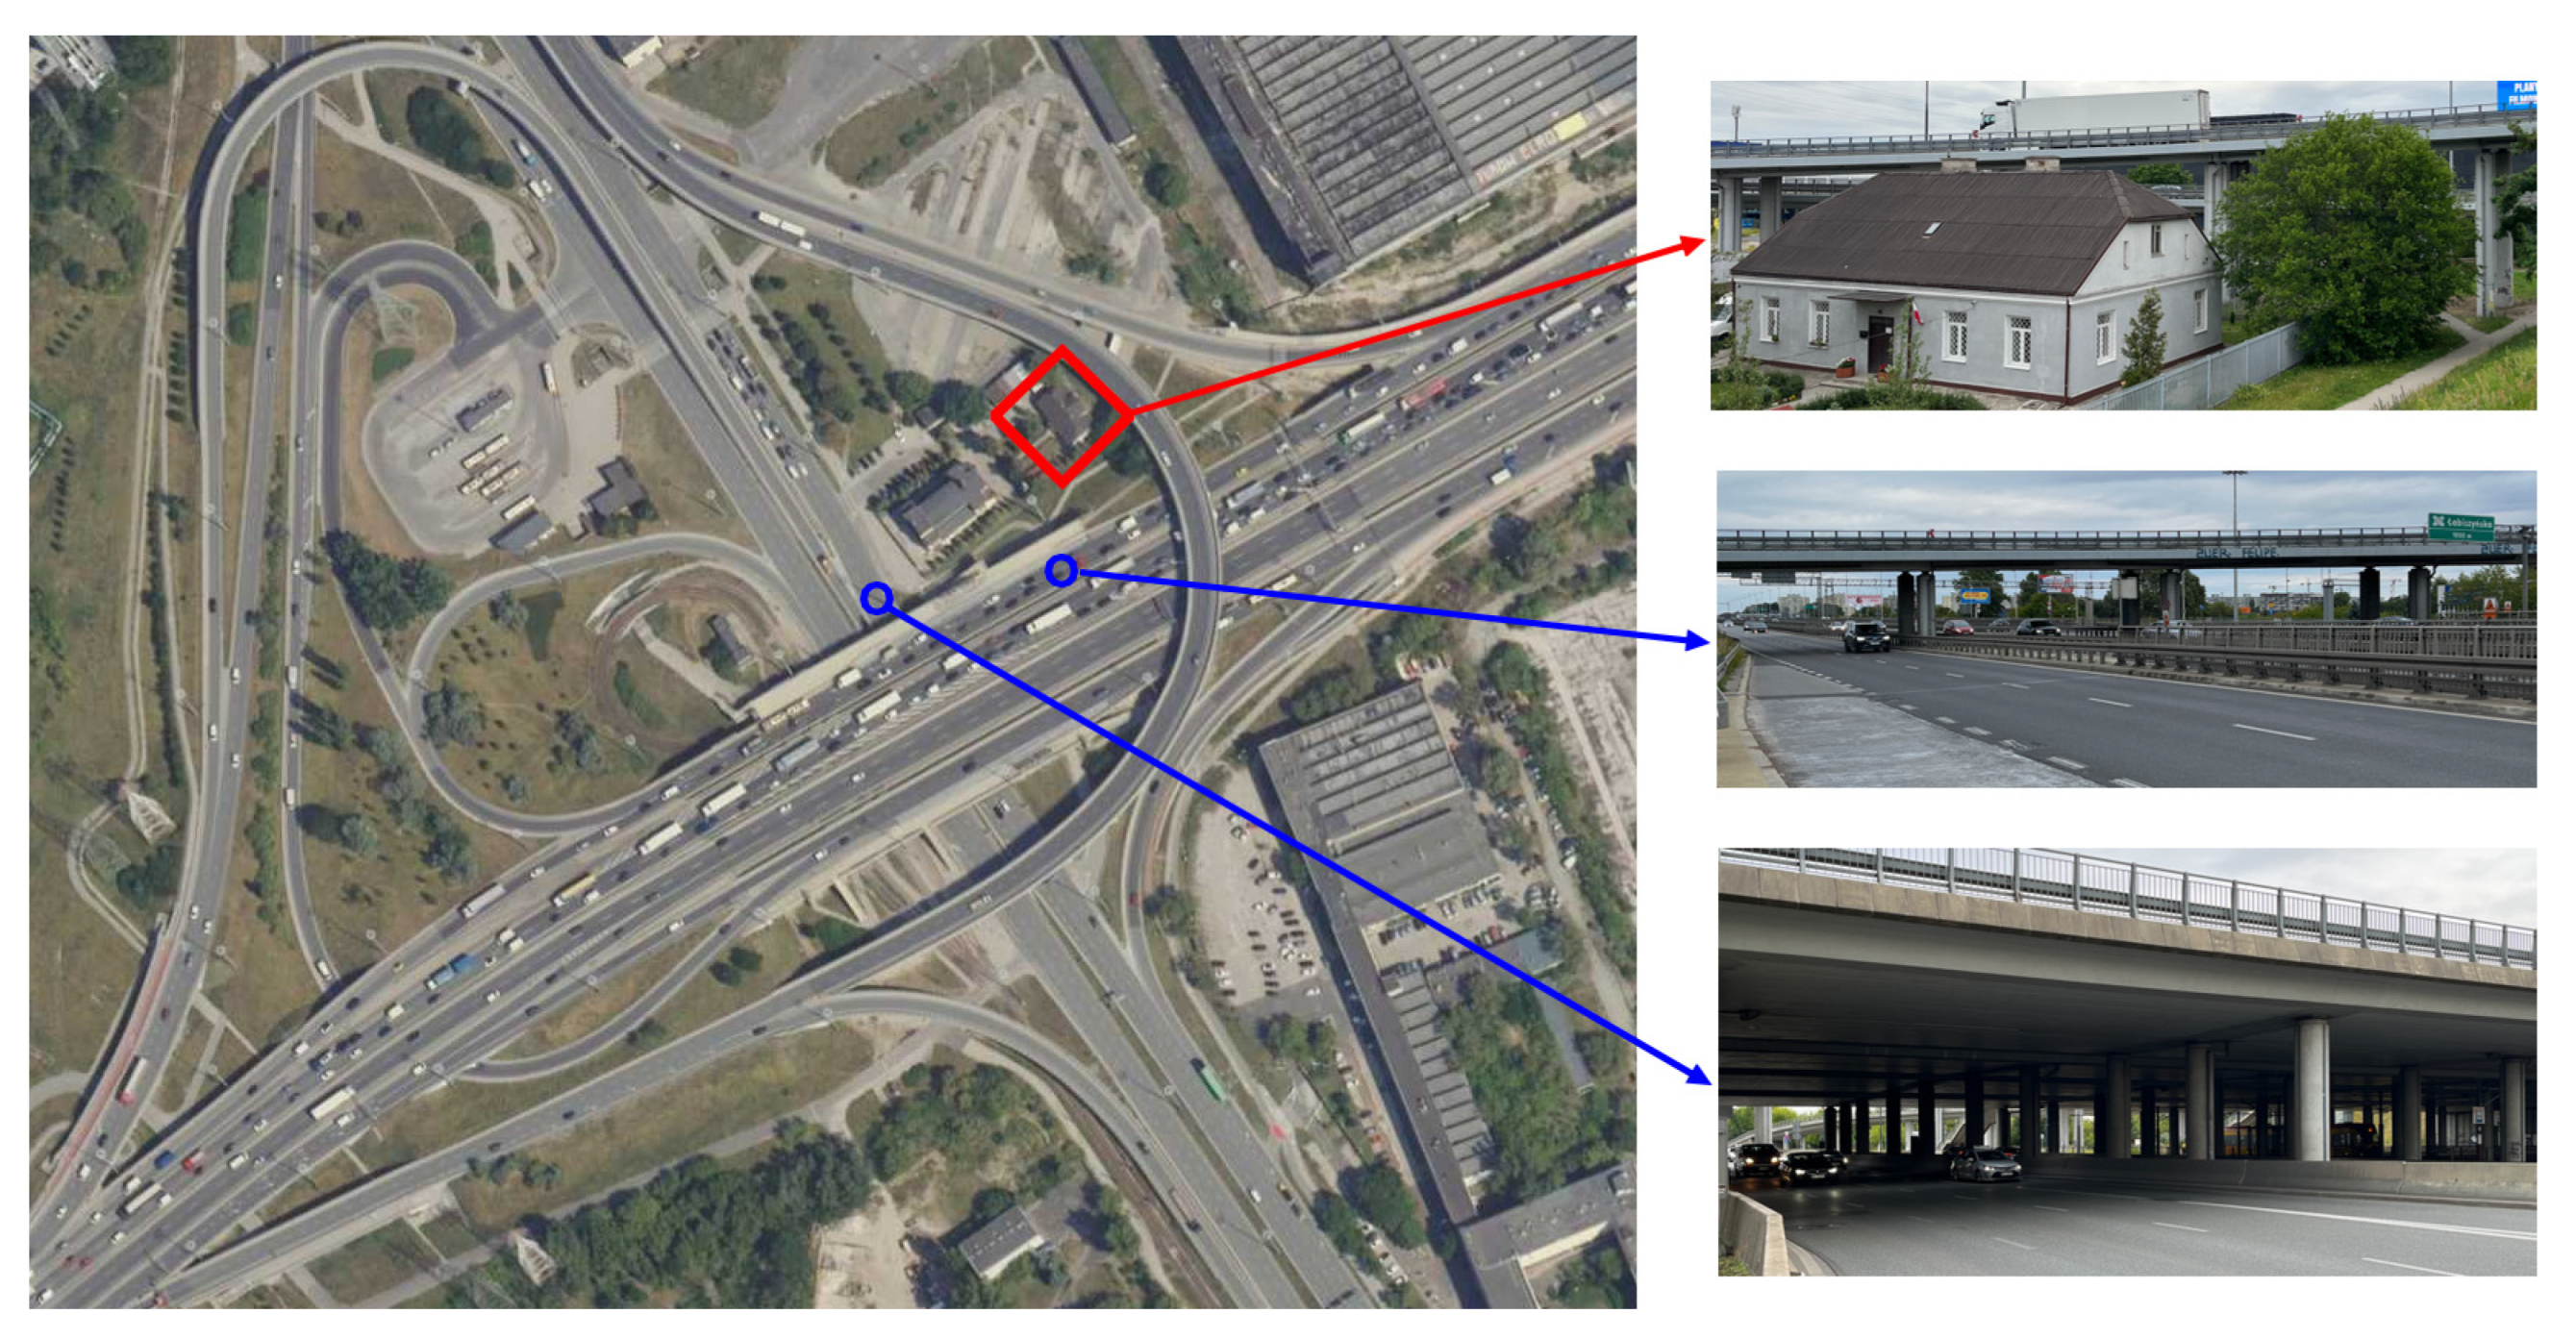
The subject of this study was a ground-floor residential building with an attic (Figure 2). Its floor is supported by masonry walls, and the roof is timber. The building lacks technical documentation and is listed in the municipal register of historic monuments. It is located adjacent to a grade-separated junction (Figure 3).

3.2. Research Problem

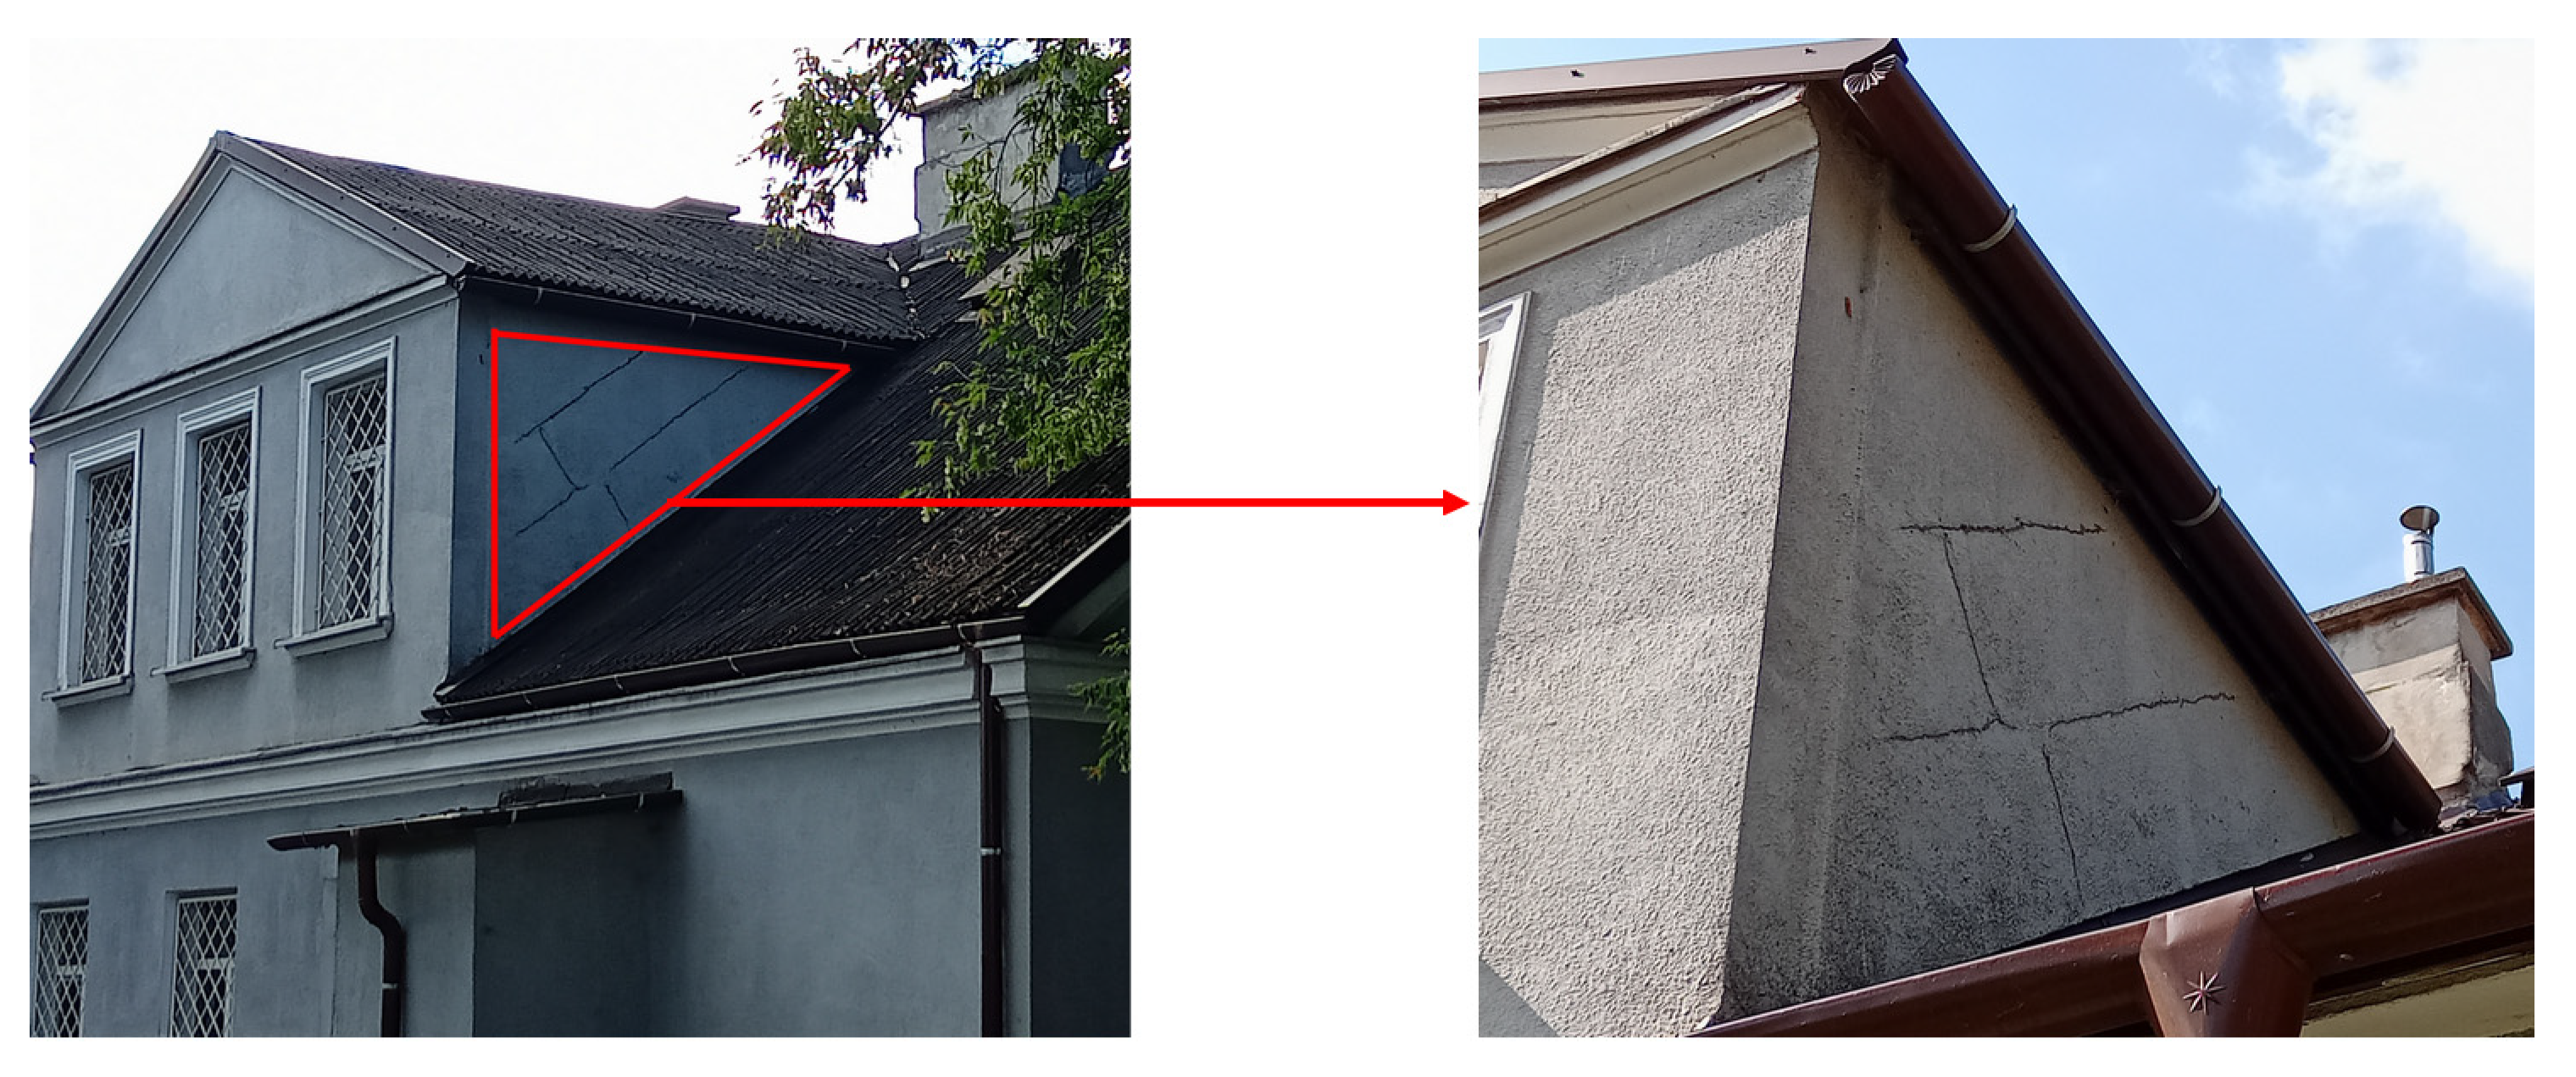
During the damage survey of the building, we observed diagonal cracks in the plaster on the dormer wall (Figure 4). An assessment was carried out to determine whether recorded traffic-induced vibrations were the decisive cause of cracking. The building is located 80 m from a voivodeship road, 35 m from an expressway, and 15 m from the viaduct. The voivodeship road lies directly on the ground surface. It is the main source of traffic-induced vibrations due to irregularities such as manholes (Figure 5).

3.3. Measurement of Traffic-Induced Vibrations

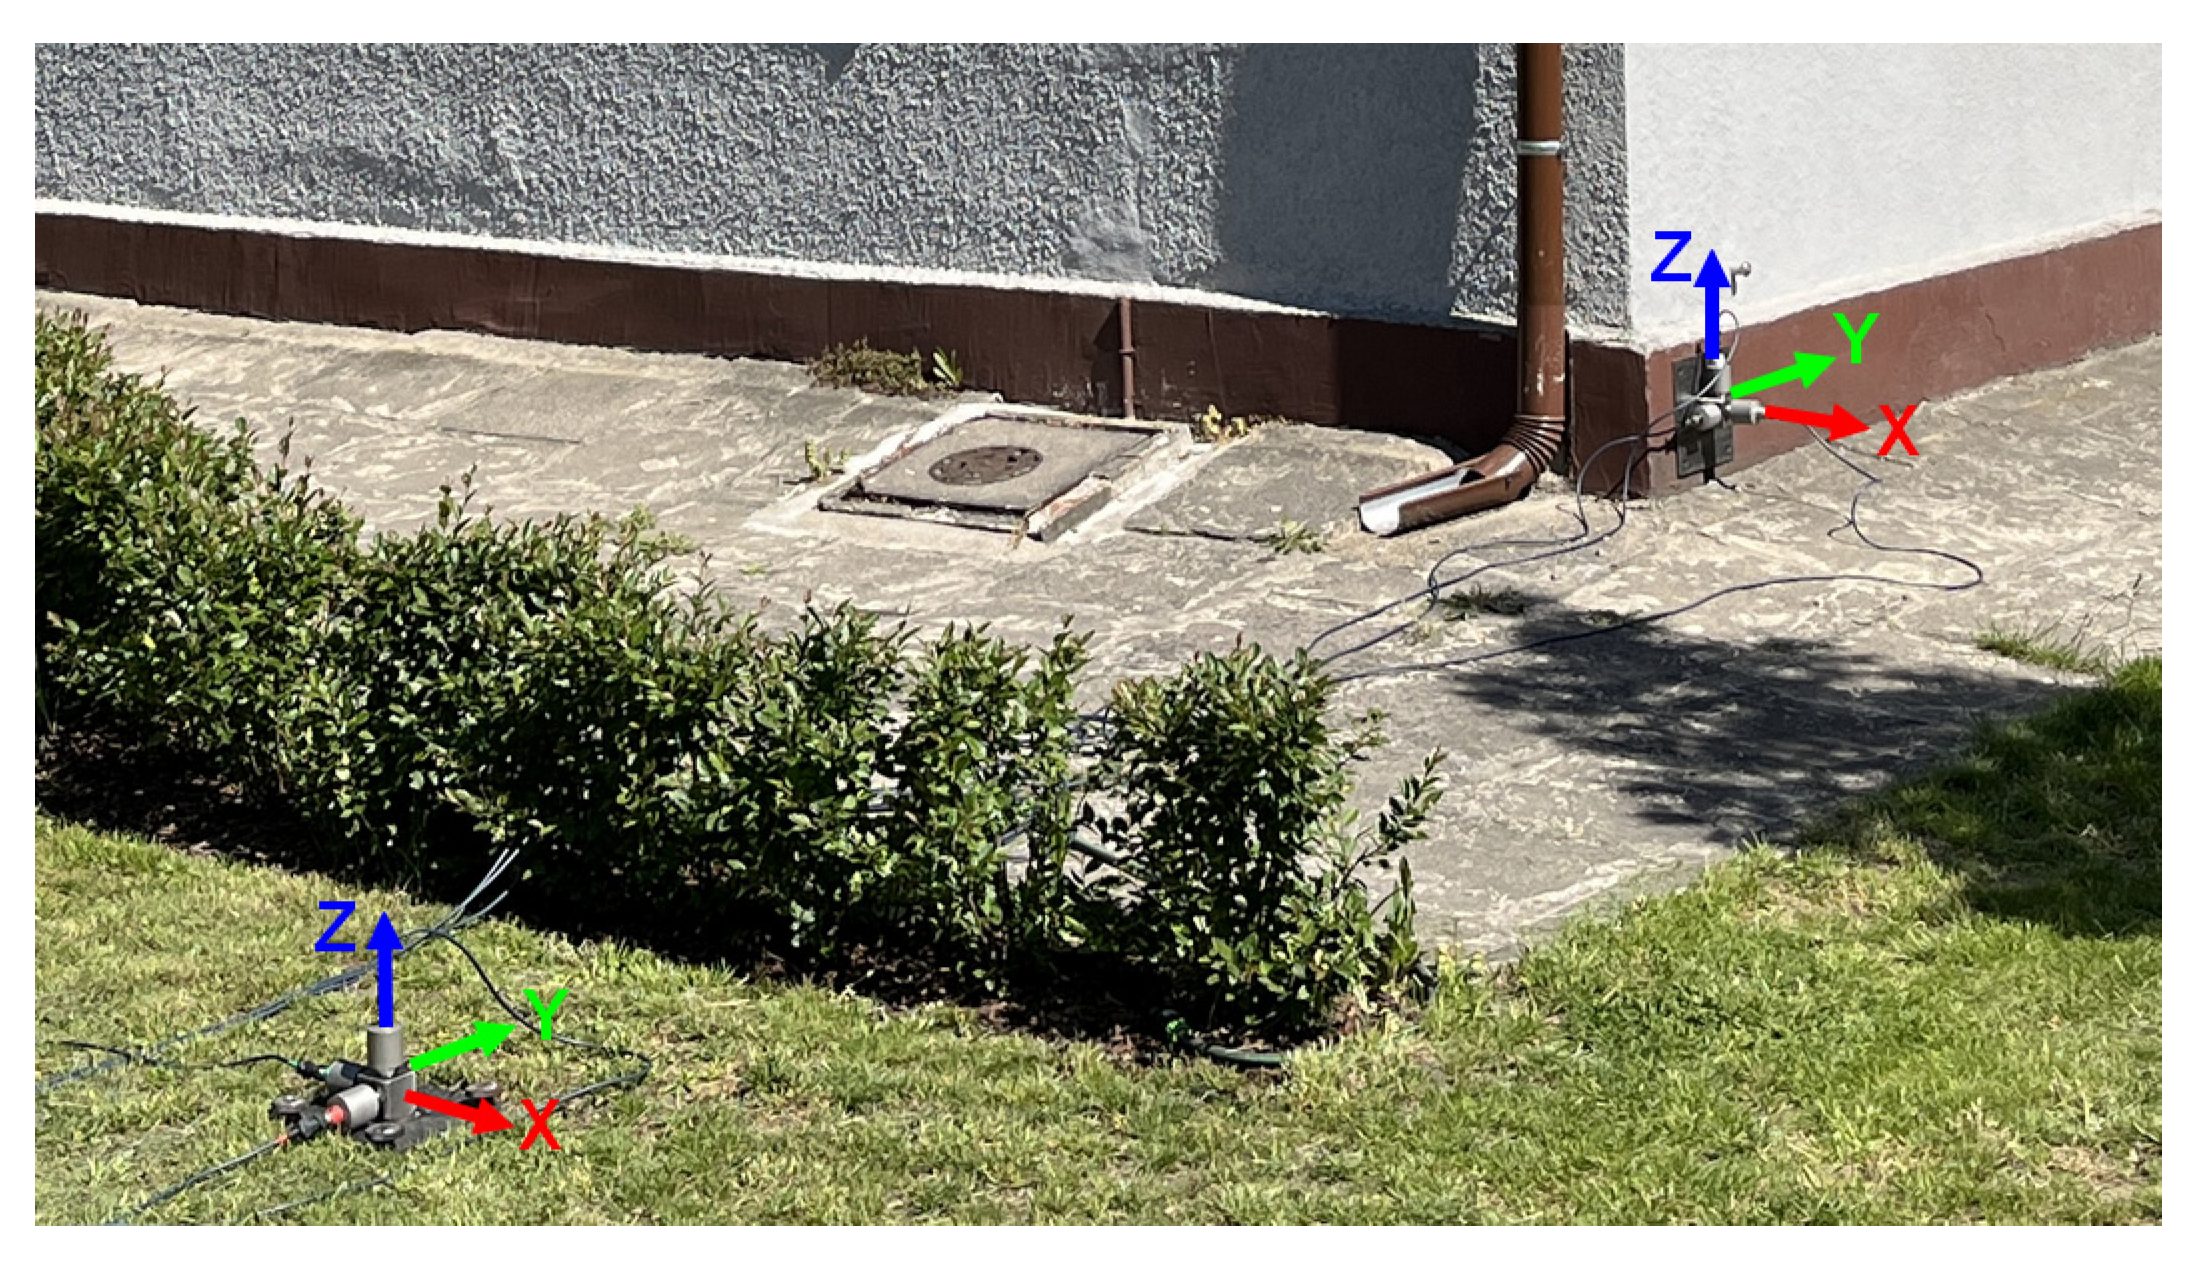
We measured traffic-induced vibrations simultaneously on the building and the ground for 20 min. This duration captured a representative number of vehicle passages and provided reliable data. We recorded vibration time histories of 8 s duration [8]. This yielded a total of 165 measurement signals per channel. The sensors were installed on the building, at the corners of the load-bearing walls at ground level. They were also placed on the ground 4 m in front of the building on the side facing the vibration source (Figure 6).
The measured quantity was vibration acceleration, recorded with DYTRAN USA 3191A1 accelerometers. The seismic sensors have a nominal sensitivity of 10 V/g, a measurement range of ±1.0 g, and a frequency range of 0.1 Hz to 1 kHz (±5%). A computer-based diagnostic analyser, KSD-400, was used for vibration recording. The device supports simultaneous acquisition of up to 16 measurement channels. It operates over a frequency range up to 10 kHz. During vibration measurements, the traffic intensity was recorded using a camera mounted on the roadside. The vehicle specifications and quantitative results are listed in Table 1.

3.4. Reconstruction of the Building’s Technical Documentation

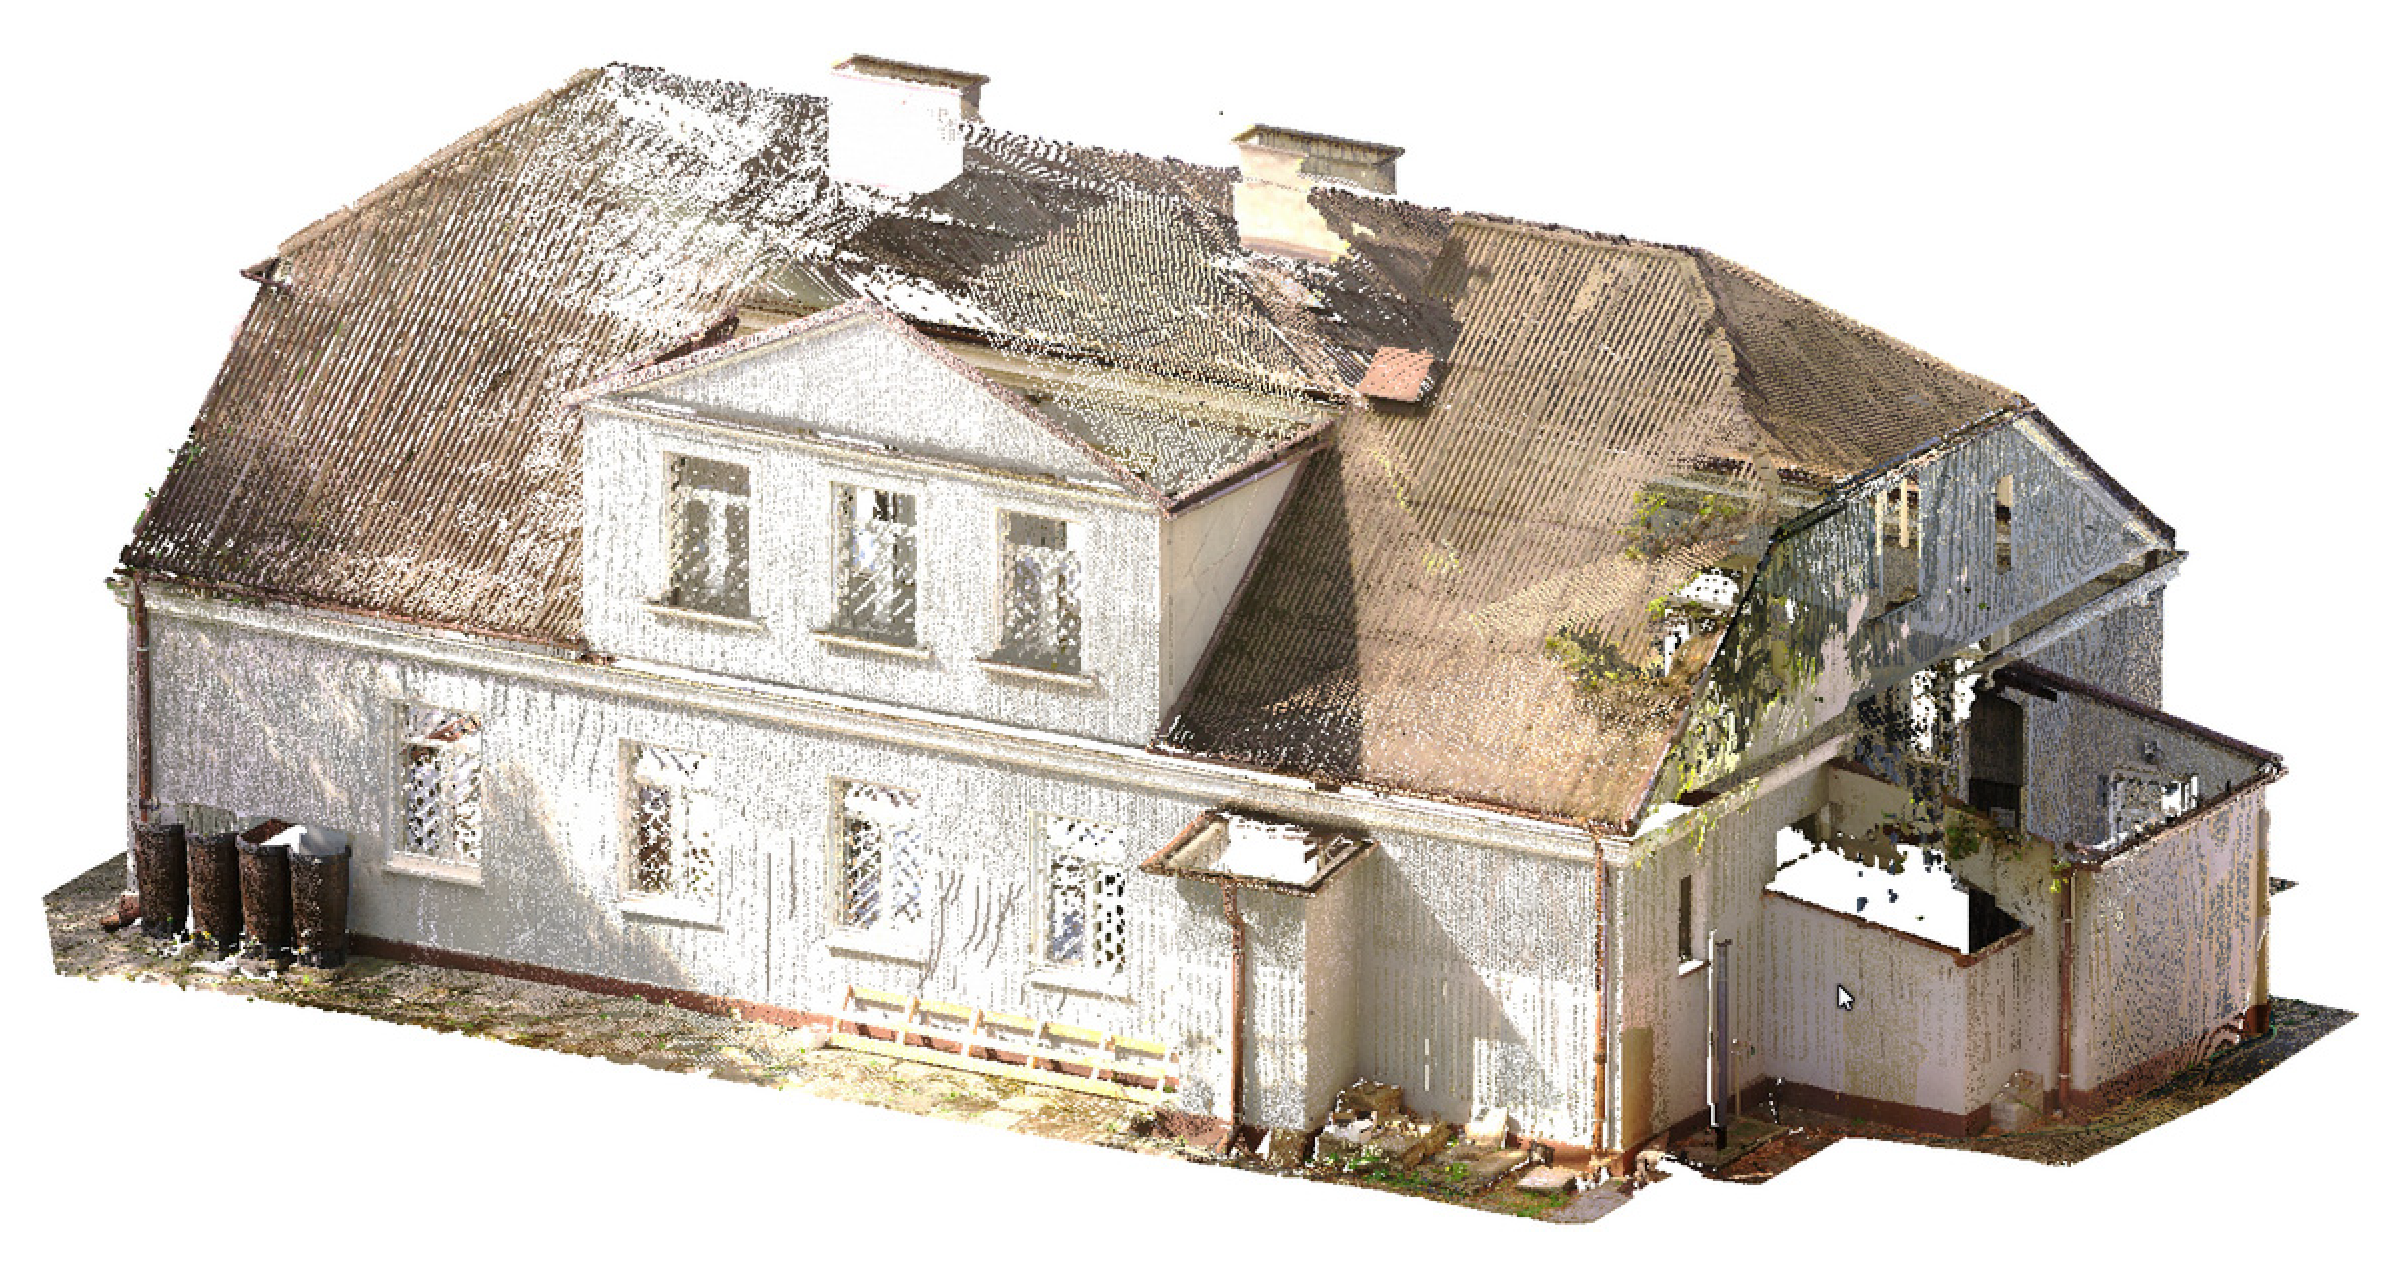
The building had no technical documentation or drawings. We performed 3D scanning during data preparation for the dynamic analysis. It was necessary to recreate the documentation, including plans, sections, and a 3D model. Manual point measurements and building modeling would have taken a very long time. Much data could have been omitted. We used a FARO Focus S70 scanner to scan the building. The device records at a rate of 1 million points per second. Its effective range is approximately 0.6 to 70.0 m, and its maximum measurement accuracy is ±1 mm. The resulting model can be used directly for BIM design, 2D/3D surveying, and structural analyses. The method ensures fast, simple fieldwork and reduces dimensional errors while providing high accuracy. Figure 7 shows, in red, the scanner positions selected for the external survey of the building.
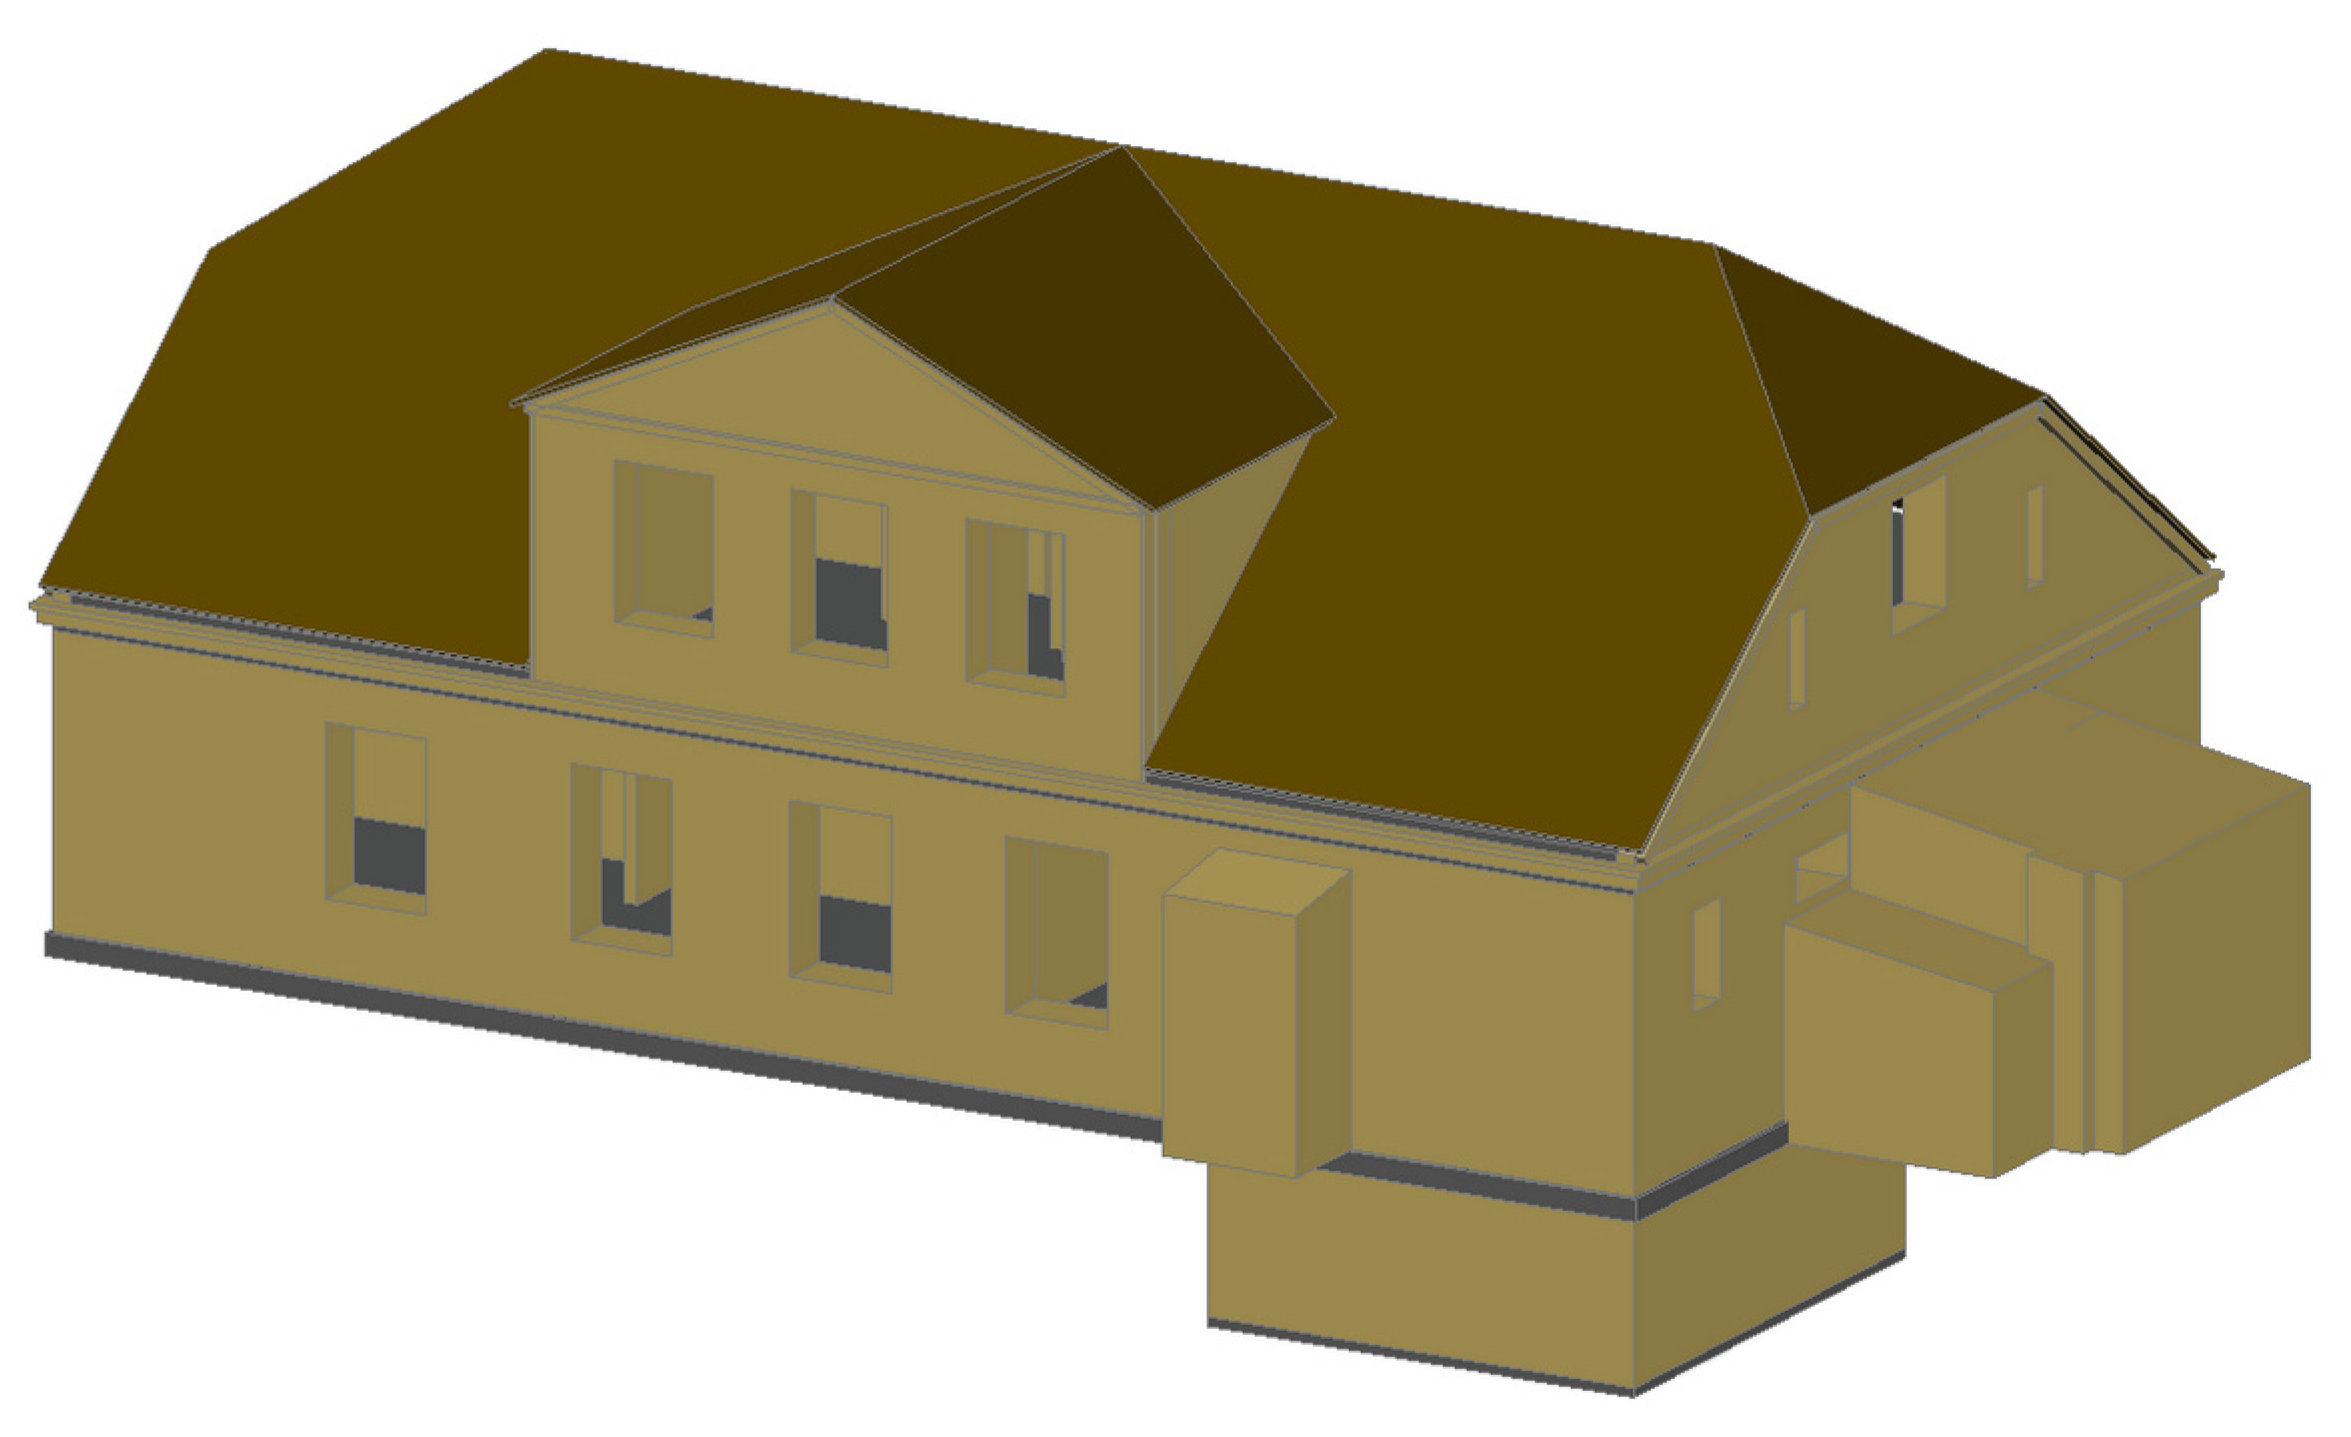
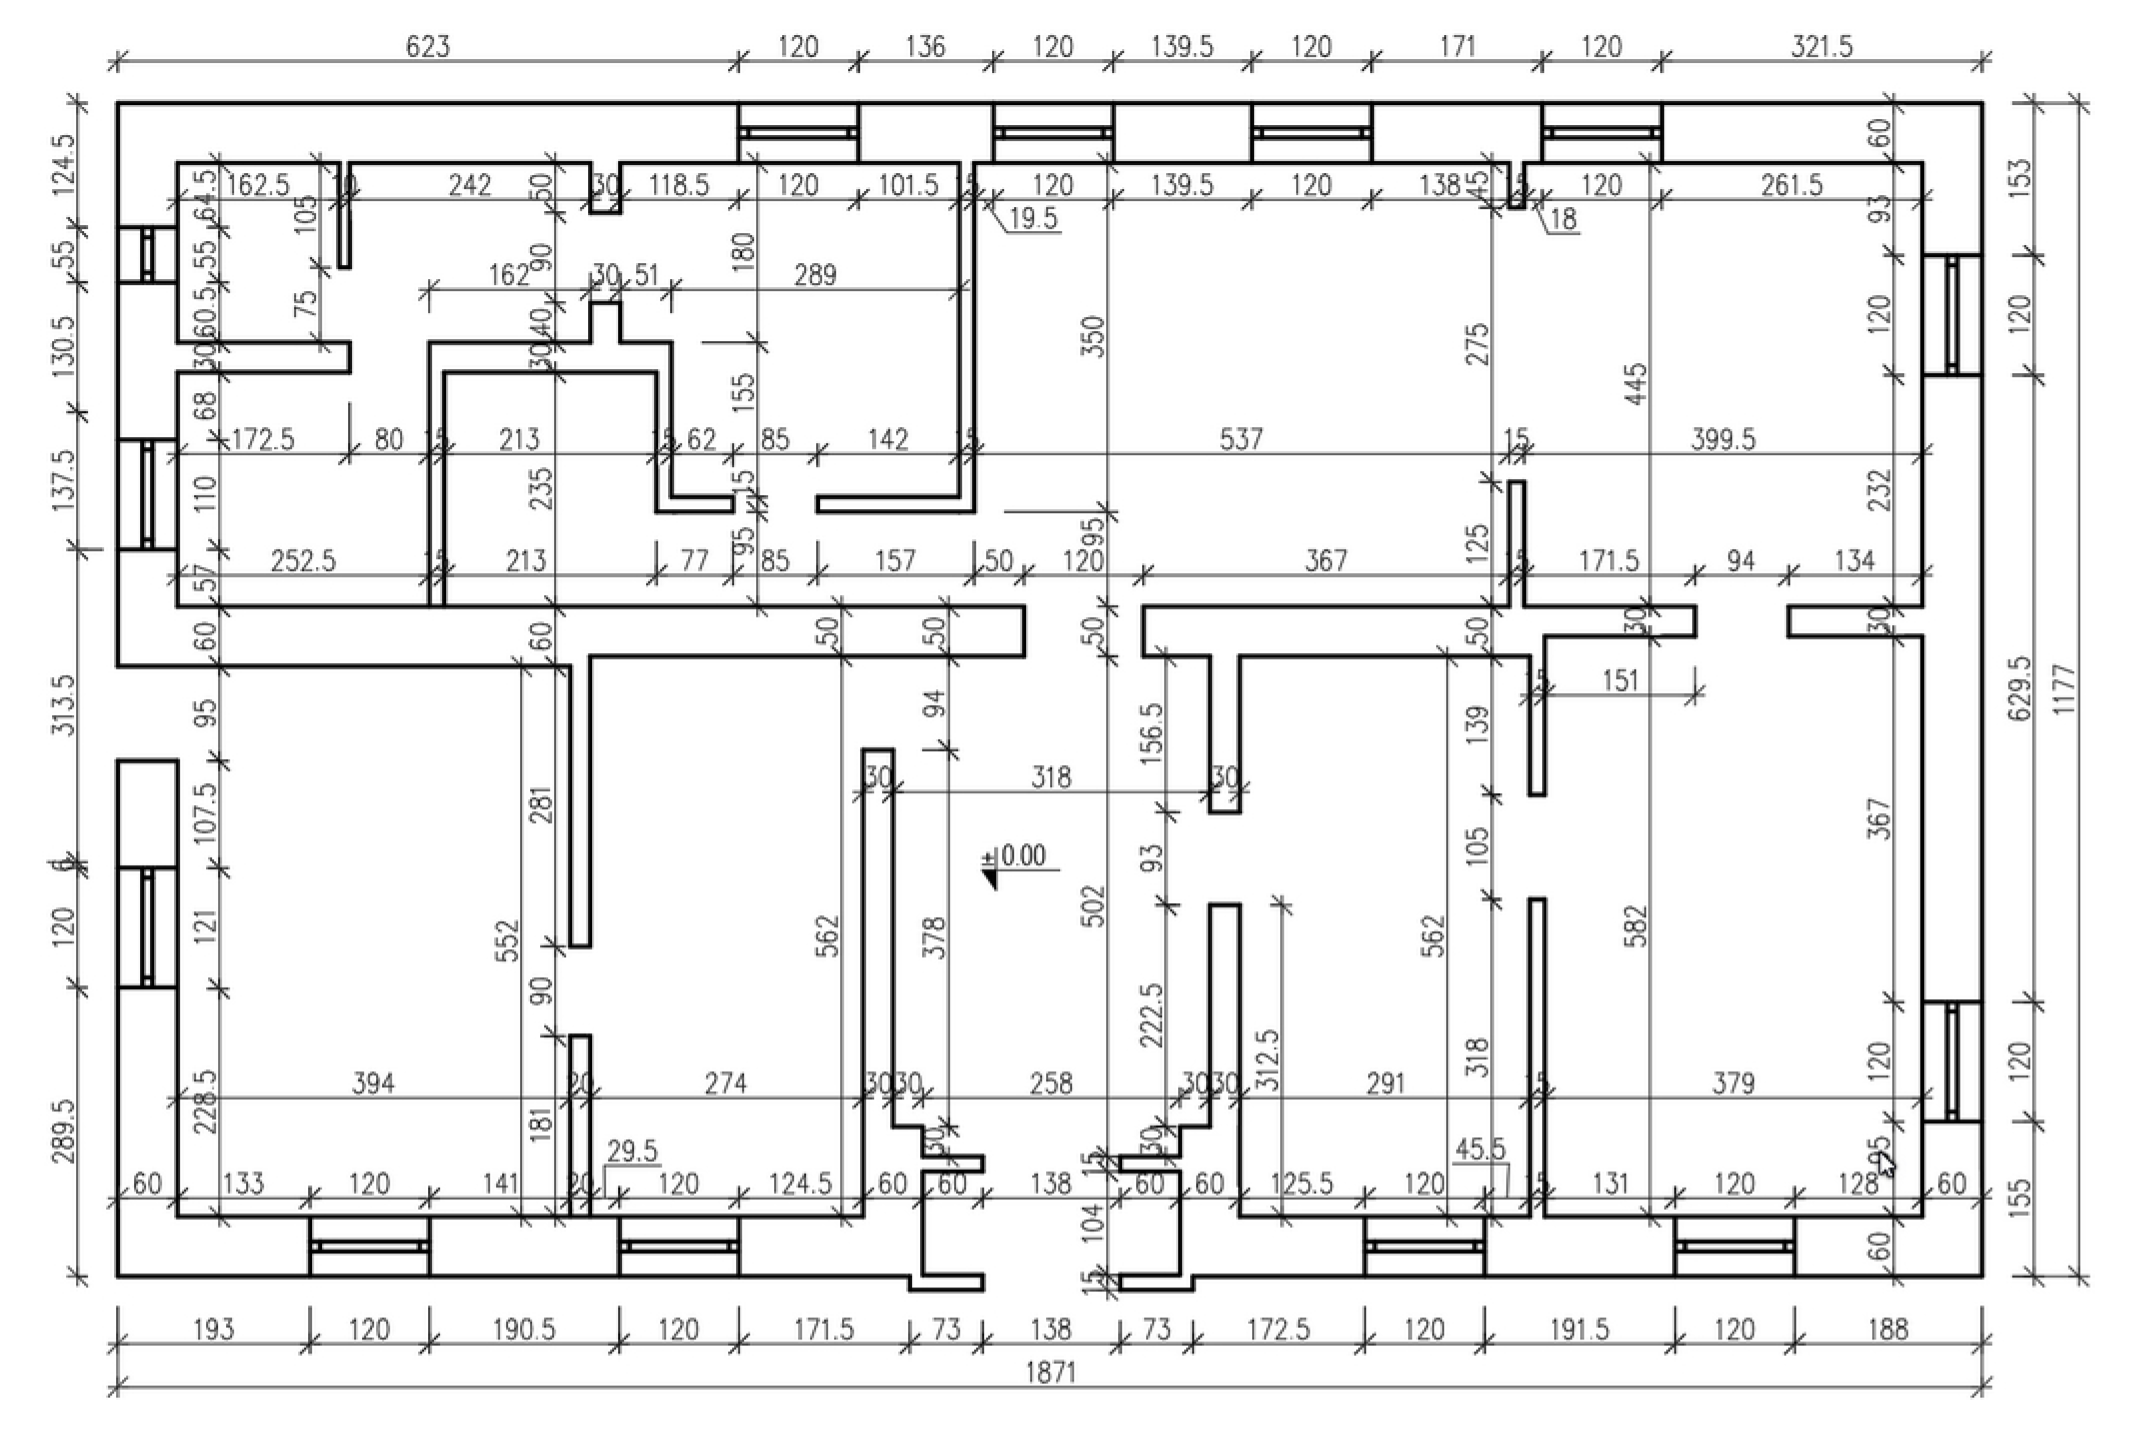
The device recorded the geometric data of the building and stored it digitally in the form of a point cloud (Figure 8). On this basis, it was possible to produce CAD drawings, such as a 3D model of the building (Figure 9) and a 2D floor plan (Figure 10).

3.5. Numerical Model of the Building

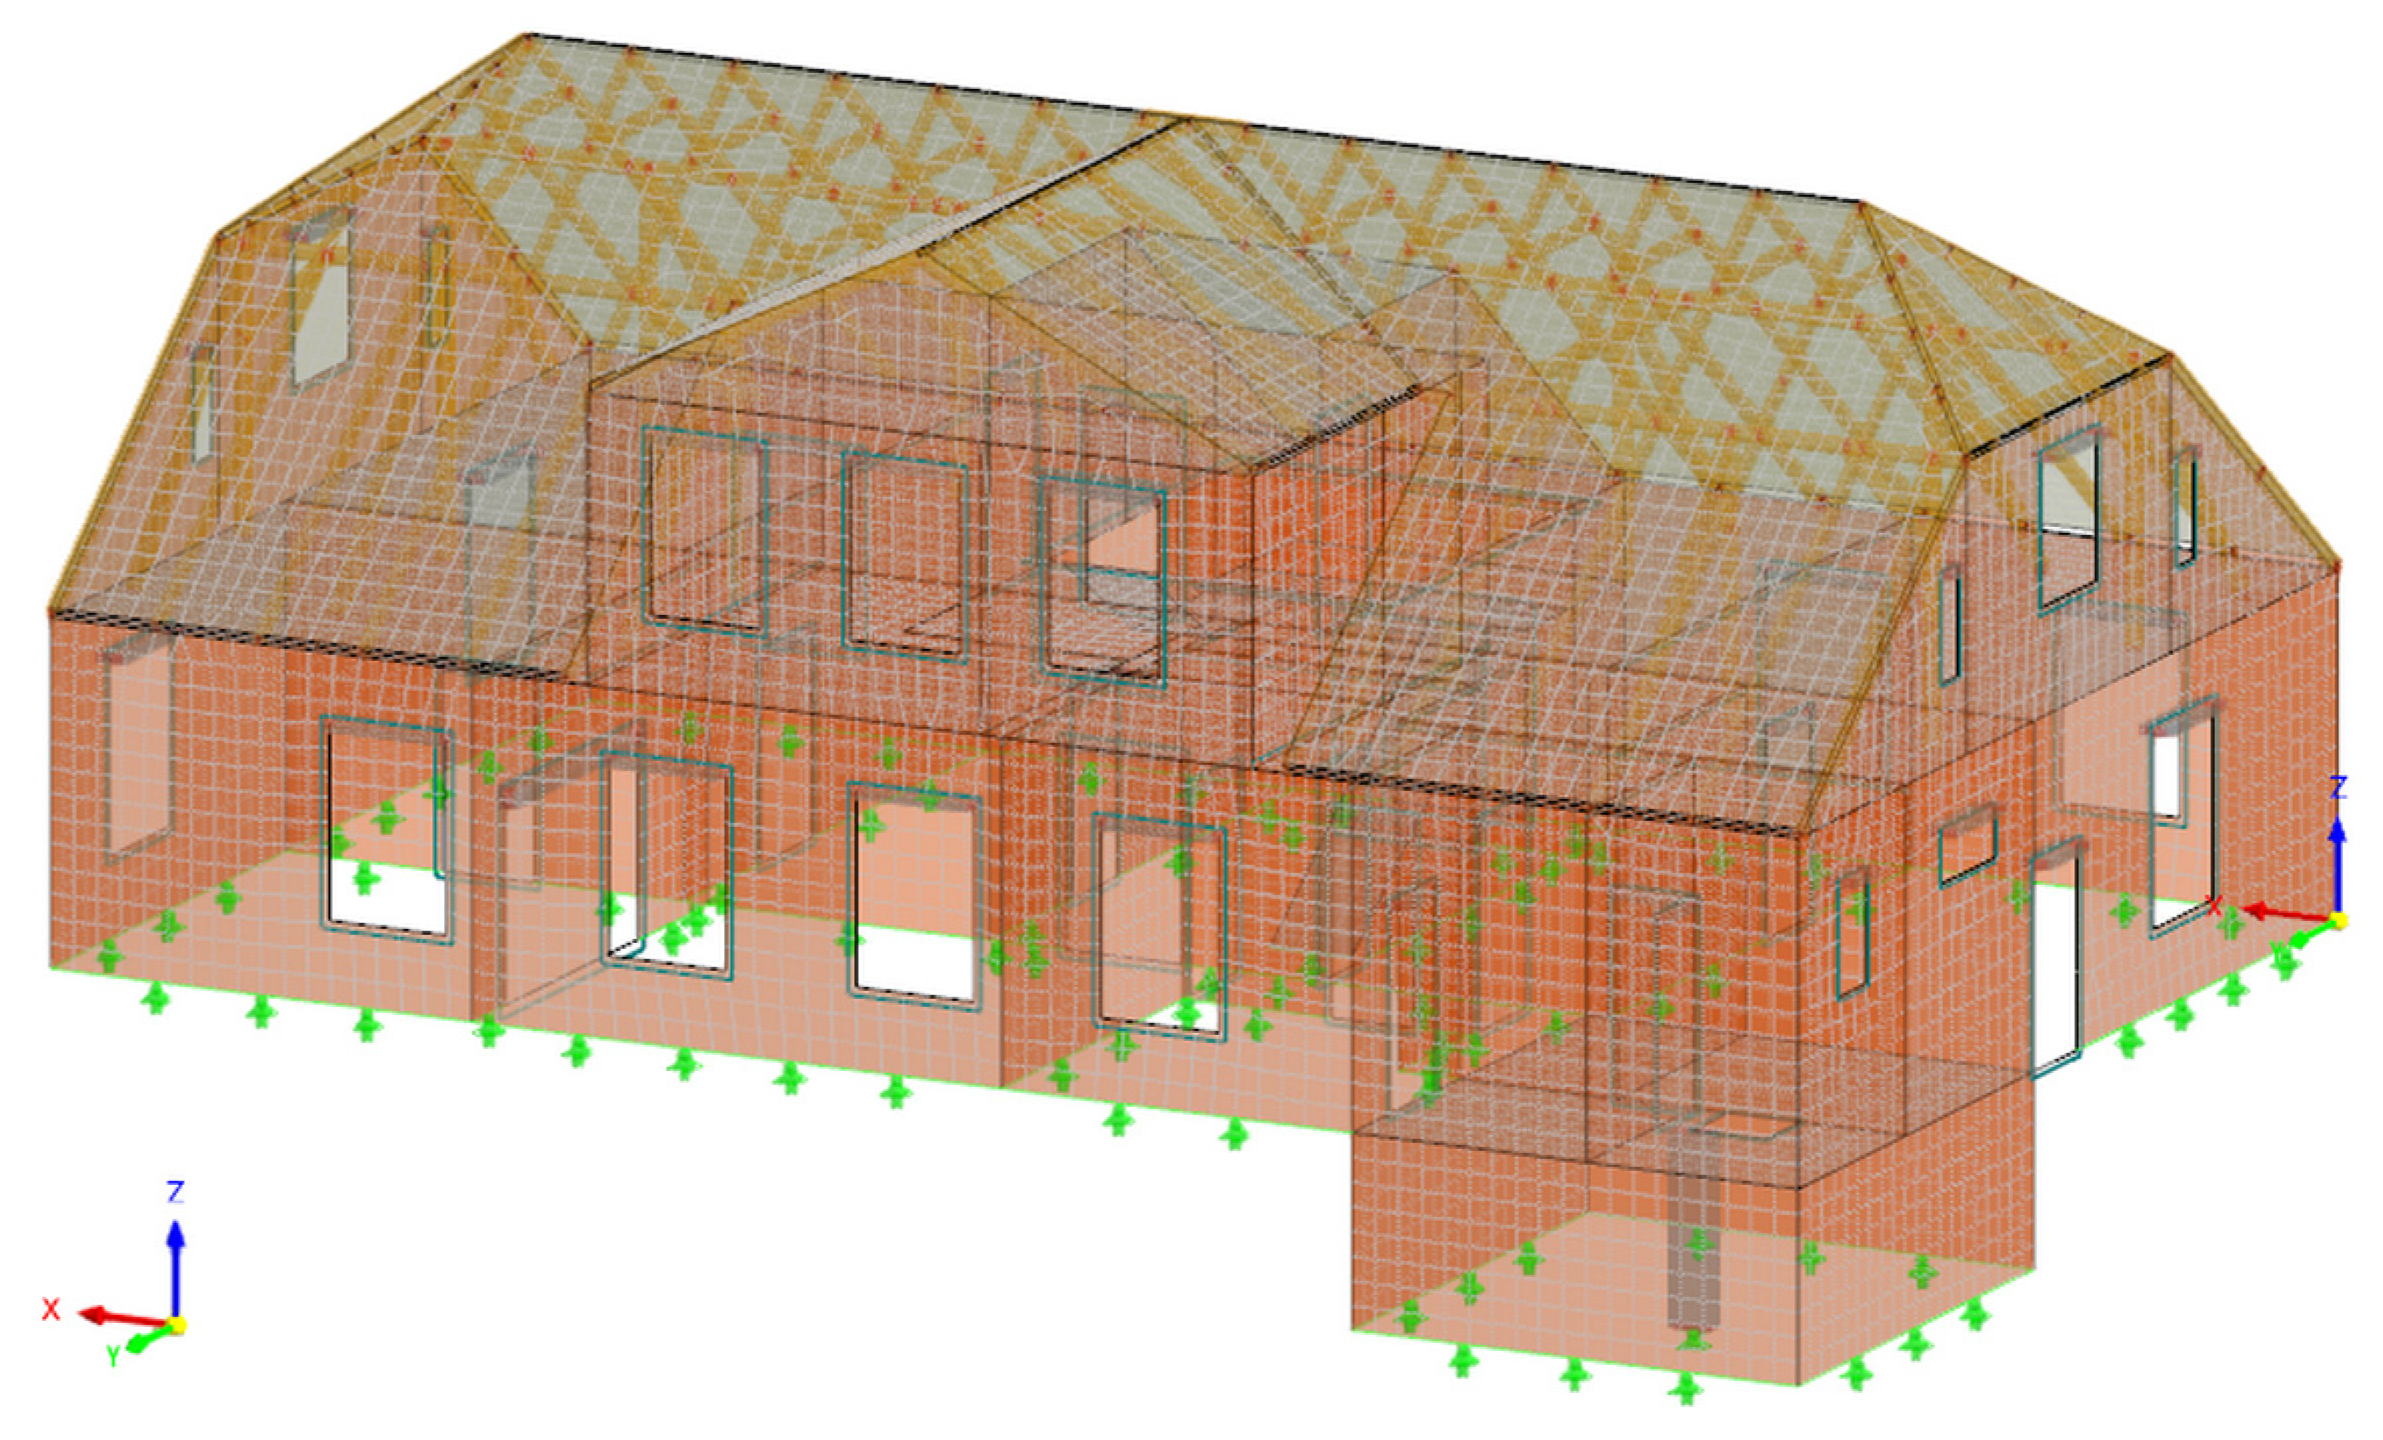
We developed a three-dimensional numerical model using the finite element method in Dlubal RFEM 6.12 software. Structural components, such as beams, were represented using beam elements. The surface components, including walls and floors, were modelled using shell elements (Figure 11). The target finite element size was 0.25 m. The software verified the quality of the mesh. The model consists of 1742 member elements and 17,941 surface elements. The geometric dimensions were adopted based on a building survey (Figure 9 and Figure 10).
The building was subjected to the three load cases (LCs). LC1 is a permanent action, including self-weighting and finishing. LC2 is a variable action with an imposed load of 2.00 kN/m2, and LC3 is a dynamic action from traffic-induced inertial forces. The material parameters adopted for the structural model were as follows:
  • Concrete: Young’s modulus E = 29.0 GPa, mass density ρ = 2500 kg/m3;
  • Clay brick: Young’s modulus E = 5.5 GPa, mass density ρ = 1900 kg/m3;
  • Wood: Young’s modulus E = 9.5 GPa, mass density ρ = 570 kg/m3.
The analysed building was evaluated in accordance with the Polish [8] and Eurocode [10] standards. We carried out a comprehensive evaluation. The procedure comprises a numerical model of the building, calculation of inertial forces and their application to the structure in combination with static loads. The structure was verified in accordance with the Eurocode standard [10] for the ultimate limit state (ULS) associated with structural failure. For the ULS of internal member failure, we have to check if E d R d . Here, E d is the design effect of actions and R d is the design resistance [10].
The building was assumed to be founded on a strip footing. As neither soil testing nor foundation excavation was performed, their actual parameters remain unknown. The elastic parameters of the soil depend on the type of soil, the dimensions of the footing, and load transfer to the subsoil. Three vertical subgrade reaction moduli were used in the analysis. They represent an infinitely rigid subsoil (Cx = Cy = Cz = ∞), dense subsoil (Cz = 90,000 kN/m3), and loosely compacted subsoil (Cz = 9000 kN/m3). For the horizontal subgrade reaction modulus, values of Cx = Cy = 1 / 3 C z were assumed. These values were applied at the foundations of the numerical model. They span boundary conditions from ideal rigidity (Figure 12a) to flexible support (Figure 12b). Additionally, nonlinearity in the form of foundation uplift was applied to the flexible support.

4. Results

4.1. Assessment of Vibration Transmission from the Soil to the Building

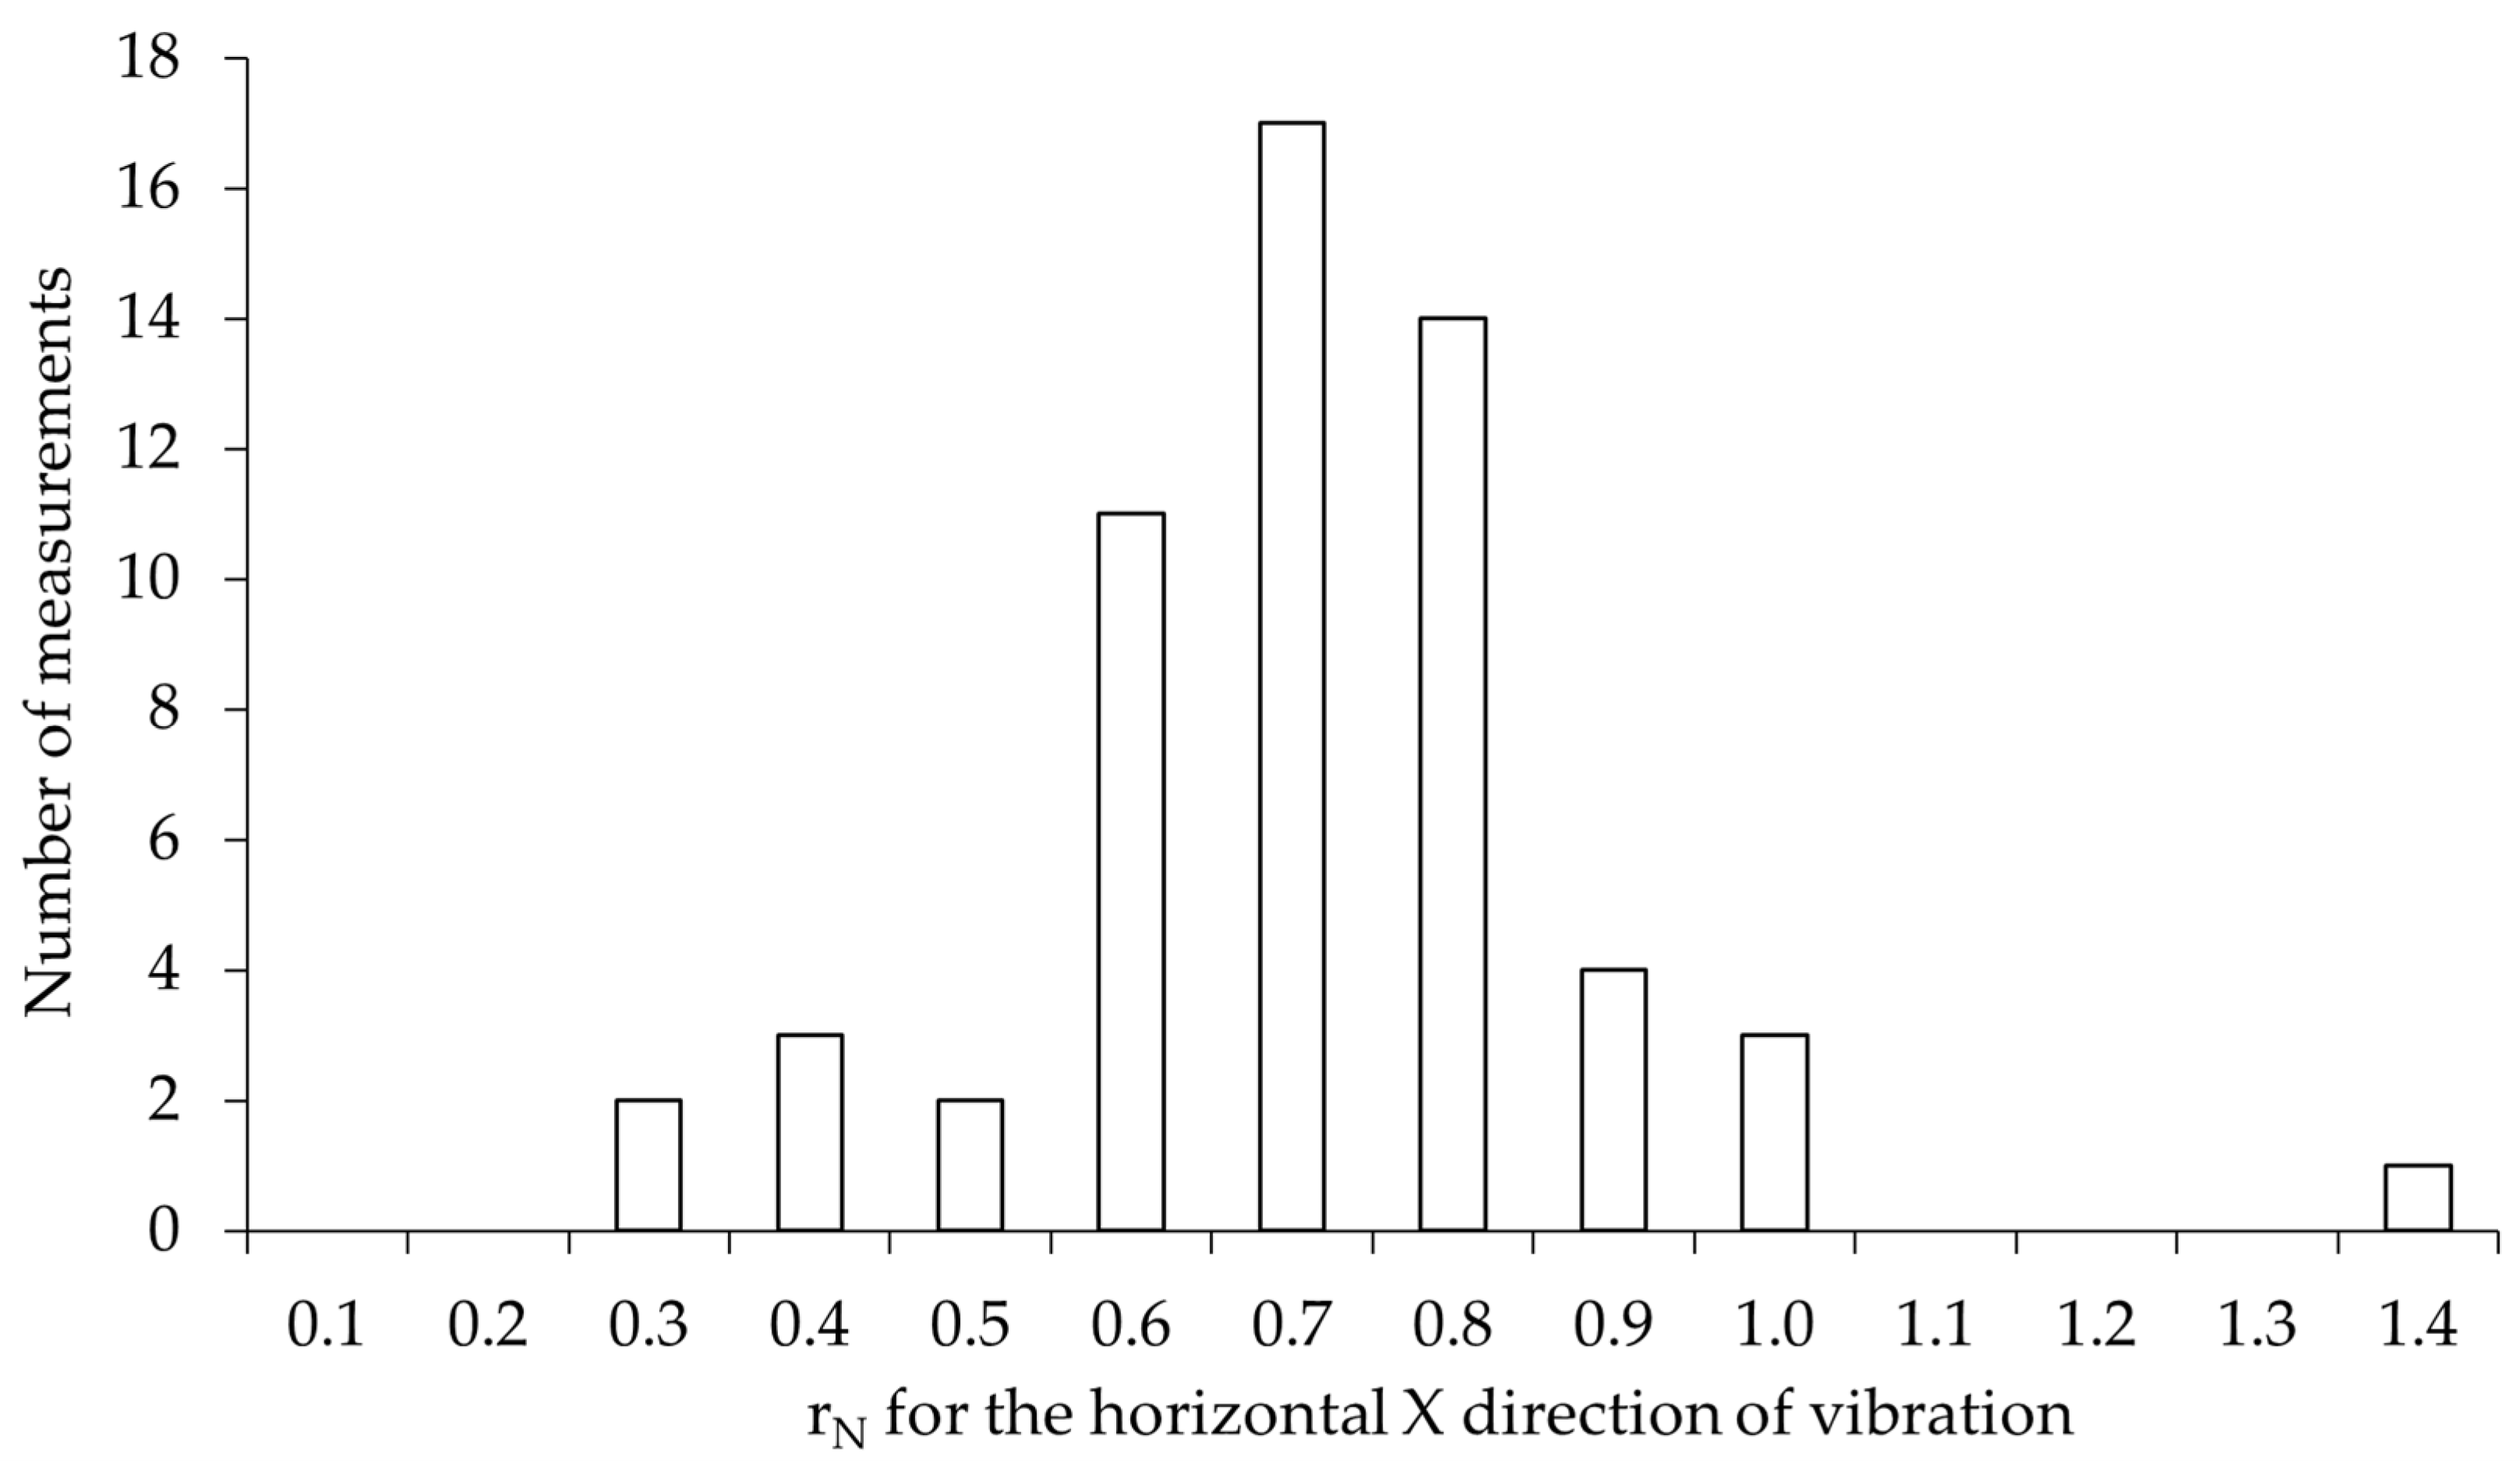
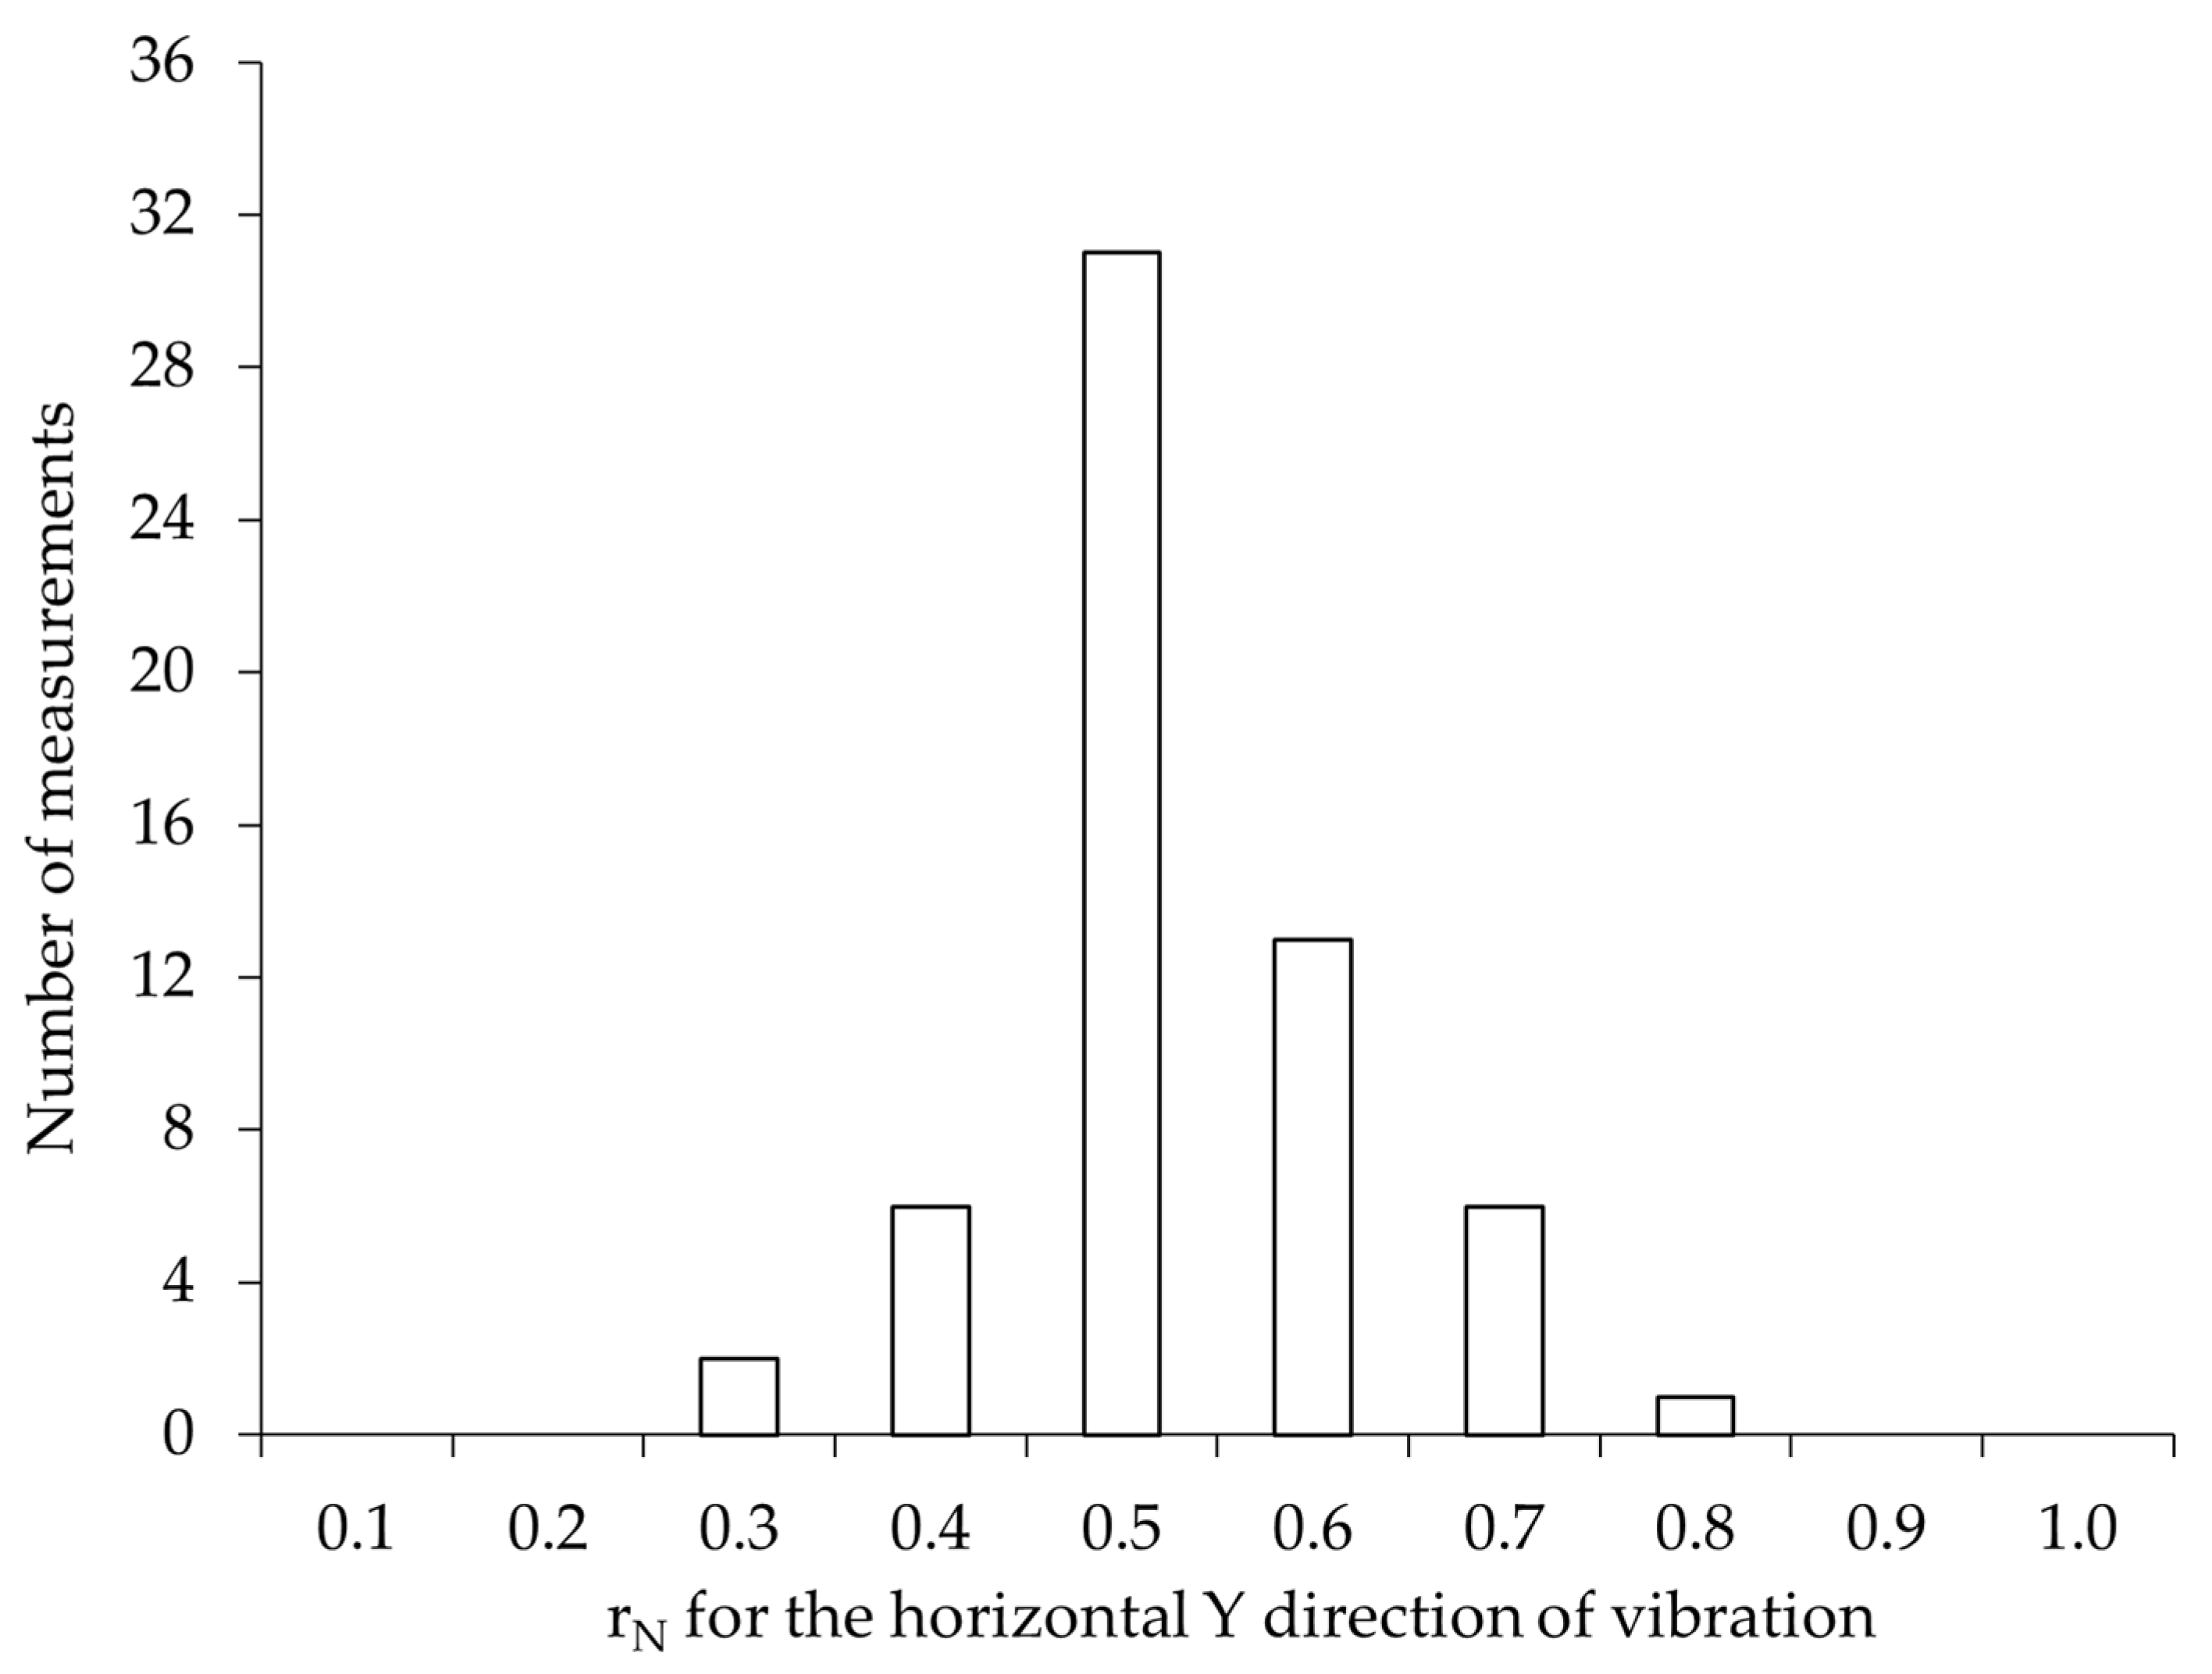
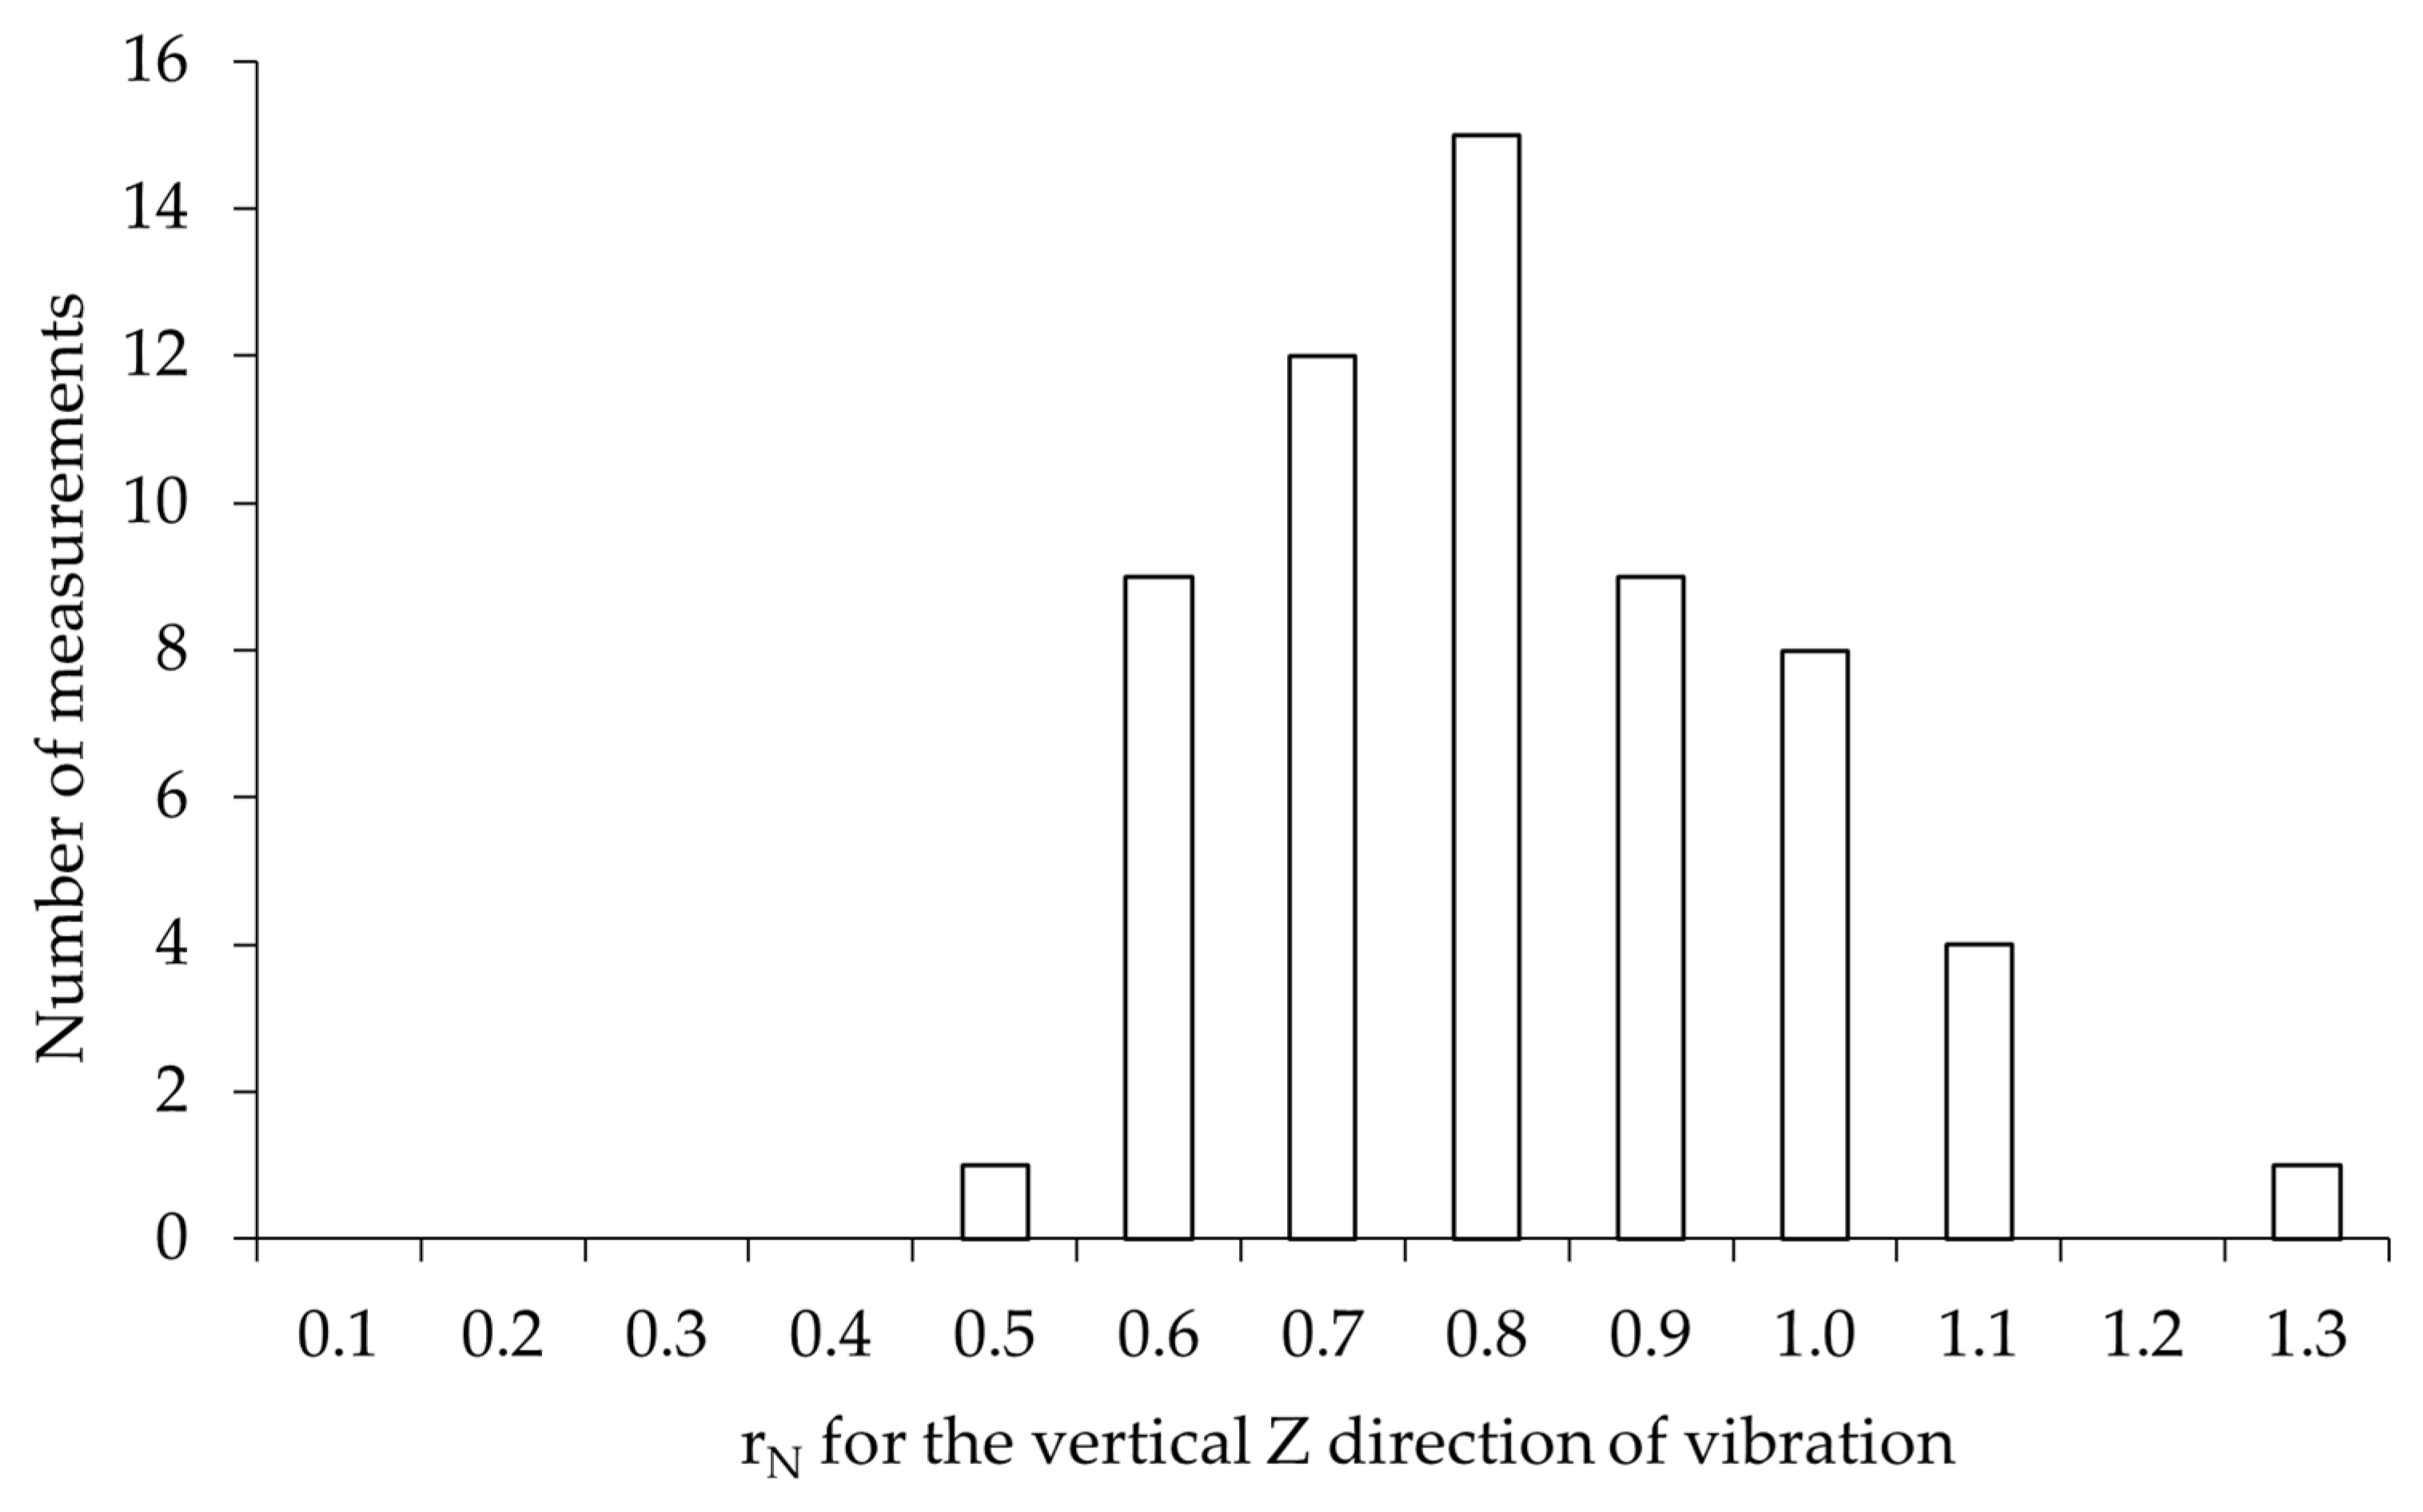
In the first stage of this study, we assessed the transmission of vibrations from the soil to the building. We then select representative vibration records by comparing vibrations at the base of the building with those measured on the soil surface (Figure 6). As a measure of vibration reduction, the amplitude reduction coefficient r N was adopted. The coefficient is defined as r N = a b , m a x / a s , m a x , where a b , m a x and a s , m a x denote the maximum amplitudes of vibration accelerations of the building and the soil, respectively [7]. The calculated values of the reduction coefficient are presented in the form of histograms for the horizontal X-direction (Figure 13), horizontal Y-direction (Figure 14), and vertical Z-direction (Figure 15). Vibration records of both the soil and the building with closely matching dominant frequencies were selected, following the recommendations in [23].
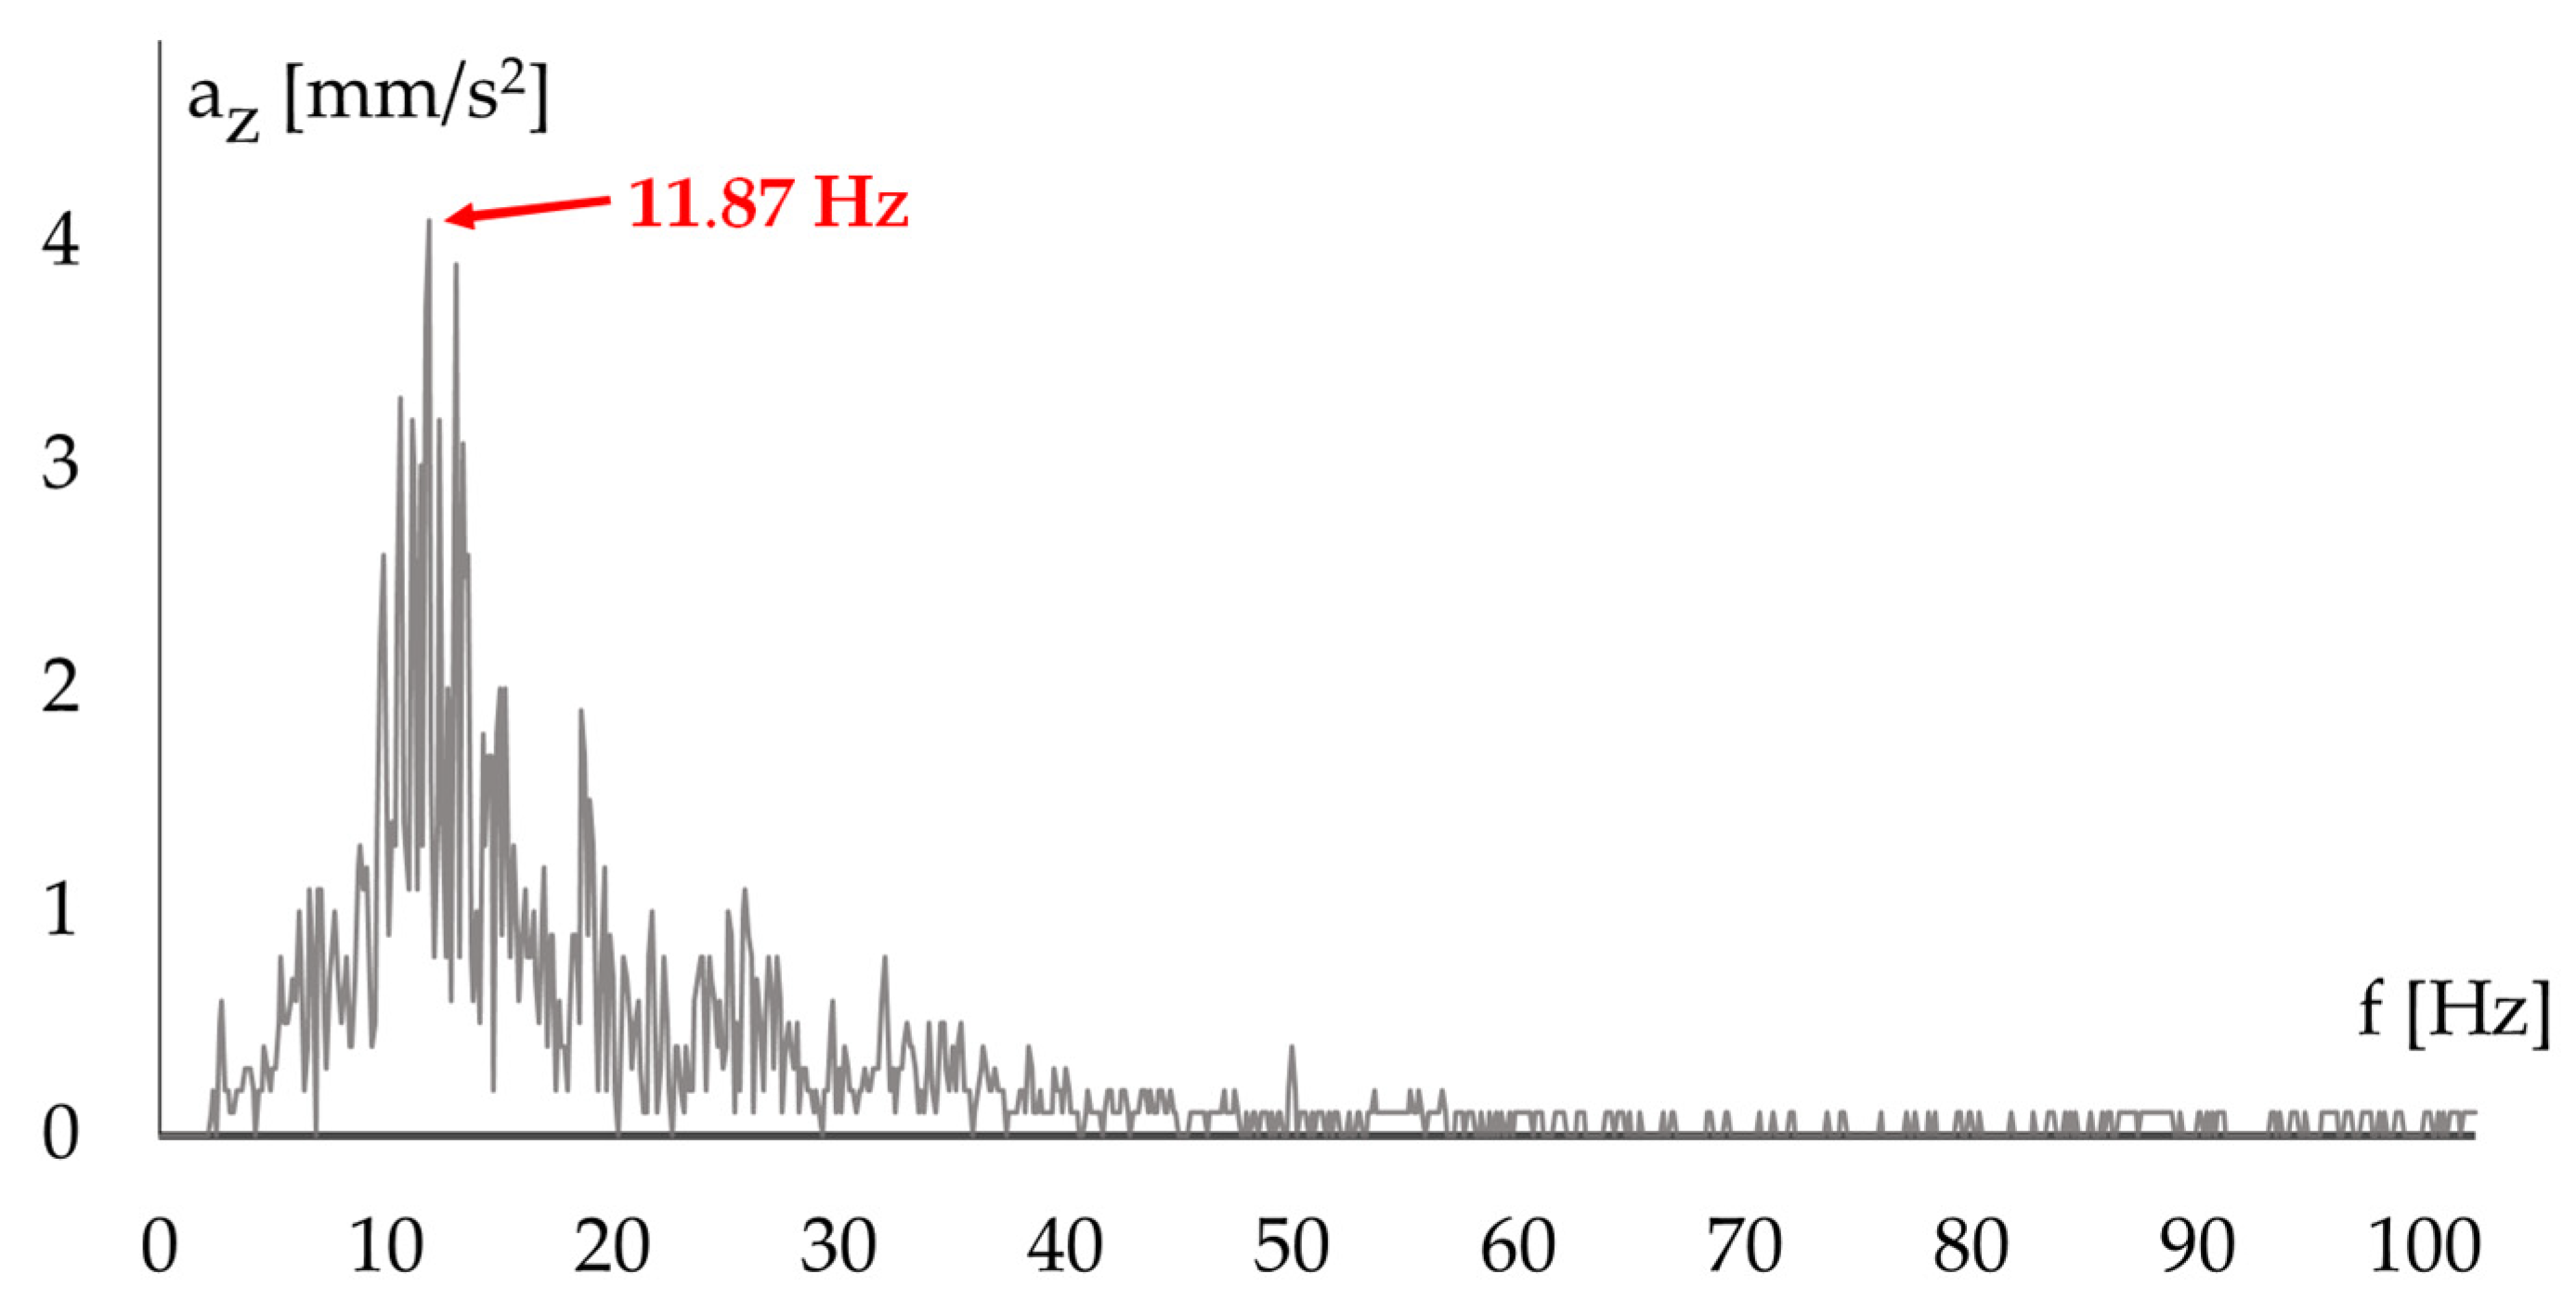
The results showed single peaks in different ranges. For horizontal vibrations, the values were 0.7 (Figure 13) and 0.5 (Figure 14), whereas for vertical vibrations, the value was 0.8 (Figure 15). These corresponded to amplitude reductions of 30%, 50%, and 20%, respectively. An amplitude increase was observed in the horizontal X (Figure 13) and vertical Z (Figure 15) directions. To illustrate this amplification, we present the vibration frequency spectra recorded on the building (Figure 16 and Figure 17). Dominant frequencies are marked in the figures to assess potential resonance.

4.2. Selection of a Representative Vibration Record

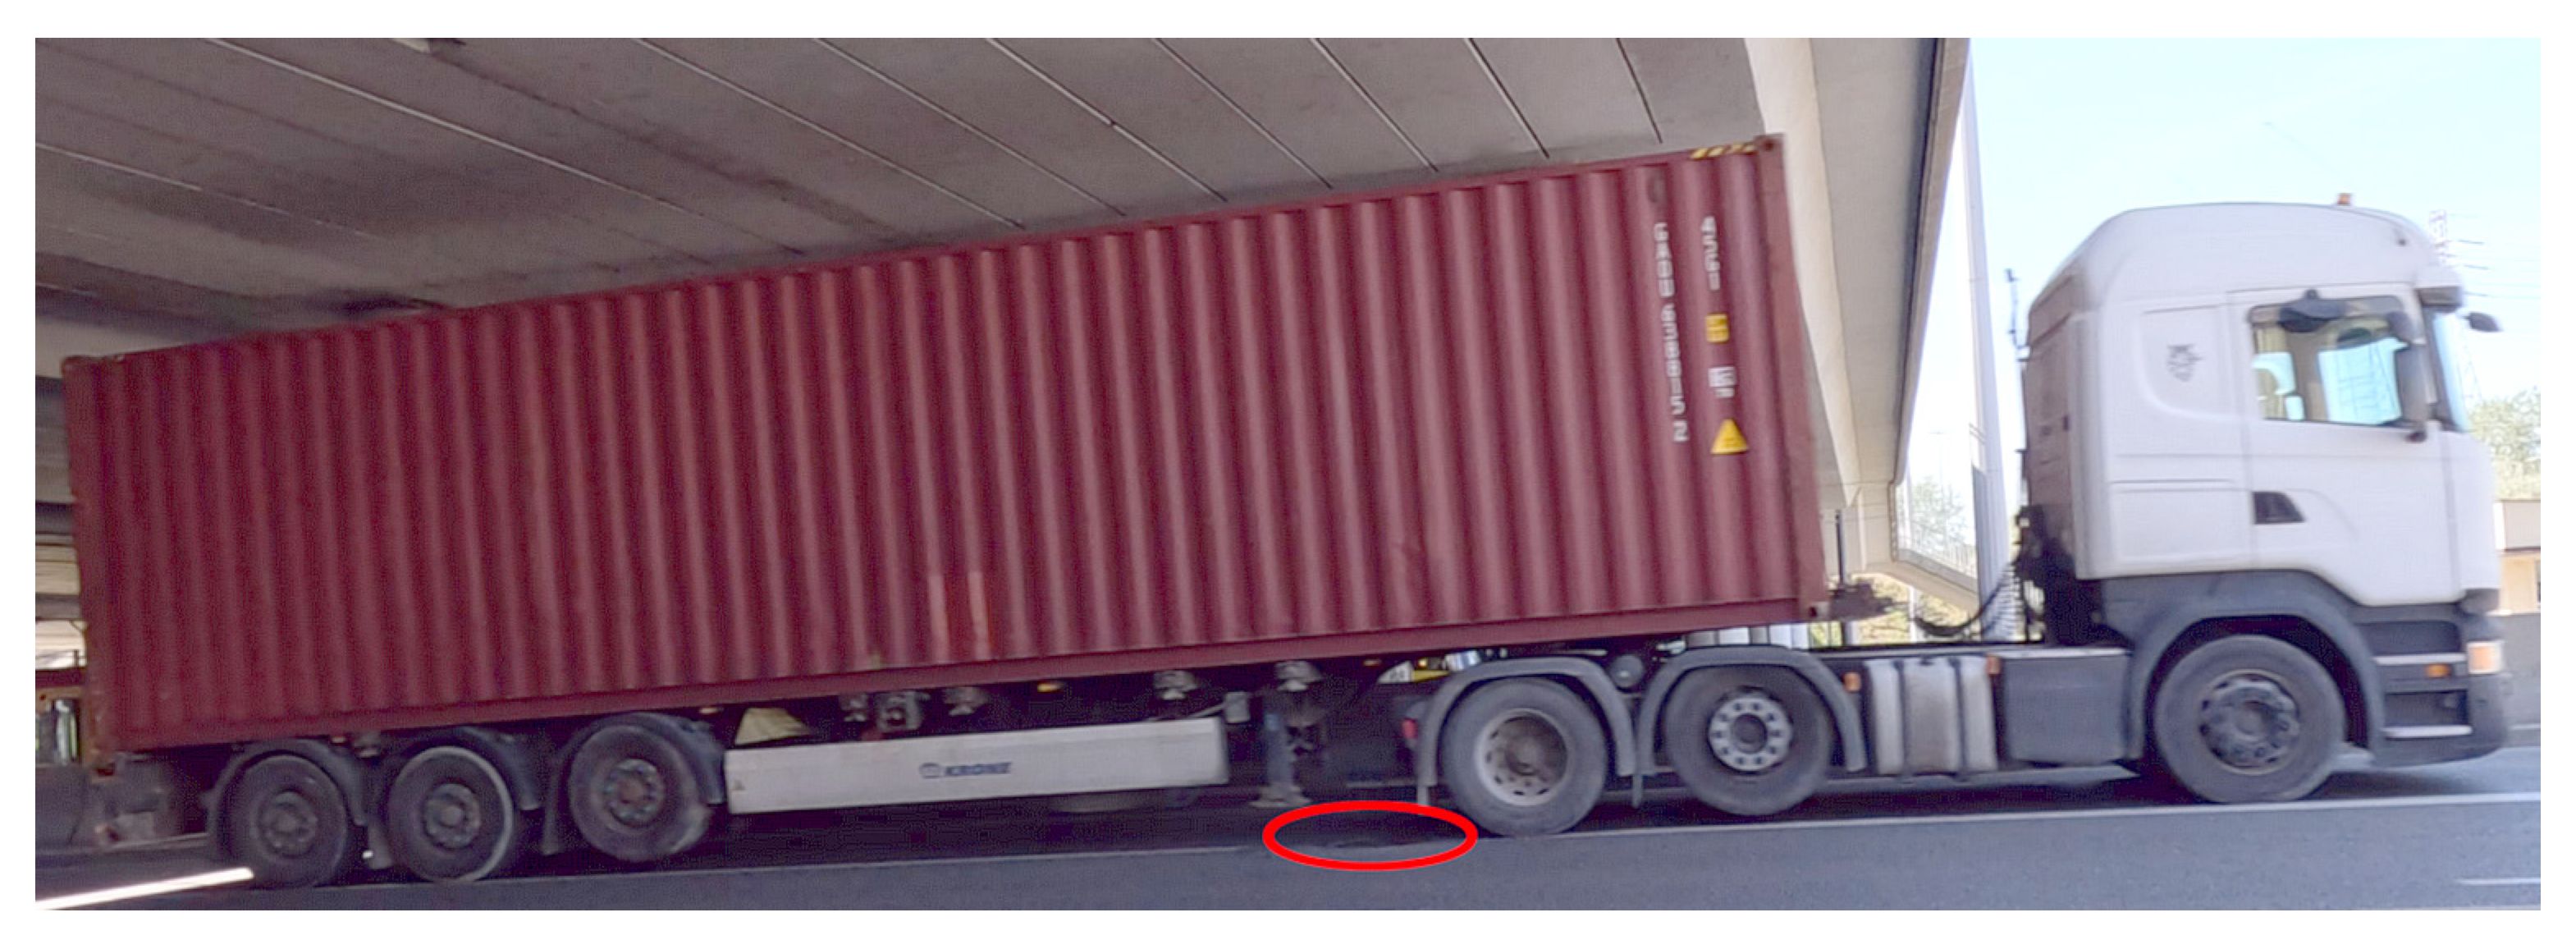
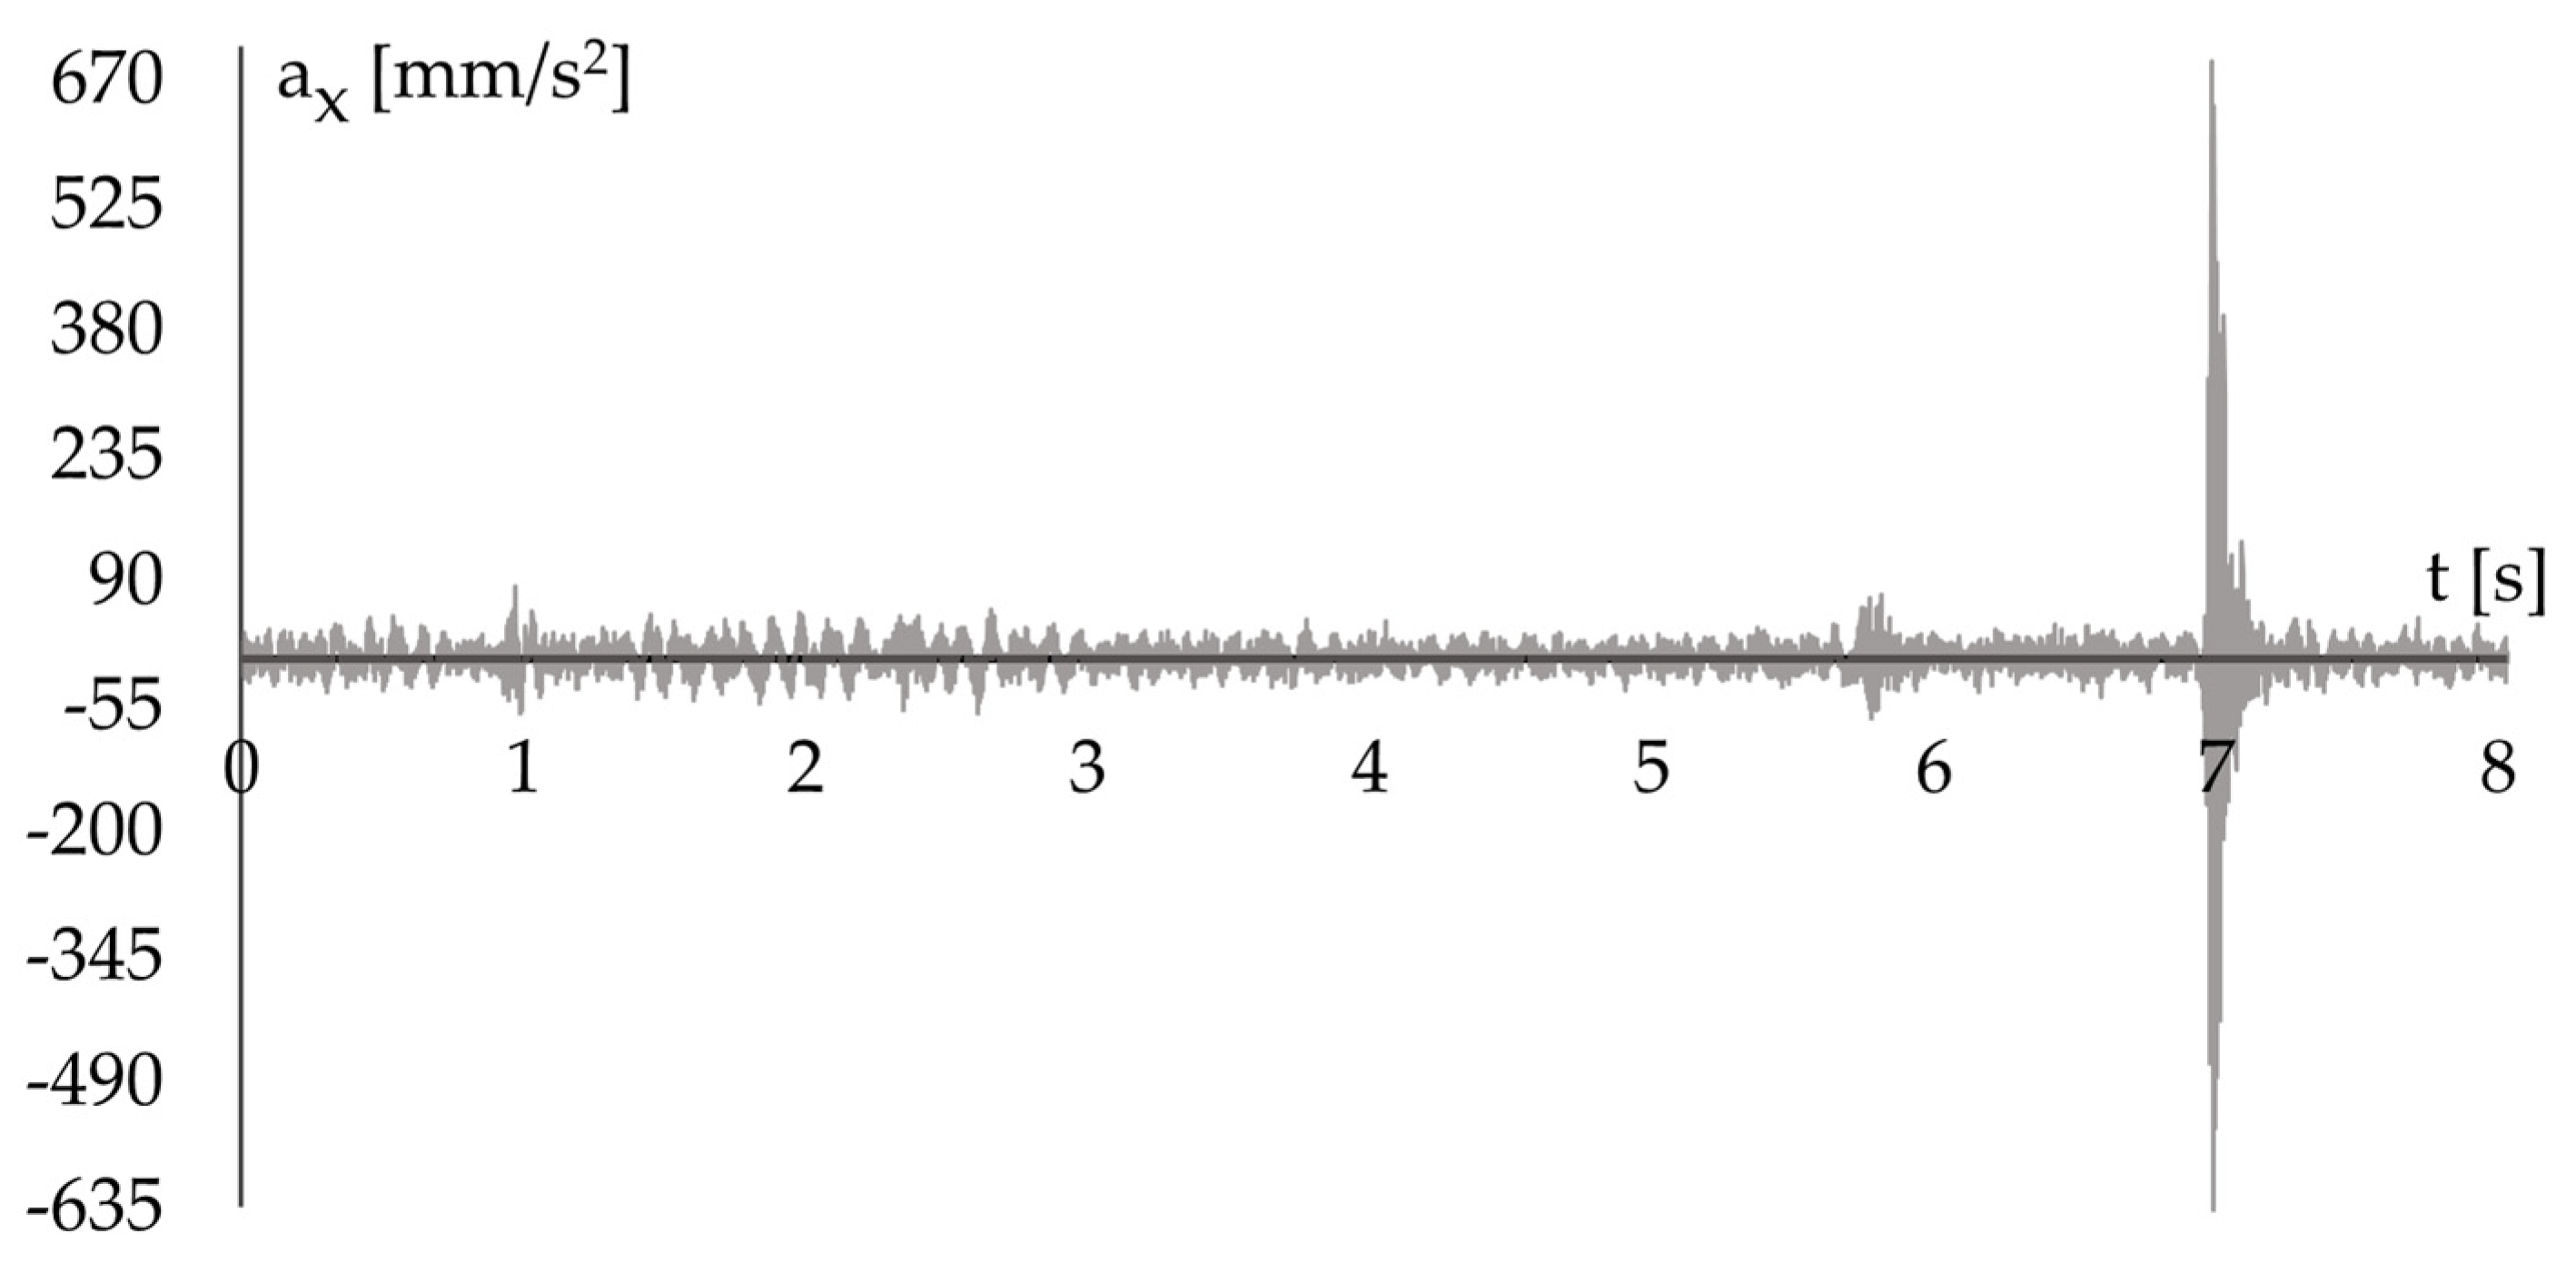
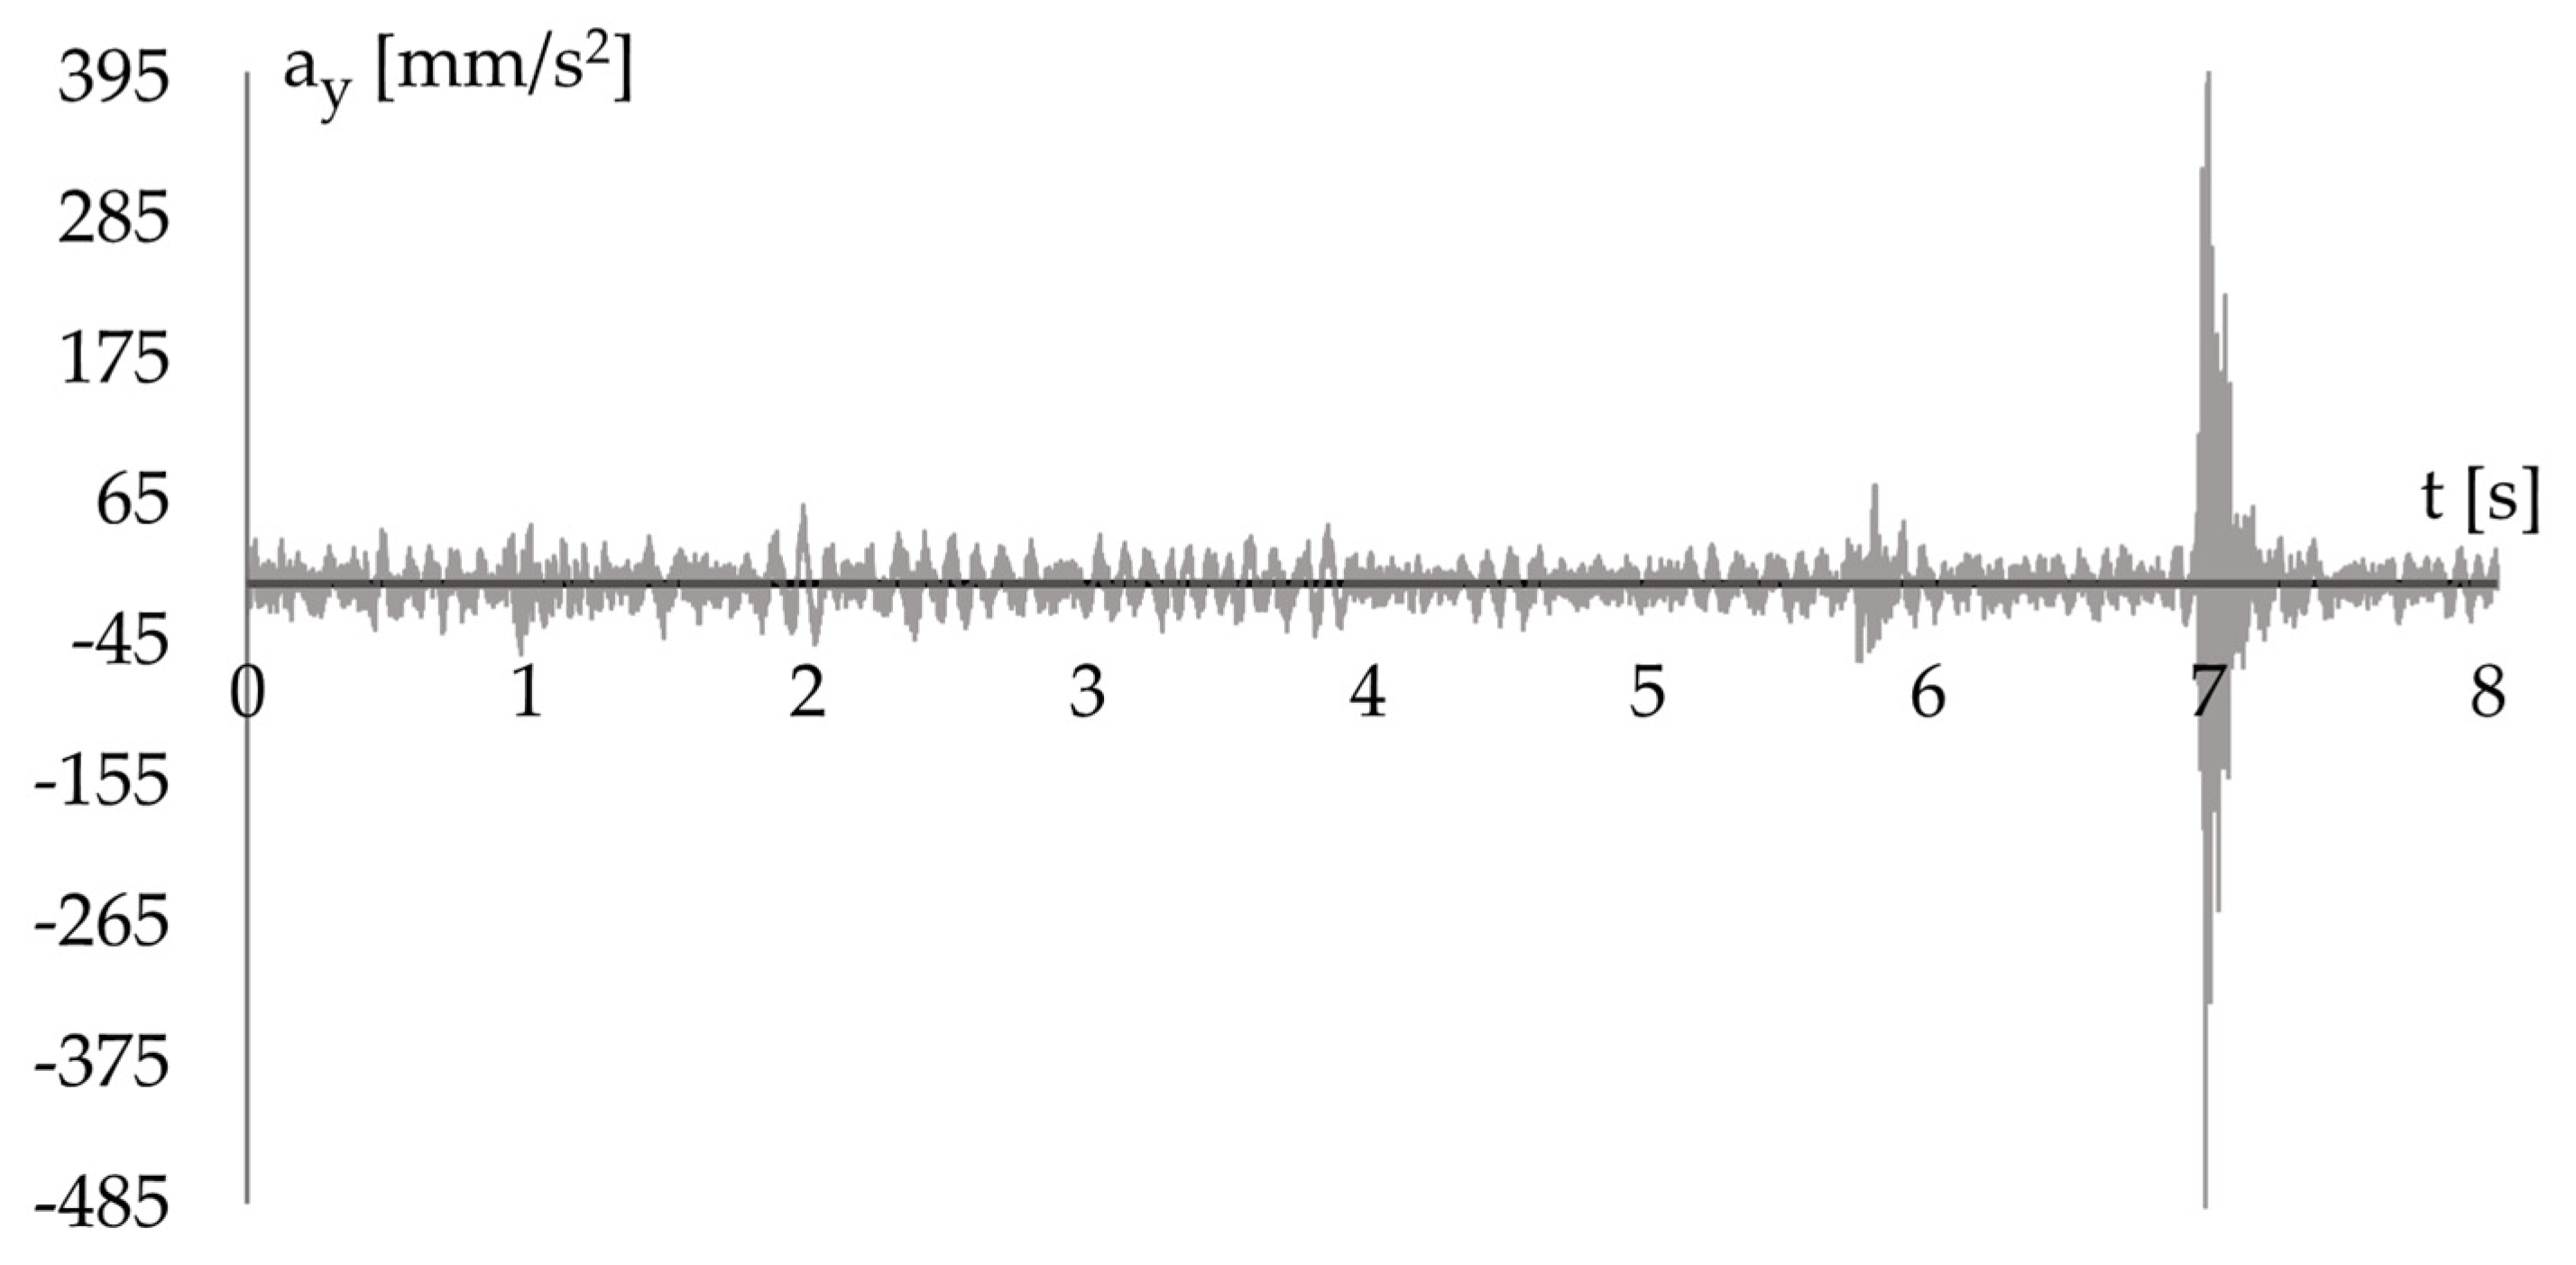
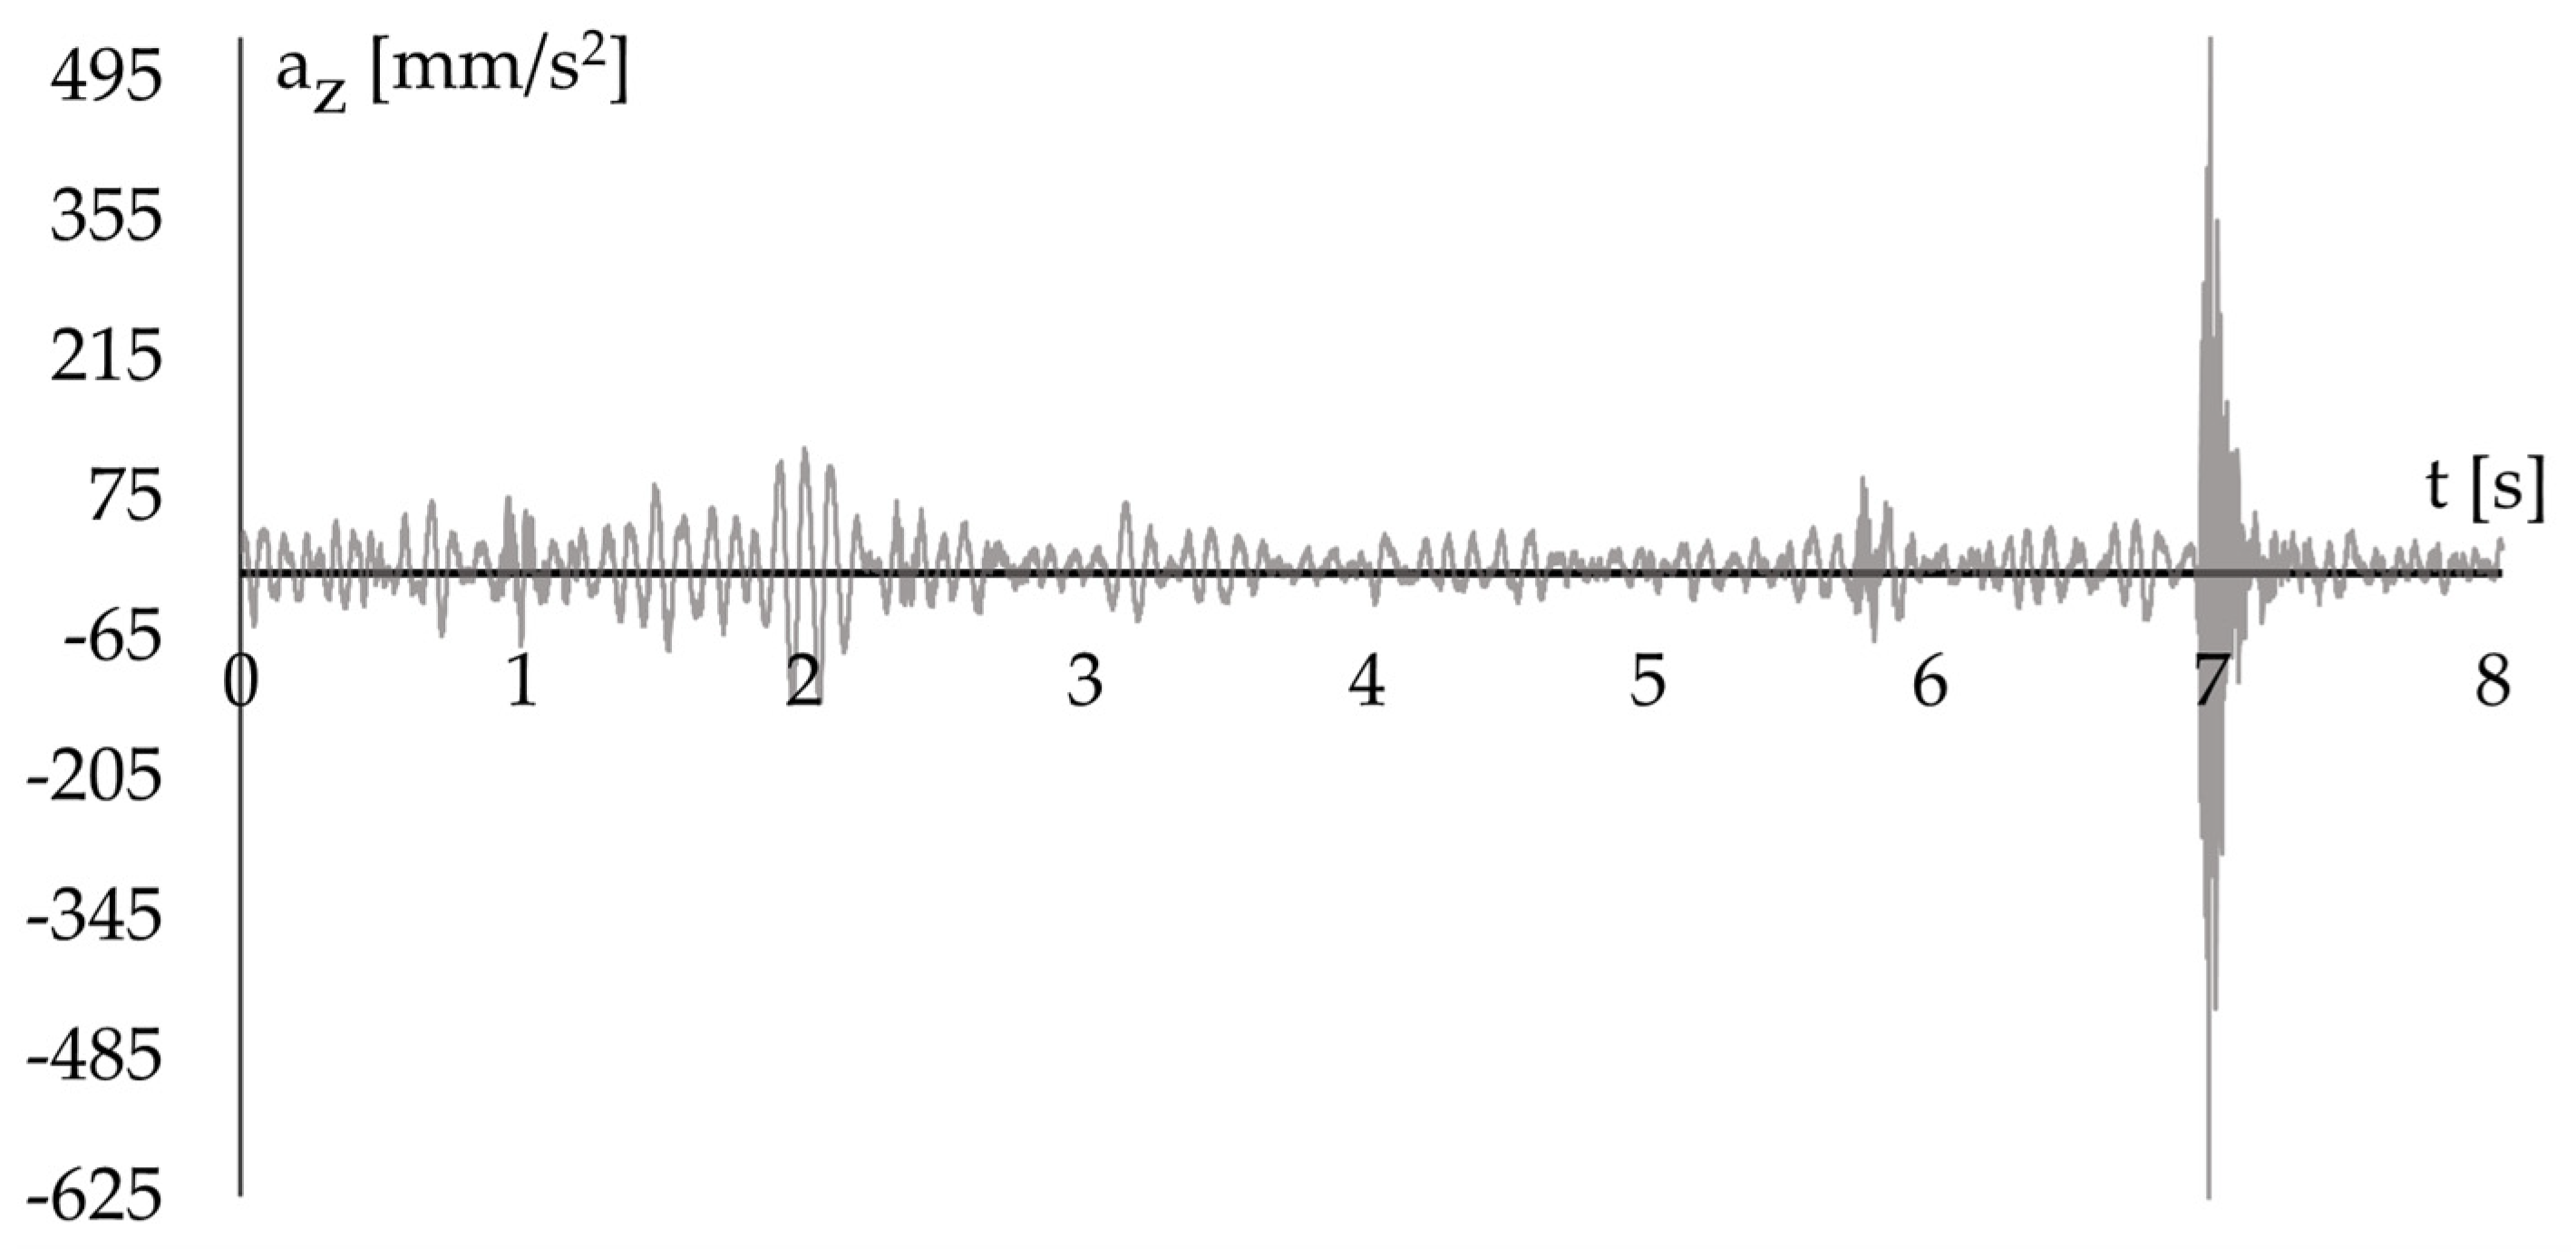
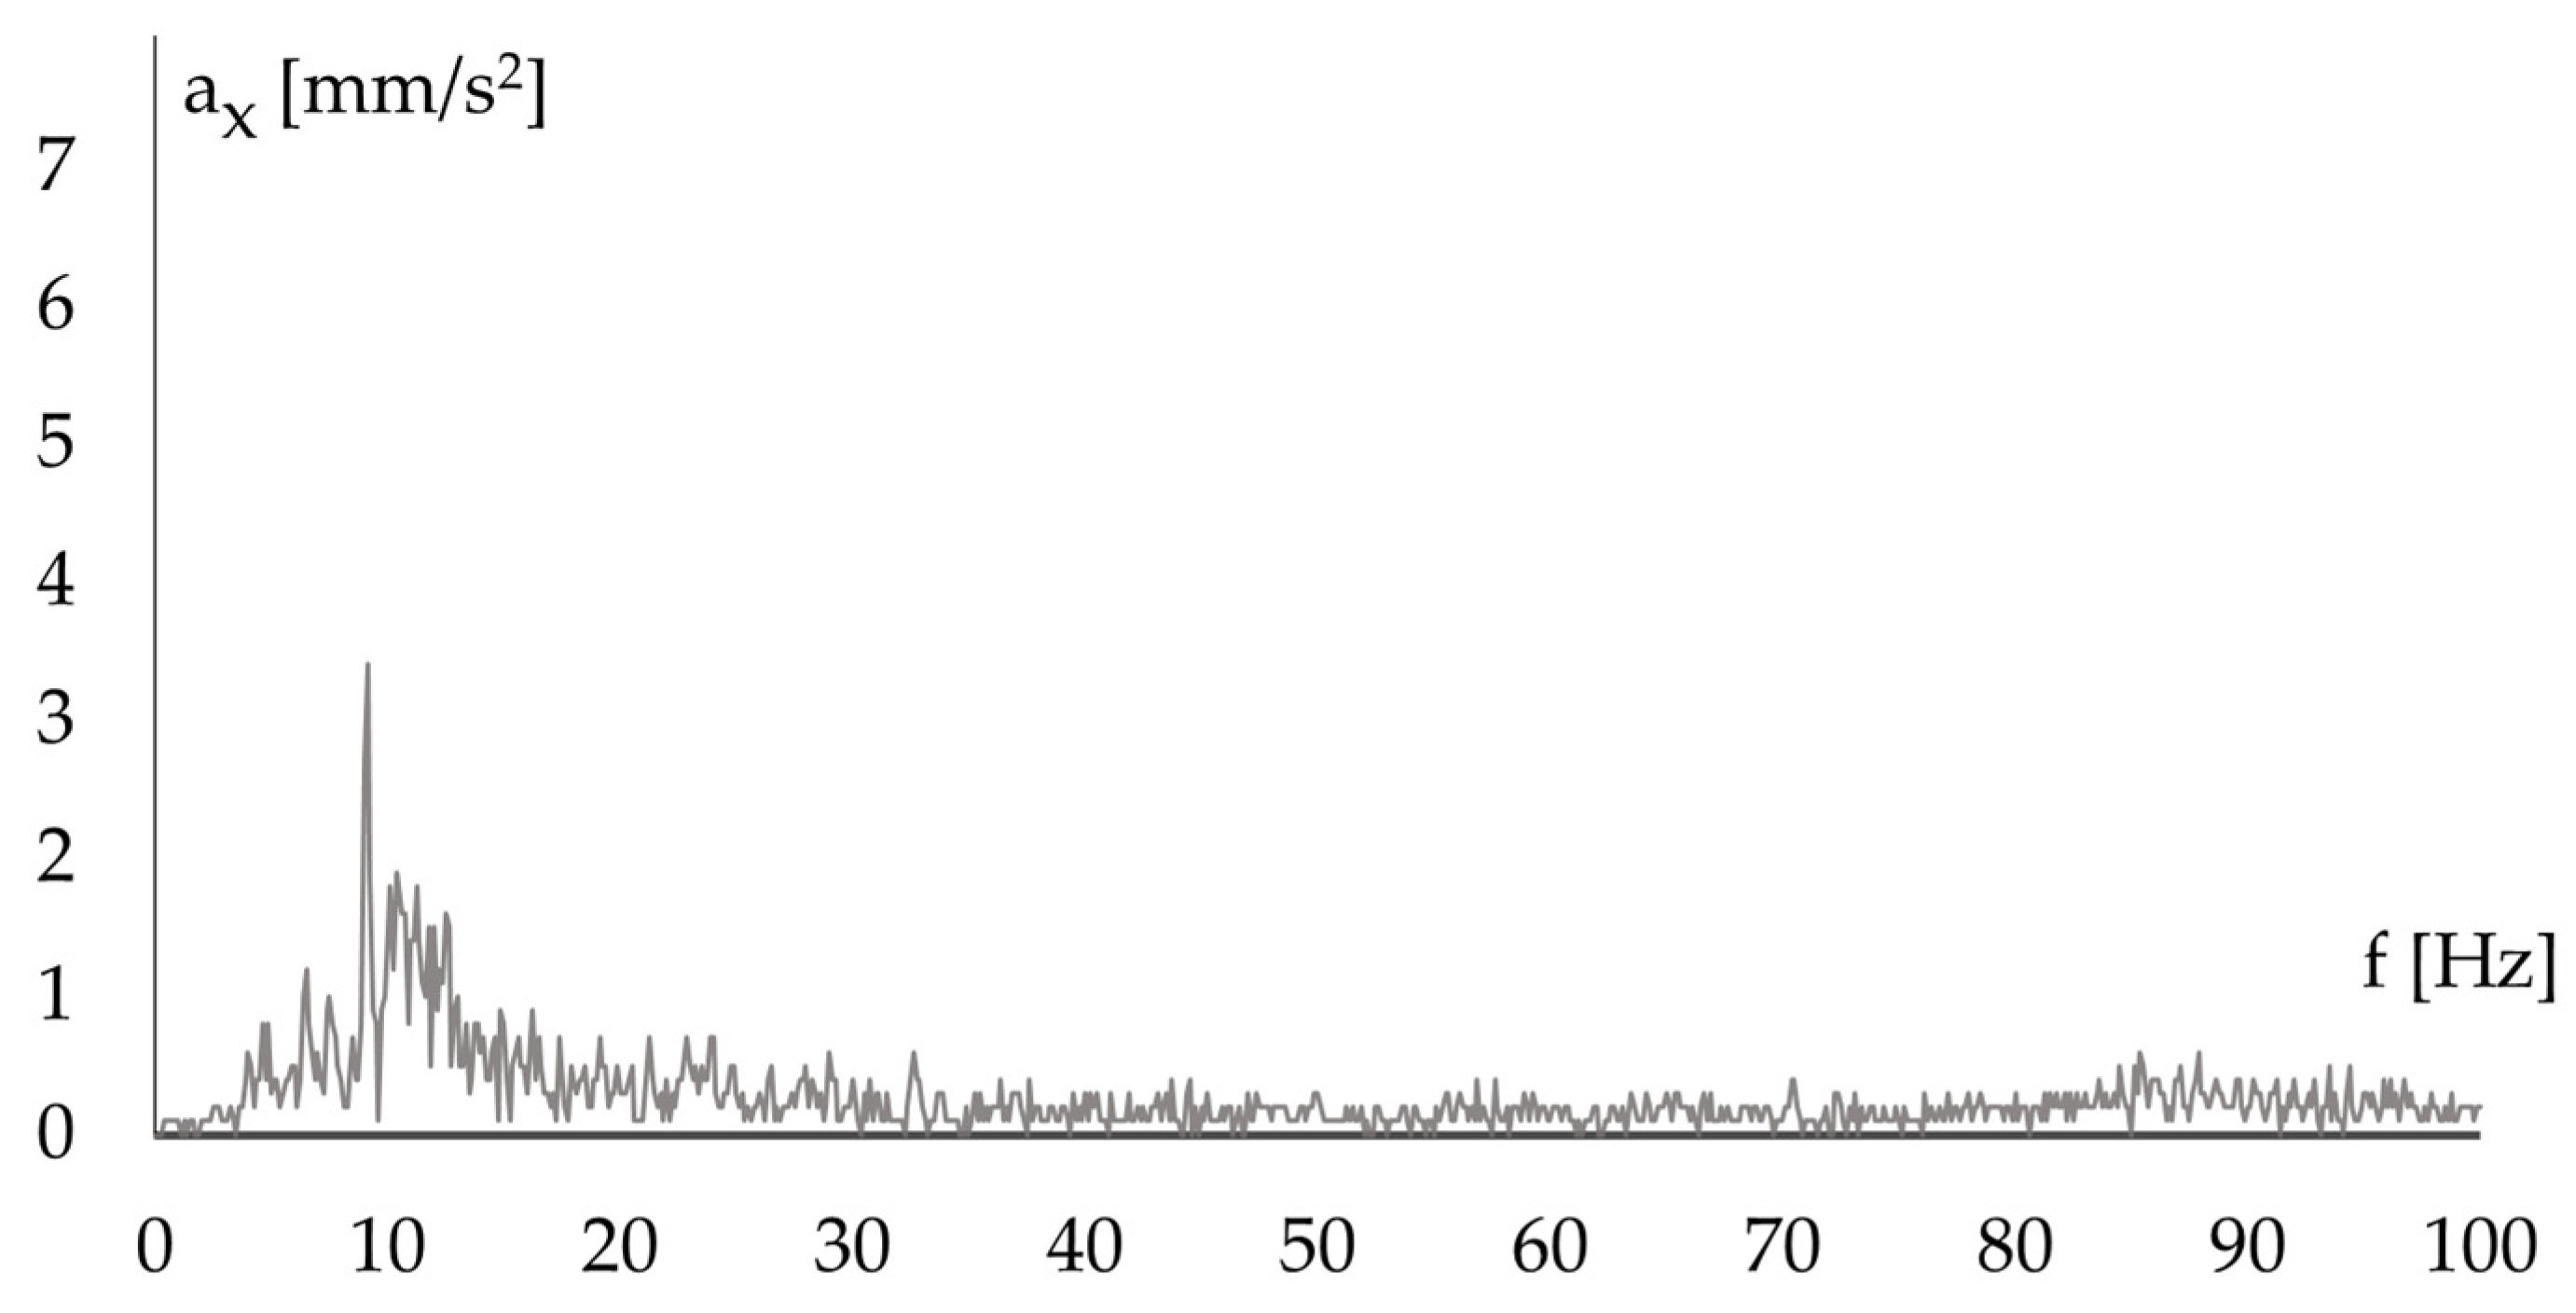
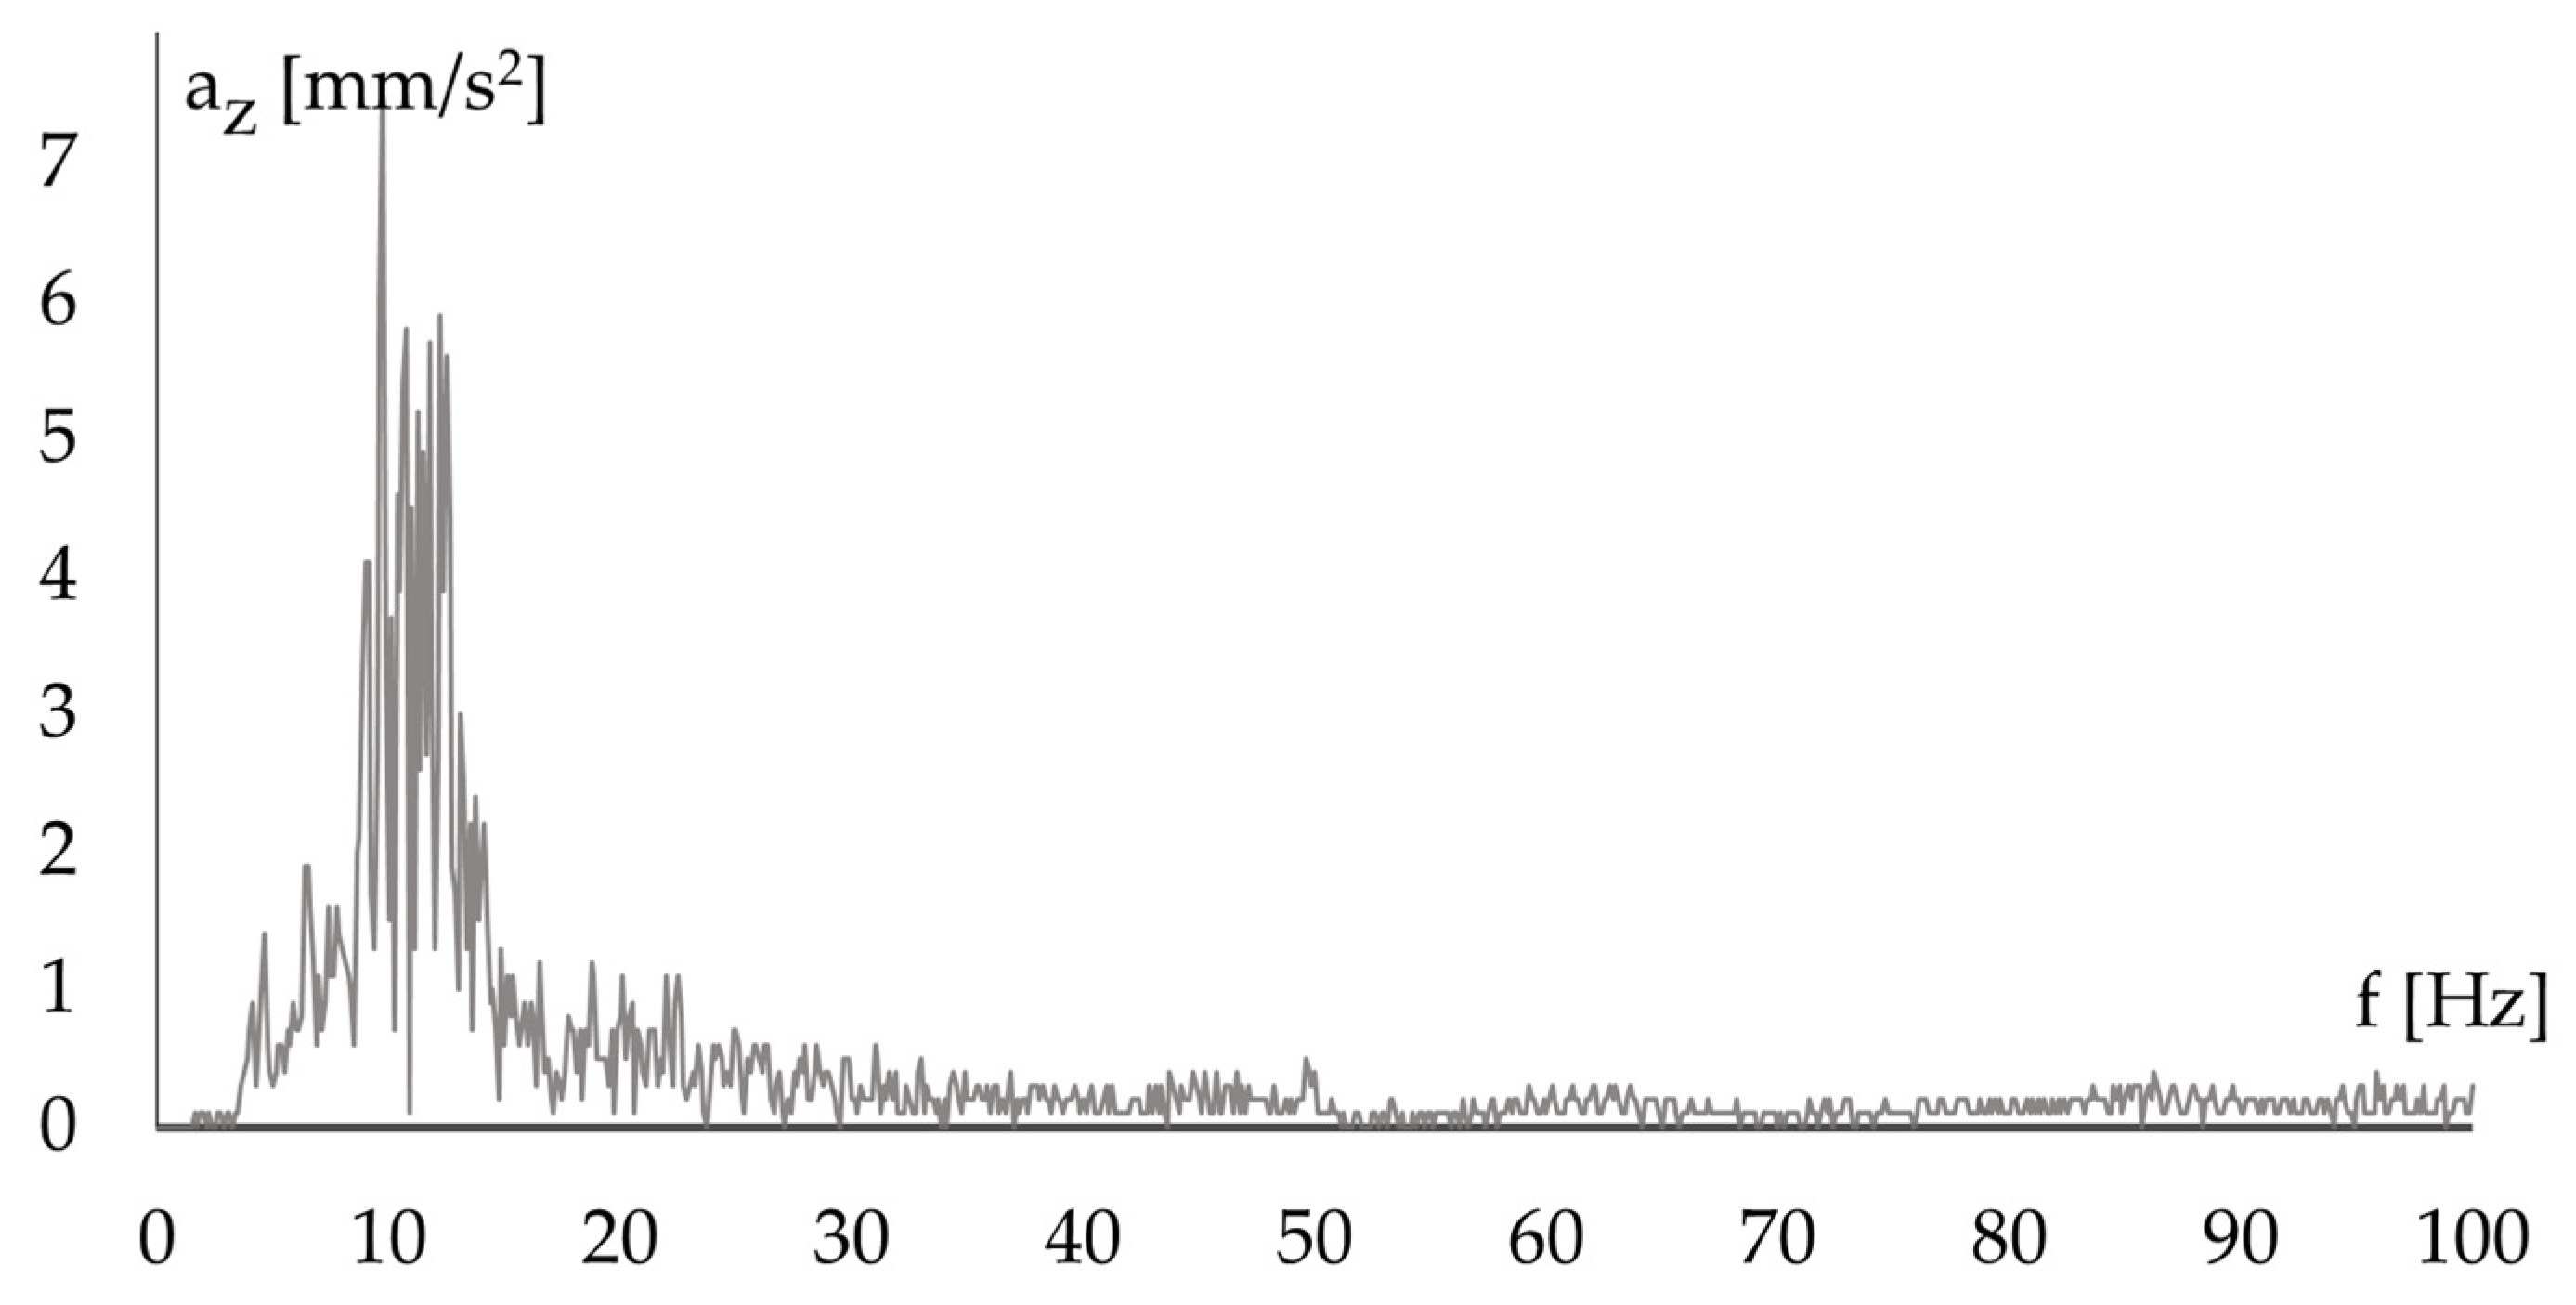
We selected representative records from all recordings. We found the highest vibration accelerations during the passage of a heavy goods vehicle carrying a container. This occurred when the vehicle struck a manhole cover with its wheels (Figure 18). The side wall of the container displayed the size and type code 45G1. This denoted a 40-foot general-purpose shipping container with an approximate tare weight of 4 tonnes [28]. Figure 19, Figure 20 and Figure 21 present the time histories of the vibration accelerations in the three directions. The corresponding frequency spectra were obtained using the Fast Fourier Transform (Figure 22, Figure 23 and Figure 24). The maximum vibration accelerations in the three coordinate directions ranged between 400 and 700 mm/s2. The vibration frequencies were in the range of 5–20 Hz, with a dominant frequency of approximately 11 Hz.

4.3. Modal Analysis

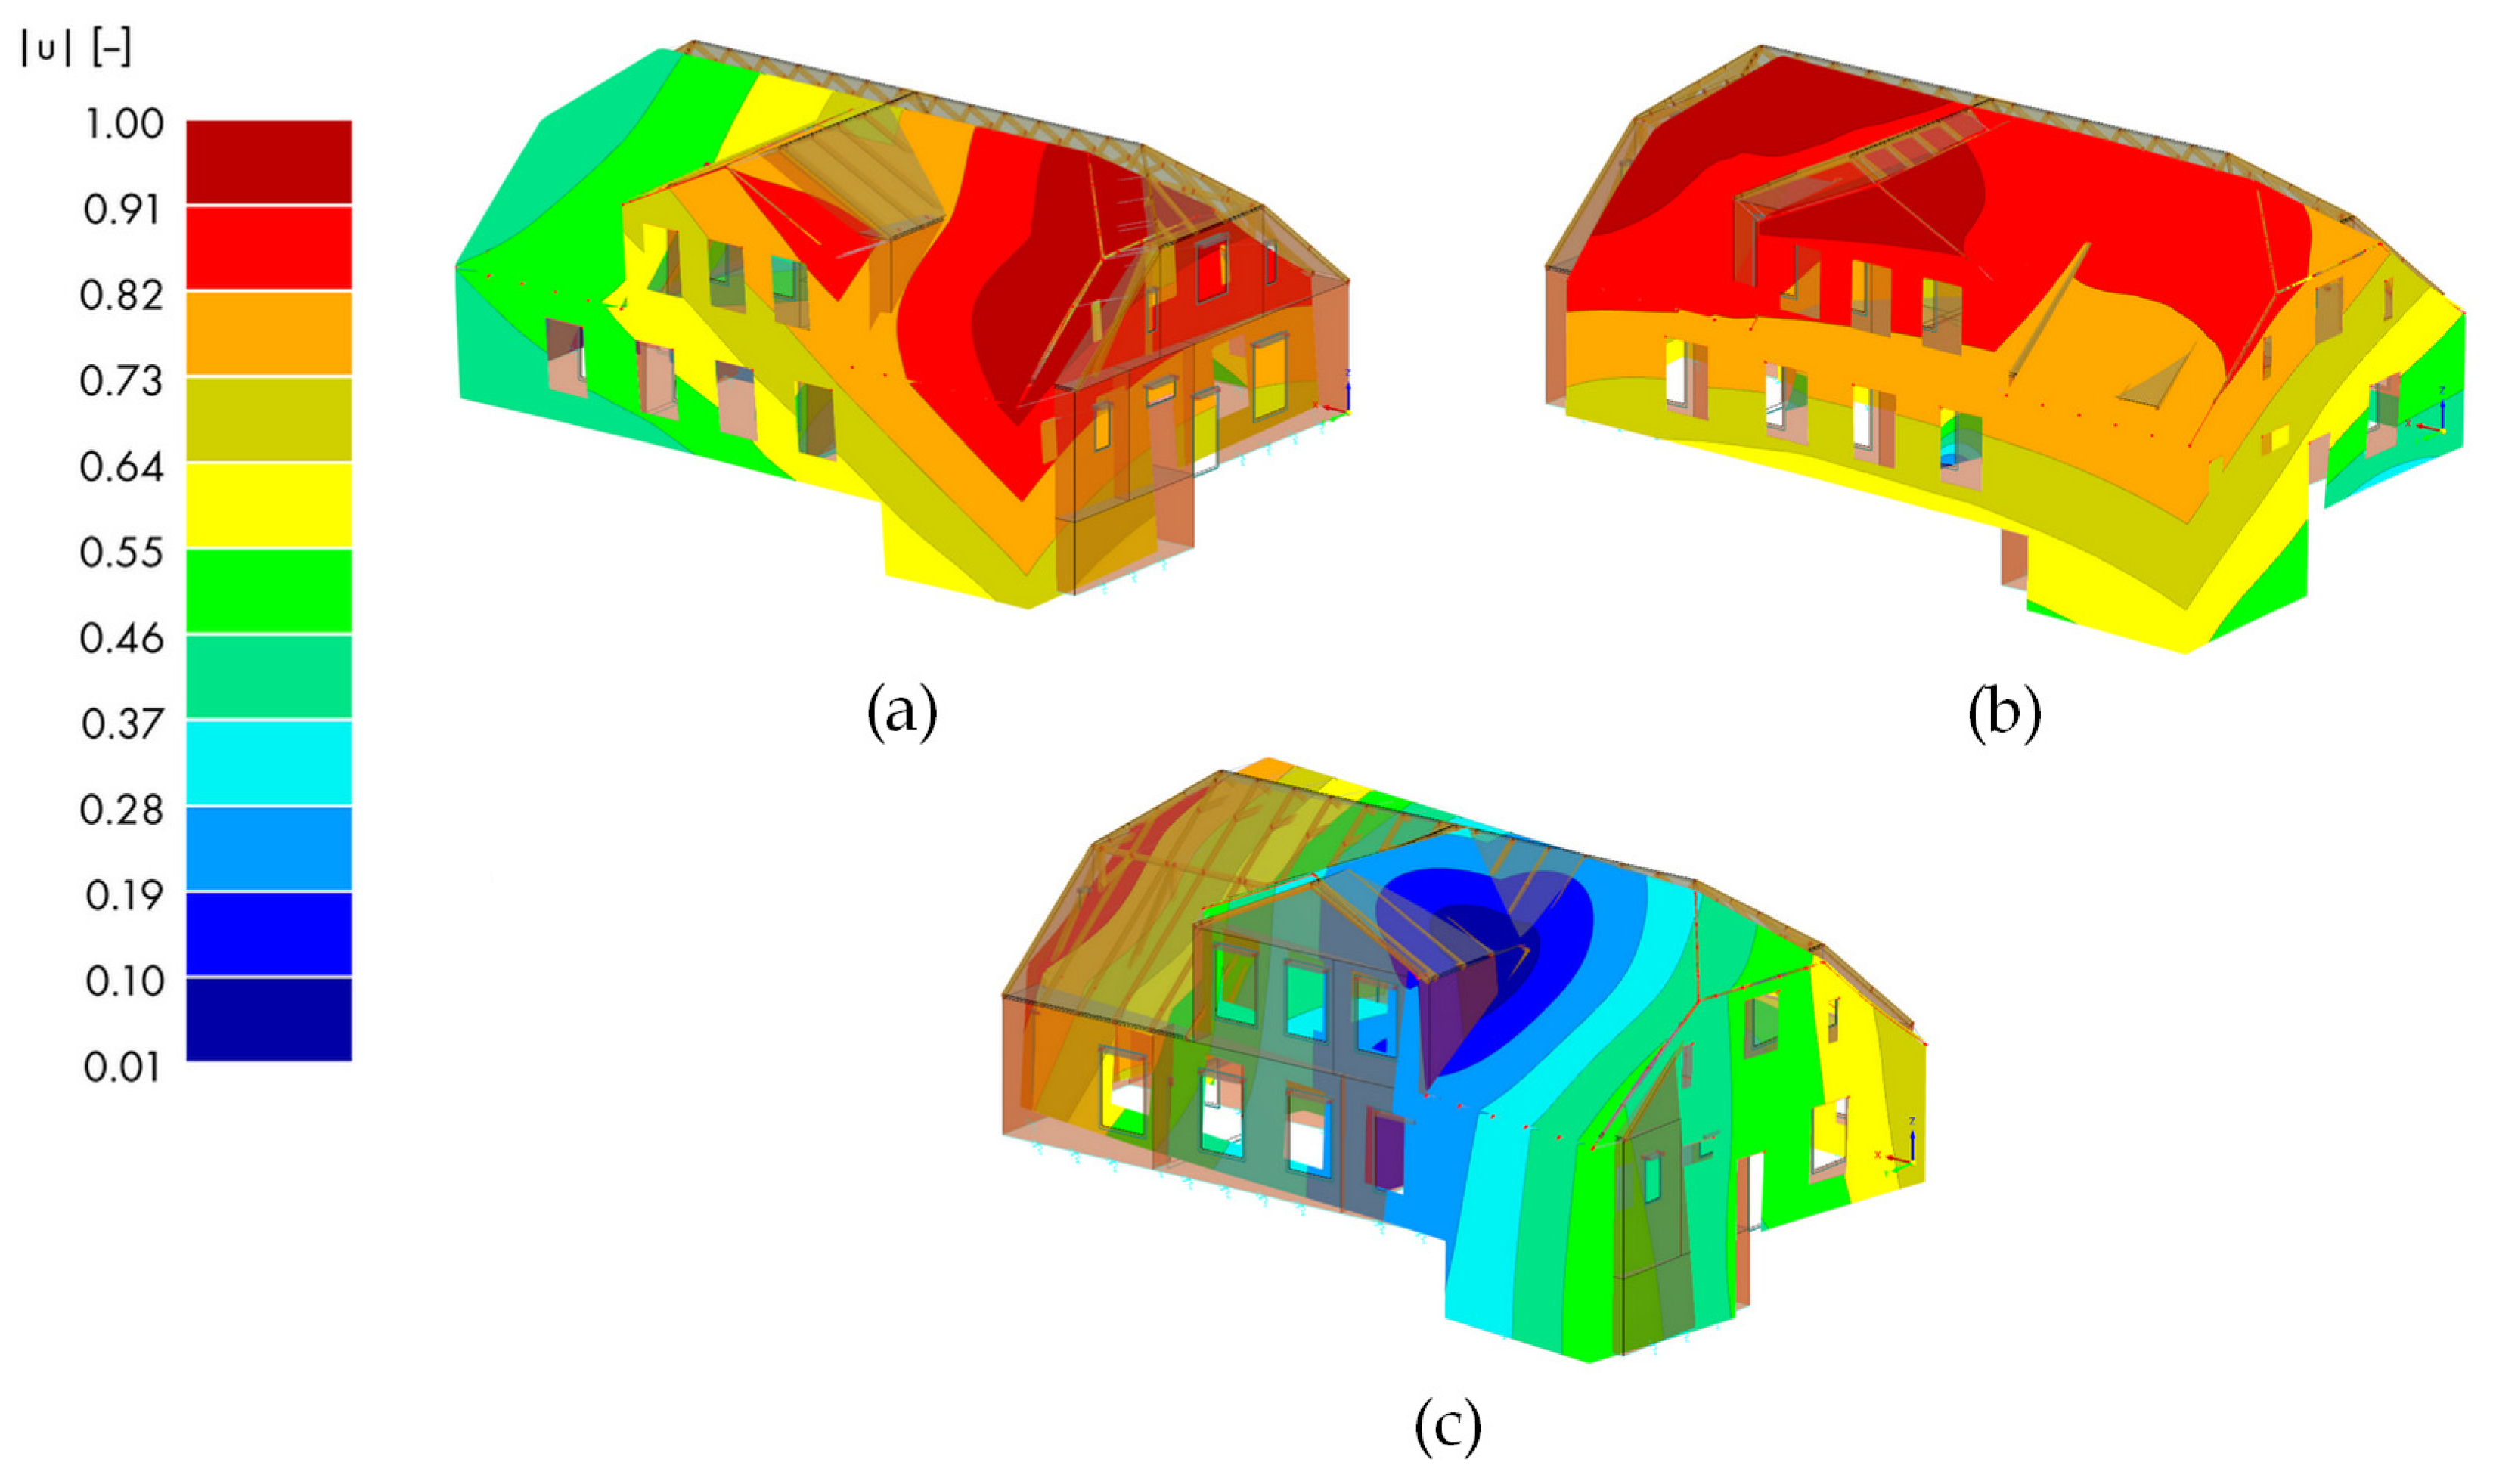
We performed the modal analysis using the load distribution according to the standard [8]. Direct evaluation of the permanent load Q k and the long-term component of the variable load Q k was not feasible. The lumped mass Q k at point k was calculated using the relation Q k = Q k + λ   Q k . The building type determines the coefficient λ ; for the residential case, we used λ = 0.4. We applied the Lanczos algorithm to the numerical model (Figure 11) and extracted 20 natural vibration modes (Table 2). For an infinitely rigid subsoil (Cz = ∞), the modes represent structural deformation. For Cz = 9000 kN/m3 and Cz = 90,000 kN/m3, translational, bending, and torsional responses dominate. Figure 25 presents the first three modes for Cz = 9000 kN/m3.
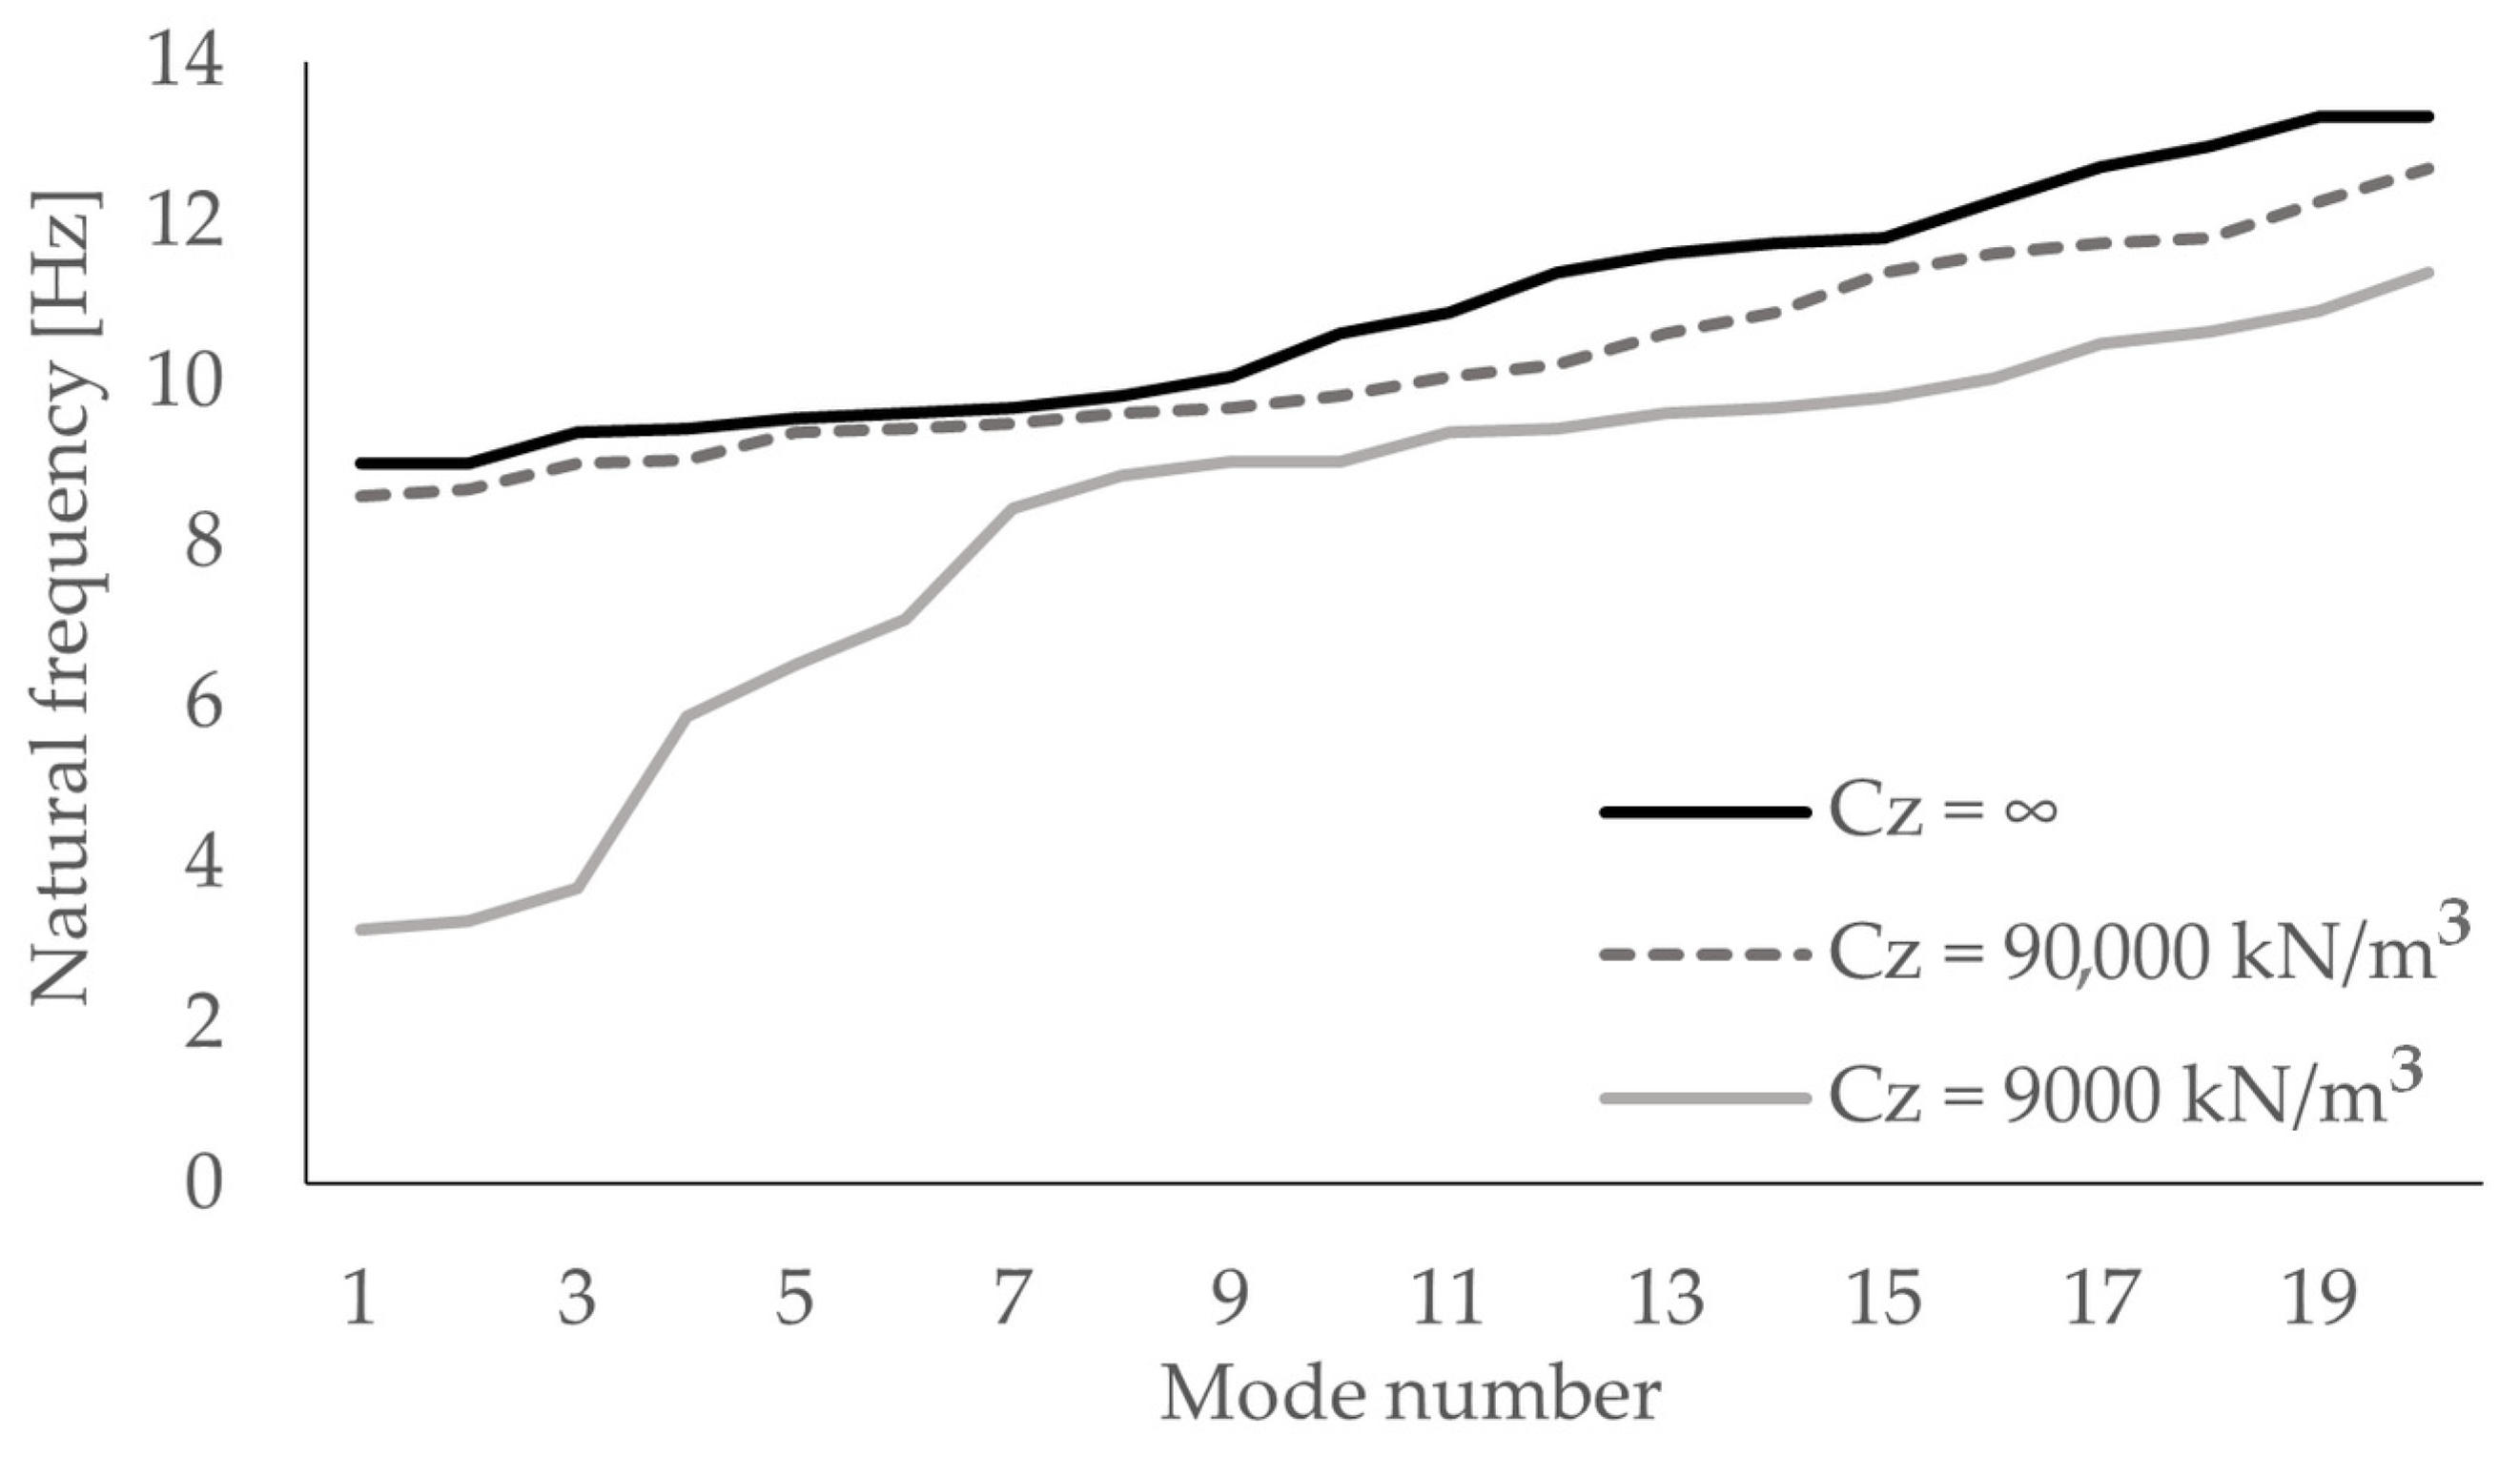
Figure 26 shows the influence of subsoil stiffness on mode shapes and natural frequencies. The transition from an infinitely rigid subsoil (Cz = ∞) to a flexible subsoil (Cz = 9000 kN/m3) reduces fundamental natural frequencies by up to 65%. This effect diminished for higher modes, with the difference decreasing to approximately 10% from the eighth mode onwards. For moderately stiff subsoil (Cz = 90,000 kN/m3), the reduction is only 4–7%.

4.4. Assessment of Ground-Transmitted Vibrations on the Structure

We evaluated the influence of recorded traffic-induced vibrations on plaster cracking by computing shear stresses. The finite element model accounted for the interaction of the soil-structure with varying subgrade reaction moduli. The maximum recorded vibration time histories (Figure 19, Figure 20 and Figure 21) were applied to the foundations in the numerical model (Figure 11). We used a time-history analysis with the implicit Newmark method and a 0.001 s time step. We set a global damping ratio of 5% of critical damping in accordance with [29,30]. This is consistent with traditional masonry structures. Subsequently, we established load combinations for the ultimate limit states in accordance with the Eurocode standard [10]. Although the standard [10] does not explicitly cover traffic-induced vibration, clause 1.1 (3) permits its use for such dynamic action. Under the Polish standard [8] clause 5.1, a dynamic action is classified as a variable action. To obtain the design value, we multiply the characteristic value of the action by a partial factor γ f = 1.5. Using Equation (6.10) in the Eurocode standard [10], two combinations were formulated: the basic combination C1, Equation (1) and the combination C2, including dynamic action represented by inertial forces Q k , f , Equation (2):
C 1 = j = 1 γ G , j G k , j + γ Q , 1 Q k , 1 + i > 1 γ Q , i ψ 0 , i Q k , i
C 2 = j = 1 γ G , j G k , j + γ f Q k , f + i = 1 γ Q , i ψ 0 , i Q k , i
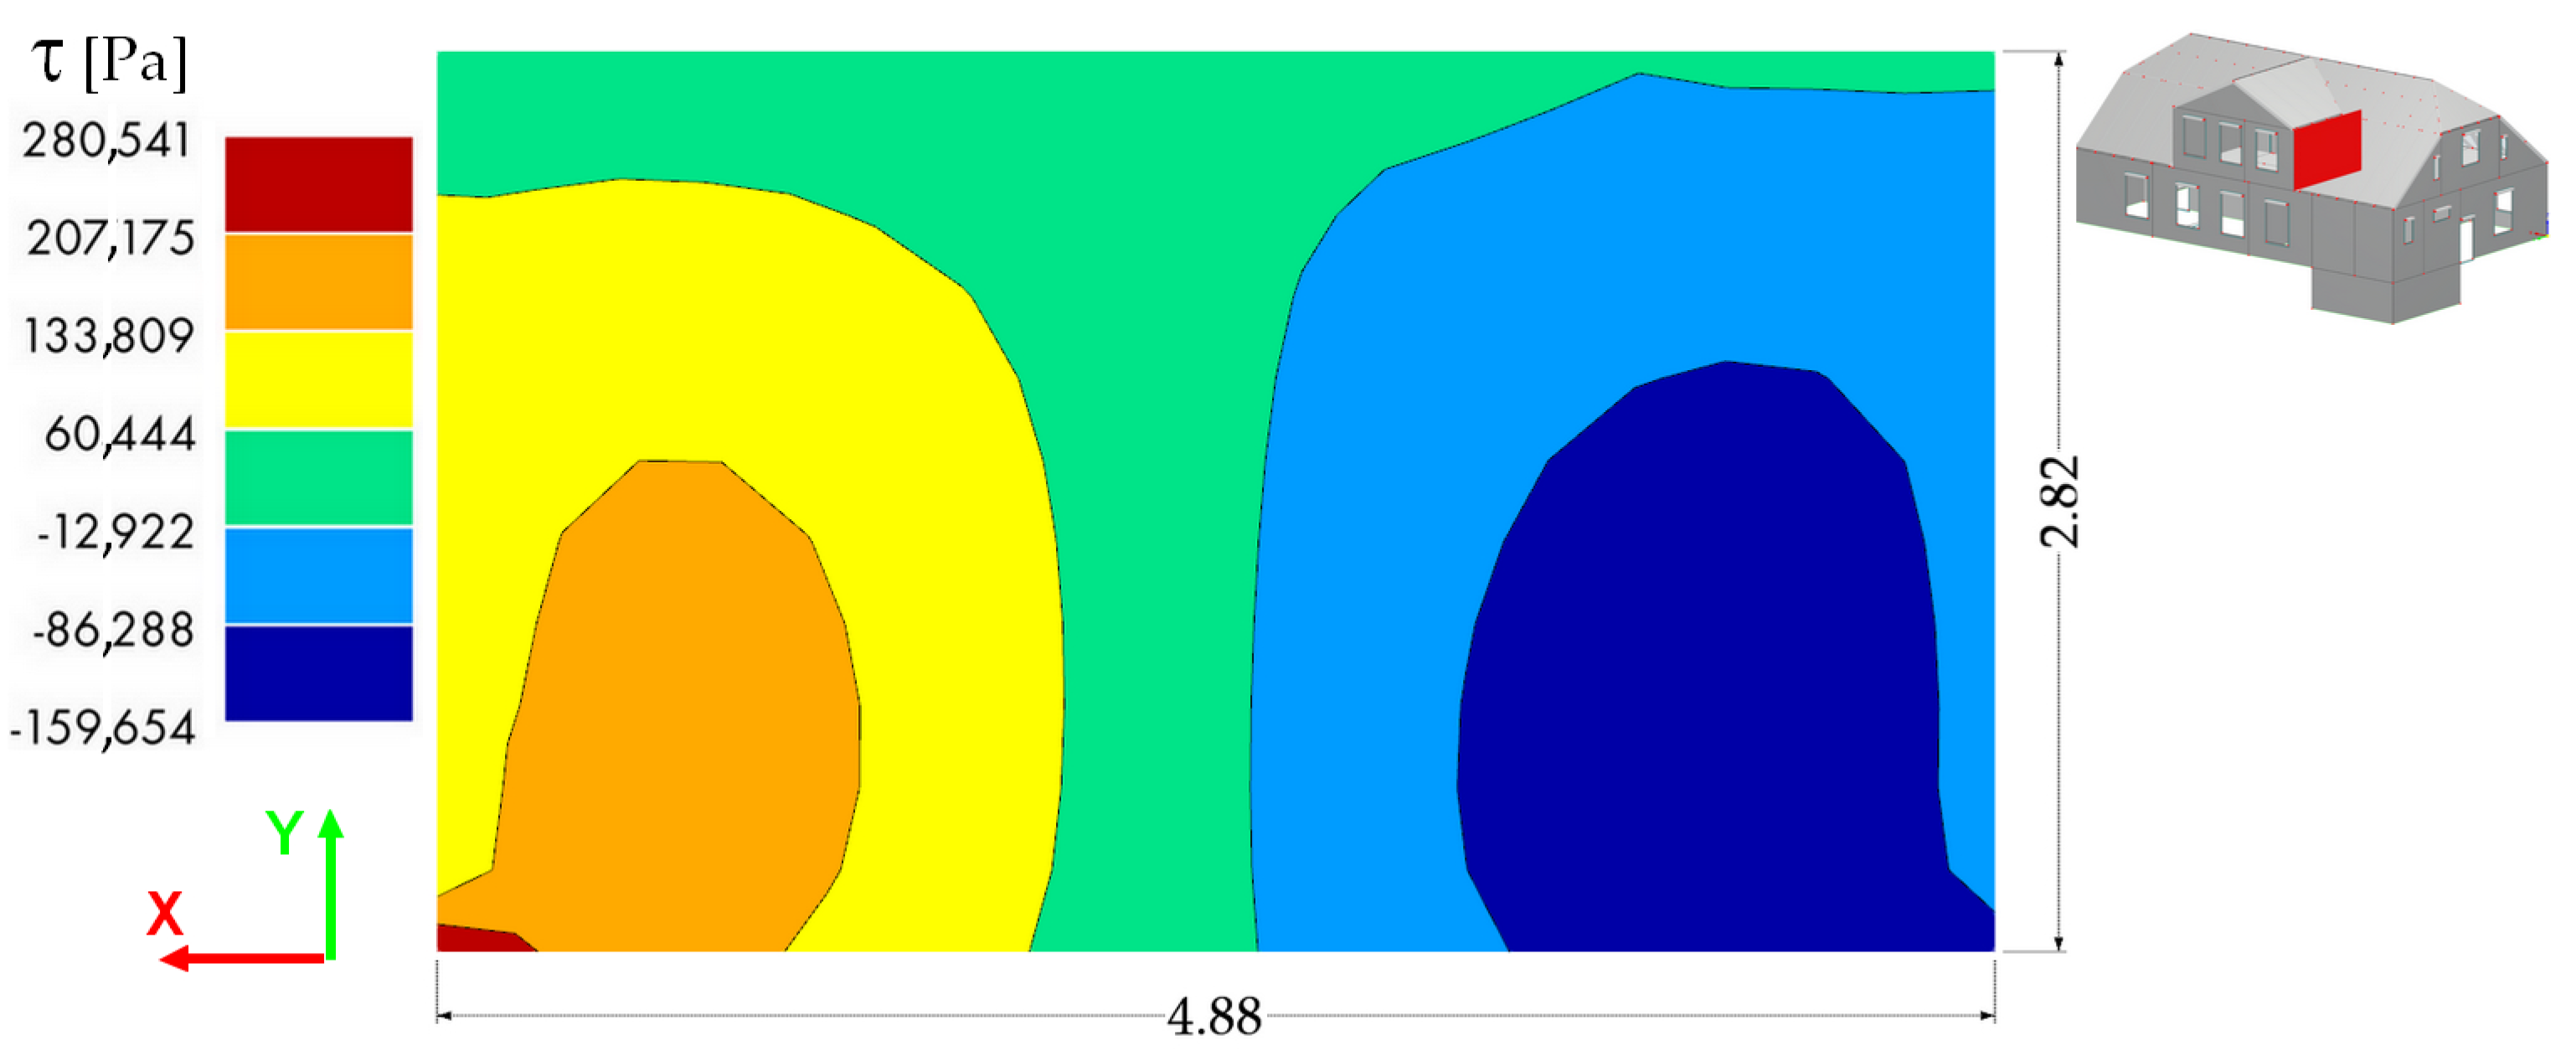
Figure 27 illustrates an example of the shear–stress distribution in the dormer wall for the load combination C1 and an infinitely rigid subsoil (Cz = ∞). Table 3 summarises the maximum shear stress τ m a x , in relation to the modulus of subgrade reaction Cz and load combinations C1, C2.

4.5. Assessment of Plaster Cracking in the Dormer Masonry Wall

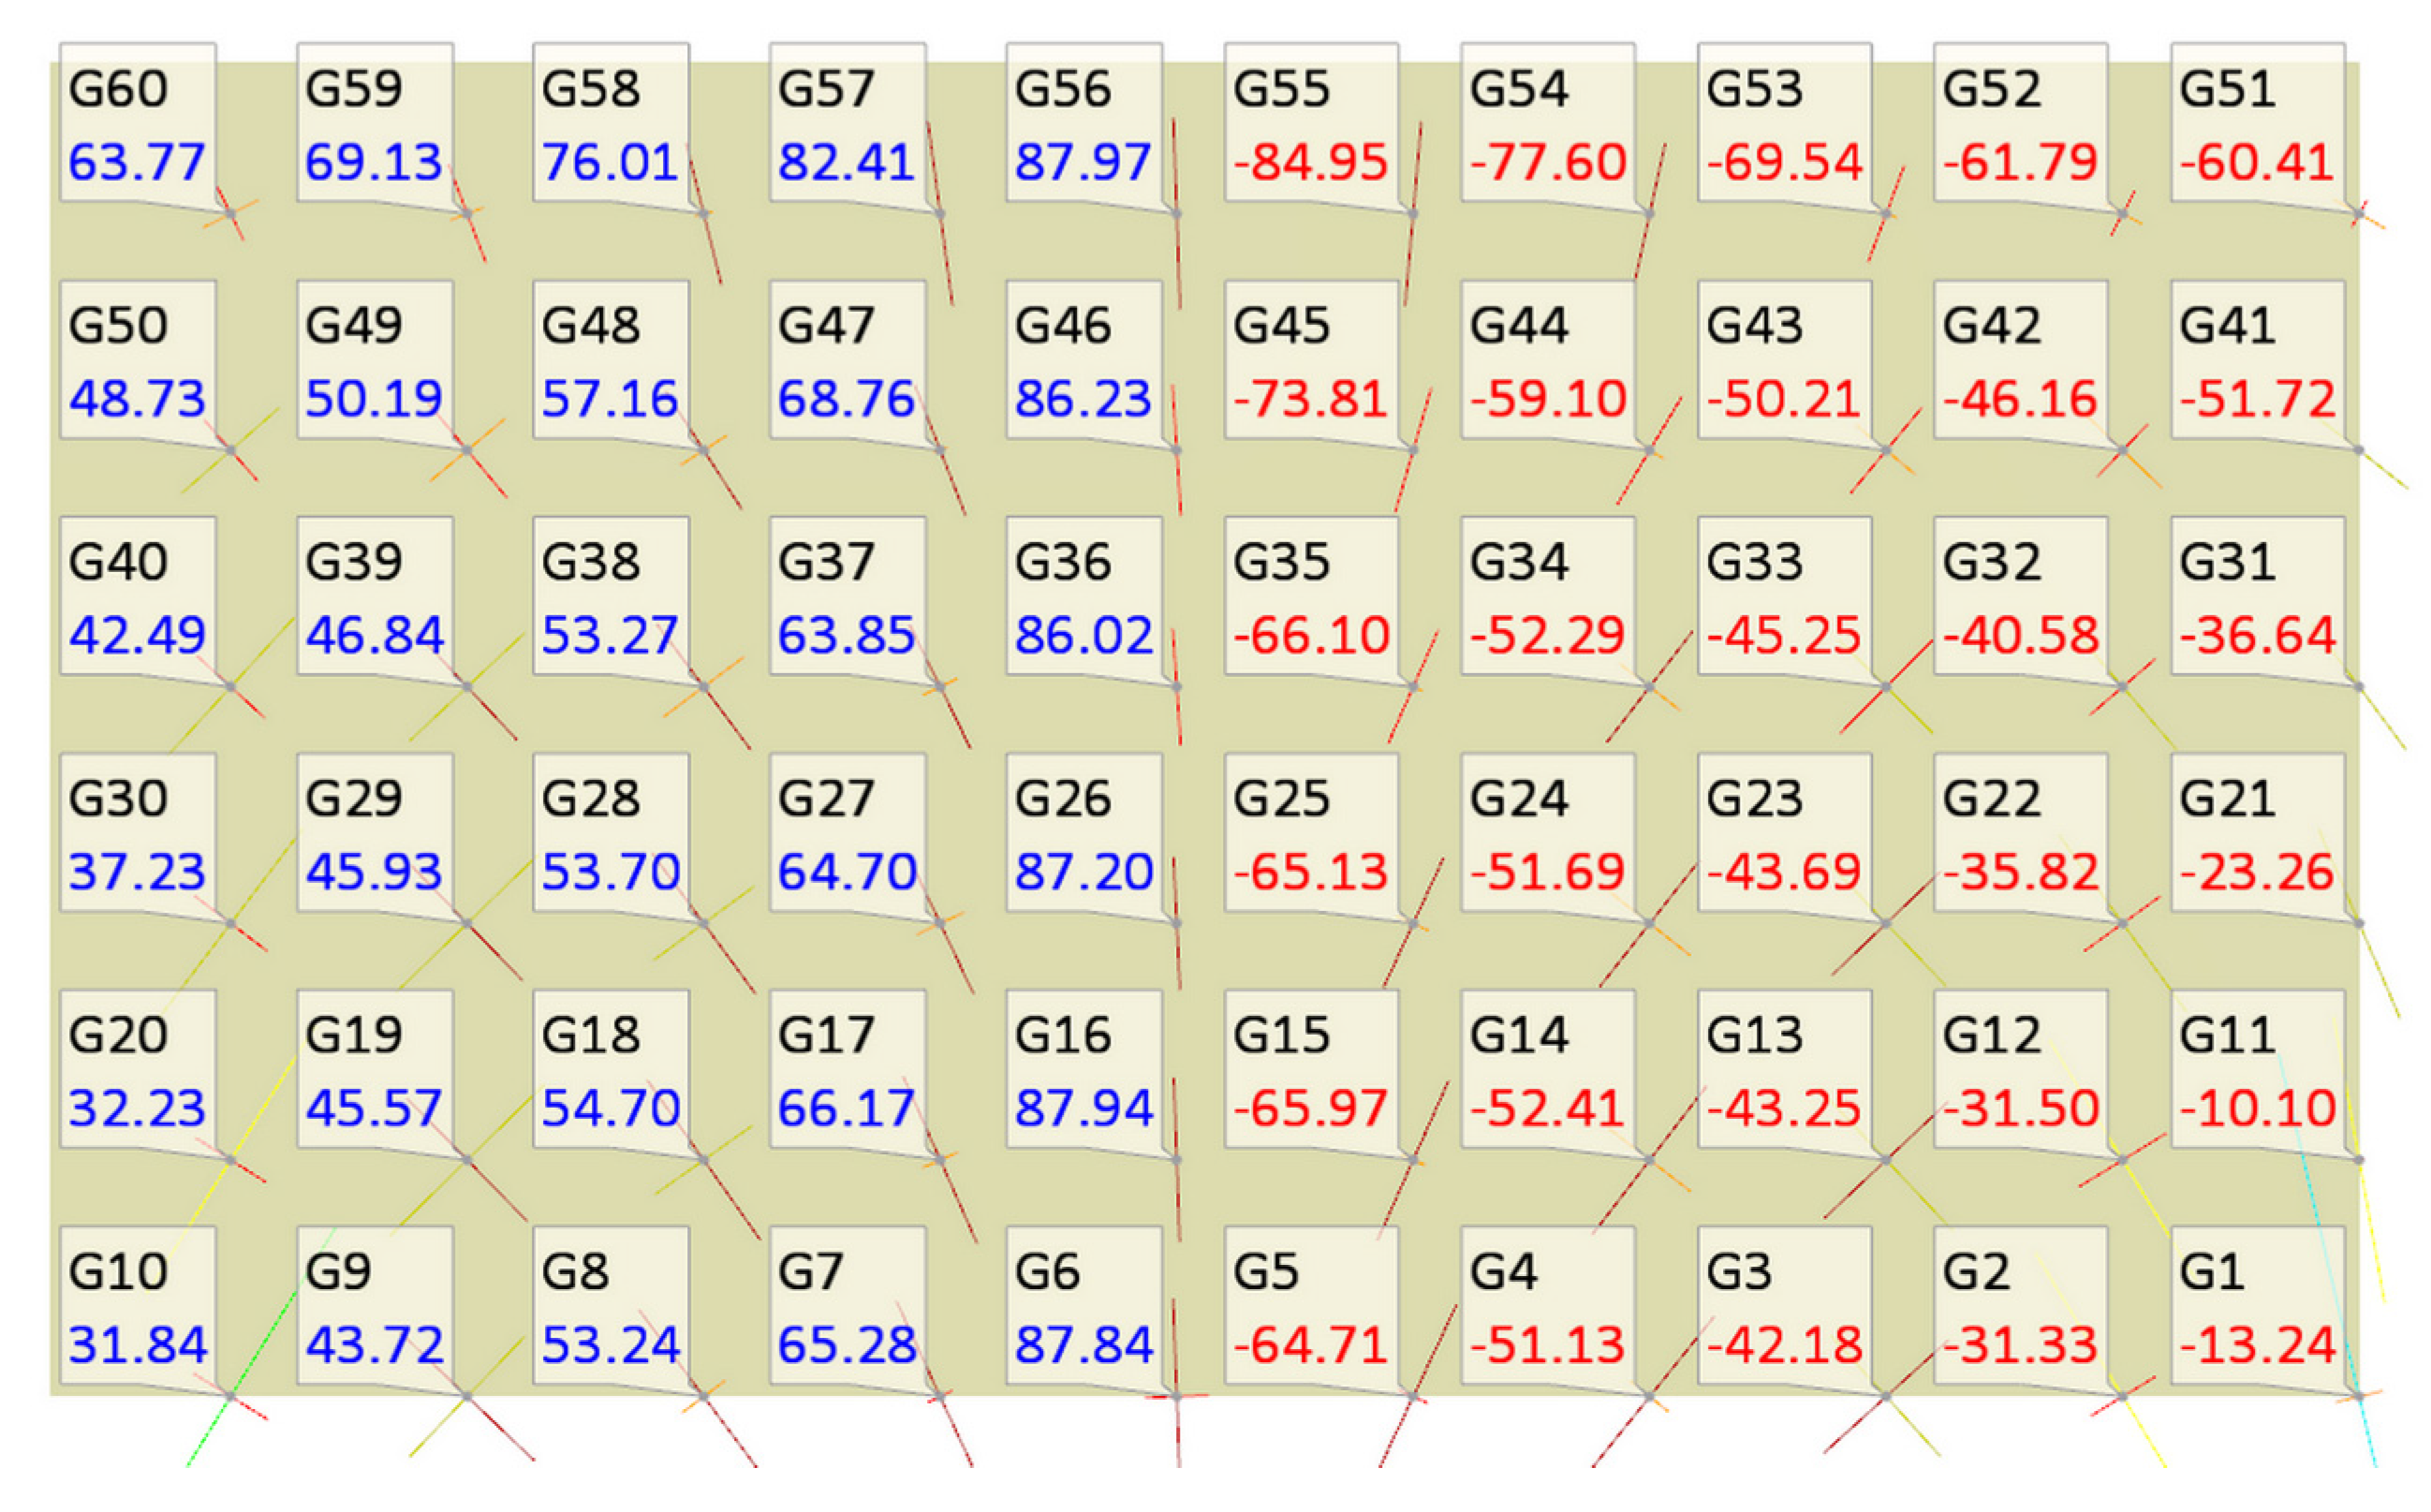
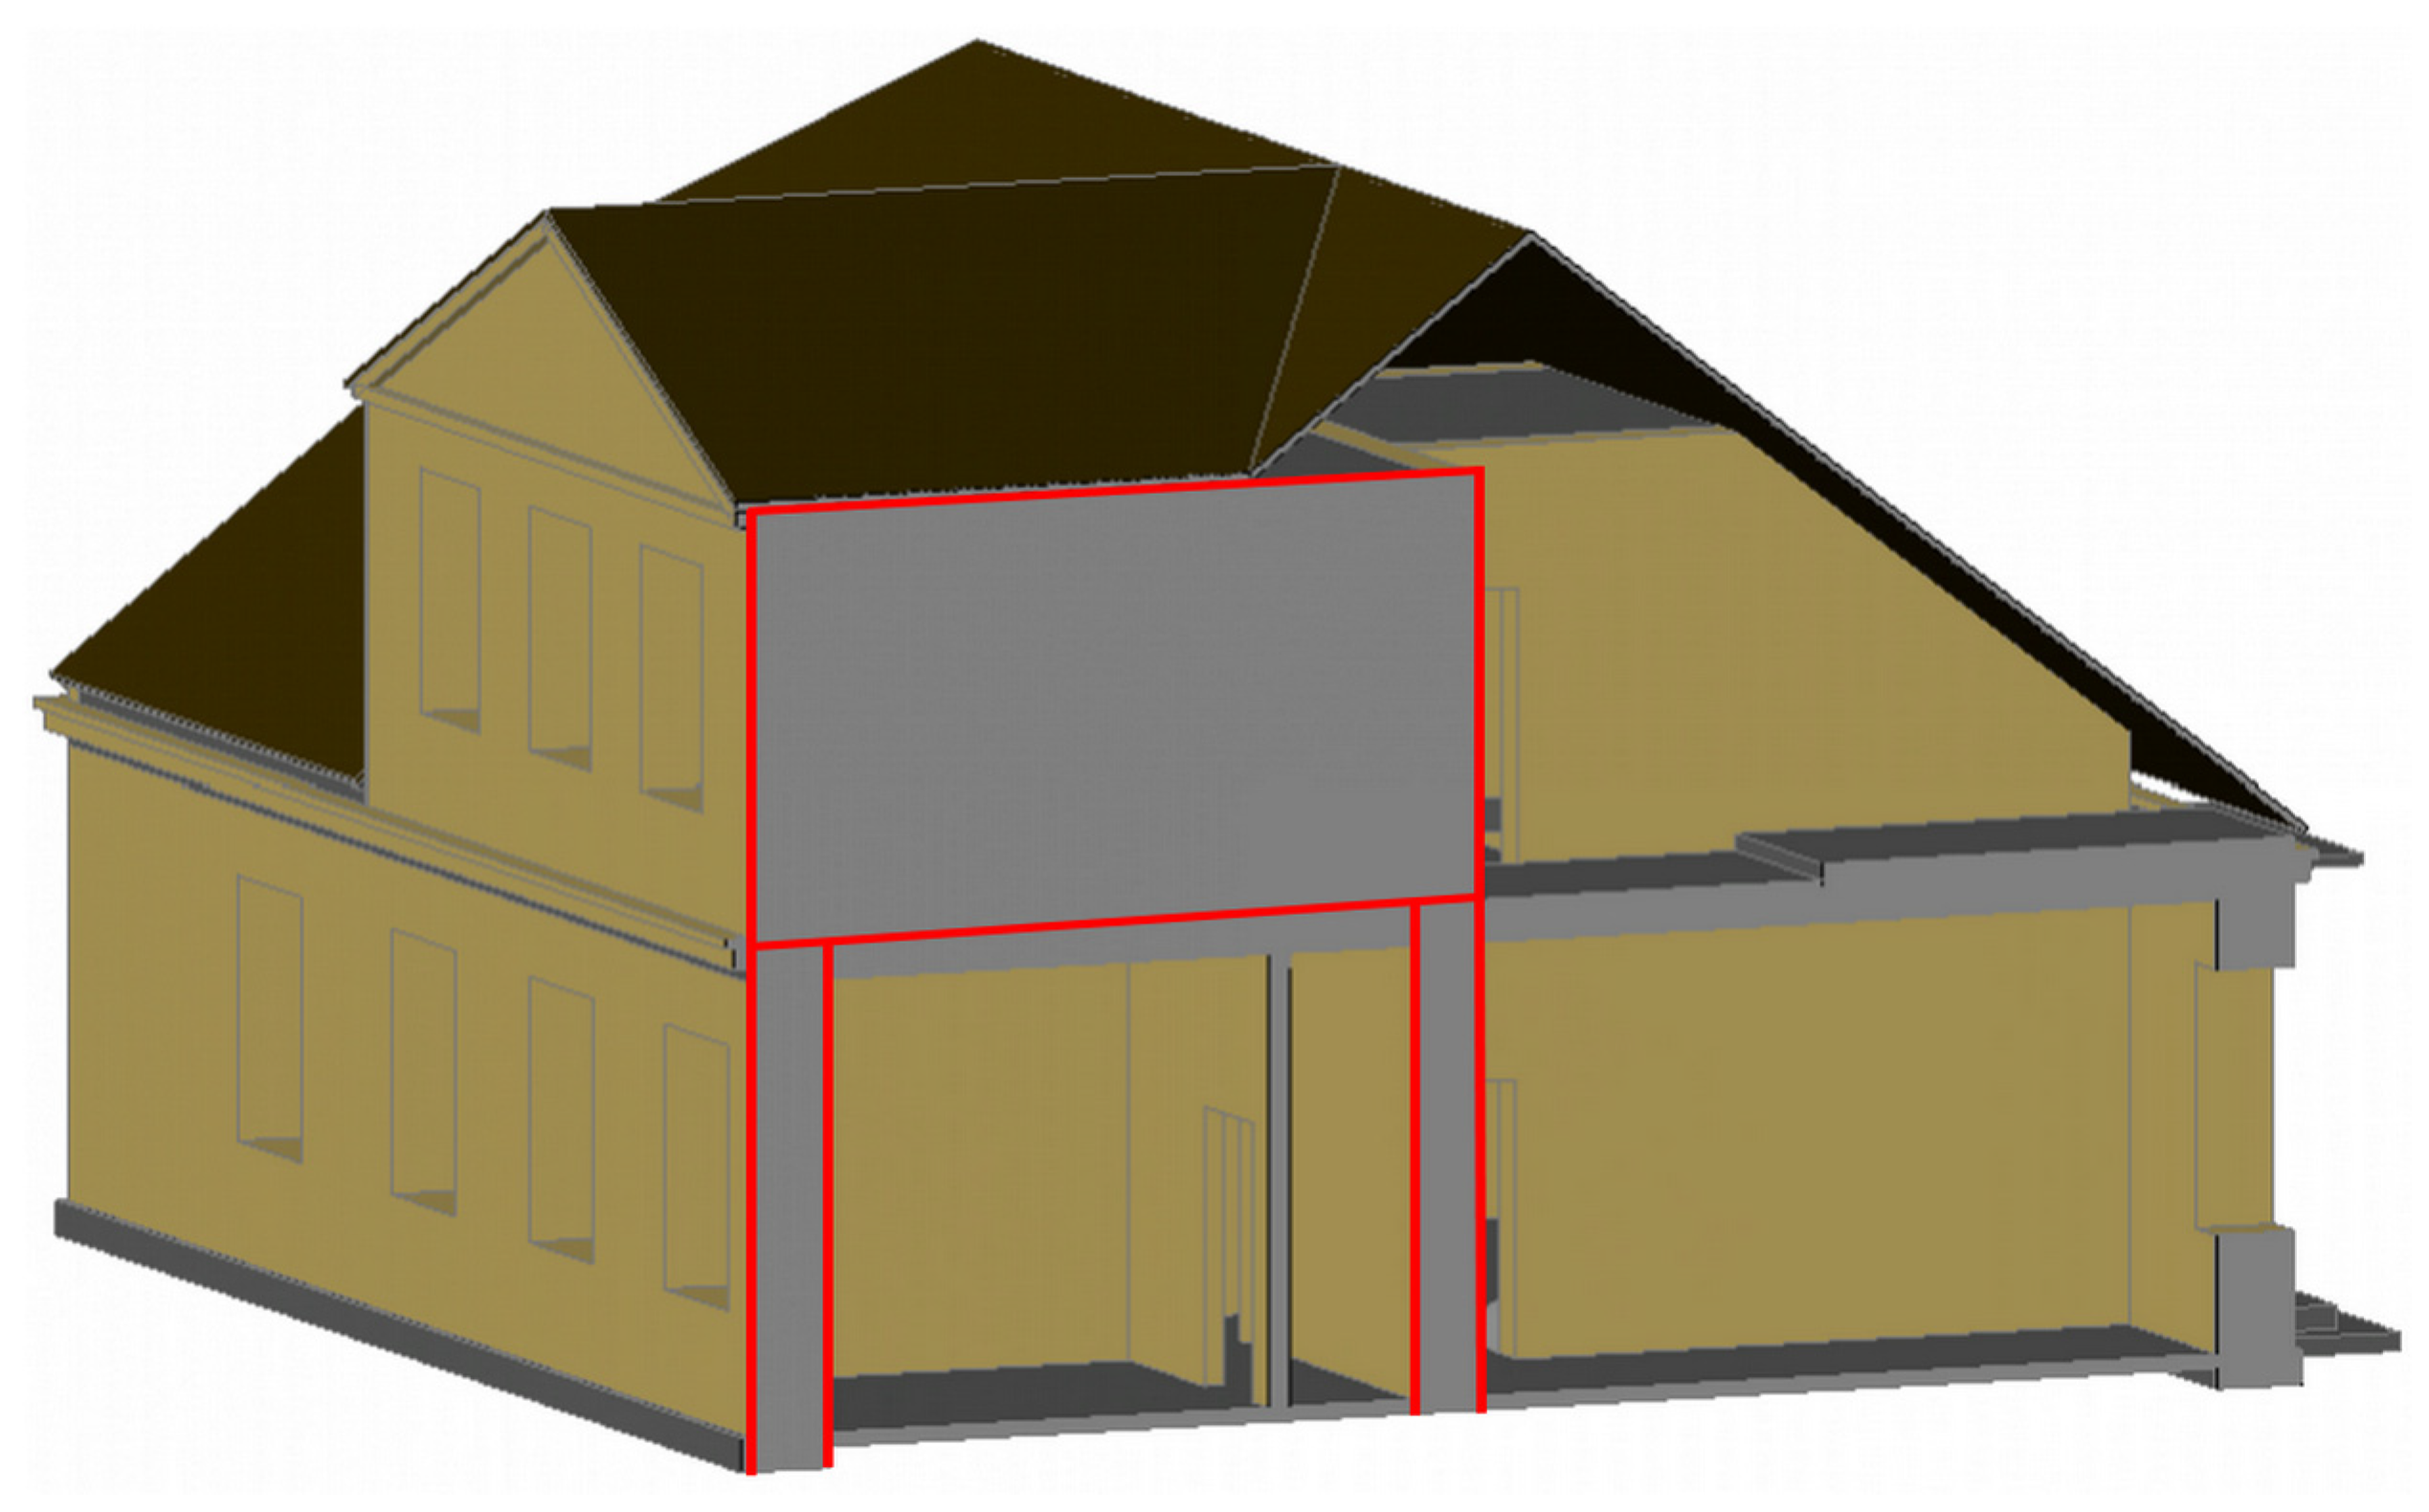
We examined the orientation of principal stress trajectories in the dormer wall. We checked whether they aligned with the direction of diagonal plaster/masonry cracks inclined at about 45°. Figure 28 presents the angles of the principal stress rotation for load combination C1 without dynamic action. It assumes an infinitely rigid subsoil (Cz = ∞). Figure 29 illustrates the structural arrangement supporting the dormer wall on the floor slab and the load-bearing walls. These walls support the dormer wall at its lower corners.
Figure 28 shows positive angles on the left side and negative angles on the right side. These patterns indicate that the principal stress axes rotate in opposite directions. On both sides, the rotation magnitudes were comparable. In the upper bands (Figure 28, points G51–G60) the angles were about 60°–88°, decreasing to about 13°–43° near the lower corners (Figure 28, points G1–G3 and G9–G10).

5. Discussion

We combined in situ vibration measurements, 3D laser scanning, numerical modelling (FEM) and soil–structure interaction (SSI) analysis. This approach provided a coherent picture of the behavior of the building under traffic-induced vibrations.
Traffic-induced vibrations attenuate during transmission from the ground to the building. We also observed several cases of amplification. This may be due to resonance, where the measured building frequencies overlap with the fundamental frequency of the building. Measurements in the X and Z directions (Figure 13 and Figure 15) showed amplitude amplification when dominant frequencies (Figure 16 and Figure 17) coincided with the natural frequencies of the structure (Table 2). The recorded frequencies of 11.87 Hz and 12.13 Hz fell within the natural frequencies of the building, 11.80 Hz and 12.25 Hz. The resonance occurred and the amplitudes on the building increased. We placed sensors in the corners of the load-bearing walls. The observed effect should be attributed primarily to the response of these elements.
We performed a modal analysis of the building for different subsoil stiffnesses. Changes in subsoil stiffness affect the lowest natural modes most strongly. The soft subsoil significantly lowers their frequencies, while the stiffer subsoil brings them close to the values of an infinitely rigid foundation (Figure 26).
We analysed shear stresses in the dormer wall (Table 3) to quantify the impact of recorded traffic-induced vibrations (Figure 19, Figure 20 and Figure 21) on plaster cracking. Maximum shear stresses decreased as the subsoil stiffness decreased. This held for both combinations, without dynamic action (C1), and with dynamic action (C2). Hence, the results are sensitive to the adopted subgrade reaction modulus. The differences between the extreme shear stress values obtained for the rigid and flexible supports were approximately 30%. Meanwhile, the influence of the load combination and the inclusion of traffic-induced vibrations is small. The differences between C1 and C2 load combinations are 0.2%, 1.4%, and 3.7%, and they grow as subsoil stiffness decreases. This indicates that the choice of subgrade reaction modulus is more significant than the choice of combination.
The principal directions rotate smoothly. They form a shear field with principal stresses intersecting near 90°. At mid-height and along the diagonal from the compressed to the tensioned zone (Figure 28), the major principal tension is oriented at about 45°. This matches the expected diagonal plaster/masonry crack. Larger angles, closer to 90°, along the top edge indicate bending and boundary condition effects. Small angles at the lower corners arise from the support constraints (Figure 29). In this case, wall support conditions primarily governed the cracking. Traffic-induced vibrations played a secondary role. The analysis indicates that the plaster should be repaired and strengthened locally to prevent cracking recurrence. We recommend treating cracks with fiberglass repair tape and a patching compound: the tape reinforces the crack edges, and the compound fills the gap.

6. Conclusions

The comprehensive diagnostic approach showed that the diagonal cracking of the plaster/dormer wall was not a direct consequence of traffic-induced vibrations. It resulted mainly from the support conditions and structural behaviour of the wall. Traffic-induced vibrations affect the dynamic response of the building, but their contribution to damage is limited because of the distance from the vibration source. Subsoil compliance proved to be the key factor. Significantly reduced the natural frequencies of the building and influenced shear stresses. Subsoil flexibility in the analyses had a greater impact than the addition of dynamic actions to the load combinations.
Field measurements and numerical analyses indicate that:
  • The intensity of ground-transmitted traffic-induced vibrations is largely attenuated at the building interface: the amplitude reduction coefficient r N was generally below unity in all directions, with only occasional amplification;
  • Amplitude amplification occurs when the measured building frequencies match the natural frequencies;
  • The comprehensive diagnostic approach should be based on vibrations recorded directly in the existing building;
  • The numerical building–subsoil model demonstrated high sensitivity to subsoil stiffness, for example, a reduction in natural frequencies of up to 65% and a decrease in the maximum shear stresses in the wall by approximately 30%;
  • The choice of load combination (C1 without dynamic action, C2 with dynamic action) had a minor effect on the maximum shear stresses; the differences were only 0.2–3.7%;
  • The shear stress map and the principal stress orientations exhibited a shear pattern consistent with the observed diagonal cracking of the plaster/dormer wall;
  • For two-storey masonry buildings, when the subgrade reaction modulus is unknown, a rigid support assumption is acceptable and consistent with the required reliability;
  • The European standard [10] omits load combinations for traffic-induced vibrations in combination with national standards. This gap can be covered;
  • The comprehensive diagnostic approach enabled the effects of traffic-induced vibrations to be distinguished from other structural factors and proved effective in identifying the cause of cracking;
  • The comprehensive diagnostic approach has limitations related to 3D scanning and FEM modelling. Three-dimensional scanners are costly, especially newer models, and data collection and processing are labor-intensive. Developing a three-dimensional numerical model is challenging for buildings with complex geometry. Achieving a faithful representation of the real structure can be time-consuming. Furthermore, an incorrect assumption of the damping ratio can affect the results.
  • The comprehensive diagnostic approach is applicable to all building types, particularly new structures with non-standard structural systems. It is also useful for assessing historic buildings, reconstructing drawing documentation when it is missing, and supporting conservation decisions regarding repair. The method enables the identification of elements exposed to dynamic actions or structural factors, allowing optimisation of repair work.

Author Contributions

Conceptualization, M.T.; methodology, M.T.; software, M.T.; validation, M.T. and Ł.G.; formal analysis, M.T.; investigation, M.T., Ł.G. and J.S.; resources, M.T., Ł.G. and J.S.; data curation, M.T.; writing—original draft preparation, M.T.; writing—review and editing, M.T. and J.S.; visualization, M.T.; supervision, J.S.; project administration, Ł.G.; funding acquisition, J.S. All authors have read and agreed to the published version of the manuscript.

Funding

This research was funded by the Instytut Techniki Budowlanej, grant number NZK-102/2025.

Institutional Review Board Statement

Not applicable.

Informed Consent Statement

Not applicable.

Data Availability Statement

Data are contained within the article.

Acknowledgments

The authors would like to thank Kazimierz Szałaj SVD for granting access to the presbytery of St Hedwig of Silesia in Warsaw for the research.

Conflicts of Interest

The authors declare no conflicts of interest.

References

  1. Bukała, M.; Chyla, A.; Chmielewski, R.; Januszewski, B.; Kruszka, L.; Ostatek, P.; Sobczyk, K. Analysis of rail traffic vibrations’ impact on a residential building. A case study. Eng. Expert 2021, 1, 35–49. [Google Scholar] [CrossRef]
  2. Beben, D.; Maleska, T.; Bobra, P.; Duda, J.; Anigacz, W. Influence of traffic-induced vibrations on humans and residential building—A case study. Int. J. Environ. Res. Public Health 2022, 19, 5441. [Google Scholar] [CrossRef] [PubMed]
  3. Stypuła, K.; Kawecki, J. Ocena eksploatowanych obiektów budowlanych w warunkach oddziaływań dynamicznych. In Diagnostyka Obiektów Budowlanych. Część 2. Badania i Oceny Elementów i Obiektów Budowlanych; Runkiewicz, L., Ed.; PWN Scientific Publishing House: Warsaw, Poland, 2021; pp. 53–74. (In Polish) [Google Scholar]
  4. Hunaidi, O. Traffic vibrations in buildings. Constr. Technol. Updates 2000, 39, 1–6. [Google Scholar]
  5. Hajek, J.; Blaney, C.; Hein, D. Mitigation of highway traffic-induced vibration. In Proceedings of the Annual Conference of the Transportation Association of Canada, Charlottetown, PEI, Canada, 17–20 September 2006. [Google Scholar]
  6. Ciesielski, R.; Kawecki, J.; Maciąg, E. Ocena Wpływu Wibracji na Budowle i Ludzi w Budynkach (Diagnostyka Dynamiczna); Building Research Institute: Warsaw, Poland, 1993; pp. 1–250. (In Polish) [Google Scholar]
  7. ISO 4866:2010; Mechanical Vibration and Shock—Vibration of Fixed Structures—Guidelines for the Measurement of Vibrations and Evaluation of Their Effects on Structures. ISO: Geneva, Switzerland, 2010.
  8. PN-B-02170:2016-12; Evaluation of the Harmfulness of Buildings Vibrations due to Ground Motion. PKN: Warsaw, Poland, 2016. (In Polish)
  9. ISO 10137:2007; Bases for Design of Structures—Serviceability of Buildings and Walkways Against Vibrations. ISO: Geneva, Switzerland, 2007.
  10. EN 1990: 2002; Eurocode—Basis of Structural Design. CEN: Brussels, Belgium, 2002.
  11. EN 1998-1:2004; Eurocode 8: Design of Structures for Earthquake Resistance—Part 1: General Rules, Seismic Actions and Rules for Buildings. CEN: Brussels, Belgium, 2004.
  12. DIN 4150-3: 2016-12; Vibrations in Buildings—Part 3. Effects on Structures. NABau: Berlin, Germany, 2016.
  13. Dudziak, S.; Kozyra, Z. Selected aspects of numerical modelling in prediction of building vibrations due to traffic. MATEC Web Conf. 2018, 196, 01055. [Google Scholar] [CrossRef]
  14. Pachla, F.; Kowalska-Koczwara, A.; Tatara, T.; Stypuła, K. The influence of vibration duration on the structure of irregular RC buildings. Bull. Earthq. Eng. 2019, 17, 3119–3138. [Google Scholar] [CrossRef]
  15. Kuzniar, K.; Tatara, T. The ratio of response spectra from seismic-type free-field and building foundation vibrations: The influence of rockburst parameters and simple models of kinematic soil-structure interaction. Bull. Earthq. Eng. 2020, 18, 907–924. [Google Scholar] [CrossRef]
  16. Kawecki, J.; Tatara, T. Procedures for taking account the impact of communication vibrations on operated buildings. Inżynieria I Bud. 2023, 79, 132–144. (In Polish) [Google Scholar]
  17. Piekarczuk, A.; Mazurek, A.; Szer, J.; Szer, I. A case study of 3D scanning techniques in civil engineering using the terrestrial laser scanning technique. Buildings 2024, 14, 3703. [Google Scholar] [CrossRef]
  18. Wang, J.; Yi, T.; Liang, X.; Ueda, T. Application of 3D Laser Scanning Technology Using Laser Radar System to Error Analysis in the Curtain Wall Construction. Remote Sens. 2023, 15, 64. [Google Scholar] [CrossRef]
  19. Suchocki, C.; Nowak, R.; Rutkowski, R.; Błaszczak-Bąk, W. Using handheld 3D laser scanner and high-resolution handheld digital microscope for hybrid building condition measurements. Measurement 2025, 253, 117751. [Google Scholar] [CrossRef]
  20. Zhang, D.; Liu, T.; Li, S.; Luo, H.; Ding, G.; Su, Z.; Xie Ch Zhang, S.; Feng, P. Three-dimensional laser scanning for large-scale as-built surveying of 2022 Beijing Winter Olympic Speed Skating Stadium: A case study. J. Build. Eng. 2022, 59, 105075. [Google Scholar] [CrossRef]
  21. Pachla, F.; Radecki-Pawlik, B.; Stypuła, K.; Tatara, T. Optimization of the protection against railway vibrations on the example of railway control building in Biała Rawska. Przegląd Komun. 2017, 6, 1–12. [Google Scholar] [CrossRef]
  22. Siskind, D.E.; Stagg, M.S. Blast Vibration Measurements Near and on Structure Foundations; Report of Investigation 8969; U.S. Bureau of Mines: Minneapolis, MN, USA, 1985.
  23. Ciesielski, R.; Maciąg, E. Drgania Drogowe i Ich Wpływ na Budynki; Transport and Communication Publishers: Warsaw, Poland, 1990. (In Polish) [Google Scholar]
  24. Wu, Y.; Gao, Z.; Zhao, M.; Du, X. Influence of structure-soil-structure interaction on seismic response and seismic migration performance of building structures. J. Build. Eng. 2024, 98, 111101. [Google Scholar] [CrossRef]
  25. Seyedi, M. Impact of Train-Induced Vibrations on Residents’ Comfort and Structural Damages in Buildings. J. Vib. Eng. Technol. 2024, 12, 1961–1978. [Google Scholar] [CrossRef]
  26. Li, M.; Lu, X.; Lu, X.; Ye, L. Influence of soil-structure interaction on seismic collapse resistance of super-tall buildings. J. Rock Mech. Geotech. Eng. 2024, 6, 477–485. [Google Scholar] [CrossRef]
  27. Korentz, J.; Marcinowski, J. Numerical symulation of paraseismic vibrations of the habitable building on elastic foundation. Czas. Techniczne. Bud. 2007, 104, 77–82. (In Polish) [Google Scholar]
  28. ISO 6346:2022; Freight Containers—Coding, Identification and Marking. ISO: Geneva, Switzerland, 2022.
  29. PN-85/B-02170:1985; Evaluation of the Harmfulness of Building Vibrations Due to Ground Motion. PKN: Warsaw, Poland, 1985. (In Polish)
  30. Pachla, F.; Kowalska-Koczwara, A.; Aldabbik, W. The Influence of Traffic Vibrations on Buildings and Human Inside the Buildings. Inżynieria Miner. 2024, 1, 1–6. [Google Scholar] [CrossRef]
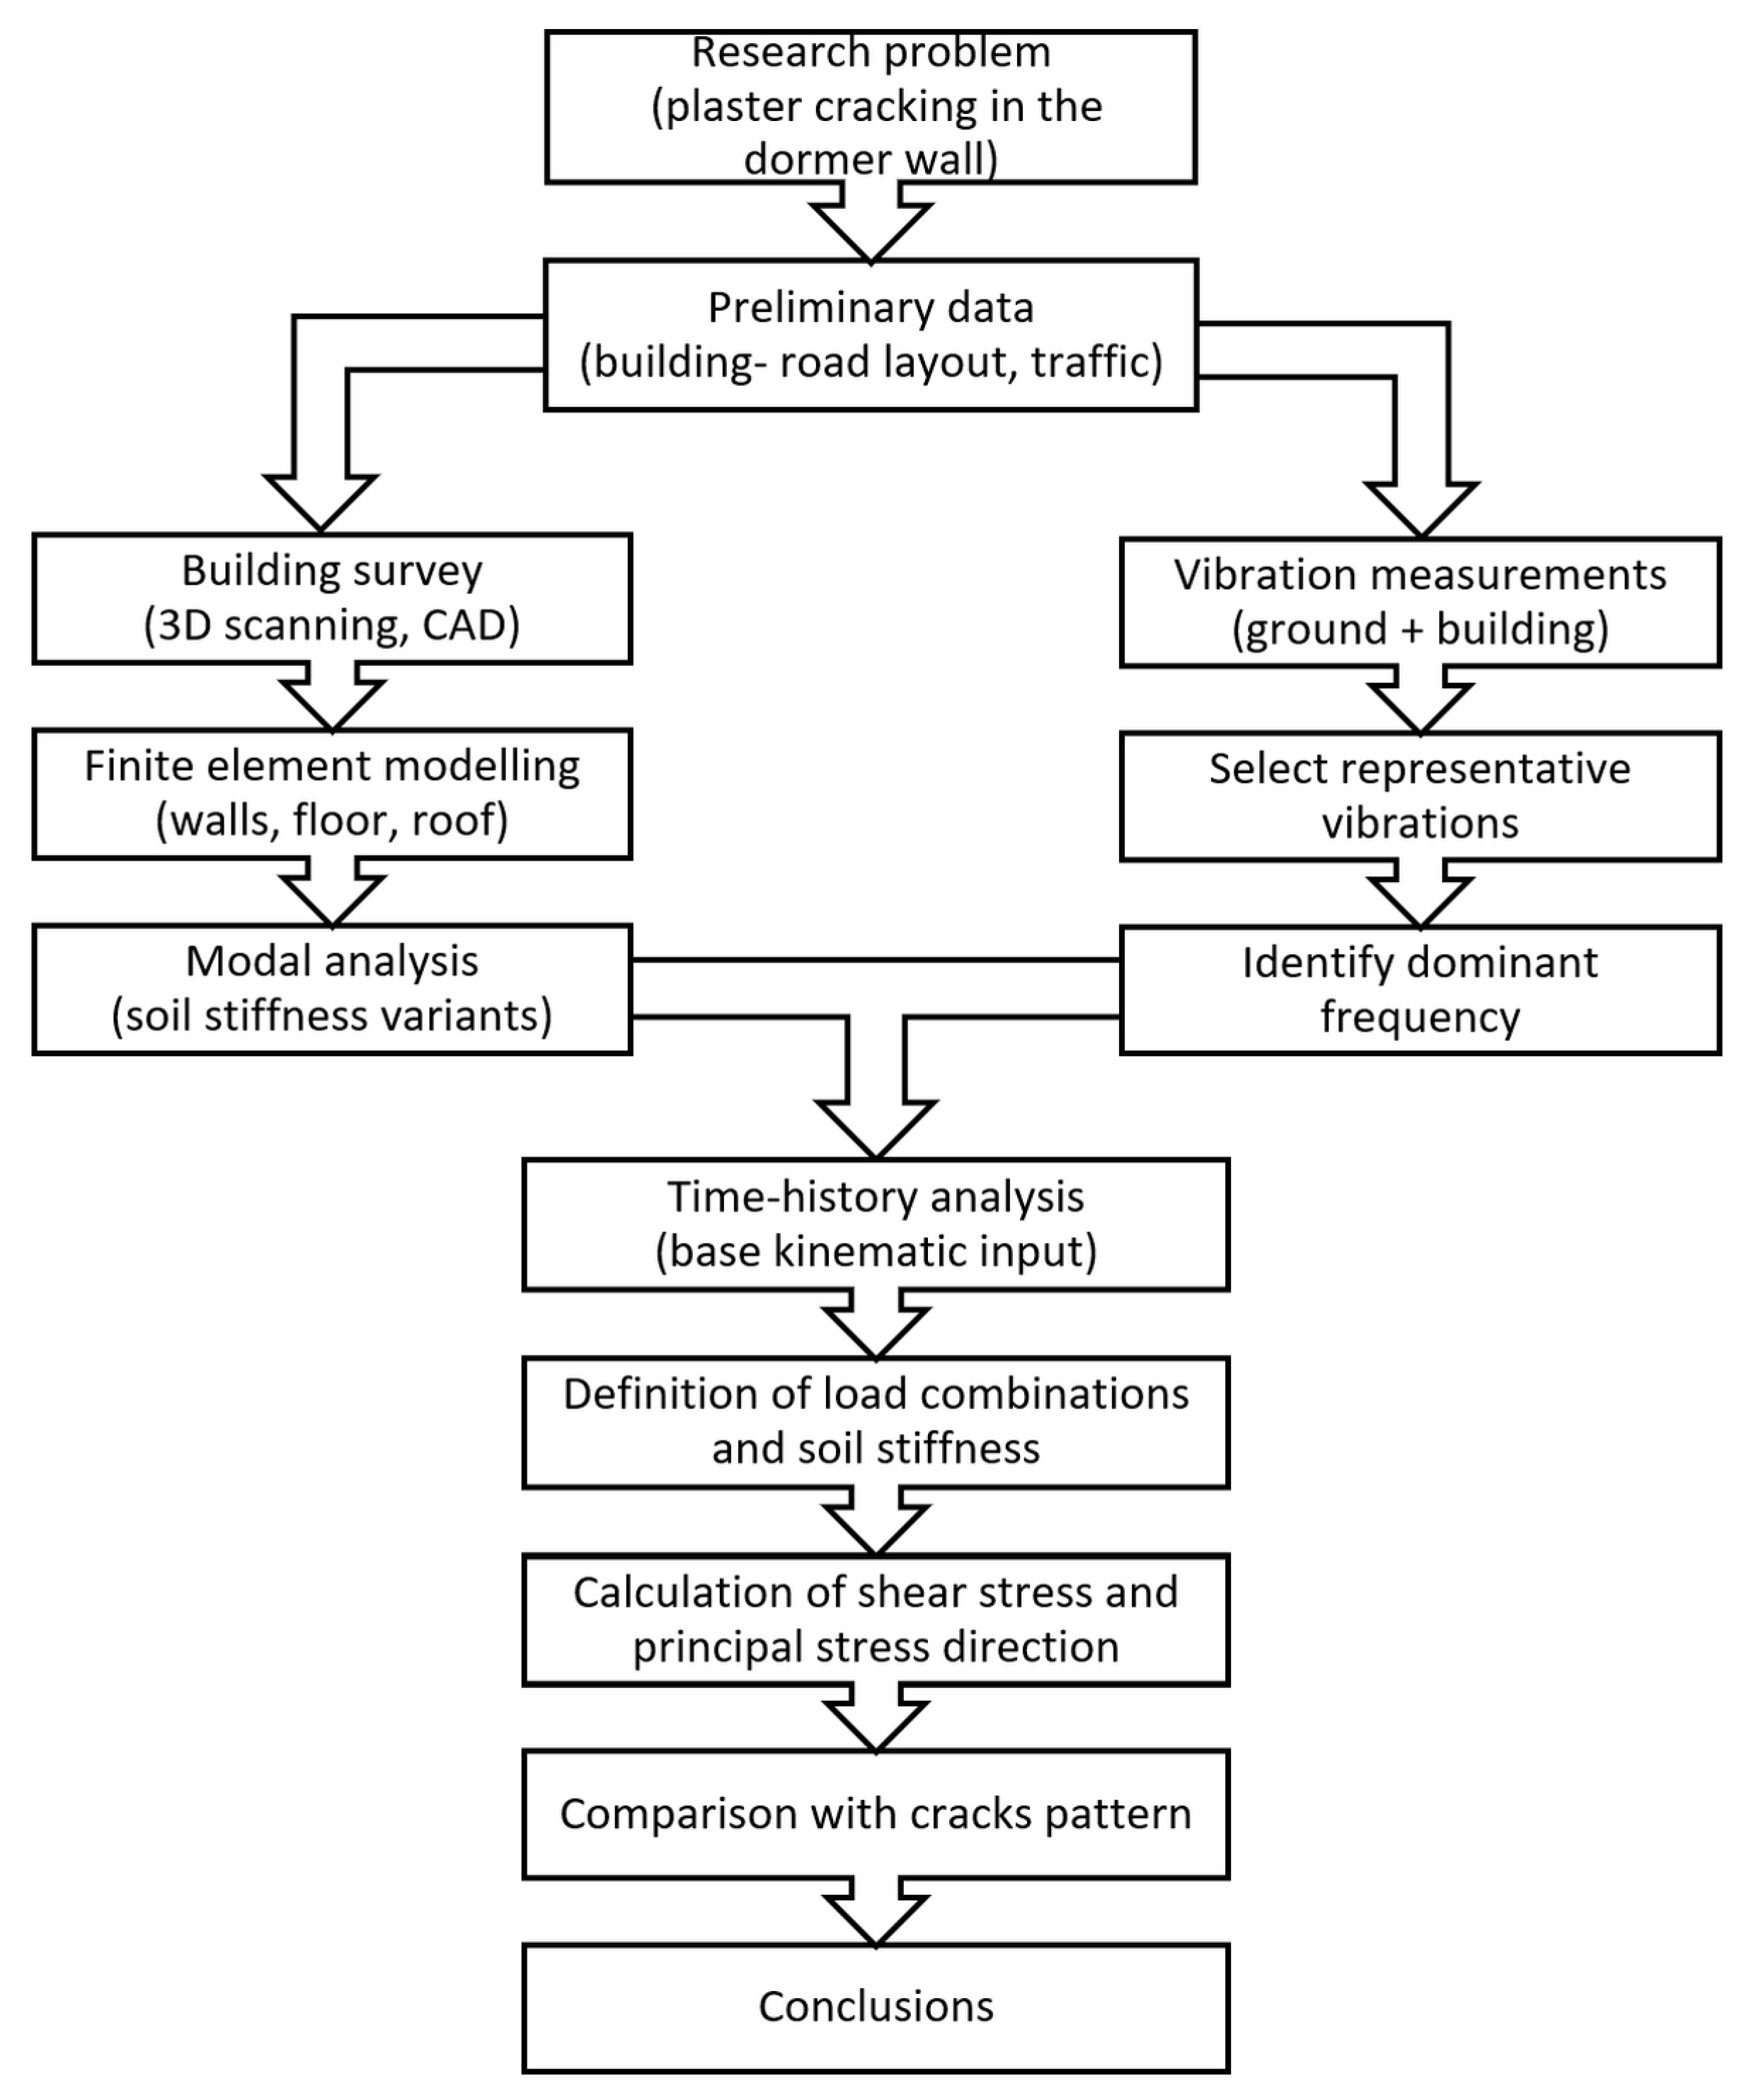
Figure 1. Schematic overview of the research procedure.
Applsci 15 11699 g001
Figure 2. Residential building.
Applsci 15 11699 g002
Figure 3. Grade-separated junction with the analysed building shown in red [map from https://www.geoportal.gov.pl/, accessed on 4 August 2025.].
Applsci 15 11699 g003
Figure 4. Diagonal crack in the plaster on the dormer walls.
Applsci 15 11699 g004
Figure 5. Road irregularities in the form of manholes are highlighted in red.
Applsci 15 11699 g005
Figure 6. Location of measurement sensors.
Applsci 15 11699 g006
Figure 7. Scanner positions 1–11 (shown in red) during external scanning.
Applsci 15 11699 g007
Figure 8. Point cloud of the building generated using a 3D laser scanner.
Applsci 15 11699 g008
Figure 9. Solid model of the building created in CAD format.
Applsci 15 11699 g009
Figure 10. Ground floor plan created in CAD format.
Applsci 15 11699 g010
Figure 11. Numerical model of the building.
Applsci 15 11699 g011
Figure 12. Boundary conditions; (a) ideal rigidity, (b) translational springs with stiffness Cx, Cy, Cz.
Applsci 15 11699 g012
Figure 13. Frequency distribution of reduction coefficient r N in the horizontal X direction of vibration.
Applsci 15 11699 g013
Figure 14. Frequency distribution of reduction coefficient r N in the horizontal Y direction of vibration.
Applsci 15 11699 g014
Figure 15. Frequency distribution of reduction coefficient r N in the vertical Z direction of vibration.
Applsci 15 11699 g015
Figure 16. Vibration frequency spectrum of the horizontal X direction for the 1.4 amplitude amplification.
Applsci 15 11699 g016
Figure 17. Vibration frequency spectrum of the vertical Z direction for the 1.3 amplitude amplification.
Applsci 15 11699 g017
Figure 18. Heavy goods vehicle transporting a container; the manhole cover is highlighted in red.
Applsci 15 11699 g018
Figure 19. Vibration of the horizontal X direction in the time domain.
Applsci 15 11699 g019
Figure 20. Vibration of the horizontal Y direction in the time domain.
Applsci 15 11699 g020
Figure 21. Vibration of the vertical Z direction in the time domain.
Applsci 15 11699 g021
Figure 22. Vibration frequency spectrum of the horizontal X direction.
Applsci 15 11699 g022
Figure 23. Vibration frequency spectrum of the horizontal Y direction.
Applsci 15 11699 g023
Figure 24. Vibration frequency spectrum of the vertical Z direction.
Applsci 15 11699 g024
Figure 25. Natural vibration modes for Cz = 9000 kN/m3, (a) first mode, (b) second mode, (c) third mode. Here, u denotes the mode-shape displacement amplitude, normalized by its maximum magnitude.
Applsci 15 11699 g025
Figure 26. Influence of subsoil stiffness on natural frequencies and mode shapes.
Applsci 15 11699 g026
Figure 27. Shear-stress contour map in the dormer wall for combination C1 and coefficient Cz = ∞; wall dimensions [meters].
Applsci 15 11699 g027
Figure 28. Angles of principal stress rotation in the dormer wall [°]. The lines show the directions of the principal stresses, and the colours indicate groups of principal stresses according to their sign.
Applsci 15 11699 g028
Figure 29. Structure of the building with the analysed wall and its support highlighted in red.
Applsci 15 11699 g029
Table 1. Quantitative traffic intensity results.
Measurement Duration
[min]
Motorcycles

[pcs]
Passenger Cars
[pcs]
Light Vans

[pcs]
Heavy Goods Vehicles
[pcs]
City Buses

[pcs]
22227646302
Table 2. Natural frequency of the building under different subsoil stiffness conditions.
Mode NumberNatural Frequency f [Hz]
CZ = ∞CZ = 90,000 [kN/m3]CZ = 9000 [kN/m3]
18.998.583.17
29.008.673.27
39.378.983.69
49.429.035.82
59.569.376.49
69.619.417.04
79.689.478.43
89.839.618.84
910.079.689.01
1010.619.839.02
1110.8710.079.39
1211.3710.229.43
1311.6110.619.61
1411.7410.879.68
1511.8011.379.82
1612.2611.6110.05
1712.6811.7410.49
1812.9511.8010.63
1913.3112.2510.88
2013.3212.6711.37
Table 3. Maximum shear stress in the dormer wall for different values of subsoil stiffness Cz and load combinations C1, C2.
Combination of Actions
for Ultimate Limit State [10]
Maximum Shear Stress τmax [Pa]
CZ = ∞CZ = 90,000 [kN/m3]CZ = 9000
[kN/m3]
C1 = 1.35 ∗ LC1 + 1.5 ∗ LC2 *280,541261,406197,425
C2 = 1.35 ∗ LC1 + 1.5 ∗ LC3 + 0.7 ∗ 1.5 ∗ LC2 *279,989257,618190,091
* C1—load combination with permanent and variable actions; C2—load combination with permanent and variable actions plus a dynamic action; LC1—permanent action; LC2—variable action Q k , i ; LC3—dynamic action Q k , f ; 1.35—partial factor for permanent action γ G , j ; 1.5—partial factor for variable action γ Q , i ; 1.5—partial factor for dynamic action γ f ; 0.7—factor for combination value of a variable action ψ 0 , i .
Disclaimer/Publisher’s Note: The statements, opinions and data contained in all publications are solely those of the individual author(s) and contributor(s) and not of MDPI and/or the editor(s). MDPI and/or the editor(s) disclaim responsibility for any injury to people or property resulting from any ideas, methods, instructions or products referred to in the content.