Abstract
The paper proposes an optimization procedure for maximizing the resistance of composite plates exposed to impact loads. For a composite plate with a predefined composite material, number, and thickness of layers, the set objective is to find the optimal solution in terms of the layer orientation so as to withstand the impact test. The fiber orientation angle is treated as a continuous design variable within the context of the problem. The commercially available finite element software package Abaqus is used to model a Kevlar 49/Epoxy composite plate and simulate its mechanical behavior when exposed to an impact load. As this deals with a highly dynamic process that involves significant nonlinear effects, an explicit time-integration scheme is selected. Prediction of the plate damage based on its maximum stress failure criteria is used as the objective function for optimization, whereas the penetration analysis is based on the Hashin criteria and implemented in an Abaqus VUMAT subroutine. The obtained results are expected to be of interest to ballistic vest manufacturers to develop passive protection solutions.
1. Introduction
Composite materials are one of the pillars of modern structural design. The exquisite combination of their light weight, high stiffness and strength, high corrosion resistance, possibility of tailoring material properties, durability, and design flexibility make them the material of choice in many contemporary structures [1]. The selection of an appropriate composite material and its configuration results in distinct advantages offered compared to other materials. With such enticing properties, composite materials have found their application in important fields of engineering, including the automotive industry [2,3], aerospace engineering [4,5], transportation [6,7], medical applications [8,9], civil engineering [10,11], defense, security, and ballistics [12,13]—to name but a few of these numerous fields. They have also significantly contributed to the development of novel structural concepts, such as lightweight active/smart structures [14,15]. The diversity of composite materials provides opportunities that should be explored to thus enhance their utilization in various applications.
To make appropriate use of the extraordinary versatility of composite materials, it is necessary to determine and suitably characterize their mechanical properties and behaviors. Although experimental tests are the ultimate approach to assessing material characteristics and comprehending the mechanical behavior of composites, they are also quite costly, especially when dealing with numerous structural design variations. Therefore, it is of crucial importance to develop numerical tools for modelling and simulating their mechanical behavior [16]. The Finite Element Method has established itself as a preferred technique in structural analysis, which is especially true for more intricate, anisotropic materials like composites. The method allows for highly reliable, efficient, and cost-effective numerical analyses of a vast spectrum of scenarios, also involving coupled field effects, e.g., thermo-mechanical [17], or electro-mechanical (piezoelectric) problems [18]. Composite materials are frequently utilized as fiber-reinforced composite laminates to create thin-walled structures, often referred to as “primadonna” within the structural hierarchy [19]. The choice of shell form for structures is motivated by the desire to achieve a high load-bearing capacity, i.e., high strength-to-weight ratio. The major workhorse theories used to describe the global behavior of composite laminates are the so-called first order theories—the classical laminate theory [20] and the first-order shear deformation theory (FSDT) [21]. The latter is more often implemented in the plate and shell type of finite elements due to the simpler requirement of C0-continuity from the shape functions [22].
The previously mentioned exceptional qualities of composite materials also make them a suitable choice to produce lightweight products aimed to serve as ballistic protection. In that case, the material design prioritizes damage tolerance by increasing the impact resistance. A number of researchers have dedicated their work to different aspects of this and other related problems. Abtew et al. [23] presented various ballistic textiles as well as composites used for ballistic applications in the form of body armor. Their focus was on the ballistic impact mechanism and the analysis of parameters such as the thickness, strength, ductility, toughness, and density of the target material. Yang et al. [24] applied multi-scale finite element modeling to simulate the behavior of woven fabrics involving fiber bundles and yarns exposed to ballistic impact. The study by Meliande et al. [25] evaluated the applications of a laminated hybrid composite with aramid woven fabric and a curaua non-woven mat in military ballistic helmets. The main advantage of their approach is in the fact that hybrid composites involve several reinforcement materials, thus providing a wider range of physical and mechanical properties with improved elasticity, strength, and toughness [26]. Furthermore, Zochowski et al. [27] conducted FE analysis of composite material matrices reinforced with aramid fibers and subjected to projectile impact conditions. Bajya et al. [28] proposed an interesting soft armor panel design based on shear thickening fluid (STF)-reinforced Kevlar fabric. Zhang et al. [29] suggested investigating preload effects on the high velocity impact behavior of fiber metal laminates and used finite element analysis to perform this investigation. Similarly, Gregori et al. [30] developed both analytical and numerical models to simulate the perforation of ceramic-composite targets by small-caliber projectiles and validated their results by performing impact tests. Ranaweera et al. [31] showed that protection in the form of tri-metallic steel–titanium–aluminum armor is superior to the protection provided by a monolithic armor.
High-hardness ceramics are often used in lightweight armor systems to protect against the intrusion of high-speed armor-piercing (AP) projectiles. Gour at al. [32] worked to improve the design performance of ceramic armor for combat vehicles. They applied FEM for numerical modeling and simulation of a bi-layer ceramic and metal structure, which was followed by experimental validation. Biswas and Datta [33] evaluated the ballistic resistance of a multilayer ceramic-backed fiber-reinforced composite target plate by means of FEM.
Also, other types of composites have been considered as protection against ballistic impact. Ansari et al. [34,35] investigated the ballistic performance of aluminum matrix composite armor with ceramic ball reinforcement under high-velocity impact. Batra and Pydah [36] used explicit analysis in ABAQUS to perform nonlinear, large deformation impact analysis of poli-etar-etar-keton (PEEK)–ceramic–gelatin composites and, thus, study the behind-armor ballistic trauma. Guo et al. [37] investigated how a Kevlar-29 composite cover layer would improve the performance of a ceramic armor system against penetration of a projectile. Osnes et al. [38] conducted a study involving experimental tests and numerical simulations of a double-laminated glass plate under ballistic impact. The experimental tests were used to determine the ballistic limit velocity and curve for the laminated glass targets and to create a basis for comparison with numerical simulations. Sandwich structures also belong to this group, and they typically include complex three-dimensional additions, cores, designed to increase the strength and stiffness under bending and shear loading. Cui et al. [39] investigated the ballistic limit of sandwich plates with a metal foam core using FE simulations. Experimental work was also performed to validate these experimental results. In the work of Beppu et al. [40], the failure characteristics of ultra-high-performance fiber-reinforced concrete (UHPFRC) panels, with a thickness of 60–120 mm, were investigated experimentally.
Research in this field also covers investigations related to the influence of projectile shape on the impact on the composite material [41,42]. Several types of projectiles were used to obtain ballistic curves, such as conical, ogival, spherical, hemispherical, and flat. Another important aspect is the impact angle of the projectile when it hits the composite, and such a study was carried out by Titira and Muntenit [43], whereby angles were varied from 0° to 70°.
While FEM is regarded as the primary method in structural analysis, it is important to note that the problem of a bullet penetrating a plate has also been simulated and examined using mesh-free methods, such as Smooth-Particle Hydrodynamics (SPH), Multi-Materials Arbitrary (MM-ALE), and Lagrangian with material erosion [44].
Based on lamina failure theories, several methods predict damage development, classified as non-interactive, interactive, and partially interactive. Limited, or non-interactive, methods compare individual lamina stresses or strains with their corresponding strengths or ultimate strains, and these form the maximum stress and maximum strain [45] criteria. In the case of interactive methods, all stress components are included in a single expression, such as the Tsai–Wu [46], Tsai–Hill [47], and Azzi–Tsai–Hill [48] criteria. Partially interactive or failure mode-based methods provide separate criteria for fiber and matrix failures, such as the Hashin [49] criterion.
The contribution of this work is to propose an effective way to optimize the composite plate exposed to ballistic impact loading. A suitable choice of composite material for the requirement of high impact resistance and energy-absorbent layers is a prerequisite for the problem at hand. The favorable properties of Kevlar fibers and resilient epoxy matrix render their combination, namely Kevlar 49/epoxy, an adequate selection. This material is well known for its applications in ballistic armor, bulletproof vests, helmets, and other impact-resistant structures [50]. As this work represents the authors’ first step in this direction, it will be assumed that the material, number, and thickness of layers are predefined in the problem, and the optimization task is to determine the fiber orientation in the layers that would be most favorable regarding the impact resistance [51]. The optimal solution for the laminated composite plate was determined using failure theory based on the criterion of maximum stress. This was achieved by implementing a genetic algorithm as the search method to systematically explore the design space and identify the optimal solution. To facilitate the optimization process, a simplified two-dimensional (2D) finite element model of the composite plate was developed. Optimization was performed by varying simulation parameters within this 2D framework to identify the optimal solution. Subsequently, the results were validated using a detailed and more accurate three-dimensional (3D) model of the plate based on established verification criteria. Integrating finite element analysis with a genetic algorithm enhances optimization efficiency while maintaining physically accurate results. Abaqus VUMAT subroutine-based material models and parallelized computations reduce computational cost and improve the robustness of the solution. This framework is generalizable and applicable to the design of advanced composites and impact-resistant structures.
2. Theoretical Background and Methodology
This section presents two distinct theoretical frameworks related to the modeling of the impactor and the composite laminate. The impactor consists of typical metallic structures, and its behavior is described using the Johnson–Cook plasticity model. In accordance with the software requirements, a complete definition of the Johnson–Cook model (including hardening) was implemented, enabling the reproducibility of the analyses by interested readers. For the composite laminate, two modeling approaches were employed: the first to prepare the model for optimization, and the second to validate the optimal solution. The Maximum Stress Criterion method was chosen for the laminate optimization process, as it is suitable for defining the objective function and monitoring the overall failure index according to the specified criterion. Additionally, the Hashin failure model was introduced to describe a more complex laminate model, which serves both to confirm the results obtained by the previous method and to provide a more detailed insight into the damage mechanisms. The Hashin model allows simultaneous tracking of internal damage in the composite’s fibers and matrix. Finally, the theoretical foundations of the optimization methods used to search the design space for the optimal solution are presented. These include the grid search method and the genetic algorithm, both of which were applied to explore and identify the most effective configuration of the composite laminate.
2.1. Johnson-Cook Plasticity
The Johnson–Cook constitutive model was applied to the impactor material to accurately represent its metallic behavior and capture the structural response in the plastic deformation domain. The Johnson–Cook Plasticity model is a particular type of von Mises plasticity model with analytical forms of the hardening law and rate dependence. It is suitable for high strain-rate deformation of many materials, including most metals. It can be used in conjunction with the progressive damage and failure finite element method (FEM) models to specify different damage initiation criteria and damage evolution laws that allow for the progressive degradation of the material stiffness and removal of elements from the mesh. Also, it is used in conjunction with either a linear elastic material model or an equation of state material model [52].
2.1.1. Johnson–Cook Hardening
Johnson–Cook hardening is briefly presented here, because it is a constituent part of Johnson–Cook plasticity, and the parameters need to be provided in ABAQUS, regardless of the fact that hardening effects play no role in the analysis to be conducted here. The Johnson–Cook hardening model represents a specific form of isotropic hardening, in which the static yield stress σ0 is expressed as follows:
where is the equivalent plastic strain and A, B, n, and m are material parameters measured at or below the transition temperature, Ttransition, and is the nondimensional temperature defined as follows:
Here, T denotes the current temperature, Tmelt the melting temperature, and Ttransition the transition temperature, defined as the temperature at or below which the yield stress becomes independent of temperature. The material parameters should be determined at or below this transition temperature.
According to the equations given above, one needs to provide the values of A, B, n, m, Tmelt, and Ttransition as a part of the Johnson–Cook plasticity definition. Furthermore, the Johnson–Cook strain rate dependence assumes the following:
where is the yield stress at nonzero strain rate, is the equivalent plastic strain rate, is the reference strain rate, C is the strain rate sensitivity, is the static yield stress and is the ratio of the yield stress at nonzero strain rate to the static yield stress (so that ). Hence, the yield stress is expressed as follows:
2.1.2. Johnson–Cook Damage Criterion
The Johnson–Cook criterion is a special case of the ductile damage initiation criterion, in which the equivalent plastic strain at the onset of damage, , is assumed to be of the following form:
where d1–d5 are the failure parameters.
The Johnson–Cook criterion can be used in conjunction with Mises, Johnson–Cook, Hill, and Ducker–Prager plasticity models. When used in conjunction with the Johnson–Cook plasticity model, the specified values of the melting and transition temperatures should be consistent with the values specified in the plasticity definition. The Johnson–Cook damage initiation criterion can also be specified together with any other initiation criteria, including the ductile criteria. When used in conjunction with the Johnson–Cook plasticity model, the specified values of the melting and transition temperatures should be consistent with the values specified in the plasticity definition. The Johnson–Cook damage initiation criterion can also be specified together with any other initiation criteria, including the ductile criteria.
2.2. Failure Criteria
Failure of composite materials is predicted by means of failure criteria, the implementation of which into the FEM framework is relatively straightforward. The failure criterion can be expressed using the failure index IF as follows [53]:
where σ is the applied stress and σF is the material strength in the loading direction. It can also be expressed via the strength ratio R, which is the inverse of the failure index:
Failure will occur when IF ≥ 1, that is, R ≤ 1.
2.2.1. Maximum Stress Theory
The maximum stress theory [54] is applied to composite materials to predict the failure strength of unidirectional laminates. Damage prediction is performed based on the stress of an individual composite layer. The damage index IF according to the maximum stress criterion is
where σ1 and σ2 are the normal stresses, and σ12 is the shear stress. The dependence is given by the following expressions:
where F1t is longitudinal tensile strength, F1c longitudinal compressive strength, F2t transverse tensile strength, F2c transverse compressive strength, and F6 in-plane shear strength (see Figure 1).
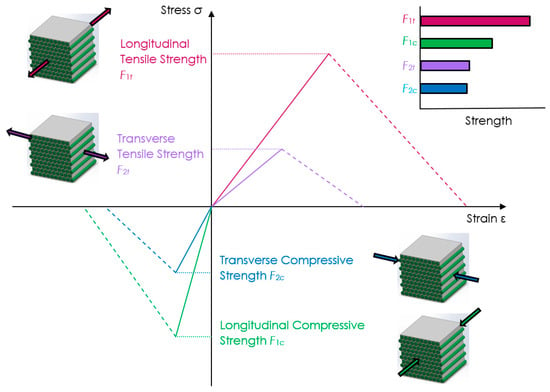
Figure 1.
Strength characteristics of multidirectional composite laminates.
Damage in the laminate is avoided when the maximum stress failure index does not exceed unity:
Under these conditions, micro-damage to the matrix and fibers, imperceptible to the naked eye, does not occur.
2.2.2. Hashin Failure Criterion
The Hashin Failure Criterion (HFC) offers a more refined assessment of damage in composite plates compared to traditional methods, as it explicitly differentiates between fiber and matrix failure mechanisms. This distinction enhances its reliability in evaluating material degradation and makes it particularly suitable for validating earlier failure models. Moreover, its compatibility with numerical implementation in three-dimensional finite element simulations further supports its application in advanced composite damage analysis. HFC distinguishes four failure modes, and each of them is described by a suitable equation, as listed below:
- Fiber tension mode
- Fiber compression mode
- Matrix tension mode
- Matrix compression mode
It should be noted that, according to HFC, Equations (12)–(15) define the square of failure indices. When any of these failure indices surpass 1, it indicates that the corresponding damage mode has initiated in the composite ply.
The stresses σ1, σ2, and σ6 are the components of the stress tensor, σ, which are used to evaluate the failure criteria. The following expressions are used for this purpose:
where σ is the true stress and M is the damage operator:
The internal damage variables, df, dm, and ds, characterize fiber, matrix, and shear damage. These variables are derived from the damage variables dtf, dcf, dtm, and dcm, corresponding to the aforementioned four modes:
Each damage variable ranges from 0, representing an undamaged state, to 1, indicating complete material failure. The damage operator M modifies the nominal stress components to reflect the progressive degradation of material stiffness associated with damage evolution in each failure mode.
2.3. Procedure for Determining the Failure Index Based on the Maximum Stress Criterion
A flowchart for computing the maximum stress failure index of a laminate exposed to mechanical loading [55] is presented in Figure 2.
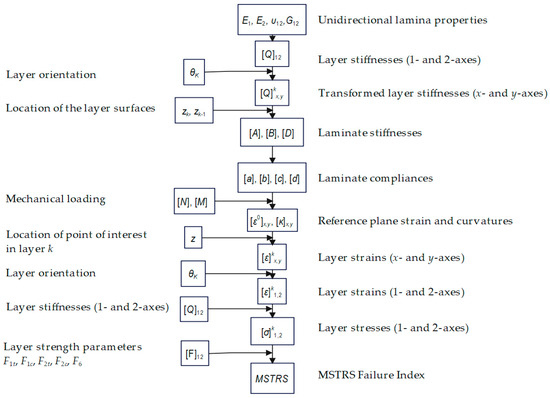
Figure 2.
Flowchart for stress and failure analysis of multidirectional laminates (Maximum Stress Criterion).
The procedure for determining the failure index using the Maximum Stress Criterion begins with the preparation of input data. This includes the basic lamina properties such as the longitudinal modulus (E1), transverse modulus (E2), Poisson’s ratio (ν12), and in-plane shear modulus (G12). Additionally, the laminate stacking sequence must be defined, including the orientation angles of each ply relative to the reference direction, along with the thickness of each ply. External loading conditions are also required in the form of in-plane forces (Nₓ, Nᵧ) and moments (Mₓ, Mᵧ).
With the material and geometric data available, the next step is to compute the stiffness matrix. Computation of the ply stiffnesses [Q]1,2 is referred to their principal material axes using the following relation:
Once the local stiffness matrix is calculated, it must be transformed to the global laminate coordinate system (x, y). Transforming the layer stiffness [Q]kxy, of layer k to the laminate coordinate system (x, y) proceeds according to the following:
Following this, the vertical coordinates of each ply’s top and bottom surfaces (zk and zk−1) are computed relative to the laminate mid-plane. These values are used in the calculation of the laminate stiffness matrices: the extensional matrix [A], the coupling matrix [B], and the bending matrix [D]. These matrices are obtained by summing the contributions of each ply’s stiffness over its thickness, weighted by appropriate functions of the z-coordinates.
Once the stiffness matrices are determined, the overall laminate compliance matrix is calculated by inverting the combined matrix formed by [A], [B], and [D]:
From this, the mid-plane strains [ε0]x,y and curvatures [κ]x,y are computed using the applied loads (N and M).
To evaluate the stress and strain in a specific ply, the through-thickness coordinate z at the point of interest must be selected. For laminates with many thin layers or symmetric laminates under in-plane loading, the mid-plane of the ply is typically used. However, for laminates with few, thick layers under bending or asymmetry, it is often necessary to evaluate strains and stresses at the top and bottom surfaces of each ply to capture maximum values. The total strain at the chosen point in the global coordinate system is calculated by adding the mid-plane strain to the product of curvature and distance z from the mid-plane using Equation (26):
These global strains are then transformed to the local material axes (1,2) using a standard transformation matrix:
The stresses in each ply [σ]k1,2 are then obtained by multiplying the local strain vector by the ply stiffness matrix in the (1,2) coordinate system using Equation (28):
To complete the failure analysis, material strength data [F]1,2 must be input, including the allowable tensile and compressive strengths in both the longitudinal and transverse directions, as well as the shear strength. The Maximum Stress Criterion is then applied by comparing each stress component to its corresponding allowable strength. A failure index is calculated as the maximum ratio between the actual stress and the material strength. If any of these ratios exceed 1, the ply is considered to have failed under the given loading conditions.
2.4. Optimization Methods
2.4.1. Grid Search Method
The grid search method, also known as the scanning method, presents a way to minimize the objective function when solving problems in technical and other sciences [56]. It is characterized by searching for the value of the objective function within the allowed area, where an extremum of the objective function can be found. The larger the density of points where the function is examined, or the smaller the scanning step, the greater the accuracy of the results will be. This increases the likelihood of discovering a global extremum among the local ones. In all types of mathematical models, finding a global optimum is guaranteed by maintaining a sufficiently high density of points. This is the main practical feature of the scanning method. Scanning methods are divided based on the type of search pattern used within the allowed area. The pattern can take the form of a grid (Figure 3), a spiral, or other configurations, with either constant or variable steps.
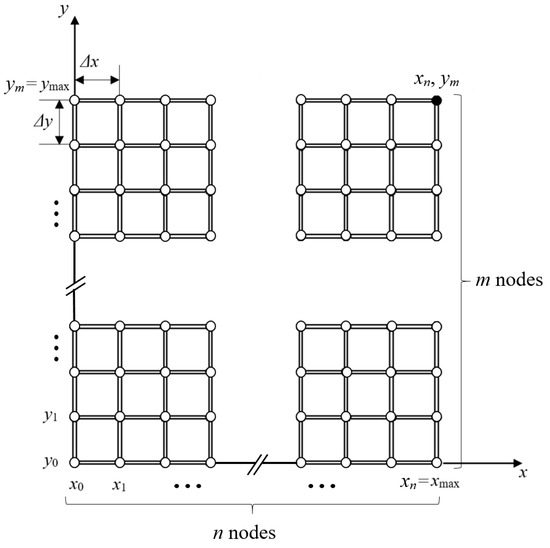
Figure 3.
The search plan with a constant step in the form of a network.
The grid search method used in this paper employs a grid with a constant step. This method is characterized by simplicity and certainty in identifying the lowest function value. Its simplicity comes from using mathematical equations that do not require derivatives. Finding the extremum is based on a straightforward and concise mathematical formulation. Constraint functions do not complicate the procedure; they are often expressed as inequalities. The simplicity of the scanning method offers an advantage over other optimization techniques.
2.4.2. Genetic Algorithm
A genetic algorithm is a metaheuristic optimization technique inspired by the principles of natural selection and evolution, designed to efficiently explore complex search spaces and identify optimal solutions [57,58]. By applying specialized evolutionary techniques, we can develop effective formulas for predicting certain events. In a genetic algorithm, each potential solution is encoded as a sequence of genes called a chromosome. These chromosomes collectively form a population, often called a generation, at a specific point in time. After defining the objective function, an initial population is generated. Each chromosome is then evaluated and scored based on its performance. If the desired criteria are not met, the algorithm proceeds through multiple cycles—selecting, combining, and mutating chromosomes—until an optimal or acceptable solution is achieved. At each stage, a genetic algorithm applies three types of rules to produce the next generation: selection, crossover, and mutation. The process starts with the selection principle, where individuals are chosen to serve as parents for the next population. These selected parents undergo crossover, producing offspring that form the new generation. To maintain diversity and explore new options, mutations are introduced randomly, helping the population evolve. In a genetic algorithm, key terms include gene, representing a specific property or variable; chromosome (or organism), which is a combination of genes and represents a potential solution; and population, consisting of multiple chromosomes. Within this population, parents are selected to generate the next generation. Reproduction involves applying crossover and mutation to these parents, creating new chromosomes and evolving the population over time. Initially, chromosomes are created from existing variables, and the algorithm uses a diverse initial population. Each chromosome is tested, with better ones having a higher chance of survival and reproduction, while weaker ones die out. The next step is to create the second generation from this initial pool. A new generation is produced by crossing suitable pairs of individuals, resulting in chromosomes that are more fit than those in the previous generation. This process repeats until the algorithm’s termination condition is met. The algorithm can be stopped under several conditions, such as reaching a predefined number of generations or finding a satisfactory or optimal solution. It may also end if the population becomes uniform, with little to no variation remaining, or manually, based on visual inspection or user judgment. Due to the randomness involved, the final solutions can differ across multiple runs, although they tend to be similar. These differences are caused by various internal factors within the algorithm. The entire process of multi-criteria optimization with genetic algorithms is illustrated in Figure 4.
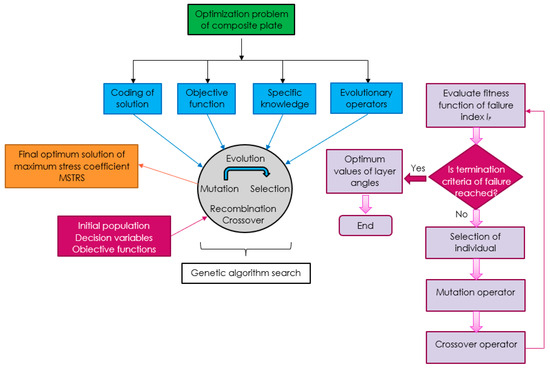
Figure 4.
Genetic algorithm for composite plate optimization.
3. Finite Element Analysis and Optimization Procedure
The finite element method was employed within the optimization framework to accurately predict the structural response of the composite plate. The modeling and simulation were performed using the commercial software ABAQUS (version 2024). The methodology for model preparation, finite element analysis, and optimization is presented in the following sections.
3.1. Geometry and FE Mesh
As the study investigates the contact interaction between an impactor and a composite plate, their geometries were defined, finite element models developed with the domains suitably discretized for the analysis. The geometry of the impactor is presented in Figure 5. The impactor has an ellipsoidal shape with a semi-major axis of 10.5 mm and a semi-minor axis of 4.5 mm (Figure 5a). The shape of the impactor resembles that of a bullet, selected for its penetrating characteristics. Composed of two distinct materials, the impactor geometry is divided into a core and a jacket, as shown in Figure 5b. The jacket has a uniform thickness of 1 mm, and the total mass of the impactor is 8 g. The impactor is modeled as a deformable body discretized using 35,388 quadratic tetrahedral elements (type C3D10M), as depicted in Figure 5b. A mesh convergence study was performed to ensure the accuracy of the results, confirming that the presented finite element model yields converged and reliable outcomes.
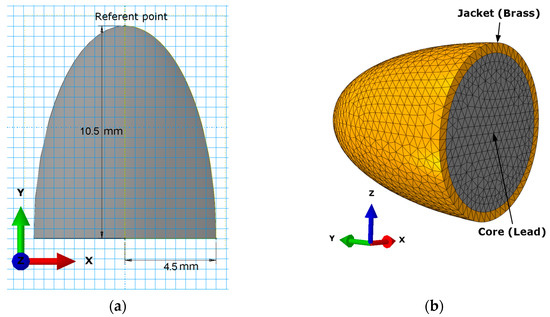
Figure 5.
Impactor model: (a) dimensions (b) finite element discretization of the impactor.
The composite plate was modeled in two forms: two-dimensional (2D) and three-dimensional (3D). The 2D model was employed for optimization simulations, while the 3D model was used for verification. Both models were defined with identical specifications, including dimensions, thickness, number of layers, and material properties. The size of the plate is 100 × 100 mm2 as shown in Figure 6a. The plate is defined as deformable, with elastic and plastic material properties. It consists of three layers, each 1 mm thick, thus yielding a total thickness of 3 mm. The discretization of the plate was performed using different finite element types based on the model geometry: shell elements (type S4R) were applied for the 2D model, while hexahedral elements (type C3D8R) were used for the 3D model. To enhance the accuracy of the analysis, mesh refinement was applied in the central region of the plate, where contact with the impactor is expected, as illustrated in Figure 6b.
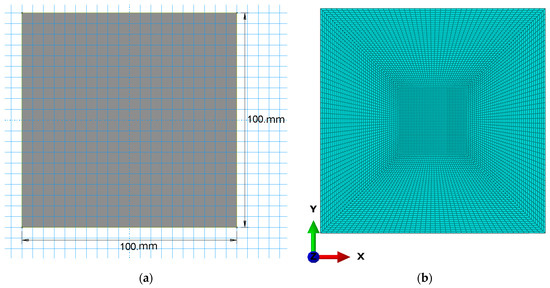
Figure 6.
Target model (a) composite plate dimensions; (b) finite element discretization of the composite plate.
The discretization mesh was established following a sensitivity study of four mesh configurations with varying element densities. The analysis was conducted for the central node of the plate, directly subjected to impact and experiencing the maximum stress response. Comparison of the Maximum Stress Criterion values over time, as shown in Figure 7, indicated that the medium-density mesh provided an optimal compromise between computational efficiency and result accuracy. Mesh model 3, comprising 30,000 elements, was selected for its close agreement with the finest mesh and favorable computational performance. Therefore, this mesh configuration was adopted for subsequent simulations.
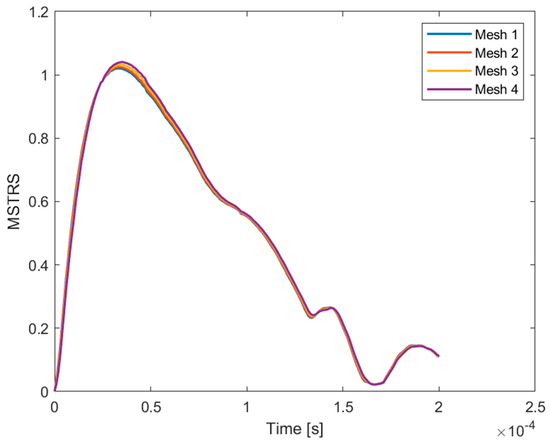
Figure 7.
Mesh sensitivity analysis for discretization models with 8500, 15,000, 30,000, and 67,000 elements (Mesh 1, Mesh 2, Mesh 3, and Mesh 4).
3.2. Properties of Materials
Material properties were specified for both the impactor and the composite plate to accurately represent their mechanical behavior in the simulation. The impactor consists of two distinct materials: a brass jacket and a lead core. The mechanical behavior of these materials was defined using the Johnson–Cook constitutive model, with properties provided in Table 1.

Table 1.
Material properties of the impactor.
For the composite plate, Kevlar 49 was selected based on the findings of [55], which demonstrated its superior mechanical performance under impact loading. The material parameters used in the 2D finite element model of the plate are listed in Table 2.

Table 2.
Properties of Kevlar 49/epoxy unidirectional material (two-dimensional).
The 3D composite plate model includes additional material parameters to account for through-thickness behavior and three-dimensional stress states, supplementing those defined in the 2D model. These parameters are provided in Table 3.

Table 3.
Properties of Kevlar 49/epoxy unidirectional material (three-dimensional).
In Figure 8, the considered composite plate is illustrated with an example of a ply orientation of 45/−45/45°, where the ply angles are specified relative to axis 1, representing the reference direction. A reference plane is shown at the mid-thickness of the plate, and three through-thickness integration points are defined within each ply (IP), at which the simulation results are evaluated. The figure also displays the thickness of each layer and the corresponding material assignment, providing a clear representation of the laminate architecture used in the simulation.
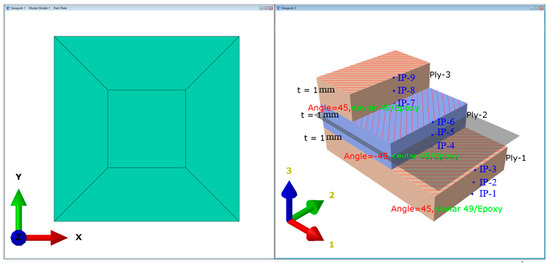
Figure 8.
Schematic illustration of a composite plate.
3.3. Initial and Boundary Conditions
After defining the models and assigning their material properties, the initial conditions and boundary constraints were established to prepare the simulations. The initial position of the impactor is set as shown in Figure 9a, with the impactor moving along the negative z-direction at a velocity of v3 = 25 km/h (~7 m/s). Figure 9b depicts the boundary conditions applied to the composite plate, which was fully constrained along all four edges by fixing all translational (U1 = U2 = U3 = 0) and rotational (UR1 = UR2 = UR3 = 0) degrees of freedom. The applied boundary support conditions are identical for both the 2D and 3D plate models. The impactor hits the plate at a right angle (90°), resulting in the maximum normal impact load. This impact orientation constitutes the critical loading condition and is therefore selected as the worst-case scenario for the numerical simulations.
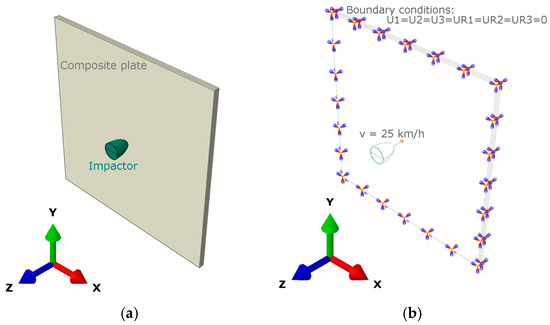
Figure 9.
(a) Initial position; (b) boundary conditions.
3.4. Optimization Procedure
This section presents an optimization framework employing both grid search and genetic algorithm techniques to identify the optimal fiber orientations for laminated composite plates. The objective is to perform one-, two-, and three-parameter optimization of the ply angles in the composite layers. This process integrates MATLAB (version 2024 b) and Abaqus (version 2024), enabling automated design iterations where MATLAB controls the optimization algorithm and Abaqus performs the finite element simulations to evaluate structural performance. The optimization is conducted using an exhaustive search method within the defined design space, complemented by a genetic algorithm to efficiently explore and refine candidate solutions. The objective function value, representing the maximum stress within the composite plate, is obtained from Abaqus simulations and minimized through iterative parameter adjustments by the optimization algorithm. Initially, the search method with a fixed step size is employed to identify a promising region containing the minimum. Subsequently, the genetic algorithm refines the search within this region to locate the global minimum more efficiently. The genetic algorithm is implemented in MATLAB and interfaced with Abaqus, allowing for automated iterations where MATLAB updates design variables and Abaqus performs finite element analyses to evaluate each candidate solution. Abaqus simulations are performed for each population in the generation, with corresponding fitness values evaluated based on the defined objective function until the convergence criteria or desired accuracy is achieved. The initial parameter value is randomly selected within predefined bounds, after which the genetic algorithm iteratively assigns and evolves parameter values for candidate solutions based on selection, crossover, and mutation operations. Upon receiving the simulation results from Abaqus, the genetic algorithm evaluates the fitness of each solution, updates the parameter set accordingly, and iteratively repeats the optimization cycle until convergence criteria are met and the optimal solution is obtained. The complete sequence of steps involved in the optimization process is illustrated in Figure 10.
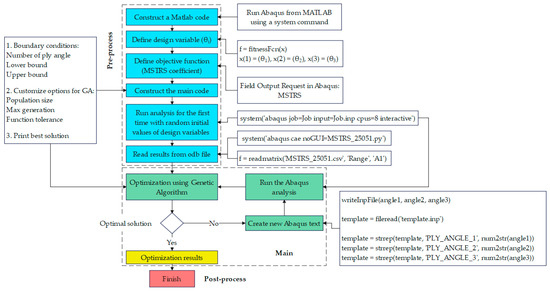
Figure 10.
Flowchart of the optimization procedure.
3.5. Verification Procedure
Since the optimization was conducted on a simplified 2D model of the composite plate, it is essential to verify the obtained optimal solution using a corresponding 3D model. However, due to the lack of native support for composite failure criteria in 3D continuum elements within the simulation software, a user-defined material subroutine (VUMAT) was developed to incorporate the Hashin failure criteria. This implementation allows accurate evaluation of the progressive failure mechanisms in the composite laminates during impact loading, thereby ensuring reliable validation of the optimization results. To implement the Hashin failure criteria, a user-defined material model was developed using the VUMAT subroutine, written in Fortran [59], based on the guidelines provided in the Abaqus User Subroutine Reference Manual [60]. The algorithmic procedure for the application of the Hashin failure criteria through the VUMAT subroutine is illustrated in Figure 11.
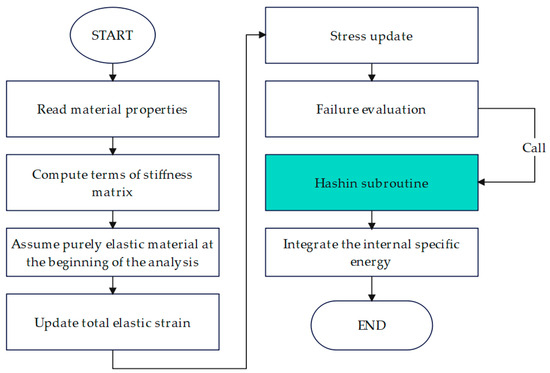
Figure 11.
Algorithm, VUMAT subroutine.
According to Hashin criteria, material damage is considered to be initiated when the damage index exceeds one, indicating that the failure criterion has been met and the material’s integrity is compromised. Under this assumption, the optimization results obtained from the model discretized with 2D shell elements are validated by implementing an external subroutine-based failure evaluation within the model, discretized with 3D solid elements.
4. Results and Discussion
4.1. One-Parameter Optimization
The results of one-parameter optimization are presented in Table 4. The optimization parameter is the fiber angle in the last layer (opposite side of impact) of the composite, θ3, and the objective function is the maximum stress coefficient (MSTRS). The fiber orientations of the first and second layers are fixed at θ1 = 45° and θ2 = −45°, respectively. The results were obtained using Abaqus software, through a discrete search with the grid search method, and with a continuous search using the genetic algorithm. The comparison of the methods’ results is shown in Table 4.

Table 4.
Comparison of one-parameter optimization results.
Figure 12 shows the search curve based on the simulation results. The search was conducted with a step of Δθ = 1° within a range of 0 to 179°. A total of 180 simulations were performed. The results are shown for the element on plate 25,051 which is in direct contact with the impactor and located at a point (Section Point 1) on the opposite side of the impact. In each simulation, the moment when the highest value of the MSTRS coefficient was identified is noted. The genetic algorithm performed a continuous search of the minimum area from 0 to 10°. The graph shows the best results of the search method (red dot) and the genetic algorithm search (blue dot), which are also displayed in Table 4. The results are similar, indicating that in this case, the genetic algorithm confirmed the results of the initial search. Analysis of the results indicates that the objective function of the best solution exceeds the allowable limit (greater than one).
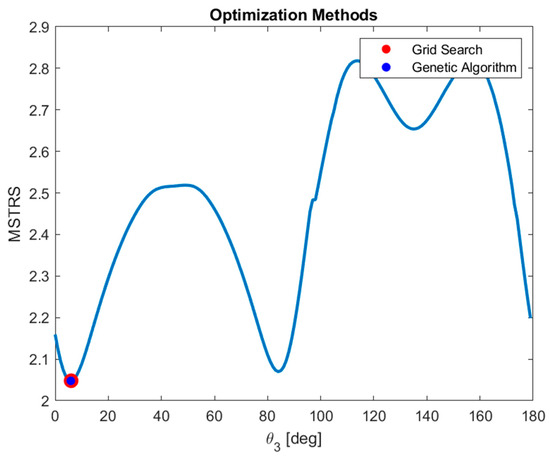
Figure 12.
Maximum stress coefficient for the one-parameter optimization case.
4.2. Two-Parameter Optimization
In the case of two-parameter optimization, the optimization parameters are the angles θ2 and θ3, which are the orientation angles of the fibers in the second (middle) and third (farthest from impact) layers. The fiber orientation of the first composite layer is fixed at θ1 = 45°. The same element, 25,051, is observed and the valid result in the simulation occurs when the MSTRS coefficient reaches its highest value. A discrete-space search was conducted in the area 0 ÷ 170° x0 ÷ 170° with a step Δθ of 10°. The total number of simulations was 324 (182).
A genetic algorithm was used to continuously search for the area of the minimum, which was defined as θ2 = [60, 80], θ3 = [−10, 10]. Figure 13 shows the results of the two-dimensional space search with the values of the maximum stress coefficient. The best search result is shown with a red dot, while the best genetic algorithm result is shown with a blue dot. The results are also given in Table 5. It can be concluded that genetic algorithm improves the solution of the grid search in the case of a two-dimensional search. Moreover, while the results exhibit a notable improvement over the single-parameter optimization, the objective function still exceeds the allowable limit (greater than one).
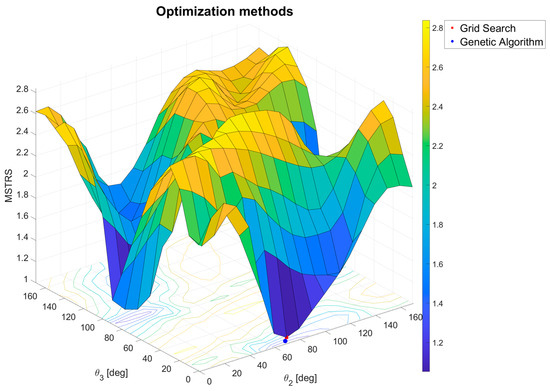
Figure 13.
Maximum stress coefficient for the two-parameter optimization case.

Table 5.
Comparison of two-parameter optimization results.
4.3. Three-Parameter Optimization
A discrete search of three-dimensional space [0, 165] × [0, 165] × [0, 165] with step Δθ = 15° was performed. The total number of simulations conducted was 1728 (123). A genetic algorithm was used to continuously search for the area of the minimum, which is constrained by θ1 = [120, 150], θ2 = [90, 120], and θ3 = [−15, 15]. The number of populations in the genetic algorithm was 50, while the maximum number of generations was 100, with a tolerance of 10−4. The results are shown in Table 6.

Table 6.
Comparison of three-parameter optimization results.
Three-parameter optimization of all three ply angles of the composite plate produced an acceptable solution for the objective function (less than one), suitable for practical application.
4.4. Comparison of Results by Optimization Order
Table 7 and Table 8 summarize the best optimization results for one, two, and all three optimization parameters, obtained using a discrete-step search and a continuous search with a genetic algorithm. It can be concluded that increasing the number of optimization parameters yields better results, as expected, but this also increases the demands on computational time and memory resources, as shown in Table 7. All simulations were performed using a standard workstation, with parallel processing enabled to enhance computational efficiency. This configuration ensured stable performance and acceptable computation times during the dynamic explicit analyses.

Table 7.
Grid search results and resources vs. optimization complexity.

Table 8.
Genetic algorithm results vs. optimization complexity.
In the case of the genetic algorithm, because the search area was smaller compared to the first method, fewer simulations were needed, which reduced the overall time. Additionally, an advantage of the genetic algorithm in this research is that it was not necessary to save data from each simulation as only the best result is displayed at the end.
The convergence behavior of the genetic algorithm during optimization with one, two, and three design parameters is shown in Figure 14. The convergence rate of the fitness function is plotted against the number of generations, providing insight into the algorithm’s efficiency and stability. The comparison among the three cases shows that the convergence trend becomes smoother and slower as the number of optimization parameters increases, which is expected due to the expanded search space and higher computational complexity.
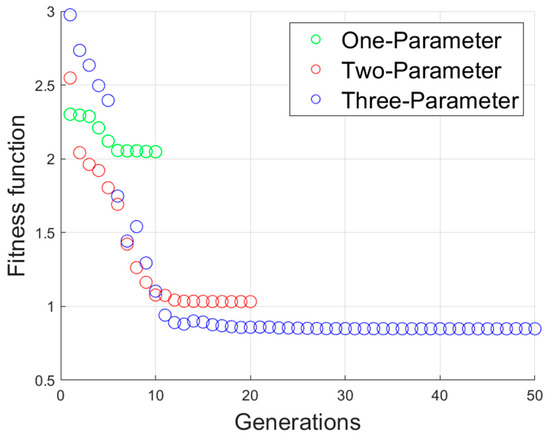
Figure 14.
Convergence of the genetic algorithm for optimization cases with one, two, and three design parameters.
Then, a sensitivity analysis of the genetic algorithm optimization parameters for the selected case was performed. The effect of the population size was investigated, and after testing population sizes 20, 50, and 100, finally, a population size of 50 was used. For mutation rate, values of 0.01, 0.05, and 0.1 were considered, and the middle value was adopted. The maximum number of generations was limited to 100, which was enough to successfully finalize optimization in all three cases. The combination of selected population size, mutation rate, and maximum number of generations provided good convergence behavior and solution quality. The analysis provided insights into the robustness of the genetic algorithm and verified optimal parameter settings for efficient and reliable optimization.
4.5. Results of Finite Element Analysis
4.5.1. FE Simulation of a Plate Discretized with Shell Elements
The simulation was conducted as a dynamic analysis using the explicit solver and covers a total period of t = 2 × 10⁻⁴ s. The solver employed an automatic time-stepping scheme to ensure the stability of the explicit integration, resulting in 20,646 integration steps. The results demonstrate the response of the composite plate under impact loading. To present the findings, Figure 15 shows the distribution of the maximum stress criterion (MSTRS). Specifically, Figure 15a illustrates the stress contours on the top surface of the first ply, while Figure 15b presents the corresponding stress distribution on the bottom surface of the final ply at t = 6.6 × 10⁻⁵ s. The laminate configuration used in this analysis corresponds to a 133/105.7963/–0.42° stacking sequence.
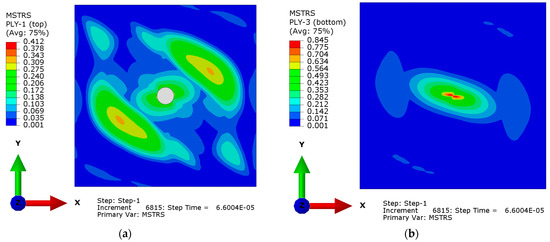
Figure 15.
Contour plots for the 133/105.7963/−0.42° composite plate at time t = 6.6 × 10⁻⁵ s (a) MSTRS ply 1 top surface; (b) MSTRS ply 3 bottom surface.
Based on the maximum stress criterion, the objective function reaches its minimum at the obtained optimal fiber orientations, indicating that the composite plate exhibits the highest resistance under these conditions.
4.5.2. FE Simulation of a Plate Discretized with Solid Elements
Verification of the results was conducted using a three-dimensional model of the composite plate discretized with solid elements. The 3D model provides detailed insight into the stress distribution during the impact event, allowing for evaluation and tracking of actual damage progression within the structure. The simulation was performed as a dynamic explicit analysis over a total duration of 3 × 10⁻⁴ s, using 150,000 integration steps. The simulation demonstrated that the observed increase in maximum stresses results from the transfer of energy from the impactor to the composite plate. The reduction in the impactor’s kinetic energy during interaction with the target is shown in Figure 16.
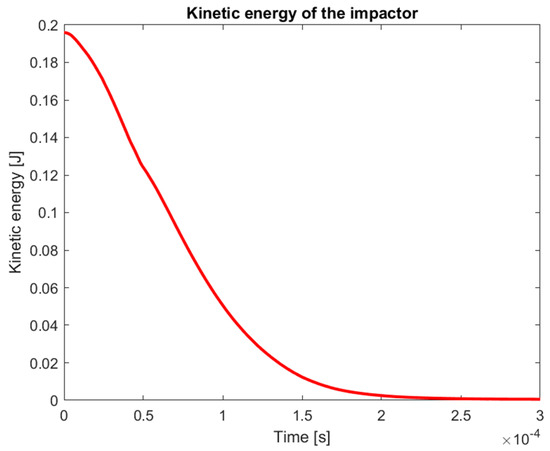
Figure 16.
Kinetic energy of the impactor.
Using Equation (29), the initial value of the impactor’s kinetic energy was calculated, where the mass of the impactor is 8 g and the speed is 25 km/h. The obtained value corresponds precisely to the initial kinetic energy computed by the simulation software, as depicted in Figure 16.
The visualization of the results indicated that the specified stress levels were insufficient to cause damage to the plate, as no crack formation was observed, Figure 17.
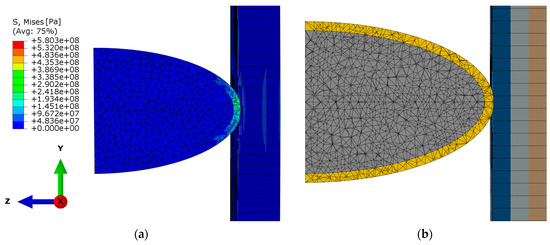
Figure 17.
Impactor penetration increment: 150,000, step time 3 × 10⁻⁴ s (a) Von Mises stress; (b) composite layup.
Failure coefficients were simultaneously recorded in a separate text file during the simulation. These values are presented in Figure 18, where the ordinate represents the failure coefficient values and the abscissa shows the corresponding number of data points. The dataset comprises 10,000,000 recorded values obtained over an impact simulation. Based on the analysis of the results shown in Figure 18, it is concluded that no damage occurs in the composite plate, as all damage indices are below one.
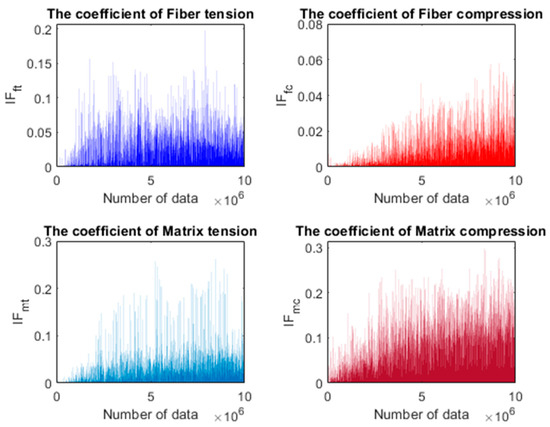
Figure 18.
Results of Hashin failure indices.
5. Conclusions
In this study, the optimal choice of composite plate was determined based on the impact load. The impactor model, with a specified kinetic energy, was represented using the Johnson–Cook plasticity model combined with a material damage law. This approach proved effective for accurately simulating the impact of a deformable impactor on the target. The initial setup of the composite plate involved defining its geometry, the number of layers, their thicknesses, and the constituent materials. These parameters were kept fixed, while optimization was performed for the fiber orientations within the layers. The material selection was based on Kevlar 49, owing to its high energy-absorption capability and resistance to impact loads.
Optimization was carried out using both the grid search method and a genetic algorithm based on the maximum stress criterion. Each method provided acceptable solutions, each with specific advantages, while combining the two approaches yielded more accurate results. The success of the optimization was evaluated based on the condition of the composite plate after impact, which remained undamaged. This finding was validated through a three-dimensional simulation of the optimal solution, conducted according to the Hashin criterion, which confirmed the absence of penetration.
This study represents the authors’ initial step toward developing suitable approaches for optimizing composite material structures subjected to impact loading. The present work is limited to low-speed impact, ensuring the design of a composite plate that can withstand the specified impact without damage. Additional constraints include the use of a relatively simple structural geometry, a limited number of layers with constant thicknesses and a predefined material system. A further limitation of the study lies in the definition of general contact, which was modeled using a surface-to-surface formulation with a linear geometric approximation. The normal contact behavior was modeled as hard contact, while the tangential behavior was assumed to be frictionless. The two-dimensional discretized mesh model employed for the optimization was assigned only elastic properties to enable monitoring of the objective function parameters. However, this approach allows tracking only up to the onset of damage, which is insufficient to capture the model’s final failure state. Future research will address these limitations by considering more complex geometries, variable lay-up configurations, and a broader range of materials. It will also incorporate experimental verification. Expanding the set of optimization parameters will inevitably increase the numerical effort required, making computational efficiency and solution accuracy even more critical. Hence, future work will also investigate the application of advanced metaheuristic optimization methods and their tuning with the aim of improved computational efficiency and solution accuracy.
Author Contributions
Conceptualization, J.T., Ž.Ć. and D.M.; methodology, J.T., Ž.Ć. and D.M.; software, J.T. and D.M.; validation, J.T., Ž.Ć. and D.M.; formal analysis, J.T. and D.M.; investigation, J.T. and D.M.; resources, J.T. and Ž.Ć.; data curation, J.T. and D.M.; writing—original draft preparation, J.T. and D.M.; writing—review and editing, J.T., Ž.Ć. and D.M.; visualization, J.T. and Ž.Ć.; supervision, D.M.; project administration, D.M.; funding acquisition, D.M. All authors have read and agreed to the published version of the manuscript.
Funding
This research received no external funding.
Institutional Review Board Statement
Not applicable.
Informed Consent Statement
Not applicable.
Data Availability Statement
The data presented in this study are available on request from the corresponding author.
Conflicts of Interest
The authors declare no conflicts of interest.
References
- Huang, X.; Su, S.; Xu, Z.; Miao, Q.; Li, W.; Wang, L. Advanced Composite Materials for Structure Strengthening and Resilience Improvement. Buildings 2023, 13, 2406. [Google Scholar] [CrossRef]
- Gheorghe, V.; Scutaru, M.L.; Ungureanu, V.B.; Chircan, E.; Ulea, M. New Design of Composite Structures Used in Automotive Engineering. Symmetry 2021, 13, 383. [Google Scholar] [CrossRef]
- Vlase, S.; Gheorghe, V.; Marin, M.; Öchsner, A. Study of structures made of composite materials used in automotive industry. Proc. Inst. Mech. Eng. Part L J. Mater. Des. Appl. 2021, 235, 2574–2587. [Google Scholar] [CrossRef]
- Georgantzinos, S.K.; Giannopoulos, G.I.; Stamoulis, K.; Markolefas, S. Composites in Aerospace and Mechanical Engineering. Materials 2023, 16, 7230. [Google Scholar] [CrossRef] [PubMed]
- Özel, M.A.; Kopmaz, O. Design of a Periodic Structure for Composite Helicopter Rotor Blade. Int. J. Simul. Model. 2024, 23, 447–458. [Google Scholar] [CrossRef]
- Lin, Y.; Qian, W.; Lei, L.; Liu, Y.; Zhang, J.; Liu, J.; Kong, W.; Hu, Y.; Shi, Y.; Wu, Z.; et al. Structural integrity issues of composite materials and structures in future transportation equipment. Compos. Struct. 2025, 358, 118943. [Google Scholar] [CrossRef]
- Chauhan, V.; Kärki, T.; Varis, J. Review of natural fiber-reinforced engineering plastic composites, their applications in the transportation sector and processing techniques. J. Thermoplast. Compos. Mater. 2019, 35, 1169–1209. [Google Scholar] [CrossRef]
- Faheed, N.K. Advantages of natural fiber composites for biomedical applications: A review of recent advances. Emergent Mater. 2024, 7, 63–75. [Google Scholar] [CrossRef]
- Kim, C.; Lee, S.; Rhee, K.Y.; Park, S. Carbon-based composites in biomedical applications: A comprehensive review of properties, applications, and future direction. Adv. Compos. Hybrid Mater. 2024, 7, 55. [Google Scholar] [CrossRef]
- Mahmoud, M.; Eladawy, M.; Ibrahim, B.; Benmokrane, B. Interface Shear Capacity of Basalt FRP-Reinforced Composite Precast Concrete Girders Supporting Cast-in-Place Bridge-Deck Slabs. J. Bridge Eng. 2024, 29, 04024091. [Google Scholar] [CrossRef]
- Monfared, M.; Ramakrishna, S.; Alizadeh, A.; Hekmatifar, M. A systematic study on composite materials in civil engineering. Ain Shams Eng. J. 2023, 14, 102251. [Google Scholar] [CrossRef]
- Devarajan, B.; Lakshminarasimhan, R.; Murugan, A.; Rangappa, S.M.; Siengchin, S.; Marinkovic, D. Recent developments in natural fiber hybrid composites for ballistic applications: A comprehensive review of mechanisms and failure criteria. Facta Univ. Ser. Mech. Eng. 2024, 22, 343–383. [Google Scholar] [CrossRef]
- Ma, D.; Scazzosi, R.; Manes, A. Modeling approaches for ballistic simulations of composite materials: Analitical modes vs. finite element method. Compos. Sci. Technol. 2024, 248, 110461. [Google Scholar] [CrossRef]
- Milić, P.; Marinković, D.; Klinge, S.; Ćojbašić, Ž. Reissner-Mindlin Based Isogeometric Finite Element Formulation for Piezoelectric Active Laminated Shells. Teh. Vjesn. 2023, 34, 416–425. [Google Scholar]
- Rama, G.; Marinković, D.; Zehn, M. Efficient three-node finite shell element for linear and geometrically nonlinear analyses of piezoelectric laminated structures. J. Intell. Mater. Syst. Struct. 2018, 29, 345–357. [Google Scholar] [CrossRef]
- Manolis, G.D.; Dineva, P.S.; Rangelov, T.; Sfyris, D. Mechanical models and numerical simulations in nanomechanics: A review across the scales. Eng. Anal. Bound. Elem. 2021, 128, 149–170. [Google Scholar] [CrossRef]
- Safae, B.; Onyibo, E.C.; Hurdoganoglu, D. Thermal buckling and bending analyses of carbon foam beams sandwiched by composite faces under axial compression. Facta Univ. Ser. Mech. Eng. 2022, 20, 589–615. [Google Scholar] [CrossRef]
- Marinković, D.; Köppe, H.; Gabbert, U. Aspects of modeling piezoelectric active thin-walled structures. J. Intell. Mater. Syst. Struct. 2009, 20, 1835–1844. [Google Scholar] [CrossRef]
- Ramm, E. Form und Tragverhalten, Heinz Isler Schalen; Karl Krämer Verlag: Stuttgart, Germany, 1986. [Google Scholar]
- Park, G.; Kim, C. Composite Layer Design Using Classical Laminate Theory for High Pressure Hydrogen Vessel (Type 4). Int. J. Precis. Eng. Manuf. 2023, 23, 571–583. [Google Scholar] [CrossRef]
- Rama, G.; Marinkovic, D.; Zehn, M. High performance 3-node shell element for linear and geometrically nonlinear analysis of composite laminates. Compos. B Eng. 2018, 151, 118–126. [Google Scholar] [CrossRef]
- Nestorović, T.; Marinković, D.; Shabadi, S.; Trajkov, M. User defined finite element for modeling and analysis of active piezoelectric shell structures. Meccanica 2022, 49, 1763–1774. [Google Scholar] [CrossRef]
- Abtew, M.; Boussu, F.; Bruniaux, P.; Loghin, C.; Cristian, I. Ballistic impact mechanisms—A review on textiles and fibre-reinforced composites impact responses. Compos. Struct. 2019, 223, 110966. [Google Scholar] [CrossRef]
- Yang, Y.; Liu, Y.; Xue, S.; Sun, X. Multi-scale finite element modeling of ballistic impact onto woven fabric involving fiber bundles. Compos. Struct. 2021, 267, 113856. [Google Scholar] [CrossRef]
- Meliande, N.; Oliveira, M.; Pereira, A.; Balbino, F.; Figuiredo, A.; Monteiro, S.; Nascimento, L. Ballistic properties of curaua-aramid laminated hybrid composites for military helmet. J. Mater. Res. Technol. 2023, 25, 3943–3956. [Google Scholar] [CrossRef]
- Zachariah, A.S.; Shenoy, S.; Pai, D. Experimental Analysis of the Effect of the Wowen Aramid Fabric on the Strain to Failure Behavior of Plain Weaved Carbon/Aramid Hybrid Laminates. Facta Univ. Ser. Mech. Eng. 2024, 22, 13–24. [Google Scholar]
- Zochowski, P.; Bajkowski, M.; Grygoruk, R.; Magier, M.; Burian, W.; Pyka, D.; Bocian, M.; Jamroziak, K. Finite element modeling of ballistic inserts containing aramid fabrics under projectile impact conditions—Comparison of methods. Compos. Struct. 2022, 294, 115752. [Google Scholar] [CrossRef]
- Bajya, M.; Majumdar, A.; Butola, B.; Verma, S.; Bhattacharjee, D. Design strategy for optimizing weight and ballistic performance of soft body armour reinforced with shear thickening fluid. Compos. Part B Eng. 2020, 183, 107721. [Google Scholar] [CrossRef]
- Zhang, C.; Zhu, Q.; Wang, Y.; Ma, P. Finite Element Simulation of Tensile Preload Effects on High Velocity Impact Behavior of Fiber Metal Laminates. Appl. Compos. Mater. 2020, 27, 251–268. [Google Scholar] [CrossRef]
- Gregori, D.; Scazzosi, R.; Nunes, S.; Amico, C.; Giglio, M.; Manes, A. Analitical and Numerical modelling of high-velocity impact on multilayer alumina/aramid fiber composite ballistic shields: Improcement in modelling approaches. Compos. Part B Eng. 2020, 187, 107830. [Google Scholar] [CrossRef]
- Ranaweera, P.; Rambach, M.; Weerasinghe, D.; Mohotti, D. Ballistic impact response of monolithic steel and tri-metallic steel-titanium-aluminium armour to nonrigid NATO FMJ M80 projectiles. Thin-Walled Struct. 2023, 182, 110200. [Google Scholar] [CrossRef]
- Gour, G.; Idapalapati, S.; Goh, W.; Shi, X. Equivalent protection factor of bi layer ceramic metal structures. Def. Technol. 2022, 18, 384–400. [Google Scholar] [CrossRef]
- Biswas, K.; Datta, D. Numerical simulation of ballistic impact on multilayer ceramic backed fibre reinforced composite target plate. Proc. Inst. Mech. Eng. Part L J. Mater. Des. Appl. 2022, 236, 1527–1540. [Google Scholar] [CrossRef]
- Ansari, A.; Akbari, T.; Pishbijari, M. Investigation on the ballistic performance of the aluminum matrix composite armor with ceramic balls reinforcement under high velocity impact. Def. Technol. 2023, 29, 134–152. [Google Scholar] [CrossRef]
- Akabi, T.; Ansari, A.; Pishbijari, M. Influence of aluminium alloys on protection performance of metal matrix composite armor reinforced with ceramic particles under ballistic impact. Ceram. Int. 2023, 49, 30937–30950. [Google Scholar]
- Batra, R.; Pydah, A. Impact analysis of PEEK/ceramic/gelatin composite for finding behind armor trauma. Compos. Struct. 2020, 237, 111863. [Google Scholar] [CrossRef]
- Guo, G.; Alam, S.; Peel, L. An investigation of the effect of a Kevlar-29 composite cover layer on the penetration behavior of a ceramic armor system against 7.62mm APM2 projectiles. Int. J. Impact Eng. 2021, 157, 104000. [Google Scholar] [CrossRef]
- Osnes, K.; Kristian, J.; Grue, T.; Borvik, T. Experimental tests and numerical simulations of ballistic impact on laminated glass. EPJ Web Conf. 2021, 250, 02022. [Google Scholar] [CrossRef]
- Cui, T.; Zhang, J.; Li, K.; Peng, J.; Chen, H.; Qin, Q.; Poh, L. Ballistic Limit of Sandwich Plates with a Metal Foam Core. J. Appl. Mech. 2022, 89, 021006. [Google Scholar] [CrossRef]
- Beppu, M.; Kataoka, S.; Ichino, H.; Musha, H. Failure characteristics of UHPFRC panels subjected to projectile impact. Compos. Part B Eng. 2020, 182, 107505. [Google Scholar] [CrossRef]
- Ji, H.; Wang, X.; Tang, N.; Li, B.; Li, Z.; Geng, X.; Wang, P.; Zhang, R.; Lu, T. Ballistic perforation of aramid laminates: Projectile nose shape sensitivity. Compos. Struct. 2024, 330, 117807. [Google Scholar] [CrossRef]
- Kumar, M.; Bharadwaj, M. Numerical Simulation of ballistic impact response on composite materials for different shape of projectiles. Sādhanā 2022, 47, 145. [Google Scholar] [CrossRef]
- Titire, L.; Muntenita, C. Ballistic Impact Study of an Aramid Fabric by Changing the Projectile Trajectory. Fibers 2025, 13, 8. [Google Scholar] [CrossRef]
- Sun, Z.; Zeng, Z.; Li, J.; Zhang, X. An immersed multi-material arbitrary Lagrangian-Eulerian finite element method for fluid-structure-interaction problems. Comput. Methods Appl. Mech. Eng. 2024, 432, 117398. [Google Scholar] [CrossRef]
- Shuang, L. The Maximum Stress Failure Criterion and the Maximum Strain Failure Criterion: Their Unification and Rationalization. J. Compos. Sci. 2020, 4, 157. [Google Scholar] [CrossRef]
- Mario, R.A.; Lorenco, A.F.; Luis, C.; Joao, R.C. Tsai-Wu based Orthotropic Damage Model. Compos. Part C Open Access 2021, 4, 100122. [Google Scholar]
- Tan, B.; Zheng, J.; Xu, J.; Jia, Y.; Li, H. Rate dependent Tsai Hill strength criterion for short fiber reinforced EPDM film in tensile failure process. Acta Mater. Compos. Sin. 2018, 35, 1646–1651. [Google Scholar]
- Jaroslaw, G.; Andrzej, T. Experimental-numerical studies on the first-ply failure analysis of real, thin walled laminated angle columns subjected to uniform shortening. Compos. Struct. 2021, 269, 114046. [Google Scholar]
- Fouzia, L.C.; Mohamed, M.M.; Habib, B. Using a Hashin Criteria to predict the Damage of composite notched plate under traction and torsion behavior. Fract. Struct. Integr. 2019, 13, 331–341. [Google Scholar]
- Nael, M.A.; Dikin, D.A.; Admassu, N.; Elfishi, O.B.; Percec, S. Damage Resistance of Kevlar® Fabric, UHMWPE, PVB Multilayers Subjected to Concentrated Drop-Weight Impact. Polymers 2024, 16, 1693. [Google Scholar] [CrossRef]
- Memarzadeh, A.; Onyibo, C.E.; Asmael, M.; Safaei, B. Dynamic Effect of Ply Angle and Fiber Orientation on Composite Plates. Spectr. Mech. Eng. Oper. Res. 2024, 1, 90–110. [Google Scholar] [CrossRef]
- Abaqus Analysis User’s Manual, Materials; Dassault Systèmes Simulia Corp.: Johnston, RI, USA, 2010.
- Barbero, E. Strength. In Introduction to Composite Materials Design, 2nd ed.; Barbero, E., Ed.; CRC Press: Boca Raton, FL, USA, 2018; pp. 227–278. [Google Scholar]
- Barbero, E. Elasticity and Strength of Laminates. In Finite Element Analysis of Composite Materials Using Abaqus; Barbero, E., Ed.; CRC Press: Boca Raton, FL, USA, 2013; pp. 91–173. [Google Scholar]
- Isaac, D.; Ori, I. Elastic Behavior of Multidirectional Laminates. In Engineering Mechanics of Composite Materials, 2nd ed.; Isaac, D., Ori, I., Eds.; Oxford University Press: New York, NY, USA, 2006; pp. 158–165. [Google Scholar]
- Singiresu, R. Nonlinear Programming II: Unconstrained Optimization Techniques. In Engineering Optimization Theory and Practice, 3rd ed.; Singiresu, R., Ed.; Wiley: New York, NY, USA, 1996; pp. 333–415. [Google Scholar]
- Ghasemi, J.M.; Najafi, S.E.; Fallah, M.; Nabatchian, M.R. A fuzzy chance-constrained programming model for mathematical modeling-based metaheuristic algorithms in the design of green loop supply chain networks for power plants. Eng. Rev. 2024, 44, 91–121. [Google Scholar] [CrossRef]
- Zhang, L.; Qiu, S. Optimization and Optimization Design of Gear Modification for Vibration Reduction Based on Genetic Algorithm. Tech. Gaz. 2024, 31, 1614–1623. [Google Scholar]
- Nyhoff, L.; Lesstma, S. Fortran 77 and Numerical Methods for Engineers and Scientists; A Simon & Schuster Company: Riverside, NJ, USA, 1995. [Google Scholar]
- Abaqus User Subroutines Reference Manual; Dassault Systèmes Simulia Corp.: Johnston, RI, USA, 2010.
Disclaimer/Publisher’s Note: The statements, opinions and data contained in all publications are solely those of the individual author(s) and contributor(s) and not of MDPI and/or the editor(s). MDPI and/or the editor(s) disclaim responsibility for any injury to people or property resulting from any ideas, methods, instructions or products referred to in the content. |
© 2025 by the authors. Licensee MDPI, Basel, Switzerland. This article is an open access article distributed under the terms and conditions of the Creative Commons Attribution (CC BY) license (https://creativecommons.org/licenses/by/4.0/).