Abstract
The high carbon emissions associated with cement-based materials in lightweight foamed soils have become a significant environmental concern. In addition to this applied problem, there is also a scientific challenge: current studies of carbon–magnesium reactions in lightweight carbonated soils (LCSS) lack multiparameter predictive models, which are essential for understanding the coupled effects of MgO dosage and CO2 foam content on material performance. This study addresses this gap by systematically investigating the influence of MgO and CO2 foam on the strength, resistivity, and carbonation behavior of LCSS. A multiparameter regression model was developed to predict these properties, and its statistical significance and predictive accuracy were verified. The results show that MgO dosage strongly promotes carbonation and strength development, while CO2 foam content primarily regulates porosity and carbonation degree. The established model provides reliable predictions of LCSS performance and offers a scientific basis for optimizing carbon–magnesium reactions in sustainable soil stabilization.
1. Introduction
Traditional foamed lightweight soil is a lightweight construction material made by mixing cement, water, and air bubbles in specific proportions. It offers adjustable density and strength, self-leveling properties, thermal insulation, and ease of construction [1,2,3]. This material is widely used in road engineering and backfilling behind bridge abutments [4,5,6]. Since its introduction to China in 2002 [7], foamed lightweight soil has achieved significant promotion and application in infrastructure construction. However, foamed lightweight soil still primarily uses Portland cement as the main binder. The cement production process involves substantial energy consumption and CO2 emissions, releasing approximately 0.95 tons of CO2 per ton of cement produced [8], making it a major source of carbon emissions.
With the accelerating industrialization, global fossil fuel consumption has continuously increased, leading to a significant rise in atmospheric CO2 concentration, which has become a primary driver of global warming [9,10]. By 2025, the atmospheric CO2 concentration will have reached 426.26 ppm, representing an approximately 25.8% increase compared to 1980 [11,12]. To address the climate crisis, the international community has reached a consensus on controlling greenhouse gas emissions. China is actively advancing its strategic goals of “carbon peaking” and “carbon neutrality” [13].
Among various emission reduction strategies, the technology of carbon capture, utilization, and storage (CCUS) is widely recognized as an effective approach to control CO2 emissions [14]. Post-combustion capture, in particular, is extensively applied due to its high technological maturity and strong industrial adaptability [15,16]. Solid adsorbents, as novel CO2 capture materials, have gradually replaced traditional liquid absorption methods due to advantages such as ease of operation, wide temperature tolerance, and low corrosiveness [17,18]. MgO has emerged as a promising and efficient adsorbent due to its low toxicity, low energy consumption, low cost, and ability to react with acidic CO2 to form stable carbonates. Its theoretical adsorption capacity can reach up to 24.8 mmol/g [19,20,21,22].
Benefiting from its excellent carbon adsorption properties, MgO has been widely applied as a key component in green solidification materials for civil engineering. MgO-based solidifiers can partially replace high-carbon-emission cement and offer advantages such as low calcination temperature (<900 °C), strong CO2 reactivity, and compatibility with various industrial wastes, aligning with the development of low-carbon construction materials [23,24,25,26]. Yi [27] conducted preliminary experimental studies on MgO-carbonated solidified silty and sandy soils, confirming the superior performance of MgO in soft soil stabilization. Cai et al. [28] investigated the influence of MgO dosage on the carbonation solidification of silty clay, finding that higher MgO dosage led to more pronounced carbonation strengthening effects. Liu et al. [29] studied the effects of varying moisture content and carbonation duration on MgO-carbonated silty clay. They proposed a microscopic carbonation reaction model and identified that the highest strength was achieved at 6 h of carbonation. To further improve the material performance, reactive MgO is often combined with supplementary cementitious materials such as ground granulated blast furnace slag (GGBS) to form a more reactive low-carbon binder system. Studies indicate that products such as hydrotalcite in the GGBS–MgO composite system significantly enhance pore structure and strength [27,30]. Carbonation products, primarily magnesium carbonates, simultaneously improve mechanical properties and enable CO2 sequestration [31]. Therefore, MgO-based materials possess not only excellent mechanical strength and stability but also significant potential for carbon emission reduction. Recent research has revealed the potential of MgO in cementitious systems to capture and mineralize CO2 into stable carbonate phases. For instance, Haque et al. [32] provided a comprehensive review on magnesium cements and their carbonation curing, highlighting the interdependence of MgO dosage, CO2 curing conditions, microstructure, and strength. Gao et al. [33] further demonstrated that Mg(OH)2 carbonation is strongly dependent on reaction time, temperature, and solvent environment, producing various hydrated magnesium carbonates such as hydromagnesite and nesquehonite. Similarly, surface functionalization of MgO has been shown to accelerate carbonation kinetics and alter phase morphology [34]. In addition, Zhou et al. [35] reported the synergistic role of MgO in partially calcined limestone systems, where even modest MgO additions significantly improved carbonation and microstructural densification. These findings confirm that MgO dosage plays a crucial role in controlling carbonation pathways. Alongside Mg-based carbonation, several studies have investigated the performance of magnesium-rich binders under different curing environments. Liu G et al. [36] studied carbonated magnesium slag mortars and demonstrated that hydraulic admixtures strongly influence carbonation depth and strength. Other recent works have emphasized the durability and stability of Mg-based cementitious materials under aggressive environments, such as sulfate attack and wet–dry cycles [37]. The mechanisms of alkali activation in magnesium slag carbonization have also been reported, providing new insights into multi-process interactions [38]. These studies underscore the complex interplay between MgO, hydration, carbonation, and durability-related properties.
The carbonation process involves internal moisture migration, pore structure evolution, and carbonate formation within the material. These microstructural changes significantly affect the macroscopic mechanical properties. Additionally, these reactions alter the material’s electrical properties. Electrical resistivity, a physical parameter highly sensitive to moisture content and pore structure, effectively reflects the internal hydration or carbonation processes and has been widely used to monitor the performance of cemented soils and related materials. Liu et al. [39,40] investigated the effects of moisture content, saturation degree, water-to-cement ratio, and curing age on the resistivity of cemented soils. An empirical relationship between resistivity and unconfined compressive strength has been established and successfully applied to assess the quality of cement mixing piles. Miao et al. [41] experimentally studied the relationships among resistivity, curing age, unconfined compressive strength, and cement content in cemented soils. The engineering applications of resistivity have been explored, e.g., for quality control of cement soil jet grouting piles. Liu et al. [42] examined the resistivity characteristics of soils and developed a regional resistivity model for clayey soils.
Although numerous studies have focused on the strength enhancement and microstructural evolution of MgO-based carbonation solidification materials, systematic research on their carbon sequestration efficiency remains relatively scarce. Most work emphasizes reaction mechanisms and strength development, while quantitative analysis of carbon absorption capacity and its influencing factors is still insufficient. Carbon sequestration efficiency directly impacts the environmental benefits of the material and the achievement of the “dual carbon” goals, making its in-depth study of significant practical importance. In the context of MgO-based carbonation, the chemical reactions governing the process can be generally summarized as follows. First, MgO hydrates to form brucite (Mg(OH)2). Subsequently, under CO2 exposure, Mg(OH)2 and MgO react with CO2 to produce a variety of hydrated magnesium carbonates such as nesquehonite (MgCO3·3H2O), hydromagnesite (4MgCO3·Mg(OH)2·4H2O), and dypingite (4MgCO3·Mg(OH)2·5H2O). These carbonation reactions not only contribute to CO2 sequestration but also affect the microstructural development and strength of lightweight carbonation solidified slurry. Therefore, the degree of carbonation can be regarded as a key parameter linking the chemical reactions with the engineering performance of the material. Considerable progress has been made in understanding Mg-based carbonation; a major scientific gap remains. Most current studies focus on single-factor influences (e.g., MgO dosage, curing environment), whereas multiparameter predictive models that integrate MgO dosage, CO2 dosage, pore structure, and phase development are still lacking. Some efforts have been made in related fields, such as predictive modelling of foamed concrete using regression or machine learning approaches [43,44], and studies on foamed mortars showing the effect of carbonation on strength and durability [45]. Moreover, research on reactive MgO concretes demonstrated that additives such as NaHCO3 and NaCl can enhance carbonation reactivity [46]. However, these approaches seldom address carbon–magnesium reactions in lightweight carbonated soils, where both MgO dosage and CO2 foam content interact to determine the carbonation degree and engineering performance.
Moreover, the use of electrical resistivity as a non-destructive indicator for predicting the strength of MgO-based carbonation systems has not yet been systematically studied. Given that resistivity is highly sensitive to moisture content and reaction degree—both closely related to strength—developing a resistivity–strength predictive model holds promise for rapid material performance assessment and on-site quality control, thereby enhancing its feasibility and intelligence in engineering applications.
Therefore, from an applied perspective, the use of traditional cementitious binders in lightweight foamed soils leads to high carbon emissions and limits the environmental sustainability of ground improvement technologies. Replacing part of the cement with reactive MgO and utilizing CO2 foaming can significantly reduce emissions while improving strength and durability through in situ carbonation. From a scientific perspective the underlying mechanisms of carbon–magnesium reactions in lightweight carbonated soils remain insufficiently understood. In particular, the interactions among MgO dosage, CO2 foam content, and carbonation behavior have not been adequately modeled, and multiparameter predictive relationships for strength, resistivity, and carbonation degree are still lacking. Based on the above background, this study employs CO2 foam as a foaming agent combined with active MgO, GGBS, and calcium carbide residue (CCR) as primary raw materials. Using the optimal mix ratio and molding process proposed by Shao et al. [47], a low-carbon lightweight carbonation solidified slurry (LCSS) was prepared. The specific objectives of this research are as follows: (1) To investigate the effects of MgO dosage and CO2 foam content on the strength, resistivity, and carbonation behavior of lightweight carbonated soils. (2) To analyze the microstructural and thermogravimetric characteristics that reflect the influence of MgO and CO2 dosage on carbonation processes. (3) To establish a multiparameter regression model describing the relationships among MgO content, CO2 foam dosage, and mechanical and carbonation properties. (4) To evaluate the statistical significance and predictive accuracy of the developed model, thereby providing a quantitative framework for understanding carbon–magnesium reactions in LCSS. This study aims to bridge the gap between practical application and scientific understanding through systematic experimentation and model development, providing theoretical support and practical guidance for the design optimization and engineering application of green slurry treatment materials.
2. Experimental Materials and Methods
2.1. Experimental Materials
Waste Slurry:
The waste slurry used in this study was collected from the bored pile drilling slurry at a construction site in the Xian’an Camp, Xuhui District, Shanghai. The slurry exhibited a dark grayish-black color and had a high moisture content. Sampling, transportation, and storage were conducted using sealed containers to prevent moisture evaporation. Moisture content, pH, liquid-plastic limits, and specific gravity were measured according to the “Standard for Geotechnical Testing Methods” (GBT50123-2019) [48] and the “Test Procedures for Solidifying Slurry in Hydropower and Water Conservancy Projects” (DL/T5815-2020) [49]. The detailed physical properties are presented in Table 1. Particle size distribution was analyzed using a laser particle size analyzer, with results shown in Figure 1. As shown in the particle size distribution curve in Figure 1, the particle sizes of the waste slurry are mainly concentrated between 10 and 100 μm, indicating a relatively uniform size distribution.

Table 1.
Physico-chemical quality of waste slurry.
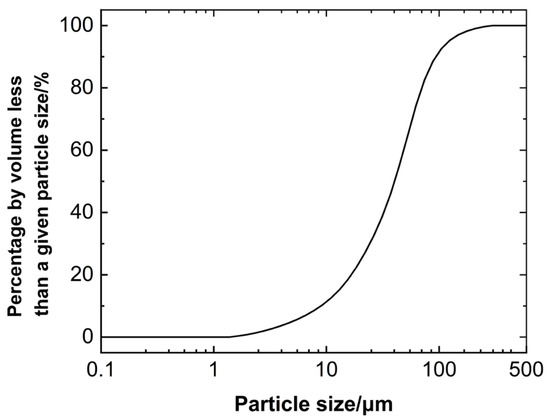
Figure 1.
Particle size distribution curve of the waste slurry.
It should be noted that the chemical composition of the waste slurry was not determined in this study due to experimental limitations. This is acknowledged as a limitation of the current work, and future studies will include detailed chemical composition analysis to provide a more comprehensive characterization.
MgO:
STARMAG150 reactive MgO was used in this study. It appears as a pure white, ultrafine powder with a bulk density of 0.48 g/cm3 and a MgO content as high as 98%. Its chemical composition and corresponding contents are presented in Table 2. The material exhibits excellent reactivity, which refers to its high purity and ultrafine particle size that enable rapid hydration to Mg(OH)2 and subsequent carbonation to magnesium carbonates. STARMAG150 has a high reactivity index (citric acid test: 150 s), confirming its suitability for carbonation-based stabilization applications.
Table 2.
Chemical composition of reactive MgO.
Calcium Carbide Residue (CCR):
A high-grade calcium carbide residue (CCR) powder was used in this study. The material is fine-textured, gray in color, and exhibits high reactivity. The particle size ranges from approximately 150 to 400 μm, and the bulk density is 1.5 g/cm3. The detailed chemical composition is presented in Table 3.
Table 3.
Chemical composition of CCR.
Ground Granulated Blast Furnace Slag (GGBS):
S95-grade ground granulated blast furnace slag (GGBS) was selected for this study. It has a bulk density of 2.8 g/cm3, a flowability index of 98%, a loss on ignition (LOI) of 0.84%, and a moisture content of 0.45%. The material appears grayish-white, and its detailed chemical composition is listed in Table 4.
Table 4.
Chemical composition of GGBS.
Anhydrous Calcium Sulfate, PAM, and CO2:
The anhydrous calcium sulfate used in this study was of analytical reagent (AR) grade. Detailed technical specifications are provided in Table 5.
Table 5.
Technical parameters for anhydrous calcium sulphate.
The anionic polyacrylamide (PAM) used in this study was of analytical reagent grade, with a PAM content of no less than 90% and a hydrolysis degree of 30%. It appears as a white crystalline solid, with a pH range of 5.0–7.0 and an anionicity of 1.2–1.6. The material exhibits excellent flocculation performance.
The CO2 gas used was food-grade with a high purity of up to 99%.
Foaming Agent:
Since LCSS is alkaline, using an acidic foaming agent would cause the generated CO2 foam to readily dissolve within the matrix, resulting in severe defoaming and collapse, which hinders strength development. Therefore, an alkaline foaming agent was selected. Although it readily reacts with CO2, its impact can be mitigated through pre-treatment. The CO2 foam produced with an alkaline foaming agent is largely insoluble in LCSS, thereby minimizing collapse and maintaining structural integrity. This choice has minimal adverse effects on strength while providing a high foaming ratio and good foam stability. When air was used as the foaming gas, the foam density was 40 kg/m3; when CO2 was used, the foam density was 80 kg/m3.
2.2. Research Program
Figure 2 illustrates the overall research framework of this study. Two variable parameters—MgO dosage and CO2 foam content—were designed to investigate their influence on the mechanical and carbonation properties of lightweight carbonated soil. The controlled factors included curing time, environmental conditions. The determined parameters consisted of compressive strength, resistivity, and carbonation degree (CO2wt) obtained through mechanical and thermal analyses. Based on the experimental data, multiparameter regression models were established to predict the key performance indicators, and their statistical reliability was validated.

Figure 2.
Research program and experimental framework.
2.3. Experimental Program
2.3.1. Sample Preparation Procedure
Based on the optimal mix proportions established in previous experiments by Shao et al. [47], the sample preparation procedure is illustrated in Figure 3. The detailed steps are described as follows:

Figure 3.
Schematic diagram of the specimen preparation process.
Preparation of mixed slurry: the waste slurry collected from the construction site was first pretreated by stirring and drying, then sealed in airtight containers for later use. Prior to testing, high-moisture-content slurry was prepared by adjusting the moisture content to 200% as designed. The curing agents were weighed based on the predetermined mix ratio. The powdered binders were thoroughly premixed and then gradually added into the prepared high-moisture slurry in two batches, each stirred for 3 min to ensure homogeneous mixing.
Preparation of CO2 foam: The foaming agent was diluted at a 1:40 ratio, and CO2 gas was introduced at a system pressure of 200 kPa. Once foaming stabilized, the inlet valve was closed, and the mixture was left undisturbed for 20 min to allow sufficient interaction between CO2 and the foaming agent. Throughout the process, system pressure was maintained; if a pressure drop occurred, the valve was reopened to restore pressure. After stable foaming was achieved, the foam was allowed to stand for 10 min to ensure uniformity and stability.
Slurry blending and casting: The stabilized foam was measured using a graduated cylinder according to the mix ratio and added to the pre-mixed slurry. The mixture was stirred for 1 min to ensure thorough incorporation of foam and initiation of carbonation. The resulting foamed slurry was then poured into molds in three stages. Given the self-compacting nature of foamed lightweight soils, only light tapping was required for uniform filling. The mold surfaces were then covered with transparent plastic film to minimize moisture loss.
Curing: The freshly casted specimens were placed in a standard curing chamber maintained at 20 ± 1 °C and 99% relative humidity. After 48 h of initial curing, the specimens were demolded and wrapped in plastic film to retain moisture. They were then returned to the curing chamber for continued standard curing until the designated testing age.
2.3.2. Experimental Design
In this study, the dosage of solid powders is expressed as a percentage of the total mass of the slurry, while the CO2 foam content is defined as the percentage of the total volume of the LCSS. The dosages of anhydrous calcium sulfate and PAM in all LCSS mixtures were fixed at 5% and 0.05%, respectively. The detailed experimental design schemes are presented in Table 6 and Table 7.
Table 6.
Experimental design for unconfined compressive strength, moisture content, electrical resistivity, and thermogravimetric analysis with varying MgO dosages.
Table 7.
Experimental design for unconfined compressive strength, moisture content, electrical resistivity, and thermogravimetric analysis with varying CO2 foam content.
2.4. Experimental Methods
The effects of MgO content and CO2 foam content on the 28-day unconfined compressive strength (UCS) and moisture content of LCSS were investigated through unconfined compression and moisture content tests. A predictive model for 28-day UCS was developed. Electrical resistivity tests were conducted to study the impact of MgO and CO2 foam dosage on the electrochemical properties of LCSS, and the relationship between these properties and UCS was analyzed. Thermogravimetric analysis (TGA) was performed to investigate the influence of MgO and CO2 foam dosage on the carbon sequestration capacity of LCSS. Compositional analysis was conducted, and a carbon sequestration prediction model was established. SEM was used to observe the microstructural morphology of LCSS after reaction.
2.4.1. Unconfined Compression Test
The unconfined compressive strength (UCS) tests were conducted following the “Highway Geotechnical Test Specifications” (JTG 3430-2020) [50]. Unconfined compression tests were performed on LCSS specimens sized as cylinders with a diameter of 50 mm and height of 100 mm. Testing was conducted using a microcomputer-controlled electronic universal testing machine (model WDW-300D, Jinan Chuanbai Instrument Equipment Co., Ltd., Jinan, China) at an axial loading rate of 1 mm/min.
2.4.2. Moisture Content Test
The moisture content test used samples taken from the failed specimens of the 28-day unconfined compressive strength tests. Approximately 20 g of the broken specimen was collected, crushed, and passed through a 2 mm sieve. The mass was weighed and recorded. Testing was conducted within 5 min after the UCS test to prevent moisture evaporation and ensure data accuracy. The sample was placed in an aluminum container and dried in an oven at 40 °C. Since temperatures above 50 °C may cause dehydration of hydromagnesite (Mg3(CO3)4·3H2O) formed during carbonation into basic magnesium carbonate [51], the drying temperature was kept at 40 °C. The mass was measured daily for 2 days after drying until the dry mass remained constant, at which point the final dry mass was recorded. Three parallel tests were conducted for each group, and the arithmetic mean of the three results was taken as the moisture content of the specimen.
2.4.3. Resistivity Test
Resistivity measurement methods are mainly classified into four-electrode and two-electrode techniques based on the number of electrodes [51]. In this study, the resistivity of LCSS was measured using a Percometer (PM) (model MS6508, Shanghai Huayi Group Co., Ltd., Shanghai, China), an instrument capable of real-time, non-destructive, in situ measurement of the material’s dielectric constant and specific conductivity. After 28 days of standard curing, specimens were removed and placed in a constant temperature chamber at 20 °C for temperature equilibration. Due to the sensitivity of resistivity measurements to temperature, testing was conducted within 3 min of removal. The PM device was powered on and the appropriate probe was selected. Initial calibration was performed by measuring air. Following calibration, the PM sensor was placed on the specimen surface, and measurements were conducted by selecting the operational mode.
2.4.4. Thermogravimetric Analysis (TGA) Test
This test is used to analyze the mass loss of LCSS samples caused by the decomposition of carbonate phases, thereby quantitatively determining the CO2 absorption of the samples. When the samples reached 28 days of curing in the standard curing chamber, they were quickly removed and placed into an agate mortar to prevent moisture loss. The samples are ground in the agate mortar until passing through a 200 μm square mesh sieve, producing powdered samples that are labeled and stored for subsequent analysis [52]. Thermogravimetric analysis (TGA) was conducted using a Rigaku TG/DTA8122 analyzer (Rigaku Corporation, Tokyo, Japan). The prepared test samples were placed into alumina crucibles. Under a nitrogen protective atmosphere, the samples were heated from 30 °C to 800 °C at a rate of 10 °C/min. The simultaneous thermogravimetric and differential thermal analyzer measured the TG curve of the samples synchronously. The DTG curve can be derived through calculation, providing a more intuitive analysis of the changes in the sample data with temperature.
In thermogravimetric analysis (TGA), the sample mass after drying at 105 °C is commonly used as the normalization baseline to exclude free and physically bound water, while avoiding decomposition of carbonate phases. Drying at 105 °C thus provides a stable ‘dry mass’ that does not alter carbonate chemistry. Therefore, the mass loss in the carbonate decomposition interval (540–800 °C) [53] is divided by the sample mass at 105 °C to calculate the CO2 uptake (CO2wt), as follows:
where W540–800 °C denotes the mass loss in the 540–800 °C interval (as % of original sample mass) and W105 °C denotes the sample mass after drying at 105 °C (as % of original sample mass). This normalization yields the CO2 uptake expressed per unit dry mass, minimizing artifacts from variable moisture content and enabling direct comparison between samples.
2.4.5. Scanning Electron Microscopy (SEM) Test
Scanning Electron Microscopy (SEM) was used to characterize the microstructural products formed in LCSS. Specimens were first cured under standard conditions for 28 days according to the designated mix proportions. After curing, samples were oven-dried at 40 °C for 48 h to avoid decomposition of sensitive components at higher temperatures. Drying was considered complete when the mass of the specimen remained constant after three successive weight measurements. Prior to SEM observation, samples were gold-sputtered to prevent surface charging, which could interfere with image quality.
3. Experimental Results
3.1. Unconfined Compressive Strength and Water Content
Figure 4 illustrates the effect of reactive MgO dosage on the moisture content of LCSS. The results indicate that the moisture content of LCSS initially decreased with the increasing MgO dosage, then slightly increased, and finally declined again. The lowest moisture content of 27.03% was observed at an MgO content of 21%.

Figure 4.
Relationship between 28-day unconfined compressive strength, moisture content, and MgO dosage in LCSS.
Under the activation of CCR, water in the waste slurry reacted with GGBS in the alkaline environment, generating hydration products primarily consisting of C–S–H, C–A–S–H gels, and tobermorite [54], which contributed to the reduction in LCSS moisture content. Meanwhile, reactive MgO reacted with water in the slurry to form Mg(OH)2, which subsequently underwent carbonation with CO2 foam. As a result, the overall moisture content of LCSS decreased with increasing MgO dosage.
Figure 4 presents the effect of reactive MgO dosage on the UCS of LCSS. At a curing age of 28 days, the UCS of LCSS ranged from 0.114 to 0.253 MPa, with a general increasing trend observed as the MgO dosage increased. When the MgO dosage was relatively low, the change in compressive strength was minimal. The most remarkable gain in strength occurred within the MgO dosages ranging from 16% to19%, and the highest UCS of 0.253 Mpa was achieved at an MgO dosage of 21%.
As the reactive MgO content increased, the alkaline environment provided by CCR enhanced the internal hydration reactions within the LCSS. The formation of hydration products such as Mg(OH)2 was promoted, which subsequently reacted with CO2 under high CO2 foam conditions to generate granular nesquehonite crystals. These carbonation products filled internal pores and promoted the aggregation of slurry particles through physical encapsulation and chemical bonding. With further increases in MgO dosage, the porosity of LCSS decreased and its structure became more compact, indicating that the carbonation products were primarily derived from Mg(OH)2. An appropriate increase in MgO dosage facilitated the carbonation process, thereby improving the UCS of LCSS [55].
Figure 5 illustrates the effect of CO2 foam dosage on the moisture content of LCSS. The results indicate that the moisture content of LCSS increased with the rise in CO2 foam dosage, reaching a maximum of 64% at a foam content of 52%. Changes in moisture content can partially reflect the variation trend of UCS. As moisture content increased, the internal porosity of LCSS also rose, leading to a looser structure and the formation of connected pores, which caused a decrease in compressive strength. Additionally, variations in moisture content affected the number of flow channels, thereby altering permeability; higher moisture content corresponded to greater permeability [56]. Therefore, when employing carbonation solidification processes for waste slurry treatment, it is essential to comprehensively consider the factors influencing the moisture content of LCSS.
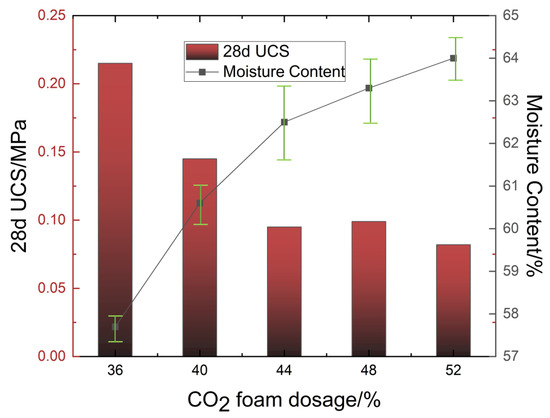
Figure 5.
Relationship between 28-day unconfined compressive strength, moisture content, and CO2 foam dosage in LCSS.
Figure 5 illustrates the effect of CO2 foam dosage on the UCS of LCSS. Overall, the UCS of LCSS exhibited a decreasing trend with increasing CO2 foam dosage. The highest UCS of 0.215 Mpa was observed at a minimum foam dosage of 36% after 28 days of curing. The incorporation of foam introduced a large number of macropores, increasing the pore volume within the LCSS matrix and reducing its compressive strength. However, the elevated CO2 concentration resulting from foam addition enhanced the carbonation and solidification reactions, partially offsetting the adverse effects of increased porosity on strength development.
Prediction of 28-Day Strength of LCSS
A nonlinear regression model was established to predict the 28-day unconfined compressive strength (qu) of LCSS as a function of reactive magnesia content (x1) and CO2 foam content (x2). The proposed regression model is expressed as Equation (2):
where β0 through β5 are regression coefficients, and ε represents the random error. Based on the experimental data, the fitted regression equation is as Equation (3):
A three-dimensional nonlinear regression surface of unconfined compressive strength as a function of CO2 foam content and reactive MgO content is shown in Figure 6. Black dots represent the experimental data, while the colored surface indicates the predicted values generated by the nonlinear regression model. As observed, the predicted strength values closely match the experimental results, with a coefficient of determination (R2) of 0.9177, indicating that more than 90% of the variation in UCS can be explained by the two factors and their interactions. The ANOVA results showed that the regression was statistically significant with an F-statistic of 13.9 and a corresponding p-value less than 0.01, confirming the reliability of the model. The predictive performance of the model was further evaluated by error metrics. The root mean square error (RMSE) was 0.0168 MPa, and the mean absolute percentage error (MAPE) was 10.58%, indicating a relatively small deviation between predicted and experimental values. This confirms that the proposed nonlinear regression model can reliably capture the variation in UCS with respect to CO2 foam and MgO contents.

Figure 6.
Three-dimensional nonlinear regression surface of the 28-day unconfined compressive strength of LCSS as a function of CO2 foam dosage and reactive MgO dosage.
It should be noted that the regression model was developed based on a limited number of experimental data points (MgO dosage: 7–19%, CO2 foam content: 36–52%). Therefore, the model is only valid within this range and should not be extrapolated beyond it. Although the model predicts an increase in UCS with both MgO and CO2 foam content, this result should be interpreted cautiously. From a mechanistic perspective, excessive foam addition would inevitably increase porosity and reduce strength, which was not fully captured by the regression due to limited experimental data. Hence, the model is primarily empirical and trend-oriented, rather than a mechanistic prediction tool. Future work with a larger dataset and advanced modeling approaches is needed to refine the predictive capability.
3.2. Electrical Resistivity Performance of LCSS
3.2.1. Effect of Reactive MgO Dosage and CO2 Foam Dosage on Electrical Resistivity
Figure 7a illustrates the effect of reactive MgO dosage on the electrical resistivity of LCSS. It can be observed that the electrical resistivity of LCSS generally increased with the increase in MgO dosage, reaching the highest value at 21% MgO, which corresponded to the lowest water content according to previous LCSS moisture tests. Previous studies have demonstrated that changes in resistivity are closely related to variations in the sample’s water content, saturation, and porosity, with water content showing the strongest correlation, as water acts as the primary medium for electrical current flow within the sample [57]. As the MgO dosage increased, more complete hydration reactions occurred, consuming more water within the sample, thereby reducing the moisture content of LCSS and increasing its electrical resistivity.

Figure 7.
The effect of reactive MgO dosage and CO2 foam dosage on the electrical resistivity of LCSS. (Comparison between measured data (dots) and fitted curves for the effects of MgO dosage and CO2 foam dosage on resistivity of LCSS. The circular markers denote measured experimental points. Smooth curves only connect the measured points and have no predictive significance). (a) The effect of reactive MgO dosage on the electrical resistivity of LCSS. (b) The effect of reactive CO2 foam dosage on the electrical resistivity of LCSS.
Figure 7b shows the effect of different CO2 foam dosage on the electrical resistivity of LCSS. It can be seen that when the CO2 foam dosage ranged from 36% to 52%, the resistivity varied between 42.7 and 93.3 (Ω·m), and the resistivity decreased with increasing CO2 foam dosage. Based on previous experimental observations, as the CO2 foam dosage increased, the moisture content of LCSS rises. Although a higher CO2 foam dosage promoted more complete carbonation reactions and thus increased the amount of carbonation products, consuming more water within the sample, the increase in moisture introduced by the foam exceeded the water consumed by carbonation. Therefore, with increasing CO2 foam dosage, the overall moisture content of the sample increased, resulting in a decrease in electrical resistivity.
3.2.2. Relationship Between Resistivity and UCS
Figure 8 illustrates the relationship between electrical resistivity and UCS of LCSS at varying MgO and CO2 foam dosages. UCS is a critical parameter for evaluating the feasibility of LCSS in engineering applications and is influenced by factors such as MgO and CO2 foam dosages. Previous studies [51] have shown that changes in sample resistivity exhibit trends similar to those of UCS. Therefore, investigating the correlation between electrical resistivity and UCS in LCSS is essential.

Figure 8.
Relationship between UCS and electrical resistivity. (a) Relationship between UCS and electrical resistivity at various MgO dosages. (b) Relationship between UCS and electrical resistivity at various CO2 foam dosages.
Figure 8a illustrates the relationship between electrical resistivity and UCS of LCSS samples under varying MgO dosage. The results demonstrate a significant positive correlation between resistivity and UCS; as resistivity increased, sample strength also rose. Previous studies indicate that increasing MgO dosage helps reduce sample moisture content and promotes the formation of carbonation products, such as magnesium carbonates, thereby enhancing both resistivity and strength. When the MgO dosage reached 13%, both resistivity and UCS attained high values, reflecting improved structural density and cementation performance.
Figure 8b further illustrates the coupled relationship between electrical resistivity and UCS under varying CO2 foam dosage. The results indicate a positive correlation between the two parameters. However, as the foam dosage increased, both resistivity and strength decreased. This decline was attributed to the foam increasing the sample’s moisture content and porosity, which weakened the formation of carbonation products and reduced structural density, leading to lower resistivity and UCS.
Previous studies have consistently reported a strong linear correlation between the UCS and electrical resistivity of stabilized soils. This relationship reflects the evolution of pore structure optimization, increased structural density, and enhanced cementation during the carbonation process, which jointly promote the concurrent increase in resistivity and strength. The present study validated the feasibility and effectiveness of using electrical resistivity as a predictive indicator for strength. Furthermore, it provided theoretical support and practical value for developing a nondestructive testing model for LCSS, demonstrating significant practical implications and potential for wider application.
3.3. Carbon Sequestration Performance of LCSS
3.3.1. TG–DTG Analysis of LCSS Under Different MgO and CO2 Foam Dosages
The TG–DTG curves of LCSS consistently show three major mass loss processes: (1) 30–200 °C, related to moisture removal; (2) 300–450 °C, associated with the decomposition of Mg(OH)2; and (3) 540–800 °C, corresponding to the decomposition of carbonate phases with CO2 release. Although both TG and DTG curves describe the same sequence of processes, they provide complementary perspectives: TG highlights the overall weight change, while DTG reveals the intensity of each decomposition peak.
The TG curves of samples with varying MgO contents (Figure 9a) showed similar decomposition patterns, with major mass-loss steps in the three characteristic temperature regions. A closer view of the theoretical decarbonation interval (480–800 °C, Figure 9b) revealed that higher MgO contents led to slightly larger mass losses in this range, confirming enhanced carbonate formation. The corresponding DTG curves (Figure 10a) indicated three decomposition peaks, consistent with the three stages identified above. In the dehydration stage (50–150 °C, Figure 10b), the weight-loss rate decreased as MgO dosage increased, due to consumption of pore water by hydration and carbonation reactions. In contrast, during hydroxide decomposition (300–450 °C, Figure 10c), the weight-loss rate increased with MgO dosage, reflecting the larger amounts of Mg(OH)2 formed and subsequently decomposed. Finally, in the decarbonation stage (625–725 °C, Figure 10d), higher MgO dosages produced stronger decomposition peaks, indicating more extensive carbonation and greater quantities of magnesium carbonate phases. These results demonstrate that increasing MgO content significantly promotes both hydration and carbonation, thereby intensifying the decomposition signals observed in TG–DTG curves.
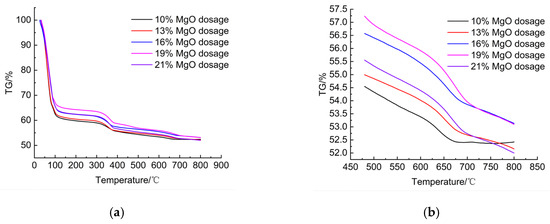
Figure 9.
TG curves. (a) TG curves of samples with varying MgO dosages. (b) TG curve within the temperature range of 480–800 °C.


Figure 10.
DTG curves. (a) DTG curves at different MgO dosages. (b) DTG curves within the temperature range of 50–150 °C. (c) DTG curves within the temperature range of 300–450 °C. (d) DTG curves within the temperature range of 625–725 °C.
The TG curves of specimens with different CO2 foam dosages (Figure 11a) also exhibited the three typical decomposition intervals. Within the 480–800 °C range (Figure 11b), the differences among samples were less pronounced than those caused by MgO dosage. Nevertheless, higher CO2 foam dosages introduced a larger total amount of CO2 into the system, thereby increasing the degree of carbonation. The DTG curves (Figure 12a) further confirmed this trend: three decomposition peaks were observed for all dosages, but the changes in intensity were relatively modest compared with MgO variation. In the dehydration stage (50–150 °C, Figure 12b), the weight-loss rate increased with foam dosage, consistent with the higher initial moisture content introduced by the foam. In the hydroxide decomposition stage (300–450 °C, Figure 12c), the influence of foam dosage was minor, with weight-loss rates ranging only between 0.55% and 0.65% per minute. In the decarbonation stage (625–725 °C, Figure 12d), the peak variations were also limited, reflecting the fact that while additional CO2 promotes more carbonation reactions, the effect is relatively smaller compared with MgO dosage.
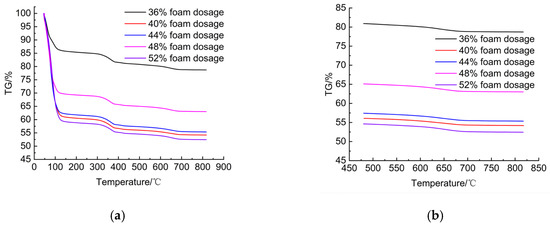
Figure 11.
TG curves. (a) TG curves of LCSS samples with varying CO2 foam dosages. (b) TG curve within the temperature range of 480–800 °C.

Figure 12.
DTG curves. (a) DTG curves at different CO2 foam dosages. (b) DTG curves within the temperature range of 50–150 °C. (c) DTG curves within the temperature range of 300–450 °C. (d) DTG curves within the temperature range of 625–725 °C.
Overall, TG–DTG analysis demonstrates that MgO dosage has a dominant influence on the decomposition processes of LCSS, producing stronger shifts in dehydration, hydroxide decomposition, and decarbonation peaks. CO2 foam dosage also affects these processes by increasing the total injected CO2 and thereby the degree of carbonation, but the variations are less significant. Importantly, both MgO dosage and CO2 foam dosage follow the same mechanistic pathways, and the use of TG and DTG curves in combination provides a comprehensive understanding of these effects. In addition to the magnesium-based hydration and carbonation reactions, calcium-bearing phases also participate in the decomposition of LCSS. Specifically, CaO originating from the lightweight soil can hydrate to form Ca(OH)2, which subsequently carbonates into CaCO3. During TG–DTG analysis, the decomposition of Ca(OH)2 generally occurs in the range of 300–500 °C, while the decarbonation of CaCO3 takes place at approximately 650–725 °C. These processes partially overlap with the decomposition of Mg(OH)2 and magnesium carbonates, making it difficult to completely separate the weight-loss contributions of Ca-based and Mg-based compounds.
The presence of these Ca-bearing phases implies that, when the CaO/MgO ratio increases, Ca(OH)2 decomposition and CaCO3 decarbonation may contribute significantly—even dominantly—to the observed TG–DTG signals. In the present study, although MgO dosage was the primary variable of interest, the contribution of calcium hydroxide and calcium carbonate should not be neglected, as they also play an important role in shaping the overall thermal behavior of LCSS. Future studies will aim to further quantify and distinguish the relative contributions of Ca-based and Mg-based phases by combining TG–DTG with complementary analytical methods such as XRD and FTIR.
It should be noted that the primary objective of this study was to evaluate the overall carbonation degree of LCSS, rather than to differentiate between magnesium-based and calcium-based carbonation products. Both MgCO3 and CaCO3 phases decompose in the same range, releasing CO2 that contributes to the weight-loss signals in TG–DTG analysis. Therefore, for the purpose of calculating carbonation degree, it is sufficient to quantify the CO2 released within this temperature interval, irrespective of whether the carbonate originates from Mg or Ca compounds.
It is also worth noting that in the experimental design, the amount of calcium-bearing phases remained essentially constant across the different MgO dosage groups. As a result, although Ca(OH)2 decomposition and CaCO3 decarbonation contribute to the thermal signals, their influence is uniform among the groups and does not interfere with the comparative analysis of MgO dosage on carbonation degree. Therefore, the calculated carbonation degree primarily reflects the effect of MgO dosage and the total CO2 uptake of the system, with the role of Ca-based phases acting as a constant background contribution.
While calcium hydroxide decomposition and calcium carbonate decarbonation may indeed play a dominant role when the CaO/MgO ratio is high, the current study focuses on the cumulative effect of Mg- and Ca-bearing phases in terms of CO2 fixation. The distinction between Mg-based and Ca-based contributions is not the central focus of this work, but we acknowledge their participation and clarify that the carbonation degree reported here represents the total CO2 uptake of the system.
3.3.2. Effects of Active Magnesium Oxide Content and CO2 Foam Content on CO2wt
The CO2wt was calculated using Equation (1) based on the TG curves obtained from varying active magnesium oxide and CO2 foam dosages, as shown in Figure 12.
Figure 13a illustrates the effect of reactive MgO dosage on CO2wt. It shows that within the 10–21% MgO dosage range, the CO2wt of LCSS varied between 3.93% and 10.07%. Traditional cement-based stabilization of waste slurry generates a large amount of CO2. Since the 21st century, China’s cement consumption has ranked first worldwide, contributing up to 8 Gt of annual carbon emissions from fossil fuels, which contradicts environmental sustainability goals [58]. Replacing traditional cement with reactive MgO and GGBS can not only reduce cement usage but also absorb CO2, thereby achieving energy conservation and emission reduction.

Figure 13.
The effect of reactive MgO dosage and CO2 foam dosage on CO2wt.
Figure 13a indicates that the CO2wt of LCSS initially increased and then decreased with increasing reactive MgO dosage. The absorption rate peaks at 10.07% when the MgO dosage reaches 19%, suggesting a limit to MgO’s capacity for CO2 absorption. At a fixed CO2 foam dosage, there exists a maximum CO2wt, beyond which further increase in MgO content reduces absorption efficiency. Excessive MgO led to the rapid formation of hydration products that coat unreacted MgO and slag particles, hindering further hydration reactions. This resulted in decreased production of hydration products and consequently lowered CO2 absorption.
Figure 13b shows the effect of varying CO2 foam dosage on CO2wt. When the CO2 foam content ranged from 36% to 52%, the CO2 absorption rate varied between 3.86% and 6.21%. The absorption rate exhibited an overall trend of first increasing and then decreasing with increasing CO2 foam dosage, reaching a maximum at 48%. This was mainly because higher CO2 foam dosage promotes more thorough carbonation and solidification reactions within LCSS, and the increased porosity provided more reaction sites, enhancing CO2 absorption. At a fixed reactive MgO dosage, there existed a maximum CO2 absorption capacity for LCSS.
3.3.3. Study on the Carbon Sequestration Model of LCSS
Based on the previously fitted experimental data curves, a mathematical model was proposed to describe the CO2 absorption rate of LCSS as a function of reactive MgO dosage and CO2 foam dosage. Currently, several methods exist to establish mathematical relationships between independent and dependent variables, which can be broadly categorized into two types [59]: The first method studies the relationship between each independent variable and the dependent variable separately, derives corresponding mathematical models for each, and then combines these models. If the combined model significantly deviates from experimental data, interactions between variables are considered by developing a multivariate model. This approach is widely applicable and generally accurate. The second method directly considers quadratic relationships among independent variables as well as their interactions, establishing a multivariate quadratic nonlinear model. However, this method has a narrower scope of applicability [60]. Therefore, the first method is adopted in this study for modeling.
The influence curves of reactive MgO dosage and CO2 foam dosage on CO2 absorption rate were fitted using the logistic model. The model equations are presented in Equations (4) and (5):
where y0 represents the global baseline offset, shifting the entire curve vertically.
A controls the amplitude and direction of the peak (positive for a peak, negative for a trough).
w determines the peak width; a larger w results in a broader, flatter peak, while a smaller w yields a sharper, narrower peak.
xc is the position at which the curve reaches its extremum.
z is the fitting parameter.
Physically, the logistic function provides an appropriate description of the carbonation process. In the early stage, carbonation progresses slowly due to the limited contact between CO2 and reactive phases (induction stage). As the reaction proceeds, carbonation accelerates because more reactive MgO is available and pore structures facilitate CO2 diffusion (rapid growth stage). Finally, the reaction rate decreases and approaches a plateau, as the formation of carbonate products (MgCO3, CaCO3) reduces the permeability of the system and hinders further CO2 penetration (saturation stage).
This sigmoidal pattern is consistent with the experimental results of LCSS carbonation, confirming that the logistic model not only fits the data mathematically but also reflects the physical mechanisms governing the process. The fit was based on the experimental data and the fitted curve parameters are shown in Table 8, the fitted graph is shown in Figure 14.
Table 8.
Parameters of the fitted curves.
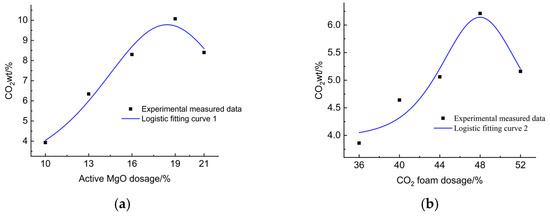
Figure 14.
Fitted curves based on experimental data. (a) Fitted curves under different reactive MgO dosages. (b) Fitted curves at different CO2 foam dosages.
The fitted equation describing the relationship between the MgO dosage and the CO2 uptake is given as follows:
The fitted equation for the relationship between CO2 foam dosage and CO2 uptake is as follows:
where x1 represents the MgO dosage (%);
x2 denotes the CO2 foam dosage (%);
z1 and z2 are the fitting parameters.
Due to the interactive effect between MgO dosage and CO2 foam dosage in LCSS, the carbon sequestration model must incorporate a reduction coefficient in addition to the superposition of the fitted equations. Based on the regression analysis, the reduction coefficient is determined, and the carbon sequestration model for LCSS is expressed as follows:
where K is the reduction coefficient for MgO dosage, taken as 0.682;
L is the reduction coefficient for CO2 foam dosage, taken as 0.318.
Equation (10) can be rewritten as:
To further evaluate the reliability of the proposed carbon sequestration model, a statistical significance test and error analysis were performed. The nonlinear regression model was subjected to an ANOVA test, which confirmed that the overall model was statistically significant (F-test, p < 0.01).
The prediction errors were quantified by comparing the experimental CO2 uptake values with the predicted results. The combined regression model achieved a coefficient of determination of R2 = 0.844, a RMSE of 0.787, and a MAPE of 11.9%, suggesting good agreement between predicted and experimental results. The integrated model demonstrates reliable predictive capability with acceptable deviations, thereby validating its practical applicability in estimating CO2 sequestration efficiency of LCSS.
3.4. SEM Analysis
To further understand the underlying mechanisms in overall performance of LCSS including unconfined compressive strength, moisture content, electrical resistivity, and carbon sequestration capacity, the microstructural characteristics of specimens with varying CO2 foam contents were examined in detail.
In this study, SEM analysis was performed only for specimens with different CO2 foam dosages. At 1000× magnification, the images highlight the differences in porosity and pore distribution caused by varying foam content. At 5000× magnification, the images allow observation of carbonate crystal morphology and microstructural densification under the same conditions. Although MgO dosage is expected to have a stronger influence on phase morphology, microstructural characterization of different MgO dosages was beyond the scope of the present work and will be investigated in future studies.
Figure 15 presents SEM images of LCSS samples at 1000× magnification under different CO2 foam dosages. As the CO2 foam dosage increased, larger pores were observed, along with more fragmented soil particles and reduced interparticle filling. Higher foam dosages leaded to more pronounced porosity and weaker particle bonding, with clearer boundaries and sharper particle edges. At a CO2 foam dosage of 44%, large macropores began to form, significantly compromising the structural integrity of the material. The spatial distribution of soil particles and pores became increasingly heterogeneous with foam addition. The particle surfaces were covered with various morphologies of reaction products, although some interparticle connections still remained.
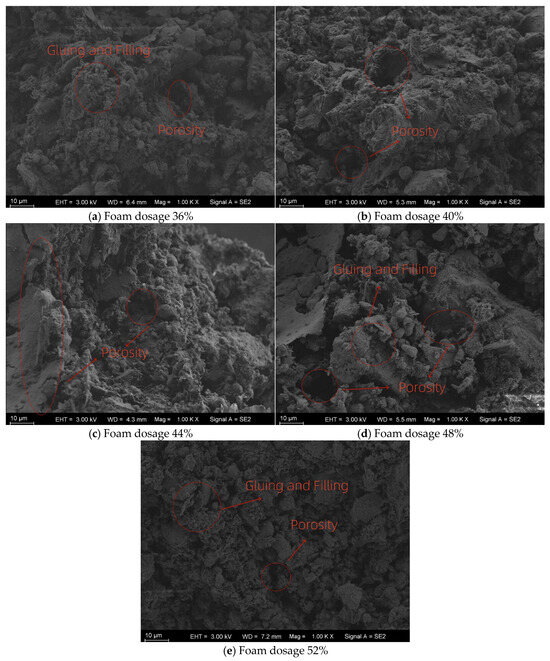
Figure 15.
Microstructural features at 1000× magnification.
Figure 16 shows SEM images of LCSS at 5000× magnification under different CO2 foam contents. The particles were clearly encapsulated by prismatic crystals and fibrous or flake-like cementitious products. Previous studies had identified the prismatic crystals as hydromagnesite, and the fibrous or flake-shaped binding phases as nesquehonite and dypingite [61], all of which are magnesium carbonate-based carbonation products. Nesquehonite and dypingite are often located beneath the hydromagnesite crystals, indicating possible phase transformation pathways between these products. As the CO2 foam dosage increased, the amount of carbonation products also increased, indicating a more extensive carbonation reaction. This behavior differs from conventional surface carbonation, suggesting that CO2 foam enables deeper and more uniform internal carbonation.

Figure 16.
Microstructural features at 5000× magnification.
The complete carbonation reactions occurring in LCSS are presented in Equations (12)–(16) [53].
From Figure 15 and Figure 16, it can be seen that as the CO2 foam dosage increases, the pore structure becomes more open and irregular, and larger interconnected voids are observed. At low foam dosages, the microstructure appears dense with relatively compact particle packing, indicating efficient particle bonding and limited unreacted porosity. At higher CO2 foam dosages, the distribution of pores becomes more heterogeneous; however, fine carbonation products such as needle-like and plate-like magnesium carbonate hydrates can still be observed on the pore surfaces and between particles. These crystalline products, likely corresponding to hydromagnesite and nesquehonite, demonstrate that CO2 introduced via foaming actively participates in the carbonation process even under high-porosity conditions. The comparison between the two magnifications (1000× and 5000×) reveals that while the overall porosity increases with foam dosage, micro-scale carbonate precipitation contributes to local densification and improved interparticle bonding. This microstructural densification mechanism explains the measured increases in compressive strength, as well as the rise in resistivity with higher carbonation degrees. Although SEM analysis for different MgO dosages was not conducted in this study, the observed microstructural evolution with CO2 foam variation provides strong evidence that carbonation reactions effectively occur throughout the pore network and significantly influence the material’s performance.
4. Microstructural Evolution and Its Role in Enhancing Strength, Electrical Resistivity, and Carbon Sequestration of LCSS
Figure 17 illustrates the schematic microstructural model of LLCS. There exists a significant synergy among the compressive strength, electrical resistivity, and CO2 sequestration capacity of LLCS, which is fundamentally governed by the microstructural evolution jointly driven by magnesia carbonation reactions and the C–S–H gel matrix. Studies have demonstrated that the magnesia carbonation products within the material follow a transformation sequence: reactive MgO → brucite → hydromagnesite/nesquehonite/dypingite. In particular, prismatic nesquehonite crystals bridge soil particles and slurry impurities through both physical encapsulation and chemical bonding, forming bridging structures and cementitious layers that significantly enhance normal stress transfer and interparticle friction, thereby improving compressive strength.

Figure 17.
Schematic diagram of the LLCS micro-model.
At the microstructural level, hydromagnesite crystals exhibit needle-like or fibrous morphologies that grow directionally along pore walls. These structures work synergistically with dypingite to form an interconnected network, effectively filling voids, reducing porosity, and anchoring loose aggregates. This contributes to initial structural stability and inhibits crack propagation. Collectively, these mechanisms enhance the electrical resistivity of the material, as the reduced porosity and moisture content limit the formation of conductive pathways. In addition, the CCR induced C–S–H gel, appearing as sheet-like or filamentous structures, interacts synergistically with magnesium carbonate minerals to form a three-dimensional matrix. This network improves the interfacial bonding between the cementitious phase and soil particles, thereby enhancing structural integrity and reducing the likelihood of interfacial weak zones.
From a carbon sequestration perspective, the carbonation–magnesia reaction involves substantial CO2 uptake, which becomes chemically bound in magnesium carbonates such as hydromagnesite, dypingite, and nesquehonite. The formation of these carbonates serves as a direct indicator of the material’s CO2 absorption capacity. Therefore, this material system not only enhances mechanical performance but also enables simultaneous optimization of carbon sequestration and electrical properties through microstructural regulation.
5. Disscution
5.1. Comparison with Previous Studies
Table 9 presents a comparison between the findings of this study and those reported by other authors on MgO-based carbonation systems and foamed lightweight materials. The present study achieved comparable or higher strength and carbonation degrees under CO2 foaming conditions, indicating that the combined use of reactive MgO and CO2 foam can effectively enhance mechanical performance while improving carbon sequestration efficiency.
Table 9.
Comparison between this study and previous works.
5.2. Strengths and Weaknesses of the Present Study
Strengths:
(1) Establishes the first multiparameter predictive model for carbon–magnesium reactions in LCSS.
(2) Integrates mechanical, electrical, and carbonation analyses in a single framework.
(3) Demonstrates that CO2 foaming can effectively improve carbonation efficiency and strength simultaneously.
(4) Provides statistically validated predictions (R2 > 0.90, low RMSE, MAPE).
Weaknesses:
(1) SEM analysis was conducted only for variations in CO2 foam dosage, not MgO content.
(2) Long-term durability and field validation were not addressed and should be considered in future studies.
(3) The current model assumes constant curing conditions and does not account for environmental variability.
5.3. Scientific Novelty and Fundamental Differences
The main scientific novelty of this work lies in establishing a quantitative, multiparameter relationship among MgO dosage, CO2 foam content, strength, resistivity, and carbonation degree in LCSS. This provides new insights into how carbon–magnesium reactions contribute to mechanical performance in lightweight cemented materials.
Unlike previous studies that focused on either carbonation kinetics or single mechanical properties, this research integrates multiple parameters within a predictive model, verified through statistical analysis. Moreover, the experimental approach using CO2 foaming as a gas–solid reaction pathway represents a fundamentally different engineering strategy, promoting uniform CO2 distribution and efficient in situ carbonation.
Therefore, this study contributes both scientifically (by developing a multiparameter prediction model for MgO carbonation) and technically (by proposing a sustainable approach to CO2 utilization in soil stabilization).
6. Conclusions and Future Prospects
This study systematically investigated the combined effects of MgO dosage and CO2 foam content on the strength, resistivity, and carbonation behavior of lightweight carbonated soils (LCSS), and developed a multiparameter prediction model validated by statistical analysis. The main findings can be summarized as follows:
(1) Effect of MgO and CO2 foam: Increasing MgO dosage significantly enhances carbonation and mechanical strength due to the formation of hydromagnesite and nesquehonite, while CO2 foam primarily modifies the pore structure and promotes CO2 diffusion within the matrix.
(2) Model accuracy: The developed regression model accurately predicts strength, resistivity, and carbonation degree, confirming the strong coupling between MgO dosage, CO2 foam content, and carbonation efficiency.
(3) Microstructural evidence: SEM and TG–DTG analyses reveal that increased MgO content leads to denser carbonated structures, while CO2 foam dosage influences pore morphology and the local distribution of carbonate phases.
6.1. Future Prospects and Ongoing Work
Building upon these findings, future research will focus on several directions:
(1) Microscopic characterization: Conducting detailed SEM, XRD, and FTIR analyses for specimens with different MgO dosages to clarify the micro–macro relationship of carbonation.
(2) Time-dependent carbonation: Investigating the kinetics and evolution of CO2 uptake and strength development under long-term curing and cyclic environmental conditions.
(3) Durability and environmental assessment: Evaluating water resistance, freeze–thaw stability, and CO2 sequestration capacity to assess the material’s long-term sustainability.
(4) Field-scale validation: Extending laboratory findings to pilot-scale or field tests to verify the practical performance of LCSS under real environmental conditions.
6.2. Potential Engineering Implementation
The present results demonstrate that the combination of MgO and CO2 foam provides an effective route to reduce cement consumption and achieve in situ CO2 utilization. This approach can be directly applied to the design of low-carbon lightweight foundation fills, embankment backfills, and ground stabilization materials. The proposed prediction model also offers a useful design tool for optimizing MgO and CO2 dosages to achieve targeted strength and durability while minimizing carbon footprint.
Overall, this study not only deepens the understanding of carbon–magnesium reactions in lightweight soil systems but also establishes a practical foundation for developing carbon-negative construction materials in future sustainable engineering.
Author Contributions
Conceptualization, L.S.; Data curation, W.Y.; Formal analysis, W.Y.; Funding acquisition, L.S.; Investigation, W.Y. and J.N.; Methodology, W.Y. and J.N.; Project administration, L.S.; Resources, L.S.; Software, L.S.; Supervision, Y.L., J.N., X.D., C.S., and L.W.; Validation, W.Y.; Visualization, W.Y.; Writing—original draft, L.S. and W.Y.; Writing—review and editing, J.N. and X.D. All authors have read and agreed to the published version of the manuscript.
Funding
This research received no external funding.
Data Availability Statement
The original contributions presented in this study are included in the article. Further inquiries can be directed to the corresponding author.
Conflicts of Interest
The authors declare no conflicts of interest.
References
- Youssef, M.B.; Lavergne, F.; Sab, K.; Miled, K.; Neji, J. Upscaling the elastic stiffness of foam concrete as a three-phase composite material. Cem. Concr. Res. 2018, 110, 13–23. [Google Scholar] [CrossRef]
- Xiong, Y.; Zhang, C.; Chen, C.; Zhang, Y. Effect of superabsorbent polymer on the foam-stability of foamed concrete. Cem. Concr. Compos. 2022, 127, 104398. [Google Scholar] [CrossRef]
- Zhou, D.; Gao, H.; Liao, H.; Li, F.; Cheng, F. Enhancing the performance of foam concrete containing fly ash and steel slag via a pressure foaming process. J. Clean. Prod. 2021, 329, 129664. [Google Scholar] [CrossRef]
- Yang, S.; Yao, X.; Li, J.; Wang, X.; Zhang, C.; Wu, S.; Wang, K.; Wang, W. Preparation and properties of ready-to-use low-density foamed concrete derived from industrial solid wastes. Constr. Build. Mater. 2021, 287, 122946. [Google Scholar] [CrossRef]
- Malai, A.; Youwai, S.; Watcharasawe, K.; Jongpradist, P. Bridge approach settlement mitigation using expanded polystyrene foam as light backfill: Case study and 3D simulation. Transp. Geotech. 2022, 35, 100794. [Google Scholar] [CrossRef]
- Shi, X.; Huang, J.; Su, Q. Experimental and numerical analyses of lightweight foamed concrete as filler for widening embankment. Constr Build Mater 2020, 250, 118897. [Google Scholar] [CrossRef]
- Chen, Z.; Wang, S. Foamed cement banking soil and its application. J. China Foreign Highw. 2003, 23, 117–120. (In Chinese) [Google Scholar] [CrossRef]
- Cai, G. Experimental and Application Studies on Soft Soil Carbonated and Stabilized by Reactive Magnesia. Ph.D. Thesis, Southeast University, Nanjing, China, 2017. (In Chinese). [Google Scholar]
- Ko, D.H.; Kang, S.C.; Lee, C.W.; Im, K.S. Effects of support porosity of Co-Mo/MgO catalyst on methane catalytic decomposition for carbon and hydrogen production. J. Ind. Eng. Chem. 2022, 112, 162–170. [Google Scholar] [CrossRef]
- Rabie, A.M.; Shaban, M.; Abukhadra, M.R.; Hosny, R.; Ahmed, S.A.; Negm, N.A. Diatomite supported by CaO/MgO nanocomposite as heterogeneous catalyst for biodiesel production from waste cooking oil. J. Mol. Liq. 2019, 297, 224–231. [Google Scholar] [CrossRef]
- Hu, Y.; Guo, Y.; Sun, J.; Li, H.; Liu, W. Progress in MgO sorbents for cyclic CO2 capture: A comprehensive review. J. Mater. Chem. A 2019, 7, 20103–20120. [Google Scholar] [CrossRef]
- Dziejarski, B.; Serafin, J.; Andersson, K.; Krzyżyńska, R. CO2 capture materials: A review of current trends and future challenges. Mater. Today Sustain. 2023, 24, 100483. [Google Scholar] [CrossRef]
- Cui, H. Structure-Performance Relationship and Sorption Mechanisms of Alkali Metal Salt-Promoted Solid Sorbents for Intermediate and High Temperature CO2 Capture. Ph.D. Thesis, East China University of Science and Technology, Shanghai, China, 2021. (In Chinese) [Google Scholar] [CrossRef]
- Tan, C. The Influence Mechanism of MgO Microstructure and Active Site Regulation on CO2 Adsorption Properties. Master’s Thesis, Nanjing Normal University, Nanjing, China, 2020. (In Chinese) [Google Scholar] [CrossRef]
- Iugai, I.A.; Steksova, Y.P.; Vedyagin, A.A.; Mishakov, I.V.; Bauman, Y.I.; Belyy, V.A.; Danilovich, D.P.; Krivoshapkina, E.F.; Krivoshapkin, P.V. MgO/carbon nanofibers composite coatings on porous ceramic surface for CO2 capture. Surf. Coat. Tech. 2020, 400, 126208. [Google Scholar] [CrossRef]
- Yu, X.; Ji, R.; Yang, H.; Wang, E.; Su, G. Research progress of post-combustion carbon dioxide capture materials. Low-Carbon Chem. Chem. Eng. 2023, 48, 82–94. (In Chinese) [Google Scholar] [CrossRef]
- Gao, W.; Yan, G.; Xu, Y.; Feng, Y. Research progress on solid adsorbents for carbon dioxide capture. Low-Carbon Chem. Chem. Eng. 2023, 48, 145–155. (In Chinese) [Google Scholar]
- Guo, Y.; Zhao, C.; Sun, J.; Li, W.; Lu, P. Facile synthesis of silica aerogel supported K2CO3 sorbents with enhanced CO2 capture capacity for ultra-dilute flue gas treatment. Fuel 2018, 215, 735–743. [Google Scholar] [CrossRef]
- Ghosh, S.; Sarathi, R.; Ramaprabhu, S. Magnesium oxide modified nitrogen-doped porous carbon composite as an efficient candidate for high pressure carbon dioxide capture and methane storage. J. Colloid. Interf. Sci. 2019, 539, 245–256. [Google Scholar] [CrossRef]
- Tan, C.; Guo, Y.; Sun, J.; Li, W.; Zhang, J.; Zhao, C.; Lu, P. Structurally improved MgO adsorbents derived from magnesium oxalate precursor for enhanced CO2 capture. Fuel 2020, 278, 118379. [Google Scholar] [CrossRef]
- Gao, W.; Zhou, T.; Gao, Y.; Louis, B.; O’Hare, D.; Wang, Q. Molten salts-modified MgO-based adsorbents for intermediate-temperature CO2 capture: A review. J. Energy Chem. 2017, 26, 830–838. [Google Scholar] [CrossRef]
- Zhu, Z.; Shi, X.; Rao, Y.; Huang, Y. Recent progress of MgO-based materials in CO2 adsorption and conversion: Modification methods, reaction condition, and CO2 hydrogenation. Chin. Chem. Lett. 2024, 35, 108954. [Google Scholar] [CrossRef]
- Dung, N.T. Development of MgO concrete with enhanced hydration and carbonation mechanisms. Cem. Concr. Res. 2018, 103, 160–169. [Google Scholar] [CrossRef]
- Dung, N.T.; Unluer, C. Carbonated MgO concrete with improved performance: The influence of temperature and hydration agent on hydration, carbonation and strength gain. Cem. Concr. Compos. 2017, 82, 152–164. [Google Scholar] [CrossRef]
- Zhang, R.; Arrigoni, A.; Panesar, D.K. Could reactive MgO cement be a green solution? The effect of CO2 mineralization and manufacturing route on the potential global warming impact. Cem. Concr. Compos. 2021, 124, 104263. [Google Scholar] [CrossRef]
- Harrison, J. The Case for and Ramifications of Blending Reactive Magnesia with Portland Cement. In Proceedings of the 28th Conference on Our World in Concrete & Structures, Singapore, 28–29 August 2003; TecEco Pty Ltd.: Tasmania, Australia, 2003. [Google Scholar]
- Yi, Y. Sustainable Novel Deep Mixing Methods and Theory. Ph.D. Thesis, Southeast University, Nanjing, China, 2013. (In Chinese). [Google Scholar]
- Cai, G.; Liu, S.; Du, Y.; Zhang, D.; Zheng, X. Strength and deformation characteristics of carbonated reactive magnesia treated silt soil. J. Cent. South Univ. 2015, 5, 1859–1868. [Google Scholar] [CrossRef]
- Liu, S.; Cao, J.; Cai, G. Microstructural mechanism of reactive magnesia carbonated and stabilized silty clays. Rock Soil Mech. 2018, 39, 1543–1552, 1563. (In Chinese) [Google Scholar] [CrossRef]
- Zhang, Y.; Ong, Y.J.; Yi, Y. Comparison between CaO-and MgO-activated ground granulated blast-furnace slag (GGBS) for stabilization/solidification of Zn-contaminated clay slurry. Chemosphere 2022, 286, 131860. [Google Scholar] [CrossRef] [PubMed]
- Liska, M.; Al-Tabbaa, A. Ultra-green construction: Reactive magnesia masonry products. Waste Resour. Manag. 2009, 162, 185–196. [Google Scholar] [CrossRef]
- Haque, M.A.; Dai, J.G.; Zhao, X.L. Magnesium cements and their carbonation curing: A state-of-the-art review. J. Sustain. Cem. -Based Mater. 2024, 13, 79–101. [Google Scholar] [CrossRef]
- Gao, X.; Lu, P.; Kuzmenko, L.; Ilavsky, J.; Gadikota, G. Reactive CO2 Capture and Mineralization of Magnesium Hydroxide to Produce Hydromagnesite with Inherent Solvent Regeneration. Ind. Chem. Mater. 2025, Advance Article. [Google Scholar] [CrossRef]
- Rai, R.; Serra-Maia, R.; Shi, Y.; Psarras, P.; Vojvodic, A.; Stach, E. Enhanced mineral carbonation on surface functionalized MgO as a proxy for mine tailings. Environ. Sci. 2025, 12, 2630–2646. [Google Scholar] [CrossRef]
- Zhou, X.; Qian, X.; Qin, Y.; Hu, C.; Liu, Z.; Wang, F. Novel Carbonated Materials: The Synergistic Role of MgO in Partially Calcined Limestone. ACS Sustain. Chem. Eng. 2024, 12, 4332–4344. [Google Scholar] [CrossRef]
- Liu, G.; Liu, S.; Yin, B.; Wang, J. Effects of Hydraulic Materials on the Performance Evolution of Carbonated High-Volume Magnesium Slag Mortars. Buildings 2025, 15, 3062. [Google Scholar] [CrossRef]
- Jia, Y.; Zou, X.; Jiang, Y.; Zou, Y.; Song, S.; Qin, J.; Wang, Y.; Zhu, L. Study on the Stability of Low-Carbon Magnesium Cementitious Materials in Sulfate Erosion Environments. Materials 2023, 16, 4042. [Google Scholar] [CrossRef] [PubMed]
- Zhu, M.; Zhai, R.; Zhu, M.; He, J. Evaluating Alkali Activation in Magnesium Slag Carbonization and Its Mechanism. Crystals 2024, 14, 847. [Google Scholar] [CrossRef]
- Liu, S.; Wang, L.; Liu, Y.; Du, G.; Cai, G.; Sun, H.; Shan, Y. Experimental study on electrical resistivity of soil-cement. Chinese J. Geotech. Eng. 2006, 28, 1921–1926. (In Chinese) [Google Scholar] [CrossRef]
- Liu, S.; Zhang, D.; Zhu, Z. On the uniformity of deep mixed soil-cement columns with electrical resistivity method. In Proceedings of the U.S.-China Workshop on Ground Improvement Technologies 2009, Orlando, FL, USA, 14 March 2009. [Google Scholar]
- Miao, L.; Liu, S.; Yan, M. Research on electrical resistivity feature of cement-soil and its application. Chin. J. Rock Mech. Eng. 2001, 20, 126–130. (In Chinese) [Google Scholar]
- Liu, G.; Wang, Z.; Huang, J. Research on electrical resistivity feature of soil and it’s application. Chin. J. Geotech. Eng. 2004, 26, 83–87. (In Chinese) [Google Scholar]
- Harith, I.K.; Salman, E.E.; Hussien, M.L.; Mohammed, A.Y. Optimizing compressive strength of foamed concrete using stepwise regression. Discov. Appl. Sci. 2025, 7, 607. [Google Scholar] [CrossRef]
- Ullah, H.S.; Khushnood, R.A.; Ahmad, J.; Farooq, F. Predictive modelling of sustainable lightweight foamed concrete using machine learning novel approach. J. Build. Eng. 2022, 56, 104746. [Google Scholar] [CrossRef]
- Gupta, S.; Kashani, A.; Mahmood, A.H. Carbon sequestration in engineered lightweight foamed mortar—Effect on rheology, mechanical and durability properties. Constr. Build. Mater. 2022, 326, 126383. [Google Scholar] [CrossRef]
- Dung, N.T.; Unluer, C. Improving the Carbonation of Reactive MgO Cement Concrete via the Use of NaHCO3 and NaCl. J. Mater. Civ. Eng. 2022, 34, 04022189. [Google Scholar] [CrossRef]
- Shao, L.; Yu, W.; Du, X.; Shen, A.; Li, Y.; Ding, H.; Tao, S.; Wu, F. Investigating Lightweight Carbonation Curing of Waste Slurry Using Activated Magnesium Oxide: Performance Insights. Materials 2025, 18, 2084. [Google Scholar] [CrossRef]
- GB/T 50123-2019; Standard for Soil Test Methods. China Architecture & Building Press: Beijing, China, 2019.
- DL/T 5815-2020; Test Specification for Wall-Building Slurry in Hydropower and Water Conservancy Engineering. China Electric Power Press: Beijing, China, 2020.
- JTG 3430-2020; Specifications for Highway Geotechnical Testing. People’s Transportation Publishing House: Beijing, China, 2020.
- Vandeperre, L.J.; Al-Tabbaa, A. Accelerated carbonation of reactive MgO cements. Adv. Cem. Res. 2007, 19, 67–79. [Google Scholar] [CrossRef]
- Wang, Z.; Pu, L.; Yao, Y.; Yang, J.; Li, L.; Luo, J.; Zhu, S.; Zeng, Q.; Ruan, S. Unveiling the role of reactive magnesia and red mud in CO2-cured aerated concrete. J. Build. Eng. 2023, 10, 57–58. [Google Scholar] [CrossRef]
- Luo, K.; Li, J.; Lu, Z.; Wang, L.; Deng, X.; Hou, L.; Jiang, J. Preparation and performances of foamed hydraulic lime. Constr. Build Mater 2021, 290, 32–44. [Google Scholar] [CrossRef]
- Gao, L.; Meng, H.; Wan, H.; Hu, X.; Chen, C. Properties and microstructure of alkali-activated cementitious materials prepared with carbide slag-slag-fly ash solid waste. J. Cent. South Univ. 2023, 54, 1739–1747. (In Chinese) [Google Scholar] [CrossRef]
- Min, F.; Shen, Z.; Li, Y.; Yuan, D.; Chen, J.; Li, K. Solidification and carbonization experimental study on magnesium oxide in shield waste soil and its carbonization mechanism. Rock Soil Mech. 2024, 45, 364–374. (In Chinese) [Google Scholar] [CrossRef]
- Wang, X.; Shun, P.; Zhao, M.; Xing, S.; Feng, D.; Tang, L. Influence of different consolidation factors on moisture content and permeability of waste slurry. Environ. Eng. 2022, 40, 84–89. (In Chinese) [Google Scholar] [CrossRef]
- Yi, Y.; Liska, M.; Unluer, C.; Al-Tabbaa, A. Carbonating magnesia for soil stabilization. Can. Geotech. J. 2013, 50, 899–905. [Google Scholar] [CrossRef]
- Ye, Y. Rapid Stabilization of High-Water Content Muddy Soil with Reactive MgO Carbonization. Master’s Thesis, Southeast University, Nanjing, China, 2022. (In Chinese). [Google Scholar]
- Siva Soumya, B.; Sekhar, M.; Riottc, J.; Braun, J. Nonlinear regression model for spatial variation in precipitation chemistry for South India. Atmos. Environ. 2009, 43, 1147–1152. [Google Scholar] [CrossRef]
- Zhao, Y.; Du, Y.; Liu, F.; Chen, Y. Study on carbonation model for fly ash concrete based on multivariate nonlinear analysis. Concrete 2017, 3, 74–77, 81. (In Chinese) [Google Scholar] [CrossRef]
- Chen, X. Research on Unconsolidated Undrained Shear Characteristics of Calcareous Sand. Master’s Thesis, Guangxi University, Nanning, China, 2023. (In Chinese). [Google Scholar]
Disclaimer/Publisher’s Note: The statements, opinions and data contained in all publications are solely those of the individual author(s) and contributor(s) and not of MDPI and/or the editor(s). MDPI and/or the editor(s) disclaim responsibility for any injury to people or property resulting from any ideas, methods, instructions or products referred to in the content. |
© 2025 by the authors. Licensee MDPI, Basel, Switzerland. This article is an open access article distributed under the terms and conditions of the Creative Commons Attribution (CC BY) license (https://creativecommons.org/licenses/by/4.0/).