Abstract
Shallow-buried, closely spaced tunnels under bias loading often encounter stability challenges due to excavation-induced interaction effects. These effects are particularly significant in the middle rock pillar zone. To evaluate the influence of face lag distance on tunnel stability, the Georgia No. 1 Tunnel was selected as a case study. Numerical simulations and field monitoring were combined to analyze the deformation and stress evolution under different face lag distances. The analysis focused on ground surface settlement, vault displacement, and tunnel clearance convergence. The results indicate that ground surface settlement decreases notably as the face lag distance increases. When the face lag distance increased from 0.5 D to 2.0 D, the maximum settlement decreased by about 11.9%, with the absolute maximum measured value of approximately 3.48 mm. Stress concentration occurred mainly within 15 m behind the excavation face, suggesting that a face lag distance exceeding this range can effectively mitigate tunnel interaction effects. The biased tunnel side experienced greater vault settlement and convergence, requiring closer monitoring. An insufficient face lag distance amplifies deformation superposition, whereas an excessive one causes additional horizontal fluctuations. For the geological and structural conditions of the Georgia No. 1 Tunnel, a face lag distance of approximately 2.0 D provides an optimal balance between stability, safety, and construction efficiency. These findings offer practical guidance for the design and safe construction of shallow-buried twin tunnels under bias loading.
1. Introduction
Since the mid-20th century, highway tunnel engineering has advanced rapidly in parallel with the continuous expansion of transportation infrastructure. In recent decades, closely spaced tunnels have been increasingly adopted in both urban and mountainous regions due to their advantages of flexible alignment, reduced land occupation, lower construction costs, simplified procedures, and minimal topographic constraints [1,2,3,4]. Nevertheless, the excavation of such tunnels is often accompanied by complex stress redistribution [5] and strong mutual interference between construction sequences [6], which may easily induce surrounding rock instability and cracking of the lining structures. These problems not only pose challenges to construction safety but also threaten the long-term serviceability of tunnel structures [7].
To better understand the mechanical behavior of closely spaced tunnels, scholars have carried out both theoretical analyses and experimental investigations. For instance, Song et al. [8], based on random medium theory, refined the Parker method and proposed a simple yet accurate approach for predicting ground surface settlement, particularly suitable for shallow tunnels. Lin et al. [9] developed an analytical solution for shallow twin tunneling in viscoelastic geomaterials based on the complex variable theory, incorporating the equivalent three-dimensional effects of tunnel faces. Large-scale physical model tests have also been employed to investigate the stability of surrounding rocks in closely spaced tunnels [10,11,12]. These studies consistently demonstrate that surrounding rock displacement and principal stress can serve as effective indicators for assessing tunnel spacing. With increasing attention to the mechanical role of the middle rock pillar (MRP), many researchers have emphasized its critical importance in tunnel safety. Numerical simulation, owing to its efficiency, low cost, and reliability, has become a primary method for studying tunnel interactions. Finite element software such as Midas GTS NX 2019 (v2.1), ABAQUS 6.14.4, ADINA and FLAC-3D has been widely used to analyze the mechanical response and interaction mechanisms of shallow-buried, biased, and closely spaced tunnels with different face lag distances [13,14,15]. Wang [16] investigated tunnel excavation in Class V surrounding rock under varying advance lengths and excavation sequences, while Chen [17] simulated shallow-buried, biased granite tunnels under diverse construction conditions and identified the MRP as the weakest and most vulnerable section. Yao et al. [18] employed two-dimensional elastoplastic models to study the stress and deformation characteristics of the MRP under different lithological conditions, revealing that smaller spacing intensifies stress concentration and deformation. Liu and Zhou [19,20] further proposed the concept of rock-pillar zone division and assessed MRP stability using yield proximity criteria. Zhong et al. [21], through the analysis of ground surface settlement induced by mechanized twin-tunnel construction in mixed soil–rock strata, revealed the effects of geological conditions and construction parameters on ground deformation. Collectively, these findings demonstrate that the MRP serves as a crucial load-bearing zone governing the overall mechanical behavior of twin tunnels.
With respect to the influence of excavation sequence and face lag distance, previous studies have shown that the excavation of the second tunnel alters the orientation of principal stresses and redistributes the shear modulus, thereby inducing asymmetric deformation and uneven ground surface settlement. These effects are particularly pronounced in shallow-buried tunnels under bias loading, where geological heterogeneity further amplifies differential deformation and instability risks. Ng et al. [22] demonstrated that increasing face lag distance intensifies horizontal displacement in the first-excavated tunnel, while Dai et al. [23] found that stepwise excavation combined with a larger initial section effectively reduces disturbance to the central pillar. Gao [24] further observed that crown settlement and support forces are highly sensitive to face lag distance and are generally greater than those in single-tunnel conditions. Hence, face lag distance not only governs the spatial–temporal coupling between adjacent tunnels but also determines the stress transfer efficiency of the middle rock pillar.
Although the above studies have considerably advanced the understanding of tunnel–rock interaction, several key issues remain unresolved. In particular, the mechanism of face lag distance in large-section, shallow-buried, and closely spaced tunnels has not been systematically clarified. Under such complex conditions, alternate excavation of the two working faces repeatedly disturbs the middle rock pillar, while the coupled effects of face lag distance, bias loading, and shallow overburden on surrounding rock deformation and support response have not yet been quantitatively investigated in previous numerical studies.
To bridge this research gap, this study investigates the Georgia No. 1 Tunnel—a large-section, shallow-buried, and biased twin tunnel—through three-dimensional numerical simulations calibrated with field monitoring data. The effects of five different face lag distances on ground surface settlement, surrounding rock deformation, and rock-pillar stability are systematically analyzed. Compared with previous numerical or physical model studies, the novelty of this work lies in three aspects: it integrates real engineering conditions and validated field monitoring data to calibrate the numerical model, ensuring practical reliability; it systematically examines the mechanical response of a wide range of face lag distances under biased loading, revealing the critical interaction range between adjacent tunnels; and it combines deformation characteristics with safety evaluation, providing practical recommendations for deformation control in shallow-buried twin tunnels under asymmetric stress conditions.
2. Project Overview
2.1. Project Description
The Georgia No. 1 Tunnel, located at the starting section of the F3 contract of the E60 expressway, was chosen as the case study for this research. The expressway lies in central-western Georgia, in the outer Caucasus mountainous region, between the southern slope of the Greater Caucasus fold and the Lesser Caucasus fold belt (Figure 1). Tunnel No. 1 has a total length of 878.8 m, extending from chainage 0 + 992.70 to 1 + 871.50, of which 859.0 m is constructed by underground excavation. Both bores share the same cross-sectional design, with a width of ~13.0 m and a height of ~11.0 m, resulting in an excavation area of 116.0 m2.
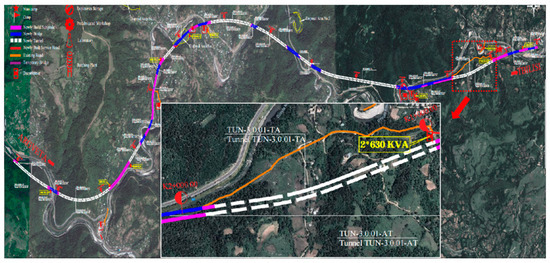
Figure 1.
Route diagram of tunnel No. 1 on highway E60 in Georgia.
According to the Code for Design of Railway Tunnels (TB 10003-2016) [25], tunnels with an excavation area greater than 100 m2 are classified as large-section tunnels. Therefore, Tunnel No. 1 belongs to this category. The minimum clear spacing between the two bores is 12.5 m. Within the mined section, the overburden depth ranges from 8.0 m to 94.0 m, with the minimum depth occurring near the portal. In the portal section, variations in topography and overburden thickness cause uneven stress distribution. When the deviation ratio of overburden thickness exceeds 0.25, the tunnel is considered to be under biased pressure. Therefore, Tunnel No. 1 can be characterized as a shallow-buried twin single-track tunnel subjected to biased pressure at the portal section.
2.2. Geological and Hydrological Conditions
The No. 1 Tunnel of the E60 Highway in Georgia is located between Karaguli and Zestafoni. The area is characterized by rugged terrain and steep slopes, with ground elevations ranging from approximately 200 to 500 m. The surface layer mainly consists of Quaternary gravelly sand–sandy gravel (gS–sG) and breccia, underlain by hard metamorphic bedrock mainly composed of pink-to-gray weathered Paleozoic granite (PzGr). The region experiences a humid climate, with an average annual rainfall of approximately 1200 mm, predominantly occurring between April and July. Surface water mainly originates from atmospheric precipitation and dissipates primarily through evaporation and surface runoff. The nearest surface water body, the Dzirula River, is located about 10–30 m below the tunnel alignment, and its water is clear and non-corrosive. According to lithological and hydrogeological conditions, groundwater occurs mainly as fissure water within the bedrock, with minor pore water in the overlying sediments. Field permeability tests revealed very low hydraulic conductivity values (on the order of 10−7–10−8 m/s), indicating that the rock mass has low overall permeability and only weak hydraulic connectivity with surface water bodies. Thus, the influence of groundwater on tunnel excavation can be reasonably neglected in the numerical simulations.
2.3. Tunnel Support System Description
The Georgia No. 1 tunnel was designed and constructed following the principles of the New Austrian Tunneling Method (NATM), adopting a full-face excavation approach throughout the construction. At the portal section, a B0 cross-sectional profile was employed (Figure 2), and the main structure was constructed using a composite lining. The excavation profile is a three-centered circular arch with an invert, measuring 12.8 m in width and 10.8 m in height. The minimum clear distance between the twin tunnels is 12.5 m. According to the criteria specified in the Code for Design of Highway Tunnels (JTG 3370.1-2018) [26] (Table 1), tunnels with an inter-tunnel clear distance less than one tunnel span are classified as closely spaced; therefore, this project meets the criterion for closely spaced tunnels.
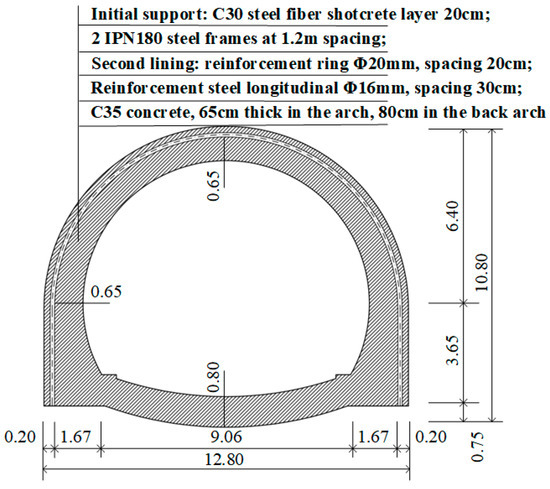
Figure 2.
Support diagram of composite lining structure.

Table 1.
Criterion for tunnel spacing classification [26].
3. Finite Element Model
3.1. Model Dimensions and Boundary Conditions
In the numerical simulation of the portal section of the Georgia No. 1 Tunnel, the Midas GTS NX 2019 finite element software was employed to analyze the mechanical responses of both the surrounding rock and the tunnel support under various excavation and lining scenarios. According to the Saint-Venant principle, the lateral boundaries were set at 3–4 times the tunnel span to minimize boundary effects and avoid their influence on the tunnel excavation zone, thereby ensuring a realistic simulation of the in situ stress environment [27].
The model width and length along the tunnel axis were set to 112 m and 60 m, respectively. The bottom boundary was located 35 m below the tunnel invert, approximately three times the tunnel height. The upper boundary coincided with the actual ground surface, corresponding to the tunnel portal zone, where the overburden depth ranges from approximately 8 to 20 m (all less than 35 m). Based on the geological investigation report, the subsurface profile consists of an upper dense gravel layer and an underlying weathered granite layer.
Boundary conditions were defined as follows. The upper surface was left free. Lateral boundaries were constrained in the X-direction to prevent horizontal movement, and front and rear faces were constrained in the Y-direction to restrict longitudinal displacement. The bottom boundary was fully fixed in all directions (X, Y, Z). The numerical model configuration is illustrated in Figure 3.
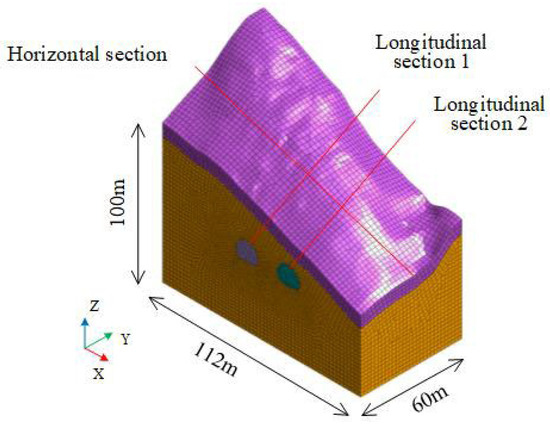
Figure 3.
Numerical calculation model diagram.
To simplify the modeling process and improve computational efficiency, and to ensure the reliability of the results, the following simplifying assumptions were made in the numerical analysis:
(1) The rock mass was assumed to be continuous, homogeneous, and isotropic, and was modeled as an ideal elastic–plastic material, whereas the tunnel lining was modeled as a linear elastic body.
(2) Interface elements between different geological layers were not defined, and relative slip between materials was neglected.
(3) The effects of groundwater and tectonic stresses were neglected, and only the stress–strain behavior of the surrounding rock under gravity was considered.
(4) Time-dependent effects during tunnel excavation were not taken into account.
3.2. Material Parameter Selection
Material parameters for numerical simulations were determined based on geological survey data and equivalent calculation parameters of the support structures, as summarized in Table 2. The rock mass was modeled using the Mohr-Coulomb elastoplastic model, while the primary support and secondary lining were simulated with elastic models. For element types, the surrounding rock was represented by 3D solid elements, whereas the primary support and secondary lining were modeled using 2D shell elements.

Table 2.
Physical and mechanical parameters of the model.
In tunnel support design, the equivalent elastic modulus of the composite primary support—comprising a steel arch and a layer of shotcrete—is determined based on the widely used equivalent stiffness principle. It can be expressed as:
where and denote the elastic moduli of the shotcrete and steel arch, respectively, while and represent their corresponding cross-sectional areas.
In the tunnel portal section, the primary support consists of a 0.2 m thick layer of C30 steel-fiber-reinforced shotcrete combined with double IPN180 steel arches spaced at 1.2 m. The secondary lining employs C35 reinforced concrete, with thicknesses of 0.8 m at the invert and 0.65 m at the crown. Assuming = 25 GPa and = 206 GPa, The equivalent elastic modulus adopted for the composite support system in the numerical model is = 68 GPa (see Appendix A for the derivation).
3.3. Numerical Simulation Scheme Design
Tunnel excavation in closely spaced tunnels induces mutual interference, especially repeated disturbance of the rock pillar between the bores [28,29,30]. To mitigate the cumulative effects of excavation-induced disturbance on the stability of the surrounding rock, and to ensure construction safety, the optimal face lag distance between adjacent excavation faces was determined based on project-specific conditions. This parameter defines the staggered excavation scheme for closely spaced tunnels. Five numerical simulation schemes were designed, as listed in Table 3, where D denotes the tunnel excavation diameter. In the numerical model, D was set to 12 m; therefore, excavation steps of 0.5 D, 1.0 D, 1.5 D, 2.0 D and 3.0 D correspond to 6 m, 12 m, 18 m, 24 m and 30 m, respectively.

Table 3.
Simulation scheme of tunnel excavation.
Tunnel excavation inevitably induces ground settlement by disturbing the surrounding rock mass. This study investigates how the longitudinal spacing between working faces affects the stability of the surrounding rock during full-face excavation. The excavation and support processes were simulated in a stepwise manner using the element activation–deactivation technique in MIDAS GTS NX 2019. The primary and secondary linings were represented by shell elements, and the surrounding rock by solid elements. At each excavation stage, the elements corresponding to the excavation zone were first deactivated, and the primary lining elements were then immediately activated to simulate the timely application of shotcrete at the tunnel face. This simplification may slightly underestimate the initial deformation; however, it does not significantly affect the long-term equilibrium response of the tunnel system. This sequential “excavation–support” procedure was repeated until completion of the full-face excavation.
After construction, typical sections were selected for settlement evaluation. By analyzing a transverse section located 24 m from the tunnel portal and two longitudinal sections along the axes of the left and right tunnels (as shown in Figure 3 and Figure 4), the influence of face lag distance on ground surface and surrounding rock deformation was systematically assessed.
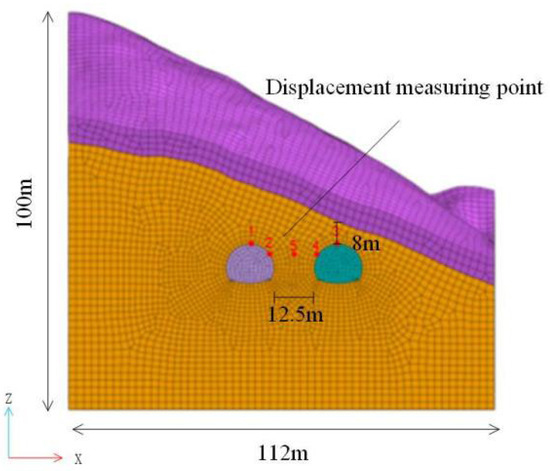
Figure 4.
Schematic diagram of key point selection in the analytical section. (Points 1 and 2 indicate the locations of the simulated monitoring points at the crown and haunch of the left tunnel, respectively. Points 3 and 4 indicate the locations of the simulated monitoring points at the crown and haunch of the right tunnel, respectively. Point 5 denotes the monitoring point in the middle rock pillar between the two tunnels).
4. Analysis of Numerical Simulation Results
4.1. Displacement Analysis
(1) Transverse Ground Surface Settlement Analysis
As shown in Figure 5, the ground surface settlement varies noticeably with face lag distance. At a face lag distance of 0.5 D, where D denotes the tunnel span, the maximum settlement reaches 3.95 mm. With increasing face lag distance, the maximum settlement decreases to 3.48 mm at 2.0 D—an 11.9% reduction relative to the 0.5 D case. Beyond this point, settlement values tend to stabilize. Notably, the maximum transverse surface settlement occurs on the left side of the middle rock pillar between the twin tunnels, mainly due to the superposition effect of sequential excavation. Table 4 presents a quantitative comparison of maximum settlements under different face lag distances.
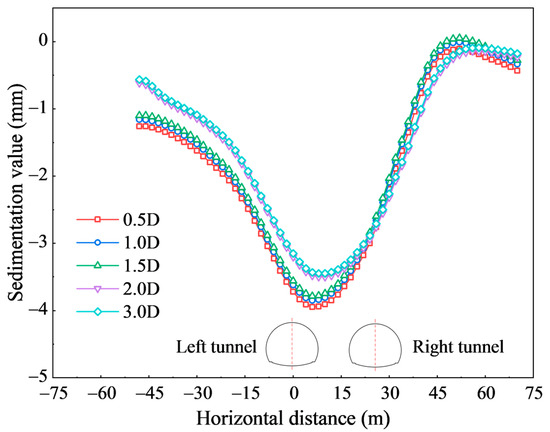
Figure 5.
Cross-sectional surface subsidence map.

Table 4.
Variation of maximum ground surface settlement with tunnel face staggering distance.
(2) Vertical Displacement Analysis of Surrounding Rock
As illustrated in Figure 6a,b, the vertical displacement of the tunnel vault evolves markedly throughout the excavation process under different face lag distances. Pronounced changes in displacement occur as the excavation face approaches the monitoring cross-section. Increasing the face lag distance effectively reduces the magnitude of vertical displacement, with negligible differences observed once the face lag distance exceeds 2.0 D. Across all cases, the vertical settlement of the left tunnel crown remains consistently greater than that of the right tunnel, reflecting the influence of biased pressure conditions [31]. For the left tunnel crown, the displacement–time curves corresponding to different face lag distances exhibit similar evolution patterns. Taking the 2.0 D case as a representative example, the displacement development can be divided into three distinct stages—slow, accelerating, and stable—corresponding to different phases of settlement progression. In the initial stage, when the excavation face is still distant from the observation section, the settlement increases gradually. As the face advances closer, the rate of settlement growth accelerates sharply, reaching its peak when the excavation face arrives at the section. Subsequently, the settlement rate decreases and stabilizes once the face has advanced approximately 15 m beyond the section. This behavior indicates that, as the stress field ahead of the advancing face becomes rebalanced, the arching effect and stress redistribution within the surrounding rock are gradually established, thereby diminishing the excavation-induced influence on this section. The right tunnel crown exhibits a comparable pattern of vertical displacement evolution.
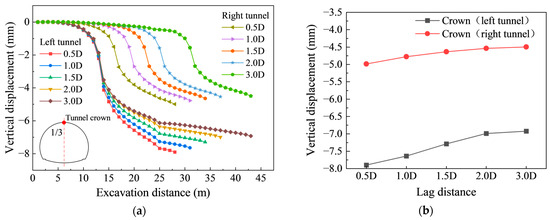
Figure 6.
Vertical displacement at the tunnel vault. (a) During excavation; (b) Final state.
In closely spaced tunnels, the thin middle rock pillar serves as a structural weak point, prone to instability or failure under stress. Figure 7a,b illustrates the evolution of vertical displacement in the core zone of the middle rock pillar under different face lag distances. During excavation, vertical displacement accumulates progressively, and the maximum rate occurs when the working face reaches the target cross-section. After excavation, the displacement rate decreases. The final vertical displacement reduces with increasing face lag distance and tends to stabilize once the lag distance exceeds 2.0 D, beyond which further increases have a negligible effect.
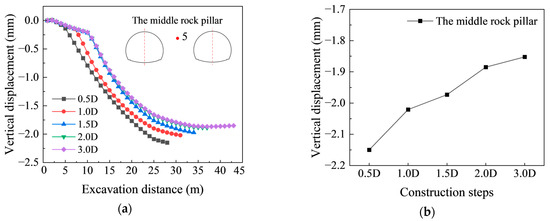
Figure 7.
Vertical displacement of the core zone in the middle rock pillar. (a) During excavation; (b) Final state.
(3) Analysis of Horizontal Displacement in Surrounding Rock
As shown in Figure 8a,b, the horizontal displacement at the tunnel waist exhibits a similar overall trend under different face lag distances. However, both the amplitude and duration of displacement fluctuations increase with greater face lag distance. The left tunnel generally shows larger horizontal displacement than the right due to the bias-loading effect. For example, at a face lag distance of 1.0 D, horizontal convergence at the monitoring point remains nearly stable while the excavation face is far from the target section. Once excavation approaches this section, displacement increases noticeably, and the influence extends approximately 15 m beyond it. As the face lag distance increases, the tunnel waist requires more excavation steps to reach deformation stability, rising from about 28 steps at 0.5 D to 37 steps at 2.0 D. This suggests that larger lag distances prolong the period of displacement fluctuation during excavation. Although the final magnitude of horizontal displacement remains comparable, extended fluctuations may raise the risk of local instability. Therefore, for greater face lag distances, more frequent monitoring and timely adjustment of temporary support are recommended to ensure construction safety.
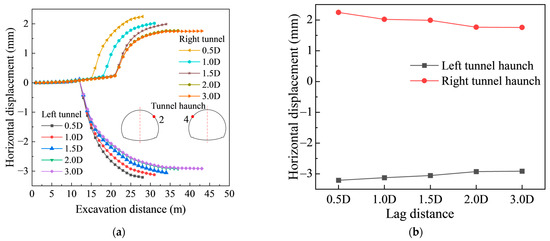
Figure 8.
Horizontal displacement at the tunnel haunch. (a) During excavation; (b) Final state.
As shown in Figure 9a,b, the horizontal displacement in the core zone of the middle rock pillar gradually increases with the excavation steps and shows a similar overall trend under different face lag distances. When the face lag distance is small, the stress fields and plastic zones of the preceding and subsequent tunnels overlap, leading to greater additional deformation of the pillar. However, once the face lag distance exceeds 2.0 D, the surrounding rock of the preceding tunnel has essentially completed stress redistribution and reached a stable state, while the arching effect develops progressively and independently. Consequently, the disturbance induced by the subsequent tunnel has a much weaker influence on the horizontal displacement of the middle rock pillar.
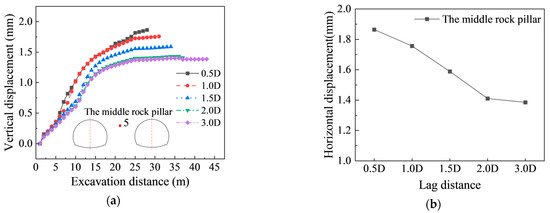
Figure 9.
Horizontal displacement in the core zone of the middle rock pillar. (a) During excavation; (b) Final state.
4.2. Stress Analysis
After excavation, stress redistribution occurs in the surrounding strata, forming distinct tensile and compressive zones around the tunnel. In this study, compressive stresses are defined as negative and tensile stresses as positive, unless otherwise specified. Analysis of these stress patterns allows for the early identification of potential failure zones and provides guidance for timely reinforcement of vulnerable areas [32,33,34].
Figure 10a,c illustrates the evolution of maximum principal stress at the tunnel haunch under varying face lag distances. While the peak principal stress values remain consistent across different face lag distances, significant stress fluctuations occur within 15 m behind the excavation face before stabilizing.

Figure 10.
Maximum principal stress distribution. (a) At the haunch; (b) In the core zone of the middle rock pillar; (c) Final stage.
In the core zone of the middle rock pillar (Figure 10b), the maximum principal stress stabilizes at −0.33 MPa, irrespective of the face lag distance. This stability mainly results from the symmetric tunnel geometry and the initial in situ stress field applied in the model. Under shallow-buried and biased loading conditions, despite differences in excavation sequence and face lag distance between the left and right tunnels, the stress within the middle rock pillar is dominated by superimposed compression. The principal stress is primarily governed by the overall overburden pressure and the self-weight of the surrounding rock, rather than by local excavation disturbances. Comparing the 2.0 D and 1.0 D cases shows that a smaller face lag distance requires fewer excavation steps to achieve the same stress reduction. This indicates that stress concentration and release are more pronounced, with stronger superimposition between the two tunnels. As the face lag distance increases, stress interaction gradually weakens, and the stress influence zones of the two tunnels become more separated. In summary, when the face lag distance reaches 2.0 D or greater, the superimposition between the twin tunnels is effectively mitigated, thereby enhancing the stability of the surrounding rock.
Figure 11a,c depicts the evolution of minimum principal stress at the tunnel haunches for different face lag distances during construction. With increasing face lag distance between the twin tunnels, the minimum principal stress values at the left and right haunches after excavation become nearly identical, reaching −0.73 MPa and −0.67 MPa, respectively. Noticeable stress variations occur within the target excavation section and extend approximately 15 m behind the tunnel face.

Figure 11.
Minimum principal stress distribution. (a) At the haunch; (b) In the core zone of the middle rock pillar; (c) Final stage.
Figure 11b presents the minimum principal stress in the core zone of the middle rock pillar. As the face lag distance increases, the extreme values of minimum principal stress in this zone remain nearly constant, eventually stabilizing at around −1.61 MPa. This suggests that the stress in the core of the rock pillar remains relatively stable, regardless of changes in face lag distance.
4.3. Analysis of Surrounding Rock Plastic Zones
Figure 12a–e shows the distribution of plastic zones in the surrounding rock under different face lag distances. The results indicate that plastic zones are mainly concentrated in the middle rock pillar and the haunch regions on both sides of the tunnels. In the numerical simulations, the Mohr–Coulomb yield criterion was employed. Using the 2.0 D face lag distance as an example, the combined effects of shallow burial depth and asymmetric loading lead to a significantly larger plastic zone in the surrounding rock of the deeper-buried tunnel than on the shallower side.
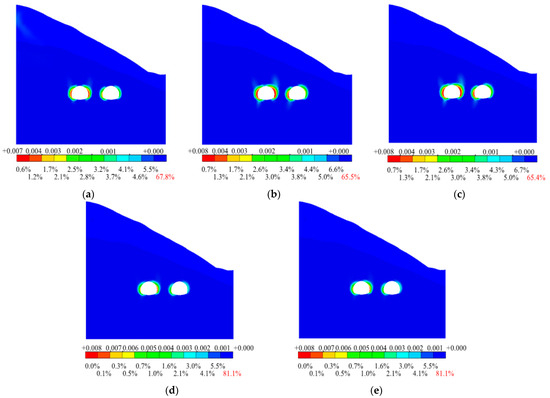
Figure 12.
Plastic zone distribution map of the surrounding rock. (a) Face lag distance = 0.5 D; (b) Face lag distance = 1.0 D; (c) Face lag distance = 1.5 D; (d) Face lag distance = 2.0 D; (e) Face lag distance = 3.0 D.
This indicates that the surrounding rock of the left tunnel may face higher risks upon completion of excavation, requiring enhanced monitoring. Overall, adjustments to the face lag distance have little effect on the maximum strain in the plastic zones. The peak plastic strain of the rock mass remains stable at approximately 0.008 across all face lag distances.
5. Monitoring Data Analysis
5.1. Monitoring Scheme
To investigate the deformation of the biased tunnel during construction and to validate the numerical simulation results [35], this study, in accordance with relevant technical specifications and construction guidelines, selected three primary monitoring parameters: ground surface settlement, vault settlement, and tunnel clearance convergence. The specific monitoring items and instruments used are listed in Table 5.

Table 5.
Monitoring Items and Instruments.
Monitoring sections were arranged at intervals of 10 m along the tunnel alignment. The vault settlement points and clearance convergence points were installed within the same cross-section, as shown in Figure 13. The monitoring frequency was determined according to Table 6, and the deformation control criteria for field monitoring are provided in Table 7.

Figure 13.
Schematic diagram of the layout of measuring points for surface subsidence.

Table 6.
Monitoring Frequency.

Table 7.
Monitoring project control values (unit: mm).
5.2. Analysis of Monitoring Results
(1) Ground surface settlement
The Y = 0 cross-section at the tunnel portal was selected to analyze the ground surface settlement evolution curve in the portal section, with monitoring points consistent with the numerical analysis (labeled DB-1 to DB-9). Figure 14 presents the settlement data from these nine monitoring points over a 45-day observation period. As shown in Figure 14, the stabilized ground surface settlement values at all monitoring points exhibit a characteristic settlement trough, which aligns with the numerical simulation results. Notably, the maximum settlement occurs in the middle rock pillar area between the parallel tunnels and shows a distinct inclination toward the deeper-buried tunnel side.
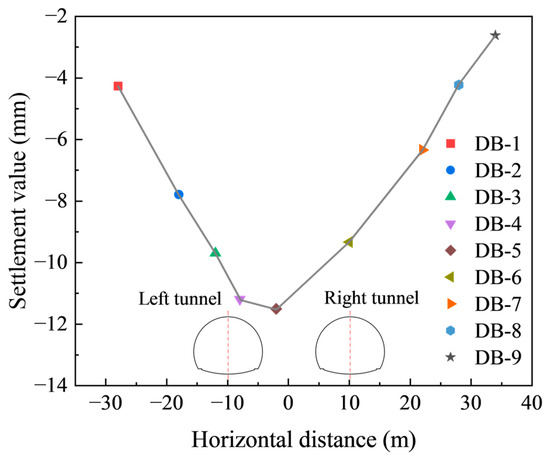
Figure 14.
Final ground surface settlement profile of monitoring points after 70 days.
(2) Crown Settlement and Haunch Convergence
Crown settlement and convergence serve as critical indicators directly reflecting surrounding rock deformation, significantly influencing construction quality and safety. The rationality of the construction scheme was validated through monitoring and analysis of crown settlement and convergence at monitoring cross-sections located 12 m, 24 m, and 36 m from the tunnel portal.
The curves presented in Figure 15a reveal the crown settlement characteristics of both tunnels at specific chainages. Overall, the settlement magnitude of the left tunnel consistently exceeds that of the right tunnel. At the Y = 24 m monitoring cross-section, the left tunnel exhibits a maximum settlement value of 12.03 mm, which remains within the specified control threshold of 20 mm.
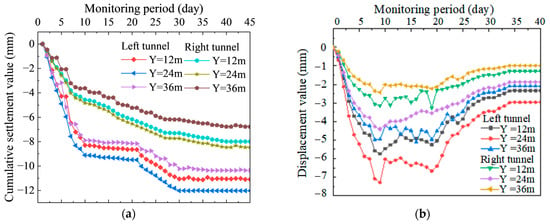
Figure 15.
Deformation curves of monitoring cross-sections of the left and right tunnels. (a) Crown settlement curves; (b) Haunch convergence curves.
These observations align with the simulation results, confirming both the accuracy of the numerical modeling and the rationality of the construction scheme. Furthermore, the left tunnel at the Y = 24 m cross-section exhibits deformation characteristics under unfavorable geological conditions, further enhancing the credibility of the simulation outcomes.
Figure 15b demonstrates the convergence patterns at different monitoring cross-sections of both tunnels. The convergence values at the tunnel haunches initially increase, then slightly decrease, and ultimately stabilize. Influenced by shallow burial depth and asymmetric loading, the left tunnel consistently exhibits greater convergence values compared to the right tunnel. The maximum convergence value occurs at the Y = 24 m cross-section, measuring 7.29 mm, below the alarm threshold of 20 mm.
5.3. Comparison Between Field Measurements and Numerical Simulations
A comparative analysis was conducted between the numerical results of the 2.0 D face lag distance scheme and the corresponding field monitoring data, as summarized in Table 8. The monitored parameters include DB-1–9 for ground surface settlement, GD-1–3 for vault settlement at cross-sections Y = 12 m, 24 m, and 36 m, and SL-1–3 for haunch convergence at the same sections.

Table 8.
Comparison of field monitoring and simulation results (unit: mm).
As shown in Table 8, the numerical results agree well with the field monitoring data in the overall trend, although the simulated values are slightly lower than the measured ones. The discrepancy mainly arises from the simplification of the rock mass as a continuous and isotropic medium, without considering the influence of local joint development and mechanical excavation-induced disturbance.
The simulation accuracy can be further improved in two ways:
(1) Refinement of deformation parameters: Local calibration of the elastic modulus and Poisson’s ratio using back-analysis or in situ tests can better align simulated and observed deformations;
(2) Incorporation of geological heterogeneity: Introducing stratigraphic zoning or stochastic field approaches can more realistically capture the spatial variability of ground properties.
Overall, all monitored deformations remained below the control thresholds (Table 7). The maximum ground surface settlement was less than 25 mm, and both vault settlement and clearance convergence were below 15 mm, confirming that the construction scheme with a 2.0 D face lag distance ensures safety and stability.
Table 9 presents the RMSE, MAE, and MAPE values for key deformation indicators, including ground surface settlement, crown settlement, and tunnel convergence. The number of data points (N) corresponds to the monitoring number used for each type of deformation. Due to idealized assumptions such as soil homogeneity and isotropy, as well as the neglect of rock joints, the simulated results are generally lower than the measured values, although the overall trends are consistent. In tunneling simulations under complex geological and construction conditions, an MAPE within 20–40% is generally considered acceptable. Therefore, the present results indicate that the adopted numerical model can reasonably capture the overall deformation behavior and trends. Future calibration by adjusting local stiffness or joint parameters could further reduce the MAPE and improve model accuracy.

Table 9.
Comparison between field monitoring and numerical simulation results.
6. Discussion
The face lag distance exerts a controlling influence on stress redistribution and ground deformation during sequential twin-tunnel excavation. When the face lag distance is small (≤1.0 D), the simultaneous unloading of two faces intensifies stress superposition in the middle rock pillar zone, resulting in higher compressive stress concentration and pronounced ground settlement. Similar stress interaction and stiffness degradation were observed by Meng et al. [36] in clayey ground, who attributed asymmetric settlement to shear stiffness reduction and principal stress rotation between adjacent tunnels. Laboratory and infrared monitoring by Shen et al. [37] further revealed asynchronous deformation of twin tunnels, with maximum displacement concentrated at the arch shoulder and crown—consistent with the stress concentration pattern identified in this study.
The deformation response observed in both numerical and field data reflects the sequential interaction between the two advancing faces and the corresponding stress release pattern. During the excavation of the first tunnel, lateral stress concentration promotes asymmetric deformation toward the side of the second tunnel. When the second face advances, the pre-disturbed stress field facilitates local yielding of the pillar rock, producing cumulative settlement and shear deformation. This process mirrors the progressive stress relaxation and stiffness recovery observed in large-section sequential tunneling under shallow overburden (Xu et al. [38]). As the face lag distance increases, the stress field in the first-excavated tunnel stabilizes before the second tunnel advances, forming a complete compressive arch that provides a more stable load-bearing structure. Consequently, the maximum tensile stress around the crown and the plastic zone extent are reduced, while the ground surface settlement curve becomes flatter.
The attenuation of coupled deformation with increasing face lag distance highlights a strong stress–displacement coupling mechanism. Du et al. [39] confirmed that reinforcement of the face front and crown can effectively suppress stress relaxation in shallow soft-soil tunnels, emphasizing the significance of excavation sequence and face stabilization. Similarly, Zheng et al. [40] demonstrated that optimized advance length and secondary lining timing balance construction safety and efficiency by limiting deformation amplitude. When the face lag distance exceeds approximately 2.0 D, further increase yields negligible variation in either stress redistribution or displacement, implying mechanical decoupling between the two faces. This threshold aligns with Liu et al. [41] for mixed ground and Zhou et al. [42], who developed a quantitative face stability model showing that adequate pre-reinforcement (e.g., grouting or core-soil reservation) significantly enhances the stability coefficient with minimal cost.
Integrating both numerical and field observations, a face lag distance of about 15 m (≈1.3 D) for the Georgia No. 1 project ensures stress relief in the middle rock pillar zone while maintaining ground surface settlement within allowable limits. Beyond this value, improvement in deformation control is marginal, whereas construction duration and cost increase notably. For shallow-buried tunnels subjected to asymmetric overburden and bias loading, a face lag distance of 1.5–2.0 D provides a practical equilibrium between structural safety and construction progress.
Under bias loading, the deformation asymmetry between left and right tunnels becomes more evident. Although the numerical model simplifies the geological heterogeneity, supports time-dependence, and groundwater effects, it captures the essential coupling mechanism between stress redistribution and displacement evolution. Future work should adopt three-dimensional time-dependent analyses incorporating anisotropic material behavior, staged support installation, and stochastic ground variability. Coupling such models with continuous monitoring-based inverse analysis will improve predictive accuracy and extend the applicability of the proposed design recommendations to various lithological and construction conditions.
7. Conclusions
This study investigated the Georgia No. 1 Tunnel Project through integrated numerical simulations and field monitoring, focusing on the construction behavior of closely spaced tunnels under shallow burial and asymmetric loading with varying face lag distances. The following discussion interprets the coupled stress–displacement responses, highlights the interaction mechanisms, and evaluates their engineering implications.
(1) Ground surface settlement and vertical displacement of the surrounding rock decreased markedly with increasing face lag distance. When the face lag distance increased from 0.5 D to 2.0 D, the maximum ground surface settlement was reduced by approximately 11.9%, whereas a further increase from 2.0 D to 3.0 D led to only a 1.4% reduction, indicating that the influence becomes negligible beyond 2.0 D. The horizontal displacement at the tunnel haunch was only slightly affected. These results indicate that increasing face lag distance effectively mitigates ground deformation by reducing the mutual disturbance between the two excavation faces, leading to a more uniform and stable settlement pattern.
(2) With increasing face lag distance, stress redistribution in the surrounding rock becomes progressively stabilized. Stress variations are mainly concentrated in the middle rock pillar and haunch zones, particularly within approximately 15 m behind the excavation face, where the plastic zone is more extensive on the bias-loaded side. As the rear tunnel advances farther behind the leading face, the stress release and load transfer zones become more spatially separated, reducing overlapping unloading effects and lowering the stress concentration. This behavior reflects a gradual transition from strong mechanical interaction to relative decoupling between the twin tunnels when the face lag distance approaches about 2.0 D.
(3) Based on both numerical simulation and field monitoring data, maintaining a minimum face lag distance of about 15 m between excavation faces is recommended to effectively control stress interaction and surface deformation. Under the geological and structural conditions of the Georgia No. 1 Tunnel—comprising weathered granitic and sedimentary strata, shallow overburden, and full-face excavation under asymmetric loading—a 2.0 D face lag distance represents an optimal configuration that balances construction stability, safety, and schedule efficiency. Increasing the face lag distance beyond this range offers limited additional benefit but may unnecessarily prolong construction duration.
(4) The conclusions drawn from this study are case-specific and primarily reflect the mechanical and geological characteristics of the Georgia No. 1 site. The numerical modeling assumes continuous, homogeneous rock properties and time-independent support stiffness, which may simplify the actual conditions where jointed rock mass, variable grouting effectiveness, and time-dependent creep may influence behavior. Future research should incorporate stochastic field characterization, parametric uncertainty, and time-dependent support effects to enhance predictive robustness. In particular, boundary condition sensitivity and heterogeneous rock behavior remain important topics for future research, as their consideration could further improve model reliability and applicability. Extending the analysis to different ground classes and excavation methods (e.g., partial-face or sequential excavation) would also enhance the generality of the findings and support a more adaptive design framework for closely spaced tunnels.
Author Contributions
Conceptualization, Z.S.; Validation, Z.S. and F.-M.D.; Formal analysis, J.-H.G.; Investigation, J.-H.G.; Resources, F.-M.D.; Data curation, J.-H.G., F.-M.D. and X.-X.T.; Writing—original draft, Z.S.; Visualization, X.-X.T.; Supervision, Z.-L.C.; Project administration, Z.-L.C.; Funding acquisition, Z.-L.C. All authors have read and agreed to the published version of the manuscript.
Funding
This work was financially supported by the National Natural Science Foundation of China (No. 52178393) and the Key Scientific Research Project of China Road and Bridge Corporation, Georgia Branch (No. CRBC(G)-E60(F3)-S1-C-208).
Institutional Review Board Statement
This study did not involve human participants or animals; hence, ethical approval was not applicable.
Informed Consent Statement
This study did not involve human participants; therefore, informed consent was not required.
Data Availability Statement
The raw data supporting the conclusions of this article will be made available by the authors on request.
Conflicts of Interest
Authors Zhen Shen and Fa-Ming Dai were employed by the company China Communications Construction Group Co., Ltd. The remaining authors declare that the research was conducted in the absence of any commercial or financial relationships that could be construed as a potential conflict of interest.
Appendix A
Mechanical Parameters of Primary Support and Secondary Lining
The primary support consists of C30 steel-fiber-reinforced shotcrete and IPN180 steel arches. The elastic modulus of the shotcrete is 25 GPa, while that of the steel arch is 206 GPa. The steel arch is composed of two IPN180 I-beams, with a total cross-sectional area of 0.0112 m2. The shotcrete has a thickness of 0.20 m, and for a unit length of 1.0 m, the corresponding sectional area is taken accordingly.
The equivalent elastic modulus of the primary support is obtained by substituting the above parameters into the stiffness equivalence formula (Equation (2)).
The secondary lining adopts C35 reinforced concrete, with an elastic modulus of 30 GPa. The concrete thickness varies from 0.65 m at the arch shoulders to 0.80 m at the crown, yielding an average thickness of 0.725 m. The reinforcement arrangement in the invert consists of circumferential bars of Φ20 mm at 0.20 m spacing and longitudinal bars of Φ16 mm at 0.30 m spacing, with a steel elastic modulus of 200 GPa. The total reinforcement area is approximately 0.0054 m2. The equivalent elastic modulus of the secondary lining is obtained by substituting the above parameters into the stiffness equivalence formula (Equation (2)).
References
- Hou, F.; Liu, C.; Wang, K.; Yuan, Z.; Li, T.; Zhou, S. Net Distance Optimization of Super-Large Section Tunnel Using New Elastoplastic-Damage Model Combining Tensile and Shear Yield Modes. Arab. J. Geosci. 2021, 14, 2657. [Google Scholar] [CrossRef]
- Jiang, Q.; Song, S.; Li, T.; Wang, K.; Gu, R. Study on Surrounding Rock Stability of Small Clear-Distance Twin Highway Tunnel with Eight Lanes. Geotech. Geol. Eng. 2019, 37, 593–598. [Google Scholar] [CrossRef]
- Shi, C.; Cao, C.; Lei, M. Construction Technology for a Shallow-Buried Underwater Interchange Tunnel with a Large Span. Tunn. Undergr. Space Technol. 2017, 70, 317–329. [Google Scholar] [CrossRef]
- Wang, C.; Pi, X.Q. A Study on the Influence by Karst on the Stability of Surrounding Rock in Neighborhood Tunnel. Adv. Mater. Res. 2012, 446–449, 2177–2181. [Google Scholar] [CrossRef]
- Teng, J.; Tang, J.; Zhang, C.; Zhang, Y. Distribution and Control of Surrounding Rock Pressure in Shallow-Buried Eccentric Twin Tunnels with Small Clear Distance. J. Undergr. Space Eng. 2018, 14, 761–769. (In Chinese) [Google Scholar]
- Li, W.; Deng, X.; Wang, W.; Xie, B.; Zou, J. Study on Reasonable Construction Method of Steep-Slope Eccentric Twin Tunnel with Small Clear Distance. J. Railw. Sci. Eng. 2016, 13, 1135–1142. [Google Scholar] [CrossRef]
- Gao, X.; Yao, A. Deformation Characteristics and Instability Mechanism of Transportation Hub under Downward Traversal Conditions of the Double-Track Super-Large Diameter Shield Tunnel. Geohazard Mech. 2024, 2, 131–142. [Google Scholar] [CrossRef]
- Zhou, P.; Song, Z.; Wang, J.; Zhang, Y.; Tian, X. Prediction Method of Ground Settlement in Eccentric Tunnel Based on Random Medium Theory. Chin. J. Geotech. Eng. 2025, 47, 589–598. [Google Scholar] [CrossRef]
- Lin, L.; Chen, F.; Lu, Y.; Li, D. Complex Variable Function Solution for Shallow-Buried Twin Tunnel Excavation in Viscoelastic Geomaterials Considering Buoyancy and Equivalent 3D Face Effects. Appl. Math. Model. 2021, 91, 149–185. [Google Scholar] [CrossRef]
- Li, L.; Shang, C.; Chu, K.; Zhou, Z.; Song, S.; Liu, Z.; Chen, Y. Large-Scale Geo-Mechanical Model Tests for Stability Assessment of Super-Large Cross-Section Tunnel. Tunn. Undergr. Space Technol. 2021, 109, 103756. [Google Scholar] [CrossRef]
- Liu, C.; Li, S.; Zhou, Z.; Li, L.; Wang, K.; Qin, C. Model Test Study on Spatial Deformation Law of Surrounding Rock for Super-Large Section and Shallow Buried Tunnels. Geotech. Test. J. 2019, 42, 703–724. [Google Scholar] [CrossRef]
- Jia, Y.; Ouyang, A.; Wang, S.; Liang, X.; Wang, B.; Liu, C.; Ye, F. Development and Application of Model Test System for Reconstruction and Expansion of Existing Shallow Single-Hole Tunnel into Twin-Arch Tunnel. Adv. Civ. Eng. 2021, 2021, 6656165. [Google Scholar] [CrossRef]
- Sun, Y.; Xu, S.; Xu, C.; Huang, W.; He, J.; Rong, Y.; Zheng, F.; Ding, L. Stress and Deformation of Surrounding Rock and Support Structure of Super-Large Cross-Section Tunnel under Different Excavation Methods. Appl. Sci. 2024, 14, 7025. [Google Scholar] [CrossRef]
- Huang, Y.; Fang, T.; Wang, N. Excavation Method Comparison and Optimization for a Super Large Cross-Section Tunnel. Appl. Sci. 2024, 14, 6544. [Google Scholar] [CrossRef]
- Islam, M.S.; Iskander, M. Three-Dimensional Numerical Investigation of Ground Settlement Caused by Side-by-Side Twin Tunnels. Tunn. Undergr. Space Technol. 2025, 159, 106509. [Google Scholar] [CrossRef]
- Wang, H.; Chen, W.; Chen, P.; Tian, H.; Cao, J.; Zhao, W. Optimization of Cross-Section Shape and Reasonable Spacing for Shallow-Buried Large-Span Twin Tunnels with Small Clear Distance. Rock Soil Mech. 2011, 32, 641–646. [Google Scholar] [CrossRef]
- Chen, Q.; Zhao, L.; Xie, X.; He, C.; Cao, Y. Study on Reasonable Spacing of Shallow-Buried Eccentric Large-Span Twin Tunnels in Granite Residual Soil. J. Cent. S. Univ. (Sci. Technol.) 2015, 46, 3475–3480. [Google Scholar] [CrossRef]
- Yao, Y.; He, C.; Xie, Z. Mechanical Characteristics and Reinforcement Measures of Rock Wall in Twin Tunnels with Small Clear Distance. Rock Soil Mech. 2007, 28, 1883–1888. [Google Scholar] [CrossRef]
- Liu, Y.; Zhou, Y. Partition and Reinforcement Method of Inter-Rock Pillar in Soft Rock Twin Tunnels with Small Clear Distance. J. Undergr. Space Eng. 2013, 9, 373–379. [Google Scholar]
- Xu, X.; Song, Z.; Tian, X.; Ding, L.; Sun, Y.; Zhao, J. Analysis on the Supporting Effect of Micro Steel Pipe Pile–Anchor System for Tunnel Portal Slope Based on Incremental Method. Mod. Tunn. Technol. 2024, 61, 118–128. [Google Scholar] [CrossRef]
- Zhong, Z.; Li, C.; Liu, X.; Fan, Y.; Liang, N. Analysis of Ground Surface Settlement Induced by the Construction of Mechanized Twin Tunnels in Soil-Rock Mass Mixed Ground. Tunn. Undergr. Space Technol. 2021, 110, 103746. [Google Scholar] [CrossRef]
- Ng, C.W.W.; Lee, K.M.; Tang, D.K.W. Three-Dimensional Numerical Investigations of New Austrian Tunnelling Method (NATM) Twin Tunnel Interactions. Can. Geotech. J. 2004, 41, 523–539. [Google Scholar] [CrossRef]
- Dai, J.; Tian, G.; Xiong, X. Optimization of Excavation Method for Twin Tunnels with Small Clear Distance Based on Rock Pressure Influence. Sci. Technol. Eng. 2019, 19, 307–311. [Google Scholar]
- Gao, Y.; Zhang, Z. Analysis of Lag Distance in Sequential Construction of Shallow-Buried Twin Tunnels in Soft Soil. J. Undergr. Space Eng. 2015, 11, 780–784, 816. [Google Scholar]
- Ministry of Railways of the People’s Republic of China. Code for Design of Railway Tunnels (TB 10003-2016); China Railway Publishing House: Beijing, China, 2016. (In Chinese) [Google Scholar]
- Ministry of Transport of the People’s Republic of China. Code for Design of Highway Tunnels (JTG 3370.1-2018); China Communications Press: Beijing, China, 2018. (In Chinese) [Google Scholar]
- Song, Z.; Wang, T.; Zhou, J.; Yu, W. Construction Optimization and Stress Characteristics of Shallow-Buried Eccentric Large-Section Tunnel. J. Undergr. Space Eng. 2017, 13, 459–468. [Google Scholar]
- Pirastehfar, K.; Shivaei, S.; Sadaghiani, M.H.; Nikooee, E. 3D Numerical Investigation of the Effects of Driving of the New Mechanized Tunnel on Existing Segmental Linings and Ground Surface Settlements—A Case Study: Shiraz Metro Line 2. Int. J. Geotech. Eng. 2022, 16, 878–889. [Google Scholar] [CrossRef]
- Das, R.; Singh, P.K.; Kainthola, A.; Panthee, S.; Singh, T.N. Numerical Analysis of Surface Subsidence in Asymmetric Parallel Highway Tunnels. J. Rock Mech. Geotech. Eng. 2017, 9, 170–179. [Google Scholar] [CrossRef]
- Zheng, F.; Li, W.; Song, Z.; Wang, J.; Zhang, Y.; Liu, N.; Xiao, K.; Wang, Y. Construction Stability Analysis and Field Monitoring of Shallowly Buried Large-Section Tunnels in Loess Strata. Water 2024, 16, 2192. [Google Scholar] [CrossRef]
- Wang, H.; Wu, L.; Jiang, M. Viscoelastic Ground Responses around Shallow Tunnels Considering Surcharge Loadings and Effect of Supporting. Eur. J. Environ. Civ. Eng. 2020, 24, 2306–2328. [Google Scholar] [CrossRef]
- Liu, S.; Shi, Y.; Zhao, Y.; Sun, R. Interaction and Control Measures of Shallow-Buried Shield Twin Tunnels with Small Clear-Distance. Mag. Civ. Eng. 2021, 8, 10801. [Google Scholar] [CrossRef]
- Wang, H.N.; Wu, L.; Jiang, M.J.; Song, F. Analytical Stress and Displacement Due to Twin Tunneling in an Elastic Semi-infinite Ground Subjected to Surcharge Loads. Int. J. Numer. Anal. Methods Geomech. 2018, 42, 809–828. [Google Scholar] [CrossRef]
- Yu, Q.; Song, Z.; Du, C.; Dai, Z.; Yin, S.; Soltanian, M.R.; Soltanian, M.; Liu, W. Analysis of Asymmetric Stress Ratio in Shallow Buried Tunnels. KSCE J. Civ. Eng. 2020, 24, 1924–1931. [Google Scholar] [CrossRef]
- Liu, L.; Song, Z.; Li, X. Artificial Intelligence in Tunnel Construction: A Comprehensive Review of Hotspots and Frontier Topics. Geohazard Mech. 2024, 2, 1–12. [Google Scholar] [CrossRef]
- Meng, F.; Chen, R.; Wu, H.; Cheng, H. Evaluating Closely Spaced Twin-Tunnelling-Induced Shear Stiffness Change by Subsurface Settlement in Clayey Ground. Environ. Earth Sci. 2020, 79, 326. [Google Scholar] [CrossRef]
- Shen, F.; Song, Y.; Zhao, W.; Wang, J.; Zheng, J.; Shao, Z. Experimental Study on Deformation Failure Mechanism of Surrounding Rocks for the Deep-Buried Twin Tunnels in Inclined Layered Strata during the Excavation. Rock Mech. Rock Eng. 2023, 56, 2311–2331. [Google Scholar] [CrossRef]
- Xu, S.C.; Liu, T.Y.; Jin, C.Y. Study on Stability of Surrounding Rock in Shallow Tunnel under Unsymmetrical Pressure. Appl. Mech. Mater. 2013, 353–356, 1529–1533. [Google Scholar] [CrossRef]
- Du, J.; Mei, Z.R.; Chen, Y.Z. Tunnel Face Stability Study in Soft Shallow Tunnel. Adv. Mater. Res. 2014, 1079–1080, 170–176. [Google Scholar] [CrossRef]
- Zheng, H.; Li, P.; Ma, G. Stability Analysis of the Middle Soil Pillar for Asymmetric Parallel Tunnels by Using Model Testing and Numerical Simulations. Tunn. Undergr. Space Technol. 2021, 108, 103686. [Google Scholar] [CrossRef]
- Liu, X.; Suliman, L.; Zhou, X.; Abd Elmageed, A. Parallel Tunnel Settlement Characteristics: A Theoretical Calculation Approach and Adaptation Analysis. Geomech. Eng. 2022, 28, 225–237. [Google Scholar] [CrossRef]
- Zhou, G.-N.; Yang, T.-T.; Sun, Z.; Li, H.; Cheng, Y.; Song, Z.-P.; Han, J.-J. Investigation of Quantitative Evaluation Method and Engineering Application of Shallow Buried Tunnel Face Stability. Appl. Sci. 2022, 12, 6656. [Google Scholar] [CrossRef]
Disclaimer/Publisher’s Note: The statements, opinions and data contained in all publications are solely those of the individual author(s) and contributor(s) and not of MDPI and/or the editor(s). MDPI and/or the editor(s) disclaim responsibility for any injury to people or property resulting from any ideas, methods, instructions or products referred to in the content. |
© 2025 by the authors. Licensee MDPI, Basel, Switzerland. This article is an open access article distributed under the terms and conditions of the Creative Commons Attribution (CC BY) license (https://creativecommons.org/licenses/by/4.0/).