Article

OGS-YOLOv8: Coffee Bean Maturity Detection Algorithm Based on Improved YOLOv8

1
School of Computer Science and Engineering, Guangdong Ocean University, Yangjiang 529568, China
2
College of Electronic and Information Engineering, Guangdong Ocean University, Zhanjiang 524088, China
*
Author to whom correspondence should be addressed.
Appl. Sci. 2025, 15(21), 11632; https://doi.org/10.3390/app152111632 (registering DOI)
Submission received: 28 September 2025 / Revised: 23 October 2025 / Accepted: 23 October 2025 / Published: 31 October 2025
(This article belongs to the Section Agricultural Science and Technology)

Abstract

This study presents the OGS-YOLOv8 model for coffee bean maturity identification, designed to enhance accuracy in identifying coffee beans at different maturity stages in complicated contexts, utilizing an upgraded version of YOLOv8. Initially, the ODConv (full-dimensional dynamic convolution) substitutes the convolutional layers in the backbone and neck networks to augment the network’s capacity to capture attributes of coffee bean images. Second, we replace the C2f layer in the neck networks with the CSGSPC (Convolutional Split Group-Shuffle Partial Convolution) module to reduce the computational load of the model. Lastly, to improve bounding box regression accuracy by concentrating on challenging samples, we substitute the Inner-FocalerIoU function for the CIoU loss function. According to experimental results, OGS-YOLO v8 outperforms the original model by 7.4%, achieving a detection accuracy of 73.7% for coffee bean maturity. Reaching 76% at mAP@0.5, it represents a 3.2% increase over the initial model. Furthermore, GFLOPs dropped 26.8%, from 8.2 to 6.0. For applications like coffee bean maturity monitoring and intelligent harvesting, OGS-YOLOv8 offers strong technical support and reference by striking a good balance between high detection accuracy and low computational cost.

1. Introduction

Coffee, tea, and cocoa are recognized as the three principal beverages globally. This crop is a beverage with significant economic value, ranking as the second largest commodity globally, following crude oil. Since the onset of the 21st century, the global coffee industry has experienced rapid development, attributed to the enhancement of consumer purchasing power [1]. In 2023, global coffee consumption amounted to 10.62 million tons, reflecting a year-on-year growth of 2.2%. Research indicates that coffee comprises numerous bioactive compounds that may lower the risk of diseases including stroke, heart failure, diabetes, and cancer [2]. In the context of the swift advancement of the global coffee industry, China’s coffee sector has experienced significant growth, establishing itself as a key participant in global coffee production, trade, and consumption. The significance of coffee in various dimensions of our country’s tropical agricultural economy, international trade, and the lives of its citizens has become more pronounced [3]. To enhance the competitiveness of the coffee industry, accurate detection of coffee bean maturity is essential. The quality of coffee beans is directly associated with their maturity level. Accurate maturity detection is essential for optimizing coffee bean harvesting timing, enhancing coffee bean quality, and maximizing the economic benefits of the coffee industry. The coffee bean picking industry is progressively shifting from manual to automated methods, influenced by advancements in computer hardware and artificial intelligence technology. The rapid and precise identification of coffee bean maturity is essential for enhancing the automation of intelligent picking.
The remainder of this paper is organized as follows: Section 2 examines pertinent advancements in crop maturity detection research within the object detection field. Section 3 describes the baseline YOLOv8 network architecture, the dataset used in this study, and the enhancements made to the suggested OGS-YOLOv8 model. In Section 4, the experimental setup and evaluation metrics are described. Comparative experiments are used to evaluate the effects of various dynamic convolutions, lightweight convolutions, and loss functions on the OGS-YOLOv8 model’s performance. In Section 5, the overall performance of the final model is thoroughly analyzed, including the evaluation of each improvement module’s contribution through ablation experiments, performance comparison with mainstream models, and visualization of model effectiveness. The limitations of the study are also explained. The main points of this paper are summed up in Section 6, which also suggests areas for further research.

2. Related Work

Currently, deep learning is extensively applied in the domain of target detection. Significant advancements have been achieved by both domestic and international scholars in the classification of crop maturity levels through the application of deep learning techniques. Researchers have successfully detected the maturity of bananas [4], mangoes [5], tomatoes [6], and other fruits by integrating machine vision with spectral analysis methods. Liu Yang et al. [7] proposed a method for detecting tomato maturity utilizing the original YOLOv5 model, aimed at facilitating online non-destructive automatic detection during the tomato cultivation process. The weight size of the model was 15.9 M, and its average accuracy was 97.4%. Ma Pengwei et al. [8] employed a lightweight YOLOv7MCA for the classification and identification of grape maturity. This method effectively detects grape fruits across multiple targets, both in near and distant views. Zhou Tao et al. [9] developed a real-time algorithm for detecting pineapple maturity targets, utilizing an enhanced version of YOLOv8, with the objective of facilitating the automatic harvesting of pineapples. Tian Youwen et al. [10] utilized MobileNetV3 in conjunction with the YOLOv8 backbone to improve the network’s capacity for extracting blueberry feature information, thus facilitating the effective detection of blueberries at various maturity levels. An enhanced CES-YOLOv8 network architecture was proposed by Chen Yongkui et al. [11] to improve the precision and effectiveness of automated strawberry ripeness detection. In comparison to the original YOLOv8 network, this model made notable gains in detection accuracy, recall, and F1-score under complicated environmental settings by integrating the ConvNeXt V2 module and ECA attention mechanism while optimizing the loss function. Despite notable advancements in the maturity detection of various crops, the detection of coffee bean maturity continues to encounter multiple challenges. In densely populated scenes, occlusion among coffee beans may result in missed and false detections. Additionally, complex environmental noise can adversely affect the model’s detection performance, thereby diminishing accuracy. Moreover, current models exhibit structural complexity and high computational demands, leading to reduced detection efficiency and challenges in fulfilling the real-time needs of practical applications. This study proposes an enhanced YOLOv8-based method for detecting coffee bean maturity, termed OGS-YOLOv8. This approach aims to maintain a lightweight model while enhancing recognition accuracy, thereby offering novel research insights for efficient and precise target identification.
The main contributions of this paper are as follows:
  • Introducing ODConv: We provide ODConv, a multidimensional dynamic attention mechanism that optimizes computational efficiency and greatly improves the model’s ability to capture delicate properties of coffee beans.
  • A thin module CSGSPC was created by: We examined and fixed the partial convolutions’ “information silo” problem. Our developed GS-PConv avoids the accuracy degradation often associated with conventional lightweight approaches by implementing a novel batch shuffle operation that considerably decreases computing complexity while assuring effective information flow between channels.
  • Proposing the Inner-FocalerIoU loss function: We present the Inner-FocalerIoU loss function to tackle the problem of sample imbalance across the dataset’s maturity phases. This method greatly improves the model’s detection accuracy by concentrating the regression process on challenging and minority samples.

3. Materials and Methods

3.1. Dataset Construction

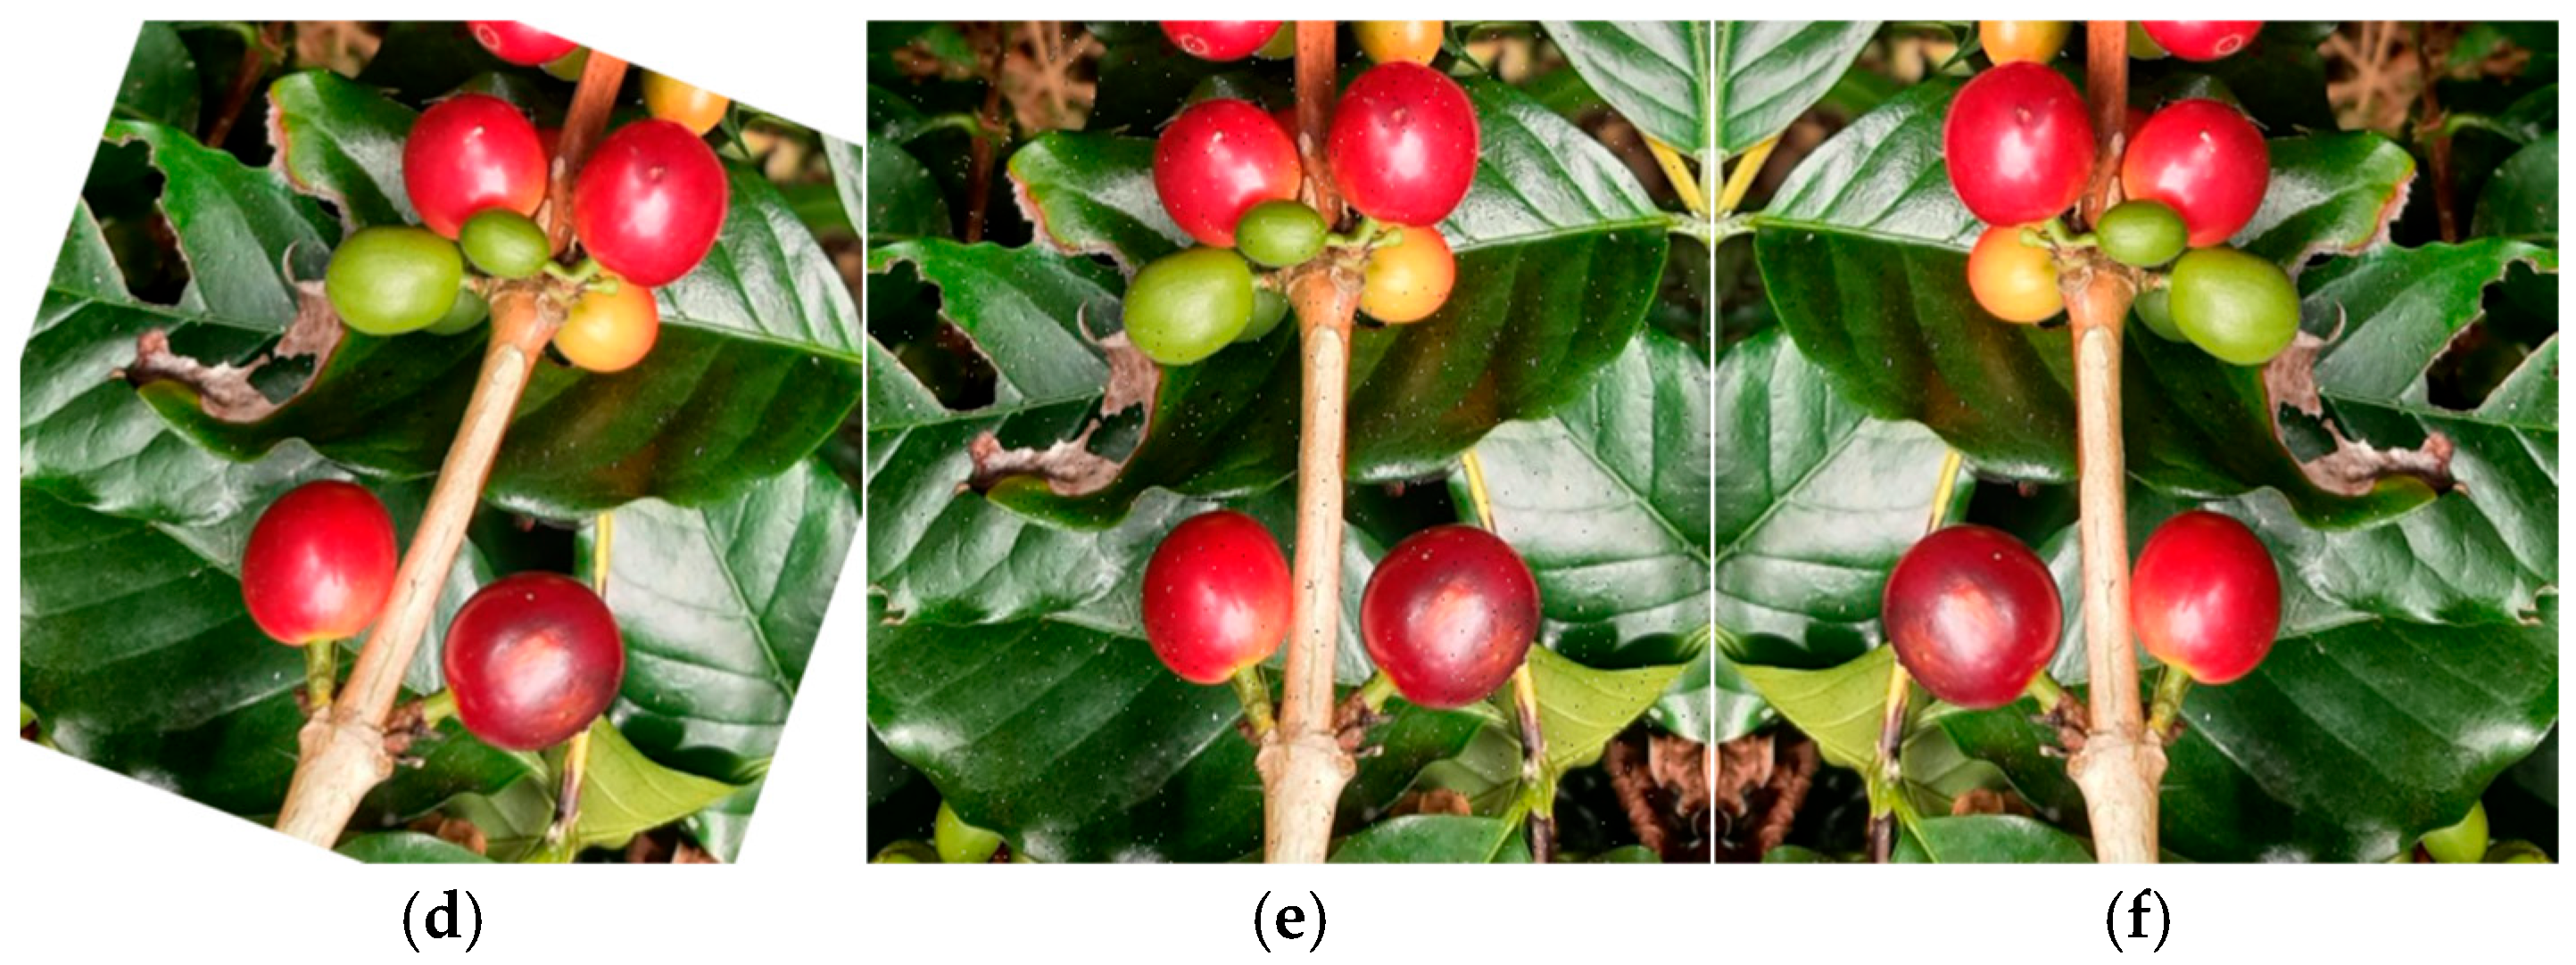
The Kaggle official website (https://www.kaggle.com/ (accessed on 15 December 2024)) provided the dataset used in this experiment. The original dataset included 859 photos of Arabica coffee (C. arabica) fruits at different stages of maturity. Data augmentation operations were performed on the dataset to improve the model’s robustness and generalization ability (As shown in Figure 1). Random flipping in both directions, cropping and scaling up to 15%, rotation by ±20°, brightness adjustment by ±20%, and noise addition up to 0.5% were among them. By simulating changes in lighting and angles found in actual picking situations, these methods increased the size of the dataset from 859 to 2523. In the end, the dataset was divided into three sets: a test set (500 images), a validation set (255 images), and a training set (1768 images) in a 7:1:2 ratio. The dataset categorizes the beans into five maturity levels: unripe, semi-dry, dry, ripe, and overripe, comprehensively including the complete growth and maturation process [12]. While the dataset predominantly originates from beans of a certain region, the varied data augmentation techniques allow the model to partially represent beans from other types and cultivation settings. Fundamental details regarding the dataset are shown in Table 1.

3.2. OGS-YOLOv8 Network Structure

The YOLO v8n architecture comprises three components: the backbone network, the neck network, and the head network. YOLO v8, being a single-stage target detection algorithm, has advantages in both speed and accuracy [13]. It integrates feature maps of varying scales to discern the color, shape, and texture characteristics of objects, hence enhancing accuracy in close-range scene object detection tasks [14]. In contrast to the prior generation model YOLO v5n, YOLO v8n substitutes all C3 modules in the backbone network with C2f modules that facilitate enhanced gradient fluxes, and incorporates a distinct head structure (DeCouple-Head) along with an innovative decoupling head design. These enhancements significantly streamline the model architecture and augment detection efficacy. Disabling Mosaic enhancement during the final 10 epochs of training improves the model’s generalization capability and accuracy.
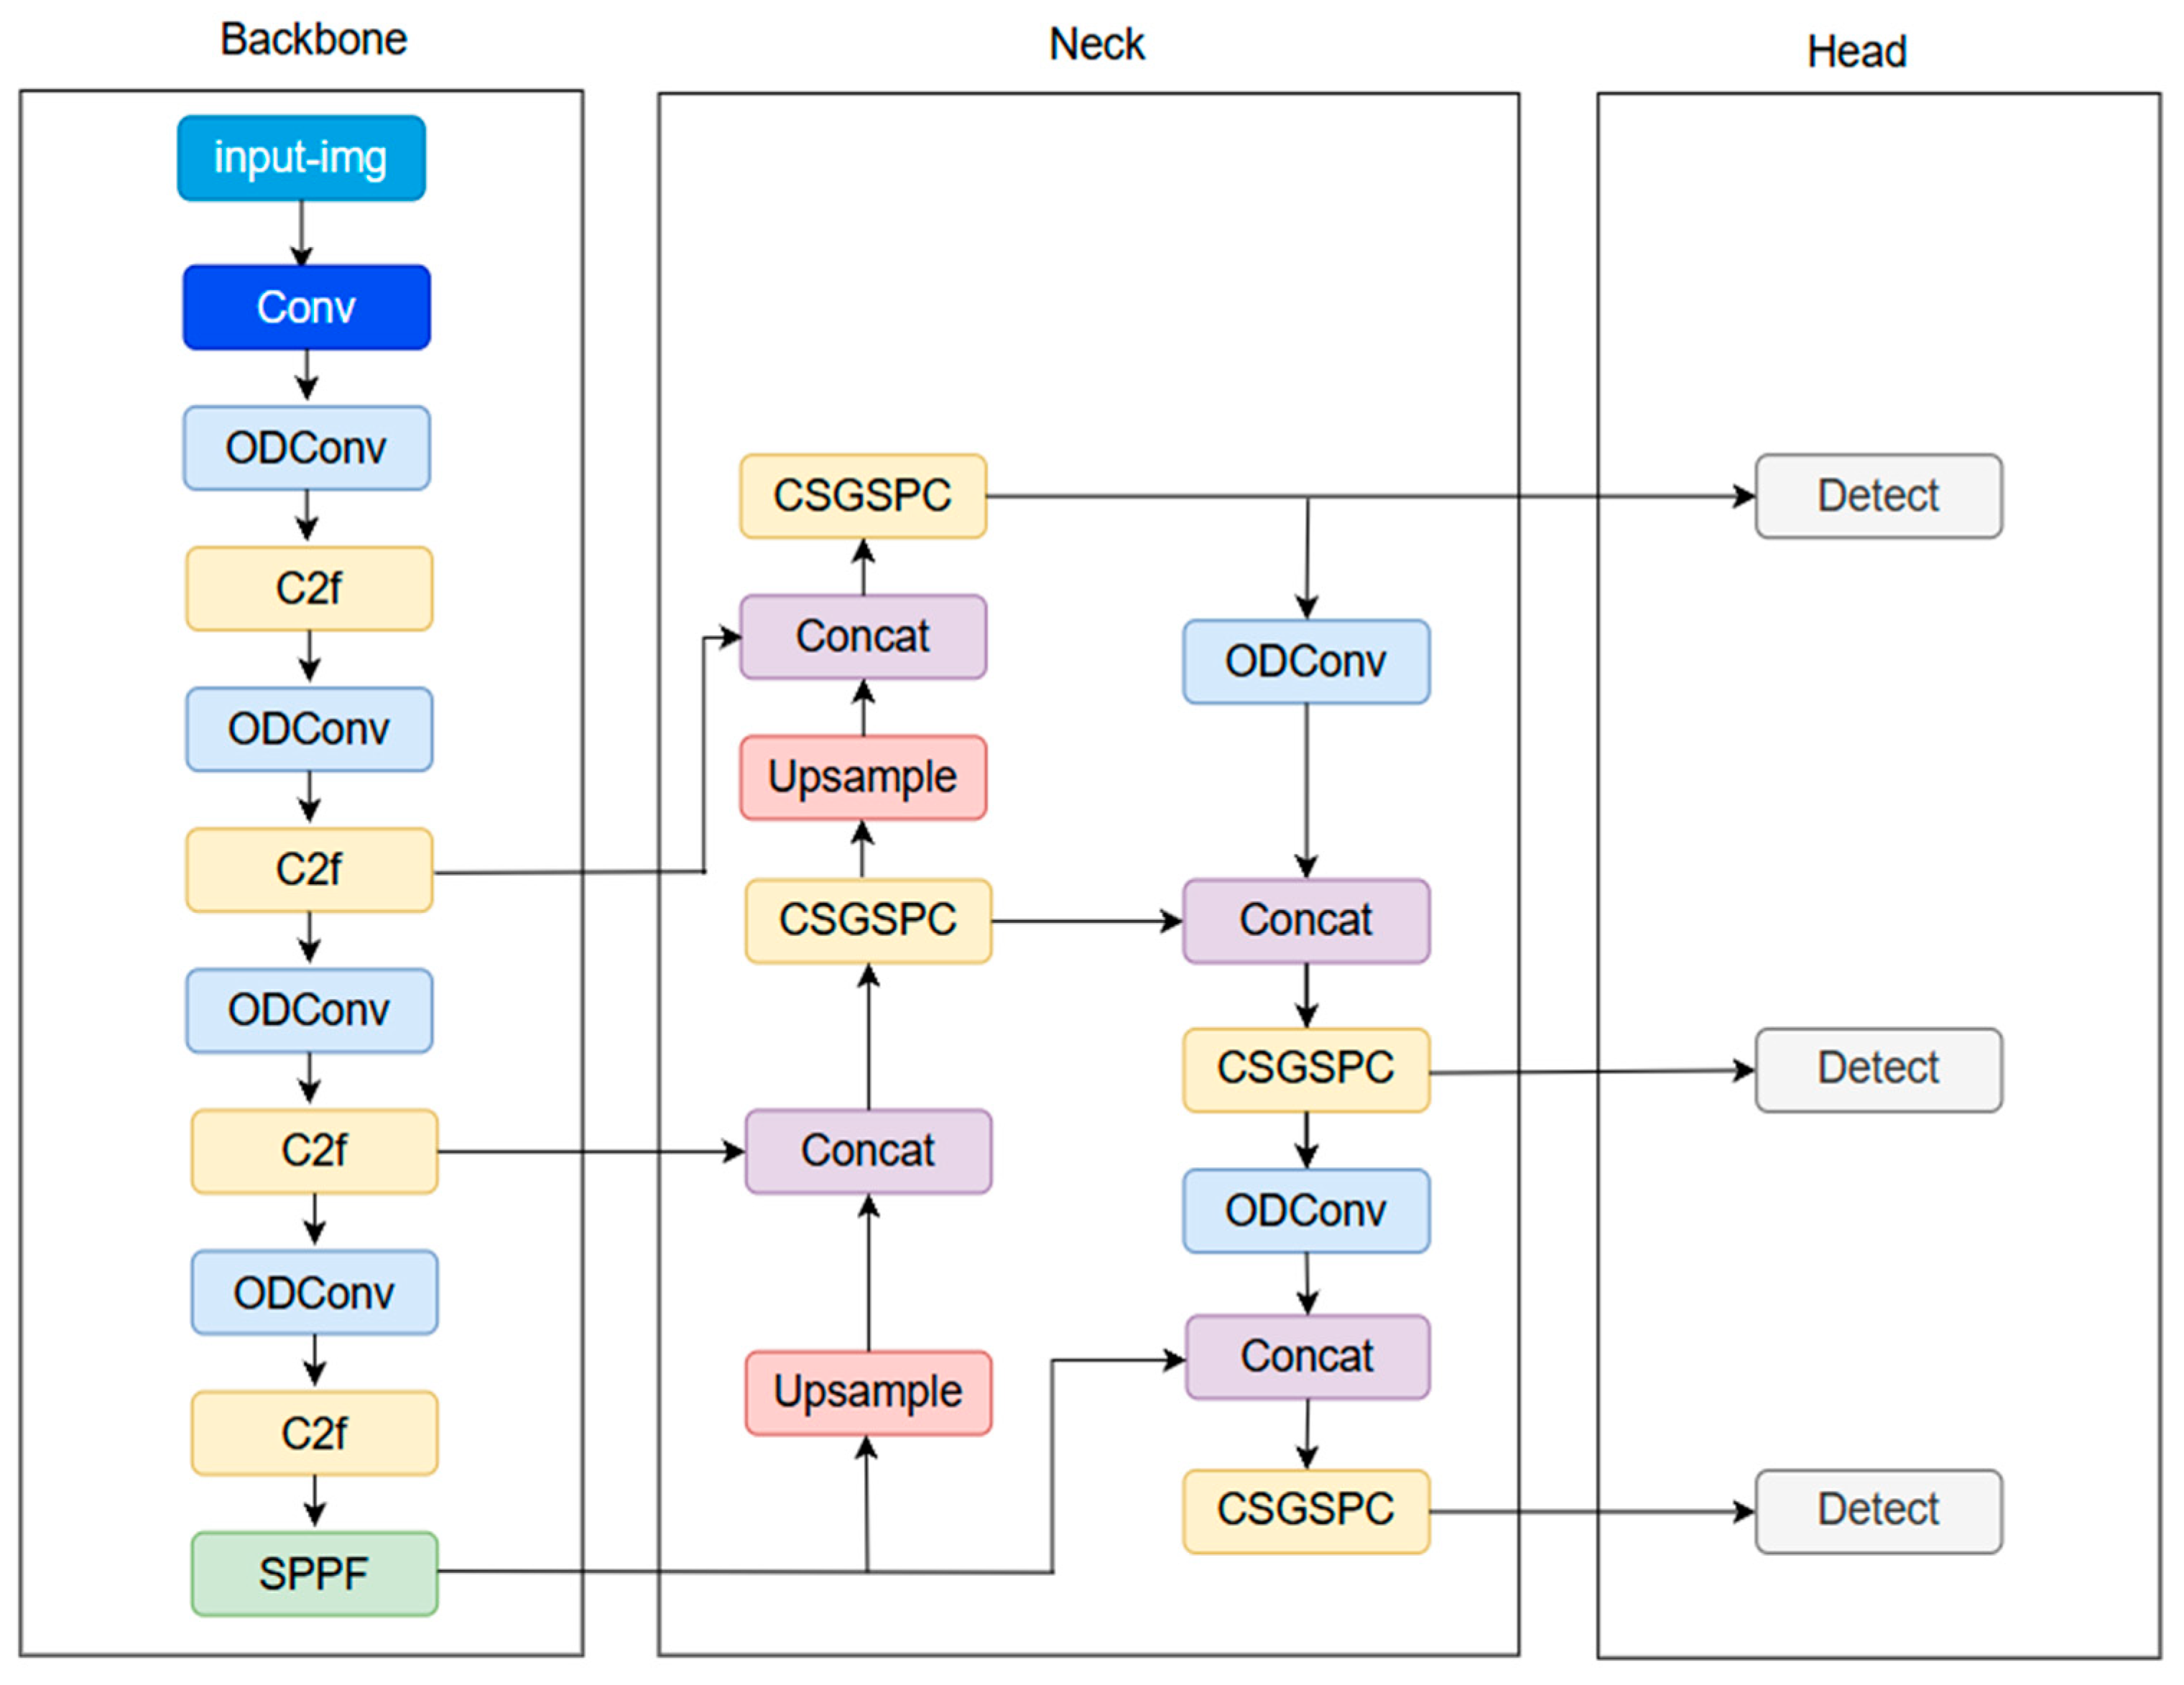
Despite being a great baseline model for object detection, YOLO v8n still has a number of drawbacks when applied to the particular task of coffee bean maturity detection. Occlusions between coffee beans can easily result in missed detections and false positives in crowded situations. Complex ambient noise can also affect the model’s detection performance, lowering the accuracy of detection. To address the aforementioned issues. This study addresses the problem of inadequate detection accuracy in coffee bean maturity identification by proposing an improved model, OGS-YOLOv8, based on the YOLO v8n architecture. In order to enhance the adaptive ability of the network to capture fine-grained and variable features of coffee beans, we introduced ODConv in the backbone network and neck network. In addition, in order to reduce the computational complexity and maintain high accuracy, we use the innovative CSGSPC module to replace the C2f module in the neck network. Finally, in order to improve the regression accuracy of unbalanced and difficult samples, the original CIoU loss function is replaced by the Inner-FocalerIoU loss function. These improvements greatly improve OGS-YOLOv8’s ability to identify in challenging situations. The improved OGS-YOLOv8 network design is shown in Figure 2.

3.3. Omni-Dimensional Dynamic Convolution

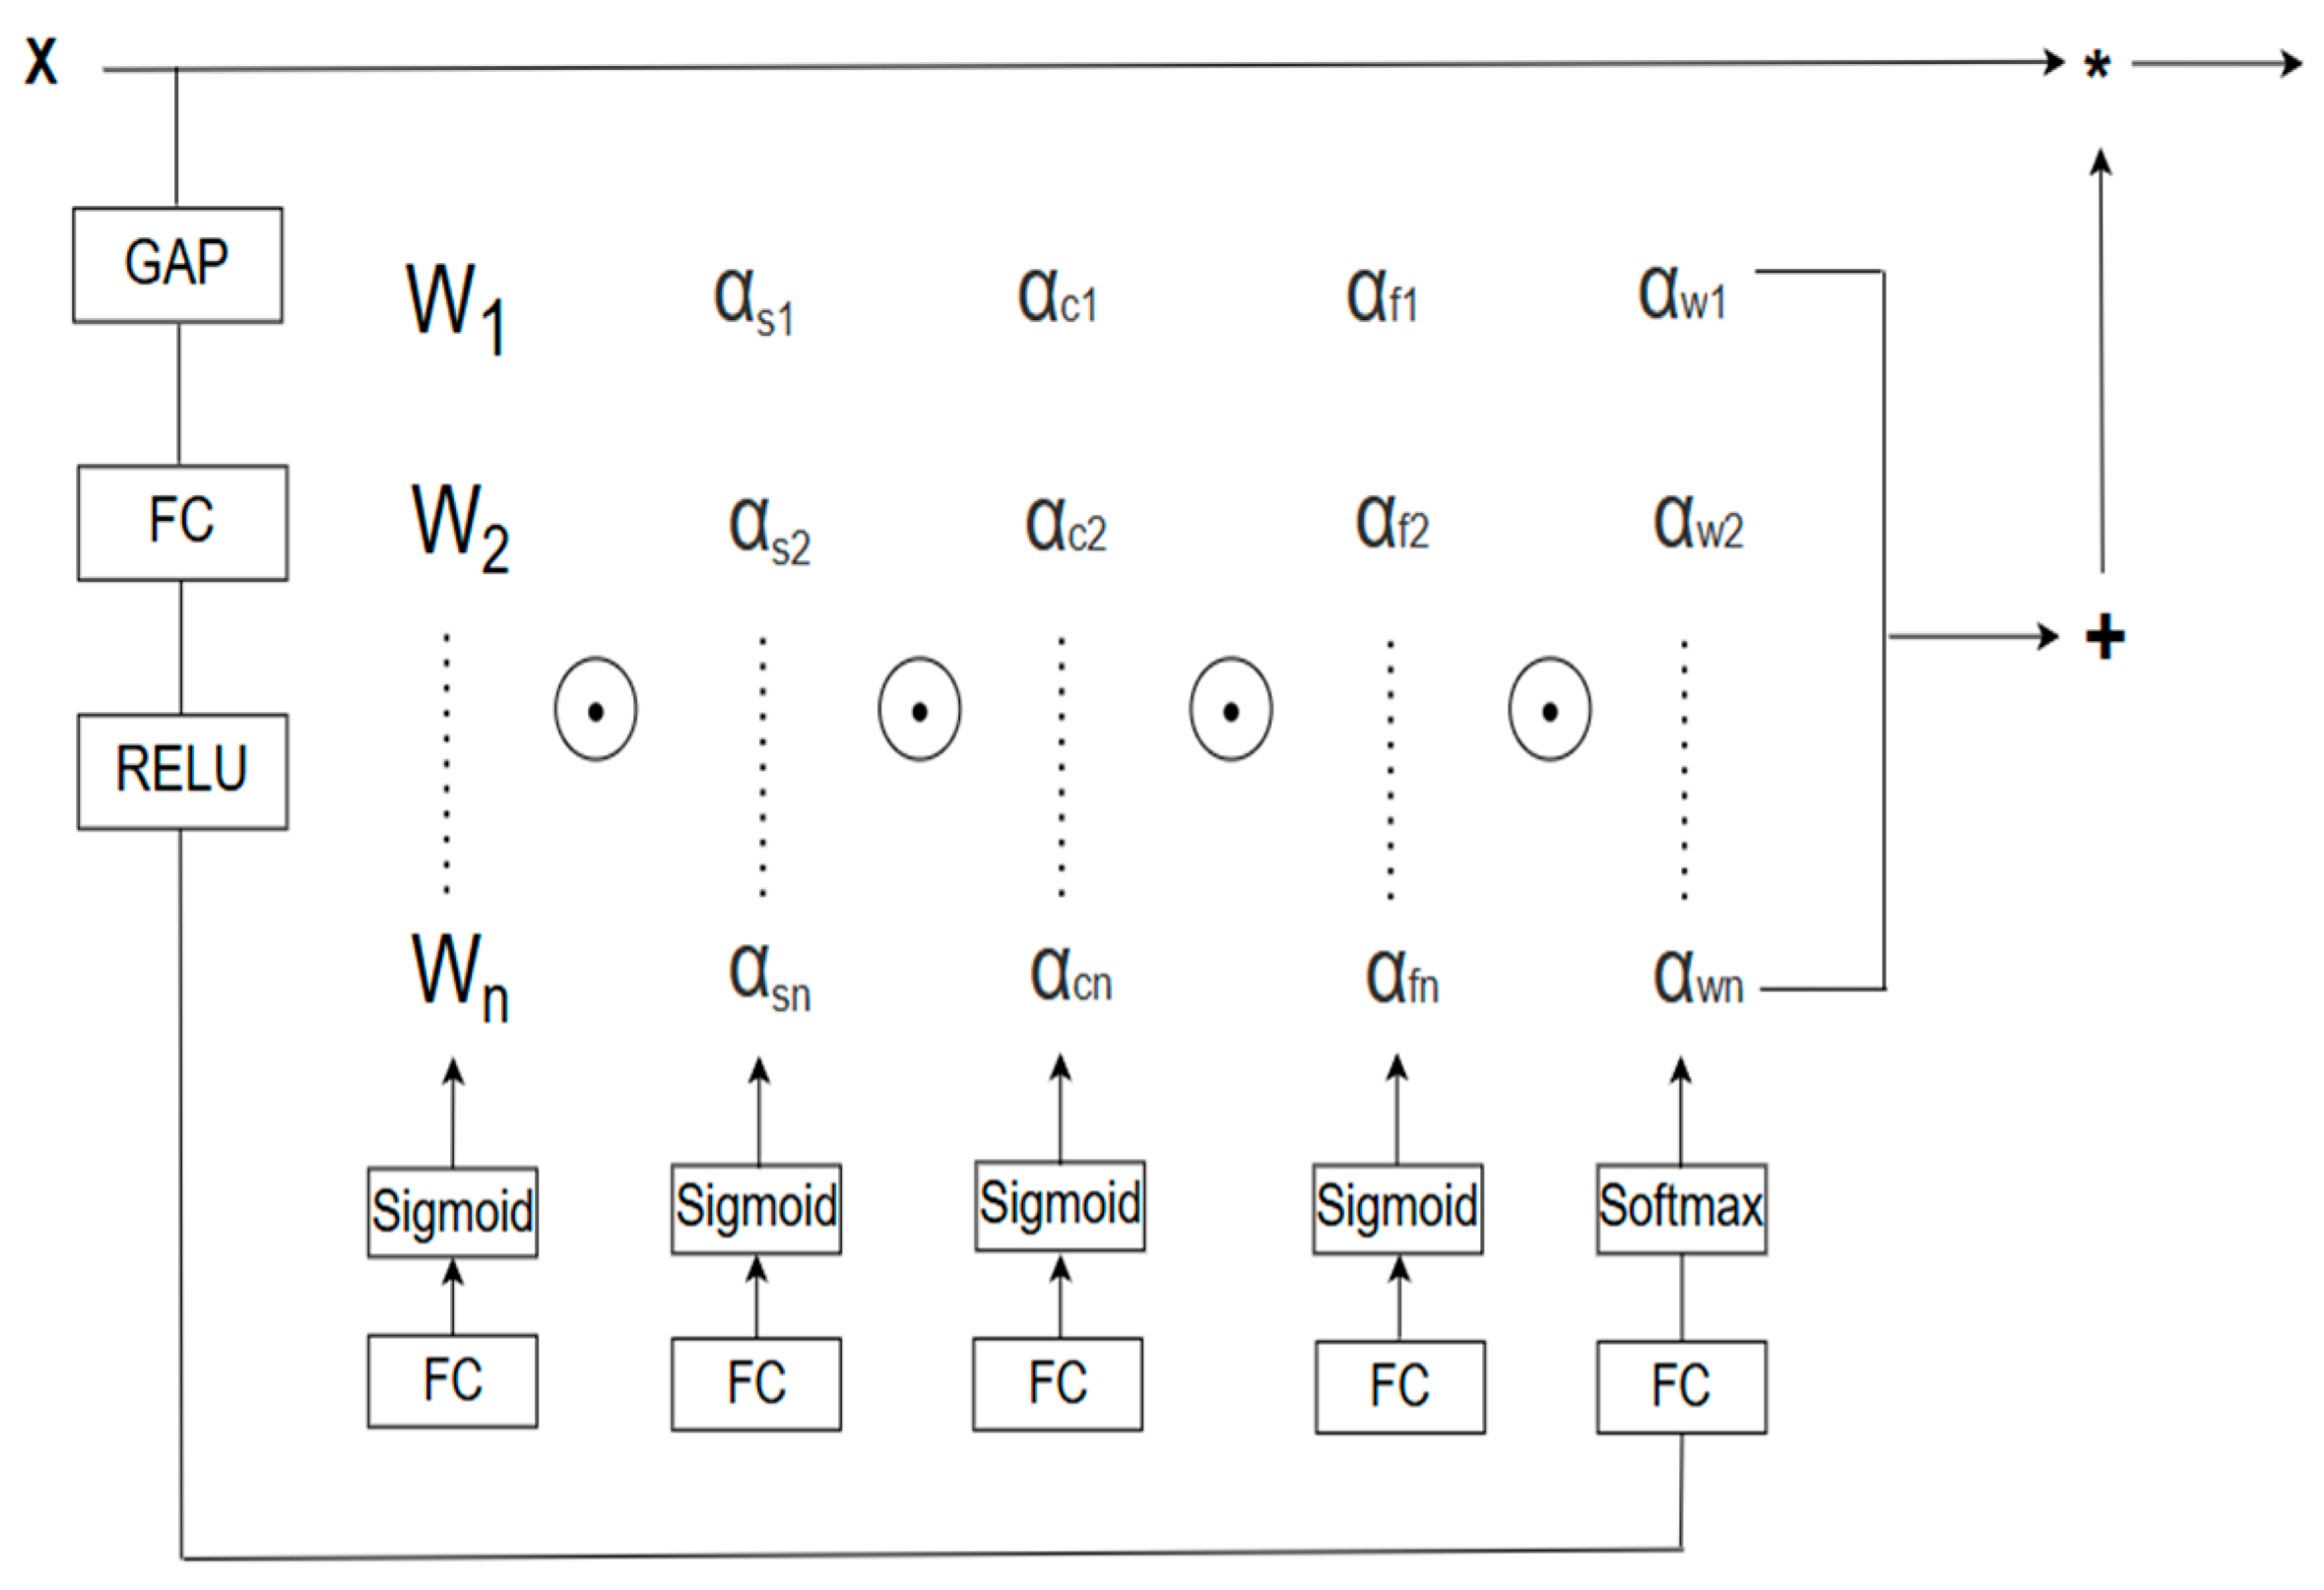
Standard convolutional networks encounter a number of particular difficulties when attempting to identify the age of coffee beans. First, very slight changes in color and texture are frequently the first indication of variances between beans at different stages of maturation. Second, there is often great dimensional variety in a single photograph, with beans ranging from small and immature to enormous and completely developed. Furthermore, effective features are extremely vulnerable to being overpowered by complex background information due to strong occlusions between beans and between beans and foliage. Conventional convolutional procedures process all inputs using static, homogeneous convolutional kernels, which are unable to adapt to these changeable settings and have trouble effectively extracting important information. The capacity to capture the nuanced, variable features of coffee beans is improved via upgraded networks in order to overcome this problem. This study presents the full-dimensional dynamic convolution (ODConv) [15], which employs an innovative multi-dimensional attention method. Utilizing a parallel technique, it acquires the complementary attention of the convolution kernel across four dimensions: spatial size, input channels, output channels, and the number of convolution kernels [16], thus allowing the model to make adaptive modifications in these dimensions. ODConv enhances the convolution kernel’s capacity to adaptively extract diverse features by dynamically assigning weights [17]. It can manage notable size changes among coffee beans and detect minute variances in color and texture. Figure 3 illustrates the convolution structure diagram of ODConv.
Figure 3 illustrates the methodology by which ODConv computes four distinct types of attention for the convolution kernel. Initially, the input features undergo a global average pooling (GAP) procedure to transform them into a feature vector of specified length. Thereafter, the feature vector is subjected to a fully connected layer (FC) and a ReLU (Rectified Linear Unit) activation function. Subsequently, the multi-branch attention module is activated. It comprises four principal branches, each utilized to compute the four varieties of attention. The fully connected layers associated with the four head branches provide the four normalized attentions via the Sigmoid or Softmax function. Upon acquiring these four attentions, the respective dimensions for each convolution kernel are multiplied sequentially in the sequence of α w 1 α f 1 α c 1 α s 1 ⊙W1 (where ⊙ denotes the multiplication of corresponding dimensions). Ultimately, all the dynamically weighted convolution kernels are aggregated and convolved with the input features to produce the output features. The formula for calculation is presented in Equation (1). The * in Figure 3 and Equation (1) represents convolution operation.
y = ( α w 1 α f 1 α c 1 α s 1 W 1 + + α w n α f n α c n α s n W n )     x
The key significance of this series of computational steps is the extensive use of the four-dimensional attention mechanism, which dynamically adjusts the convolution kernel weights to more comprehensively capture and utilize the multidimensional features of the input data, thereby improving the flexibility and accuracy of coffee bean target feature extraction.

3.4. Convolutional Split Group-Shuffle Partial Convolution

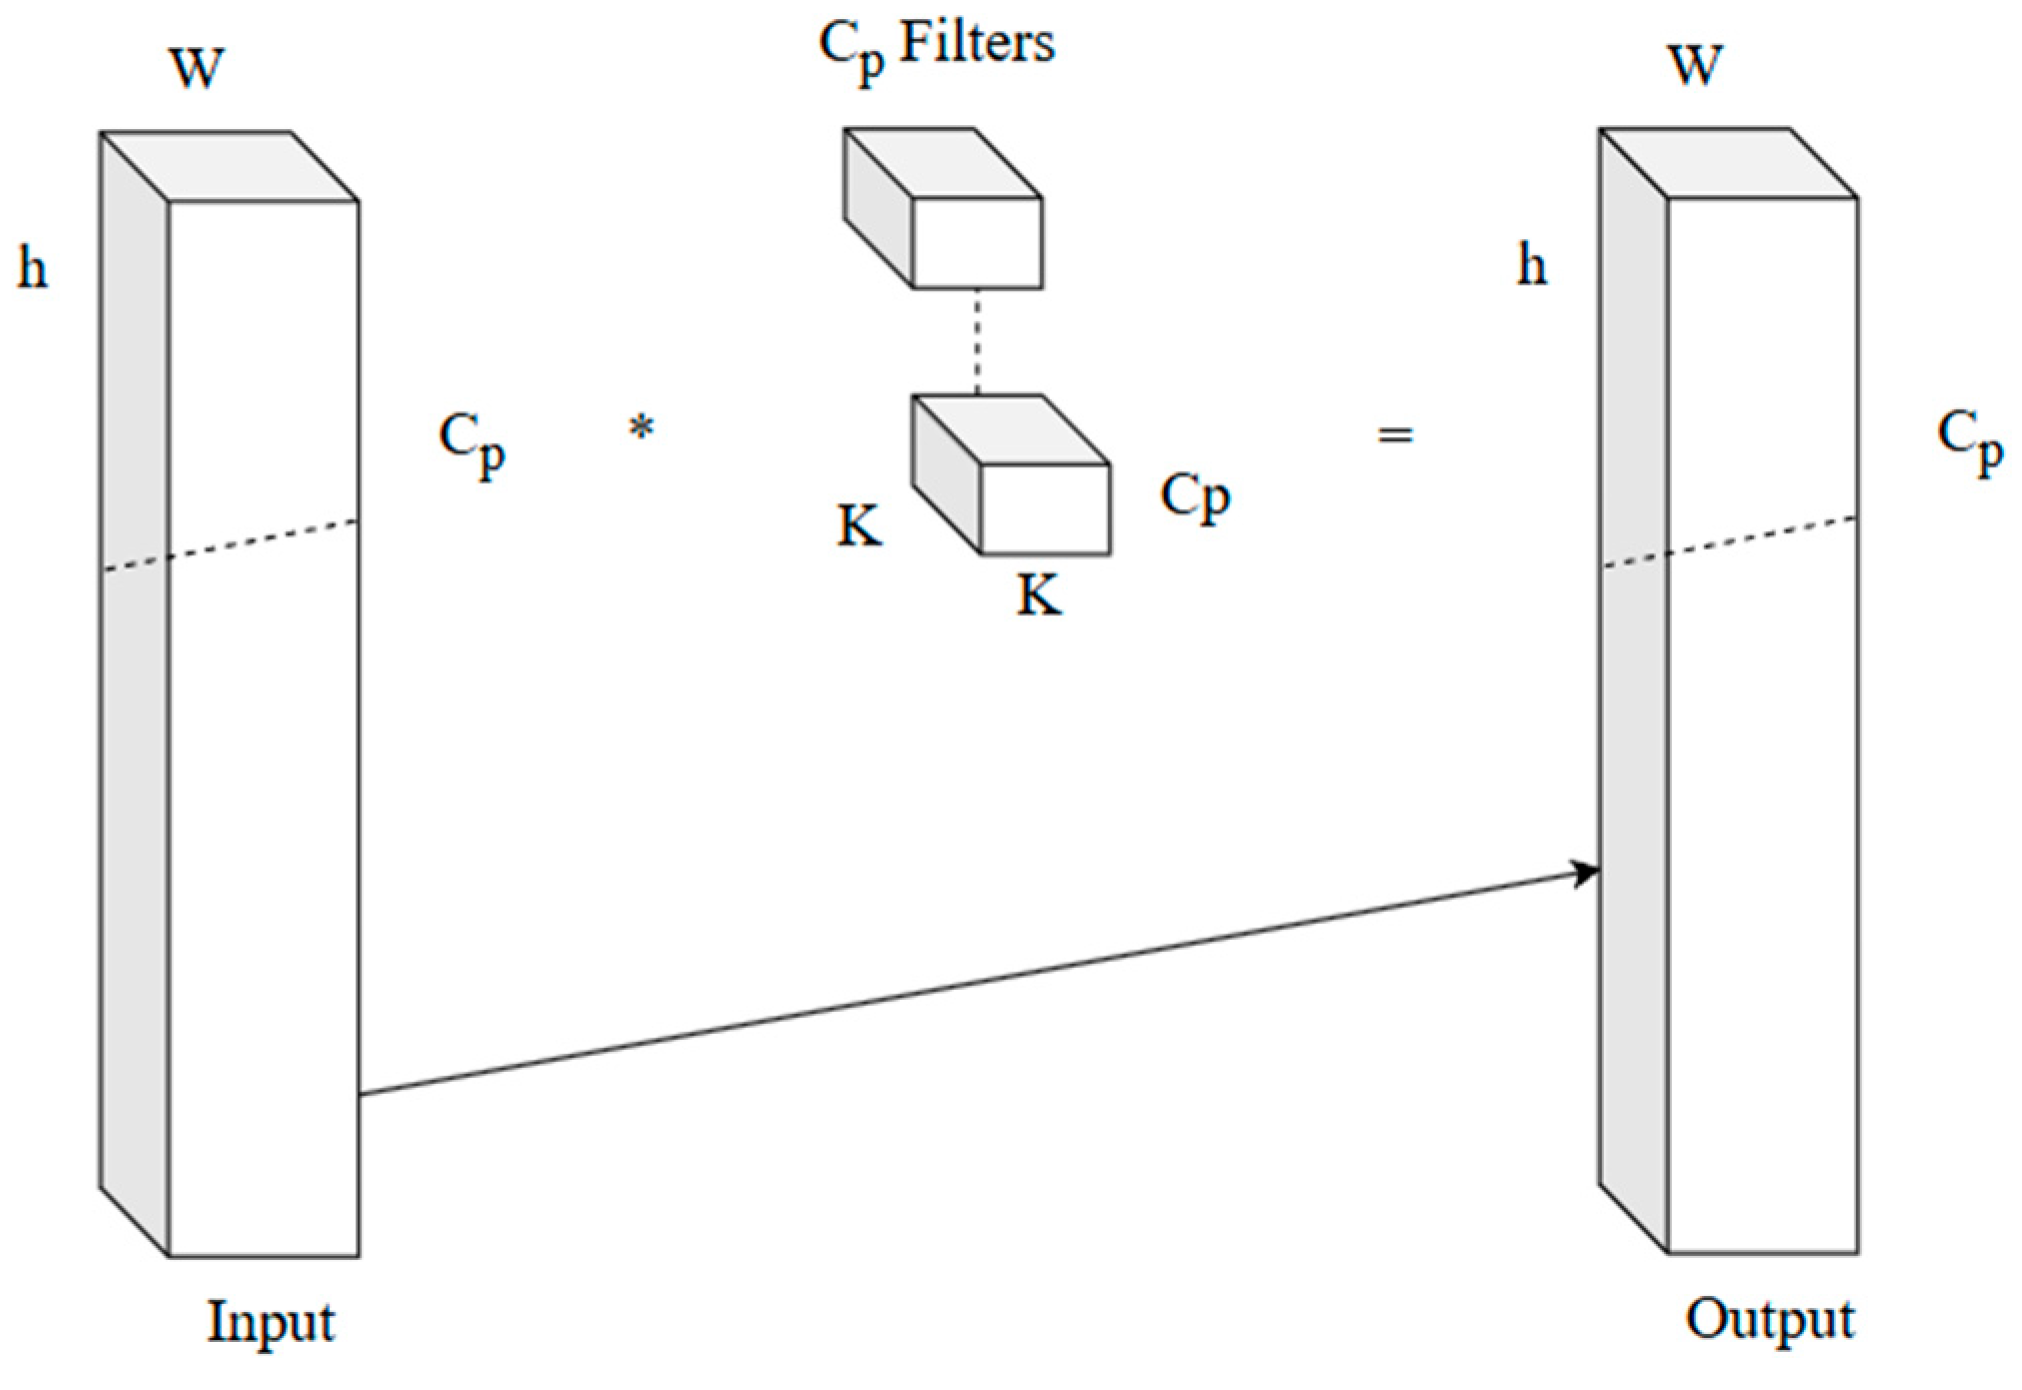
PConv, an abbreviation for Partial Convolution [18], is an efficient convolution framework that executes convolution operations solely on select channels of the input feature map, leaving the other channels unaltered. This approach decreases the total count of floating-point operations. This not only alleviates the computational load but also diminishes the frequency of memory accesses, as just a portion of the input is analyzed, rendering the model more efficient. Figure 4 illustrates the architecture of PConv. h, w, and CP denote the height, breadth, and channel count of the feature map, respectively. k denotes the dimensions of the convolution kernel, while Identity signifies that the input feature map is transmitted to the output feature map unchanged. CP Filters denotes the quantity of filters utilized. * symbol represents convolution operation.
By computing only a subset of channels, PConv increases efficiency. However, its static processing approach creates a problem known as the “information silo” because the channels that are computed and ignored in each layer are fixed, making it impossible for channels that are not involved in computation to fuse information with computed channels. This limits the variety of features that the network can learn. We created GS-PConv (As shown in Figure 5) to balance information transfer and computational efficiency in order to overcome this difficulty. The three steps listed below make up the main workflow:
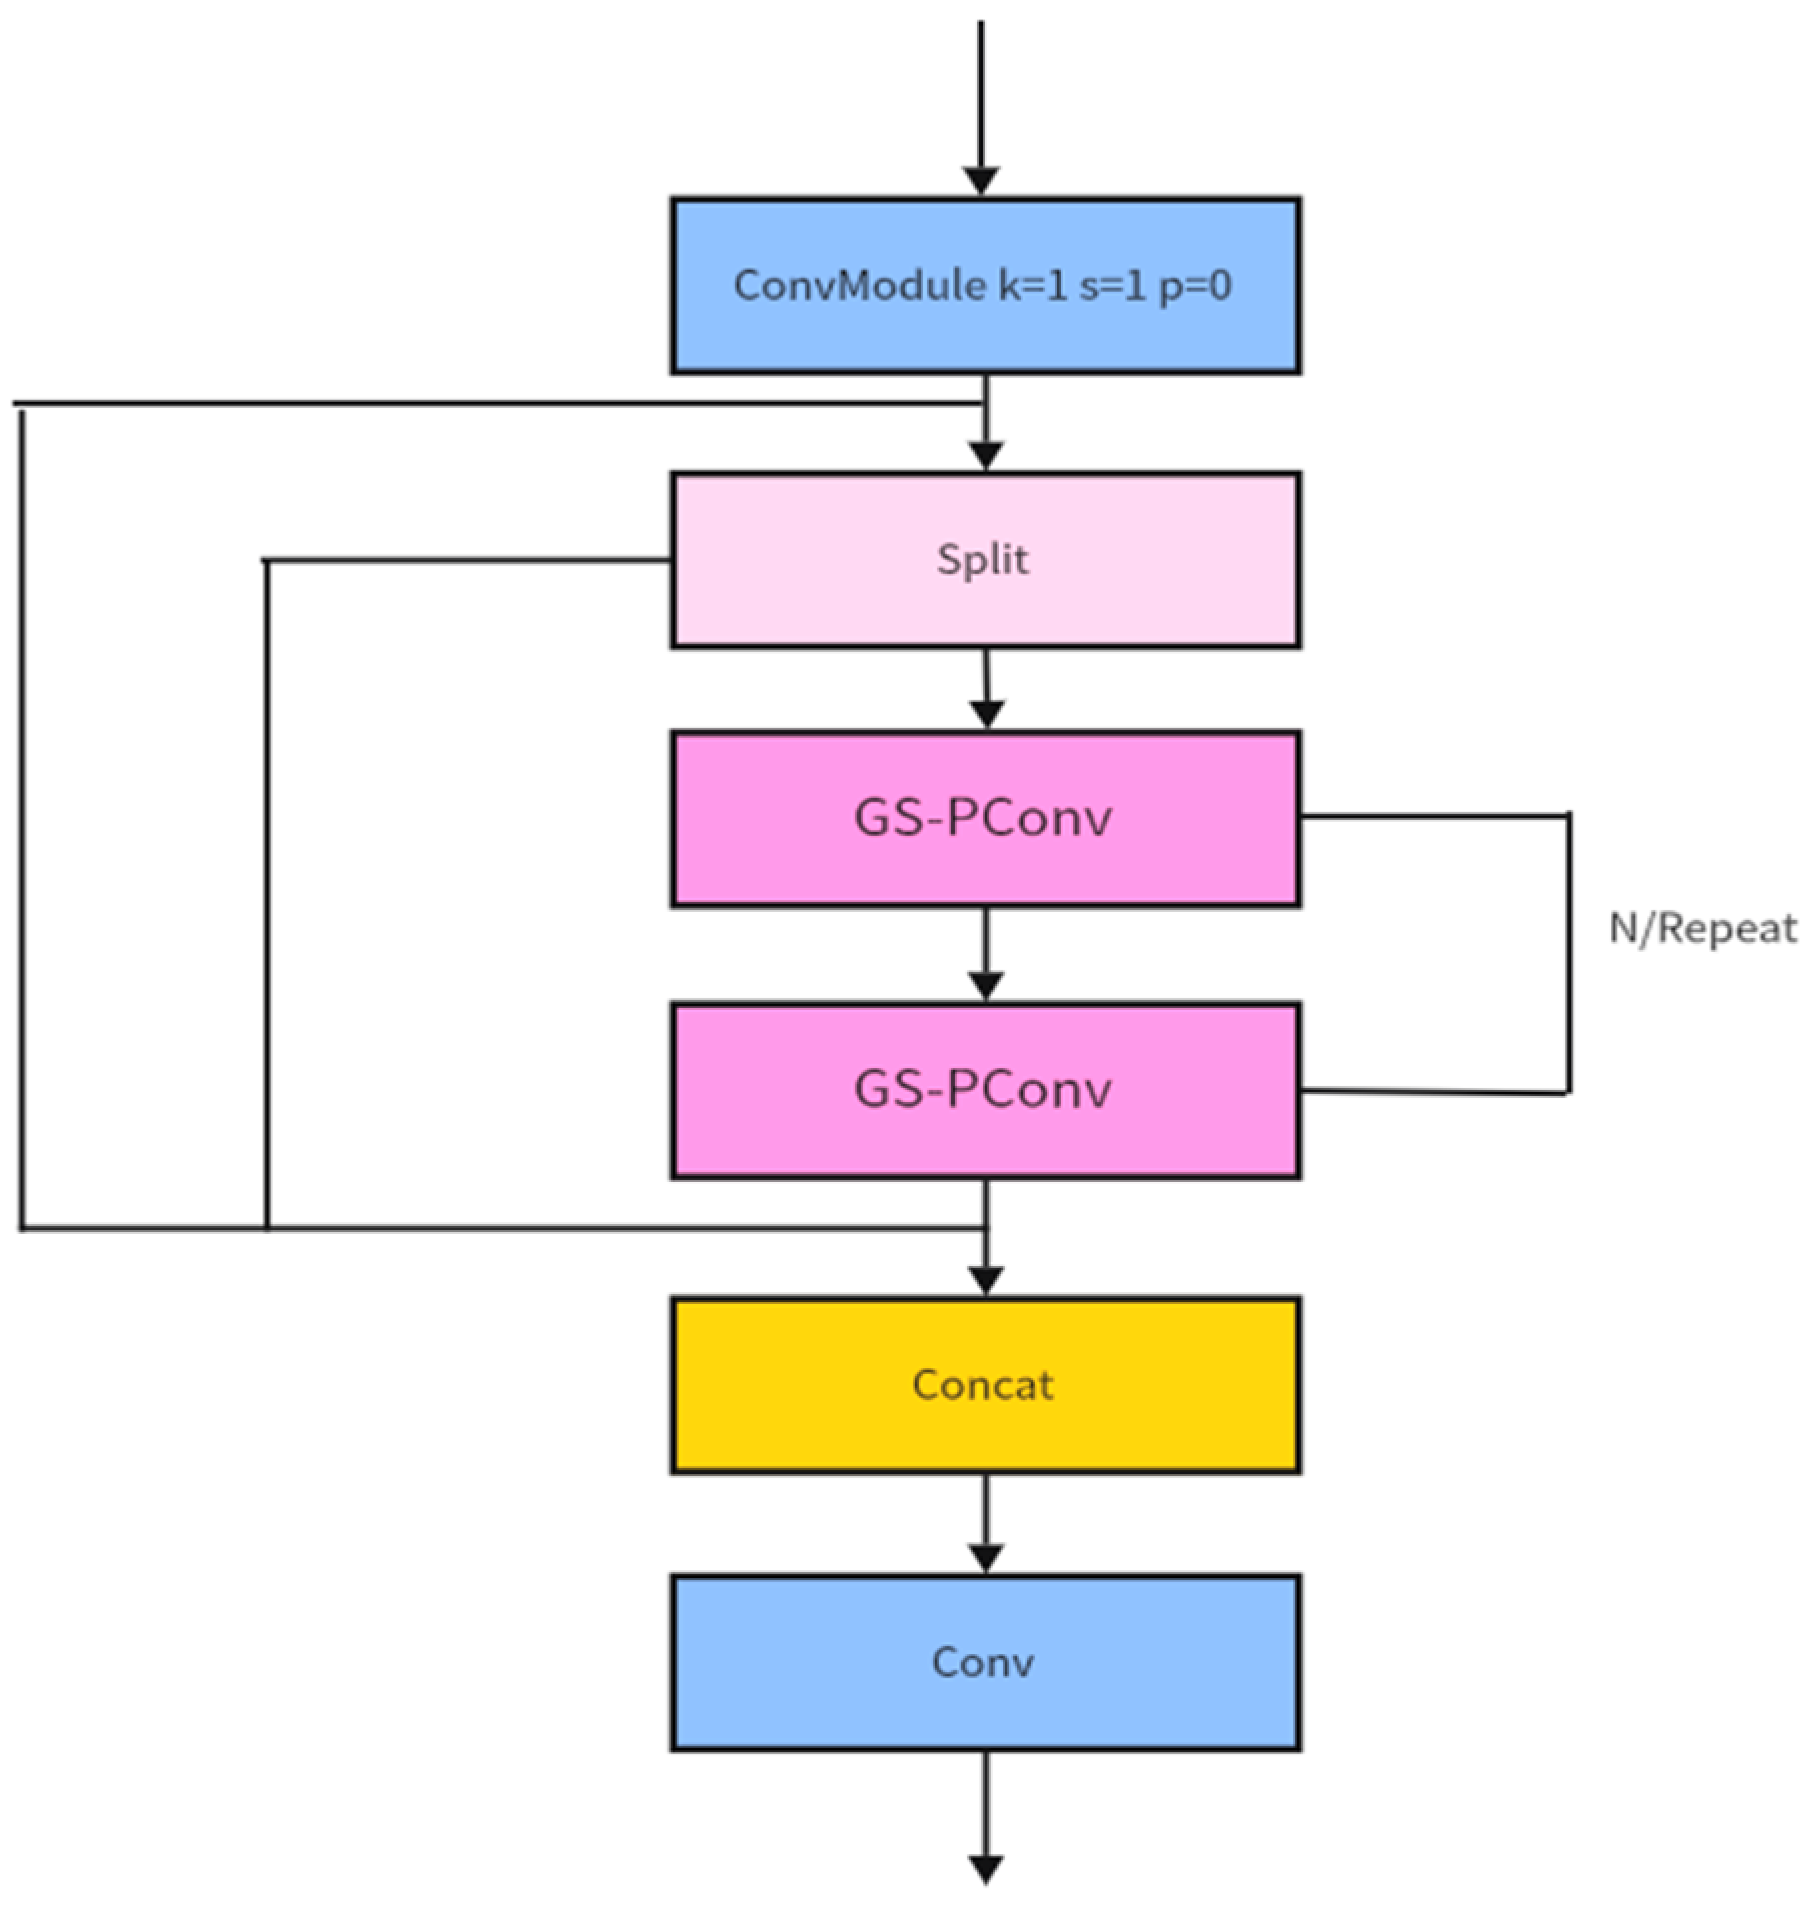
We start by splitting the input feature map along the channel dimension into n separate groups. Only 25% of the channels in each group undergo convolutional operations; the other channels stay unaltered. The overall computational load can be decreased by using this intra-group partial computation technique to more intensively allocate computational resources to features that need to be updated; GS-PConv uses tensor reshaping and splitting procedures to combine all channels waiting for convolution across groups into a single contiguous tensor in order to accomplish effective forward propagation. This allows for a single batch convolution operation to facilitate unified processing. By avoiding ineffective recursive structures, our method guarantees great efficiency for both inference and training. Following convolution and reorganization, GS-PConv adds a channel reshuffling process. Without adding extra parameters, this procedure evenly distributes processed and unprocessed channels from each group among other groups, guaranteeing that every channel has an equal chance to take part in the convolution at the following layer. This technique ensures the complete integration of global features and efficiently encourages the flow of information among groups.
Ultimately, lightweight GS-PConv was used to replace all of the Conv layers in C2f, creating a new structure called CSGSPC. This change improves computational efficiency while preserving performance by cutting down on unnecessary calculations and memory accesses. Figure 6 depicts the enhanced CSGSPC design.

3.5. Inner-FocalerIoU Loss Function

The initial loss function of YOLO v8n is the CIoU [19] loss function, characterized by excessive computing complexity, insensitivity to tiny objects. The Inner-IoU [20] loss function is proposed to address the aforementioned issues. The bounding box regression process in target detection is optimized by the utilization of auxiliary bounding boxes and scaling factors, addressing the limitations of limited generalization and sluggish convergence associated with the conventional IoU loss function across various detection tasks. The calculation formula is presented in Equation (2): ‘inter’ denotes the intersection area of two auxiliary bounding boxes, while ‘union’ signifies the combined area of the same bounding boxes.
I o U i n n e r = i n t e r u n i o n
We use the Focaler-IoU [21] method to optimize the bounding box regression loss in order to overcome the sample difficulty imbalance in regression problems. A linear interval remapping function with parameters d and u—which stand for the lower and upper bounds of the desired IoU interval ([d, u] ∈ [0, 1])—is fed the value calculated from Equation (2). The model may adaptively focus on regression samples of different difficulty levels by dynamically altering the values of d and u. Following this function’s processing, we are left with a focused IoU value. (3) displays its computation formula.
I o U i n n e r - f o c a l e r = 0 , I o U i n n e r < d I o U i n n e r d u d , d I o U i n n e r u 1 , I o U i n n e r > u
Finally, using the loss structure of IoUinner-focaler the total loss LInner-Focaler is calculated, as indicated by Equation (4). This computation greatly increases the detection accuracy [22] by allowing the loss function to concentrate more on targets that are typically in the minority class and are challenging to regress.
L I n n e r - F o c a l e r = 1 I o U i n n e r - f o c a l e r

4. Results

4.1. Environment and Parameter Adjustment

With an NVIDIA GeForce RTX 4060 GPU, 8 GB of RAM, 32 GB of RAM, PyTorch version 2.41, and Python version 3.8.0, this study uses PyTorch as its deep learning framework. For 150 iterations, the SGD optimizer was configured with an initial learning rate of 0.01; momentum of 0.937; and weight decay of 0.005. The resolution of the input image was set to 640 by 640 pixels.

4.2. Model Evaluation Metrics

This study’s model employs precision (P), recall (R), mean average precision (mAP), F1-score, and floating point operations (FLOPs) as assessment measures. P denotes the ratio of samples classified as positive by the model that are genuinely positive. R denotes the ratio of accurately detected positive samples by the model relative to the total number of actual positive samples. mAP is the mean average precision across all categories. The harmonic mean of precision and recall is represented by the F1-score. FLOPs quantifies the computational complexity of an algorithm or model and is frequently utilized to assess the computer resources necessary for data processing by a model. The formula is shown in (5) to (8).
P = T P T P + F P
R = T P T P + F N
mAP   =   1 N i = 1 N A P i
F 1   =   2 × P × R P + R

4.3. Model Training Process and Comparison

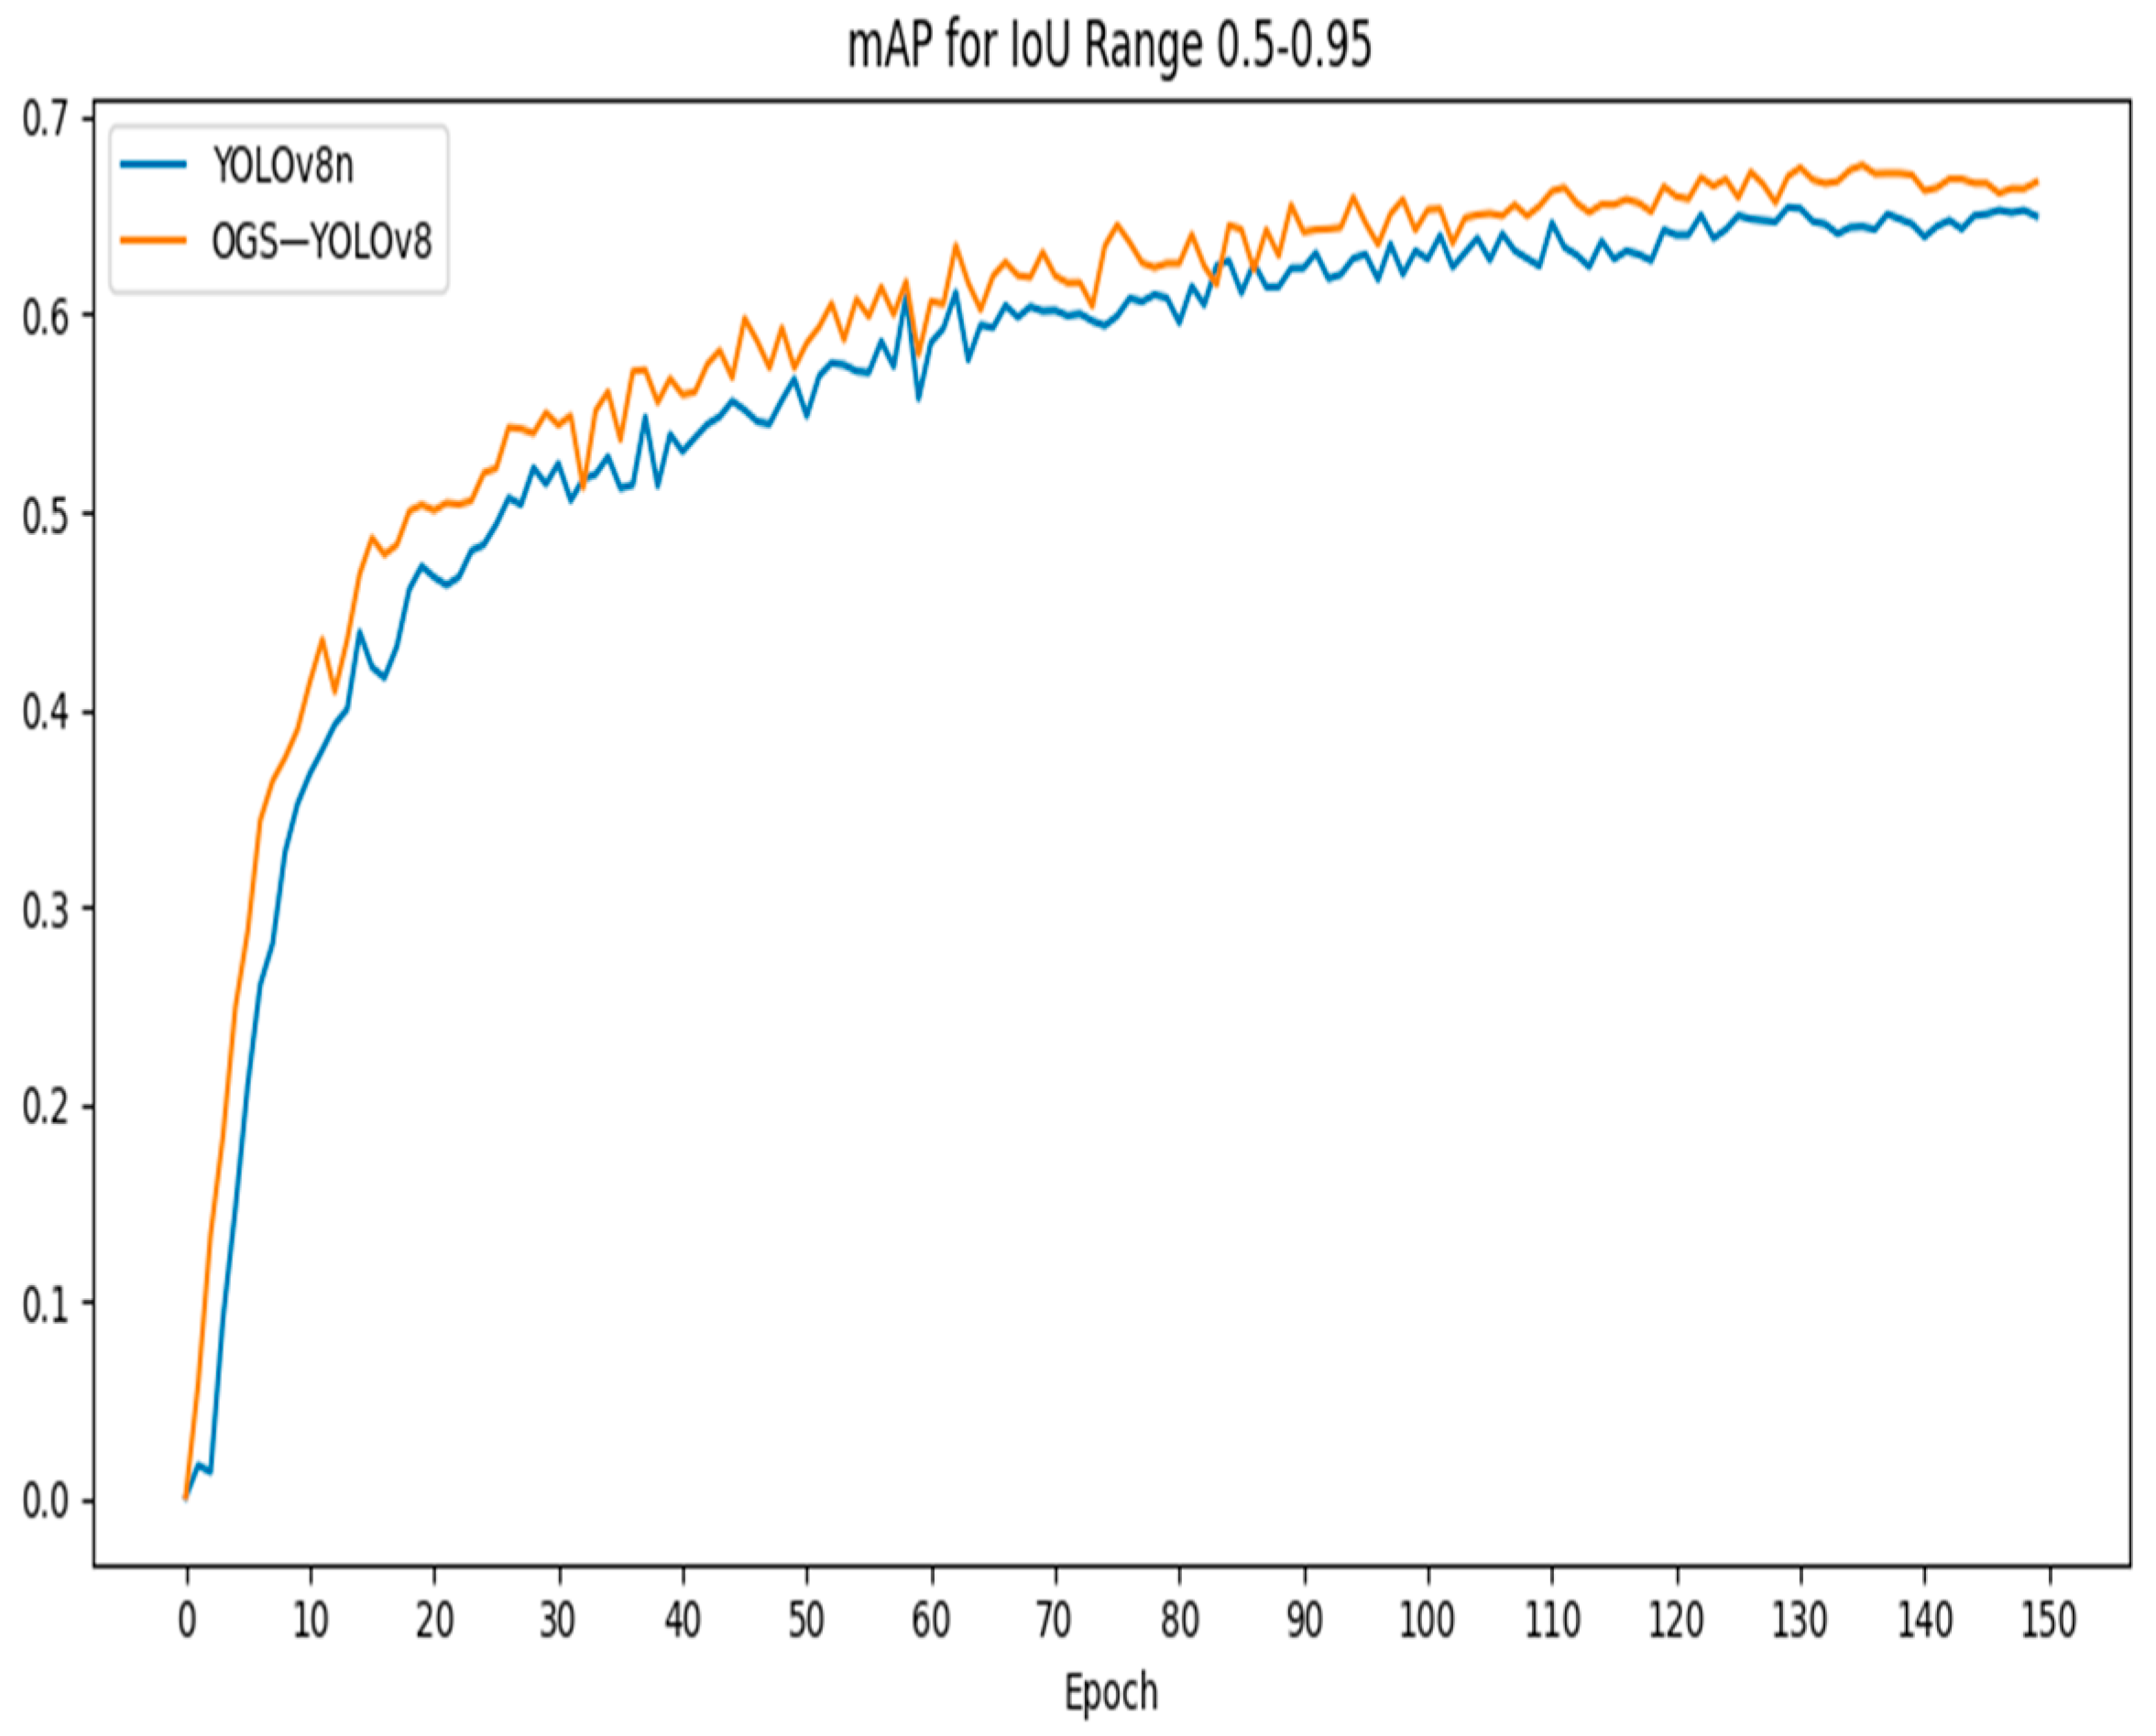
Figure 7 illustrates the variations in metrics throughout the model training process. The model underwent training for 150 epochs. The mean average precision (mAP@0.5–0.95) consistently increased with further epochs, exhibiting reduced fluctuations post-115 epochs and demonstrating notable enhancement relative to the initial model.

4.4. Comparison of Different Dynamic Convolutions

Ablation studies were designed to investigate the advantages of ODConv compared to alternative dynamic convolution models. Models based on YOLO v8n were developed under identical experimental settings, substituting standard convolution with AKConv [23], SPD-Conv [24], DSConv [25], and ODConv. The experimental findings are presented in Table 2. The enhanced ODConv-YOLO v8n model attains superior performance in mAP@0.5, precision, and F1-score, achieving 74.1%, 70.4%, and 70.5%, respectively. These enhancements signify improvements of 1.3%, 4.1%, and 1.9% over YOLO v8n, respectively. The FLOPs/G decreased to 6.9, signifying decreasing computational complexity. Despite an increase in inference time to 9.2 ms, it remained lower than the other three enhanced models by 0.2 ms, 0.6 ms, and 0.9 ms, respectively. In summary, ODConv dynamic convolution attains an optimal equilibrium between detection accuracy and computational efficiency, hence augmenting the model’s capacity to assess coffee bean ripeness.

4.5. Comparison of Different Lightweight Convolutions

Ablation experiments were meant to investigate the advantages of GS-PConv compared to other lightweight convolutional models. A model based on YOLO v8n was developed under identical experimental settings, substituting C2f with FasterBlock, DualConv [26], HetConv [27], and GS-PConv. The experimental findings are presented in Table 3. Our proposed GS-PConv provides the optimum performance. It reduces computational complexity (GFLOPs) from 8.2 to 7.0 while keeping almost similar mAP@0.5, resulting in the highest precision and F1-scores. Although HetConv has a lower computational cost, its inference speed is extremely poor; FasterBlock and DualConv, on the other hand, perform worse than GS-PConv.

4.6. Comparison of Different Loss Functions

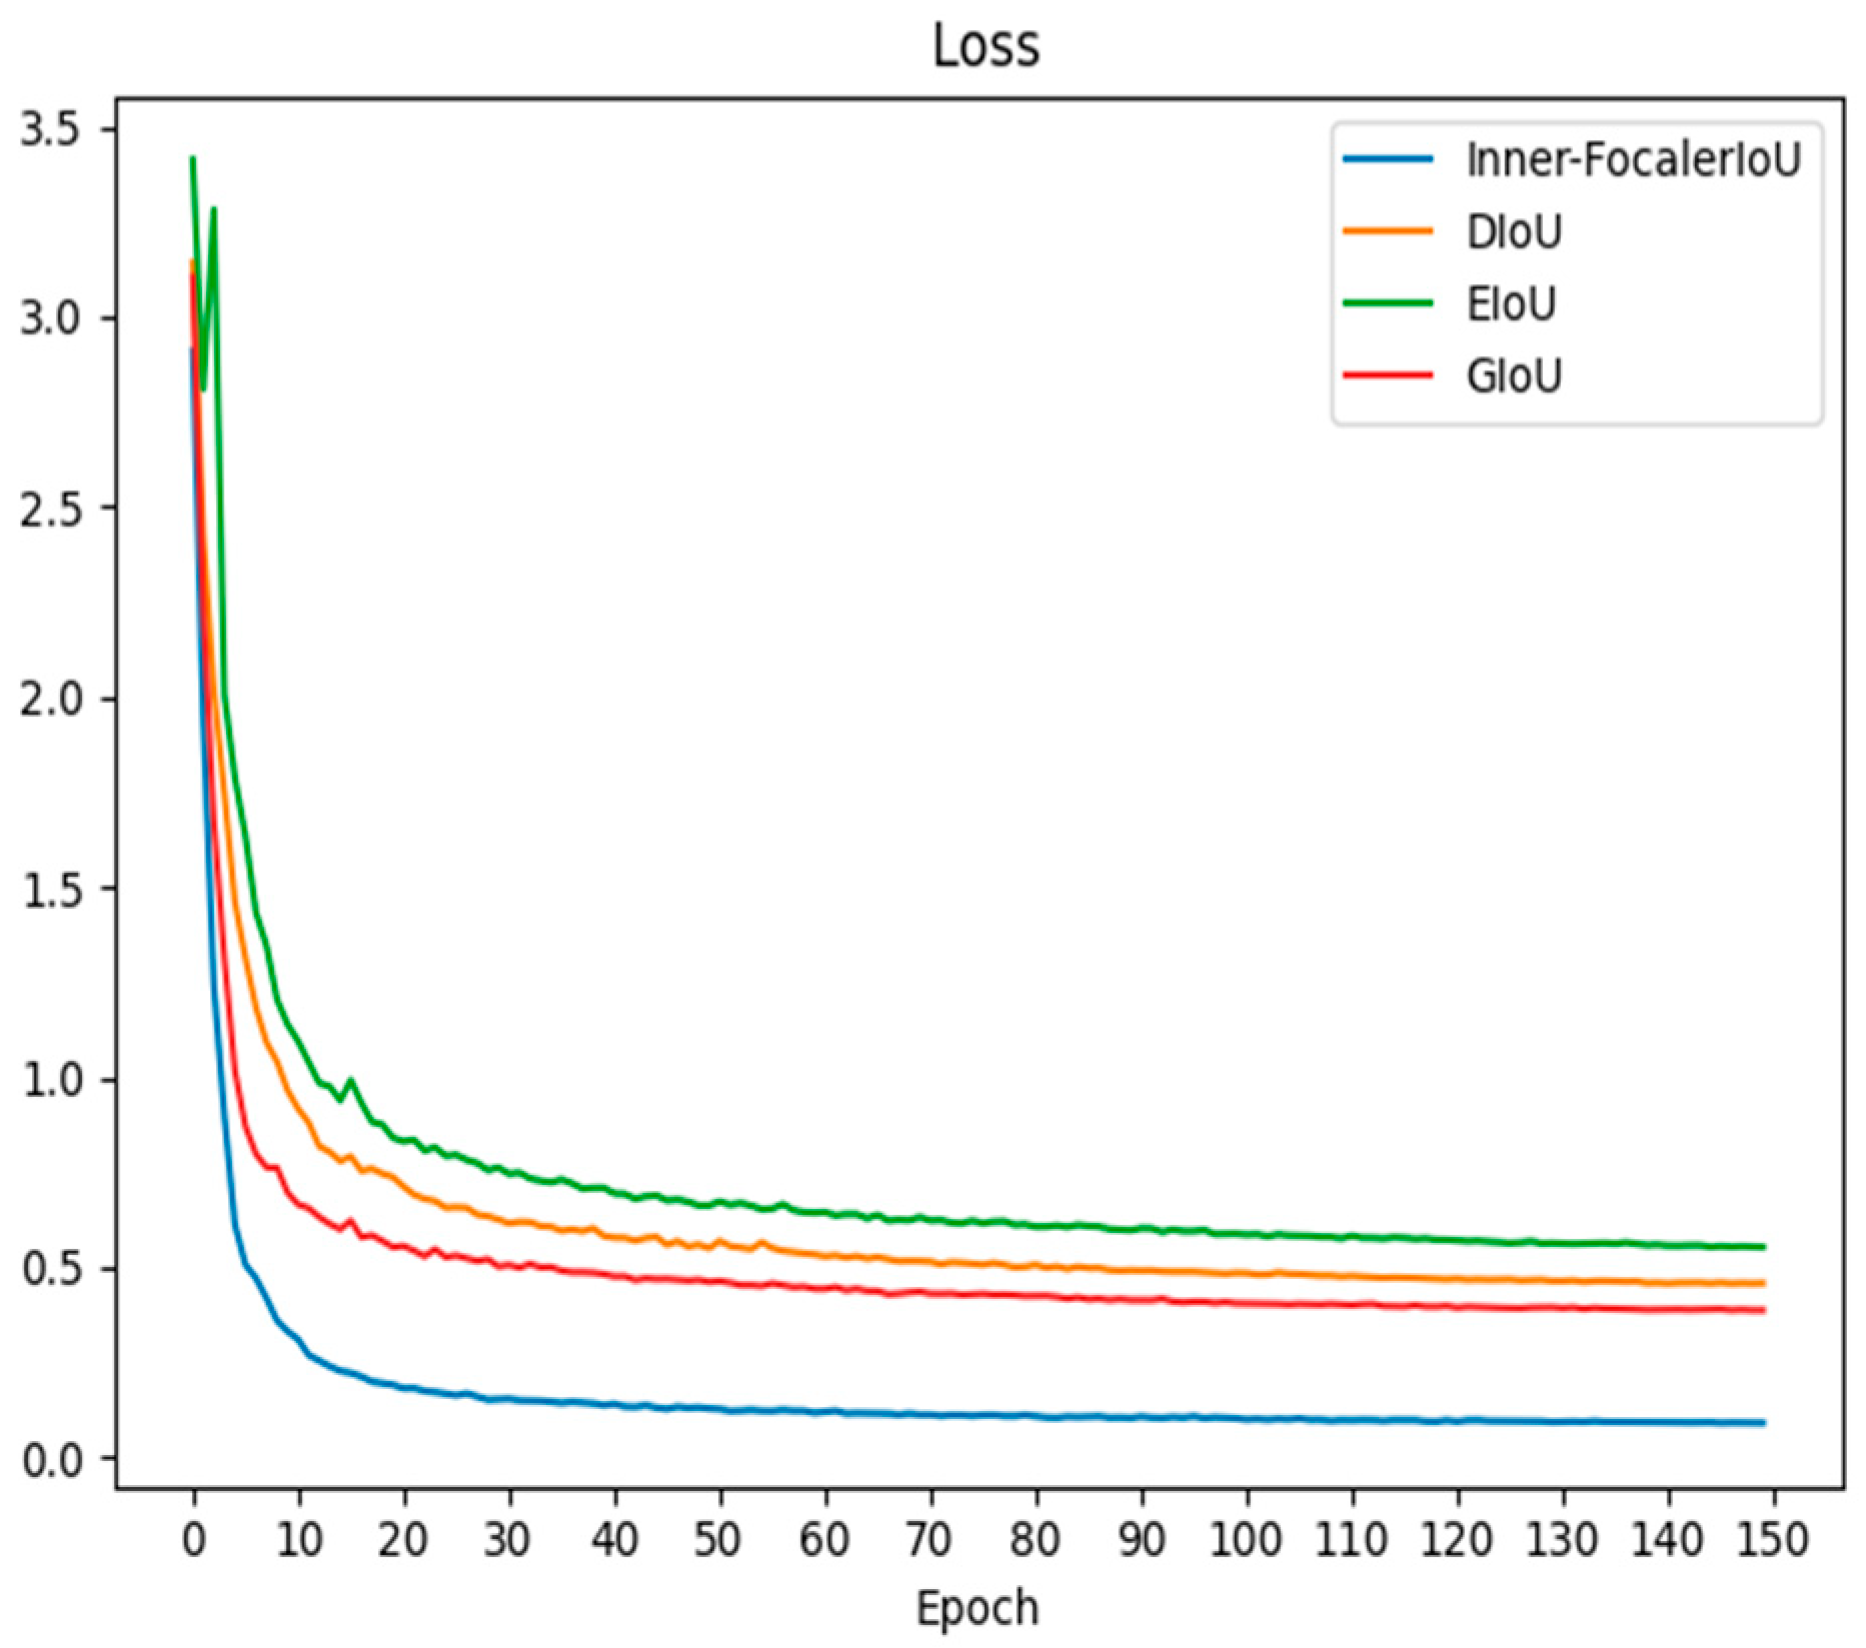
To assess the efficacy of Inner-FocalerIoU, we employed GIoU [28], DIoU [29], EIoU [30], and Inner-FocalerIoU as loss functions for training utilizing the YOLO v8n model within a consistent experimental framework. Figure 8 displays the experimental outcomes. Among all the aforementioned loss functions, the Inner-FocalerIoU loss function has the most rapid convergence time and the lowest loss value.

5. Discussion

5.1. Improved Model Ablation Experiment

To see how they affected performance, ablation experiments were carried out by selectively turning off the ODConv module, GS-PConv module, and the enhanced loss function in OGS-YOLO. The goal of this strategy is to confirm that these feature improvements are essential. Additionally, all testing was conducted using the same hyperparameters and settings to guarantee the accuracy of ablation experiments.
The ablation results in Table 4 show that the ODConv module, the GS-PConv module, and the Inner-FocalerIoU loss function all contribute significantly to improving coffee bean detection performance. In particular, the accuracy and efficiency of the baseline model are enhanced when the ODConv module is introduced alone: the computational load drops from 8.2 to 6.9, and mAP@0.5 rises by 1.3 percentage points. This proves that ODConv is a powerful module that maximizes computational efficiency while improving feature extraction.
However, we also observe that mAP@0.5 drops by 0.6 percentage points when the GS-PConv module is added alone, even though the computational load is successfully decreased to 7.0 GFLOPs. This implies that accuracy may be slightly lost when computing complexity is simply reduced. We coupled ODConv and GS-PConv (Model 4) to solve this problem, and we found that they worked quite well together. The model outperformed both approaches separately, achieving a mAP@0.5 of 74.3% when combined. Additionally, with 6.0 GFLOPs, the computational overhead was the lowest of all combinations. This performance boost is probably the result of ODConv first giving the network more, more informative characteristics. Additionally, the shuffling algorithm of GS-PConv more cleverly eliminates superfluous information without affecting how these important aspects are represented. The lightweighting effect of GS-PConv would probably be restricted in the absence of the superior characteristics offered by ODConv. As a result, ODConv and GS-PConv function exceptionally well when combined.
Introducing the Inner-FocalerIoU loss function based on Model 4 considerably improved the model’s mAP@0.5 and accuracy. This clearly shows that by concentrating the regression process on the most challenging samples, the loss function successfully resolves the dataset’s sample imbalance issue.
The Inner-FocalerIoU loss function, GS-PConv, and the ODConv module are all integrated into the final OGS-YOLOv8 model. It completely outperforms all other model settings with mAP@0.5, precision, and F1-score of 76.0%, 73.7%, and 71.8%, respectively. In addition, the OGS-YOLOv8 model is the most computationally economical of all the models that were examined, with a computational cost of just 6.0 GFLOPs. The efficiency of the Inner-FocalerIoU loss function, ODConv module, and GS-PConv module in the OGS-YOLOv8 architecture is validated by ablation investigations.

5.2. Model Comparison Experiment

To further substantiate the superiority of the OGS-YOLOv8 model, we conducted a comparison with contemporary mainstream object detection algorithms. We conducted a comparison with YOLOv3-tiny, YOLOv5n, YOLOv7-tiny, YOLOv10n, and the original YOLOv8 model. The experiments utilized the coffee bean dataset from this publication. The findings are presented in Table 5.
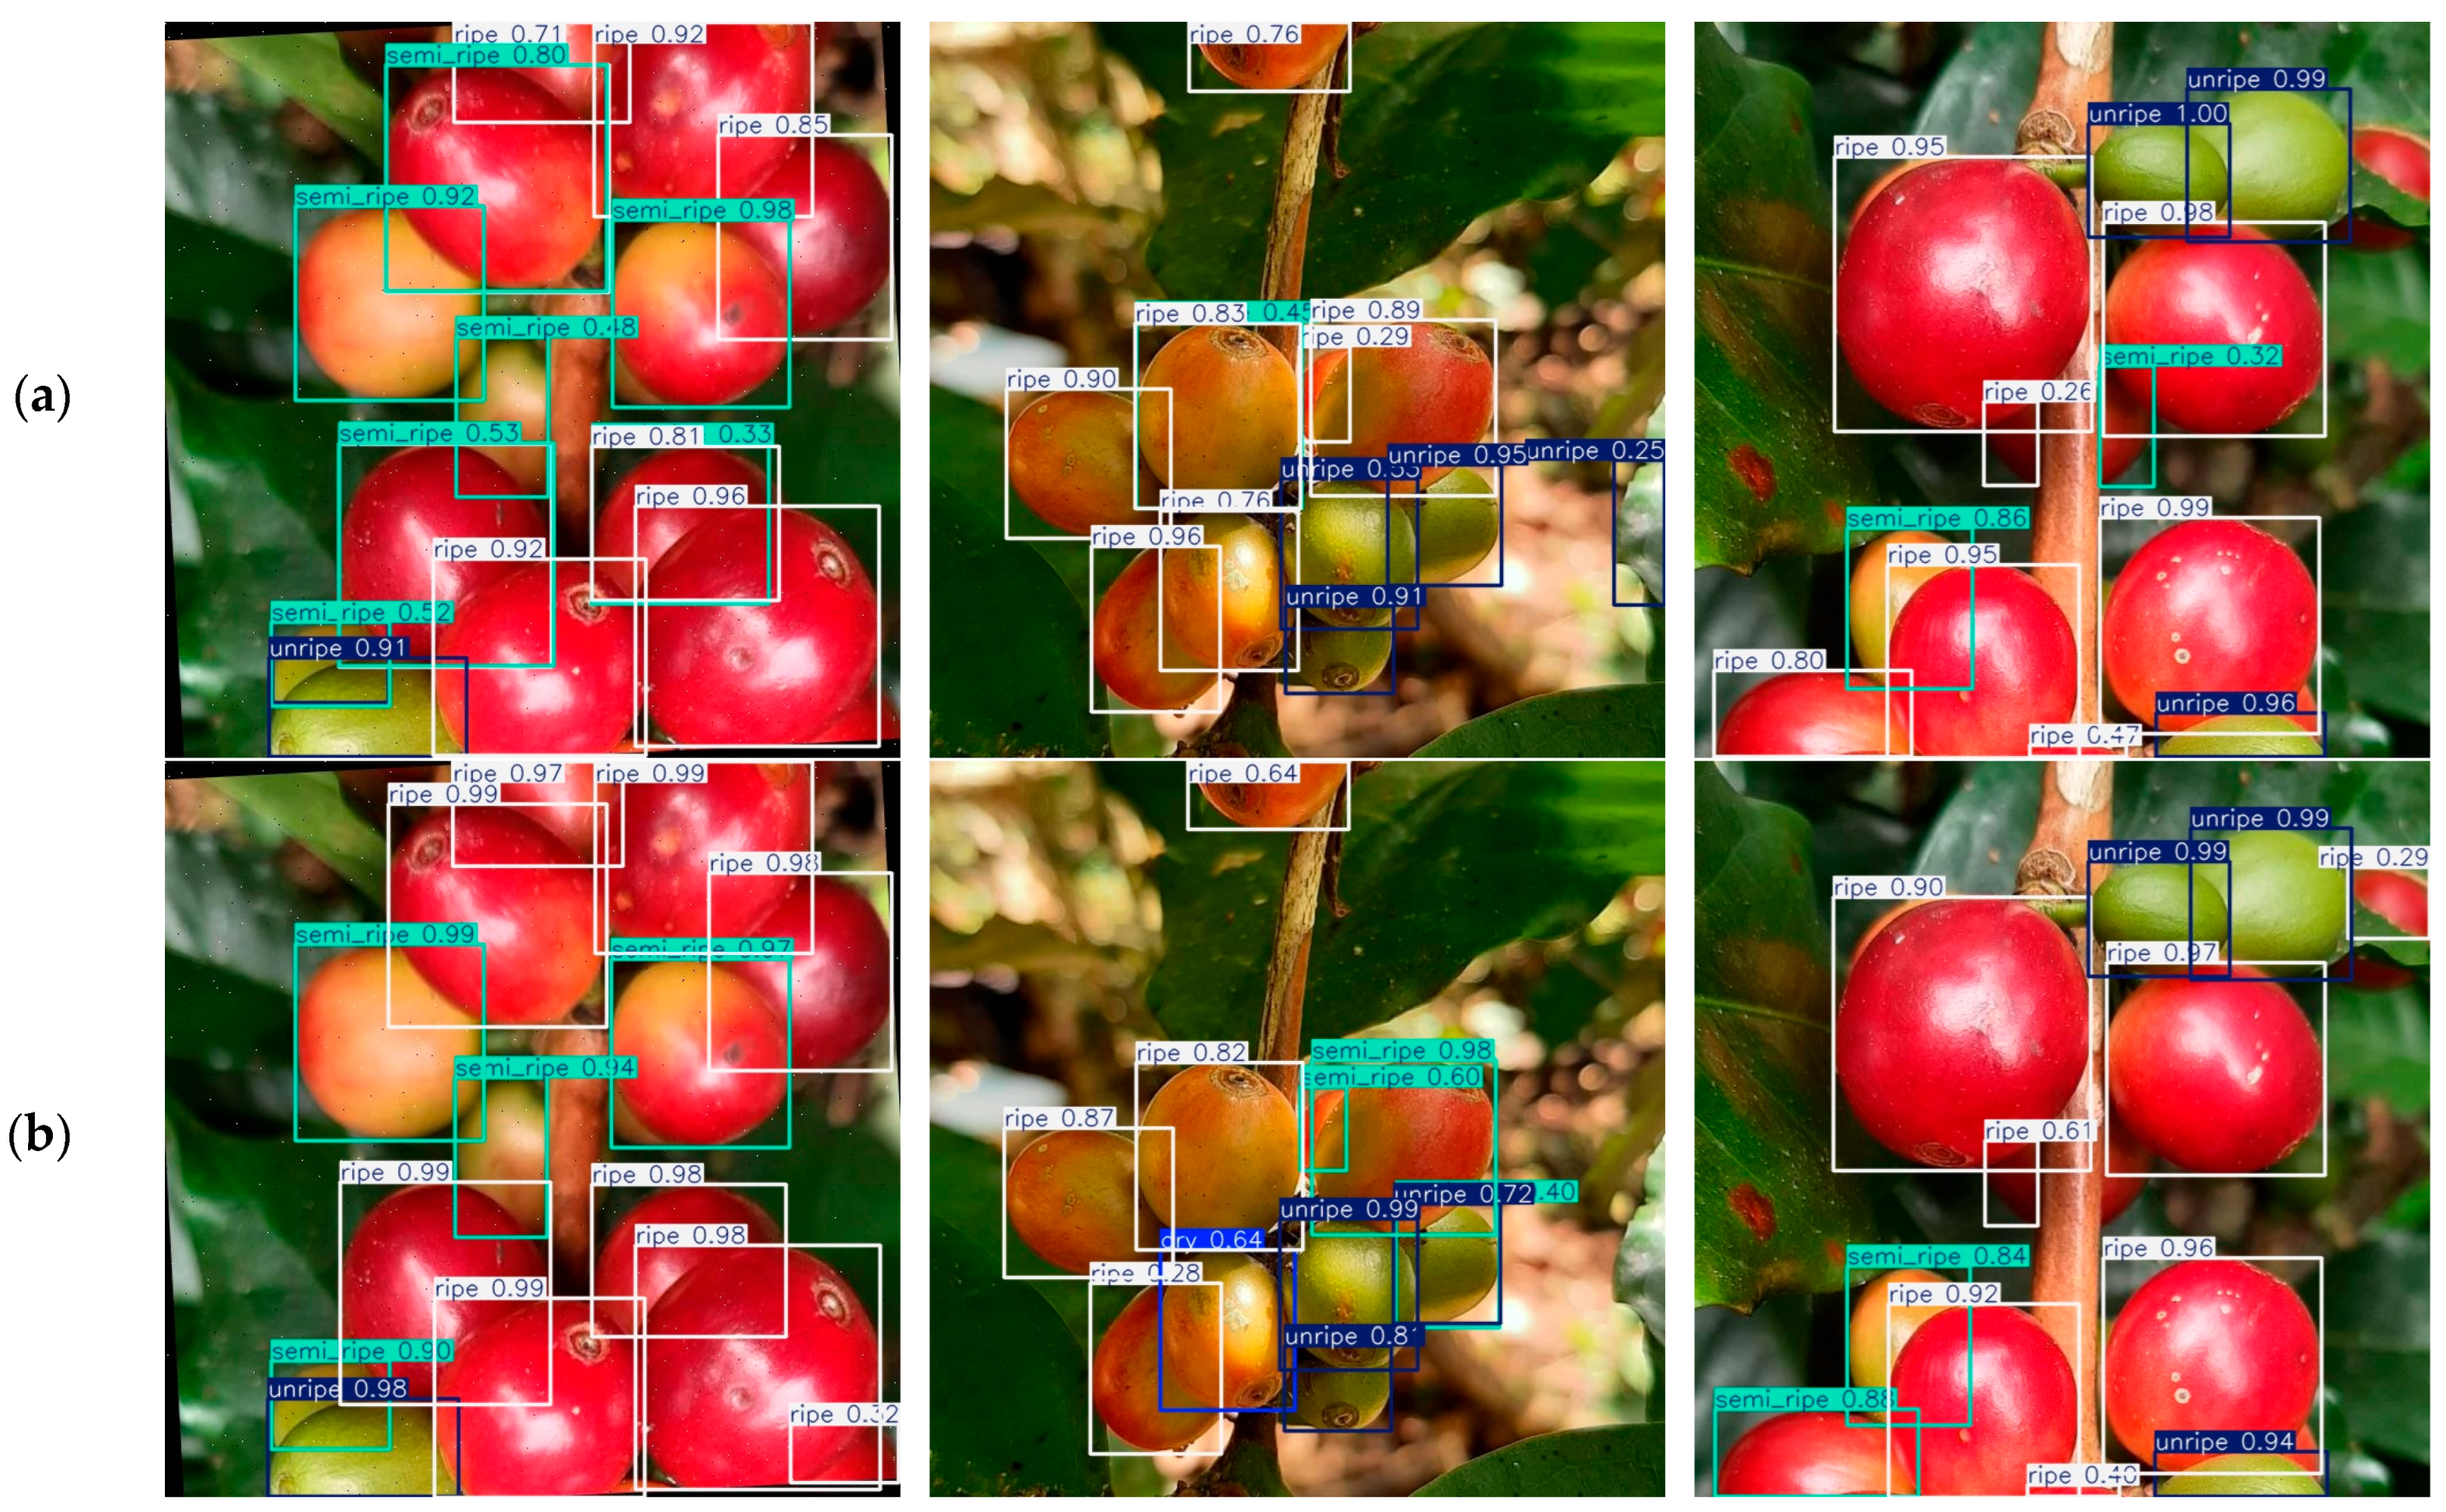
We performed comparative studies against object detection algorithms like YOLO v8n, YOLOv3-tiny [31], YOLO v5n, YOLOv7-tiny [32], and YOLO v10n [33] in order to further validate the performance advantages of the OGS-YOLOv8 model. OGS-YOLOv8 performed the best across all important detection accuracy criteria, as Table 5 illustrates. OGS-YOLOv8 specifically produced improvements of 3.2%, 7.2%, 4.7%, 3.0%, and 3.9% in terms of mAP@0.5 in comparison to YOLO v8n, YOLOv3-tiny, YOLOv5n, YOLOv7-tiny, and YOLOv10n. Furthermore, its precision (73.7%) and F1-score (71.8%) outperform all comparison models. Even though YOLOv5 requires fewer computer resources, OGS-YOLOv8 offers a significant advantage in terms of precision in the detection indicators. This indicates that OGS-YOLOv8 strikes a better balance between performance and resource usage by achieving high detection accuracy while keeping a tolerable processing overhead. OGS-YOLOv8’s better performance is further supported by the detection comparison in Figure 9, which shows that it detects coffee bean maturity more precisely and efficiently than the baseline model, lowering missed detections and false positives.

5.3. Feature Heatmap Visualization

To demonstrate the enhanced detection capabilities of the proposed OGS-YOLOv8 model compared to the original YOLO v8n model, we provide a visual comparison of the feature heatmaps from both models (refer to Figure 10). The heatmap of YOLO v8n exhibits a concentrated red reaction solely within the target area, demonstrating a notable deficiency in feature emphasis. Many regions of pertinent target information remain inadequately active, resulting in deficiencies in essential feature extraction and indirectly affecting detection precision. Conversely, the OGS-YOLOv8 heatmap exhibits a pronounced thermal response, precisely delineating the target’s contour while thoroughly collecting essential textural information. This disparity clearly illustrates the substantial benefits of the enhanced OGS-YOLOv8.

5.4. Application Value and Limitations

This research offers valuable technical support for maturity monitoring and intelligent harvesting in coffee bean agriculture. By enhancing detection precision and minimizing computational resource demands, the model can optimize the timing of coffee bean harvesting, elevate coffee bean quality, and augment the economic advantages of the entire coffee sector. This research possesses specific limitations. The model’s detection accuracy may be compromised in severe lighting conditions or very intricate backdrops. Secondly, despite the model’s lightweight design, additional optimization is required to accommodate various hardware environments for deployment on edge devices. Furthermore, Arabica coffee beans grown in particular places are the primary source of the dataset used in this study. The model’s generalization abilities have been improved by data augmentation approaches, but additional validation may be necessary to assess how well it performs when used with other coffee bean kinds or in various growing environments. To verify the model’s resilience and capacity for generalization, future studies will concentrate on evaluating it using a wider range of datasets.

6. Conclusions

6.1. Model Proposal and Improvement

This work tackles the inadequate accuracy of coffee bean recognition across different maturity stages in intricate contexts by introducing a coffee bean maturity detection algorithm founded on an enhanced YOLOv8. Initially, ODConv is employed to substitute all convolutional layers in the backbone and neck networks to improve feature extraction. Secondly, by improving PConv, GS-PConv was created and used to substitute the Conv layer in the C2f module, creating the new CSGSPC architecture. The model’s computational complexity decreased as a result. The Inner-FocalerIoU loss function supersedes the CIoU loss function to enhance model correctness. As a result of the previously described enhancements, the OGS-YOLOv8 model exhibits exceptional performance on every metric. Comparative tests and ablation studies unequivocally show that this model offers strong technical support for automated and intelligent coffee bean maturity detection while keeping cheap computational costs and greatly improving detection accuracy, recall, and F1-scores.

6.2. Future Research Directions

Future studies will concentrate on further testing and enhancing the model’s performance in real-world field contexts to tackle the intricate conditions of diverse illumination, seasons, and growing locations, hence ensuring resilience and accuracy. The model’s applicability in detecting maturity in other crops will also be examined. The model’s adaptability will be enhanced by transfer learning and fine-tuning, allowing it to adapt to a broader range of crops.

Author Contributions

Conceptualization, N.Z. and Y.W.; methodology, N.Z. and Y.W.; software, N.Z. and Y.W.; validation, N.Z. and Y.W.; formal analysis, N.Z. and Y.W.; investigation, N.Z. and Y.W.; resources, N.Z. and Y.W.; data curation, N.Z. and Y.W.; writing—original draft preparation, Y.W.; writing—review and editing, N.Z.; visualization, Y.W.; supervision, N.Z.; project administration, N.Z.; funding acquisition, N.Z. All authors have read and agreed to the published version of the manuscript.

Funding

This research received no external funding.

Data Availability Statement

Data is contained within the article.

Conflicts of Interest

The authors declare no conflicts of interest.

References

  1. Gao, N.Y.Z.; Lou, Z.C.; Yang, S.L.; Mo, X. Evaluation of World Coffee Industry Competitiveness and China’s Countermeasures. South China Rural Area 2023, 39, 15–23. [Google Scholar] [CrossRef]
  2. Poole, R.; Kennedy, O.J.; Roderick, P.; Fallowfield, J.A.; Hayes, P.C.; Parkes, J. Coffee Consumption and Health: Umbrella Review of Meta-Analyses of Multiple Health Outcomes. BMJ 2017, 359, j5024. [Google Scholar] [CrossRef]
  3. Huang, J.X.; Lv, Y.L.; Li, W.R.; Xia, B.; Xiang, X.; Zhou, X.; Lou, X. Report on China Coffee Industry in 2022. Trop. Agric. Sci. Technol. 2023, 46, 1–5. [Google Scholar] [CrossRef]
  4. Fu, L.; Yang, Z.; Wu, F.; Zou, X.; Lin, J.; Cao, Y.; Duan, J. YOLO-Banana: A Lightweight Neural Network for Rapid Detection of Banana Bunches and Stalks in the Natural Environment. Agronomy 2022, 12, 391. [Google Scholar] [CrossRef]
  5. Ignacio, J.S.; Aisma, K.N.A.E.; Caya, M.V.C. A YOLOv5-based Deep Learning Model for In-Situ Detection and Maturity Grading of Mango. In Proceedings of the 2022 6th International Conference on Communication and Information Systems (ICCIS), Chongqing, China, 21–23 April 2022; pp. 141–147. [Google Scholar] [CrossRef]
  6. Lian, S.; Li, L.; Tan, W.; Tan, L. Research on Tomato Maturity Detection Based on Machine Vision. In The International Conference on Image, Vision and Intelligent Systems (ICIVIS 2021); Lecture Notes in Electrical Engineering; Yao, J., Xiao, Y., You, P., Sun, G., Eds.; Springer: Singapore, 2022; Volume 813. [Google Scholar] [CrossRef]
  7. Liu, Y.; Gong, Z.H.; Li, Z.F.; Liu, T.; Zhao, Z.; Wang, T. Tomato ripeness detection method based on improved YOLOv5. Chin. Agrometeorol. 2024, 45, 1521–1532. [Google Scholar] [CrossRef]
  8. Ma, P.W.; Zhou, J. Grape ripeness detection in complex environments based on improved YOLOv7. Trans. Chin. Soc. Agric. Eng. 2025, 41, 171–178. [Google Scholar] [CrossRef]
  9. Zhou, T.; Wang, J.; Mai, R.G. Real-time object detection method of pineapple ripeness based on improved YOLOv8. J. Huazhong Agric. Univ. 2024, 43, 10–20. [Google Scholar] [CrossRef]
  10. Tian, Y.W.; Qin, S.S.; Yan, Y.B.; Wang, J.; Jiang, F. Detecting blueberry maturity under complex field conditions using improvedYOLOv8. Trans. Chin. Soc. Agric. Eng. 2024, 40, 153–162. [Google Scholar] [CrossRef]
  11. Chen, Y.; Xu, H.; Chang, P.; Huang, Y.; Zhong, F.; Jia, Q.; Chen, L.; Zhong, H.; Liu, S. CES-YOLOv8: Strawberry Maturity Detection Based on the Improved YOLOv8. Agronomy 2024, 14, 1353. [Google Scholar] [CrossRef]
  12. Velasquez, S.; Patricia Franco, A.; Peña, N.; Carlos Bohorquez, J.; Gutierrez, N. Classification of the Maturity Stage of Coffee Cherries Using Comparative Feature and Machine Learning. Coffee Sci. 2021, 16, e161710. [Google Scholar] [CrossRef]
  13. Ge, Z.; Zhang, Y.; Jiang, Y.; Ge, H.; Wu, X.; Jia, Z.; Wang, H.; Jia, K. Lightweight YOLOv7 Algorithm for Multi-Object Recognition on Contrabands in Terahertz Images. Appl. Sci. 2024, 14, 1398. [Google Scholar] [CrossRef]
  14. Reis, D.; Kupec, J.; Hong, J.; Daoudi, A. Real-Time Flying Object Detection with YOLOv8 2024. arXiv 2023, arXiv:2305.09972. [Google Scholar] [CrossRef]
  15. Li, C.; Zhou, A.; Yao, A. Omni-Dimensional Dynamic Convolution. arXiv 2022, arXiv:2209.07947. [Google Scholar] [CrossRef]
  16. Xu, W.; Liu, J.; He, Y.; Yang, Y.; Xie, X.; Yang, X. Deep Learning Model for Cold-Rolled Plate Defect Detection Based on Omni-dimensional Dynamic Convolution and Global Attention Mechanism Enhancement. Metall. Mater. Trans. B 2025, 56, 3980–3996. [Google Scholar] [CrossRef]
  17. Chen, Y.; Dai, X.; Liu, M.; Chen, D.; Yuan, L.; Liu, Z. Dynamic Convolution: Attention over Convolution Kernels. In Proceedings of the 2020 IEEE/CVF Conference on Computer Vision and Pattern Recognition (CVPR), Seattle, WA, USA, 13–19 June 2020; IEEE: Piscataway, NJ, USA, 2020; pp. 11027–11036. [Google Scholar] [CrossRef]
  18. Chen, J.; Kao, S.H.; He, H.; Zhuo, W.; Wen, S.; Lee, C.H.; Chan, S.H.G. Run, Don’t Walk: Chasing Higher FLOPS for Faster Neural Networks. In Proceedings of the 2023 IEEE/CVF Conference on Computer Vision and Pattern Recognition (CVPR), Vancouver, BC, Canada, 17–24 June 2023; pp. 12021–12031. [Google Scholar] [CrossRef]
  19. Zheng, Z.; Wang, P.; Ren, D.; Liu, W.; Ye, R.; Hu, Q.; Zuo, W. Enhancing Geometric Factors in Model Learning and Inference for Object Detection and Instance Segmentation 2021. IEEE Trans. Cybern. 2021, 52, 8574–8586. [Google Scholar] [CrossRef]
  20. Zhang, H.; Xu, C.; Zhang, S. Inner-IoU: More Effective Intersection over Union Loss with Auxiliary Bounding Box. arXiv 2023, arXiv:2311.02877. [Google Scholar] [CrossRef]
  21. Zhang, H.; Zhang, S. Focaler-IoU: More Focused Intersection over Union Loss. arXiv 2024, arXiv:2401.10525. [Google Scholar] [CrossRef]
  22. Yu, C.; Liu, Y.; Zhang, W.; Zhang, X.; Zhang, Y.; Jiang, X. Foreign Objects Identification of Transmission Line Based on Improved YOLOv7. IEEE Access 2023, 11, 51997–52008. [Google Scholar] [CrossRef]
  23. Zhang, X.; Song, Y.; Yang, D.; Ye, Y.; Zhou, J.; Zhang, L. AKConv: Convolutional Kernel with Arbitrary Sampled Shapes and Arbitrary Number of Parameters. arXiv 2024, arXiv:2311.11587. [Google Scholar] [CrossRef]
  24. Sunkara, R.; Luo, T. No More Strided Convolutions or Pooling: A New CNN Building Block for Low-Resolution Images and Small Objects. arXiv 2022, arXiv:2208.03641v1. [Google Scholar] [CrossRef]
  25. Qi, Y.; He, Y.; Qi, X.; Zhang, Y.; Yang, G. Dynamic Snake Convolution Based on Topological Geometric Constraints for Tubular Structure Segmentation. In Proceedings of the 2023 IEEE/CVF International Conference on Computer Vision (ICCV), Paris, France, 2–6 October 2023; pp. 6047–6056. [Google Scholar] [CrossRef]
  26. Zhong, J.; Chen, J.; Mian, A. DualConv: Dual Convolutional Kernels for Lightweight Deep Neural Networks. IEEE Trans. Neural Netw. Learn. Syst. 2023, 34, 9528–9535. [Google Scholar] [CrossRef]
  27. Singh, P.; Verma, V.K.; Rai, P.; Namboodiri, V.P. HetConv: Beyond Homogeneous Convolution Kernels for Deep CNNs. Int. J. Comput. Vis. 2020, 128, 2068–2088. [Google Scholar] [CrossRef]
  28. Rezatofighi, H.; Tsoi, N.; Gwak, J.; Sadeghian, A.; Reid, I.; Savarese, S. Generalized Intersection Over Union: A Metric and a Loss for Bounding Box Regression. In Proceedings of the 2019 IEEE/CVF Conference on Computer Vision and Pattern Recognition (CVPR), Long Beach, CA, USA, 15–20 June 2019; pp. 658–666. [Google Scholar] [CrossRef]
  29. Zheng, Z.; Wang, P.; Liu, W.; Li, J.; Ye, R.; Ren, D. Distance-IoU Loss: Faster and Better Learning for Bounding Box Regression. Proc. AAAI Conf. Artif. Intell. 2020, 34, 12993–13000. [Google Scholar] [CrossRef]
  30. Zhang, Y.-F.; Ren, W.; Zhang, Z.; Jia, Z.; Wang, L.; Tan, T. Focal and Efficient IOU Loss for Accurate Bounding Box Regression. arXiv 2022, arXiv:2101.08158v2. [Google Scholar] [CrossRef]
  31. Redmon, J.; Farhadi, A. YOLOv3: An Incremental Improvement. arXiv 2018, arXiv:1804.02767. [Google Scholar] [CrossRef]
  32. Wang, C.-Y.; Bochkovskiy, A.; Liao, H.-Y.M. YOLOv7: Trainable Bag-of-Freebies Sets New State-of-the-Art for Real-Time Object Detectors. In Proceedings of the 2023 IEEE/CVF Conference on Computer Vision and Pattern Recognition (CVPR), Vancouver, BC, Canada, 17–24 June 2023; IEEE: Piscataway, NJ, USA, 2023; pp. 7464–7475. [Google Scholar] [CrossRef]
  33. Wang, A.; Chen, H.; Liu, L.; Chen, K.; Lin, Z.; Han, J.; Ding, G. YOLOv10: Real-Time End-to-End Object Detection. Adv. Neural Inf. Process. Syst. 2024, 37, 107984–108011. [Google Scholar] [CrossRef]
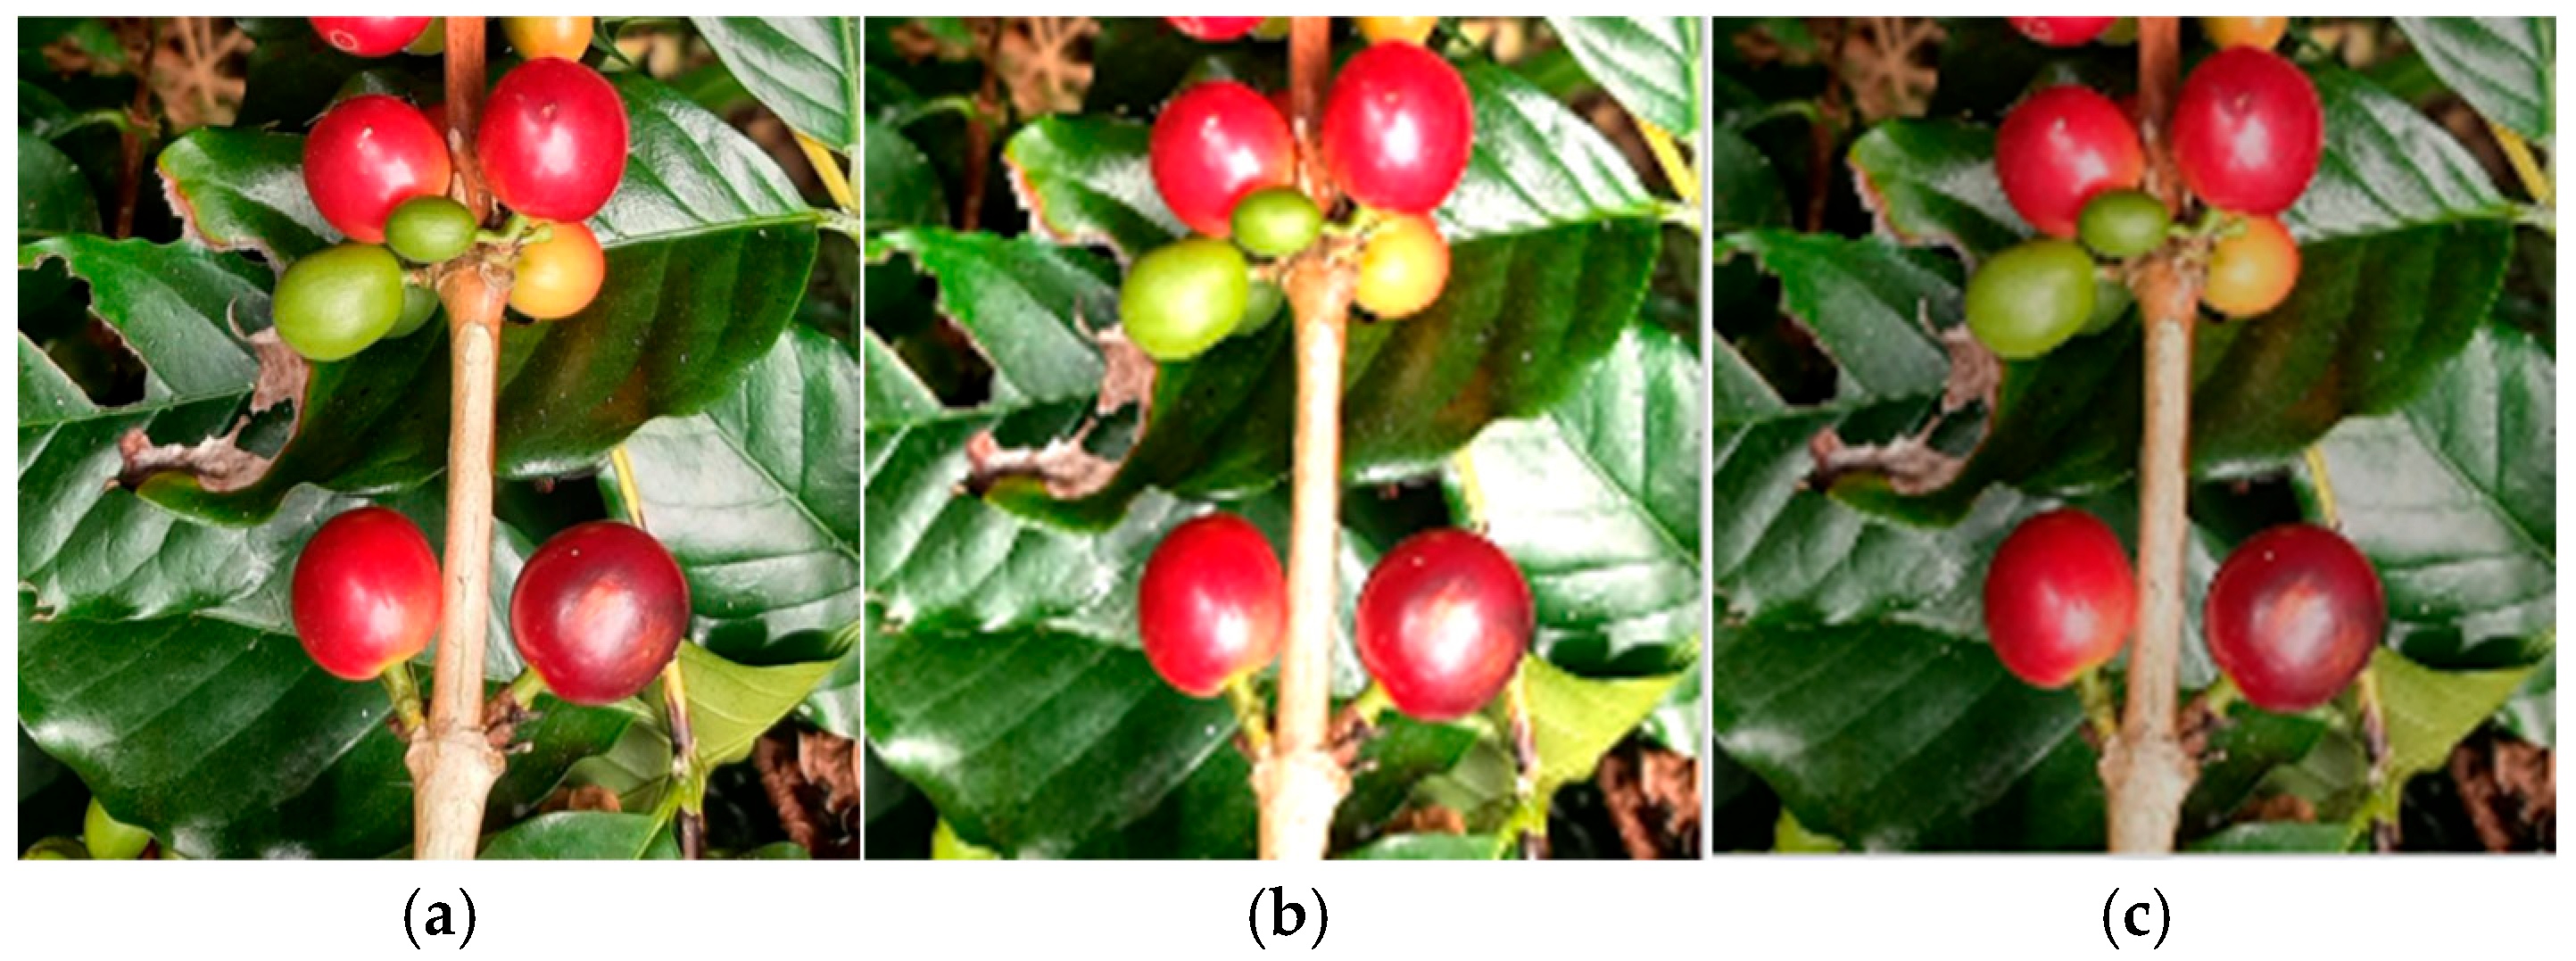
Figure 1. Examples of enhancements to the coffee bean maturity dataset. (a) Original image: shows an image of coffee beans without any processing, used as a baseline for comparison. (b) Brightness enhancement: By increasing the brightness of the image, the appearance of coffee beans under different lighting conditions is simulated. (c) Luminance blur: A blur effect is introduced while adjusting the brightness to simulate image quality degradation that may occur under certain conditions. (d) Rotation: Rotate the image by a certain angle to simulate the change in shooting angle and ensure that the model can effectively recognize coffee beans in different orientations. (e) Gaussian noise: Gaussian noise is added to the image to simulate the image noise that may be encountered in real-world shooting and enhance the model’s robustness to noise. (f) Flip: Flip the image horizontally or vertically to ensure that the model is insensitive to left-right or upside-down changes in the coffee beans.
Applsci 15 11632 g001aApplsci 15 11632 g001b
Figure 2. OGS-YOLOv8 network structure.
Applsci 15 11632 g002
Figure 3. ODConv convolution structure.
Applsci 15 11632 g003
Figure 4. PConv structural diagram.
Applsci 15 11632 g004
Figure 5. GS-PConv structural diagram.
Applsci 15 11632 g005
Figure 6. CSGSPC structural diagram.
Applsci 15 11632 g006
Figure 7. Comparison chart of training process.
Applsci 15 11632 g007
Figure 8. A comparison plot of various loss functions.
Applsci 15 11632 g008
Figure 9. Comparison of OGS-YOLOv8 and YOLOv8 detection effect. (a) YOLOv8 detects coffee bean images under dense, front-lit, leaf-occluded, and backlit conditions. (b) OGS-YOLOv8 detects coffee bean images under dense, front-lit, leaf-occluded, and backlit conditions.
Applsci 15 11632 g009
Figure 10. Model heatmap.
Applsci 15 11632 g010
Table 1. Coffee Bean Maturity Dataset Basic Information.
DatasetsNumber of Image SamplesImmaturePartially DriedDryMaturityOvermaturity
Training set176816,40618595832688413
Validation set50038855891521250213
Test set25527271979037063
Total252323,01826458254308689
Table 2. Ablation Comparisons with Various Dynamic Convolutions.
ModelmAP@0.5/%Precision/%F1-Score/%FLOPs/GInference Time/ms
YOLO v8n72.866.368.68.26.7
ODConv-YOLO v8n74.170.470.56.99.2
AKConv-YOLO v8n69.964.466.07.49.4
SPD-Conv-YOLO v8n72.269.670.17.49.8
DSConv-YOLO v8n70.668.969.29.510.1
Table 3. Ablation Comparison Tests with Several Lightweight Convolutions.
ModelmAP@0.5/%Precision/%F1-Score/%FLOPs/GInference Time/ms
YOLO v8n72.866.368.68.26.7
GS-PConv-YOLO v8n72.267.269.37.08.3
FasterBlock-YOLO v8n72.564.368.97.69.9
DualConv-YOLO v8n71.966.568.68.19.8
HetConv-YOLO v8n71.665.067.26.615.6
Table 4. Experimental results of model ablation.
ModelODConvGS-PConvInner-FocalerIoUmAP@0.5/%Precision/%F1-Score/%FLOPs/GmAP@0.5–0.95/%
YOLO v8n×××72.866.368.68.267.0
Model 1××74.170.470.16.968.2
Model 2××72.267.269.37.066.1
Model 3××73.668.870.68.167.9
Model 4×74.372.071.56.067.7
Model 5×74.366.471.16.968.0
Model 6×72.068.769.57.265.4
OGS-YOLOv876.073.771.86.069.2
The √ symbol indicates that the corresponding component is included in the model configuration. The × symbol indicates that the corresponding part is not included in the model configuration.
Table 5. Comparison of detection results from various models.
ModelmAP@0.5/%Precision/%F1-Score/%FLOPs/GmAP@0.5–0.95/%
YOLO v8n72.866.368.68.267.0
YOLOv3-tity68.866.867.212.957.5
YOLO v5n71.373.070.44.165.1
YOLOv7-tity73.061.268.213.167.0
YOLO v10n72.170.869.88.266.6
OGS-YOLOv876.073.771.86.069.2
Disclaimer/Publisher’s Note: The statements, opinions and data contained in all publications are solely those of the individual author(s) and contributor(s) and not of MDPI and/or the editor(s). MDPI and/or the editor(s) disclaim responsibility for any injury to people or property resulting from any ideas, methods, instructions or products referred to in the content.