Article

IoT Sensing-Based High-Density Monitoring of Urban Roadside Particulate Matter (PM10 and PM2.5)

1
Department of Future & Smart Construction Research, Korea Institute of Civil Engineering and Building Technology, 283 Goyang-daero, Ilsanseo-gu, Goyang-si 10223, Gyeonggi-do, Republic of Korea
2
BISTelligence, Inc., 13F, Building B, 330 Gangnam-daero, Seocho-gu, Seoul 06627, Republic of Korea
*
Author to whom correspondence should be addressed.
Appl. Sci. 2025, 15(21), 11608; https://doi.org/10.3390/app152111608
Submission received: 25 August 2025 / Revised: 22 October 2025 / Accepted: 29 October 2025 / Published: 30 October 2025
(This article belongs to the Section Transportation and Future Mobility)

Abstract

Particulate matter (PM) poses serious health risks, including respiratory and cardiovascular diseases, and is classified as a carcinogen by the World Health Organization and International Agency for Research on Cancer. Roadside air pollution, which is strongly affected by traffic emissions, is a major contributor to urban air quality deterioration. This study investigated the feasibility of establishing a low-cost, Internet of Things (IoT)-based, high-density monitoring network for roadside PM10 and PM2.5 to support safer and more sustainable road environments. We developed low-cost IoT sensing devices, deployed them at three urban roadside sites with different environmental conditions, and compared their performances with those of nearby public monitoring stations. One-minute resolution data were analyzed using Pearson correlation, cross-correlation, dynamic time warping, Z-score, and the roulette index. The IoT sensor data were strongly correlated with public station data, confirming its reliability as a complementary observation method. Notable site-specific patterns were sharp concentration increases with traffic at an intersection and distinct diurnal and weekly cycles at residential and rooftop sites. These findings demonstrate that low-cost IoT sensing can complement sparse public networks by providing microscale air quality information. This approach offers a practical foundation for smart city development and intelligent roadside environmental management.

1. Introduction

Rapid industrial and economic development has intensified urban air pollution, with some of the major sources being power generation, manufacturing, household combustion, vehicular emissions, and resuspended dust. The International Agency for Research on Cancer classified particulate matter (PM) as a Group 1 carcinogen in 2013 [1]. Accordingly, several countries have provided real-time air quality information on this pollutant. In South Korea, the Ministry of Environment operates the AirKorea service [2], which delivers data on PM ≤ 10 μm (PM10, and PM ≤ 2.5 μm (PM2.5) as well as four other regulated pollutants (i.e., SO2, CO, NO2, and O3) from 665 monitoring stations nationwide (as of July 2025).
The health impacts of PM depend more on particle size and chemical composition than on mass concentration [3]. Coarse particles (2.5–10 μm) show notable toxicity, while trafine particles from internal combustion engines have high surface areas and mobility in the human body [4].
In urban areas, PM10 and PM2.5 arise from both natural and anthropogenic factors. Natural sources include Asian dust, wildfires, sea salt, and biogenic volatile organic compounds, whereas anthropogenic sources include construction, industrial emissions, residential heating, and cooking. The higher heating demand in winter also significantly increases PM2.5 emissions. In particular, traffic is the most critical anthropogenic contributor. Millions of roadside residents and commuters are exposed to traffic-related air pollution [5,6,7], which comprises gases and particles of varying composition depending on the vehicle type, fuel, and meteorology [8]. In addition to exhaust emissions (e.g., CO, NOx, PM, and hydrocarbons) [4,9], non-exhaust sources such as brake and tire wear, road surface abrasion, and resuspended dust have been increasingly recognized. Roadside PM directly reflects traffic emissions and provides crucial data for policymaking and health impact assessments. Recent studies have reported that road dust accounts for up to 87.7% of the roadside PM10 increase [10]. Consequently, intersections, tunnel entrances, and bus stops often serve as high-exposure hotspots.
The 64 roadside monitoring stations currently established in South Korea represent only 9.8% of the national monitoring network, which limits their ability to capture fine-scale roadside variability. These stations are typically located within meters of the curb at a height of approximately 3 m to monitor vehicular emissions; however, their sparse distribution does not reflect localized conditions across dense urban road networks. Moreover, both highway users and pedestrians remain continuously exposed, underscoring the need for real-time high-resolution roadside information. Given the complexity of urban infrastructure and traffic, the current monitoring density is insufficient to track localized PM distribution. Although public networks provide robust baseline data, their low density highlights the need for complementary methods. Because expanding the number of roadside stations is expensive, the use of Internet of Things (IoT)-based low-cost sensors serves as a practical alternative to high-density networks.
In this context, this study proposed and validated a low-cost IoT-based sensing device for spatiotemporally dense roadside PM monitoring. Field experiments were conducted at multiple urban sites and compared with public stations to assess their feasibility. The remainder of this paper is structured as follows: Section 2 reviews related work, Section 3 presents the methodology and experimental setup, Section 4 provides comparative analyses, Section 5 discusses the findings, and Section 6 concludes with the implications and future research directions.

2. Literature Review

In South Korea, fixed roadside monitoring stations continuously record data (e.g., at 1-min or hourly intervals) from various urban locations, such as intersections, dedicated lanes, and medians. For example, Seoul operates 14 automatic roadside stations—10 at street sides, two on dedicated lanes, and two on medians—that measure NO2, PM10, PM2.5, and meteorological and traffic parameters in real time [11]. These networks allow for comparative analyses with national public monitoring data (AirKorea) to identify localized variations. However, apart from the three stations in Daejeon, most municipalities operate only one or two stations, rendering dense monitoring infeasible.
Numerous studies have sought efficient roadside monitoring strategies to address this problem. Woo et al. [12] used a mobile monitoring system to measure the ultrafine particle concentrations and size distributions on the inner ring roads of Seoul. The results showed the highest concentrations inside the tunnels, averaging 1.8 times greater than those outside segments, with sharp declines at the tunnel exits due to dilution. The concentrations also decreased with increasing wind speed outside the tunnel zones. Kang et al. [13,14] analyzed highway air quality and management strategies, identifying hotspots in other areas (due to truck idling), tollgates (during peak hours), and tunnels (traffic congestion). Mitigation technologies, such as central barrier shields, microbubble sprays, and filtration systems, have been suggested. Kim et al. [15] examined roadside pollutants in Bucheon using machine learning and an air quality monitoring system and found the highest levels in industrial districts and on major arterial roads.
Overall, domestic studies have consistently emphasized elevated and highly variable PM concentrations near tunnels, intersections, rest areas, and tollgates, which are largely influenced by traffic intensity, structure, wind speed, and the time of day. These studies highlight the limitations of the current public monitoring network, which relies on sparsely fixed stations, and the need for real-time, localized monitoring.
Internationally, diverse approaches have also been explored. Khan et al. [16] applied system dynamics modeling to evaluate feedback mechanisms for controlling resuspended road dust and proposed sustainable policy scenarios. McCarthy et al. [17] focused on PM2.5 emissions from vehicles, roadside monitoring, and source apportionment. Zhang and Peng [18] employed artificial neural networks to estimate roadside PM2.5 using traffic and meteorological inputs and validated their method in Florida and Shanghai. Srimuruganandam [19] investigated the elemental composition of road dust in India and highlighted the health risks posed by inhalable particles. Navarro-Ciurana et al. [20] demonstrated that fine road dust particles (<45 µm) carry higher concentrations of potentially toxic elements. Choi et al. [21] used urban CCTV (closed-circuit television) data with deep learning to estimate PM concentrations and achieved a promising accuracy (RMSE = 3.61, MAPE = 19.74%).
Recent advances have highlighted the potential of low-cost optical sensors, particularly laser-scattering devices (e.g., PMS and SDS series) capable of simultaneously measuring PM1, PM2.5, and PM10 [22,23,24,25]. Calibration against reference instruments remains essential, with correlation coefficients typically ranging from 0.77–to 0.95; in addition, temperature and/or humidity corrections [23,25] and cross-validation between sensors [24,26] are also necessary. Despite the challenges in data quality and environmental adjustments, IoT-based sensor networks, machine learning integration, and multi-pollutant systems are increasingly being adopted for use in real-time, high-resolution roadside monitoring.
Previous studies [12,13,14,15,16,17,18,19,20,21] have demonstrated that high PM concentrations repeatedly occur at traffic-intensive locations and that spatiotemporally dense monitoring is necessary to capture localized dynamics. The limited number of fixed public stations further underscores the importance of low-cost IoT sensor networks and mobile platforms. These systems offer cost-effective and easily maintained solutions for capturing fine-scale roadside air quality variations, thereby enabling improved urban air quality management and evidence-based public health protection.

3. Methodology

3.1. Development of IoT Devices

The effective spatiotemporal monitoring of roadside PM in urban areas and along major roads necessitates a low-cost and low-power device capable of making accurate measurements. Compact and lightweight devices enable monitoring systems to be deployed not only at fixed stations, but also within distributed IoT networks, enhancing their capacity to observe and analyze roadside PM concentrations.
In this study, IoT sensing-based monitoring devices were developed using a Raspberry Pi Zero 2 W general-purpose processor [27] and a low-cost light-scattering-based PM sensor (PM2008M [28]) widely adopted in industrial applications. The system integrates Wi-Fi communication and miniature sensor modules, enabling real-time monitoring and scalable deployment in smart city environments. The device consists of an ARM Cortex-A53 embedded board [27], low-cost PM sensors, environmental sensors (temperature, humidity, and pressure), and a communication module that utilizes the MQTT (message queuing telemetry transport) protocol [29] with JSON (javascript object notation) data formatting [30]. Figure 1 illustrates the developed roadside monitoring device.
Based on the components shown in Figure 1, the working principle of the IoT-based PM monitoring device is as follows: The PM sensor continuously measures the mass concentrations of PM1.0, PM2.5, and PM10 using a laser light-scattering method. The environmental sensors collect temperature, humidity, and barometric pressure data, which can be used as calibration references under varying atmospheric conditions. These data are transmitted to the main processor through dedicated sensor interface ports (Air Quality and Environmental I/Fs), where they are formatted into JSON packets and uploaded via the MQTT protocol using Wi-Fi communication. The entire system is powered by a 30,000 mAh power bank, allowing long-term roadside operation.
The PM sensor measures the mass concentrations of PM1.0, PM2.5, and PM10 in real time, and the environmental sensors (barometric pressure and temperature/humidity) provide auxiliary meteorological parameters such as barometric pressure, temperature, and humidity, which can serve as calibration references when operating under different altitudes or regional environments. Although the IoT device hardware and software were designed to support such compensation, this function was not applied in the present study, as the experiments focused on short-range roadside measurements under similar meteorological conditions.
Data were collected at 1-s intervals and transmitted to a broker server via MQTT. The IoT device packages sensor data in the JSON format, following the strcture below:
{
    “device_id”: “RSPM-0001”,
    “latitude”: “xxx.xxxxxxx”,
    “longitude”: “yyy.yyyyyyy”,
    “timestamp”: “2025-07-06T14:33:02Z”,
    “pm1_0”: 18,
    “pm2_5”: 26,
    “pm10”: 41,
    “temp”: 26.4,
    “humidity”: 74.3,
    “pressure”: 1005.7
{
Messages are published at 1-s intervals, and the broker server stores the collected data in a database.
To verify the reliability of the developed device, ten identical sensor units, identical to those shown in Figure 1, were manufactured and calibrated in a controlled laboratory chamber. Each IoT device was equipped with a PM2008m particulate-matter sensor module [30], which is among the Grade-1 sensors officially approved under the Korean national certification system for temporary air-quality monitoring instruments. The calibration of each PM sensor was performed in accordance with the manufacturer’s PM2008m manual [30], and the performance consistency was assessed by comparing the agreement among the ten sensor datasets.
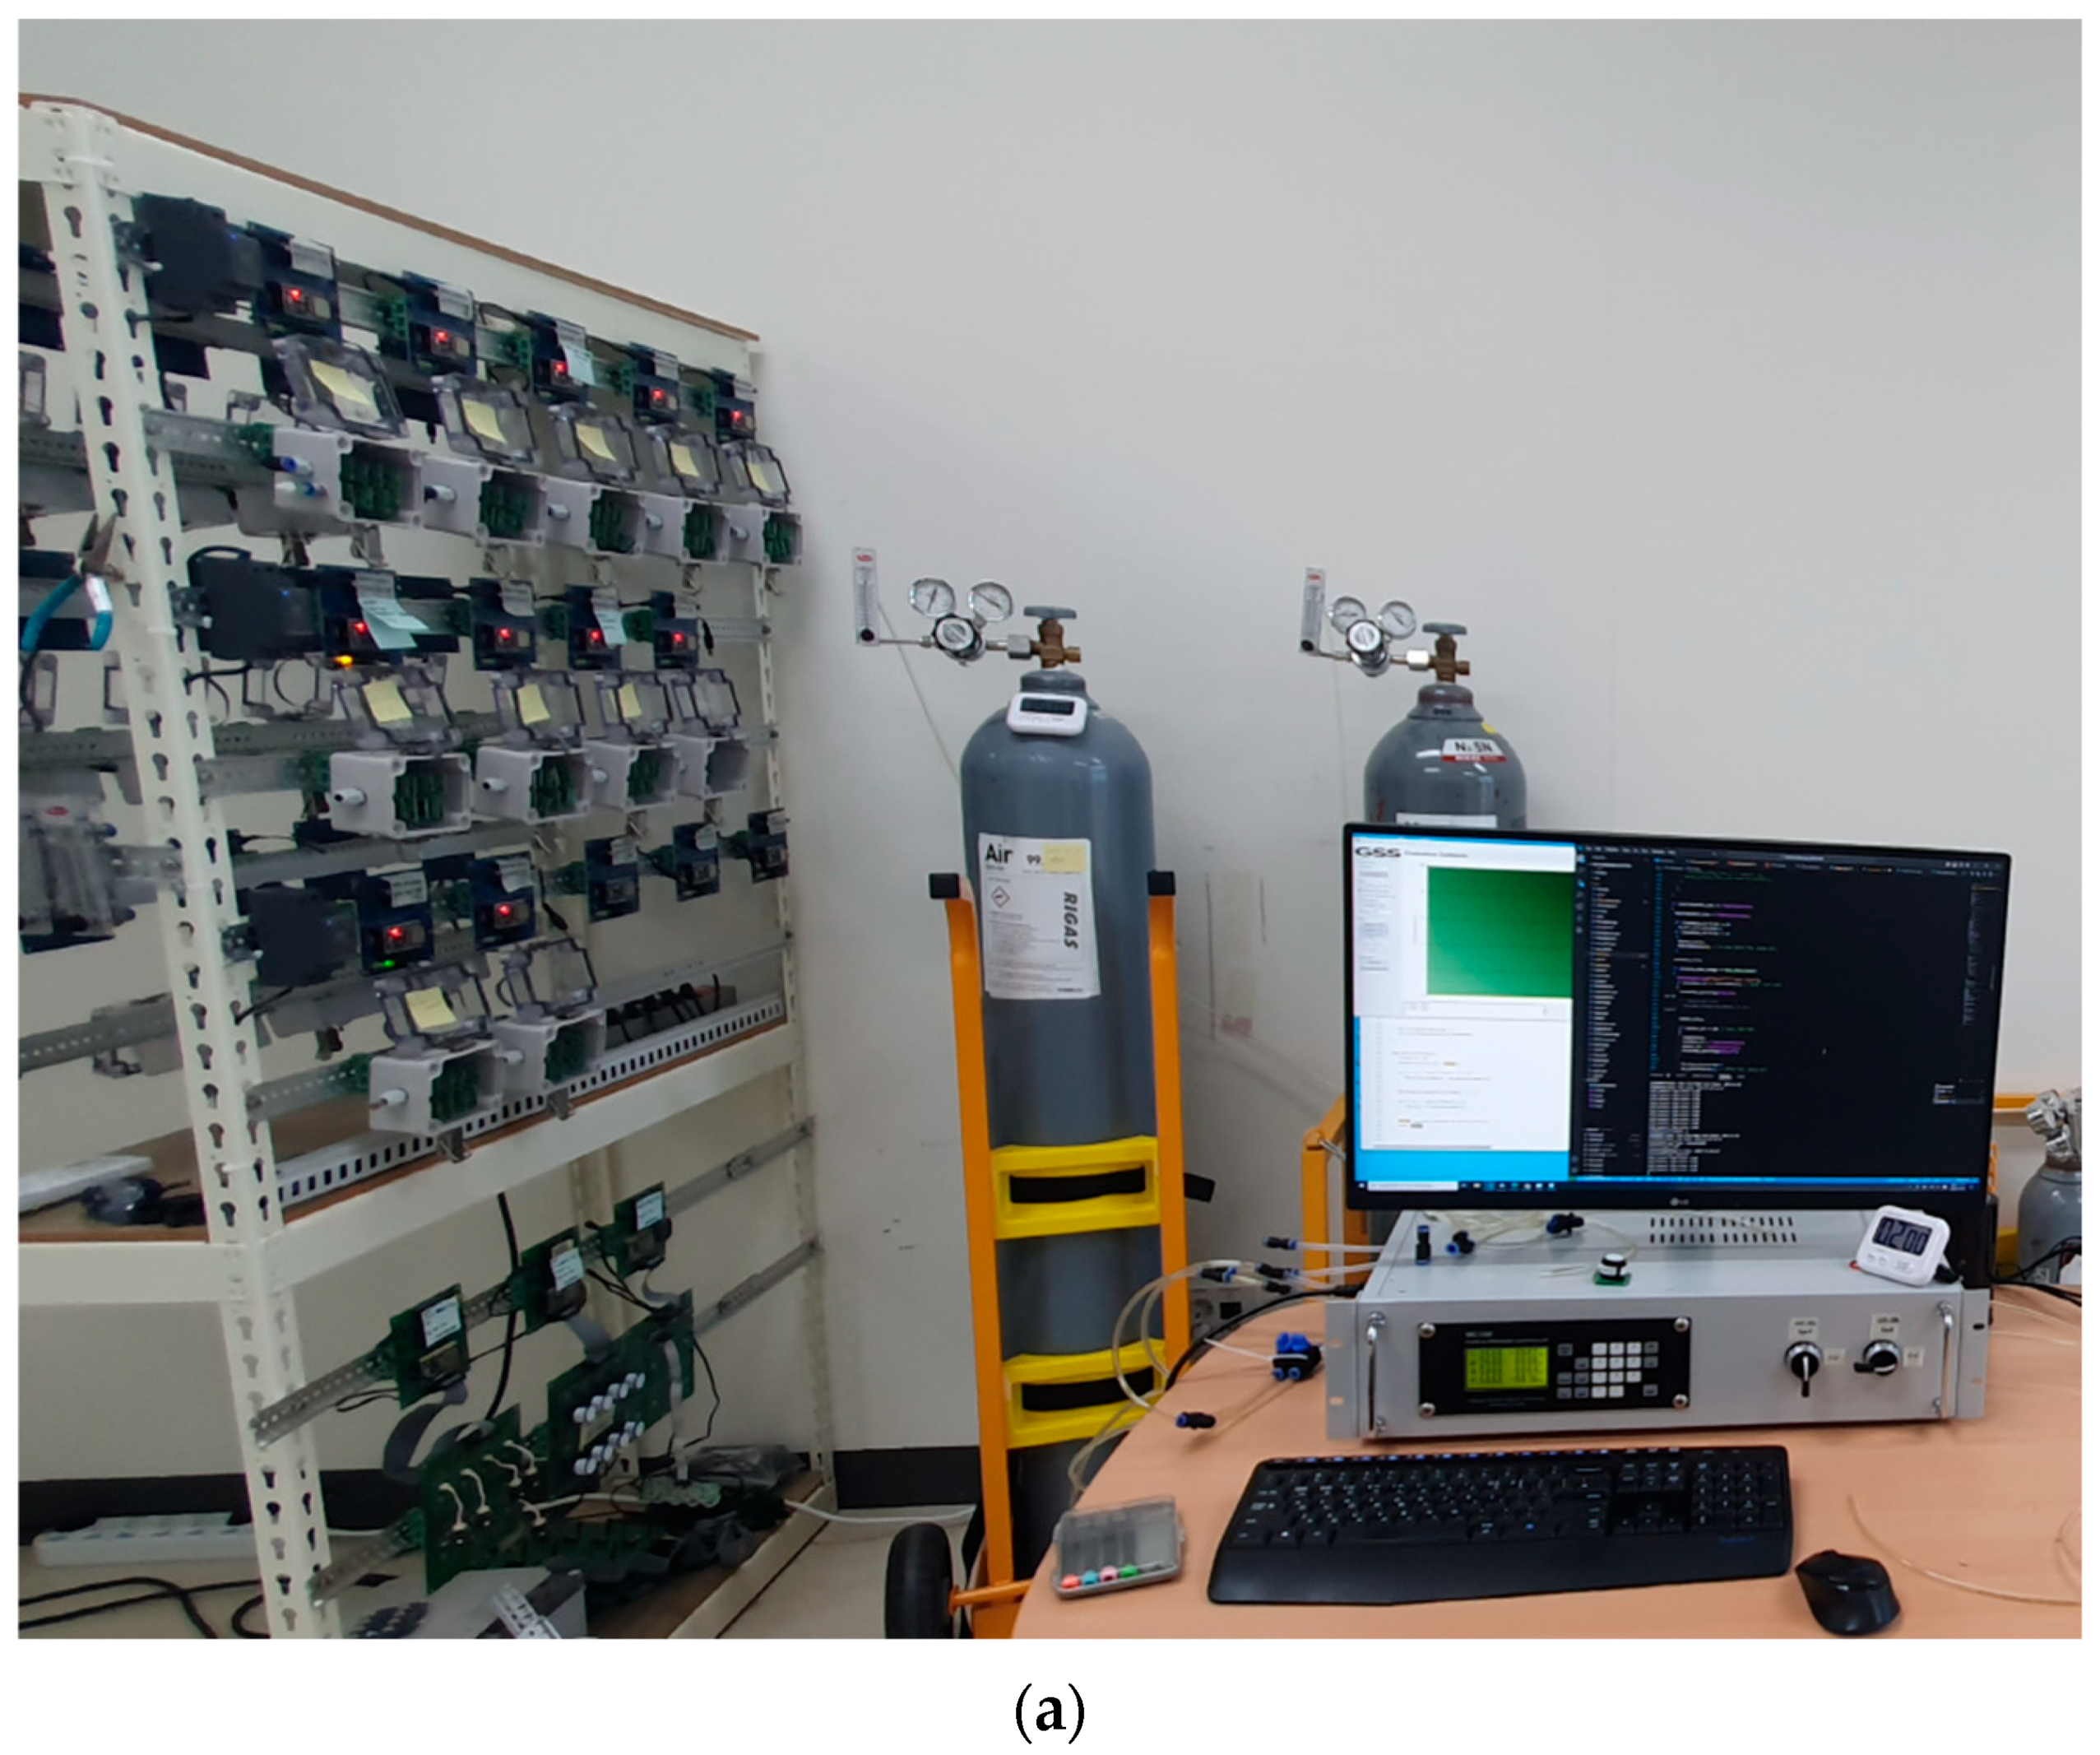
Subsequently, a co-exposure experiment was conducted, in which all sensors were simultaneously exposed to the same particulate-matter environment to validate inter-sensor consistency. Figure 2 presents both the experimental setup and the resulting data for inter-sensor validation.
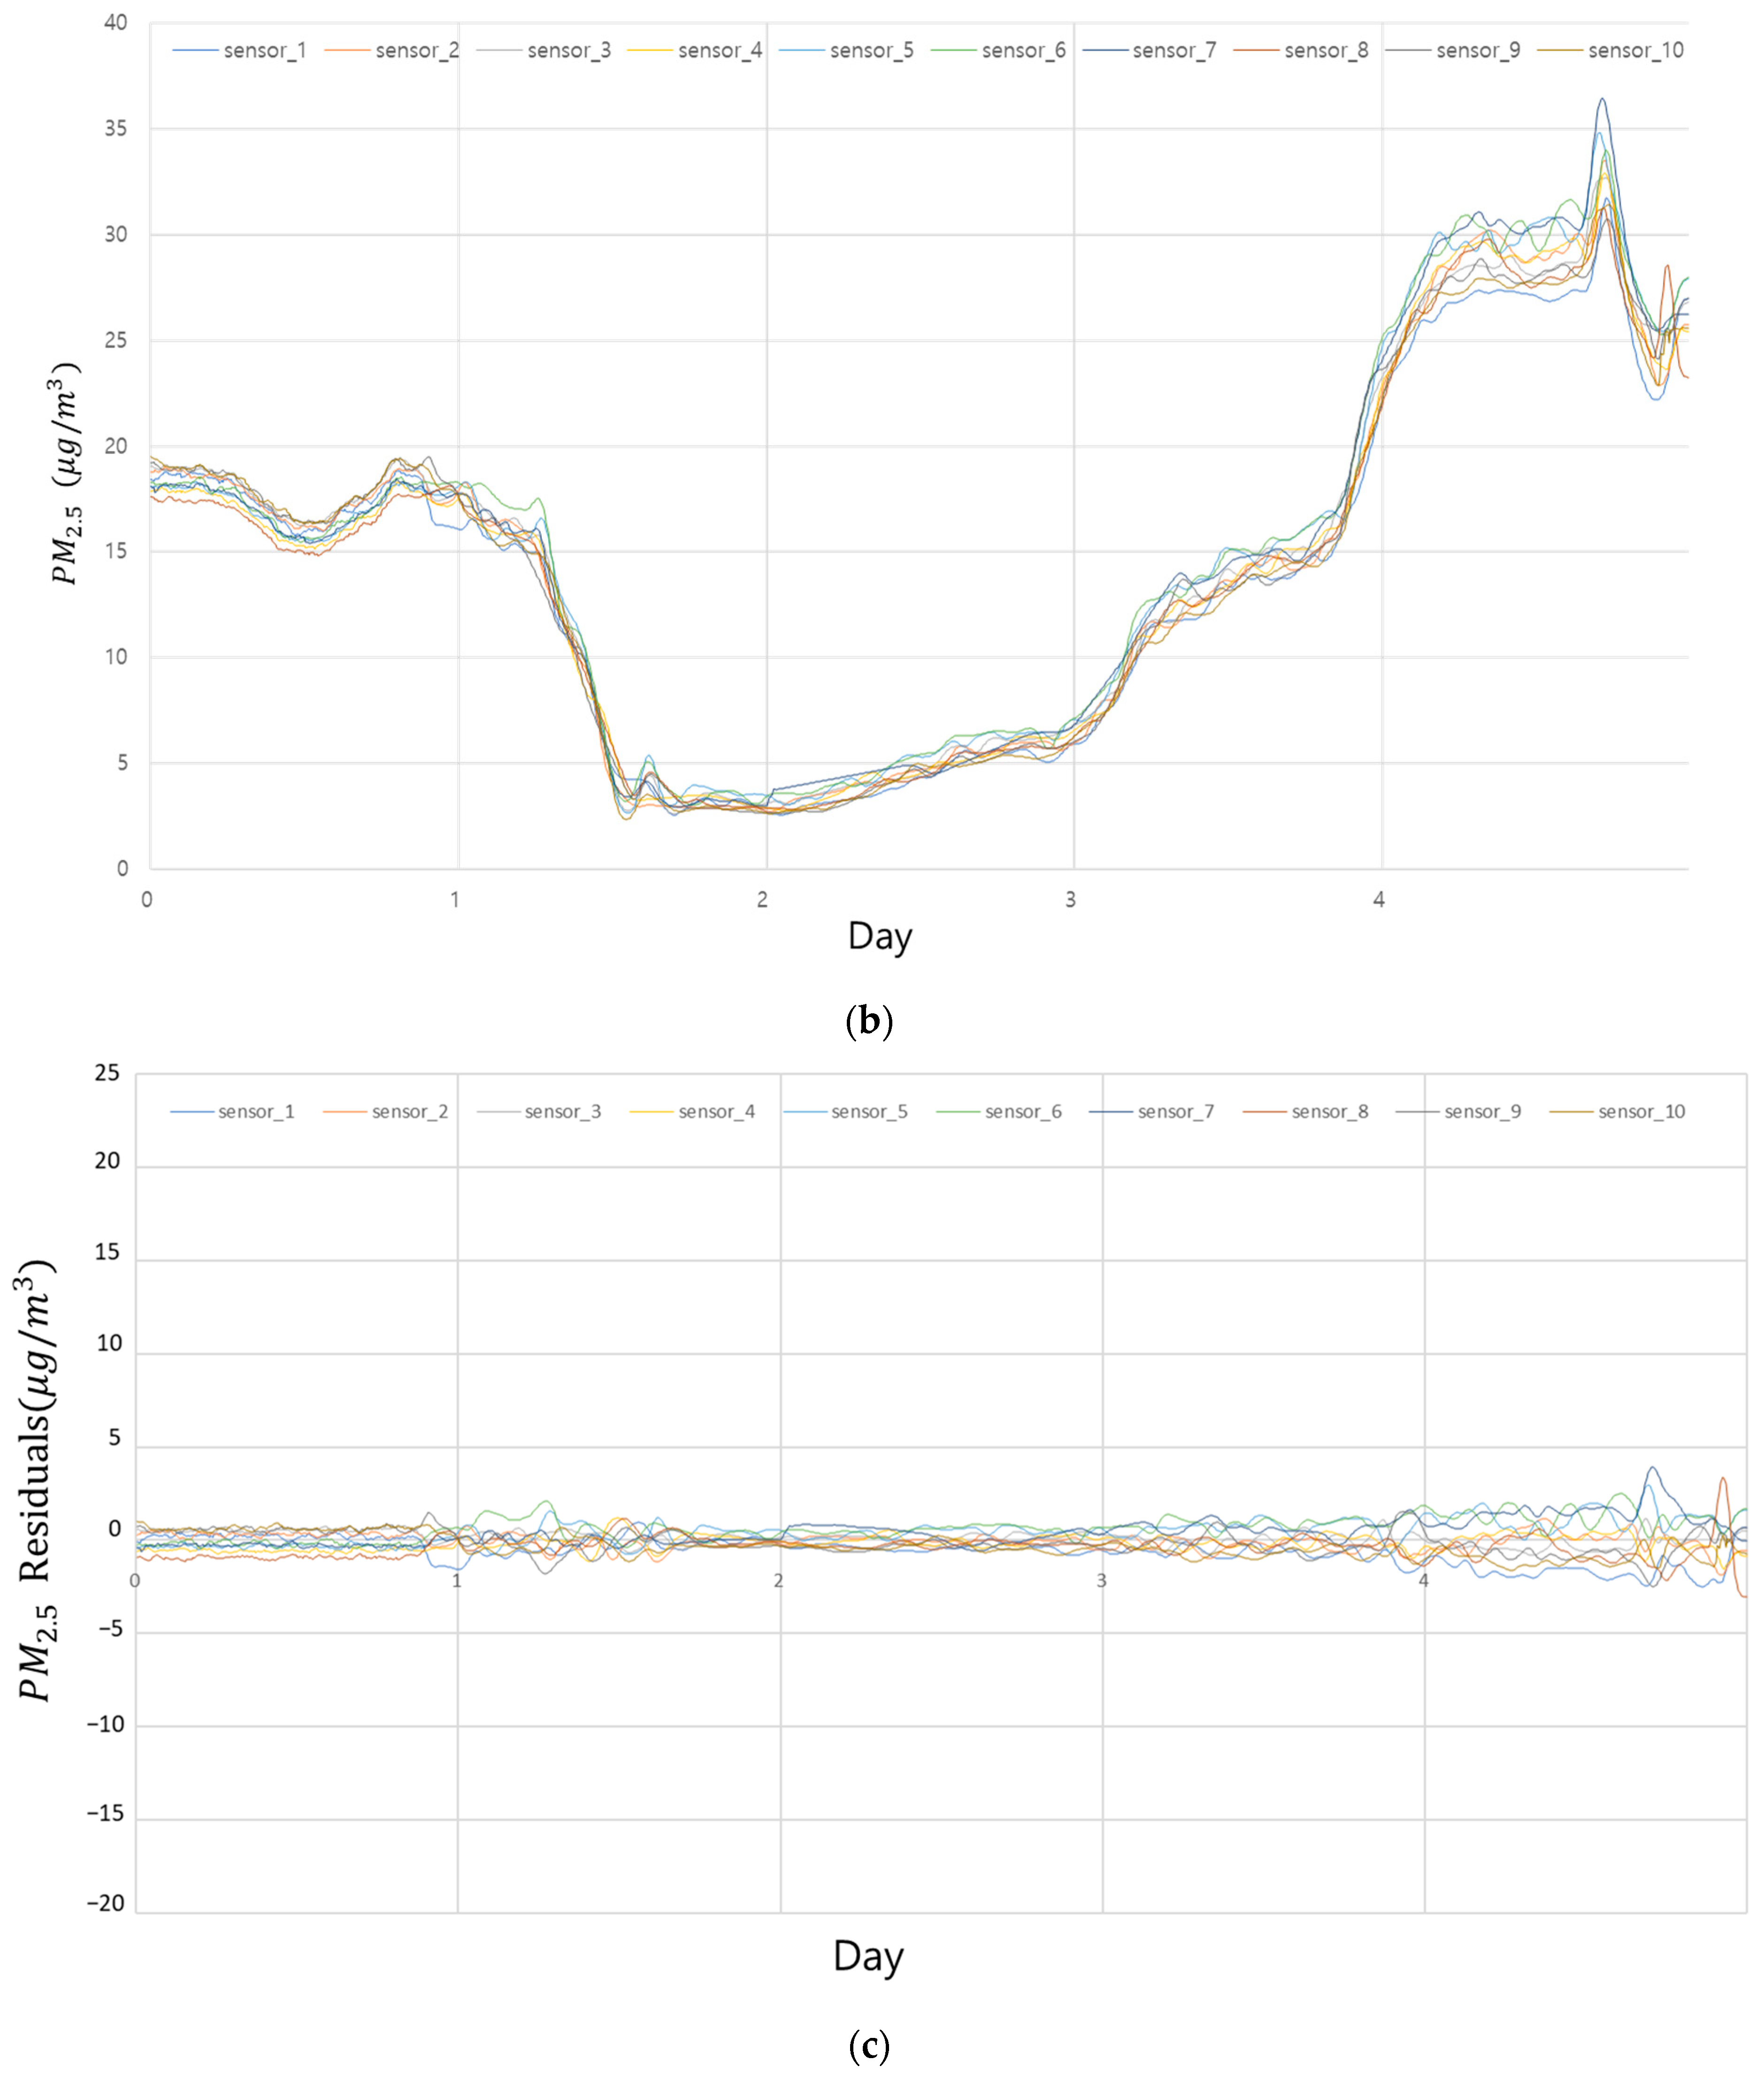
As shown in Figure 2a, ten identical IoT sensors were mounted on a multi-tier tray (left side of the chamber) and operated continuously for five consecutive days under controlled indoor conditions. During this test, an aerosol generator was used to vary the particulate-matter concentration inside the chamber, allowing dynamic response evaluation. Figure 2b presents the five-day time series of PM2.5 concentrations measured by all sensors, which exhibited nearly identical temporal patterns with only minor differences in magnitude. This high consistency demonstrates the reproducibility and stability of the sensor responses under identical environmental conditions.
Figure 2c further depicts the residual time series of each sensor relative to the ensemble mean, defined as r i t = P M 2.5 , i t P M 2.5 ¯ t . The residuals fluctuate closely around zero, indicating minimal inter-sensor variability and the absence of systematic bias or calibration drift. Occasional short-term spikes are attributed to localized particulate fluctuations or micro-scale turbulence. The maximum deviation observed during the five-day period was approximately 4 µg/m3, confirming a high level of data homogeneity and mutual consistency among the sensors.
As of July 2025, these devices are operated using battery replacement. The average data transmission latency via LTE (log-term evolution) tele-communication remained below 180 ms, and the lightweight software design ensured an average power consumption of approximately 1.6 watt. Using a 30,000 mAh battery, the device could operate for approximately 50 days. This system is primarily intended to provide high-density spatiotemporal monitoring of roadside PM, enabling the quantitative evaluation of localized variations influenced by environmental factors, thereby serving as a foundation for future high-resolution interpolation and predictive models.

3.2. Seasonal Environmental Conditions

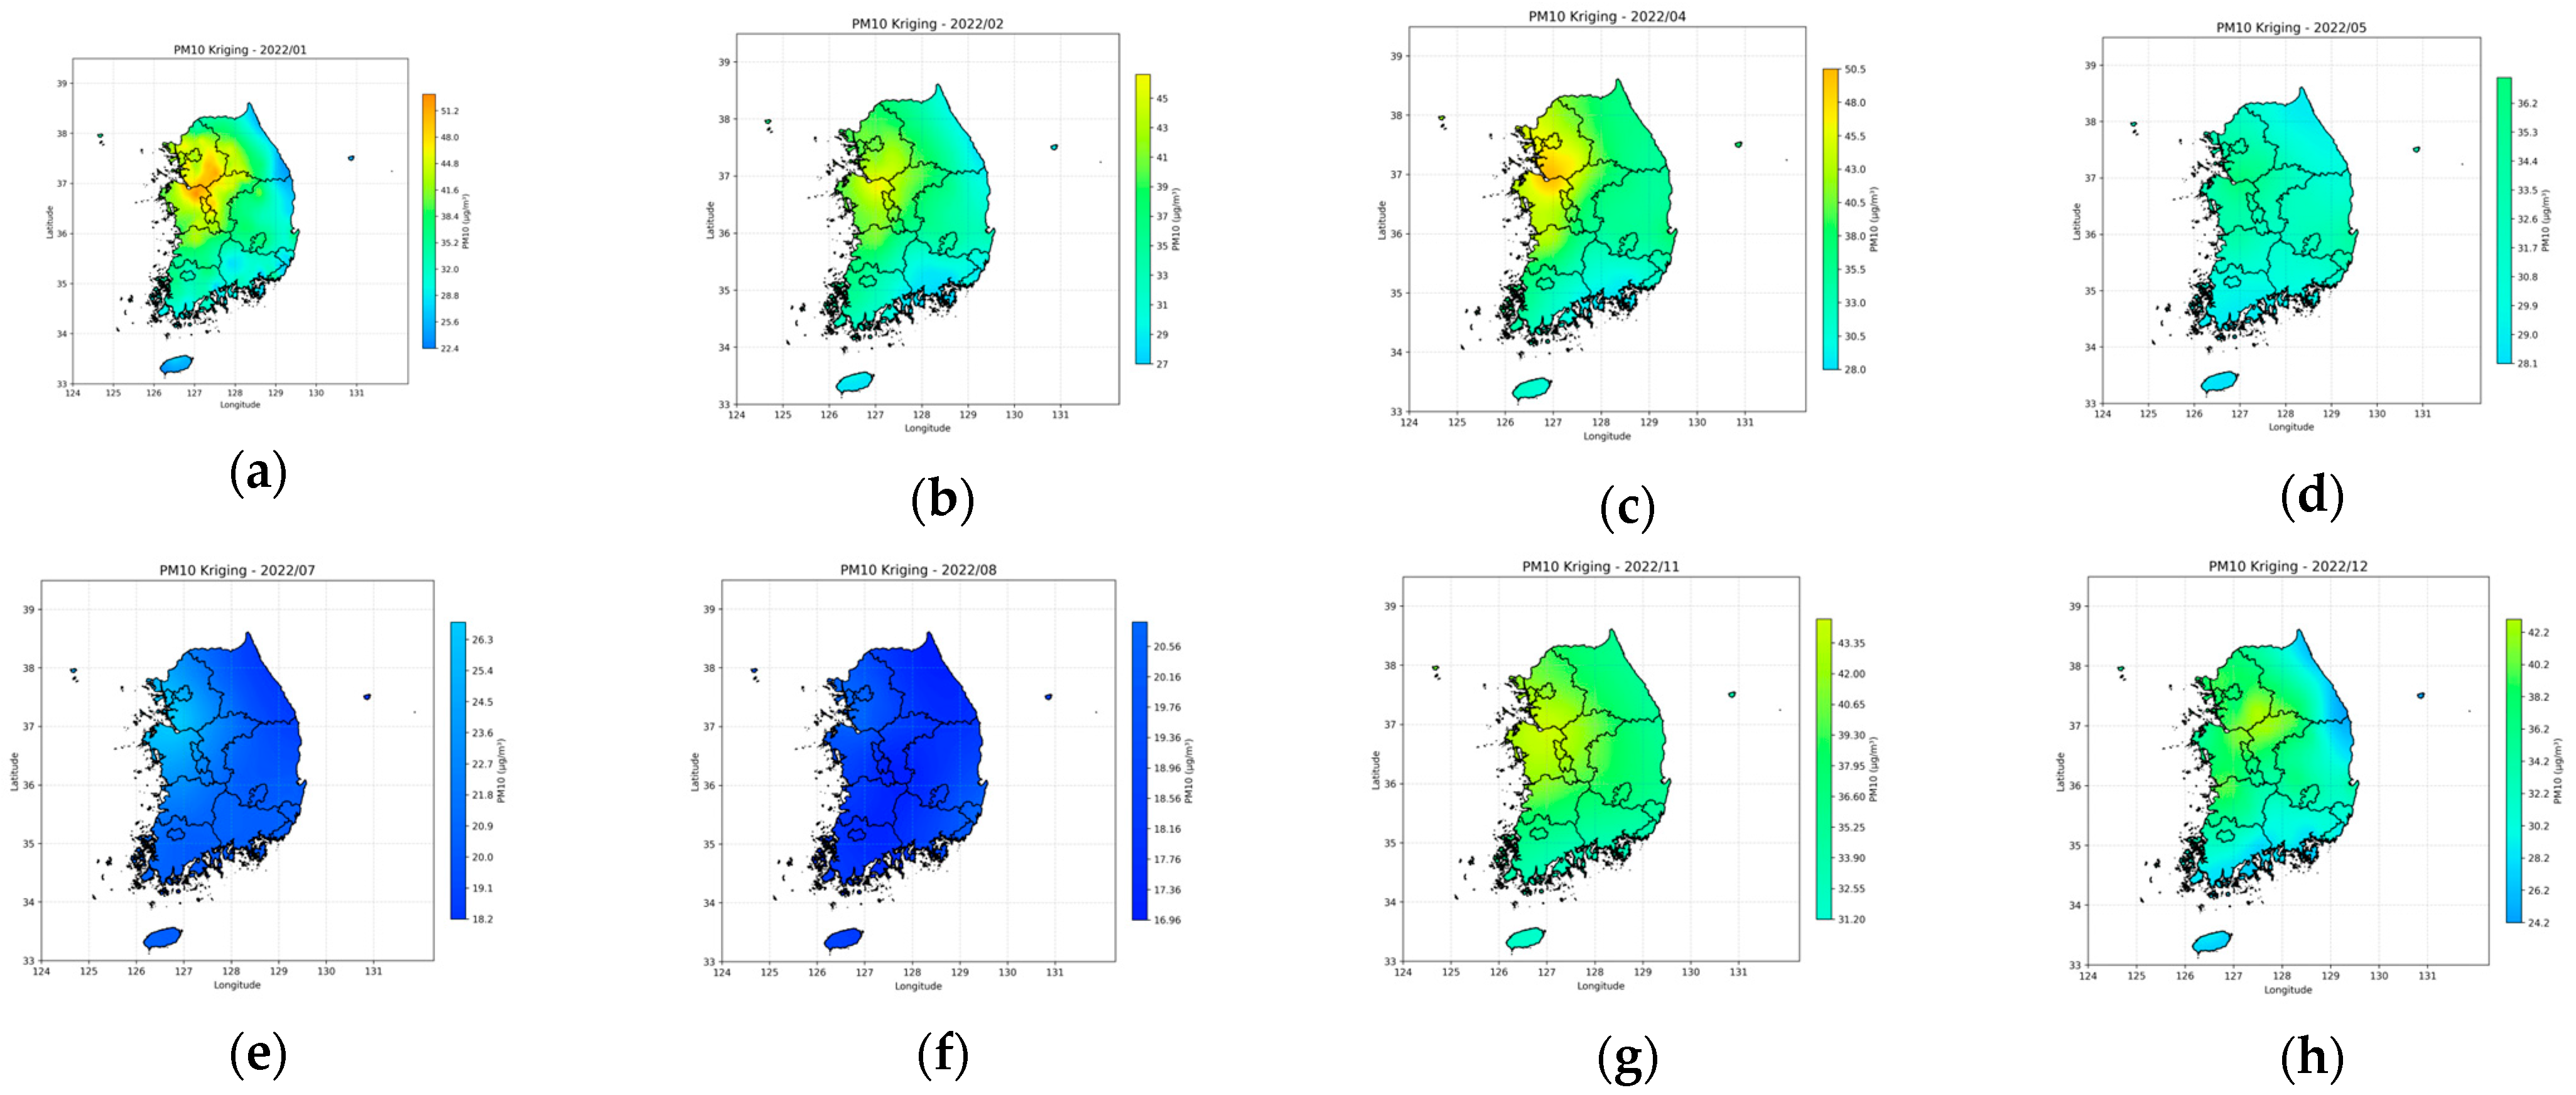
Roadside PM monitoring outcomes are strongly influenced by seasonal variations in the background air quality, prevailing winds, heating activities, and atmospheric stability. PM10 concentrations in South Korea vary significantly by season; months such as January, March, April, and November exhibit high mean levels and variability owing to both domestic and transboundary sources, whereas July presents relatively stable conditions. Figure 3 shows an analysis of the nationwide PM10 data for 2022, demonstrating that July–August is the least affected by seasonal factors. Previous studies [31,32] have also confirmed that summer months (June–August) have the lowest average concentrations and variability.
During winter (November–February), emissions from district heating, residential boilers, and industrial combustion are dominant, making it difficult to isolate traffic-related contributions. Meanwhile, spring (March–May) is affected by Asian dust and westerly winds. In contrast, summer (July–August) is governed by the North Pacific High, characterized by stable winds and minimal long-range transport [33]. Enhanced solar radiation deepens the planetary boundary layer (1.5–2 km), promoting the vertical mixing and dilution of pollutants. Moreover, minimal heating-related emissions occur in July, allowing traffic emissions to be analyzed in isolation.
Therefore, July was selected as the experimental period as it is the most suitable period for controlled roadside PM experiments, enabling the minimization of background variability, external inflows, and seasonal biases while maximizing the ability to detect localized traffic influences.

3.3. Spatial Environmental Conditions

Field experiments were conducted near the Korea Institute of Civil Engineering and Building Technology (KICT) in Goyang-si, South Korea. The experimental design emphasized spatial comparability with nearby public stations and representation of different roadside environments.

3.3.1. Subsubsection Integration with Public Monitoring Networks

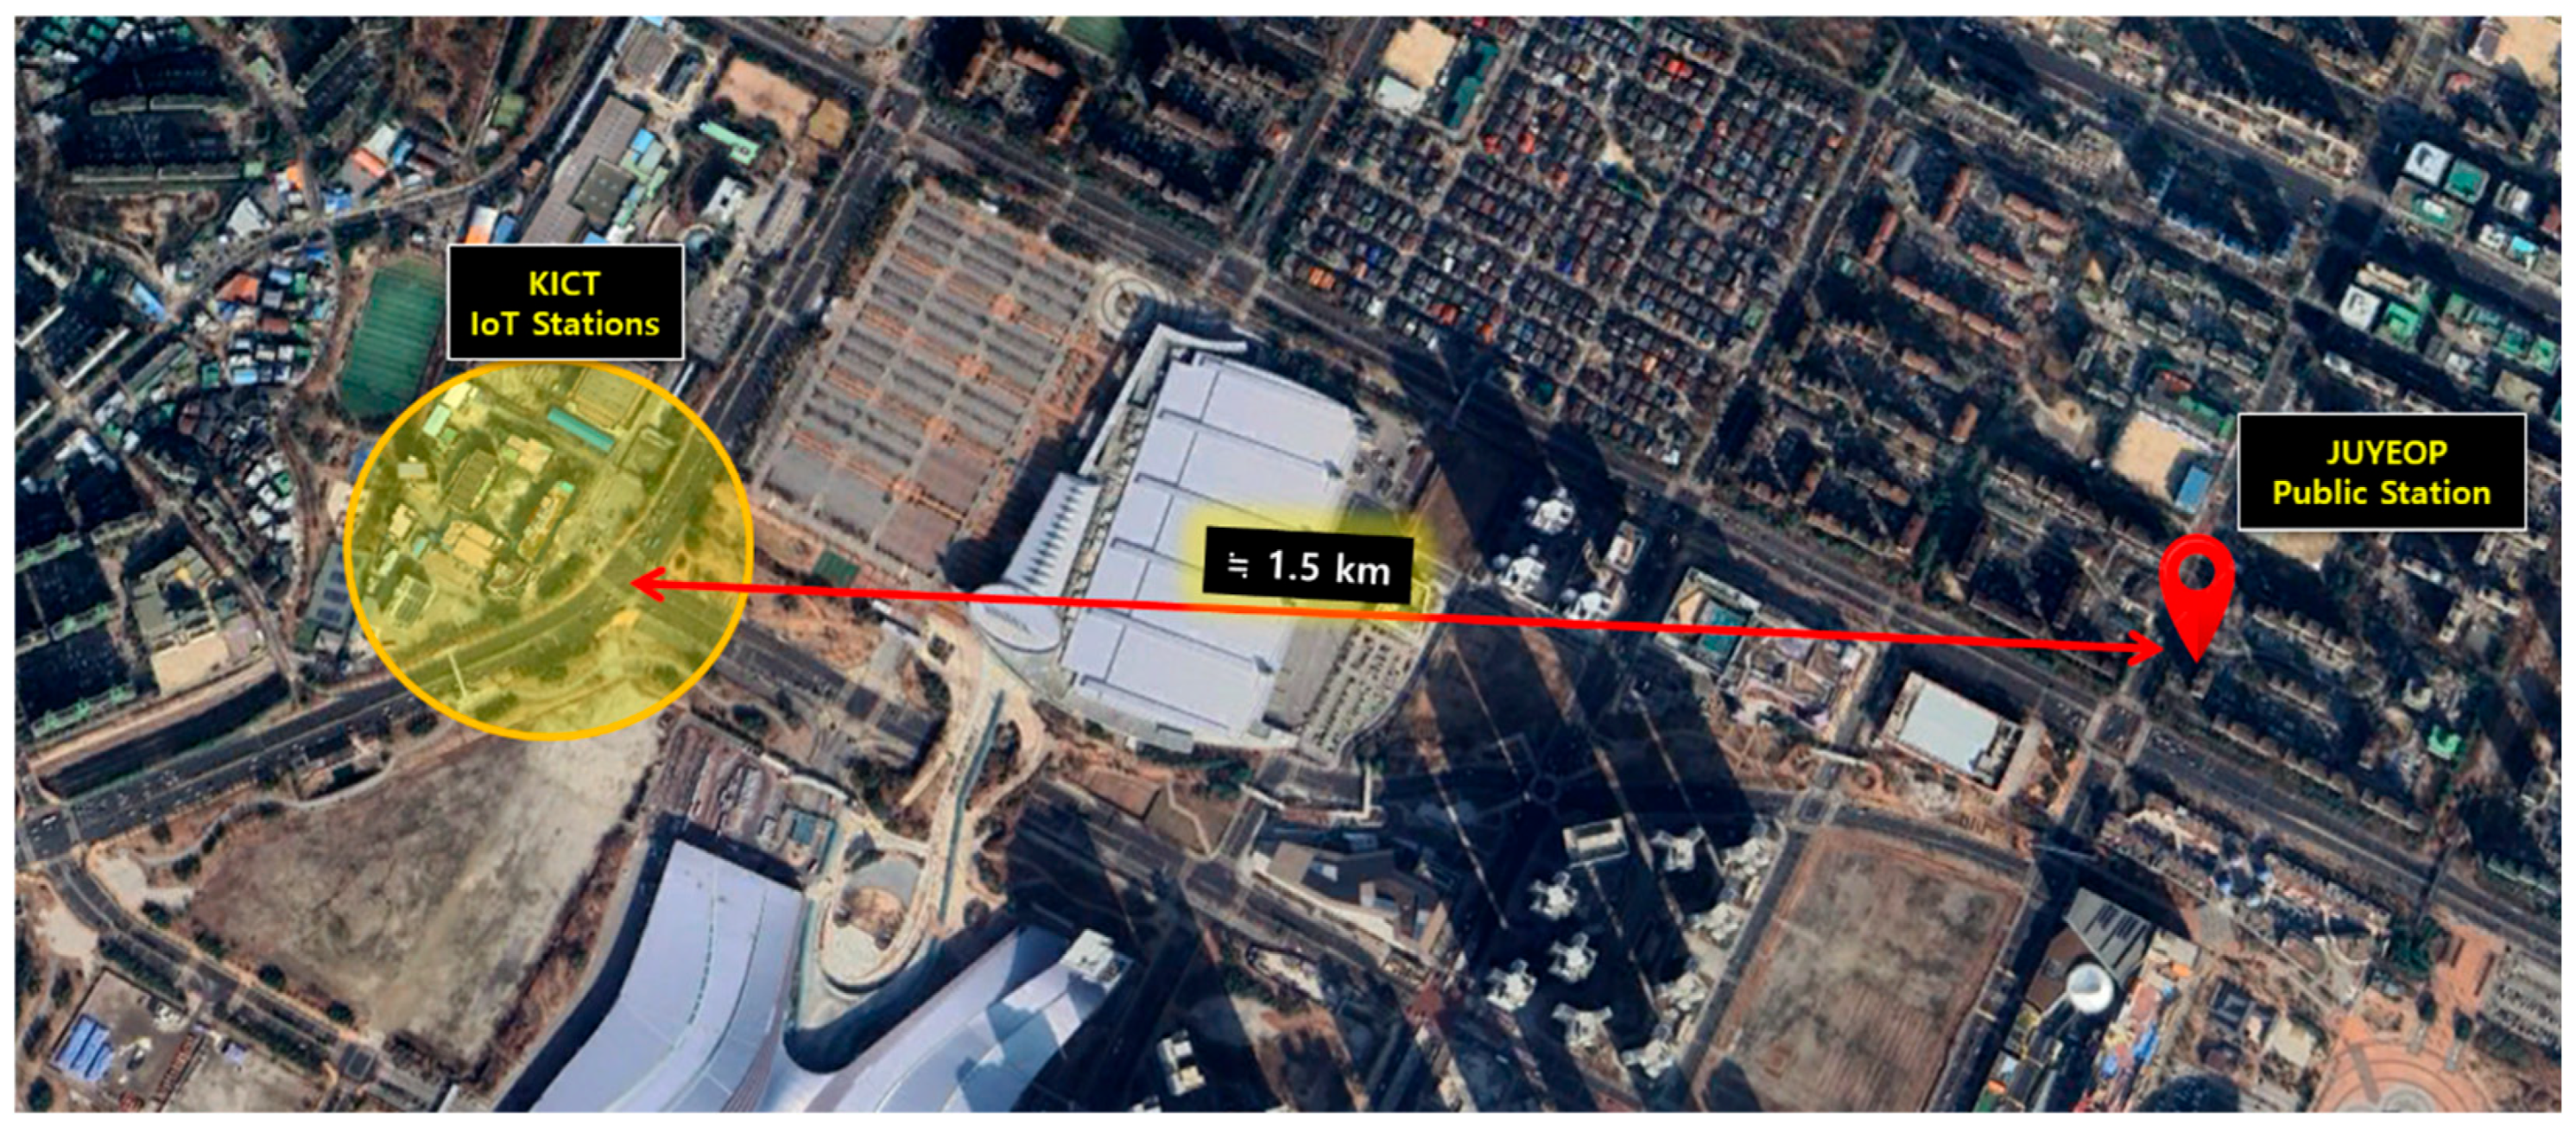
To ensure comparability, monitoring sites were selected within 2 km of the JUYEOP urban monitoring station, which is located on the rooftop of a multi-story building approximately 1.5 km from KICT. This station measures PM10, PM2.5, NO2, O3, and CO at an hourly resolution. In contrast, the developed monitoring devices recorded data at a 1-s resolution, allowing the real-time capture of short-term roadside PM fluctuations. The geographic relationship between the JUYEOP public station and the IoT sensing-based roadside monitoring sites is illustrated in Figure 4.

3.3.2. Site Selection Criteria

For the installation of the IoT sensing-based PM monitoring devices, three sites were chosen to reflect various roadside environments:
(a)
Traffic Island (High-Exposure Site)
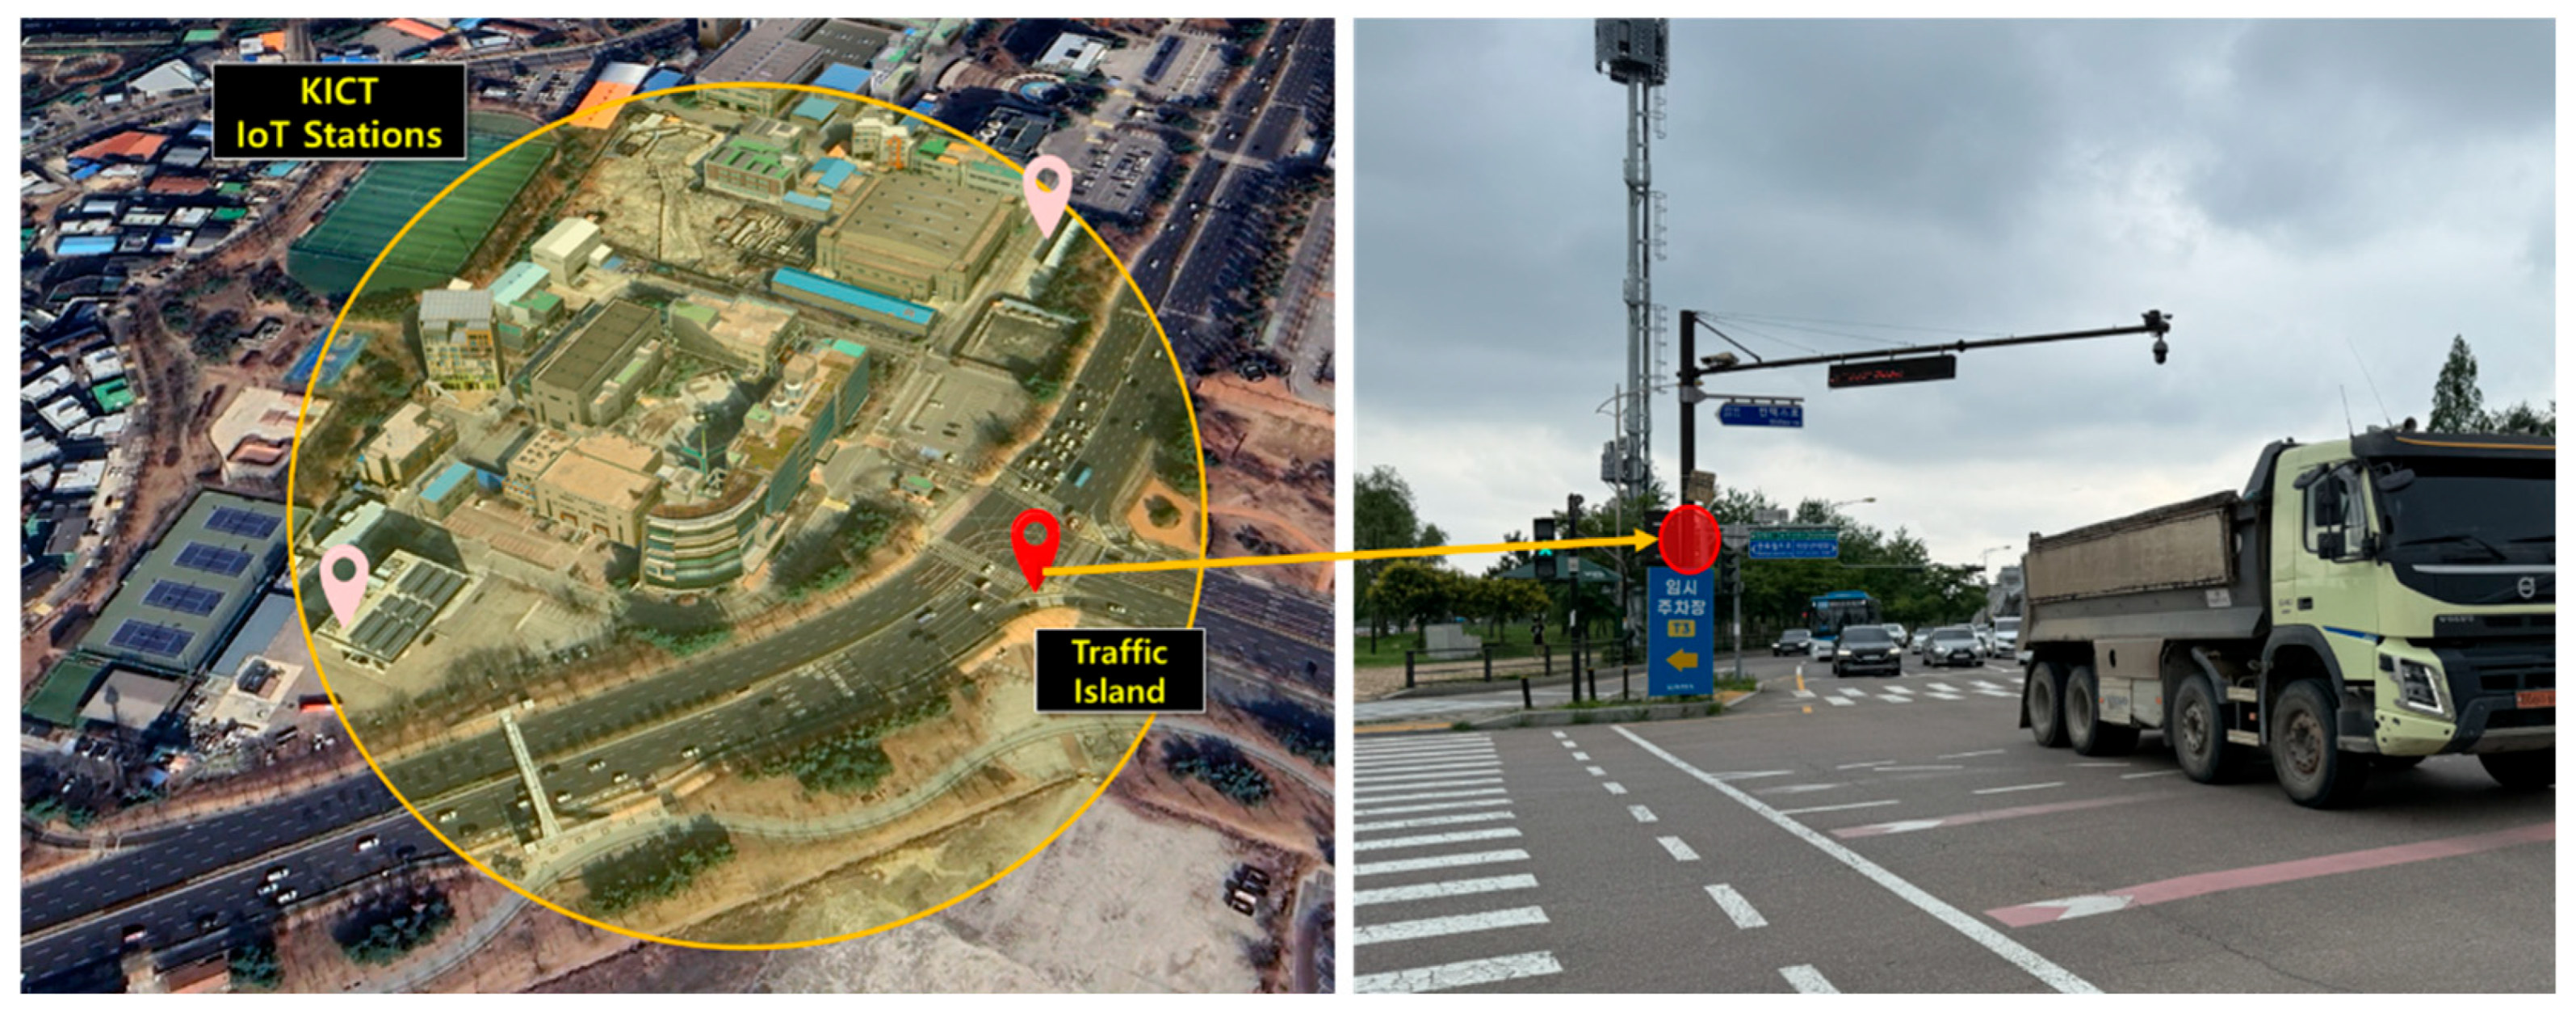
The first device was installed at the center of an eight-lane intersection with heavy traffic and frequent congestion. This site represents scenarios of high pedestrian exposure (e.g., vendors and traffic officers). Data can be used to validate the high-concentration zones in the interpolation models. The location of the traffic-island installation and the appearance of the deployed IoT sensing-based PM monitoring device are shown in Figure 5.
(b)
Rooftop (Dispersion Site)
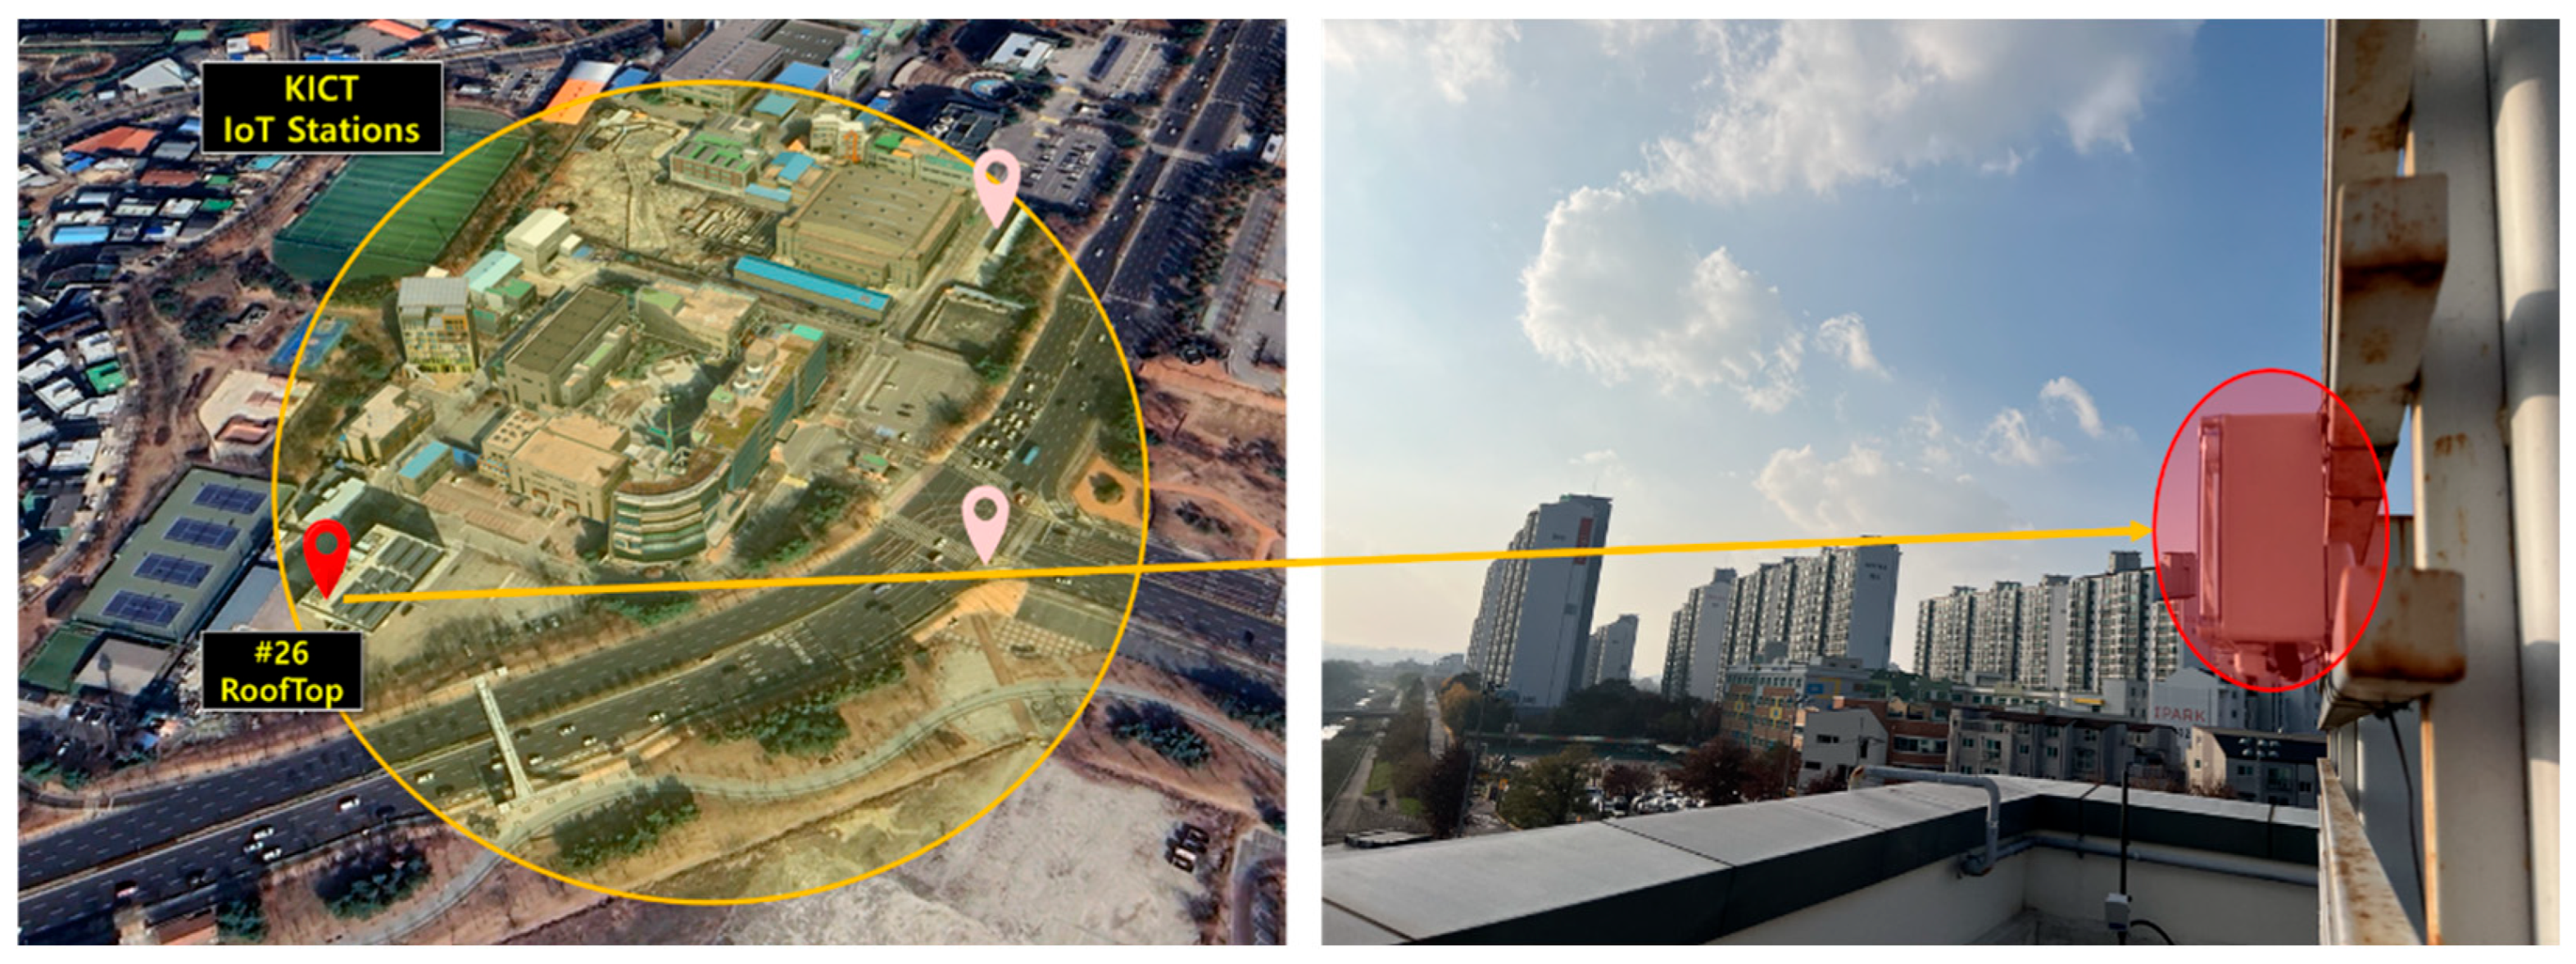
The second device was installed on a rooftop (approximately 10 m high) located 20–30 m from the road. This site reflects vertical dispersion and dilution effects and provides data for turbulence models and correction factors. It also simulates practical rooftop deployment in an urban setting. The installation location and appearance of this rooftop monitoring site are shown in Figure 6.
(c)
Shielded Roadside (Vegetation Buffer Site)
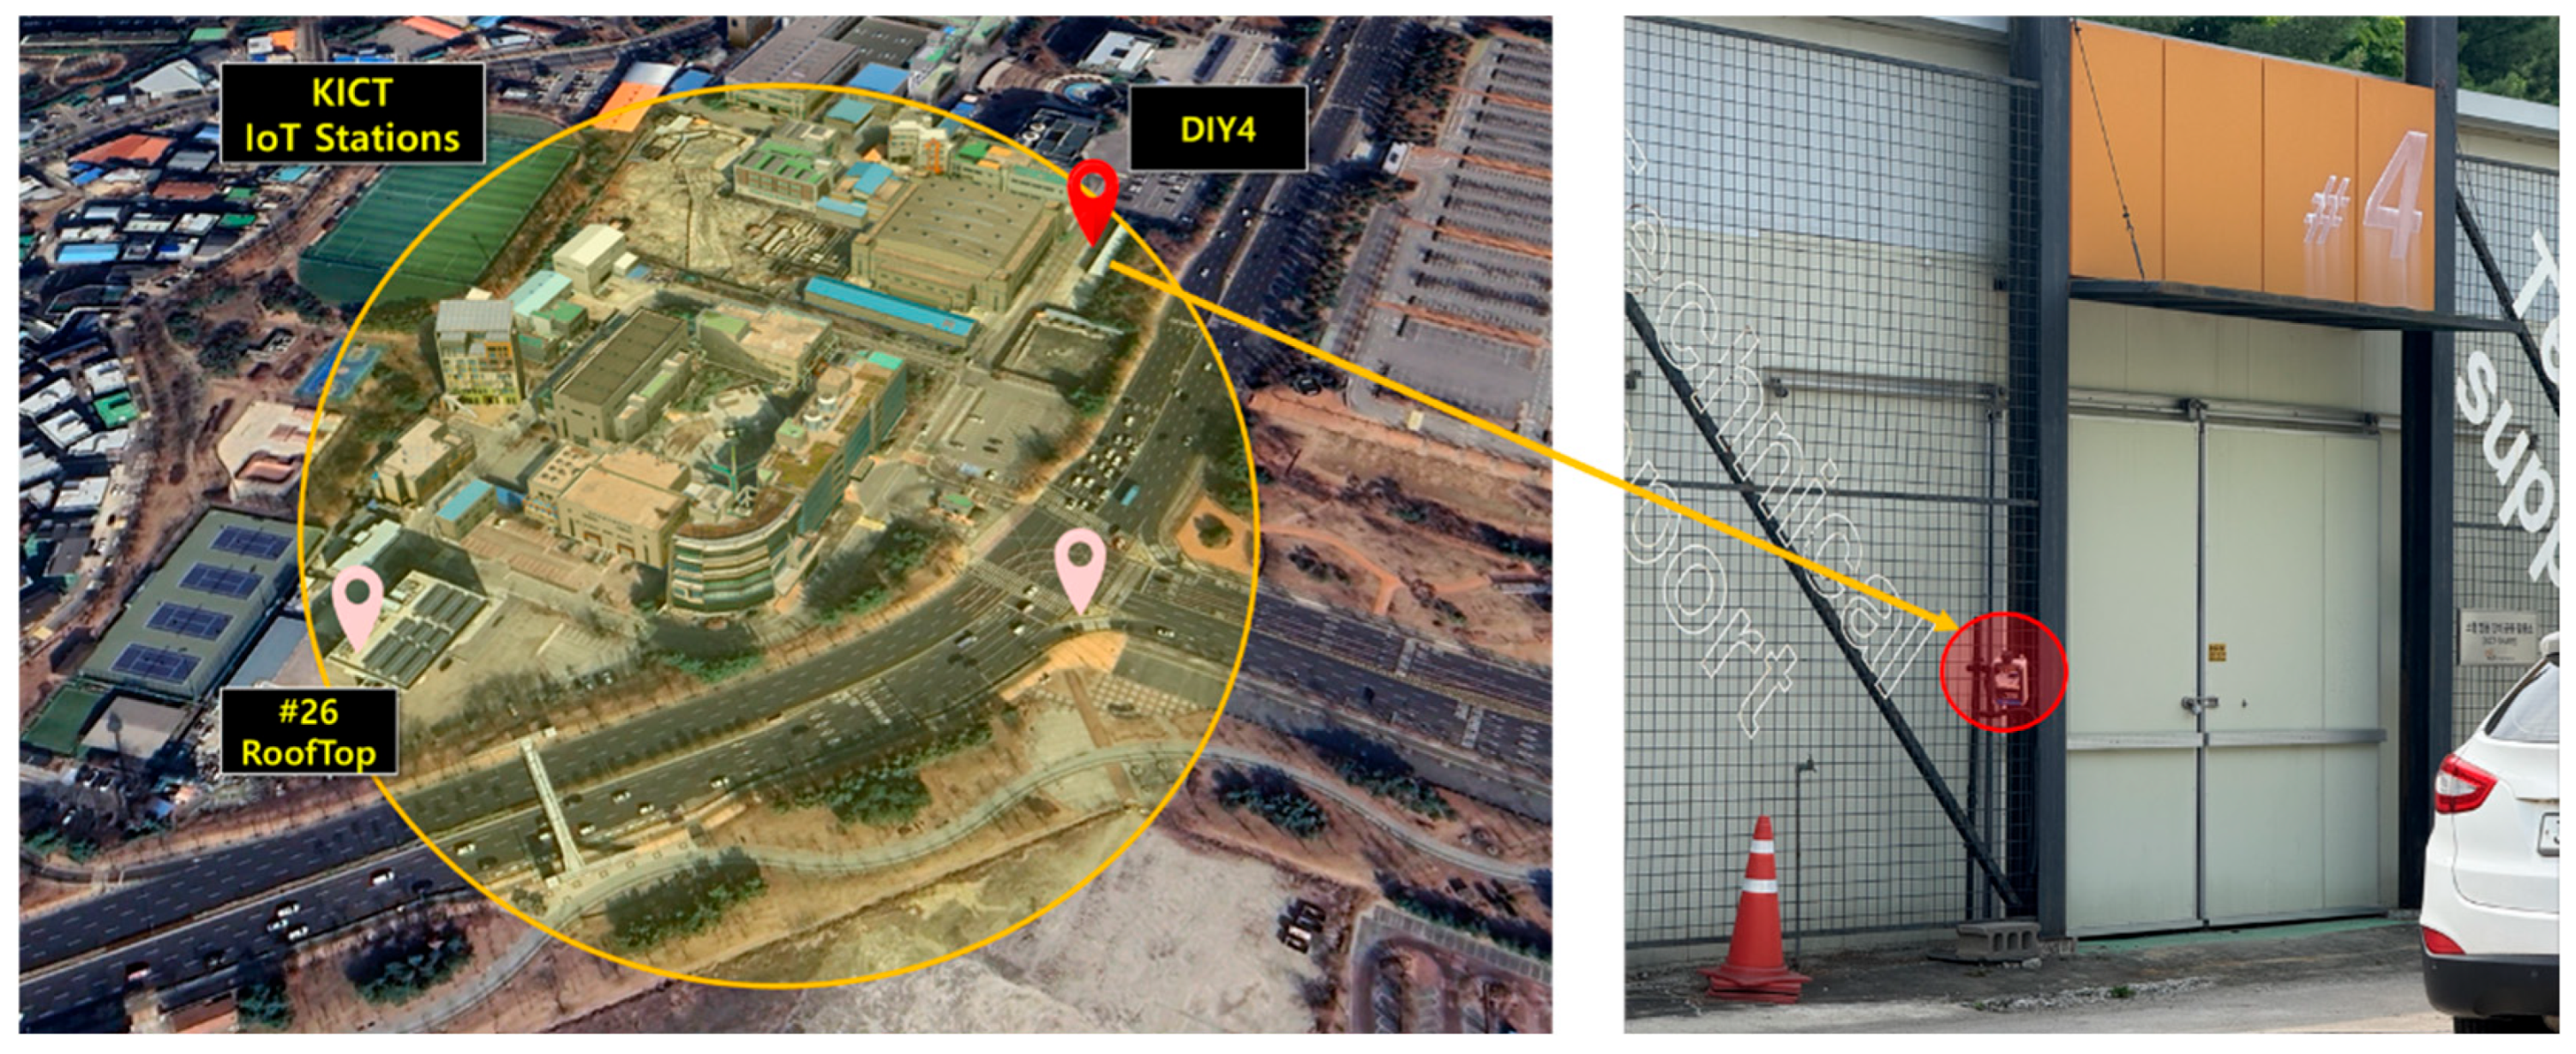
The third device was installed behind roadside trees and a single-story building within approximately 10 m of the road. Vegetation acts as a natural filter, temporarily capturing particles and reducing wind speed. This site enables the empirical evaluation of urban green buffers. The location and appearance of this roadside installation site are shown in Figure 7.

3.3.3. Temporal Normalization

All data were normalized to a 1-min resolution for consistency across sites and comparability with public station data. Hourly data from public stations were linearly interpolated to 1-min intervals, and 1-s IoT data were averaged to reduce noise. The harmonized dataset allowed for cross-site comparison, time-series analysis, and machine learning model training for spatial predictions.
To compare and analyze the localized PM concentrations at the different monitoring sites, five days of data (4–8 July 2025) were selected during the summer season, when the external PM inflow was minimized. Only non-rainfall periods were used to examine the temporal continuity across weekdays and weekends.

3.4. Quantitative Analysis

3.4.1. Similarity Measurement

We evaluated the temporal similarity between the data from the JUYEOP public monitoring station and three IoT sensing-based roadside monitoring sites using representative time-series similarity measures: the Pearson correlation coefficient [34], cross-correlation at lag 0 [35], and dynamic time warping (DTW) [36]. The Pearson correlation coefficient [36] measures the linear covariation between two time series and is widely used to identify overall linear relationships. The cross-correlation at lag 0 evaluates the similarity of synchronized fluctuations without considering the time delay, thereby providing an intuitive measure of shared periodicity or patterns. Finally, DTW is a distance-based approach that allows for nonlinear distortions in the time axis, enabling a robust comparison of time series with high variability or temporal misalignments. Applying these three methods enables the assessment of the temporal similarity of roadside PM monitoring data from multiple perspectives.

3.4.2. PM Variability Measurement

The traffic island is situated in an intersection where vehicle volume, queuing, and congestion interact to create a complex environment. Consequently, several abrupt increases in PM10 concentrations, observed as impulse-like spikes (Section 4.4), can occur. These were analyzed based on the 1-min PM10 observations from the three observation sites, with temporal variability assessed using the Z-score and roulette index.
The Z-score is calculated as follows:
Z =   x μ σ
where x is the observed value, μ is the mean, and σ is the standard deviation. This enables the comparison of relative deviations from the mean. When applied to time-series data, this method facilitates the detection of abnormal short-term surges.
To further evaluate the variability, a roulette index analysis was conducted. The roulette index (R) is defined as follows:
R =   m e a n ( x n x n 1 ) s t d ( x n x n 1 )
where xn denotes the observation at time n. This metric accounts for both the overall variability and irregularity.

4. Results

4.1. Comparison with Public Monitoring Data

Ensuring the accuracy and reliability of roadside monitoring requires validation using existing public stations. Using the PM10 data from JUYEOP public station as a reference, time-series similarities with the IoT-based monitoring devices from the three sites— shielded roadside (DIY4), traffic island at an intersection (TRAFFIC_ISLAND), and third-floor rooftop (26ROOFTOP)—were analyzed for 4–8 July 2025. Both PM2.5 and PM10 data were collected at 1-min intervals. Table 1 summarizes the site features and expected impacts.
In this study, the IoT sensing devices were not co-located with the public monitoring station but were instead installed at nearby roadside environments to better capture micro-scale variations in particulate concentration. This approach was chosen to reflect the different purposes and measurement principles of the two systems. The JUYEOP public station uses a gravimetric cartridge-based method that collects particulates over a one-hour interval, while the proposed IoT sensor employs a laser light-scattering optical method that measures concentration every second. Because of these differences in temporal resolution and sampling dynamics, a direct one-to-one comparison at the same site would not be meaningful. In addition, the public station data represent hourly averaged regional conditions and may miss short-term fluctuations caused by local traffic or turbulence, whereas the IoT sensors are designed for high-resolution, real-time monitoring in roadside microenvironments. Public monitoring stations are also typically located on building rooftops or secure facilities, where installing compact IoT units is impractical due to accessibility, cost, and safety constraints. Moreover, airborne particulate concentrations are highly sensitive to wind direction and local flow fields, meaning that even co-located instruments can record slightly different values. Therefore, this study focused on evaluating whether the IoT sensors could reproduce consistent temporal trends with the reference data while providing finer spatial and temporal resolution suited for urban roadside conditions.
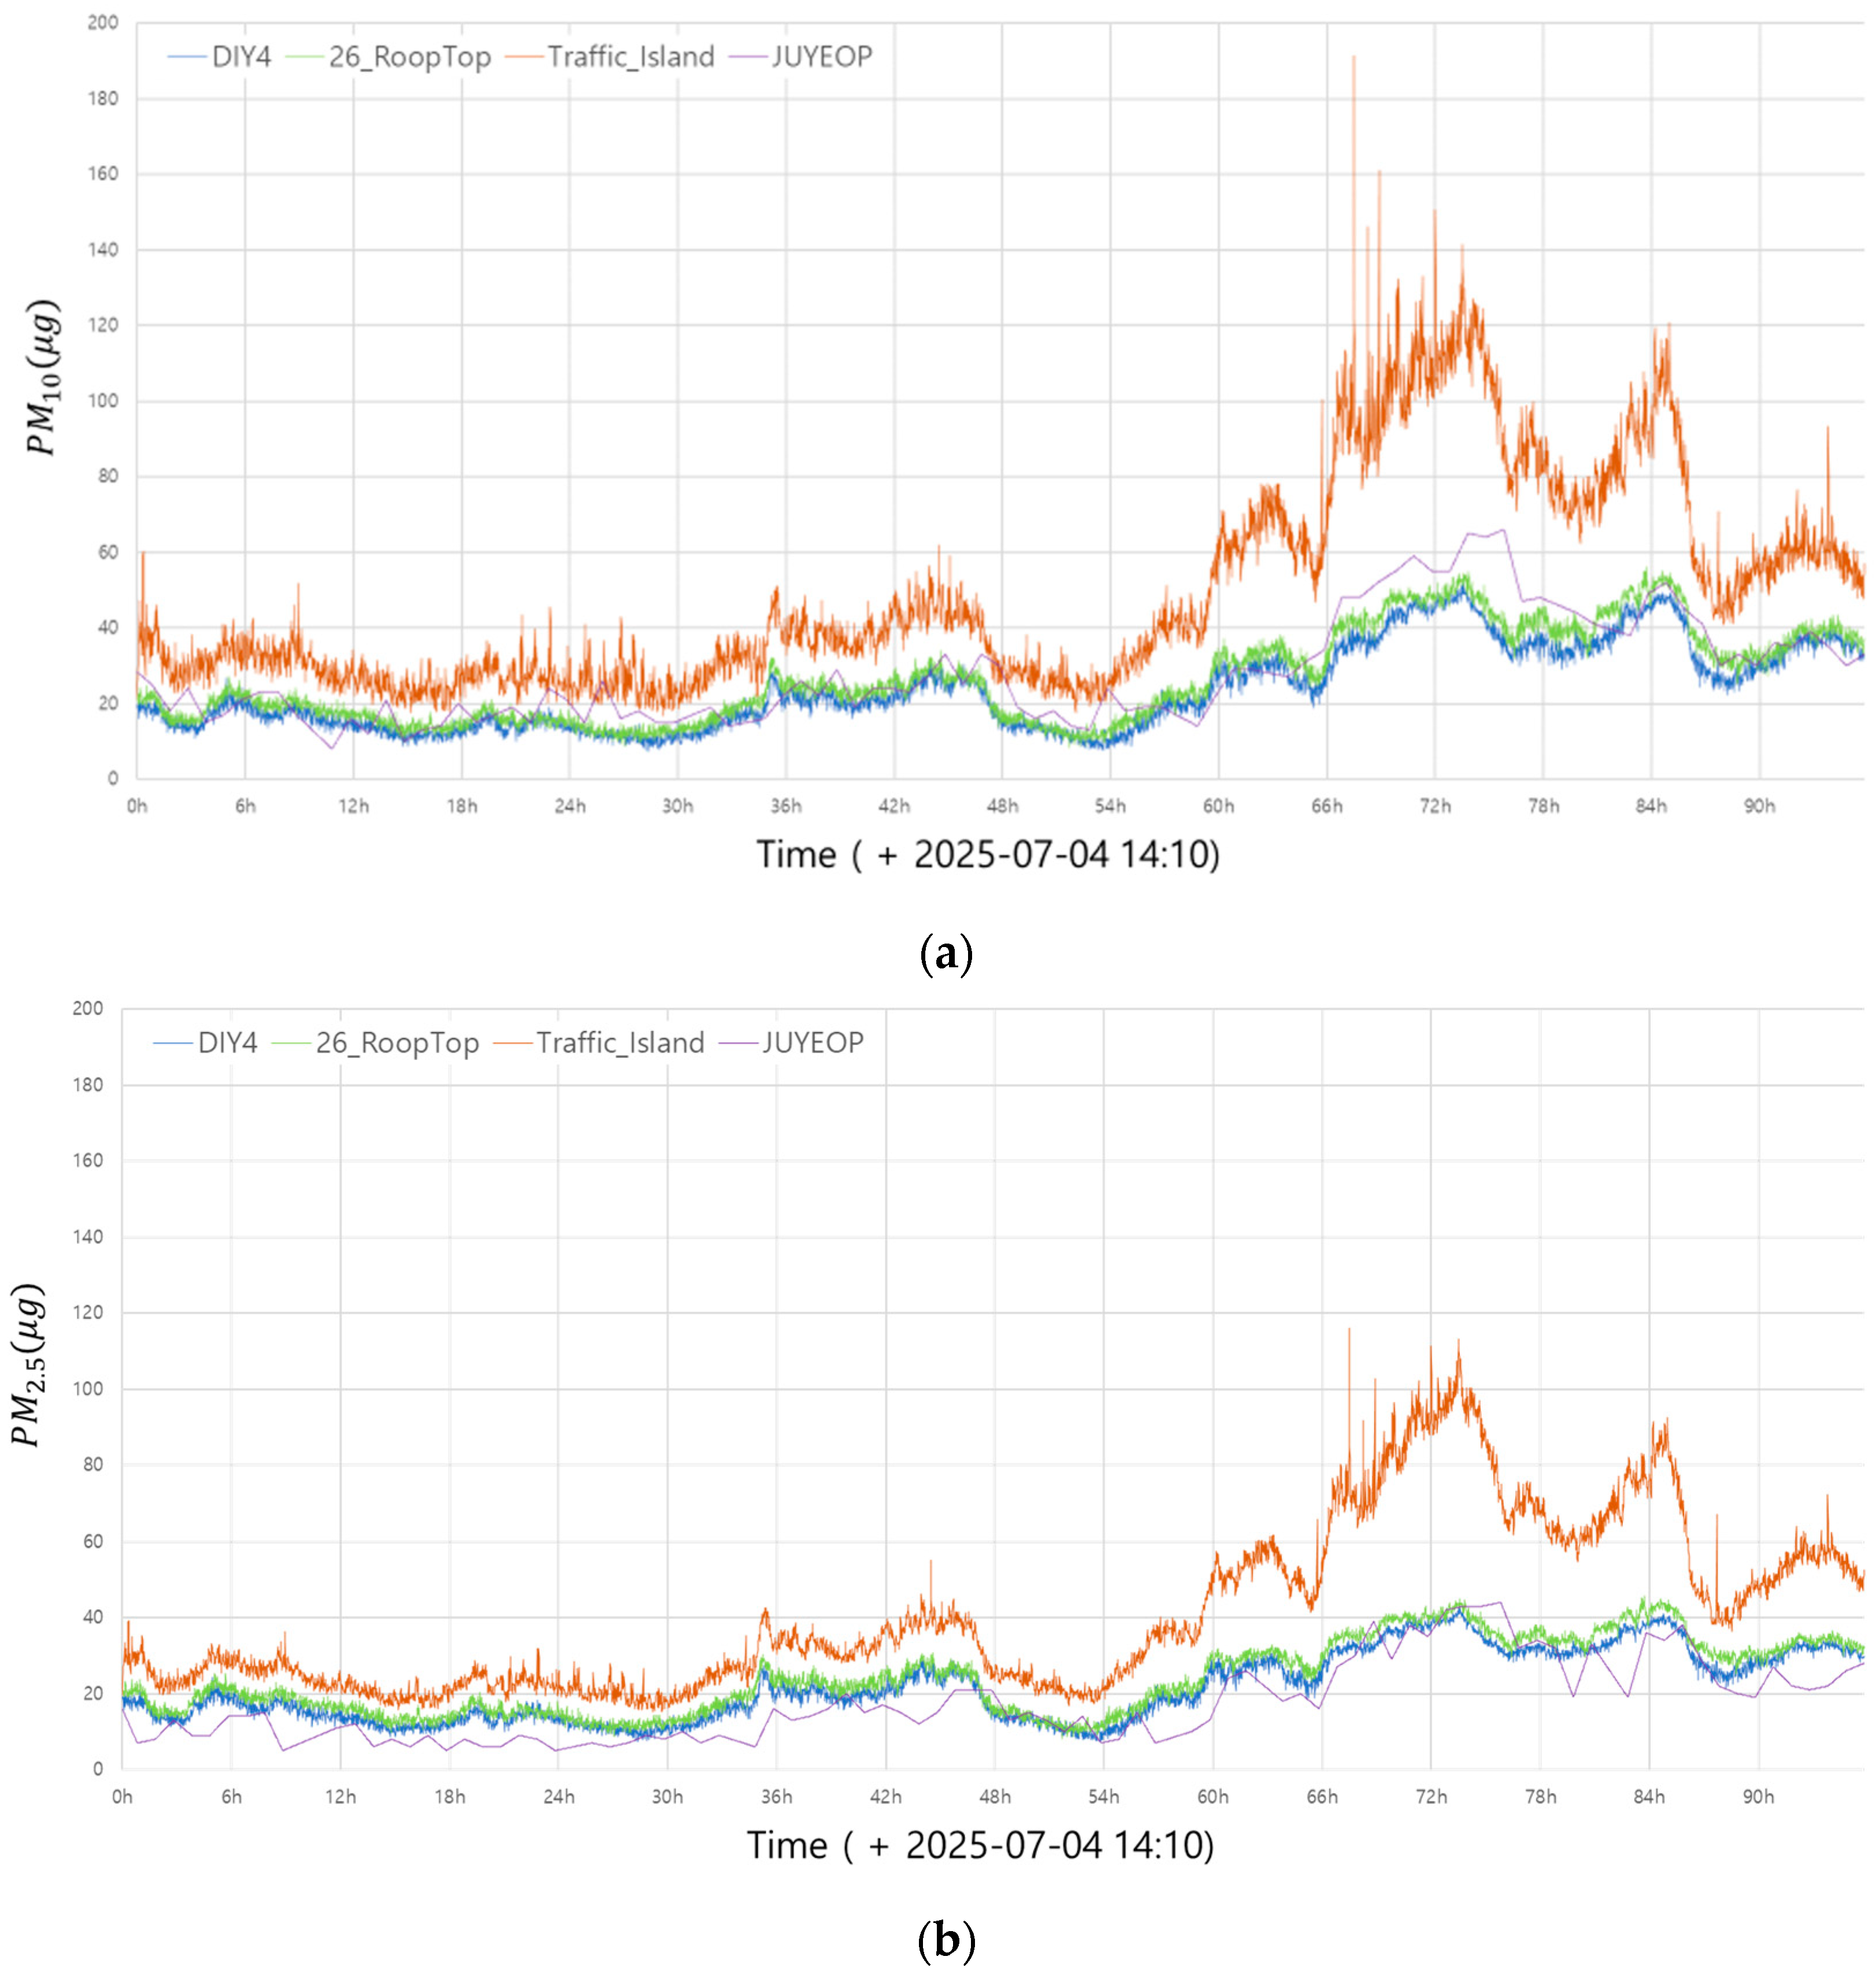
During the non-rainfall period, the time-series data of the PM observed at each site were plotted. Figure 8a,b present the PM10 and PM2.5 concentration variations measured by the IoT sensing-based monitoring devices at the three roadside sites compared with that of the JUYEOP public monitoring station, respectively. The results qualitatively confirmed a high degree of similarity in the temporal trends of PM concentration across all sites. All processed measurement values are provided in Supplementary Materials (Dataset S1).
The higher particulate-matter levels observed at the TRAFFIC_ISLAND site compared with DIY4 and 26ROOFTOP do not indicate sensor bias or performance issues but reflect genuine environmental differences caused by heavy traffic and local air-flow patterns. Because the equipment reliability was already verified through the controlled co-exposure experiment shown in Figure 2, variations among field sites represent real micro-scale pollution contrasts rather than instrumental inconsistency. This demonstrates the capability of the IoT sensor network to resolve spatially heterogeneous roadside conditions that conventional fixed stations cannot capture.
Table 2 and Table 3 present the similarity evaluation results for the PM10 and PM2.5 concentrations, respectively, comparing that of the JUYEOP public station with those of the IoT sensing-based roadside monitoring devices at each site.
The Pearson correlation analysis for PM10 showed values >0.89 for all sites, indicating a strong linear relationship, with the TRAFFIC_ISLAND site exhibiting the highest correlation. This suggests that its variability closely follows that of the JUYEOP public monitoring data. The cross-correlation (lag 0) results were comparable to the Pearson coefficients across all sites, indicating high precision and responsiveness. The measurements exhibited synchronized patterns without time delay, suggesting that despite the different observation intervals between the public and IoT stations, the proposed devices achieved a reliability level suitable for real-time monitoring. The DTW distance, which assesses shape similarity while allowing temporal distortions, further supported these findings. 26ROOFTOP and DIY4 showed very short DTW distances, indicating strong structural similarity with the JUYEOP data. In contrast, TRAFFIC_ISLAND recorded a substantially larger DTW distance, which could be the result of more dynamic and irregular pollution variations characteristic of roadside intersections.
The Pearson correlation analysis for PM2.5 concentrations determined coefficients > 0.88 across all IoT monitoring sites, confirming a strong linear relationship with the JUYEOP public station data, with the TRAFFIC_ISLAND site also exhibiting the highest correlation coefficient. The cross-correlation (lag 0) values further confirmed that the temporal fluctuation patterns at each site were well synchronized with the JUYEOP data. DTW analysis showed that DIY4 and 26ROOFTOP had relatively low DTW distances, indicating a strong similarity in fluctuation patterns, whereas TRAFFIC_ISLAND exhibited a high DTW distance despite its strong correlation. This discrepancy can be attributed to frequently observed short-term abrupt variations.
The PM2.5 observations from the IoT sensing-based devices generally demonstrated a strong temporal similarity with the JUYEOP public data, validating the devices’ reliability. Specifically, DIY4 produced the most consistent results in a stable environment, whereas TRAFFIC_ISLAND, owing to its direct exposure to vehicle traffic and environmental conditions, effectively captured high-concentration peaks but exhibited unstable patterns. The 26ROOFTOP site, despite its location, reflected dispersion effects well and produced stable measurements. These findings indicate that IoT-based devices can achieve a high level of agreement with costly public monitoring stations and provide both scientific and practical validity for detecting variations in urban roadside air quality.

4.2. Comparison of PM Concentrations by Time Period

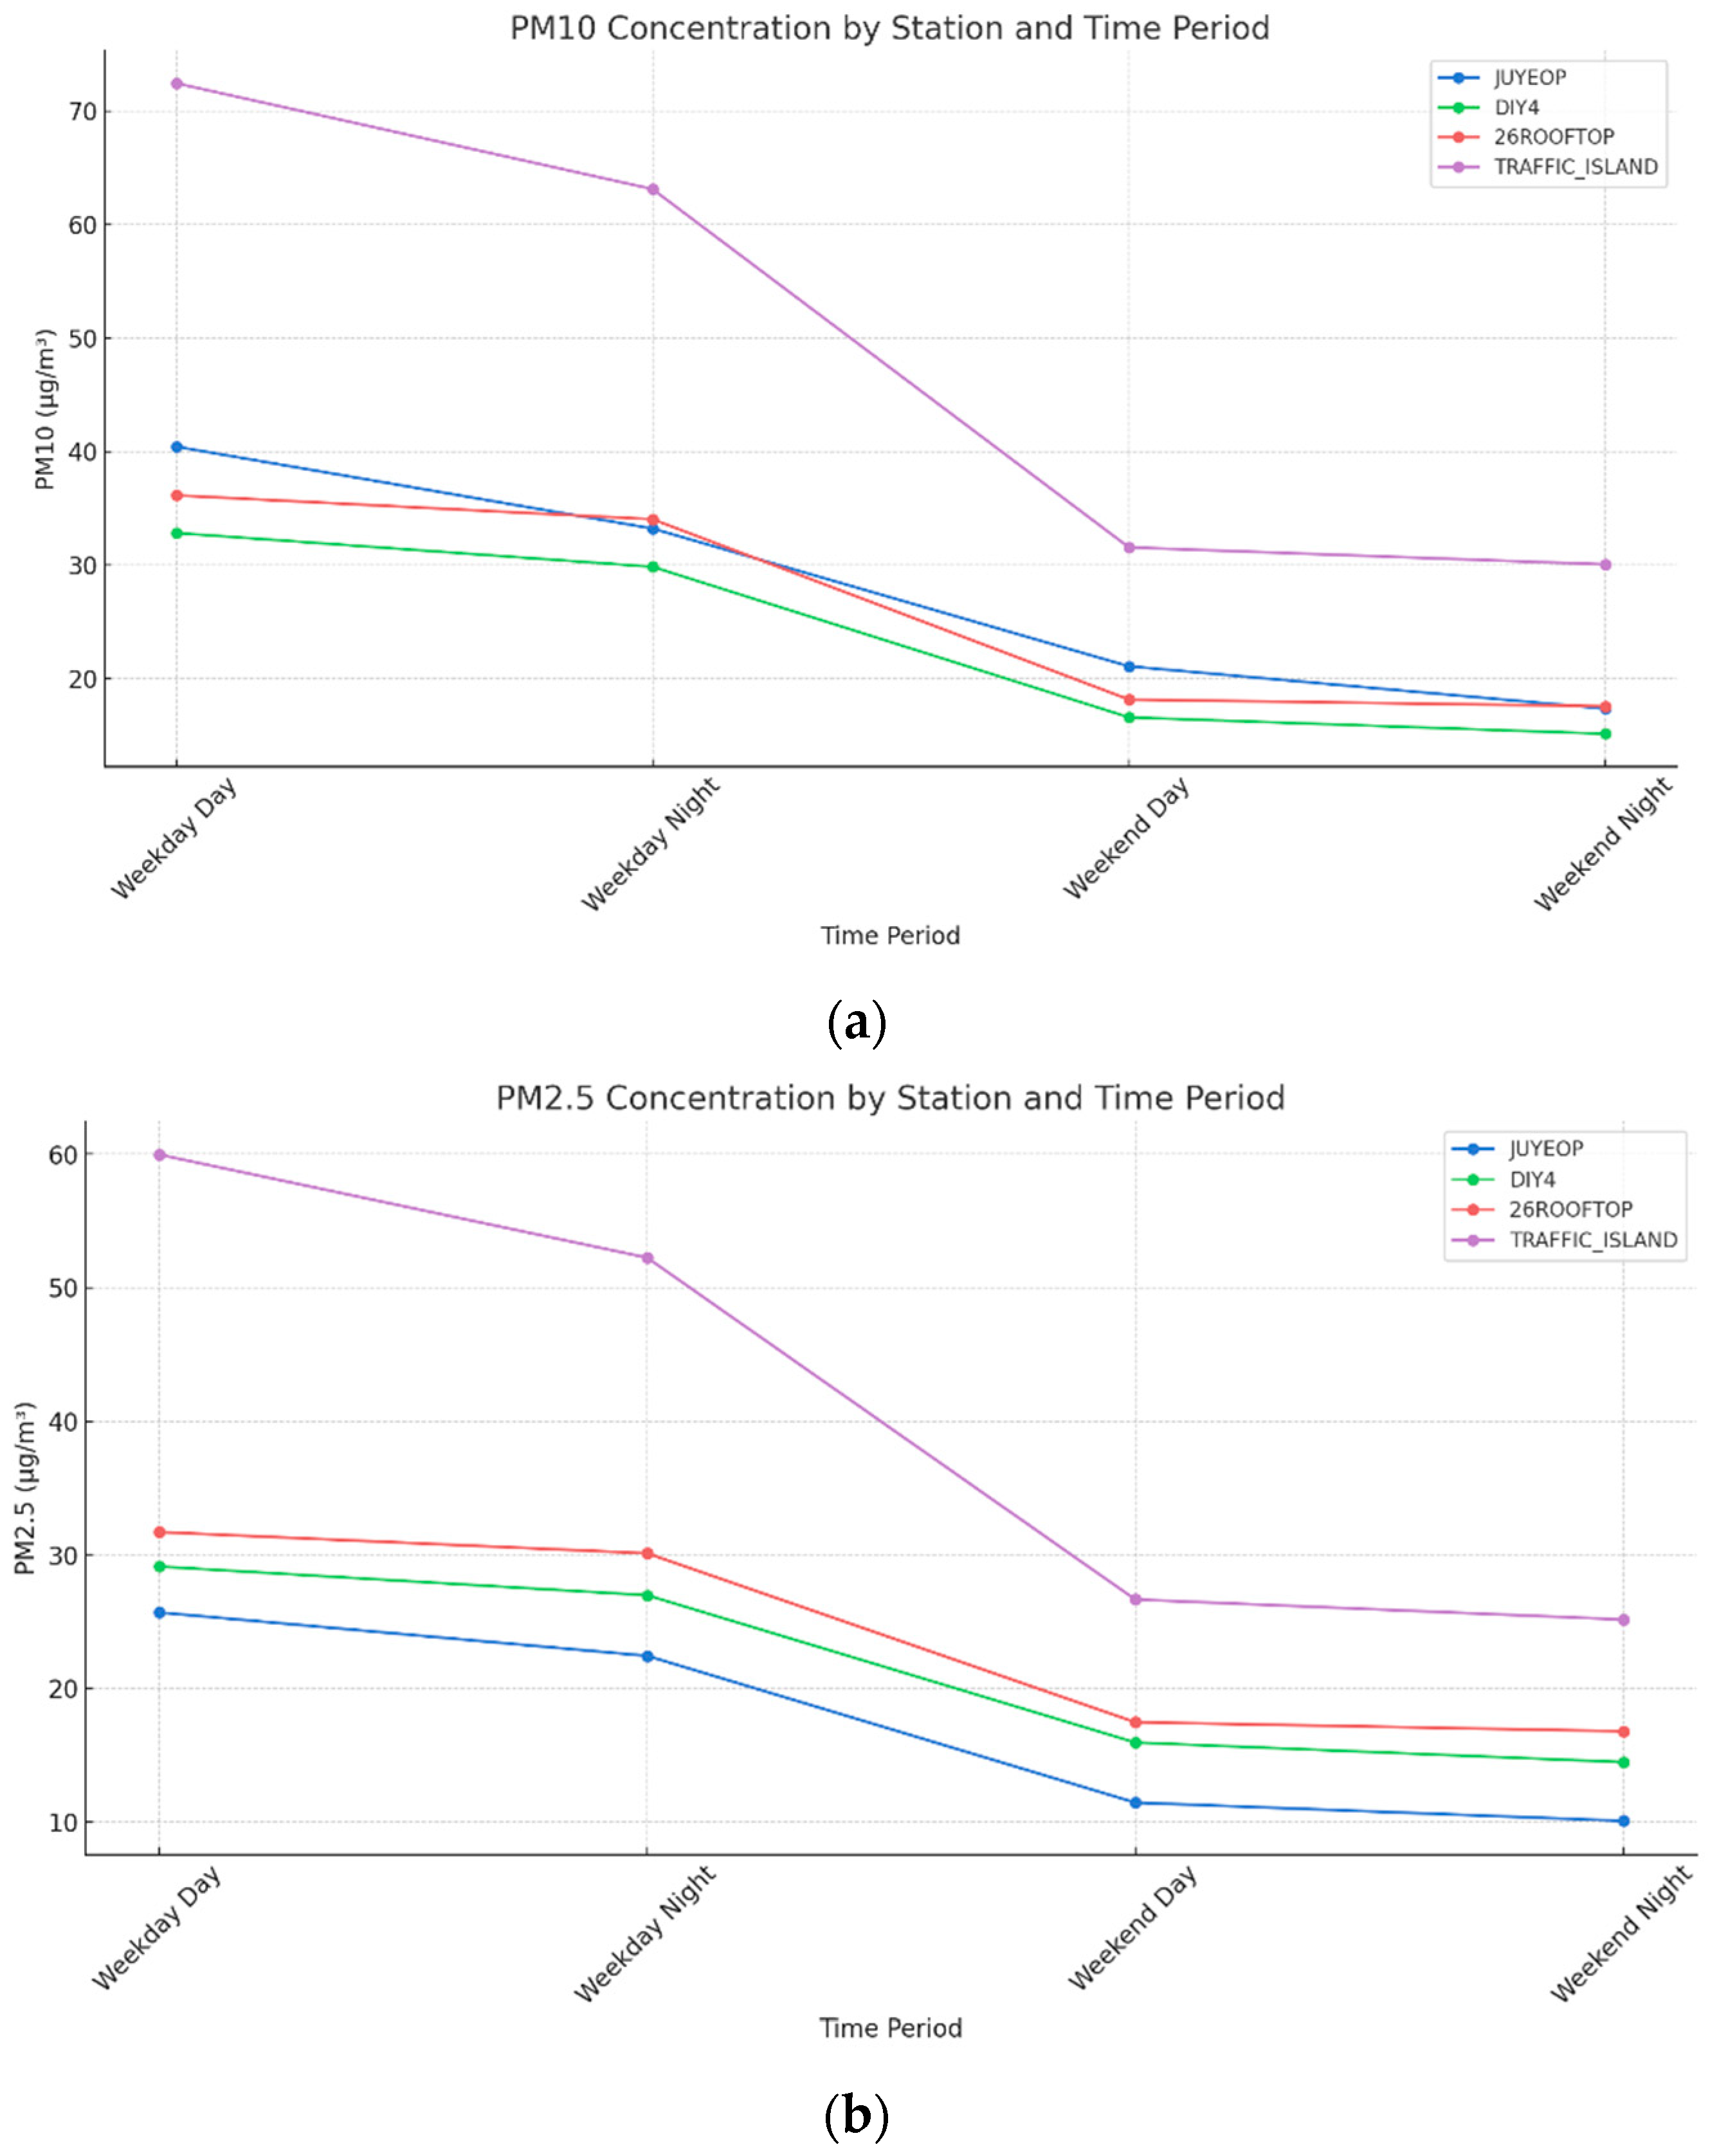
The results presented in Figure 8a,b were further analyzed by dividing the observations into weekday/weekend and day/night categories. Figure 9a,b, respectively, illustrate the temporal variations in PM10 and PM2.5 across the monitoring sites according to these time classifications.

4.2.1. Differences Between Weekdays and Weekends

The average PM concentrations were generally higher on weekdays than on weekends across all monitoring sites. Notably, the mean PM10 concentration at the TRAFFIC_ISLAND site during daytime on weekdays exceeded 70 µg/m3, representing the highest value observed during the study period. This outcome is directly attributable to the location of the site at the center of an eight-lane intersection, which is heavily affected by traffic emissions. The three other sites recorded lower PM10 and PM2.5 concentrations during weekends, which was likely due to the reduced traffic volume and decreased industrial activity.

4.2.2. Differences Between Daytime and Nighttime

Across all sites, the PM concentrations were consistently higher during the day than at night. This diurnal variation could be explained by the combined effects of increased daytime traffic and higher atmospheric mixing layer induced by solar radiation. This disparity was most pronounced at the TRAFFIC_ISLAND site, where the continuous inflow of vehicles and enclosed urban structure likely limited pollutant dispersion, thereby amplifying daytime concentrations.

4.2.3. Reliability of IoT Devices Compared with Public Monitoring Stations

Comparing the temporal patterns of the concentration changes between the JUYEOP public station and DIY4 and 26ROOFTOP sites revealed that both IoT sensing-based devices demonstrated significant correlations with the reference data. In particular, the direction and magnitude of the weekday/weekend and day/night variations closely matched those of the JUYEOP station. These findings provide quantitative evidence of the reliability of the proposed IoT devices, highlighting their potential as complementary monitoring tools, particularly in areas underserved by public stations. This also suggests the feasibility of establishing distributed citizen-centered air quality monitoring networks.

4.2.4. Time-Series Trends

The time-series comparison further indicated that the TRAFFIC_ISLAND site consistently recorded the highest PM10 and PM2.5 concentrations throughout the observation period, whereas the JUYEOP station showed relatively lower concentrations. The IoT-based devices deployed at DIY4 and 26ROOFTOP exhibited temporal trends similar to that at JUYEOP, but maintained lower absolute levels, reflecting the mitigating influence of distance from roadways and physical barriers such as buildings and trees. These results quantitatively demonstrate the impacts of roadside proximity and local topographic conditions on the observed PM concentrations.

4.3. IoT Sensing-Based Urban Roadside PM Analysis

A detailed analysis was conducted for the DIY4, 26ROOFTOP, and TRAFFIC_ISLAND sites to confirm the similarity of their data to those of the JUYEOP public station. The analysis combined site-specific characteristics with the PM concentration distributions.
The physical separation of DIY4 from the roadside by buildings and trees, which formed a semi-enclosed environment, partially shielded it from direct vehicular emissions. 26ROOFTOP, located on the rooftop of a three-story building adjacent to the road, is elevated and is therefore more influenced by dispersed particles in the atmosphere than by direct roadside emissions. TRAFFIC_ISLAND, positioned at the center of an eight-lane intersection, was directly exposed to vehicular exhaust and resuspended dust, making it the most vulnerable to high variability and peak concentrations.
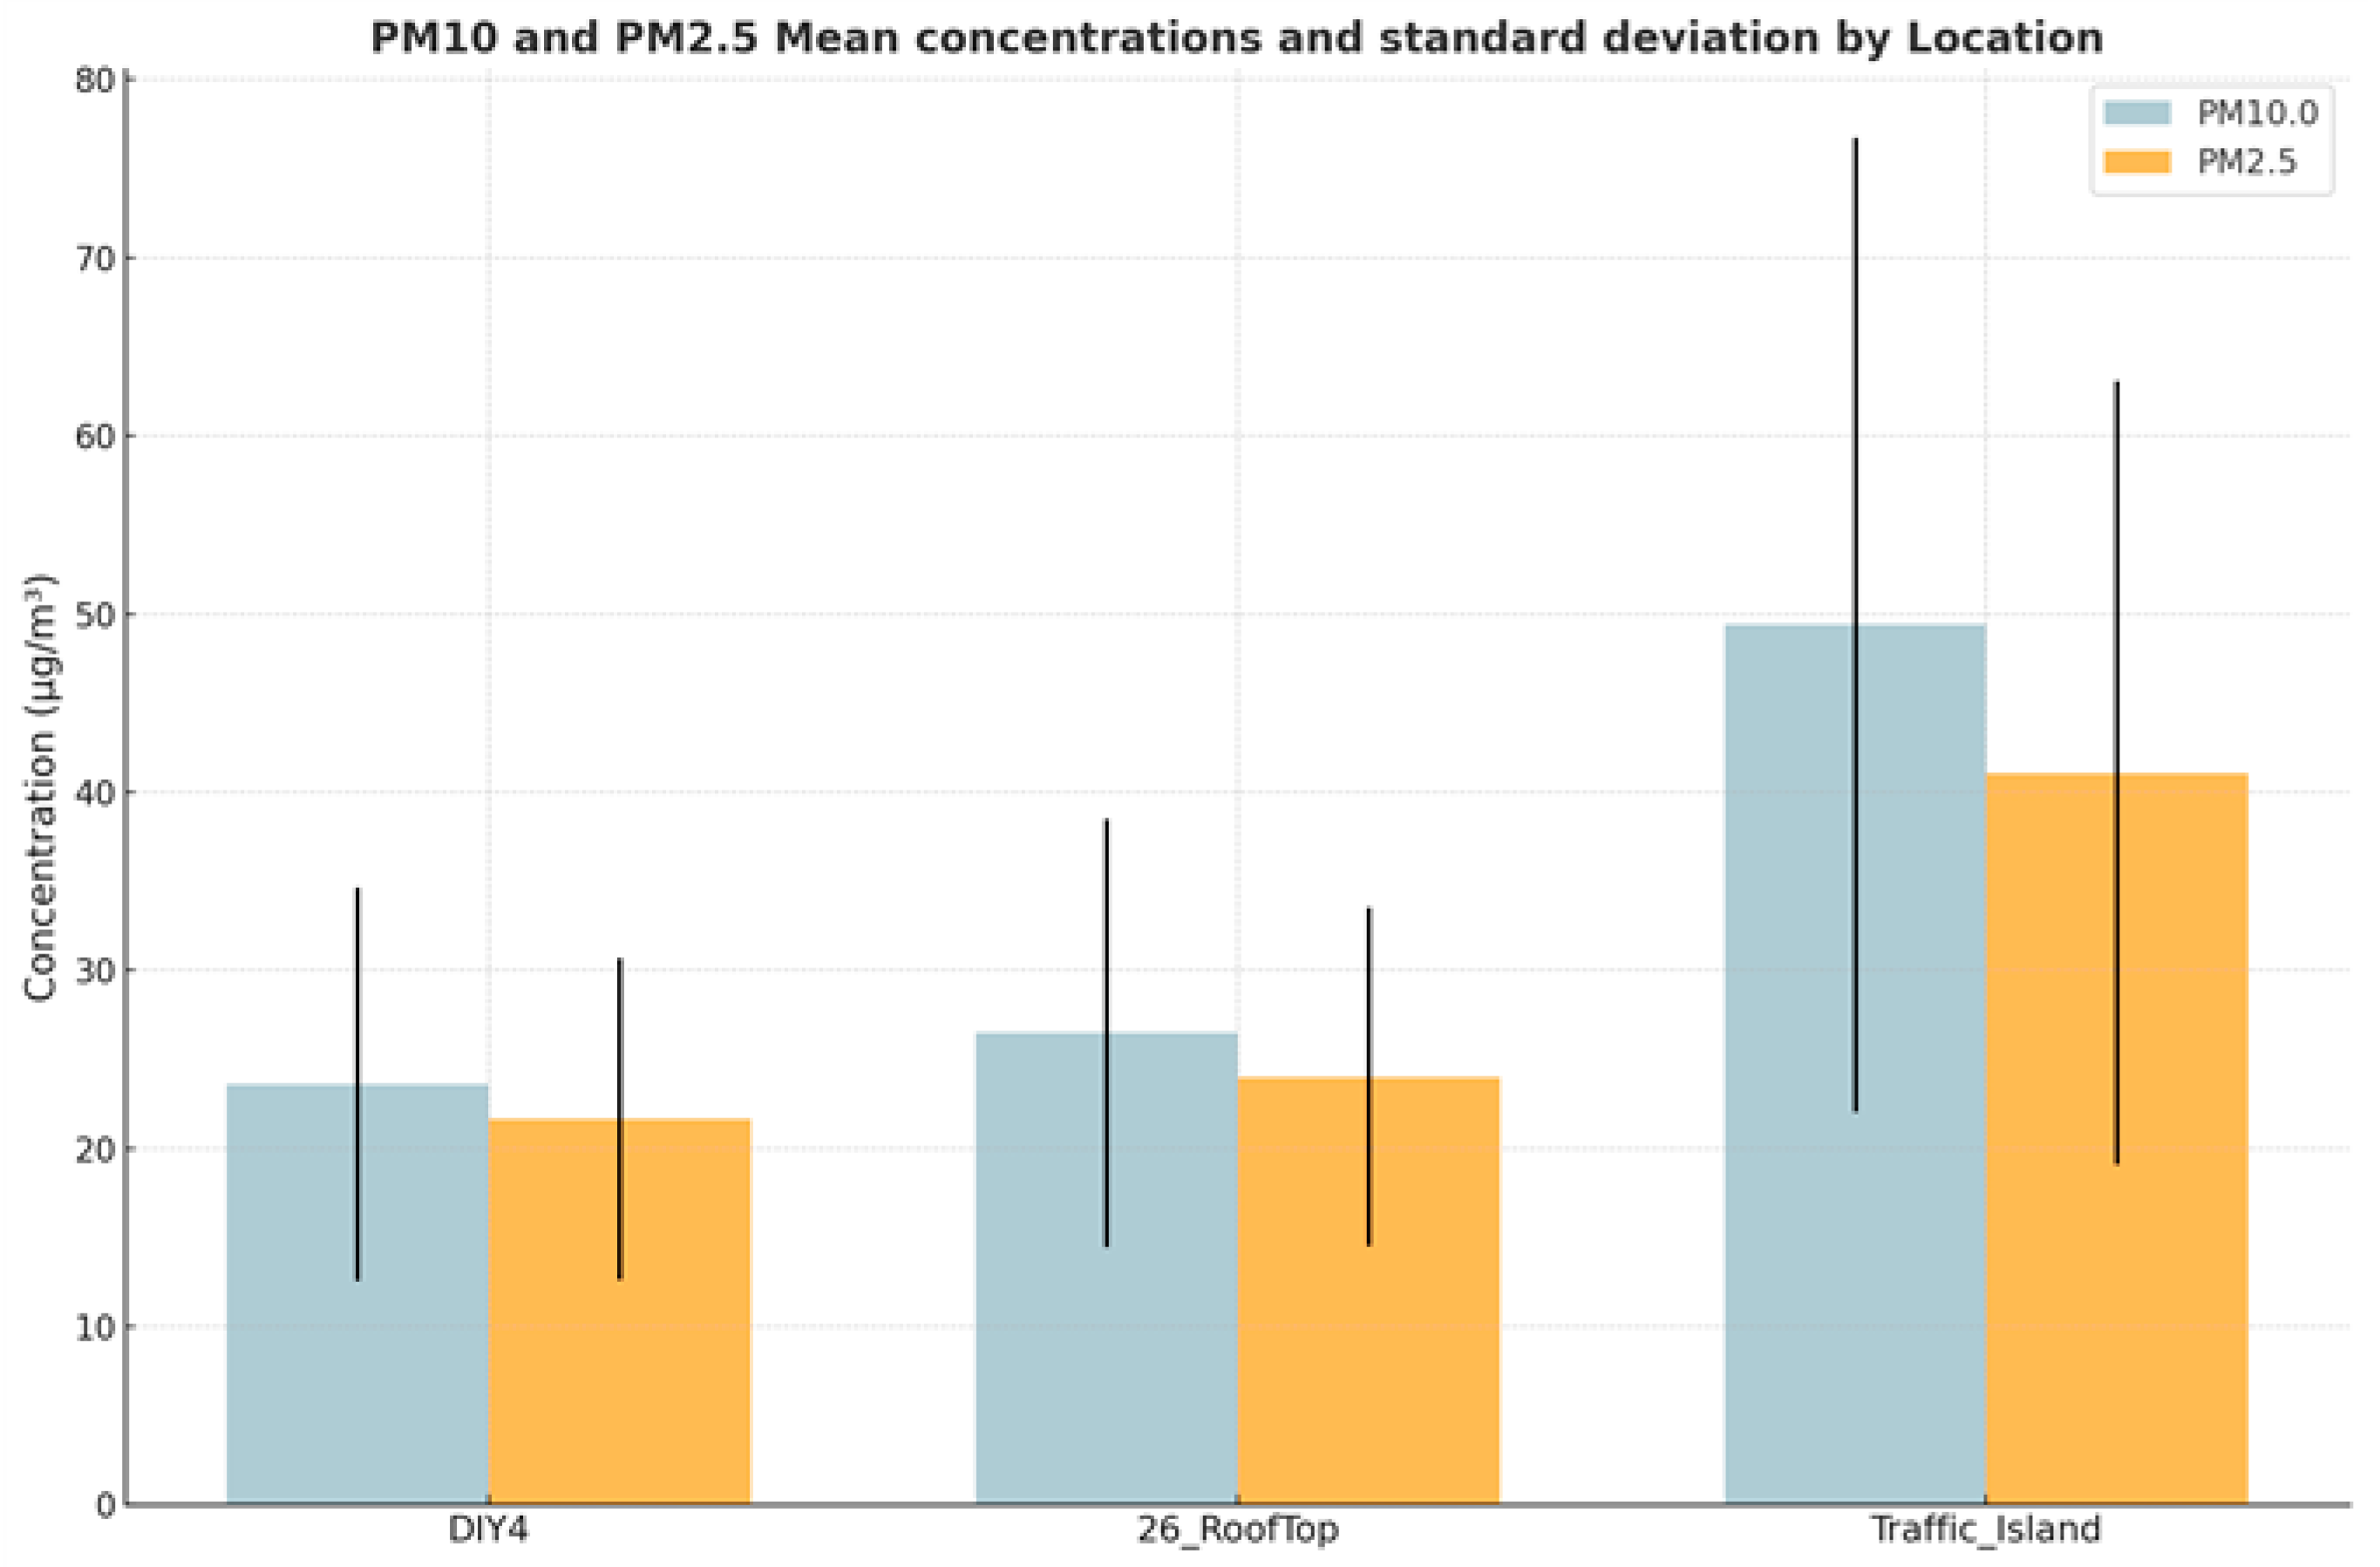
Figure 10 illustrates the mean concentrations and standard deviations of PM10 and PM2.5 at each site, providing a comparative view of both the average levels and variability. TRAFFIC_ISLAND recorded the highest mean values (PM10: 49.4 µg/m3; PM2.5: 41.1 µg/m3) and largest standard deviations (PM10: 27.4 µg/m3; PM2.5: 22.0 µg/m3), reflecting its environmental conditions that contribute to frequent daily fluctuations and peak events. DIY4 showed slightly lower concentrations (PM10: 23.6 µg/m3; PM2.5: 21.6 µg/m3) and more consistent patterns with JUYEOP station, attributed to structural shielding. 26ROOFTOP recorded the lowest averages (PM10: 26.5 µg/m3; PM2.5: 24.0 µg/m3), which can be attributed to its higher elevation and relative distance from direct roadside sources.
These findings quantitatively demonstrate that the physical setting and environmental context of each site significantly influenced the observed PM concentrations. In particular, the TRAFFIC_ISLAND site illustrates the susceptibility of dense urban intersections to localized high PM levels, whereas DIY4 and 26ROOFTOP confirm that the IoT-based devices not only captured patterns consistent with public reference data but also produced stable and reliable results. Thus, the proposed IoT sensing-based monitoring approach was validated as a scientifically meaningful and practically applicable method for characterizing urban roadside air quality.

4.4. Analysis of PM10 Impulse-like Spikes at TRAFFIC_ISLAND

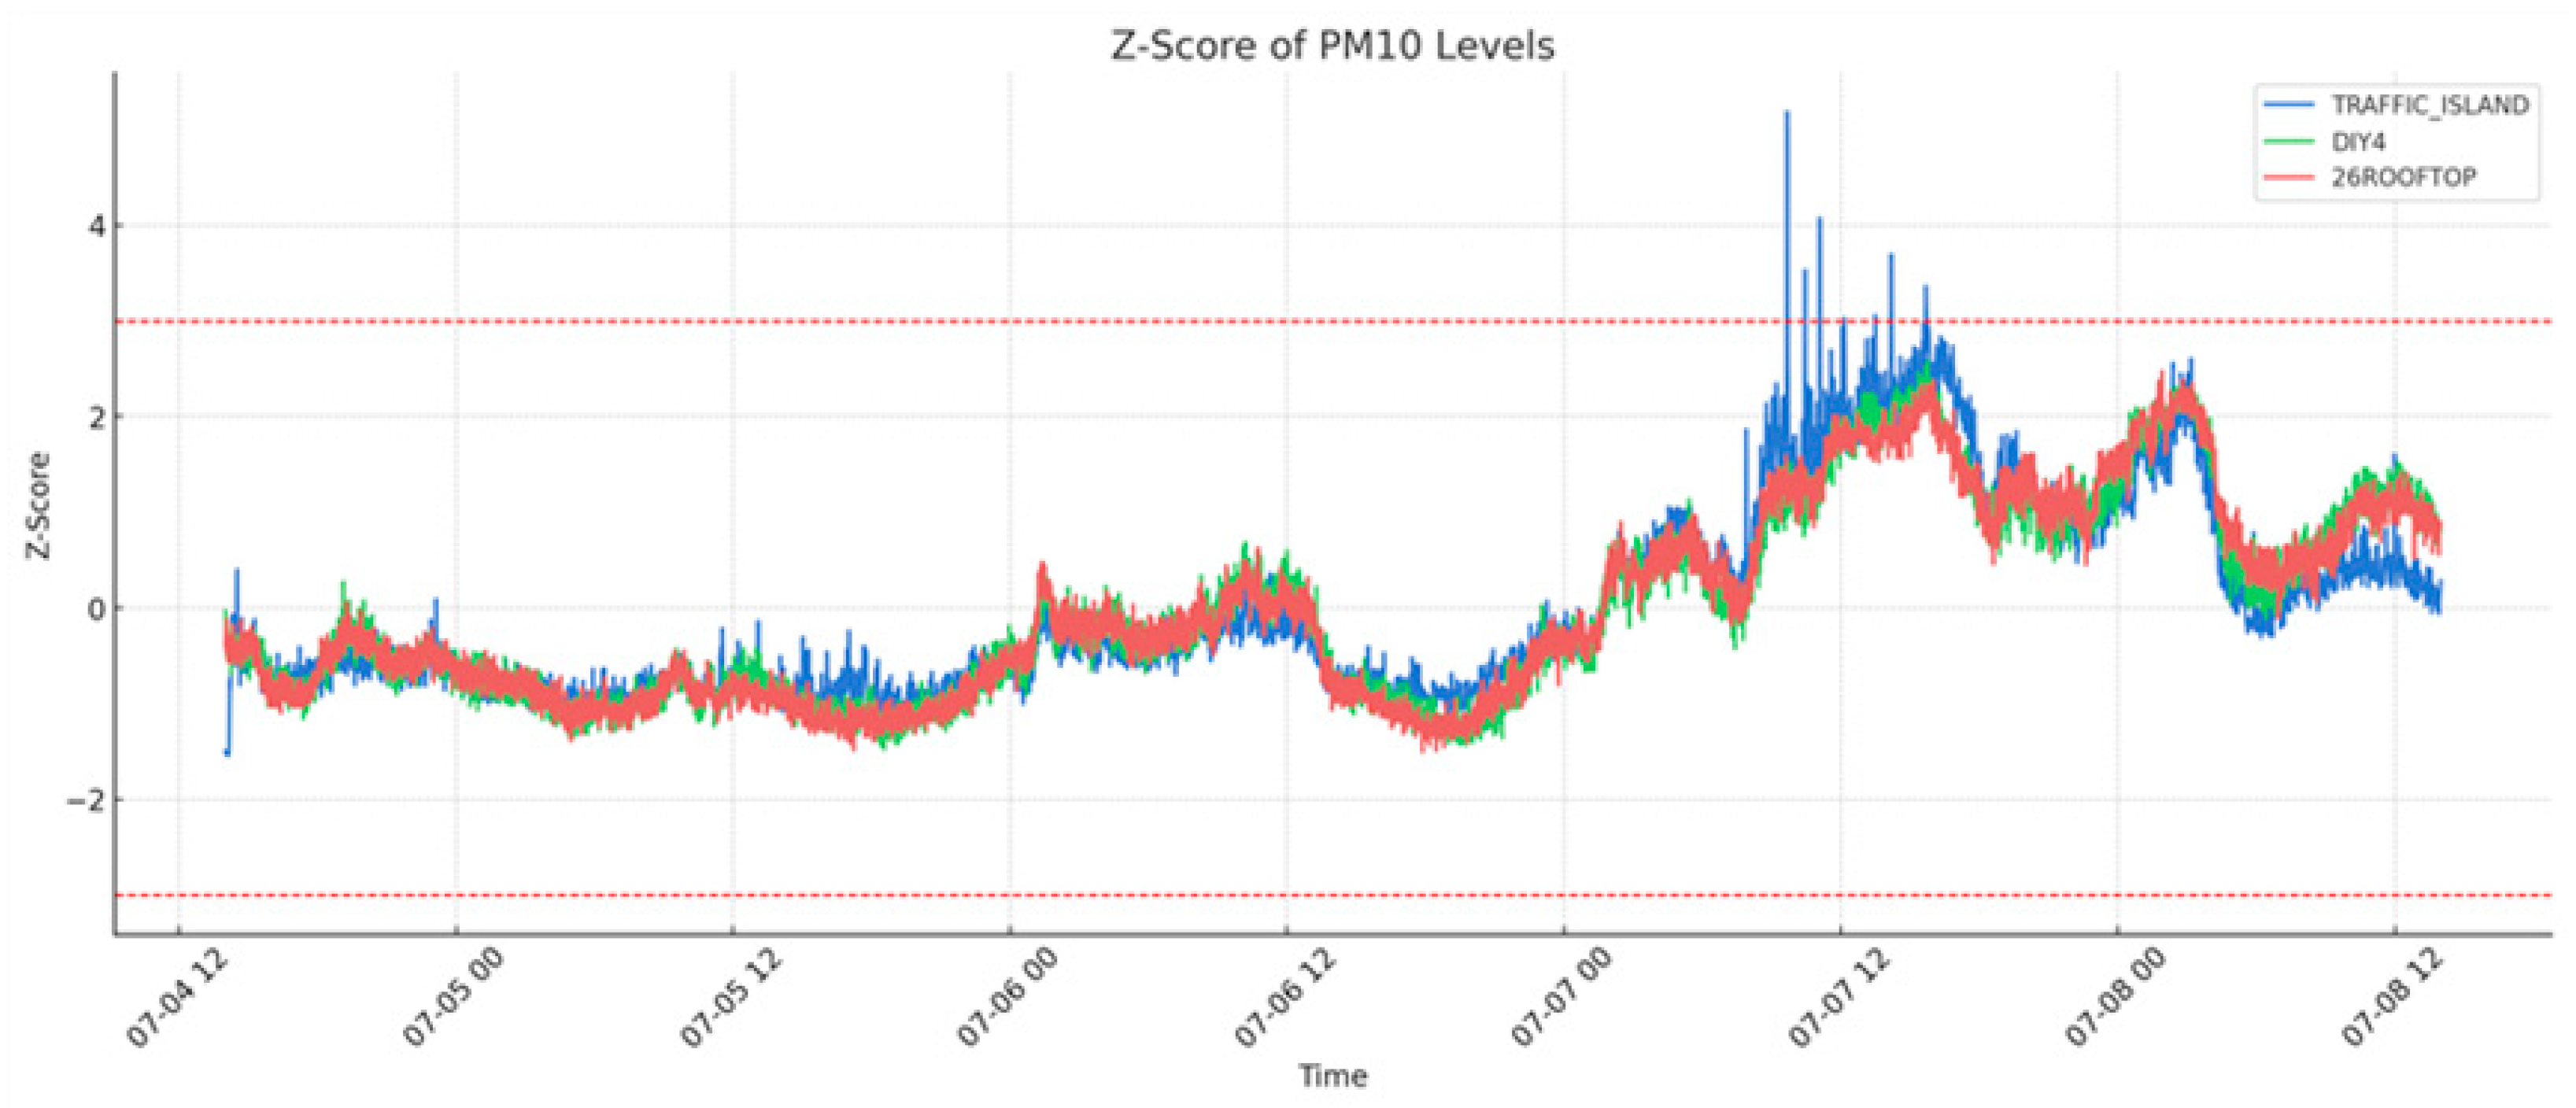
Figure 11 illustrates the identification of the outliers, which are defined as |z| > 3 (equivalent to ±3σ). A total of 13 outliers were detected at the TRAFFIC_ISLAND site, indicating repeated local and momentary concentration spikes. In contrast, no such anomalies were observed at the DIY4 or 26ROOFTOP sites, suggesting that these locations were less influenced by immediate traffic-related fluctuations. These findings confirm that TRAFFIC_ISLAND is highly sensitive to localized emission events caused by vehicle exhaust emissions and resuspended dust. The exceedance of the ±3σ (three standard deviation) thresholds (red lines) highlights the statistical distinctiveness of these impulse events.
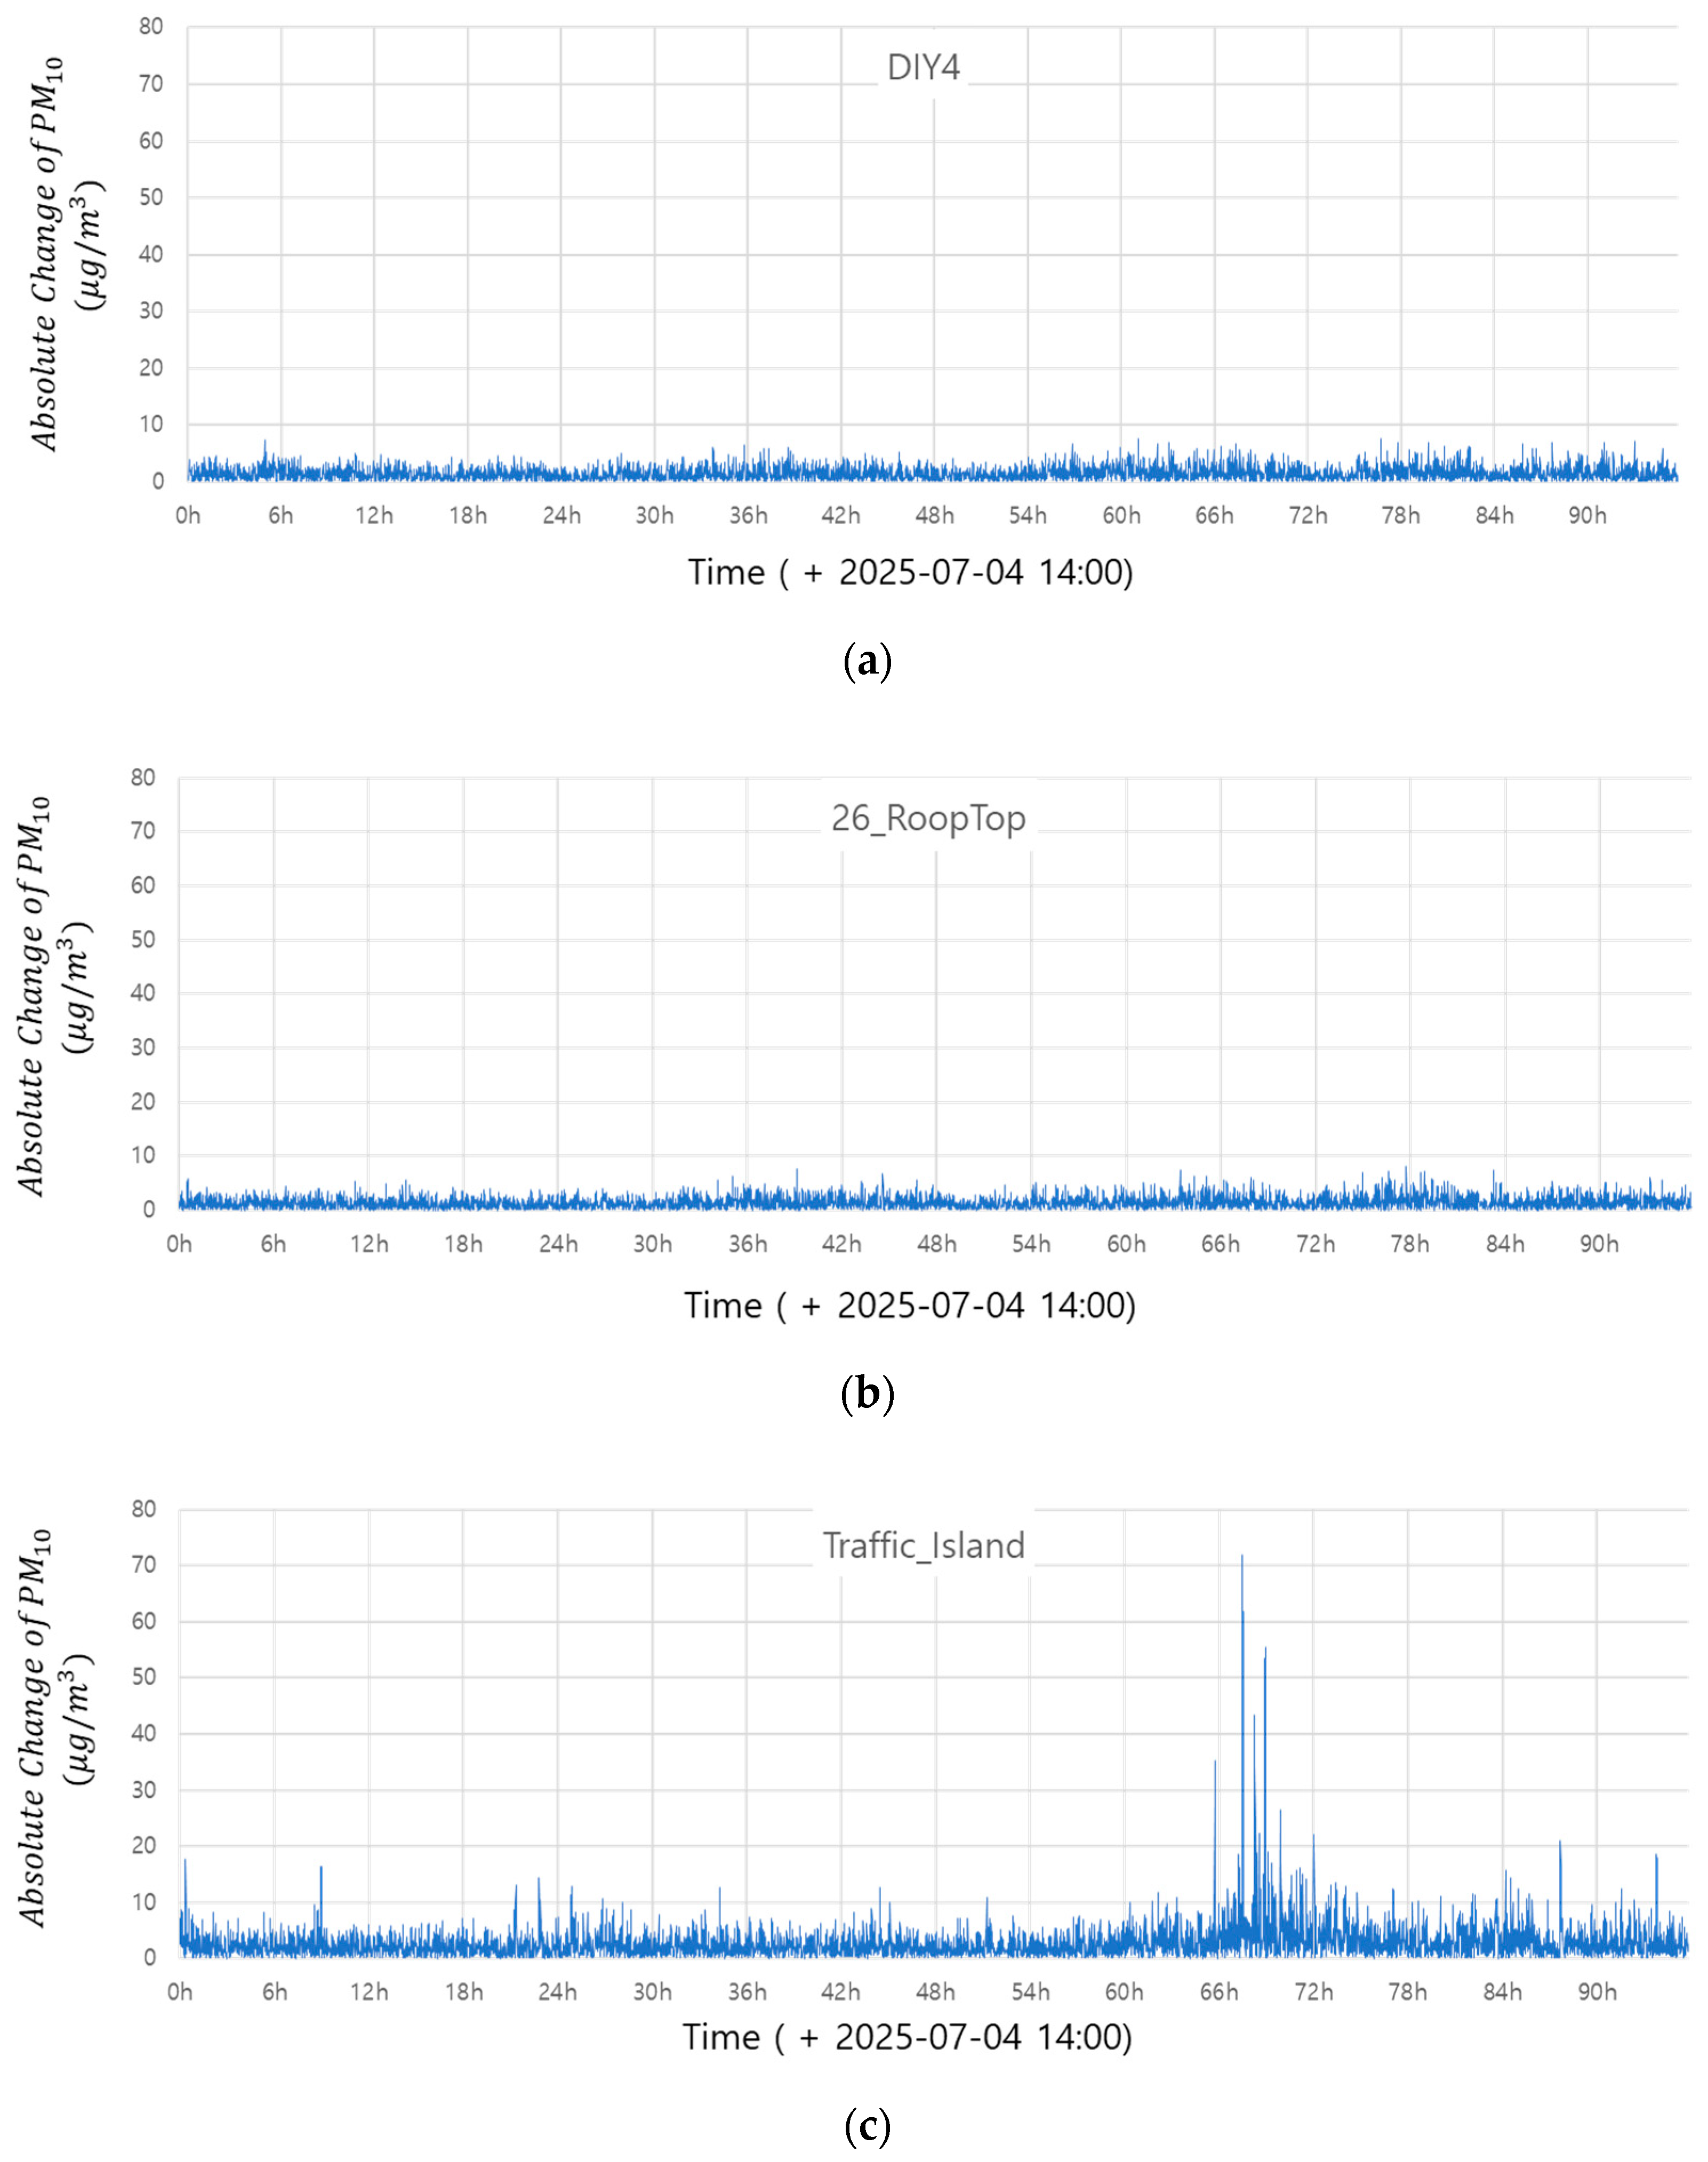
The roulette index values for each monitoring site are summarized in Table 4. DIY4 and 26ROOFTOP had relatively high values, indicating larger average changes than variability, which is consistent with gradual and predictable fluctuations. Conversely, TRAFFIC_ISLAND exhibited a much lower value, reflecting relatively small average changes, but frequent abrupt and irregular shifts. Figure 12 presents the time-series plots of absolute changes in PM10 concentration for each site: Figure 12a—DIY4, Figure 12b—26ROOFTOP, and Figure 12c—TRAFFIC ISLAND.
Pronounced spikes and drops are observed exclusively at the TRAFFIC ISLAND site, indicating frequent impulse-like fluctuations caused by localized factors such as traffic congestion and vehicle exhaust plumes. Although the overall variability at this site remains moderate, the occurrence of short-term high-concentration episodes is substantially more frequent than at other sites.
These characteristics cannot be fully captured by conventional variability metrics, emphasizing the need for fine-grained monitoring at traffic-congested urban intersections. In contrast, no comparable impulse events were observed at the shielded DIY4 site or the partially elevation-insulated 26ROOFTOP site, confirming that such phenomena are site-specific to TRAFFIC ISLAND and reflect the combined influence of its unique spatial configuration and temporal traffic dynamics.
These findings emphasize the importance of considering structural and environmental contexts when interpreting roadside measurements, underscoring the need for the fine-scale spatial monitoring of intersections as high-risk PM pollution hotspots.

5. Discussion

To understand localized PM concentration variability at different monitoring sites, this study analyzed data during the summer season (4–8 July 2025), when the external PM inflow was minimized. IoT sensing-based roadside PM monitoring devices were deployed and operated at three sites (DIY4, 26ROOFTOP, and TRAFFIC_ISLAND), and the results were compared with the observations from the JUYEOP public monitoring station to evaluate their similarity and the devices’ observational reliability. Quantitative evaluation employed Pearson correlation, cross-correlation at lag 0, DTW, Z-score variability analysis, and the roulette index. In addition, temporal patterns by day/night and weekday/weekend were examined.

5.1. Reliability of the Proposed Approach

The PM10 and PM2.5 results at DIY4 and 26ROOFTOP showed strong agreement with the data from the JUYEOP public monitoring station, with correlation coefficients exceeding 0.89 for PM10 and 0.88 for PM2.5. Their relatively low DTW distances confirm that the IoT devices captured time-series patterns similar to those of the reference station. Variability analyses based on the Z-score and roulette index further indicate that although IoT devices show slightly more noise, they share sensitive responses to the same temporal and environmental factors. These findings suggest that IoT-based sensing provides sufficiently reliable and effective complementary monitoring to supplement public observational networks.

5.2. Site-Specific Characteristics and Environmental Influences

The highest average PM concentrations observed in the TRAFFIC_ISLAND site, with PM10 frequently exceeding 70 µg/m3 during weekday daytime, reflect the direct impact of heavy traffic, congestion, idling, and resuspended road dust in this location. Short-term impulses or abrupt spikes observed at this site, with multiple outliers exceeding ±3σ (three standard deviation) in the Z-score analysis, are also likely associated not only with regular traffic flow but also episodic factors, such as construction work or post-sprinkling operations. In comparison, DIY4 and 26ROOFTOP, which were less affected by direct vehicular emissions owing to shielding by trees/buildings and higher elevation, respectively, exhibited smoother variations with clearer diurnal and weekday–weekend patterns. Notably, 26ROOFTOP showed a more pronounced daytime decrease in concentration, reflecting the influence of boundary layer development and wind-driven dispersion at higher altitudes.
These findings are consistent with previous studies identifying traffic intersections as major pollution hotspots, yet the characteristics differ from other microenvironments such as tunnels or toll plazas. For instance, Woo et al. [12] observed that PM concentrations inside tunnels were approximately 1.8 times higher than those outside due to poor ventilation and exhaust accumulation, while Kang et al. [13,14] reported elevated levels at toll plazas and rest areas associated with frequent idling and stop-and-go driving. Compared with these enclosed or semi-enclosed environments, the open-air intersection in this study exhibited more dynamic fluctuations driven by congestion, vehicle acceleration, and wind-driven dispersion. This comparison highlights the diverse mechanisms governing pollution accumulation across different traffic-related settings and underscores the need for localized IoT-based monitoring to capture such spatial variability.

5.3. Temporal Trends by Time of Day and Day of Week

Across all sites, a consistent pattern of higher concentrations was observed on weekdays compared with weekends and during daytime compared with nighttime. These differences correspond closely to traffic volume, diurnal boundary layer dynamics, and industrial or residential activity levels. The TRAFFIC_ISLAND site exhibited the strongest amplification of these contrasts, reflecting its high sensitivity to vehicular emissions and traffic conditions.

5.4. Validity and Applicability of the Analytical Methodology

Quantitative variability analysis using the Z-score and roulette index effectively identified short-term spikes and outlier events that would otherwise not be captured by averages or simple correlation measures. In particular, the roulette index is useful for quantifying the density of abrupt changes and characterizing the sensitivity and noise properties of each monitoring location.
Together, these multidimensional analyses provide empirical evidence that supports the applicability of IoT-based PM monitoring devices. When integrated with site-specific environmental characteristics, this system can serve as a complementary tool for enhancing the precision and spatial resolution of roadside and urban air quality surveillance. Further integration with meteorological data, traffic volume, and land use information is expected to enable more refined source attributions and the development of real-time response strategies in the future.
However, several methodological limitations should be acknowledged. The linear interpolation of 1-h public monitoring data to a 1-min temporal resolution may have introduced smoothing effects, potentially attenuating short-term variations. This approach was necessary to synchronize the different data acquisition intervals between IoT and public datasets, but the results should be interpreted as approximations rather than direct equivalences. Additionally, the use of a single public monitoring station (JUYEOP) as the sole reference source limits the spatial representativeness of the validation results. Future studies will include multi-site calibration and simultaneous co-located measurements to better assess spatial variability and improve cross-site consistency.

5.5. Implications and Future Directions

The results of this study confirm that urban traffic intersections act as significant particulate matter hotspots due to vehicle congestion, idling, and resuspended road dust. Beyond simple concentration differences, these findings suggest that such micro-scale traffic environments create highly variable exposure conditions for pedestrians and nearby residents. In these environments, not only do PM2.5, and PM10 concentrations increase, but the particles are also likely to contain higher proportions of heavy metals, black carbon, and secondary aerosols, which can enhance oxidative and inflammatory toxicity. Therefore, future studies should include compositional analyses of particulate matter, incorporating simultaneous observations of multiple pollutants such as COx, NOx, SO2, and volatile organic compounds (VOCs), to better elucidate the source contributions and potential health risks associated with roadside exposure.
From a policy perspective, the findings of this study indicate that short-term traffic-flow management or localized restrictions may have limited effectiveness in reducing particulate matter concentrations. This is largely because regional air circulation and meteorological conditions often dominate local PM2.5 variability. This interpretation is consistent with the findings of Zhang et al. [37], who demonstrated through machine learning and causal inference that improvements in air quality observed during the Asian Games in Hangzhou were primarily attributable to favorable meteorological conditions, with limited effects from local traffic control measures. Therefore, achieving effective PM mitigation requires an integrated approach that combines local traffic management with regional-scale air quality and meteorological strategies.
Building on these results, future research will expand the current IoT-based PM monitoring system to incorporate additional gas-phase pollutant sensors (e.g., COx, NOx, O3, and SO2) and to establish a high-resolution PM monitoring network along major urban road corridors. As shown in Figure 1, the device was intentionally designed with a multi-interface architecture to enable such modular expansion. Through this enhanced sensing framework, spatiotemporal pollutant dispersion can be quantitatively analyzed in relation to traffic volume, wind conditions, and pedestrian density. In the long term, the study aims to develop an integrated urban PM management model that incorporates pedestrian health risk assessment. This approach is expected to contribute to evidence-based air quality management and public health policymaking grounded in real-time observational data.

6. Conclusions

This study developed and validated a low-cost IoT-based sensing device as the core technology for building a dense roadside PM observation network to support safe and sustainable smart road environments. Devices were deployed at three sites along major urban roads with different environmental conditions, and the data collected were compared with those from the nearest public monitoring station. Excluding external environmental factors other than traffic emissions and high-resolution 1-min PM10 and PM2.5, the data were analyzed using Pearson correlation, cross-correlation, DTW, Z-score variability, and the roulette index, thereby comprehensively verifying the reliability and applicability of the low-cost, high-density roadside PM monitoring approach.
The proposed IoT sensing devices demonstrated significantly strong correlations with public monitoring data and highly consistent temporal variation patterns, providing empirical evidence that the proposed system can serve as a reliable supplementary monitoring approach for roadside air quality monitoring. Physical and topographical site conditions were determined to directly influence roadside air quality measurements, and the environmental characteristics of each observation site revealed distinct patterns. Notably, the observation site located at a traffic island in an intersection exhibited concentrations associated with frequent vehicular emissions and congestion. The Z-score analysis further revealed localized spikes driven by traffic queues, idling, resuspended road dust, and construction activities. In contrast, devices installed at residential and rooftop sites showed smoother variations with clearer diurnal and weekday–weekend patterns, with the rooftop data exhibiting marked reductions during the daytime owing to boundary layer development and wind-driven dispersion. Temporal trend analysis confirmed consistent differences across all sites, with higher concentrations on weekdays and during the day compared with weekends and at night, respectively. The strongest contrasts were observed in TRAFFIC_ISLAND, highlighting its high sensitivity to traffic volume, human activity, and diurnal boundary layer dynamics.
Overall, this study demonstrated that the developed low-cost IoT sensing-based dense roadside PM monitoring device can effectively complement public air quality networks, thereby overcoming the limitations of cost and spatial coverage. Such a system is suitable for capturing fine-scale environmental information not only along highways, but also on residential streets, providing valuable data for smart city development and sustainable road environment management.
Finally, the study acknowledges limitations in terms of the number of sites and observation period. Future research should expand both spatial and temporal coverage, incorporate meteorological, traffic, and land use data for multivariate analysis, and apply artificial intelligence-based predictive models to develop more comprehensive real-time response systems. In addition, integration with autonomous vehicle heating, ventilation, and air conditioning systems, traffic signal control, and public health response frameworks could enable IoT sensing-based monitoring networks to become key infrastructures for enhancing the safety, livability, and sustainability of urban environments.

Supplementary Materials

The following supporting information can be downloaded at: https://www.mdpi.com/article/10.3390/app152111608/s1, Dataset S1: Cleaned experimental dataset in Excel format (Dataset_S1.xlsx), containing processed and validated measurement data that support the analyses and results presented in this study.

Author Contributions

Conceptualization, B.-J.J. and I.J.; methodology, B.-J.J.; software, B.-J.J.; validation, B.-J.J., I.J. and N.P.; formal analysis, B.-J.J.; investigation, I.J.; resources, B.-J.J.; data curation, N.P.; writing—original draft preparation, B.-J.J.; writing—review and editing, I.J. and N.P.; visualization, B.-J.J.; supervision, B.-J.J.; project administration, B.-J.J.; funding acquisition, I.J. All authors have read and agreed to the published version of the manuscript.

Funding

This work was supported by an Institute of Information & Communications Technology Planning & Evaluation (IITP) grant funded by the Korean government (MSIT) (No. 2022-0-00622, Digital Twin Testbed Establishment).

Data Availability Statement

The data presented in this study are available on request from the corresponding author.

Acknowledgments

During the preparation of this manuscript, the authors used ChatGPT-5 (OpenAI, San Francisco, CA, USA; GPT-5, 2025) solely for English translation.

Conflicts of Interest

Author Namjune Park was employed by the company BISTelligence, Inc. The remaining authors declare that the research was conducted in the absence of any commercial or financial relationships that could be construed as a potential conflict of interest.

Abbreviations

The following abbreviations are used in this manuscript:
IoTInternet of Things
PMParticulate Matter
MQTTMessage Queuing Telemetry Transport
JSONJavaScript Object Notation
CCTVclosed-circuit television
LTELong-Term Evolution
DTWDynamic Time Warping
VOCsVolatile Organic Compounds

References

  1. National Cancer Center. Outdoor Air Pollution; World Health Organization: Geneva, Switzerland, 2024; Volume 1, pp. 4–6. [Google Scholar]
  2. Ministry of the Environment. AirKorea. Available online: https://www.airkorea.or.kr/web/ (accessed on 21 August 2025).
  3. Nijland, M.E. Traffic-Related Air Pollution—The Health Effects Scrutinized. Ph.D. Thesis, Utrecht University, Utrecht, The Netherlands, 2013. [Google Scholar]
  4. Bein, K.J.; Wallis, C.D.; Silverman, J.L.; Lein, P.J.; Wexler, A.S. Emulating near-roadway exposure to traffic-related air pollution via real-time emissions from a major freeway tunnel system. Environ. Sci. Technol. 2022, 56, 3330–3339. [Google Scholar] [CrossRef]
  5. Peng, D. Connections between air pollution, traffic and respiratory health. J. Sustain. Sci. Techol. 2022, 2, 25–32. [Google Scholar] [CrossRef]
  6. Piotrowicz, A.; Połednik, B. Exposure to aerosols particles on an urban road. J. Ecol. Eng. 2019, 20, 27–34. [Google Scholar] [CrossRef]
  7. Rather, P.A.; Wanganeo, A. Contribution of vehicular traffic towards particulate emission and its effects on human health. Int. J. Geol. Sci. Res. 2018, 5, 110–118. [Google Scholar] [CrossRef]
  8. Baldauf, R.; Thoma, E.D.; Hays, M.D.; Shores, R.C.; Kinsey, J.S.; Gullett, B.K.; Kimbrough, S.; Isakov, V.; Long, T.C.; Snow, R.; et al. Traffic and meteorological impacts on near-road air quality: Summary of methods and trends from the Raleigh Near-Road Study. J. Air Waste Manag. Assoc. 2008, 58, 865–878. [Google Scholar] [CrossRef]
  9. Ummul, S.; Rao, K.K. Road transport and their impacts on health. IJEAB 2019, 4, 321–322. [Google Scholar] [CrossRef]
  10. Wang, Y.; Huang, Z.; Liu, Y.; Yu, Q.; Ma, W. Back-calculation of traffic-related PM10 emission factors based on roadside concentration measurements. Atmosphere 2017, 8, 99. [Google Scholar] [CrossRef]
  11. Seoul Metropolitan Government. Air Pollution Monitoring Network; Policy Press. Available online: https://www.seoulsolution.kr/en/content/6540 (accessed on 21 August 2025).
  12. Woo, D.; Lee, S.-B.; Lee, S.J.; Kim, J.Y.; Jin, H.C.; Kim, T.; Bae, G.-N. Spatial distributions of on-road ultrafine particle number concentration on Naebu Express Way in Seoul during winter season. J. Korean Soc. Atmos. Environ. 2013, 29, 10–26. [Google Scholar] [CrossRef]
  13. Kang, H.; Kim, C.; Kang, H.; Lee, J. A Study on the Status of Atmospheric Environment and the Plan of Air Quality Management on the Expressway [Research Report]; Expressway & Transportation Research Institute: Hwaseong, Republic of Korea, 2018; pp. 1–393. [Google Scholar]
  14. Kang, H.; Kim, C.; Lee, J. Monitoring and Reduction Technologies for Improvement of Highway Air Quality [Research Report]; Expressway & Transportation Research Institute: Hwaseong, Republic of Korea, 2020; pp. 1–253. [Google Scholar]
  15. Kim, J.; Kim, C.; Noh, S.; Hwang, E.; Park, D. A study on spatial distribution characteristics of air pollutants in Bucheon-si using mobile laboratory. Part. Aerosol Res. 2021, 17, 9–20. [Google Scholar] [CrossRef]
  16. Khan, S.; Hassan, Q.; Kumar, K.; Dixit, S.; Sharma, K.; Vivek Kumar, C.; Dhaliwal, N.; Madhu, B. E3S Web Conference. In Proceedings of the 15th International Conference on Materials Processing and Characterization (ICMPC 2023), Newcastle, UK, 5–8 September 2023; Volume 430. [Google Scholar]
  17. McCarthy, M.C.; Eisinger, D.S.; Hafner, H.R.; Chinkin, L.R.; Roberts, P.T.; Black, K.N.; Clark, N.N.; McMurry, P.H.; Winer, A.M. Particulate matter: A strategic vision for transportation-related research. Environ. Sci. Technol. 2006, 40, 5593–5599. [Google Scholar] [CrossRef]
  18. Zhang, D.Z.; Peng, Z.R. Near-road fine particulate matter concentration estimation using artificial neural network approach. Int. J. Environ. Sci. Technol. 2014, 11, 2403–2412. [Google Scholar] [CrossRef]
  19. Jose, J.; Srimuruganandam, B. Investigation of road dust characteristics and its associated health risks from an urban environment. Environ. Geochem. Health 2020, 42, 2819–2840. [Google Scholar] [CrossRef] [PubMed]
  20. Navarro-Ciurana, D.; Corbella, M.; Meroño, D. Effects of road dust particle size on mineralogy, chemical bulk content, pollution and health risk analyses. Int. J. Environ. Res. Public Health 2023, 20, 6655. [Google Scholar] [CrossRef] [PubMed]
  21. Choi, W.; Sung, H.; Chong, K.-S. AI-driven particulate matter estimation using urban CCTV: A comparative analysis under various experimental conditions. Appl. Sci. 2024, 14, 9629. [Google Scholar] [CrossRef]
  22. Garcia-Garza, L.A.; Tello-Leal, E.; Macías-Hernández, B.A.; Romero, G.; Hernandez-Resendiz, J.D. Particulate matter 1 μm (PM1) dataset collected by low-cost sensors in residential and industrial areas at the neighborhood level. Data Brief 2024, 54, 110411. [Google Scholar] [CrossRef]
  23. Liu, X.; Zhao, Q.; Zhu, S.; Peng, W.; Yu, L. An experimental application of laser-scattering sensor to estimate the traffic-induced PM2.5 in Beijing. Environ. Monit. Assess. 2020, 192, 450. [Google Scholar] [CrossRef]
  24. Chen, S.; Cui, K.; Yu, T.Y.; Chao, H.R.; Hsu, Y.C.; Lu, I.C.; Arcega, R.D.; Tsai, M.H.; Lin, S.L.; Chao, W.C.; et al. A big data analysis of PM2.5 and PM10 from low cost air quality sensors near traffic areas. Aerosol Air Qual. Res. 2019, 19, 1721–1733. [Google Scholar] [CrossRef]
  25. Noman Munshi, M.; Nihab Ahsan, S.M.; Shafinur Rahman, M.; Tauhid Ur Rahman, M. Application of low-cost air quality monitoring sensor to assess the exposure of ambient air pollution due to PM2.5 and PM10. In Sustainability in Environmental Engineering and Science; Kumar, S., Kalamdhad, A., Ghangrekar, M.M., Eds.; Springer: Singapore, 2021; pp. 135–148. [Google Scholar] [CrossRef]
  26. Alfano, B.; Barretta, L.; Del Giudice, A.; De Vito, S.; Di Francia, G.; Esposito, E.; Formisano, F.; Massera, E.; Miglietta, M.L.; Polichetti, T.S. A review of low-cost particulate matter sensors from the developers’ perspectives. Sensors 2020, 20, 6819. [Google Scholar] [CrossRef]
  27. Raspberry Pi Ltd. Raspberry Pi Zero 2 W—Product Brief. 2024. Available online: https://datasheets.raspberrypi.com/rpizero2/raspberry-pi-zero-2-w-product-brief.pdf (accessed on 21 August 2025).
  28. Laser Particle Sensor Module (PM2008M-M) Specification. 2020. Available online: https://en.gassensor.com.cn/Product_files/Specifications/PM2008M-M%20Laser%20Particle%20Sensor%20Module%20Specification.pdf (accessed on 21 August 2025).
  29. OASIS. MQTT Version 3.1.1. Plus Errata 01; OASIS Standard. 2015. Available online: https://docs.oasis-open.org/mqtt/mqtt/v3.1.1/os/mqtt-v3.1.1-os.html (accessed on 21 August 2025).
  30. The JavaScript Object Notation (JSON) Data Interchange Format; RFC 8259; Bray, T., Ed.; IETF: Wilmington, DE, USA, 2017. [Google Scholar] [CrossRef]
  31. Kim, D.; Choi, H.-E.; Gal, W.-M.; Seo, S. Five year trends of particulate matter concentrations in Korean regions (2015–2019): When to ventilate? Int. J. Environ. Res. Public Health 2020, 17, 5764. [Google Scholar] [CrossRef]
  32. Allabakash, S.; Lim, S.; Chong, K.-S.; Yamada, T.J. Particulate matter concentrations over South Korea: Impact of meteorology and other pollutants. Remote Sens. 2022, 14, 4849. [Google Scholar] [CrossRef]
  33. Stein, A.F.; Draxler, R.R.; Rolph, G.D.; Stunder, B.J.B.; Cohen, M.D.; Ngan, F. NOAA’s HYSPLIT atmospheric transport and dispersion modeling system. Bull. Am. Meteorol. Soc. 2015, 96, 2059–2077. [Google Scholar] [CrossRef]
  34. Pearson, K. VII. Note on regression and inheritance in the case of two parents. Proc. R. Soc. Lond. 1895, 58, 240–242. [Google Scholar] [CrossRef]
  35. Box, G.E.P.; Jenkins, G.M. Time Series Analysis: Forecasting and Control; Holden-Day: San Francisco, CA, USA, 1970. [Google Scholar]
  36. Sakoe, H.; Chiba, S. Dynamic programming algorithm optimization for spoken word recognition. IEEE Trans. Acoust. Speech Signal Process. 1978, 26, 43–49. [Google Scholar] [CrossRef]
  37. Zhang, F.; Yan, R.; Ye, X.; Fei, L.; Zhu, Y.; Chen, X.; Zhu, S.; Qi, B.; Xu, D.; Li, W. Machine learning and causal inference for disentangling air pollution reduction during the asian games in megacity hangzhou. Environ. Pollution. 2025, 382, 126775. [Google Scholar] [CrossRef]
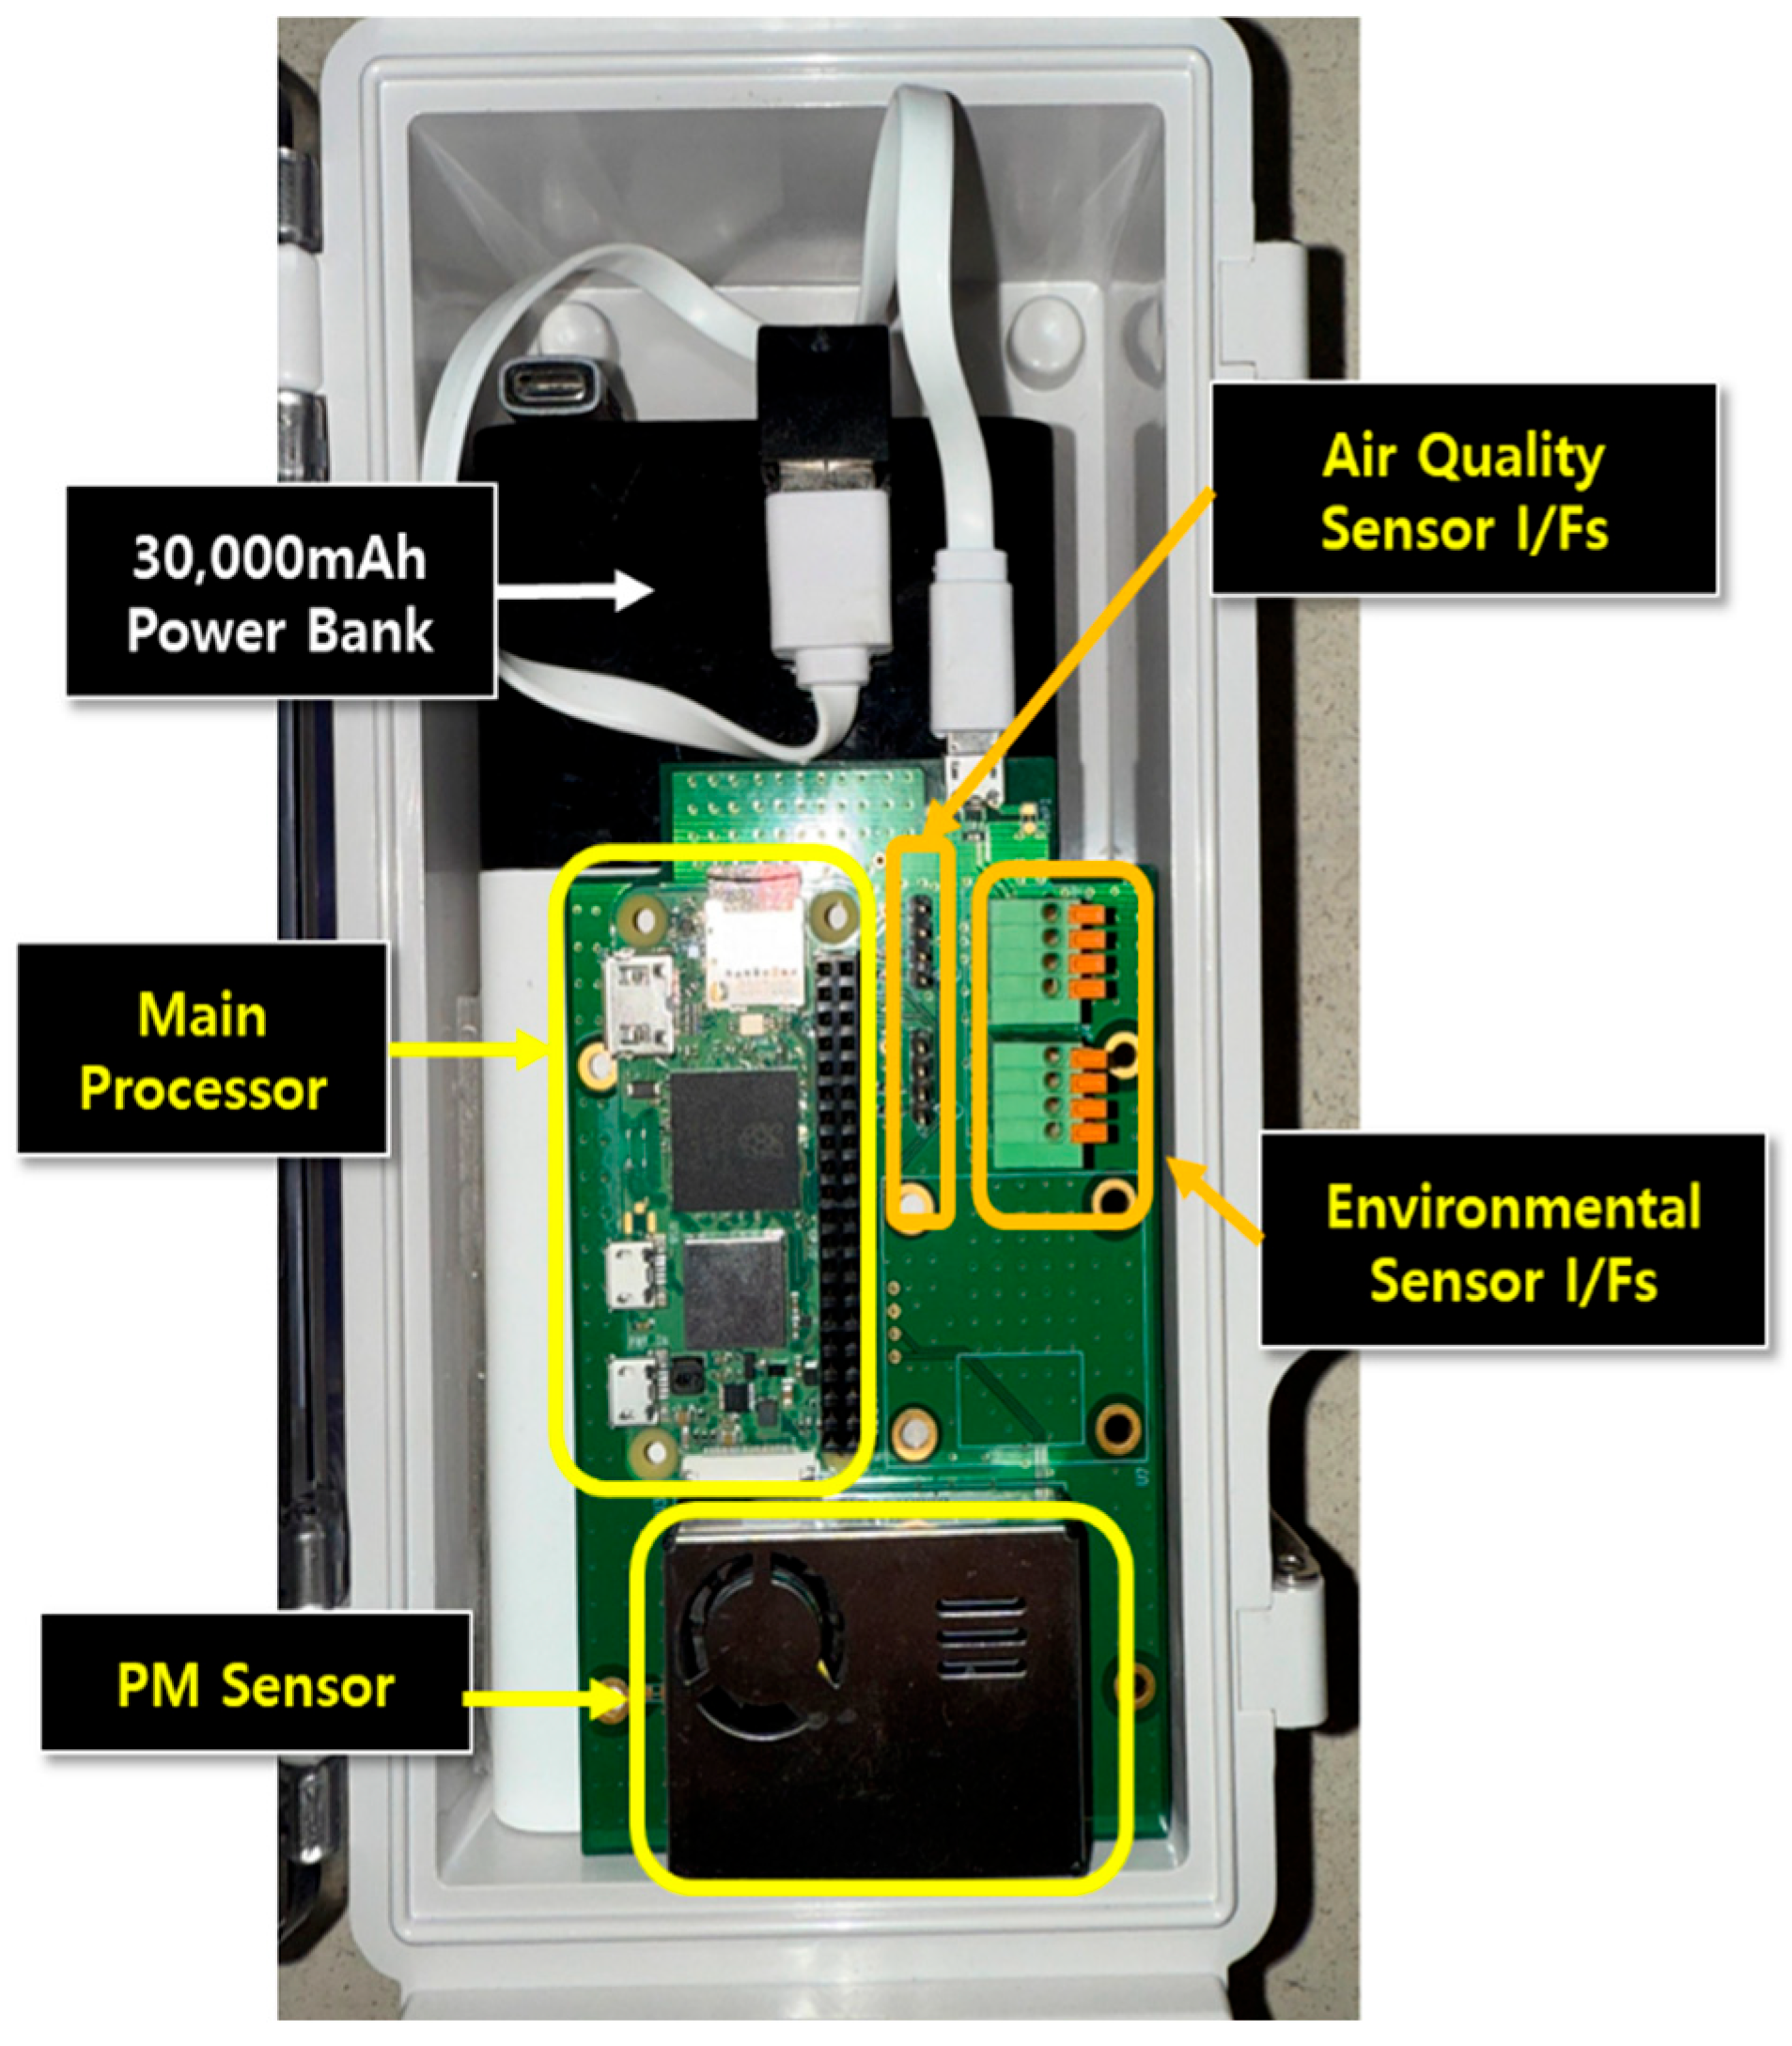
Figure 1. Experimental roadside particulate matter (PM) monitoring device (Height × Width × Depth is 20 cm × 12 cm × 8 cm).
Applsci 15 11608 g001
Figure 2. Laboratory co-exposure experiment for inter-sensor validation of the developed IoT-based PM monitoring devices, (a) Experimental setup, (b) Results of the PM sensor stabilization and state change test for PM2.5, and (c) Time series of PM2.5 residuals for each sensor with respect to the ensemble mean, in which each colored line represents the output of one of the ten sensors.
Applsci 15 11608 g002aApplsci 15 11608 g002b
Figure 3. Monthly PM10 distribution in South Korea in 2022, (a) January, (b) February, (c) April, (d) May, (e) July, (f) August, (g) November, and (h) December.
Applsci 15 11608 g003
Figure 4. Location of the Internet of Things (IoT) sensing-based roadside PM monitoring device installation area and JUYEOP public monitoring station.
Applsci 15 11608 g004
Figure 5. Location of the (left) traffic island and (right) installed IoT sensing-based PM monitoring device.
Applsci 15 11608 g005
Figure 6. Location of the (left) rooftop and (right) installed IoT sensing-based PM monitoring device.
Applsci 15 11608 g006
Figure 7. Location of the (left) roadside trees and low-rise building and (right) installed IoT sensing-based PM monitoring device.
Applsci 15 11608 g007
Figure 8. Time-series comparison of particulate matter concentrations at the three monitoring sites after temporal synchronization, (a) PM10 concentration trends at DIY4, TRAFFIC_ISLAND, and 26ROOFTOP sites, and (b) PM2.5 concentration trends at the same sites.
Applsci 15 11608 g008
Figure 9. Variations in particulate matter concentrations by observation period for the monitoring datasets, (a) PM10 concentration distributions classified by weekday/weekend and day/night periods, and (b) PM2.5 concentration distributions for the same temporal categories.
Applsci 15 11608 g009
Figure 10. Mean concentrations and standard deviations of PM10 and PM2.5 at the three observation sites.
Applsci 15 11608 g010
Figure 11. Detection of PM10 outliers using the Z-score (|z| > 3.0), the red dashed lines indicate the ±3.0 Z-score threshold used to identify extreme deviations.
Applsci 15 11608 g011
Figure 12. Detection of absolute PM10 displacement using the roulette index, (a) DIY4, (b) 26ROOFTOP, and (c) TRAFFIC_ISLAND.
Applsci 15 11608 g012
Table 1. Features and location conditions of the monitoring sites.
StationSampling
Interval
LocationDistance from RoadExpected PM Impact
JUYEOP1 h
(upsampled)
4th floor rooftop,
public air quality station
Relatively
far and elevated
Baseline reference,
low variability
DIY41 s
(1-min avg)
Roadside, behind trees & buildings (shielded)Not directly connected,
indirect influence
Possibly lower
due to shielding
26ROOFTOP1 s
(1-min avg)
Near road, rooftop of
3rd floor building
Close but elevated
(diffusion is possible)
Moderate level
due to dilution
TRAFFIC_ISLAND1 s
(1-min avg)
Traffic island
at 8-lane intersection
Very close,
directly exposed
High variability
due to direct exposure
Table 2. Results of the similarity analysis for PM10 observations.
SitePearson CorrelationCross-Correlation (Lag 0)Dynamic Time Warping (DTW) Distance
DIY40.89890.898813,380.18
26ROOFTOP 0.89960.899511,516.55
TRAFFIC_ISLAND0.92280.922670,733.55
Table 3. Results of the similarity analysis for PM2.5 observations.
SitePearson CorrelationCross-Correlation (Lag 0)DTW Distance
DIY40.88660.886413,312.14
26ROOFTOP0.88340.883322,342.81
TRAFFIC_ISLAND0.91530.915197,776.32
Table 4. Calculated roulette index values at each monitoring site.
SiteRoulette Index
DIY41.271
26ROOFTOP1.284
TRAFFIC_ISLAND0.884
Disclaimer/Publisher’s Note: The statements, opinions and data contained in all publications are solely those of the individual author(s) and contributor(s) and not of MDPI and/or the editor(s). MDPI and/or the editor(s) disclaim responsibility for any injury to people or property resulting from any ideas, methods, instructions or products referred to in the content.