Article

Nanosecond Laser-Fabricated Titanium Meshes and Their Chemical Modification for Photocatalytic and SERS Applications

by
Piotr Krzemiński
1,
Algirdas Lazaukas
2,
Sarunas Meskinis
2,
Renata Wojnarowska-Nowak
1,
Bogumił Cieniek
1,
Yaroslav Bobitski
1 and
Joanna Kisała
1,*
1
Faculty of Exact and Technical Sciences, University of Rzeszow, Pigonia 1 Str., 35-310 Rzeszow, Poland
2
Institute of Materials Science, Kaunas University of Technology, K. Baršausko 59, LT-51423 Kaunas, Lithuania
*
Author to whom correspondence should be addressed.
Appl. Sci. 2025, 15(21), 11579; https://doi.org/10.3390/app152111579
Submission received: 19 September 2025 / Revised: 21 October 2025 / Accepted: 27 October 2025 / Published: 29 October 2025
(This article belongs to the Special Issue The Applications of Laser-Based Manufacturing for Material Science)

Featured Application

The work demonstrates the development of nanosecond laser-fabricated titanium meshes chemically modified with silver nanoparticles and surface oxidation for advanced photocatalysis and surface-enhanced Raman scattering (SERS) applications.

Abstract

This study presents the fabrication and chemical modification of titanium meshes produced by nanosecond laser drilling, tailored for advanced photocatalytic and surface-enhanced Raman scattering (SERS) applications. Titanium meshes were fabricated via pulsed laser ablation (TM_1) and subsequently modified either by deposition of silver nanoparticles through irradiation (TM_2) and sonication (TM_3) or by surface oxidation using hydrogen peroxide (TM_4). Morphological and compositional analyses revealed that these modifications lead to distinct Ag nanoparticle morphologies and significant increases in surface oxygen content, notably enhancing photocatalytic performance. Photocatalytic tests demonstrated that the TM_4 mesh achieved the highest degradation rate of methylene blue, underscoring the critical role of surface oxygen enrichment. In contrast, TM_2 and TM_3 exhibit strong potential as surface-enhanced Raman scattering (SERS) substrates due to the well-distributed plasmonic silver nanostructures that enhance local electromagnetic fields. Their three-dimensional porous architecture facilitates high surface area and efficient analyte adsorption (MB), further improving SERS sensitivity. These findings establish nanosecond laser-processed titanium meshes, particularly those that are chemically modified, as promising, scalable materials for efficient water purification and effective SERS substrates for molecular sensing.

1. Introduction

Clean water access is crucial for economic growth and productivity, playing a vital role in agriculture, industry, and energy generation. Contaminated water sources can lead to crop failure, factory shutdowns, and impaired power production, impacting livelihoods and national economies [1]. In urban environments, high population densities amplify the need for reliable water treatment to prevent outbreaks and infrastructure strain. As global climate change intensifies droughts and shifts precipitation patterns, the resilience of water purification systems becomes even more important to ensure supply.
Water purification is an essential process for protecting human health, preserving environmental quality, and supporting sustainable development. Billions of people worldwide lack access to safe drinking water, resulting in the spread of waterborne diseases such as cholera, dysentery, and typhoid [2]. Contaminants in water, ranging from microorganisms to heavy metals and organic pollutants, pose severe risks to populations, especially in regions with inadequate sanitation infrastructure. Industrial discharges and agricultural runoff further exacerbate contamination, introducing chemicals, pesticides, and microplastics into natural water bodies [3]. Modern titanium mesh filters, frequently fabricated using advanced laser processing, offer durable and efficient solutions for water cleaning, combining mechanical, chemical, and photocatalytic functions. These innovations help to address the growing demand for reusable, high-performance water purification media.
Surface-enhanced Raman scattering (SERS) is a highly sensitive and specific vibrational spectroscopy technique that amplifies Raman signals of molecules adsorbed on nanostructured metal surfaces, particularly noble metals like gold and silver. This amplification arises from localized surface plasmon resonance (SPR), where collective electron oscillations generate intense electromagnetic fields (“hot spots”) near the metal surface [4], significantly enhancing molecular Raman scattering. Since its discovery in the 1970s, SERS has been widely used as a nondestructive and highly sensitive vibrational spectroscopic tool for detecting chemical and biological molecules adsorbed on structured surfaces. This enhancement is primarily due to the plasmonic properties of noble metal nanostructures, enabling the detection of low concentrations of analytes with high specificity [5]. This enhancement of Raman signals has revolutionized molecular detection in chemical, biological, and environmental sensing.
Silver nanoparticles immobilized on a structured titanium surface create an effective SERS substrate due to the strong localized surface plasmon resonance (LSPR) of Ag [6]. Titanium provides a mechanically stable, corrosion-resistant substrate. The highly ordered titanium surface provides a suitable surface for the uniform dispersion of silver nanoparticles. The combined physicochemical properties of the substrate and the deposited silver nanoparticles enhance the electromagnetic fields around the silver nanostructures, significantly increasing the sensitivity of molecular detection. Additionally, the photocatalytic activity of titanium oxides can contribute to the self-cleaning of the substrate [7], improving its reusability and durability. This synergy between the plasmonic properties of silver and the stability of titanium makes Ag-decorated titanium a promising platform for reliable and high-performance SERS sensor applications.
Nanosecond laser processing is a highly precise method for fabricating titanium meshes used in various advanced applications [8]. The technique enables the formation of uniform microholes and tailored pore structures by delivering controlled energy pulses to thin titanium foils [9]. Unlike mechanical drilling, nanosecond lasers minimize mechanical stress, thereby reducing the risk of deformation and contamination in the mesh. The high speed and automated nature of laser micro drilling makes it ideal for industrial-scale mesh production with consistently high quality. Laser parameters such as pulse duration, energy, and repetition rate are critical in determining the final pore size and mesh geometry [10]. Processing can be carried out in different atmospheres, like air or argon, to control surface oxidation and functional layer formation. The resultant titanium mesh often features enhanced surface roughness and may exhibit increased oxygen content due to laser-induced oxide formation.
This research aims to demonstrate that nanosecond laser processing can produce cost-effective, scalable titanium mesh platforms that can be chemically tuned for two distinct, high-value environmental applications. Specifically, we investigate (1) the optimization of the meshes for superior photocatalytic degradation performance and (2) their potential as surface-enhanced Raman scattering (SERS) substrates for molecular sensing. This unified approach contributes to improved access to safe drinking water and effective environmental monitoring.

2. Materials and Methods

2.1. Mesh Preparation

Surface texturing and hole array fabrication were performed on commercially pure titanium foil substrates of 0.1 mm thickness using a nanosecond Yb-doped fiber laser system (Reaying RY-F30, 30 W, λ = 1064 nm; Figure 1). The laser operated at a fixed pulse width of approximately 120 ns. Beam delivery was achieved through a galvanometer-based scanning head controlled by Ezcad software (version 2.14.11). The focused laser spot diameter on the substrate surface was ~20 μm.
The laser ablation process involves the localized removal of material from the titanium foil surface by highly energetic nanosecond laser pulses. When a laser pulse strikes the material, its energy is rapidly absorbed, leading to a swift increase in temperature. Due to the nanosecond pulse duration, the material undergoes rapid melting, vaporization, and plasma formation. The expanding plasma ejects molten and vaporized material, creating microholes or textured features with minimal heat-affected zones compared to longer pulse durations. The galvanometer scanner precisely directs the focused laser beam across the substrate, enabling the fabrication of complex patterns such as line textures and periodic hole arrays. Key parameters like pulse energy, repetition rate, and scanning speed are carefully controlled to dictate the depth, diameter, and overall morphology of the ablated features.
For the fabrication of line patterns, the laser was operated at a repetition rate of 20 kHz with scanning speeds of 300 or 1000 mm/s. The output power was set to 5% of the nominal laser power. The distance between adjacent scan lines (hatch spacing) was adjusted to either 40 μm or 50 μm in order to vary the area density of the textured features. Considering the focused spot diameter of ~20 μm, these spacings were used to create non-overlapping parallel grooves and vary the density of the textured features.
For the fabrication of hole matrices, the same repetition rate of 20 kHz was employed. In this case, the scanning speed was increased to 6000 mm/s, and the laser operated at 70% of the nominal power. A continuous scanning mode was applied, enabling the generation of regularly arranged hole arrays on the titanium foil surface. The hole positions were defined as an array of dots through the graphical interface in the Ezcad software.

2.2. Morphological and Structural Surface Characterization

The surface morphology of the prepared samples was analyzed using a Helios NanoLab 650 field emission scanning electron microscope (FESEM) (FEI, Hillsboro, OR, USA) operated at accelerating voltages of 5 kV and 30 kV. Imaging was performed in secondary electron mode using an Everhart–Thornley detector (ETD) to achieve high-resolution topographical contrast. Additionally, energy-dispersive X-ray spectroscopy (EDS) was conducted with an EDAX detector (AMETEK, Berwyn, PA, USA) to determine the elemental composition. Surface roughness was measured using an Olympus OLS5100 LEXT 3D confocal laser microscope (Olympus Co., Tokyo, Japan). The samples were analyzed at a magnification of 421×. Ten different areas of each sample were examined, and 5 measurements of roughness profile were taken for each area.
The crystal phases of the samples were characterized using a Bruker D8 Advance X-ray diffractometer(Ettlingen, Germany) equipped with Cu Kα radiation (λ = 0.154056 nm) and operated at 40 kV and 40 mA.
Raman and surface-enhanced Raman scattering (SERS) spectra were acquired using an inVia Micro Raman spectrometer (Renishaw, UK) coupled with a Leica DM 2500 M microscope, Renishaw, UK, and a 633 nm laser excitation source. For spectral acquisition, the laser power was set to ~1.5 mW for standard Raman and 0.15 mW for SERS, with an exposure time of 10 s and triple scan accumulation. For SERS analysis, a 5 µL droplet of 1 × 10⁻⁶ M methylene blue solution was deposited on the substrates, which were then dried at room temperature. Spectra were collected over the 100–2000 cm−1 range using a 50× objective, and baseline correction was applied during data processing to improve signal clarity.

2.3. Modification of Titanium Mesh

The as-prepared titanium meshes were subjected to various chemical modifications to produce samples TM_1 through TM_4. The specific treatment conditions for each sample are summarized in Table 1.

2.4. Photocatalytic Properties

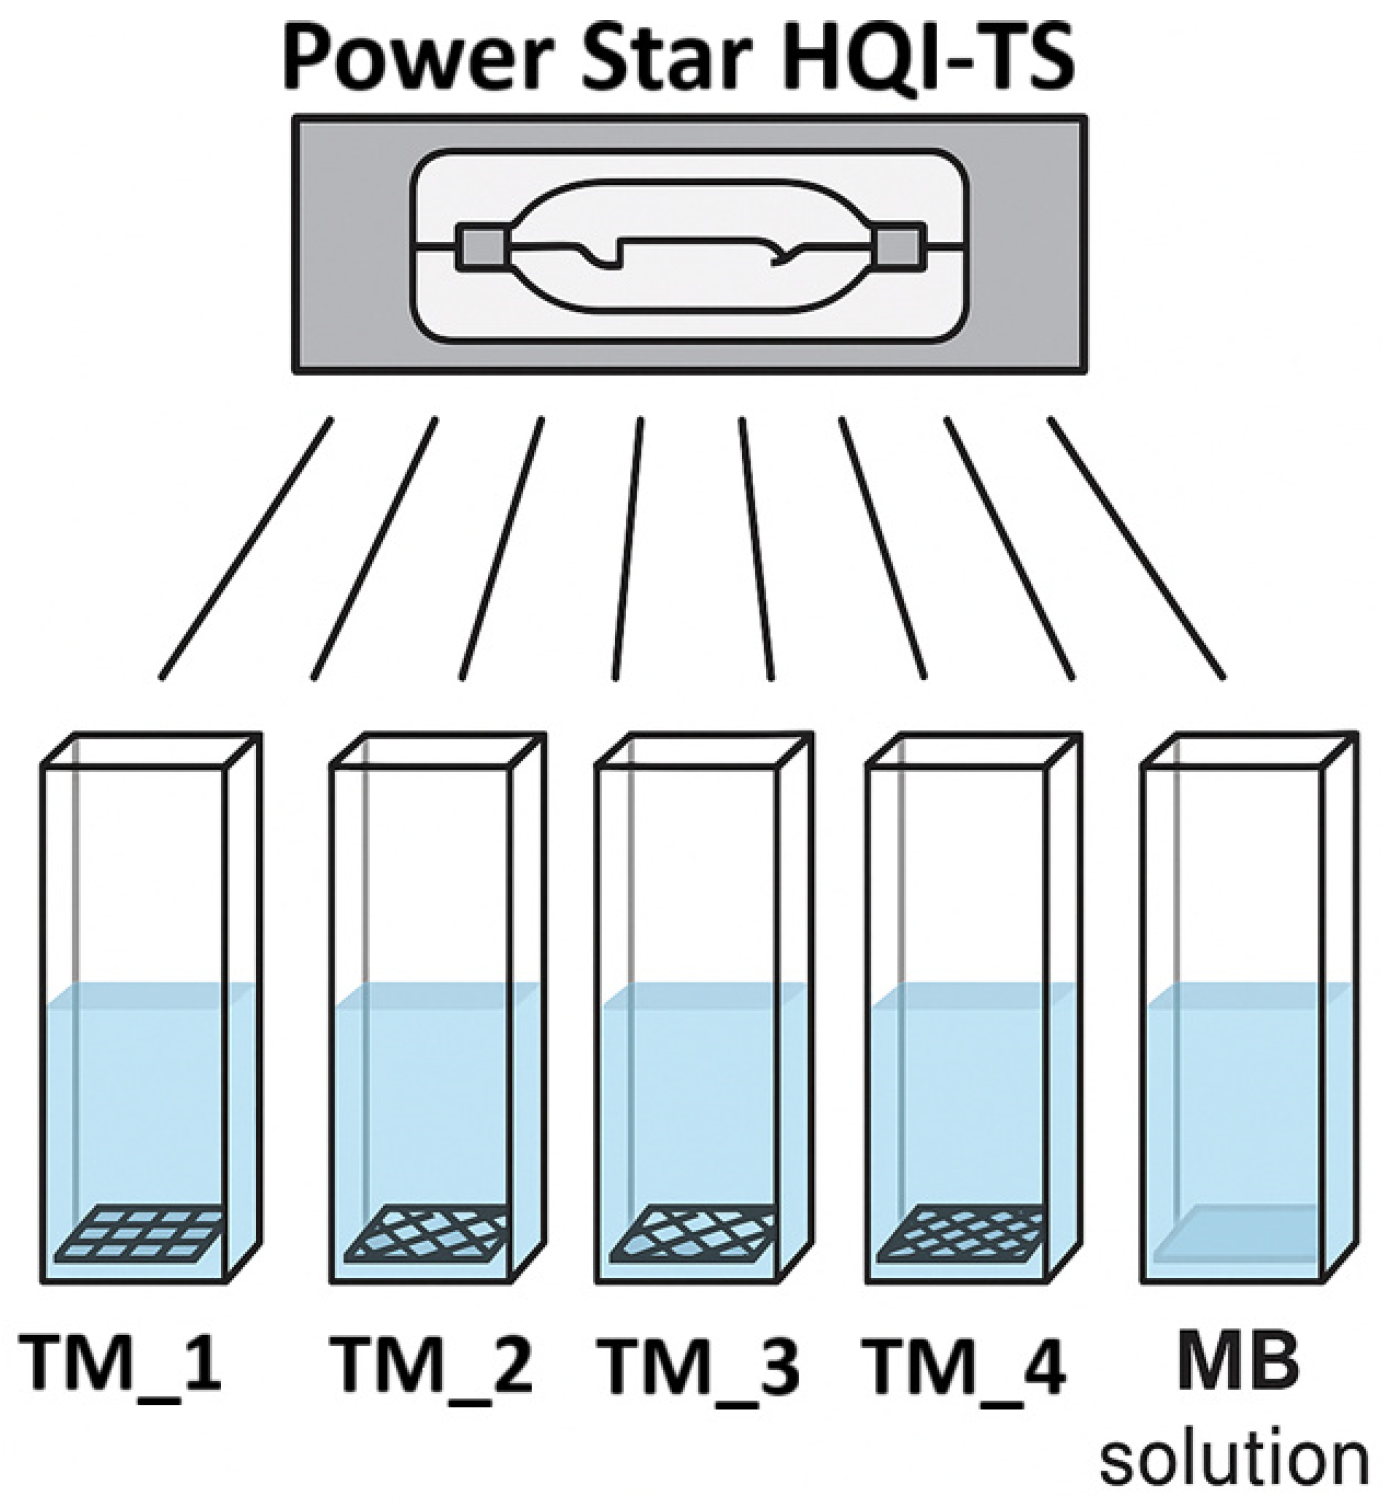
The photocatalytic activity of the titanium mesh samples (TM_1–TM_4) was examined in the reaction of methylene blue (MB) aqueous solution degradation. Each sample was placed in a quartz cuvette containing 3 mL of MB solution (1 × 10⁻⁵ mol·dm−3, pH 6), while a parallel control without a catalyst was used to assess direct photolysis. The reactions were illuminated using a 150 W PowerStar HQI-TS metal halide lamp (350–700 nm) positioned 30 cm from the samples (Figure 2), generating an irradiance of 6.44 mW·cm−2 as measured by a PeakTech 5025 digital lux meter. The concentration of MB over time was determined spectrophotometrically using a VWR UV-VIS 3100 PC spectrophotometer (Baltimore, MD, USA) by monitoring absorbance at the 664 nm wavelength at regular intervals. Quantitative analysis was performed using calibration curves prepared from five MB standard solutions with concentrations ranging from 1 × 10⁻⁵ to 1 × 10⁻⁶ mol·dm−3. This setup allowed for consistent and reproducible evaluation of the photocatalytic degradation efficiency of the prepared titanium meshes under identical irradiation conditions.

3. Results and Discussion

3.1. Morphological Analysis

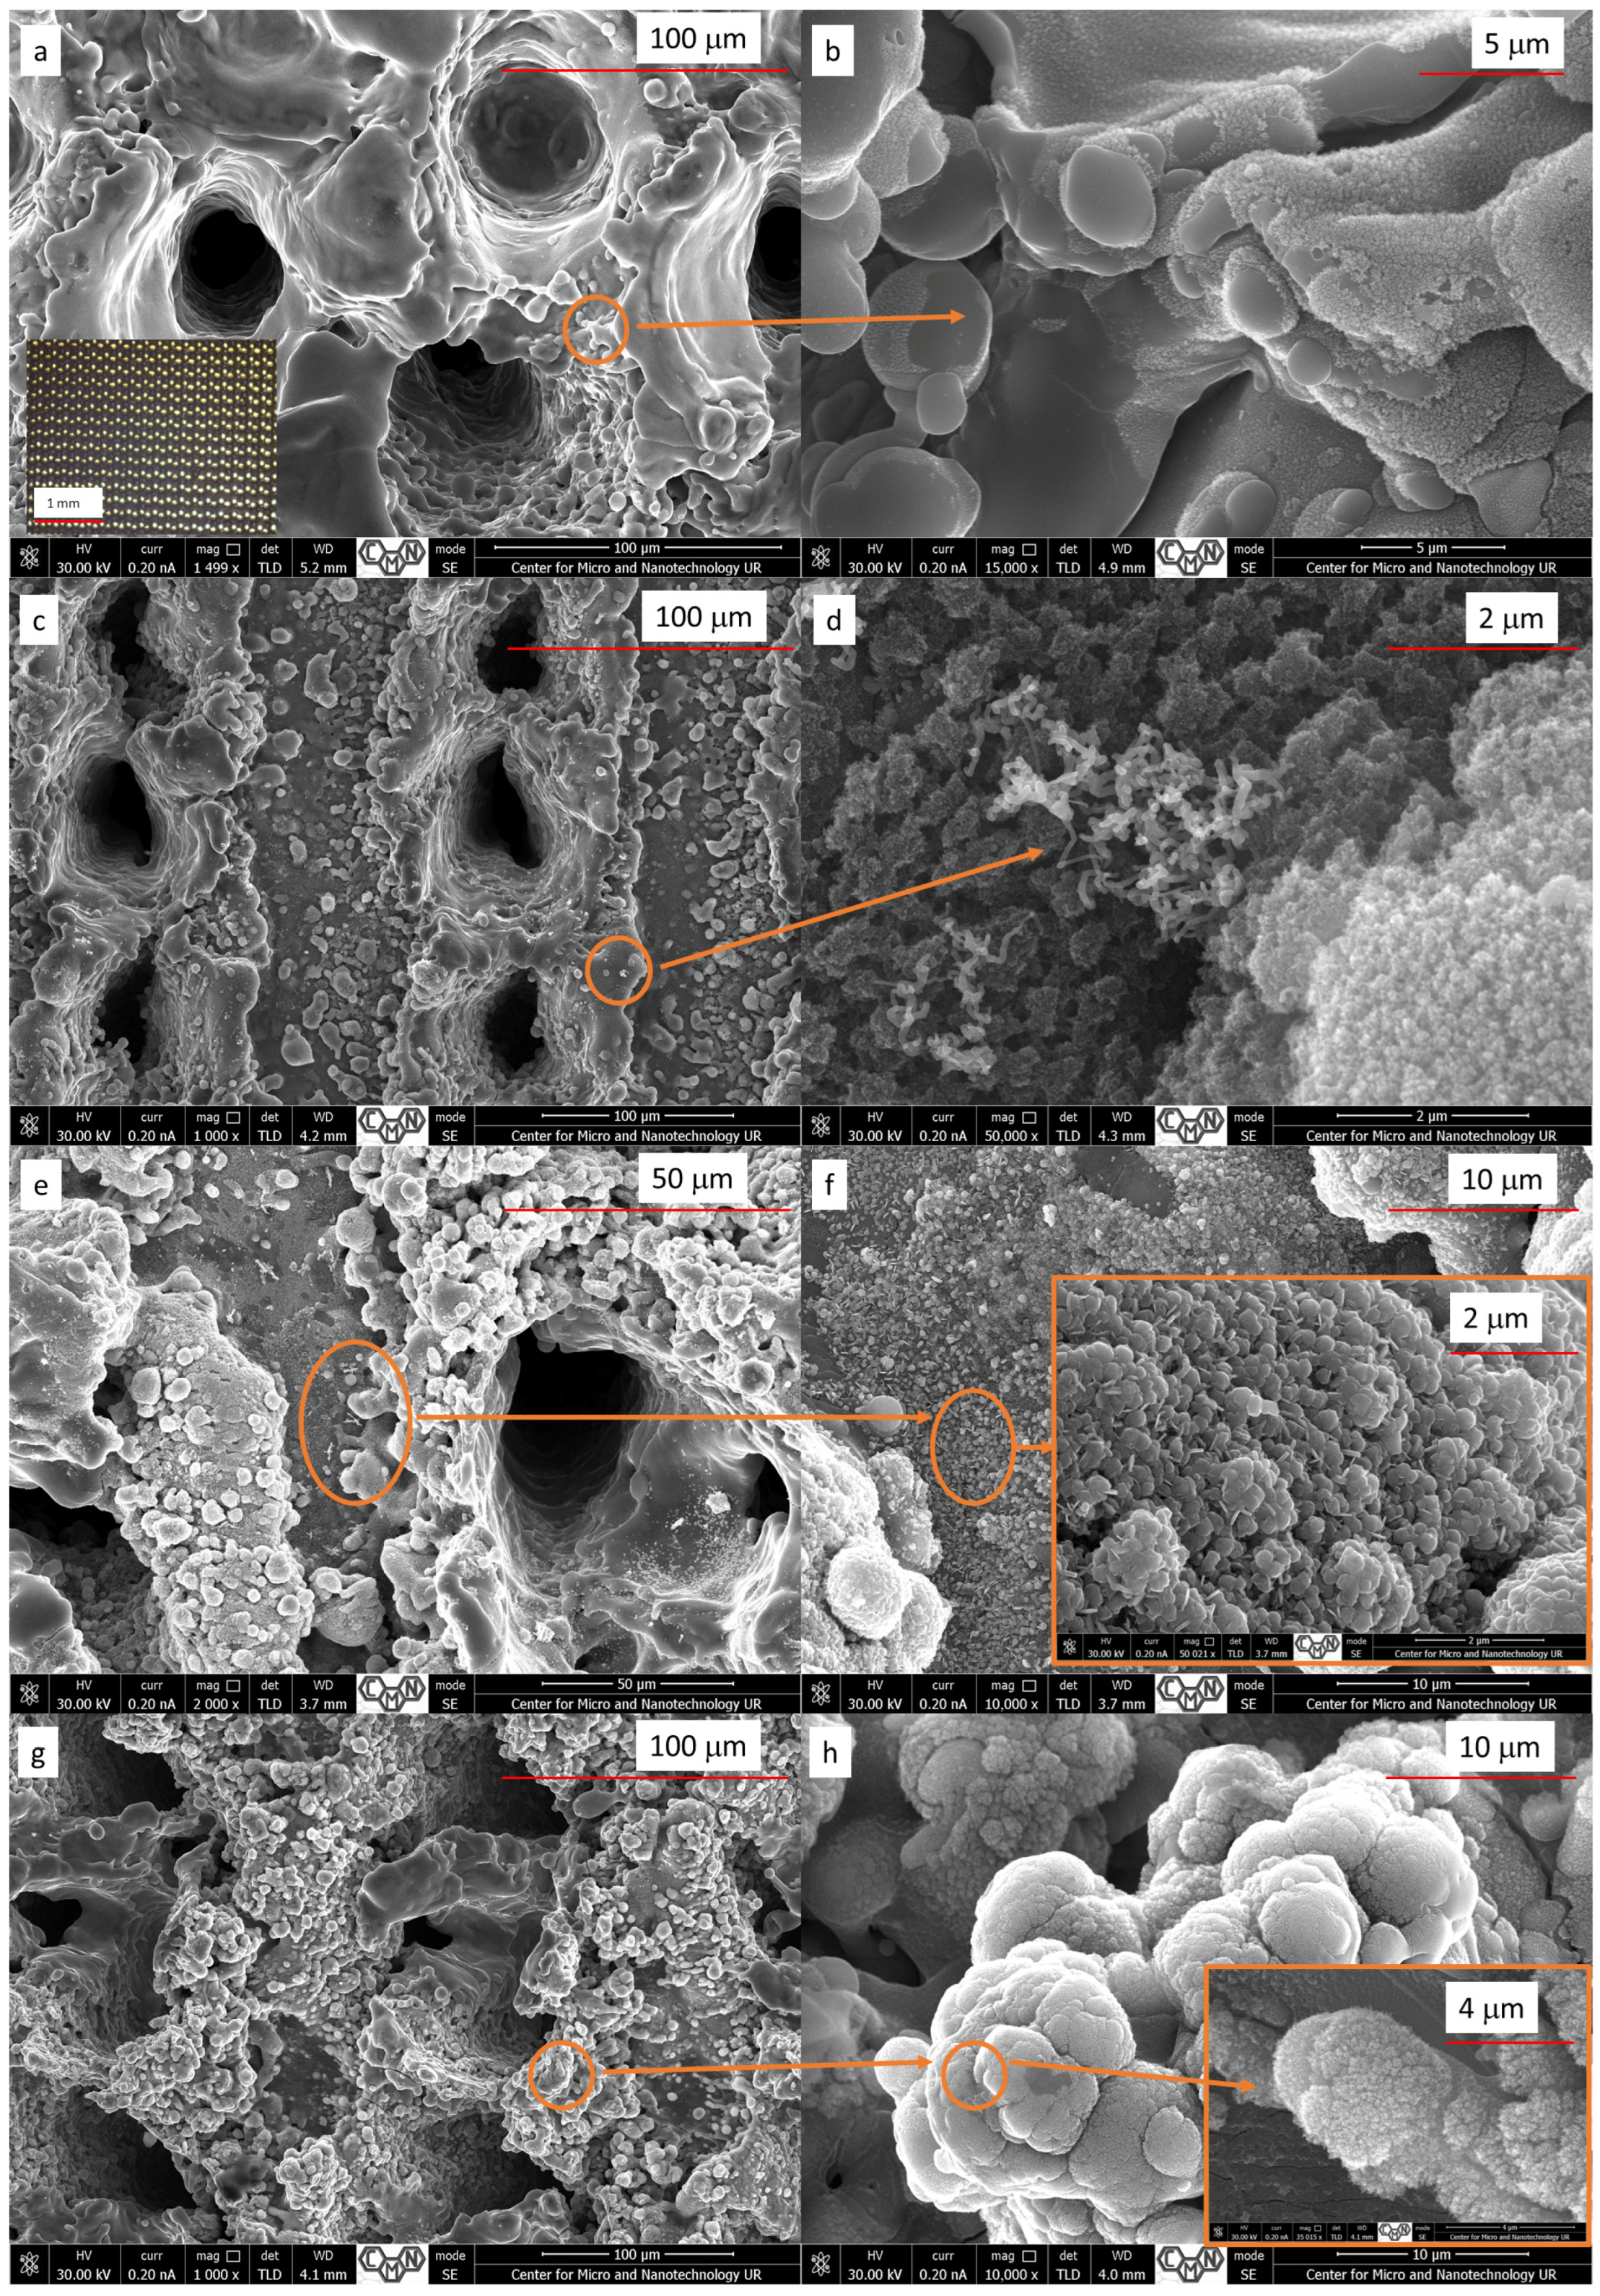
SEM images revealed holes of sizes 50 μm × 70 μm (TM_1, TM_2, TM_3) and 40 μm × 50 μm for TM_4 (Figure 3). The distance between the holes is 200 μm. The entrance hole in the specimens is surrounded by melted and resolidified metal, produced during the laser drilling process. Unmodified mesh (TM_1), as seen in Figure 3a,b, displayed a regular, interconnected porous architecture characteristic of laser-drilled titanium substrates, with the inset in (a) depicting the organized mesh pattern at 70× magnification (confocal laser microscope; the mesh is illuminated from below; yellow dots represent holes). The pristine surface revealed minimal titanium oxide deposition, which is a result of the laser process. Mesh subjected to blue-light-assisted chemical modification (TM_2) demonstrated, as shown in Figure 3c,d, a random coverage of silver nanoparticles across the mesh surface. Higher magnification views highlighted that these Ag nanoparticles present as noodle-like deposits. Ultrasonic-assisted reduction (TM_3), shown in Figure 3e,f, resulted in a notably different morphological outcome. The mesh surfaces reveal larger, densely packed silver granules. These results indicate that ultrasonic cavitation promoted rapid nucleation and aggregation of Ag nanoparticles, enhancing surface density and leading to uniform coverage of the TM_3 surface. The silver deposits on the TM_3 surface have the shape of platelets. The mesh treated with 50% hydrogen peroxide solution (TM_4), displayed in Figure 3g,h, underwent substantial topographical alteration. The surface is covered with cauliflower-like structures of titanium oxides, consistent with high oxidation rates under intensive peroxide exposure. These microstructures extended across the mesh, imparting marked roughness and increased surface area. Magnified insets in selected panels provide detailed views of nanoparticle morphology for each condition, allowing direct comparison of the effects of the modification protocols on particle size, distribution, and coverage. The images confirm the pronounced influence of both chemical and mechanical activation methods on the surface architecture of titanium. Each protocol imparts distinct nanoscale and microscale features.
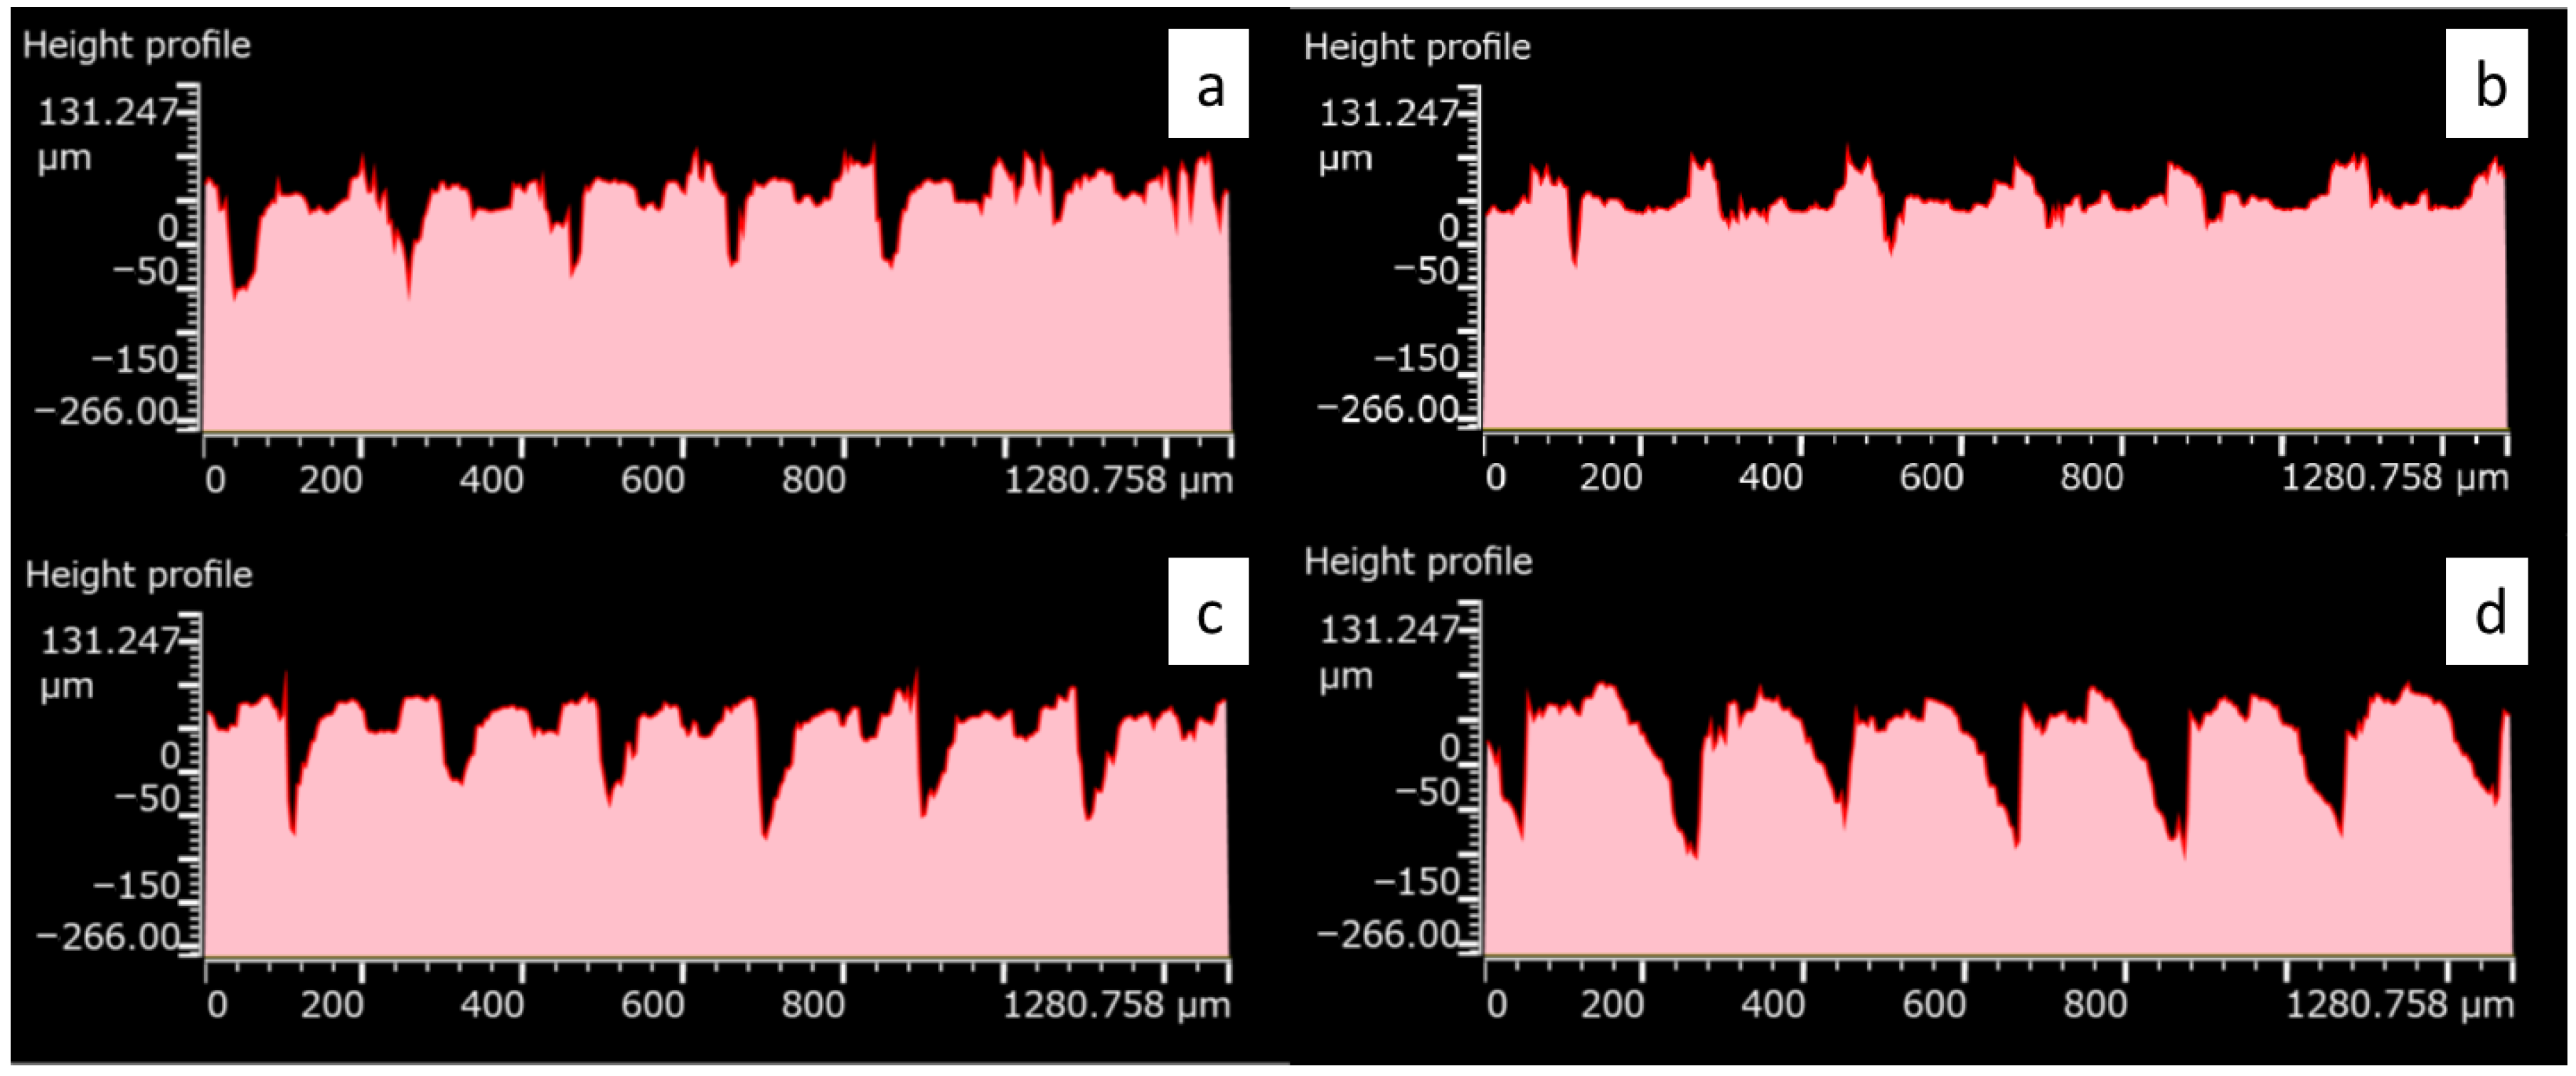
Laser processing of titanium foil generates irregularities on its surface, which causes roughness of the surface. Surface roughness is a numerical scale of the surface condition of the texture that is not dependent on visual or tactile sensation. Surface roughness plays a significant role in determining the characteristics of a surface. Several parameters can be used. In this work, three of them were selected to characterize the prepared surfaces. Height profiles of the specimens are presented in Figure 4.
Sa is one of the most widely used parameters and is the mean of the average height difference for the average plane. The height of all specimens is comparable.
Sdq represents the steepness of the surface. The surface is more steeply inclined as the value of the parameter Sdq becomes larger. This is calculated as the ratio of vertical change (rise) to horizontal change (run), multiplied by 100%. The specimens’ steepness changes in the following manner: TM_4 > TM_2 > TM_1 > TM_3. The TM_2 and TM_4 surfaces’ gradient changes more rapidly. It indicates that these surfaces have a higher roughness than the remaining ones.
Sdr signifies the rate of increase in the surface area. The increase rate is calculated from the surface area SA derived by the projected area A. Sdr values increase as the surface texture becomes finer and rougher. The surfaces TM_1 and TM_4 were characterized by greater roughness than the surfaces TM_2 and TM_3, as revealed in Figure 4 and Table 2.
For all specimens, the Sa parameter shows comparable values (~19–22 μm), indicating that the average height deviation from the mean plane remains similar across modification methods. This is consistent with the SEM images, which show that all meshes retain their basic three-dimensional porous architecture regardless of surface modification. The Sdq and Sdr parameters allow for clearer differentiation because they are more sensitive to micro- and nanoscale features introduced during modification. The TM_2 specimen SEM image reveals fine, noodle-shaped silver nanoparticles randomly distributed on the surface. The Sdq value is elevated (29.42), indicating increased local steepness probably resulting from nanoparticle coverage. At the same time, Sdr drops (204.13%), indicating that, although steep, the actual developed area does not increase as much, likely because Ag smooths valleys between holes. The step profile of sample TM_3 (Sdr = 203.18%) is consistent with the SEM observation of larger Ag aggregates. The Sdq value of 25.92 indicates that fewer gradients are present locally despite the visible Ag clusters. TM_4 (H2O2 treatment) exhibits the highest Sdq value (29.67) and Sdr value (311.62%), which correlates with the presence of cauliflower-like TiO2 microstructures visible in the SEM. These microstructures introduce distinct height changes and a significantly larger surface area, explaining both the steepness and surface enhancement. Untreated TM_1 exhibits an intermediate Sdq value and the highest Sdr value, similar to TM_4. The high Sdr value (311.20%) is due to internal microroughness resulting from laser processing. SEM confirms the natural texture and surface irregularity, containing a small amount of nanoparticles and oxide structures.

3.2. Surface Composition

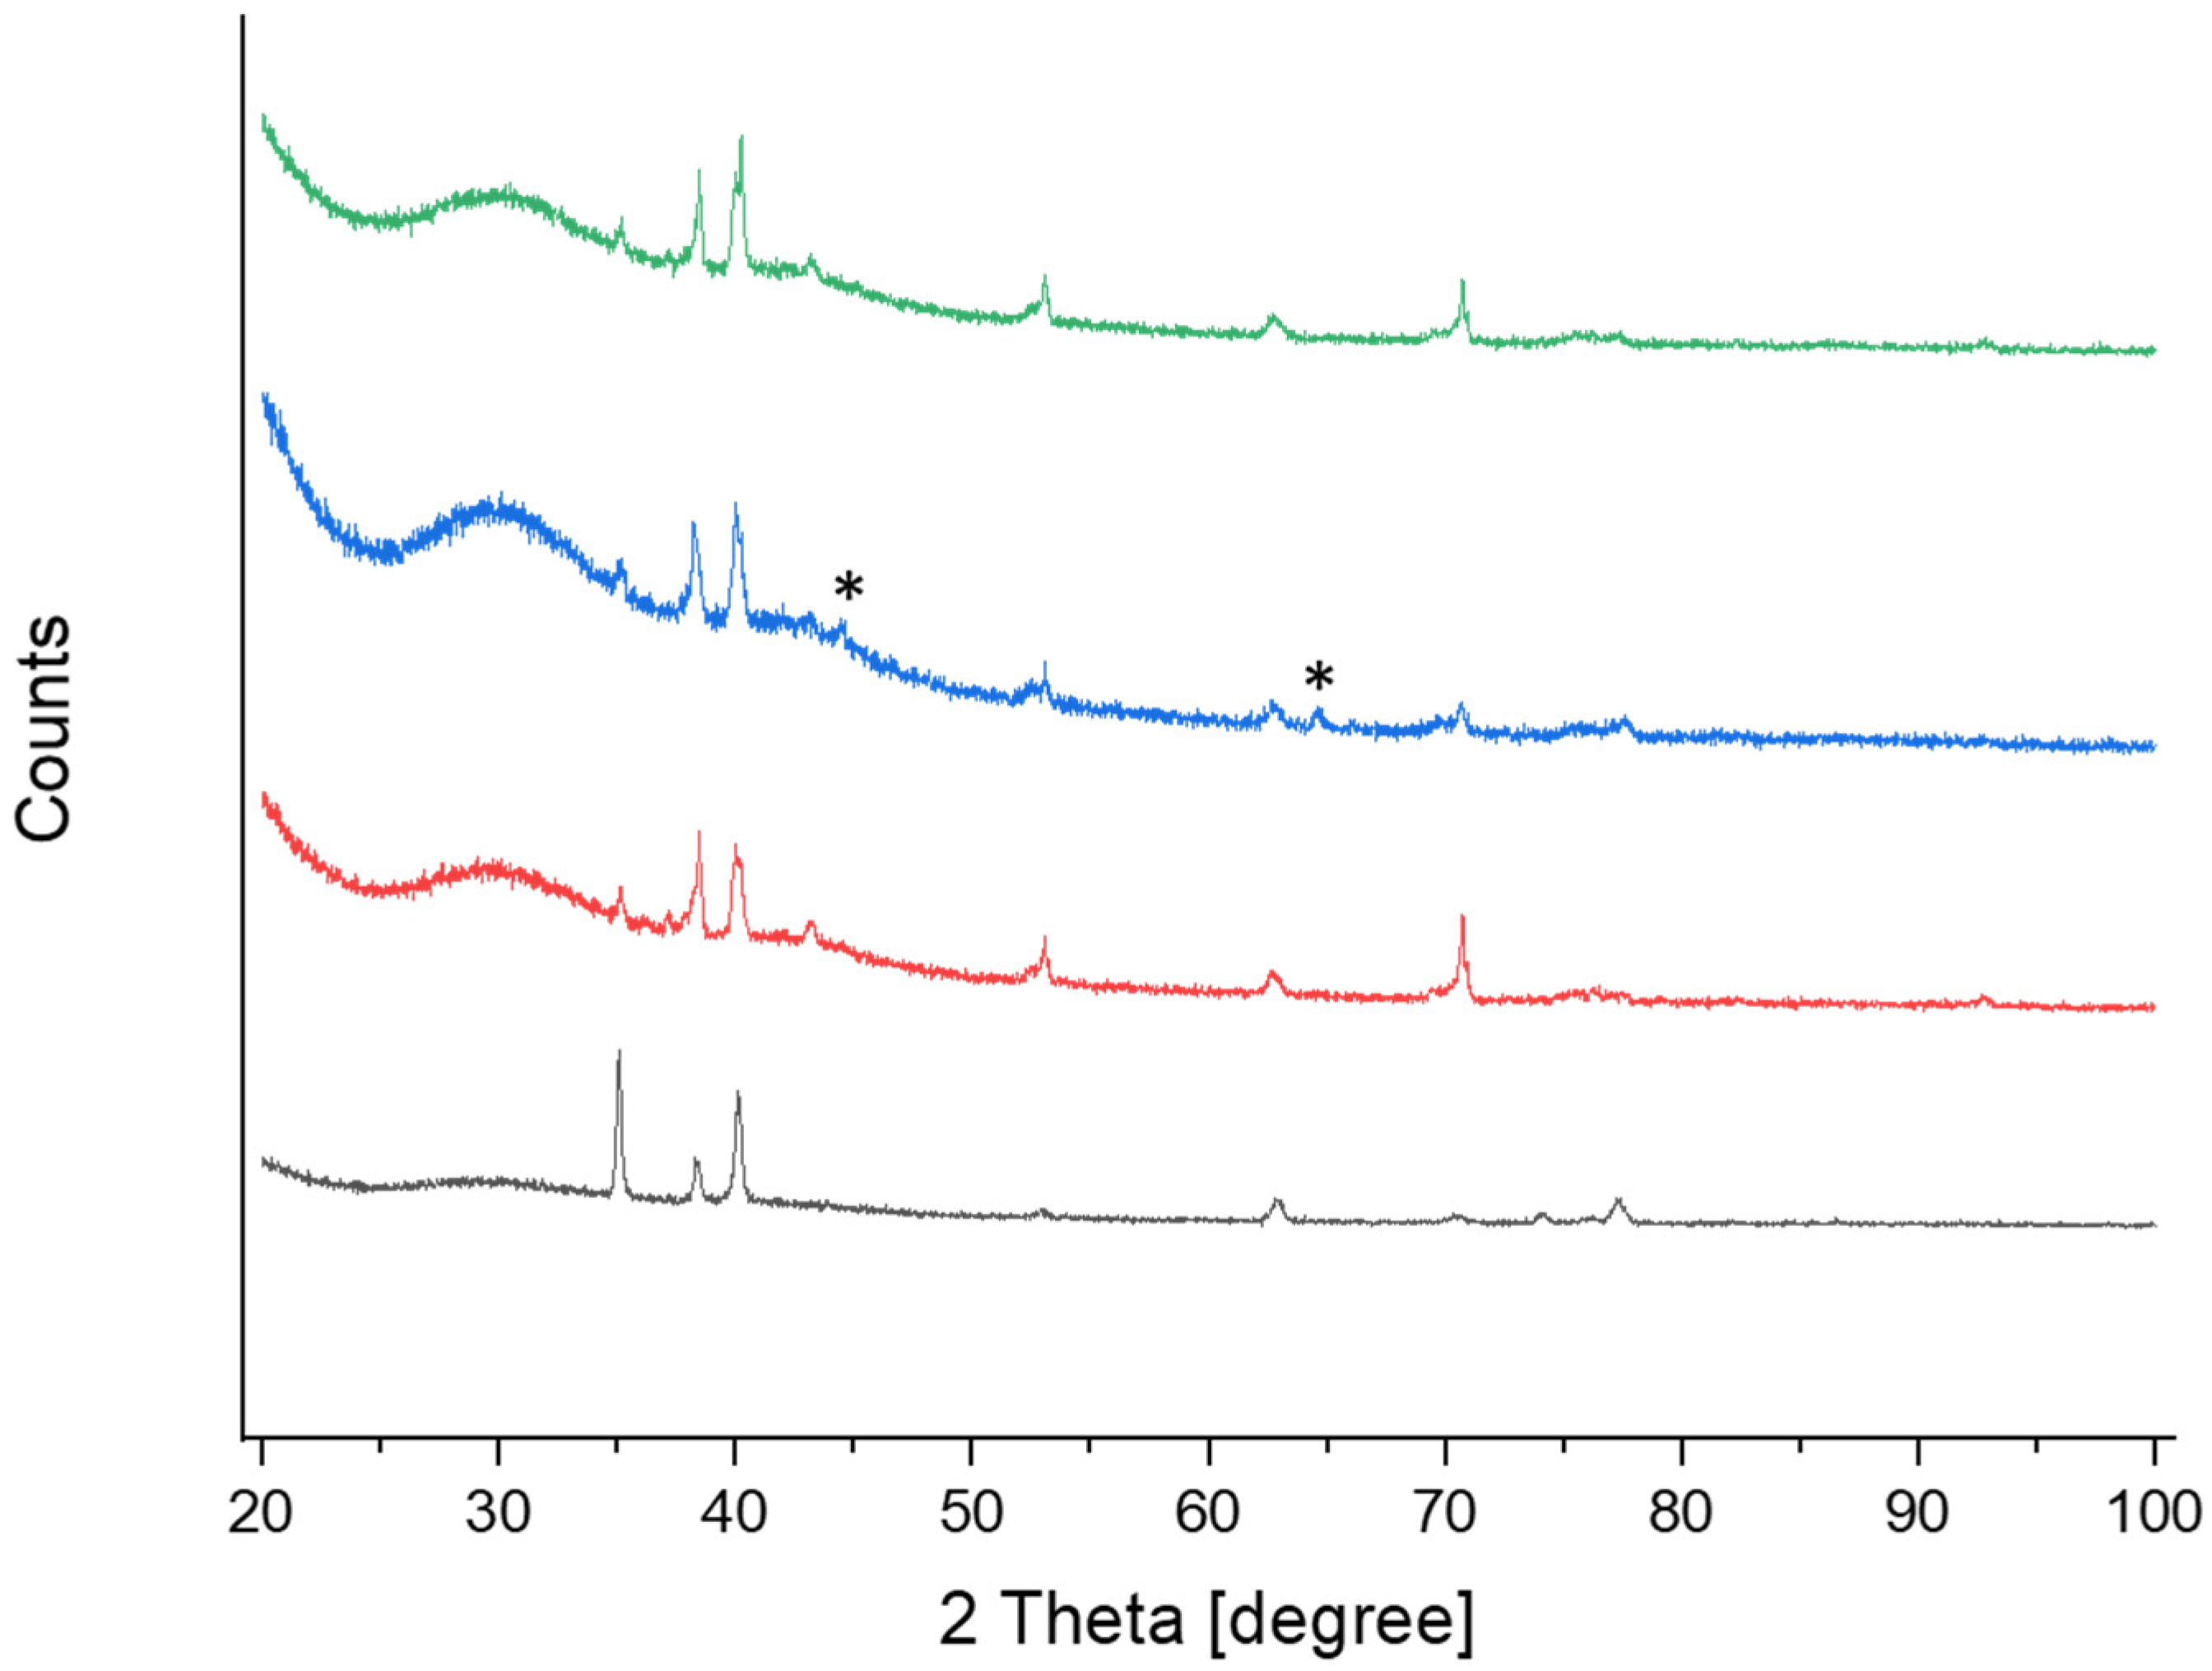
X-ray diffraction (XRD) is a widely used technique to determine the chemical and structural composition of oxides present on material surfaces. Figure 5 shows the XRD measurements of an untreated titanium sample (TM_1, grey line) as a reference and the measurements recorded for modified samples (TM_2 red line, TM_3 blue line, and TM_4 green line). The observed XRD reflexes can be assigned to Ti (reflexes at 35, 38, 40, and 52.5°2Θ) (JCPDS Card No. 44-1294), TiO2 (36, 43, 53, and 71°2Θ) (JCPDS No. 21-127), and Ag (44.5 and 64°2Θ) (JCPDS No. 04-0783). Reflections from other components were not observed. Reflex assignment was carried out with the ICDD PDF-2 database [11] and the crystallographic open database COD [12].
EDS measurements were employed to estimate the surface chemical composition of the titanium meshes (Figures S1–S4). The analysis revealed differences in the elemental concentrations among the samples (Table 3). Specifically, the Ti and O atomic percentages varied, with TM_1 and TM_4 showing oxidized surfaces and TM_4 having a higher oxygen content than TM_1. Samples TM_2 and TM_3 contained measurable amounts of silver (Ag), with TM_3 having a higher silver concentration than TM_2, while their titanium and oxygen contents correspondingly decreased.
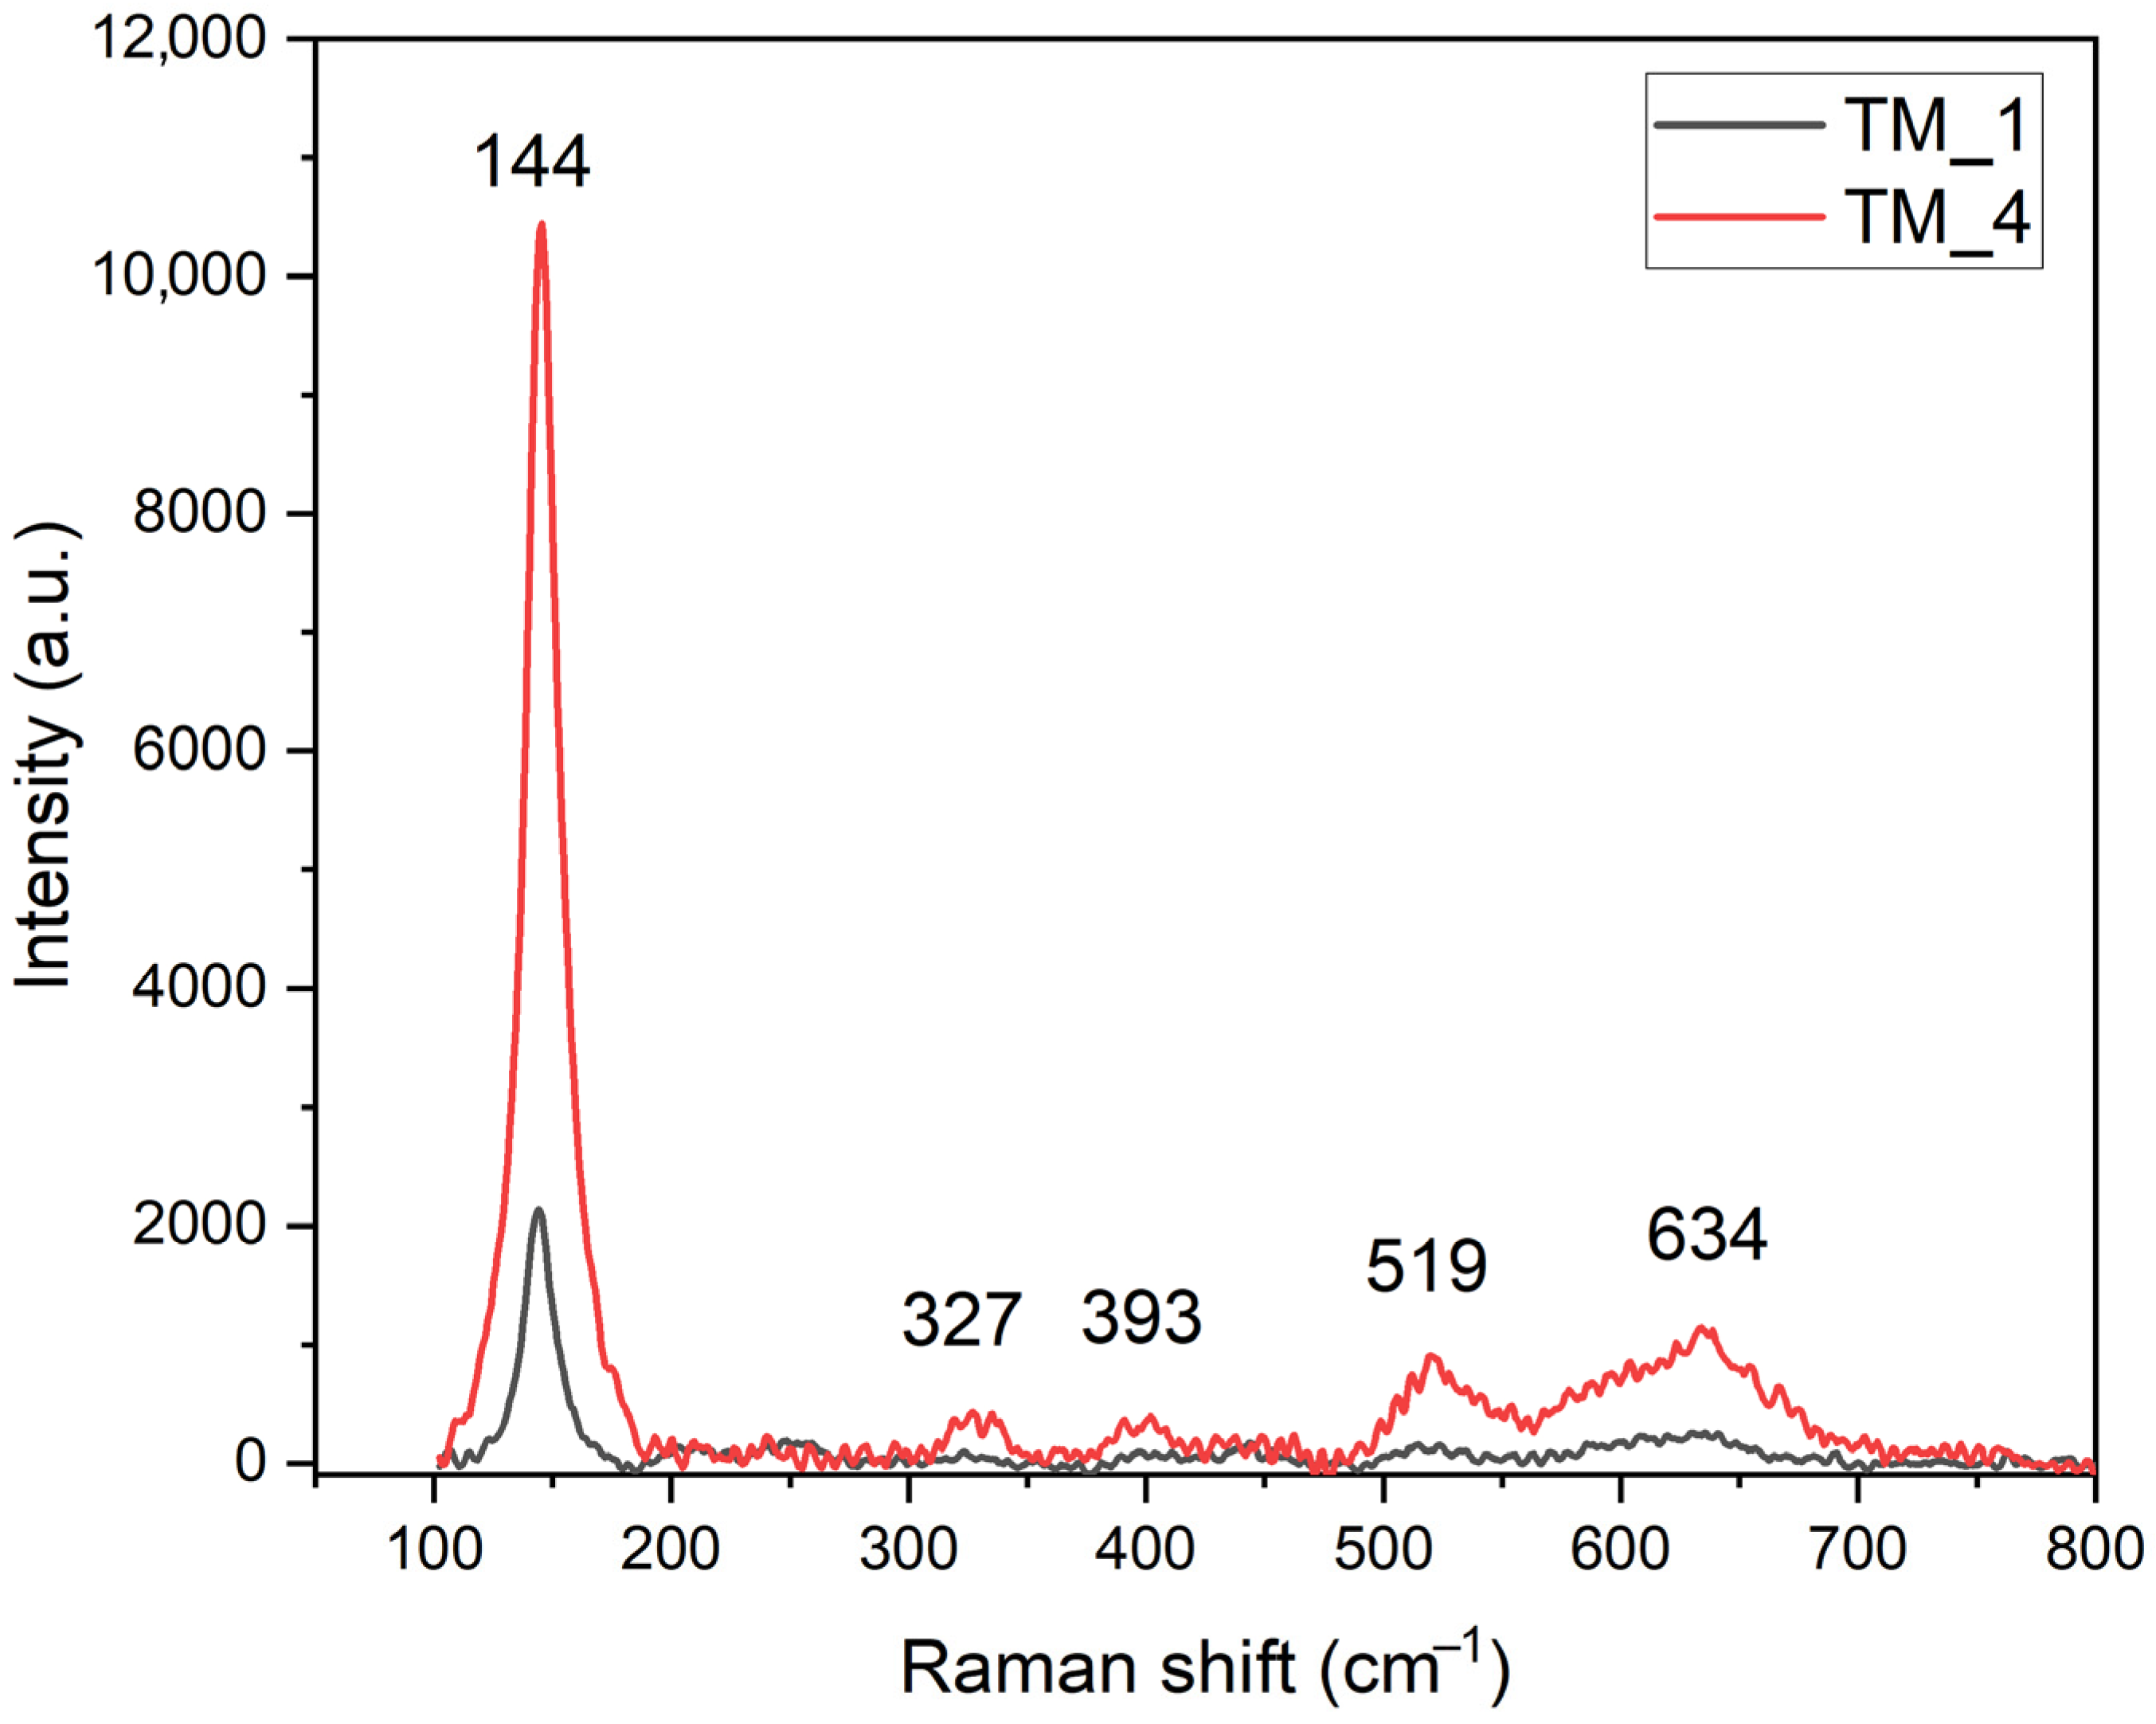
Standard Raman spectra were collected for samples TM_1 and TM_4 to determine the effectiveness of titanium oxide formation on their surface during material processing. The spectra are shown in Figure 6. Both samples showed bands attributed to Ti-O vibrations, confirming the presence of titanium oxide. It can be observed that the intensity of the bands is greater in sample TM_4, suggesting a positive effect of H2O2 treatment on the formation of oxides. The positions of Raman bands and their identification are presented in detail in Table 4. The signals are related mainly to the presence of titanium oxide in the form of anatase. Additionally, in some places of TM_1, weak bands corresponding to rutile vibrational modes were also detected. The observed slight differences in the band position presented in Table 3 indicate some variations in the structural and microstructural characteristics of the titanium oxides in the analyzed samples. Minor shifts in Raman band position between samples TM_1 and TM_4 suggest possible differences in the local lattice distortions, variations in crystallite size, or residual stress. The absence or weakening of rutile-related bands in the TM_4 spectrum further suggests differences in phase composition. Analysis of the maps (Figures S7 and S8) revealed slight variations in the amount of formed oxides in different local areas of the sample. Higher and lower concentrations of titanium oxide were observed in different areas. The oxide films formed on different parts of the sample surface exhibit slight spatial variations in the phase composition and structural order. This is most likely due to the proximity of the laser beam to the material.
Materials featuring noble metal nanostructured surfaces or nanoparticles can significantly enhance Raman scattering, leading to the surface-enhanced Raman scattering (SERS) effect which enables the detection of extremely small quantities, even down to single molecules [16].
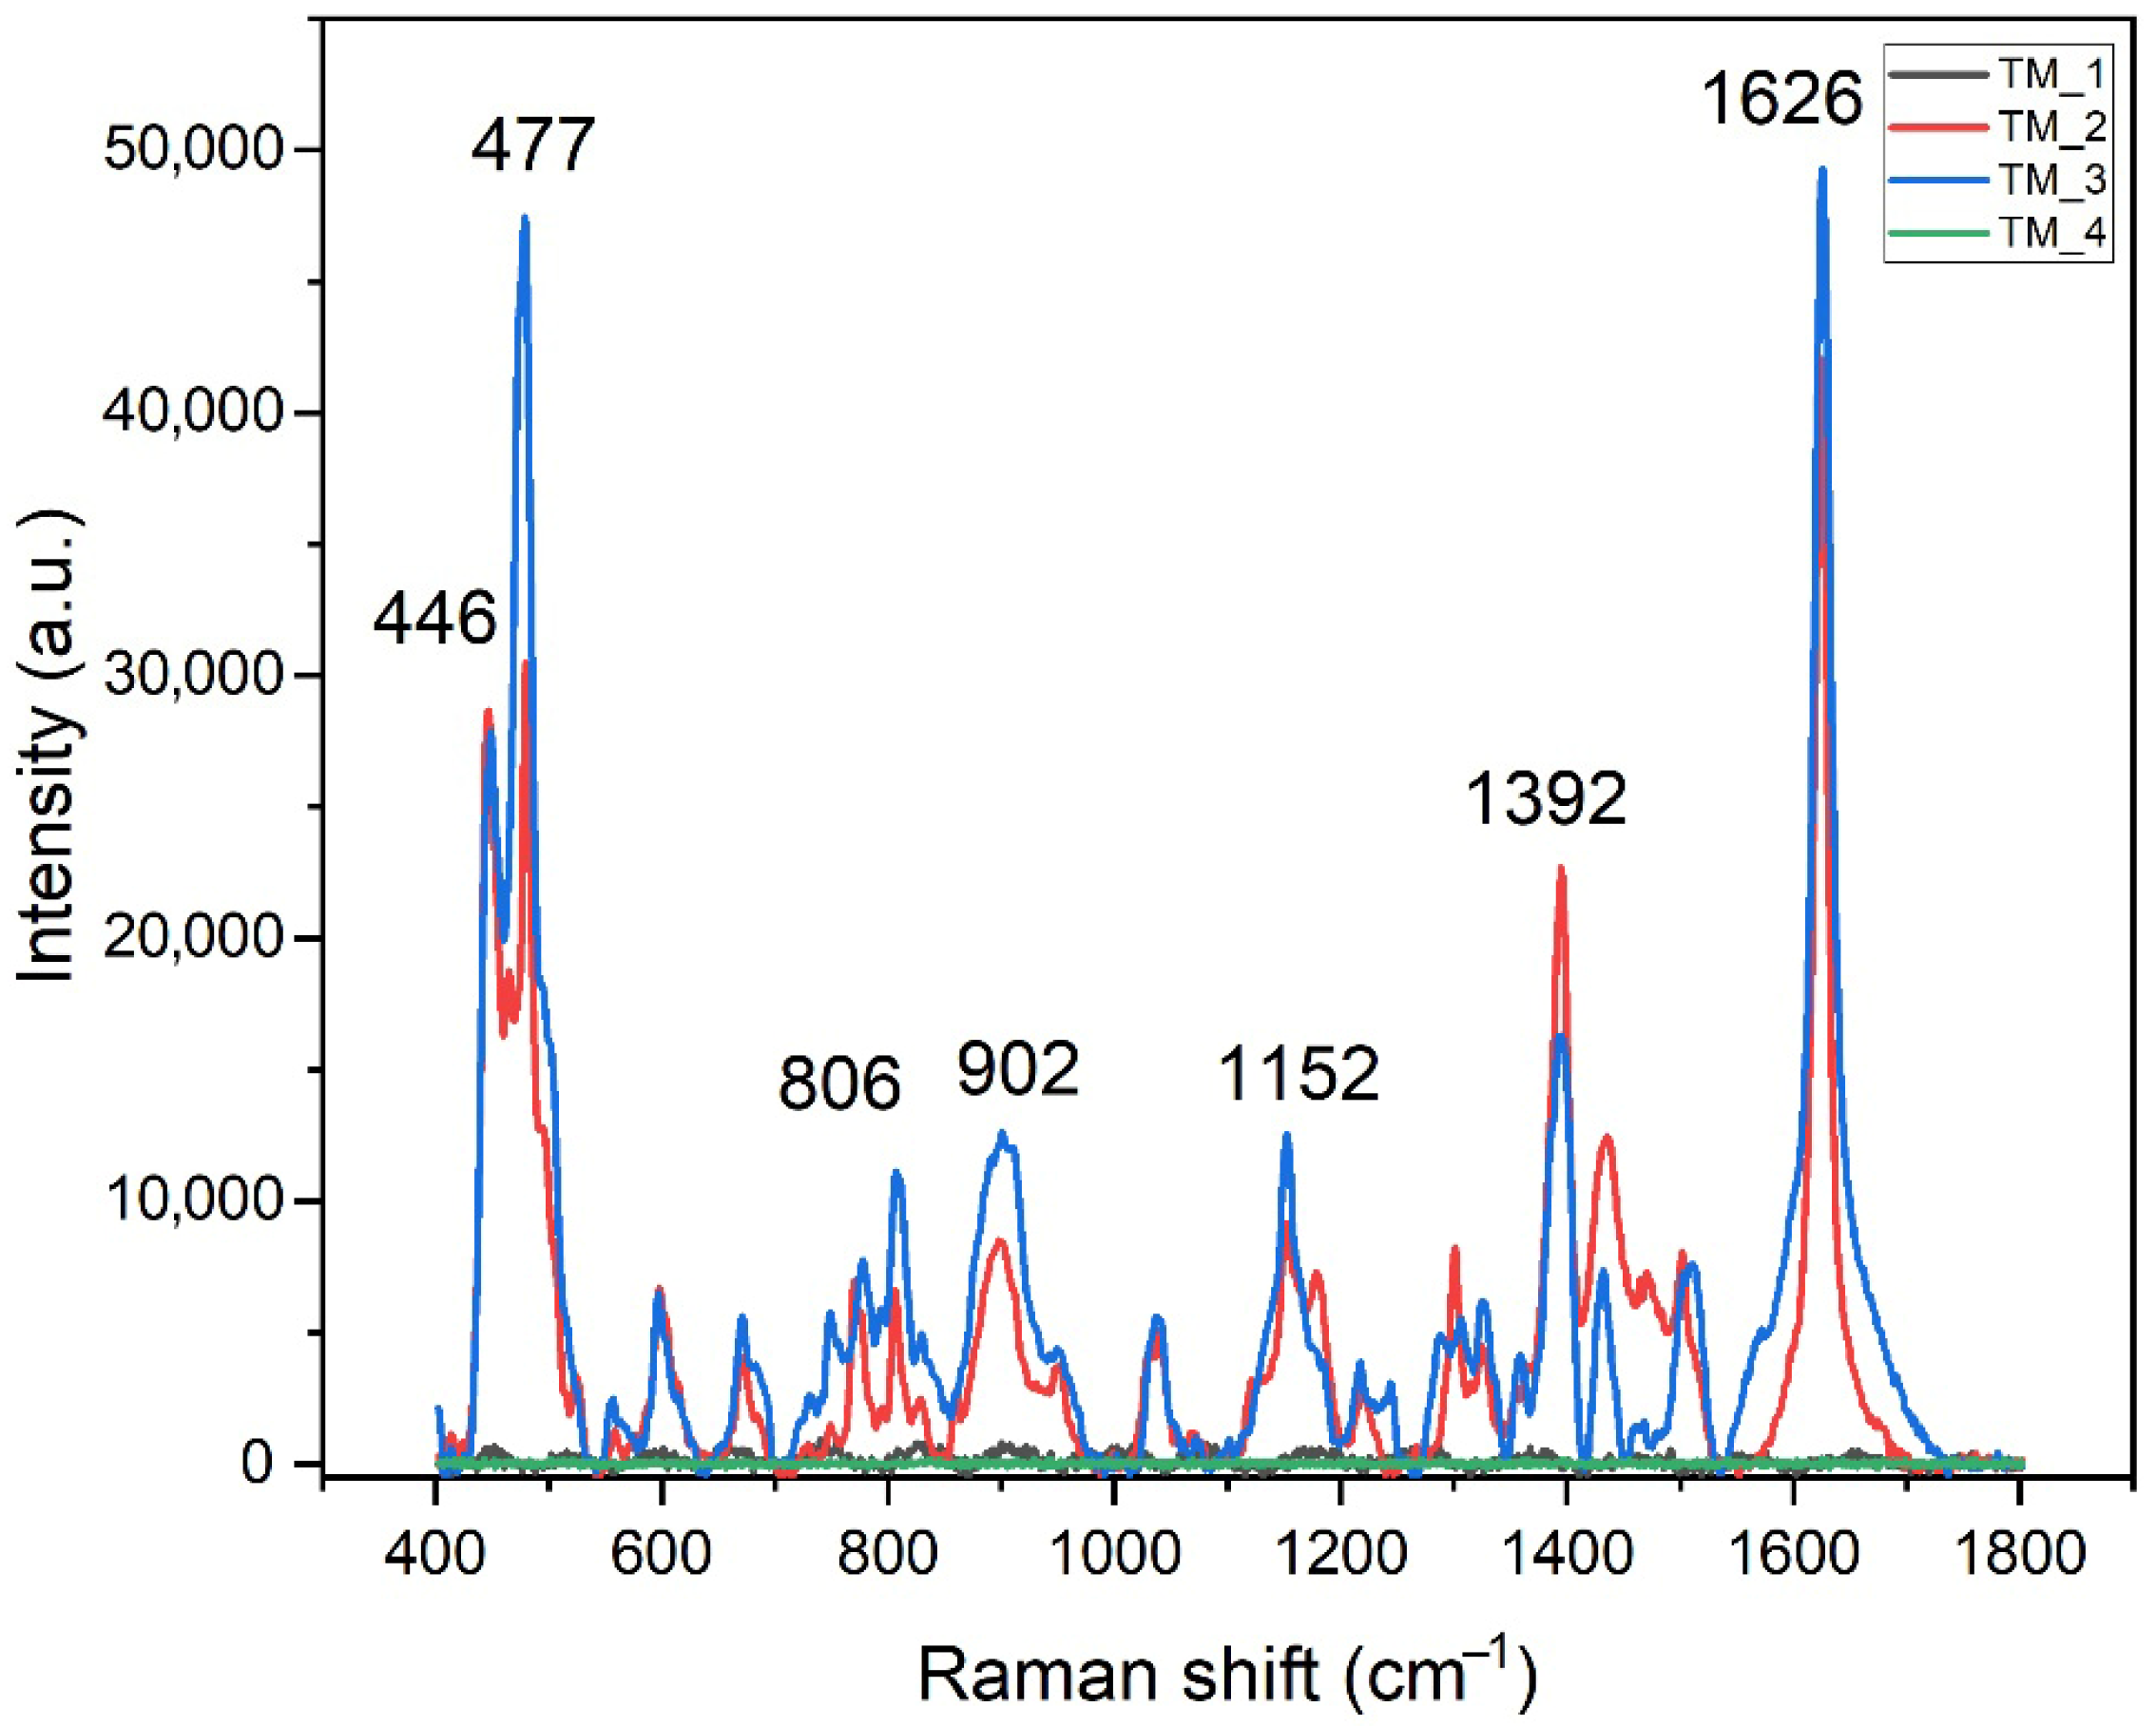
The commonly used marker methylene blue with concentration of 1 × 10⁻⁶ M was used to determine the possibility of inducing the SERS effect on the tested materials. Spectra containing lines characteristic of methylene blue were recorded for samples TM_2 and TM_3 (Figure 7). No bands typical of methylene blue were detected for samples TM_1 and TM_4. This result indicates that samples TM_2 and TM_3 have potential as SERS-enhancing substrates. Samples TM_1 and TM_4 do not have this ability, and the concentration of the MB used was too low to observe the signal.
Samples TM_2 and TM_3 were exposed to selected factors (blue light and sonification, respectively) in order to produce silver nanostructures on their surface. It can be assumed that the obtained signal amplification is related to the presence of these nanostructures. The intensity of the recorded signal for the marker band 1626 cm−1 is very high and ranges from approximately 20,000 a.u. to 70,000 a.u. Differences in the recorded signal intensity may result from surface heterogeneity and the appearance of SERS hot spots with exceptionally high Raman scattering amplification potential. SERS hot spots may be located, for example, between two closely spaced noble structures or in the case of sharp-ended nanostructures [17].
The SERS spectra of dried methylene blue droplets adsorbed on the different SERS substrates are shown in Figure 6. The concentration of the methylene blue solution used was 1 × 10⁻⁶ M. The bands recorded in the spectra are typical for MB. The most intense band at 1626 cm−1 is attributed to C–C ring vibrations. The other intense line at 446 cm−1 is associated with C–N–C skeletal bending vibration. The MB bands are described in detail in Table 4.
Some of the bands in the SERS spectra of MB on TM_2 have a slight shift in position relative to the MB on TM_3, as well as the intensity of some lines being slightly changed (Table 5). This is due to the specific nature of the SERS effect, in which certain interactions between molecules and the amplifying substrate may occur. Additionally, for larger molecules, changes in their conformation or spatial arrangement relative to the substrate or areas of strong hot spot amplification may also affect the presence of slight changes in the SERS spectra in relation to the Raman spectra of the same substances. In the case of the samples tested, the changes concern bands of low intensity. The position of the strongest and most significant bands remains unchanged.

3.3. Photocatalytic Activity

The photocatalytic activity of the titanium mesh surface was assessed by degrading methylene blue (MB) in aqueous solution under slightly acidic conditions (pH 6) and in the presence of air. Degradation kinetics were monitored by tracking the decrease in MB concentration over time. Figure 8a illustrates the MB decay profiles during the photocatalytic reactions.
The photodegradation rate constant (kapp) for each reaction system was calculated assuming the reaction followed first-order kinetics, as described by the Equation (1) [20] (Figure 8b):
l n C t C 0 = k a p p t
where kapp is the apparent rate constant; C0 and Ct are the initial concentration and concentration at time t.
The degradation rate constants are summarized in Table 6. Sample TM_4 exhibited the best catalytic degradation (kapp = 0.0097 min−1). Slightly lower degradation rate was observed for TM_2 (kapp = 0.0066 min−1). The degradation rate of MB on TM_1 and TM_3 surfaces were 0.0042 and 0.0054 min−1, respectively. The better photocatalytic activity of TM_2 and TM_4 is caused by the presence of an oxide layer on the surface, and low concentration of Ag on the TM_2 surface. The presence of Ag nanoparticles enhances the light absorption. At the same time, sample TM_3 exhibits lower photocatalytic activity, which may be attributed to the higher silver content on the surface and lower titanium oxide content.
The surfaces TM_1 and TM_4 exhibited greater roughness than the surfaces TM_2 and TM_3 (see Sdr parameter Table 1). The roughness decrease in specimens TM_2 and TM_3 may be due to surface covering by Ag particles. The kapp values of MB degradation on surfaces indicate that roughness did not influence the photocatalytic efficiency. Only the chemical composition of the surface influences the MB degradation rate.
Treatment with hydrogen peroxide (TM_4) notably increased the surface oxygen content, as confirmed by EDS analysis, which correlates directly with the highest degradation rate of methylene blue (MB) among the samples. The enriched oxygen species likely facilitate the formation of reactive oxygen species (ROS) under irradiation, thereby accelerating photocatalytic degradation pathways.
Silver nanoparticle modifications introduced via irradiation (TM_2) and sonication (TM_3) further influenced photocatalytic efficiency by enhancing light absorption and providing additional active sites. However, this enhancement is nuanced; TM_2, with a moderate silver content and appreciable oxide layer, demonstrated a higher degradation rate than TM_3, which contained a higher silver loading but lower oxygen content. Excessive silver nanoparticles can hinder charge carrier separation or induce aggregation effects that reduce active surface area, potentially lowering photocatalytic performance.
The photocatalytic performance of the studied titanium meshes results from a synergistic combination of precise microstructuring and tailored surface chemical modifications. Laser micro drilling introduces uniform microscale porosity and increases surface roughness, which improves light scattering and provides increased active sites for photocatalytic reactions [21]. The use of hydrogen peroxide treatment to oxidize the surface elevates the oxygen content, facilitating the formation of reactive oxygen species, such as hydroxyl radicals, which significantly enhance the degradation of organic pollutants like methylene blue [22]. This oxygen-enriched oxide layer also improves charge carrier separation efficiency, reducing recombination losses during photocatalysis [23].
The incorporation of silver nanoparticles via irradiation or sonication treatments plays a multifaceted role. Silver nanoparticles exhibit localized surface plasmon resonance (LSPR), which extends the light absorption capability of the titanium oxide system into the visible spectrum and promotes the generation of hot electrons that participate in photocatalytic processes [17,24,25]. However, optimal silver loading is critical; excessive silver can act as a recombination center or block active sites, as reflected by the lower photocatalytic activity of the sample with higher silver content (TM_3) compared to moderate loading (TM_2).
The photocatalysis occurs through a synergistic pathway of (Figure 9): (i) photon-induced charge generation in TiO2 (TM_1 and TM_4); (ii) plasmonic electron transfer mediated by Ag nanoparticles (TM_2 and TM_3). Upon irradiation, photons promote electrons from the valence band (VB) to the conduction band (CB) of TiO2. This process may be limited by the TiO2 band gap value (limited absorption of visible range light). The absorption of a photon generates electron–hole pairs that drive redox reactions on the catalyst surface. Ag nanoparticles act as electron traps, capturing CB electrons and preventing rapid electron–hole recombination (Figure 9a), thereby increasing the lifetime of photogenerated charges. Furthermore, under blue or visible light, Ag nanoparticles exhibit localized surface plasmon resonance (LSPR), generating “hot electrons” that transfer into the TiO2 conduction band, extending the light absorption into the visible spectrum. The generated holes in the valence band can oxidize surface hydroxyl groups or water molecules, forming highly reactive hydroxyl radicals, and photoexcited electrons react with dissolved oxygen to form superoxide radicals and hydroperoxyl radicals. The reactive oxygen species (ROS) −•OH, −•O2, and HO2 attack methylene blue (MB) molecules adsorbed on the Ti-mesh surface, leading to their degradation.
Notably, surface roughness metrics (Sa, Sdq, and Sdr) have minimal direct impact on photocatalytic rates in this system, highlighting that chemical composition and electronic effects from the oxide layer and metal nanoparticle presence are dominant. Laser processing combined with tailored chemical modification thus enables tunable and scalable fabrication of titanium meshes with enhanced photocatalytic efficacy, suitable for effective environmental remediation applications.

4. Conclusions

Nanosecond laser processing effectively produced titanium meshes with controlled microstructures suitable for photocatalytic applications. Chemical modification by hydrogen peroxide oxidation significantly enhanced surface oxygen content, yielding the highest photocatalytic degradation of methylene blue. Silver nanoparticle modification improved light absorption and enabled surface-enhanced Raman scattering (SERS), with moderate silver content being favorable for photocatalytic activity.
While laser processing introduced necessary microstructures and roughness to create a robust and high-surface-area platform, surface roughness itself was found not to be the dominant factor influencing photocatalytic degradation rates; instead, the tailored chemical composition and oxide layer formation were the key determinants. The fabricated meshes exhibited well-defined microholes with specific surface morphologies depending on modification, offering tunable properties for various environmental and sensing applications.
The combination of precise laser fabrication and targeted chemical modification offers a scalable approach to advanced titanium meshes for water purification and molecular sensing.

Supplementary Materials

The following supporting information can be downloaded at https://www.mdpi.com/article/10.3390/app152111579/s1, Figure S1: EDS spectrum of TM_1 measured in different places on the surface; Figure S2: EDS analysis of TM_4; Figure S3: EDS spectrum of TM_2 measured in different places on the surface; Figure S4: EDS spectrum of TM_3 measured in different places on the surface; Figure S5: Elemental distribution mapping in TM_1—Ti (a), O (b), and TM_4 - Ti (c), O (d); Figure S6: Elemental distribution mapping in TM_2—Ti (a), O (b), Ag (c), and TM_3—Ti (c), O (d), Ag (e); Figure S7: Raman spectra of TM_1 sample recorded at different locations on the sample surface, accompanied by optical microscope images showing the corresponding measurement points.; Figure S8: Raman spectra of TM_4 sample recorded at different locations on the sample surface, accompanied by optical microscope images showing the corresponding measurement points.

Author Contributions

Conceptualization, J.K.; methodology, A.L.; formal analysis, S.M. and Y.B.; investigation, P.K., A.L., S.M., R.W.-N., and B.C.; resources, Y.B.; writing—original draft preparation, P.K., R.W.-N., A.L., and J.K.; writing—review and editing, J.K. and A.L.; supervision, J.K. All authors have read and agreed to the published version of the manuscript.

Funding

This research received no external funding.

Institutional Review Board Statement

Not applicable.

Informed Consent Statement

Not applicable.

Data Availability Statement

The original contributions presented in this study are included in the article. Further inquiries can be directed to the corresponding author.

Conflicts of Interest

The authors declare no conflicts of interest.

Abbreviations

The following abbreviations are used in this manuscript:
SERSSurface-enhanced Raman scattering
FESEMField emission scanning electron microscope
EDSEnergy-dispersive X-ray spectroscopy
XRDX-ray diffractometer
EDTAEthylenediaminetetraacetic acid
MBMethylene blue

References

  1. Amparo-Salcedo, M.; Pérez-Gimeno, A.; Navarro-Pedreño, J. Water Security Under Climate Change: Challenges and Solutions Across 43 Countries. Water 2025, 17, 633. [Google Scholar] [CrossRef]
  2. Chan, E.Y.Y.; Tong, K.H.Y.; Dubois, C.; Mc Donnell, K.; Kim, J.H.; Hung, K.K.C.; Kwok, K.O. Narrative Review of Primary Preventive Interventions against Water-Borne Diseases: Scientific Evidence of Health-EDRM in Contexts with Inadequate Safe Drinking Water. Int. J. Environ. Res. Public Health 2021, 18, 12268. [Google Scholar] [CrossRef]
  3. Ejiohuo, O.; Onyeaka, H.; Akinsemolu, A.; Nwabor, O.F.; Siyanbola, K.F.; Tamasiga, P.; Al-Sharify, Z.T. Ensuring water purity: Mitigating environmental risks and safeguarding human health. Water Biol. Secur. 2025, 4, 100341. [Google Scholar] [CrossRef]
  4. Han, X.X.; Rodriguez, R.S.; Haynes, C.L.; Ozaki, Y.; Zhao, B. Surface-enhanced Raman spectroscopy. Nat. Rev. Methods Primers 2021, 1, 87. [Google Scholar] [CrossRef]
  5. Langer, J.; de Aberasturi, D.J.; Aizpurua, J.; Alvarez-Puebla, R.A.; Auguié, B.; Baumberg, J.J.; Bazan, G.C.; Bell, S.E.J.; Boisen, A.; Brolo, A.G.; et al. Present and Future of Surface-Enhanced Raman Scattering. ACS Nano 2020, 14, 28–117. [Google Scholar] [CrossRef]
  6. Roguska, A.; Kudelski, A.; Pisarek, M.; Opara, M.; Janik-Czachor, M. Surface-enhanced Raman scattering (SERS) activity of Ag, Au and Cu nanoclasters on TiO2-nanotubes/Ti substrate. Appl. Surf. Sci. 2011, 257, 8182–8189. [Google Scholar] [CrossRef]
  7. Song, J.-M.; Yang, W.-R.; Hsu, P.-K.; Chen, S.-Y.; Yasuda, K. Magnetically-manipulatable and self-cleaning lab-on-a-bubble Ag@TiO2@Fe3O4 hollow spheres and their application in SERS detection and photocatalytic degradation. Appl. Surf. Sci. 2024, 673, 160897. [Google Scholar] [CrossRef]
  8. Ye, S.; Cao, Q.; Wang, Q.; Wang, T.; Peng, Q. A highly efficient, stable, durable, and recyclable filter fabricated by femtosecond laser drilling of a titanium foil for oil-water separation. Sci. Rep. 2016, 6, 37591. [Google Scholar] [CrossRef]
  9. Lei, S.; Zhao, X.; Yu, X.; Hu, A.; Vukelic, S.; Jun, M.B.G.; Joe, H.; Yao, Y.L.; Shin, Y.C. Ultrafast Laser Applications in Manufacturing Processes: A State-of-the-Art Review. ASME. J. Manuf. Sci. Eng. 2020, 142, 031005. [Google Scholar] [CrossRef]
  10. Karkantonis, Y.; Pelletier, E.; Barnard, T.; Tuohy, S.; Karnakis, D. Laser drilling of high-density micro-holes on metals using a1064 nm nanosecond pulsed fibre laser. In Proceedings of the LiM 2023 Proceedings: Lasers in Manufacturing Conference 2023, Munich, Germany, 26–29 June 2023; Wissenschaftliche Gesellschaft Lasertechnik und Photonik: Munich, Germany, 2023. [Google Scholar]
  11. Kabekkodu, S. PDF-4+ (Database); International Centre for Diffraction Data: Newtown Square, PA, USA, 2015. [Google Scholar]
  12. Gražulis, S.; Daškevič, A.; Merkys, A.; Chateigner, D.; Lutterotti, L.; Quirós, M.; Serebryanaya, N.R.; Moeck, P.; Downs, R.T.; LeBail, A. Crystallography Open Database (COD): An open-access collection of crystal structures and platform for world-wide collaboration. Nucleic Acids Res. 2012, 40, D420–D427. [Google Scholar] [CrossRef]
  13. Barylyak, A.; Wojnarowska-Nowak, R.; Kus-Liśkiewicz, M.; Krzemiński, P.; Płoch, D.; Cieniek, B.; Bobitski, Y.; Kisała, J. Photocatalytic and antibacterial activity properties of Ti surface treated by femtosecond laser–a prospective solution to peri-implant disease. Sci. Rep. 2024, 14, 20926. [Google Scholar] [CrossRef]
  14. Challagulla, S.; Tarafder, K.; Ganesan, R.; Roy, S. Structure sensitive photocatalytic reduction of nitroarenes over TiO2. Sci. Rep. 2017, 7, 8783. [Google Scholar] [CrossRef]
  15. Liu, G.; Yang, H.G.; Sun, C.; Cheng, L.; Wang, L.; Qing, G.; Cheng, H.-M. Titania polymorphs derived from crystalline titanium diboride. Cryst. Eng. Comm. 2009, 11, 2677–2682. [Google Scholar]
  16. Jin, H.; Cai, Y.; Song, C.; Jin, S.; Lin, Q. Advances in single-molecule surface-enhanced Raman spectroscopy (SERS) for biosensing. Vib. Spectrosc. 2025, 38, 103784. [Google Scholar] [CrossRef]
  17. Ding, S.Y.; Yi, J.; Li, J.F.; Ren, B.; Wu, D.Y.; Panneerselvam, R.; Tian, Z.Q. Nanostructure-based plasmon-enhanced Raman spectroscopy for surface analysis of materials. Nat. Rev. Mater. 2016, 1, 16021. [Google Scholar] [CrossRef]
  18. Xiao, G.N.; Man, S.Q. Surface-enhanced Raman scattering of methylene blue adsorbed on cap-shaped silver nanoparticles. Chem. Phys. Lett. 2007, 447, 305–309. [Google Scholar] [CrossRef]
  19. Del Pilar Rodríguez-Torres, M.; Díaz-Torres, L.A.; Romero-Servin, S. Heparin Assisted Photochemical Synthesis of Gold Nanoparticles and Their Performance as SERS Substrates. Int. J. Mol. Sci. 2014, 15, 19239–19252. [Google Scholar] [CrossRef]
  20. Atkins, P.W.; De Paula, J. Atkins’ Physical Chemistry, 8th ed.; Oxford University Press: Oxford, NY, USA, 2006. [Google Scholar]
  21. Hosseini, Z.S.; Haghparast, F.; Masoudi, A.A.; Mortezaali, A. Enhanced visible photocatalytic performance of un-doped TiO2 nanoparticles thin films through modifying the substrate surface roughness. Mat. Chem. Phys. 2022, 279, 125530. [Google Scholar] [CrossRef]
  22. Carreon, M.A.; Choi, S.Y.; Mamak, M.; Chopra, N.; Ozin, G.A. Pore architecture affects photocatalytic activity of periodic mesoporous nanocrystalline anatase thin films. J. Mater. Chem. 2007, 17, 82–89. [Google Scholar] [CrossRef]
  23. Sopha, H.; Kashimbetova, A.; Hromadko, L.; Saldan, I.; Celko, L.; Montufar, E.B.; Macak, J.M. Anodic TiO2 nanotubes on 3D-printed titanium meshes for photocatalytic application. Nano Lett. 2021, 21, 8701–8706. [Google Scholar] [CrossRef] [PubMed]
  24. Awazu, K.; Fujimaki, M.; Rockstuhl, C.; Tominaga, J.; Murakami, H.; Ohki, Y.; Yoshida, N.; Watanabe, T. A plasmonic photocatalyst consisting of silver nanoparticles embedded in titanium dioxide. J. Am. Chem. Soc. 2008, 130, 1676–1680. [Google Scholar] [CrossRef] [PubMed]
  25. Yussuf, N.A.M.; Li, J.; Jung, Y.J.; Huang, H. Design of high-SERS sensitive substrates based on branched Ti nanorods coated with Ag nanoparticles. Sci. Rep. 2022, 12, 11631. [Google Scholar] [CrossRef] [PubMed]
Figure 1. Simplified scheme of a pulsed laser ablation system.
Applsci 15 11579 g001
Figure 2. Schematic representation of photocatalytic experiment.
Applsci 15 11579 g002
Figure 3. SEM images of titanium mesh surfaces subjected to different modification protocols. (a,b) Untreated mesh morphology (TM_1) and surface details, and insert in (a) depicts mesh array; (c,d) mesh after blue-light-assisted chemical modification (TM_2), revealing Ag nanoparticle coverage; (e,f) views of TM_3 following ultrasonic-assisted reduction, highlighting homogeneous silver granules; (g,h) mesh surfaces modified by H2O2 (TM_4), characterized by cauliflower-like structures of titanium oxides. Insets provide close-ups of nanoparticle morphology for each condition.
Applsci 15 11579 g003
Figure 4. Height profiles of specimens TM_1 (a), TM_2 (b), TM_3 (c), TM_4 (d).
Applsci 15 11579 g004
Figure 5. XRD patterns of specimens TM_1 (grey line), TM_2 (red line), TM_3 (blue line), TM_4 (green line); * Ag reflexes.
Applsci 15 11579 g005
Figure 6. Raman spectra of TM_1 and TM_4.
Applsci 15 11579 g006
Figure 7. SERS spectra of methylene blue on TM_1 (black line), TM_2 (red line), TM_3 (blue line), TM_4 (green line).
Applsci 15 11579 g007
Figure 8. First-order plot of the relative concentrations (Ct/C0) vs. time of MB solution (a) on the surfaces TM_1 (blue), TM_2 (orange), TM_3 (grey), TM_4 (yellow), and control (MB photolysis, light blue); the dependence of ln(Ct/C0) on time (b) TM_1 (blue), TM_2 (orange), TM_3 (grey), TM_4 (yellow), and control (MB photolysis, light blue).
Applsci 15 11579 g008
Figure 9. Schematic diagram of the electron transfer photon-induced charge generation in TiO2 (a); plasmonic electron transfer mediated by Ag nanoparticles (b).
Applsci 15 11579 g009
Table 1. Summary of titanium mesh modification conditions.
Specimen Reagent CompositionVolume
and Concentrations
Activation MethodDurationPost-Treatment
TM_1n.a.n.a.n.a.n.a.n.a.
TM_2EDTA + Ascorbic acid (AA) + AgNO318 mL of mixed solution containing 4 mM EDTA, 3.6 mM AA, and 250 μL of 50 mM AgNO3Blue light irradiation (450 nm)30 minWashed with distilled water and blotted dry
TM_3EDTA + Ascorbic acid (AA) + AgNO3Same as TM_2Ultrasonic bath (40 kHz)15 minSame as TM_2
TM_4H2O2 50%100 μL of 50% H2O2-30 minSame as TM_2
Table 2. Roughness parameters: Sa—the arithmetical mean height; Sdq—the root mean square gradient; Sdr—the developed interfacial area ratio.
SpecimenSa
[μm]
Sdq
[-]
Sdr
[%]
TM_119.6127.38311.20
TM_220.1629.42204.13
TM_319.2025.92203.18
TM_421.8029.67311.62
Table 3. Chemical composition of meshes.
SpecimenTi
[% at.]
O
[% at.]
Ag
[% at.]
TM_168.9031.100
TM_274.3824.221.4
TM_373.4721.225.31
TM_462.5837.420
Table 4. Frequency (in cm−1) and identification of Raman bands of titanium oxide [13,14,15].
TM_1
Band Position
(cm−1)
TM_4
Band Position
(cm−1)
Band IdentificationCrystal Structure
144144EgAnatase
252----EgRutile
330327BgAnatase
398393B1gAnatase
442----EgRutile
516519A1gAnatase
610---A1gRutile
633634EgAnatase
Table 5. Frequency (in cm−1) and identification of SERS bands of MB [18,19].
MB on TM_2
Band Position (cm−1)
MB on TM_3
Band Position (cm−1)
Band Identification
16251626ν(C–C) ring
15031508ν(C–C)
14691463ν(C–N)
14351431ν(C–N)
13941392α(C–H)
13251324ν(C–C) in ring
13021306δ(C–C–C) in ring
δ(C–H)
12181217ν(C–N)
11521152γ(C–H)
10391037β(C–H)
896902C–N/C–S in ring
800806γ(C–H)
769776γ(C–H)
673670γ(C–H)
597597δ(C–S–C)
480477δ(C–N–C)
446446δ(C-N-C)
ν, stretching; α, in-plane ring deformation; β, in-plane bending; γ, out-of-plane bending; δ, skeletal deformation.
Table 6. Apparent rate constant.
Samplekapp
[min−1]
R2
TM_14.2 × 10−30.95
TM_26.6 × 10−30.99
TM_35.4 × 10−30.99
TM_49.7 × 10−30.96
Control (photolysis)1.8 × 10−30.95
Disclaimer/Publisher’s Note: The statements, opinions and data contained in all publications are solely those of the individual author(s) and contributor(s) and not of MDPI and/or the editor(s). MDPI and/or the editor(s) disclaim responsibility for any injury to people or property resulting from any ideas, methods, instructions or products referred to in the content.