Abstract
Global climate change is intensifying extreme rainfall, exacerbating urban flood risks, and undermining the effectiveness of urban stormwater drainage systems (USDS) designed under stationary climate assumptions. While prior studies have identified general trends of increasing flood risk under climate change, they lack actionable connections between climate projections and practical flood risk assessment. Specifically, quantifiable forecasts of extreme rainfall for defined return periods and integrated frameworks linking climate modeling to hydrological simulation at the watershed scale. This study addresses these gaps by developing an integrated framework to assess USDS resilience under future climate scenarios, demonstrated through a case study in Changsha City, China. The framework combines dynamic downscaling of the MRI-CGCM3 global climate model using the Weather Research and Forecasting (WRF) model to generate high-resolution precipitation data, non-stationary frequency analysis via the Generalized Extreme Value (GEV) distribution to project future rainfall intensities (for 2–200-year return periods in the 2040s and 2060s), and a 1D-2D coupled urban flood model built in InfoWorks ICM to evaluate flood risk. Key findings reveal substantial intensification of extreme rainfall, particularly for long-term period events, with the 24 h rainfall depth for 200-year events projected to increase by 32% by the 2060s. Flood simulations show significant escalation in risk: for 100-year events, an area with ponding depth > 500 mm grows from 1.38% (2020s) to 1.62%, (2060s), and the 300–500 mm ponding zone expands by 21%, with long-return-period events (≥20 years) driving most future risk increases. These results directly demonstrate the inadequacy of stationary design approaches for USDS, which carries substantial applied significance for policymakers and stakeholders. Specifically, it underscores the urgent need for these key actors to update engineering standards by adopting non-stationary intensity-duration-frequency (IDF) curves and integrate Sustainable Urban Drainage Systems (SUDS) into formal flood management strategies.
1. Introduction
China’s rapid urbanization has significantly increased exposure to flood hazards [1]. Urban expansion alters land-use, disrupting hydrological cycles through vegetation removal and soil compaction, which elevates flood risk by increasing surface runoff and reducing infiltration [2,3,4]. For example, Luo and Zhang [5] estimated a 13.39% decline in China’s urban flood regulation service from 1977 to 2018, underscoring a marked increase in flood risk. Concurrently, climate change critically amplifies urban flood risk [6], with China’s vulnerability heightened by projected alterations in precipitation patterns [7,8]. Projections indicate a continued alteration of precipitation regimes across most regions [9,10] and a pronounced increase in the frequency and intensity of extreme events [11]. The convergence of these trends intensifies urban flood impacts, leading to severe consequences such as systemic transportation disruptions, substantial economic losses, and secondary disasters that threaten public safety and property [12]. Consequently, flood risk management has become a fundamental imperative for ensuring urban safety and achieving sustainable development [13,14].
Urban stormwater drainage systems (USDS) are vital municipal infrastructures designed to rapidly collect and convey runoff, efficiently manage surface runoff, and mitigate urban flood risks [15]. However, the efficacy of conventional USDS, which are designed using historical intensity-duration-frequency (IDF) curves [16], is being undermined by climate change. The intensification of rainfall extremes [17,18] and increased precipitation variability are exceeding the capacity of existing drainage networks, leading to more frequent pluvial flooding [19]. This inadequacy highlights the critical need to assess the spatiotemporal evolution of urban flood risk and USDS performance to inform proactive policy and long-term disaster risk management [20].
Previous research has extensively documented the impact of climate change on urban flooding. For instance, Zou et al. [21] estimated that a 100-year return period flood in Beijing under the SSP5–RCP8.5 scenario could inundate 199 million m2, causing economic losses of up to CNY 29.78 billion. Wang et al. [22] projected an expansion of 9.5% to 14.4% in areas with medium and high flood susceptibility in the Guangdong–Hong Kong–Macao Greater Bay Area by 2050, while Liu et al. [23] assessed an average increase in probabilistic flood risk of 51.3% and 67.4% under SSP2–4.5 and SSP5–8.5 scenarios, respectively. Despite these advances, a critical disconnect persists between climate projections and actionable flood risk assessment. Specifically, the quantifiable intensification of rainfall extremes for specific future return periods remains poorly constrained, limiting the ability to engineer resilient USDS.
Addressing this gap requires an integrated methodology that bridges climate projections and hydraulic impact. Global climate models (GCMs) provide insights into potential future precipitation changes, but their coarse spatial and temporal resolution necessitates downscaling via dynamic [24,25,26] and statistical [27,28,29] methods to achieve regional applicable resolution. Dynamic downscaling, for instance, employs high-resolution numerical models to refine GCM outputs, yielding temporally and spatially detailed regional meteorological data [24]. For extreme precipitation analysis, statistical extreme value theory (EVT) [30] provides analytical tools, such as the Generalized Extreme Value (GEV) distribution for block maxima [31,32], and the Generalized Pareto Distribution (GPD) for peaks-over-threshold data [32], with parameters determinable through maximum likelihood or L-moments approach [33].
These processed climate inputs, i.e., downscaled precipitation data and extreme value statistics, can then force hydrological and hydraulic simulation models, such as SWMM, InfoWorks ICM, HSPF, or MIKE FLOOD. These models simulate urban flood generation, propagation, and inundation processes, and also assess the USDS performance [34]. Leveraging this integrated approach, we can further quantitatively project the regional spatiotemporal non-stationary rainfall intensity characteristics under climate change and evaluate both future urban flood risk and USDS sustainability.
Building on this logic, this study developed an integrated assessment framework that couples dynamic climate downscaling using WRF model, non-stationary frequency analysis of rainfall through GEV, and high-resolution 1D-2D hydraulic modeling with the InfoWorks ICM model to deliver the aforementioned projections and evaluations. The framework is demonstrated through a case study in a highly urbanized watershed in Changsha City, China, which has faced frequent urban flood risk over the past decade. The rest of this paper is organized as follows. Section 2 describes the study area. Section 3 presents the data and methods, including WRF optimization, GEV analysis, and the InfoWorks ICM model setup. Section 4 presents the results on WRF parameterization performance, projected increases in extreme rainfall intensities, and future flood risk. Section 5 discusses implications of non-stationary rainfall, inadequacy of traditional IDF curves, and limitations of the study. Finally, Section 6 summarizes the conclusions.
2. Study Area
Changsha City (111°53′–114°15′ E, 27°51′–28°41′ N) is the capital city of Hunan Province in South-Central China, located downstream of the Xiangjiang River and to the north of the eastern part of Hunan Province. Changsha has a total area of 11,819 km2 and a construction land area of 1143 km2. Changsha’s topography is characterized by a clear east–west gradient, with plains in the east, gentle hills in the center, and low mountains and hills in the west. The elevation of Changsha varies significantly, ranging approximately from 23 m to 1593 m above sea level. The annual average rainfall is 1431.0 mm, mainly concentrated in March-July, during which June witnessed the maximum rainfall, followed by May and April, whereas the lowest rainfall was observed in December. The city has jurisdiction over six districts and one county, which is defined as main urban area (MUA), as well as managing two county-level cities.
The Longwanggang (LWG) watershed, located in the central area of MUA (Yuelu District), is a rapidly urbanizing region featuring the newly constructed stormwater drainage systems. The urban drainage systems here separate rainwater from sewage flows but prove inadequate during heavy precipitation events. We developed a hydraulic model for a sub-watershed of the LWG watershed, which is prone to frequent flood inundation, as shown in Figure 1. The region has a high northern topography and low southern topography, and experiences frequent urban inland floods. The LWG watershed’s north-high–south-low topography exacerbates flooding in southern low-lying areas (average elevation 32 m), where 60% of historical waterlogging events occurred. The hydrological modeling area has an area of 17.25 km2, a mean slope of 8.2% (derived from 10 m DEM), a weighted average runoff coefficient of 0.65 (calibrated via 2021 stormwater flow data), and a drainage density of 3.1 km/km2. Its stormwater network consists of 47 km of pipes (diameters 300–1200 mm) and 218 manholes; critical locations, e.g., overpasses and rail stations, are designed for 5-year return periods, while most areas use 1–2-year return periods.
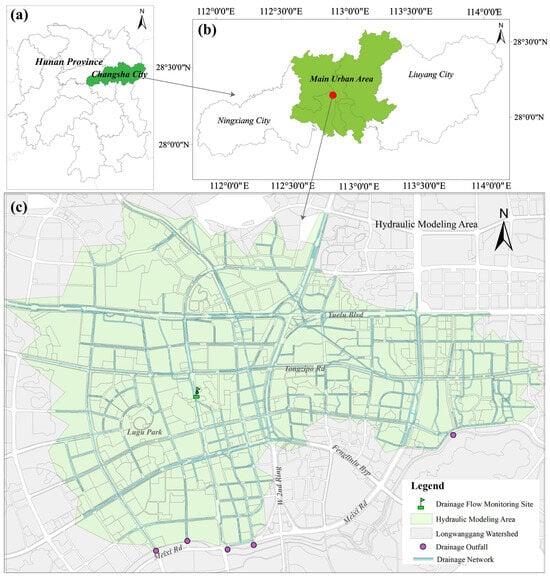
Figure 1.
Location of the study area. (a) Location of the Changsha City (CSC), (b) location of the main urban area of CSC, and (c) the hydraulic modeling area in the Longwanggang (LWG) watershed.
3. Materials and Methods
3.1. Data and Data Processing
3.1.1. Climate Data
Global climate model (GCM) output grid climate data were applied for driving the WRF run. The initial and boundary conditions for historical simulation were comprised from the ERA-interim data (0.702° × 0.702° horizontal resolution, 6 h temporal resolution, obtained from [35]), which represents a good agreement with observed temperature and precipitation in China [25].
To project the impact of climate changes on future extreme precipitation, we utilized outputs from the CMIP5 model MRI-CGCM3 [36] for rainfall downscaling. This model was selected because it outperforms other CMIP5 models in simulating diurnal rainfall over subtropical China [37,38] and offers the finest resolution (1.121° × 1.125°) among models validated for South-Central China. We obtained the MRI-CGCM3 data (2031–2070) from [39] to project the future extreme rainfall in the study area.
CMIP5 employs Representative Concentration Pathway (RCP) scenarios to distinguish different radiative forcing pathways, e.g., RCP 2.6 corresponds to a low-emission scenario and RCP 8.5 corresponds to a high-emission scenario. RCP8.5 is widely adopted for prioritizing extreme hazard identification, ensuring infrastructure resilience, and supporting precautionary disaster planning, making it particularly relevant for assessing severe plausible climate impacts. In this study, we therefore used MRI-CGCM3 outputs under the RCP8.5 scenario [40] to characterize the most severe potential impacts of future climate warming on precipitation.
3.1.2. Rainfall Observations
A series of 5 min interval historical rainfall data at the national meteorological ground-based observation station of Changsha Station (CSS) was obtained from the Hunan Provincial Climate Center with a formal application and permission process. The data includes the daily rainfall time series from 1990 to 2019, and 5 min interval time series of four extreme rainfall events involving 7 June 1997 (hereafter ‘6.7’), 31 October 2008 (hereafter ‘10.31’), 3 July 2016 (hereafter ‘7.3’), and 30 June 2017 (hereafter ‘6.30’). Historical extreme event characteristics are listed in Table 1.

Table 1.
Summary of the historical extreme event characteristics.
3.1.3. Land-Use, Digital Elevation, and the Drainage System
The data used for urban flooding modeling includes land-use, digital elevation, and drainage networks. Digital elevation model data with 10 m resolution was obtained from the Geospatial Data Cloud [41]. The land-use and drainage network were obtained from Xiangjiangxinqu (XJXQ) administration with a formal application and permission process.
3.1.4. Stormwater Flow Data and Flooding Records
There is one pipe flow monitoring station (shown in Figure 1c) constructed in our hydraulic model study area. The 1 h interval time series stormwater flow data in heavy rainfall event (19 May 2021) at the station were obtained from the XJXQ drainage system management department with a formal application and permission process.
3.2. Methodology
The study framework of this study includes three main steps as shown in Figure 2. Firstly, we downscaled the GCM (MRI-CGCM3) outputs to high-resolution (4 km) precipitation datasets, optimized for Changsha’s extreme rainfall characteristics. Secondly, we projected non-stationary rainfall intensities for 2–200-year return periods in the 2040s (2031–2050) and 2060s (2051–2070) using the Generalized Extreme Value (GEV) distribution. Finally, we assessed the urban flooding risk in the LWG watershed under the projected rainfall.
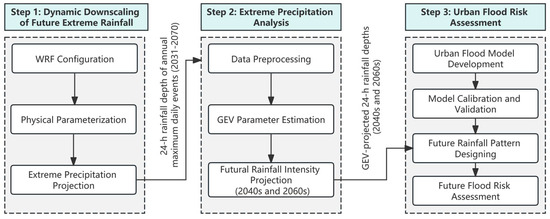
Figure 2.
The methodological framework of the study.
3.2.1. Dynamic Downscaling of Future Extreme Rainfall
- Model Configuration and Domain Setup
The Weather Research and Forecasting (WRF) model was applied for simulating extreme rainfall events. We employed the WRF model (version 3.9.1, National Center for Atmospheric Research, Boulder, CO, USA, obtained from [35]) to predict the future extreme rainfall events in CSC. The model was set with the Lambert Conformal projection coordinate system, and the computational domains were centered at Changsha (28.22° N, 112.94° E) with a three-level, two-way nested grid configuration, involving domain 1 (D01, 36 km grid spacing, 78 × 86 grid points), domain 2 (D02, 12 km grid spacing, 66 × 72 grid points) and domain 3 (D03, 4 km grid spacing, 54 × 60 grid points) as shown in Figure 3. Vertical layers of the domains feature 37 terrain-following eta levels with the top fixed at 50 hPa.
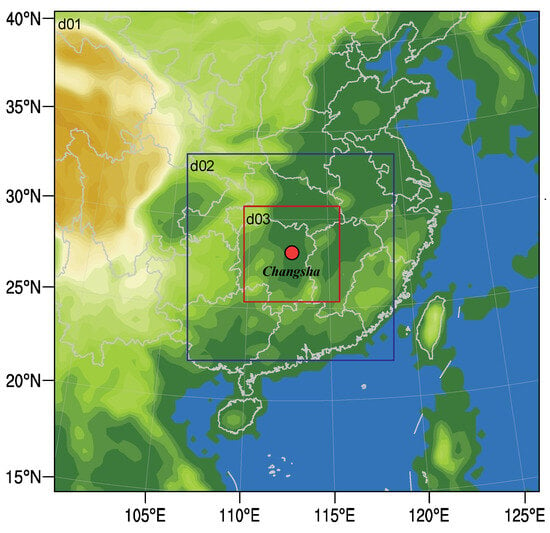
Figure 3.
3-level nested domains of the WRF model. The domain of D01, D02, and D03 has 36 km, 12 km, and 4 km horizontal resolution, respectively.
- Physical parameterization schemes
The WRF model employs several physical parameterization schemes, e.g., microphysics (MP), cumulus (CU), radiation physics (RP), and planetary boundary layers (PBL) schemes, to simulate atmospheric processes. Such schemes critically control the performance of simulation variables, particularly in precipitation forecasting, where MP and CU schemes play critical roles [42].
Empirical studies highlight regional variability in optimal scheme performance. For example, Yang et al. [43] identified that CU takes priority over MP for precipitation simulation in the Hanjing River basin, and verified the excellent performance of the Morrison-GF scheme combination. Liu et al. [44] reported the WSM6 microphysics and Grell–3D cumulus schemes were identified as most effective for heavy rainfall event predicting in the central Tianshan Mountain. Tewari et al. [45] demonstrated that the Thompson scheme outperformed WSM6 and WDM6 in capturing high-resolution peak precipitation intensities without the CU scheme in Beijing. Similarly, Liu et al. [46] showed that the Morrison microphysics scheme outperformed both the Thompson and Lin schemes for summer precipitation simulations in the southern Tibetan Plateau’s mountainous region. These findings underscore a key challenge that no single WRF configuration is universally optimal. Regional atmospheric dynamics, topography, and climate characteristics necessitate tailored scheme combinations to balance accuracy and computational efficiency.
To optimize the physical parameterization schemes, we adopt five distinct combinations from previous studies [42,45,47,48,49] by selecting those that demonstrated superior simulation performance and broader applicability across widely used categories for extreme rainfall simulations in China. The main parameterization combinations are listed in Table 2. Additionally, the Noah land surface model was employed in this study.

Table 2.
Combinations of critical physical parameterization schemes were tested in this study.
- Simulation execution and temporal configuration
For continual long-term (period of years) simulations, the WRF model is configured with a 1-year spin-up period to ensure model states (e.g., soil moisture, atmospheric circulation) reach equilibrium before the target simulation period, minimizing initialization biases in decadal-scale climate projections.
The performance of the heavy rainfall simulation for WRF is tested using ERA-interim data. During the simulation, the featured annual maximum daily precipitation event is set on the last event period day. For the historical period, i.e., 1 January 1980, to 31 December 2018, the annual maximum daily historical extreme is filtered with the local daily precipitation record. For individual extreme rainfall event (period of days) simulations, the WRF model is configured for a 9-day runtime structured as a 3-day spin-up period to stabilize the model and generate realistic initial conditions, a 5-day event period with the target annual maximum daily rainfall event positioned on the final day to ensure model stability during peak precipitation, and a 1-day post-event period to enable analysis of the extreme rainfall system’s recovery and dissipation processes. This temporal configuration balances model initialization needs with the resolution of both the peak event and its atmospheric adjustments, minimizing transient errors while capturing the full life cycle of extreme rainfall events.
For future projections, the dynamic downscaling simulation is undertaken from 1 January 2031 to 31 December 2070 under the RCP8.5 scenario, which represents the high end of the range of future pathways within a world of rapid and unrestrained economic growth and energy use. To address computational resource constraints and enhance computational efficiency, the WRF model is executed in a 2-step framework. Firstly, WRF continual simulation with two-level, two-way nested domains (D01 and D02) was conducted for 2031–2070 (RCP8.5) to identify annual maximum daily precipitation events. Then, event simulations with three-level, two-way nested domains (D01, D02, and D03) for annual maximum daily precipitation events during the period of 2031–2070 were conducted to obtain high-resolution precipitation. This framework is used to identify extreme events for each year from 2031 to 2070, based on projections from the MRI-CGCM3 climate model under the RCP8.5 scenario. Then, annual maximum daily precipitation events are picked from the result for further extreme rainfall event simulation. For the simulation, we configure another 3-level two-way nested domains D03 nested into D02. The time series interval of D03 outputs is set to 5 min. The individual extreme rainfall event simulations are the same as above.
3.2.2. Extreme Distribution Analysis of Non-Stationary Rainfall Intensity
Rainfall intensifying in the future was calculated with extreme distribution analysis. The Generalized Extreme Value (GEV) distribution is a combination of Gumbel, Fréchet, and Weibull distributions as a three-parameter distribution, and is based on the limit theorems for block maximum or annual maximum. The standard cumulative distribution of GEV can be expressed as:
where denotes the cumulative frequency and μ, σ, and ξ denote parameters of location, scale, and shape of the distribution function, respectively. Note that σ and must be greater than zero.
The GEV distribution employs μ, σ, and ξ to specify the distribution’s central tendency, scale around μ, and the tail behavior, respectively. When ξ approaches zero, is less than zero, or exceeds zero, the GEV distribution degenerates into the Gumbel distribution, the Weibull distribution, or the Fréchet distribution, correspondingly. Notably, the parameters of the underlying distribution function are time-dependent, causing the distribution’s properties to evolve.
There are several statistical methods, such as the Bayesian method (BM), weighted moments method (WMM), and maximum likelihood method (MLE), that have been applied to estimate GEV parameters. We estimate the values of μ, σ, and ξ using MLE via the R package (version 3.6.2; R Foundation for Statistical Computing, Vienna, Austria) ‘ismev’ (obtained from [50]). Before the GEV parameter estimation, Grubbs’ test (α = 0.05) was used to remove outliers from the annual maximum rainfall dataset. For MLE numerical stability, a ridge regularization term (λ = 0.01) was added to the log-likelihood function. Model fits were validated via the Kolmogorov–Smirnov (KS) test (p > 0.05 for all periods).
Design rainfall intensity (PT) according to return period (T) is estimated by the following formula:
3.2.3. Storm Pattern Designing for Urban Hydrology Simulation
The 5 min interval storm pattern is a typical input data driving the urban hydrodynamic model. A 5 min interval, 24 h time series of precipitation patterns specifically designed for CSC (as shown in Figure 4) based on a long-term period from 1980 to 2018, was obtained from the Climate Center of Hunan Province. We disaggregated the maximum daily precipitation into 5 min interval, 24 h storm time series based on the precipitation pattern.
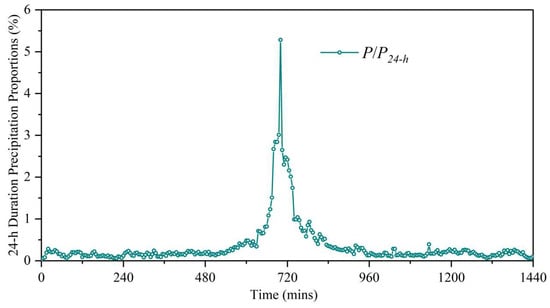
Figure 4.
The 5 min interval storm pattern with 24 h duration in Changsha City. P and P24-h denote 5 min precipitation depth and 24 h cumulative precipitation depths, respectively. P/P24-h represents the ratio of 5 min precipitation to 24 h cumulative precipitation.
3.2.4. Urban Flood Risk Assessment
Urban hydraulic modeling (UHM) is a computational tool to simulate, analyze, and optimize the behavior of urban drainage systems during rainfall events. Autodesk Integrated Catchment Management (ICM) is an advanced hydraulic and hydrologic modeling software, designed to simulate and analyze urban drainage systems, river networks, and flood risk management [51,52,53]. The model comprises a one-dimensional urban drainage pipe network model, a two-dimensional surface runoff model, and one- and two-dimensional coupling models [21]. The one-dimensional pipe network hydrodynamic model derives the hydrodynamic parameters of water flow within the pipe network through the resolution of the Saint-Venant equations in conjunction with the continuity and momentum equations as in Equations (3) and (4). The two-dimensional hydrodynamic simulation of the surface inundation employs the shallow water equations (Equations (5)–(7)) to compute parameters such as surface water depth, flow velocity, and flow directions.
where A is the cross-sectional area; Q is the discharge; t is time; x is the length along the x direction; g is the gravitational acceleration; is the angle of the bed to the horizontal; h is the water depth; S0 is the bed slope; and K is the conveyance.
where u and v denote the velocity components along the x- and y-directions, respectively; ε represents the eddy viscosity coefficient; S0,x and S0,y are the ground slope along the x- and y-directions, respectively; Sf,x and Sf,y stand for the friction slopes along the x- and y-directions, respectively; u1D and v1D denote the velocity components of the source discharge in the x- and y-directions, respectively; and q1D represents the source discharge per unit area.
We construct an urban flooding model covering an area of 17.25 km2 (shown in Figure 5) using the Infoworks ICM (version 2021, Autodesk Inc, San Rafael, CA, USA, obtained from [54]). First of all, we employ the Thiessen polygon method to delineate subcatchments into 3185 units, ensuring that runoff flows into the nearest drainage holes, which integrates the hydrological model of surface runoff with the one-dimensional hydrodynamic model of the pipe network. To simulate urban inland flooding, a two-dimensional mesh network with 267,843 triangulated irregular meshes was used. Meshes ranging in 25–213 m2 were used to balance precision and computation: meshes < 50 m2 were applied in low-lying areas to capture detailed ponding, while meshes > 100 m2 were used in flat urban areas. Mesh quality was verified with a minimum internal angle of 35°, aspect ratio < 3, and skewness < 0.4, ensuring numerical stability. The 1D pipe network hydrodynamic model is concurrently coupled to the 2D surface inundation model through manholes.
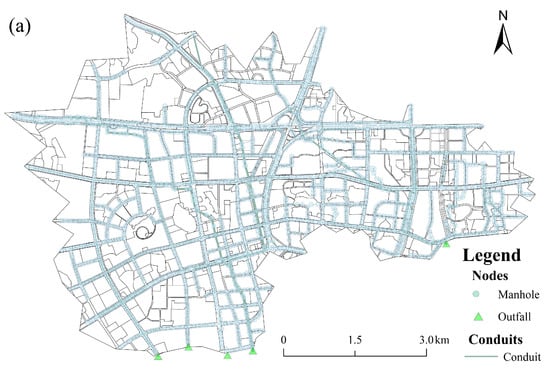
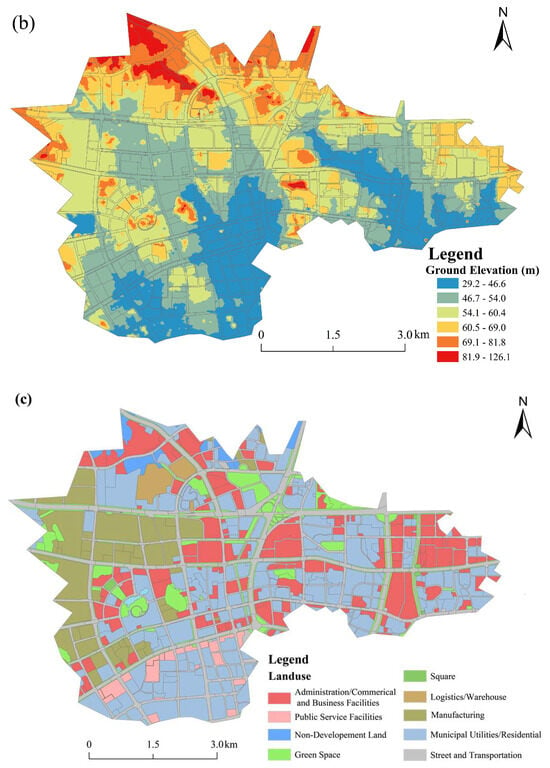
Figure 5.
Layouts of the study area for the urban flooding modeling in the Longwanggang (LWG) watershed. (a) Urban stormwater drainage pipe networks, (b) ground elevation, and (c) land-use pattern.
The initial loss and constant fraction loss methods are used for the surface runoff, and the runoff routing process is calculated using the nonlinear reservoir method. The Horton equation is used to calculate the infiltration capacity, with the required parameters being the initial infiltration rate, the stable infiltration rate, and the attenuation coefficient. The parameters of rainfall runoff and infiltration processes for different land-cover types are provided in Table 3. The rainfall input of a long-duration rainstorm (24 h) was selected to indicate the rainfall pattern and intensity.

Table 3.
Summary of important parameters and reference values used in the urban flooding model.
3.2.5. Model Performance Verification
We applied multiple performance metrics, i.e., relative error (RE), root mean square error (RMSE), mean bias error (MBE), and standard deviation (SD), to evaluate the performance of the model. The metrics are calculated by the following equations:
where P is the simulated cumulative precipitation; Q is the observed cumulative precipitation; M is the number of time steps; and Pi and Qi are the simulated and observed cumulative precipitation at step i, respectively.
4. Results
4.1. WRF Parameterization Optimization and Precipitation Bias Correction
To optimize the WRF parameterization for extreme rainfall event simulation at CSC, we evaluated the WRF performance under different parameterization scheme combinations with four historical extreme rainfall events, namely the ‘6.7’ event, ‘10.31’ event, ‘7.3’ event, and ‘6.30’ event. Figure 6 presents the precipitation time series derived from WRF outputs under five different physical parameterization scheme combinations alongside observations. For the ‘6.7’ event (Figure 6a), the 1 h precipitation depth time series of Sch. 2 follows the observation most closely throughout the entire 24 h period, both in the timing of the rainfall onset and its intensification. Sch. 5 also tracks the observations reasonably well but might underestimate the peak intensity. In contrast, Sch. 3 and Sch. 4 significantly underestimate the rainfall rate from the beginning and fail to capture the storm’s intensity. Sch. 1 shows a significant delay in the rainfall event. For the’10.31’ event (Figure 6b), Sch. 2 and Sch. 5 simulated the observation well, with only minor deviations in the timing or rate of accumulation. Sch. 1 tracks the observations for part of the event but then diverges. Sch. 3 and 4 begin to deviate early on, accumulating rain at a much slower rate and ending up far below the observed total, confirming their consistent underestimation bias. For the ‘7.3’ event (Figure 6c), Sch. 2 and Sch. 5 successfully capture the timing and intensity of the storm, closely following the sharp rise in the observation. Sch. 1 shows some accumulation but falls far short. Sch. 3 and Sch. 4 simulated barely any rain at all, completely failing to capture the dynamics of this event. For the ‘6.30’ event (Figure 6d), Sch. 5 and Sch. 2 well replicate the timing of these peaks and the overall accumulation, with Sch. 5 having a slight edge. Sch. 1 also performs reasonably well but could mistime certain peaks, leading to a higher error. Sch. 3 and Sch. 4 show a consistently slower accumulation rate, failing to match the observed intensity and resulting in a large final deficit. As discussed above, for the individual rainfall event case, notable discrepancies in the accumulated precipitation amount were observed across different scheme combinations.
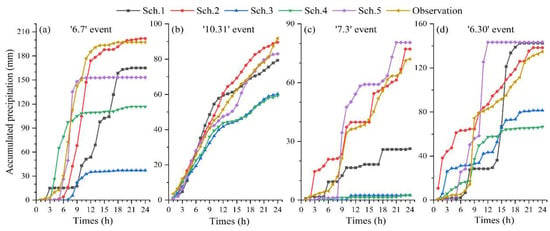
Figure 6.
Comparison of 24 h time series of accumulated precipitation derived from WRF simulations and observations during the heavy rainfall events of (a) the ‘6.7’ event, (b) the ’10.31’ event, (c) the ‘7.3’ event, and (d) the ‘6.30’ event. Note that Sch. 1–5 denote the combinations of critical physical parameterization schemes as listed in Table 2.
We also applied multiple performance metrics, such as RE, RMSE, MBE, and SD, to evaluate the performance for extreme precipitation prediction. Table 4 summarizes the evaluation metrics across different scheme combinations for each rainfall event. Sch. 2 and Sch. 5 are the most reliable. Sch. 2 provides excellent estimates for events ‘6.7’ and ‘7.3’, while Sch. 5 performs best for event ‘6.30’ and reasonably well for others. Sch. 3 and Sch. 4 consistently show significant underestimation across all events, particularly in ‘6.7’ and ‘7.3’. Their high RMSE and MBE values further indicate poor performance and substantial bias. Sch. 1 shows inconsistent results, with moderate to high underestimation in several events.

Table 4.
WRF model performance based on different parameterization schemes. Note that RE, RMSE, MBE, and SD denote relative error, root mean square error, mean bias error, and standard deviation, respectively.
These notable discrepancies in different evaluation metrics underscore that the model’s precipitation simulation performance varies substantially depending on the selection of physical parameterization schemes. Based on comprehensive comparisons of these performance variations, the Sch. 2 combination, i.e., WSM6, KF (new Eta), RRTMG, and MYJ, exhibits the most robust performance across the four events. Therefore, the Sch. 2 combination is chosen for further study as the optimized physical parameterization scheme combination.
With the optimized WRF parameterization scheme, we modeled the annual maximum daily rainfall events during the period of 1990–2019 and 2031–2070. The 24 h accumulated precipitations of the annual maximum daily rainfall events were obtained from each event simulation. Figure 7a illustrates that the 24 h precipitation simulated by the model exhibits a strong linear relationship with observations at the CSS, while showing a slight tendency toward underestimation. Actually, precipitation bias is one of the most common and critical issues in global and regional climate modeling [55]. It refers to the systematic discrepancy between simulated and observed precipitation, manifesting as either overestimation or underestimation of rainfall amounts. It is critical to conduct bias correction before the simulation output for further application, such as watershed hydrological modeling [56]. To minimize the bias of WRF output precipitation, we conducted a bias correction with the data from the historical extreme events using the quantile mapping method described in Tong et al. [57] and then applied in the future period (2031–2070). The bias correction method effectively reduced the bias of simulated precipitation by 3.56% (as shown in Figure 7b).
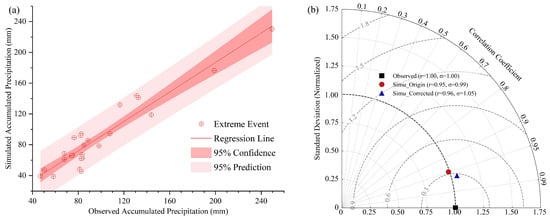
Figure 7.
Comparison of 24 h accumulated rainfall for historical (1990–2019) storm events between observations and WRF simulations. (a) Regression analysis, (b) Taylor Plot of event precipitation of observations and simulations, as well as bias-corrected simulations. The “Observed” in the legend denotes the observed accumulated precipitation of the annual maximum daily rainfall events, “Simu_Origin” represents the accumulated precipitation of these events directly derived from WRF outputs, and “Simu_Corrected” indicates the bias-corrected event precipitations using the quantile mapping approach.
4.2. Non-Stationary Rainfall Intensity Under Climate Change
The 24 h accumulated precipitation of annual maximum daily rainfall events during 2031–2070 from WRF was applied to analyze the future rainfall intensity. The data was segmented into two periods as 2031–2050 and 2051–2070, representing the 2040s and 2060s. We applied the extreme distribution analysis approach to estimate the non-stationary rainfall intensity.
Figure 8 provides a comparative view of the 24 h rainfall depth statistics across various return periods (2- to 200-year) for the 2040s and 2060s. The boxplots clearly show the median, interquartile range (IQR), and potential outliers, highlighting the increasing trend in rainfall intensity with longer return periods and across different time periods. In general, 24 h rainfall intensity increases with longer recurrence intervals for both periods, which is consistent with the expectation that more extreme rainfall events involve greater rainfall amounts. The median rainfall intensity in the 2060s is generally higher than that in the 2040s for the same recurrence interval. Also, the IQR of rainfall intensity, representing the middle 50% of data, is wider in the 2060s, indicating a greater variability in rainfall intensity. This suggests that by the 2060s, not only is the central tendency of rainfall intensity higher, but there is also a broader spread of potential rainfall values. The range of rainfall intensity (1.5IQR) is more pronounced in the 2060s, especially for longer recurrence intervals (e.g., 50, 100, 200 years). This implies a higher likelihood of extremely intense rainfall events in the 2060s.
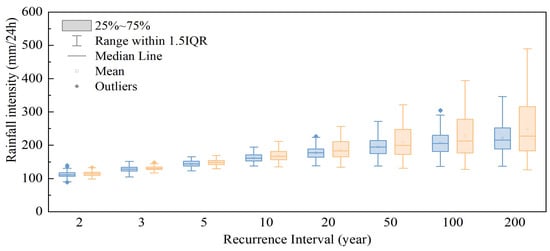
Figure 8.
Boxplots of 24 h duration rainfall intensities in Changsha main urban zone projected in the 2040s (light-blue color) and 2060s (light-orange color).
At shorter recurrence intervals (2–10 years), the difference in rainfall intensity between the 2040s and 2060s is relatively small, with overlapping IQRs and similar median values. As recurrence intervals extend to 20 years and beyond, the disparity becomes more significant, as the 2060s distributions shift upward, with higher medians, wider IQRs, and more extreme outliers. For example, at the 200-year recurrence interval, the median and upper quartile of rainfall intensity in the 2060s are notably higher than in the 2040s.
It suggests that Changsha’s main urban zone is projected to experience higher 24 h rainfall intensities, particularly for extreme events with long recurrence intervals, along with increased variability in rainfall amounts from the 2040s to 2060s.
Spatial variation in rainfall intensity on the main urban area of CSC under the return period of 2-, 3-, 5-, 10-, 20-, 50-, 100-, and 200-year in the 2040s and 2060s is present in Figure 9 and Figure 10, respectively. Overall, the rainfall intensity shows a marked increasing trend as the return period extends from 2-year to 200-year. For example, in the 2040s, the maximum 24 h rainfall intensity rises from 127 mm to 299 mm, and the minimum also increases from 92 mm to 172 mm from 2-year to 200-year. In the 2060s, the maximum increases from 125 mm to 395 mm, with the minimum rising from 107 mm to 191 mm from 2-year to 200-year.
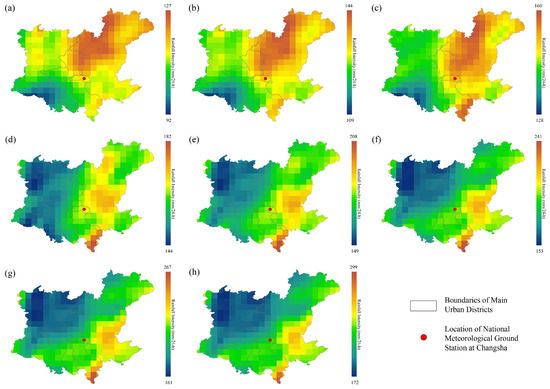
Figure 9.
Spatial distribution of 24 h duration rainfall intensity in Changsha main urban zone projected in 2040s with return periods of (a) 2-year, (b) 3-year, (c) 5-year, (d) 10-year, (e) 20-year, (f) 50-year, (g) 100-year, and (h) 200-year.
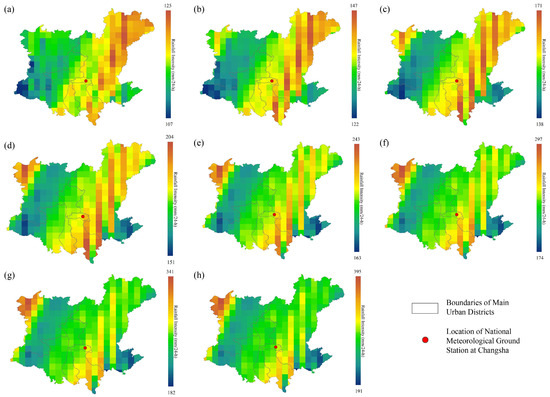
Figure 10.
Spatial distribution of 24 h duration rainfall intensity in Changsha main urban zone projected in 2060s with return periods of (a) 2-year, (b) 3-year, (c) 5-year, (d) 10-year, (e) 20-year, (f) 50-year, (g) 100-year, and (h) 200-year.
Spatially, there is obvious heterogeneity in rainfall intensity under the varied return periods. In both the 2040s and 2060s, the central and eastern parts of the main urban area generally have relatively higher rainfall intensity compared to the western and southern parts across all return periods. Central and eastern Changsha, which are low-lying plains, experience higher rainfall intensity than western mountainous areas because flat terrain potentially facilitates the convergence of warm, moist air from the Xiangjiang River. Additionally, eastern Changsha’s higher urbanization rate may enhance the urban heat island effect, strengthening convective rainfall. The location of CSC is in an area with moderate to relatively high rainfall intensity, which is representative of the regional rainfall features.
When comparing the two periods, the rainfall intensity in the 2060s is generally higher than that in the 2040s for the same return period. This indicates a potential increase in extreme rainfall events in the future under climate change, which has important implications for urban flood prevention, water resource management, and urban infrastructure design, as it reflects the possible changes in rainfall extremes that the main urban area may face under different recurrence intervals in different future periods.
4.3. Urban Flooding Risk Assessment
Before applying the hydraulic model for flood risk assessment, its performance was verified using measured pipe flow data (10 min intervals) and flood observations from 19 May 2021, as shown in Figure 11. The model exhibited good performance in stormwater flow simulation, with a Nash–Sutcliffe Efficiency (NSE) value of 0.78, a correlation coefficient (R2) value of 0.87, a RMSE value of 0.25, a bias value of 0.06, and a p-value < 0.005.
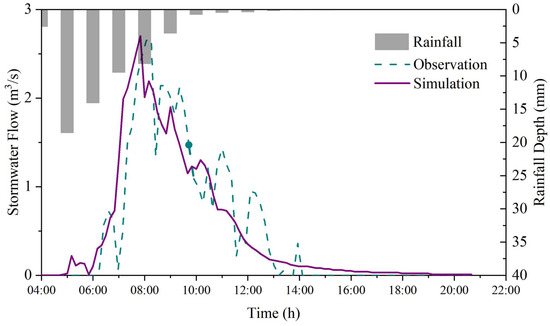
Figure 11.
Time series of observed and simulated stormwater flows of the heavy rainfall event occurred on 19 May 2021.
The storm intensity of 24 h duration rainfall intensity with 50- and 100-year return periods in the LWG watershed was applied to design the rainfall pattern for urban flooding risk assessment. As shown in Table 5, storm intensities show a clear upward trend from the past to the future for the same return period. For example, at a 50-year return period, the storm intensity in 2060 is 260.4 mm, 10.1% higher than that in 2020, indicating a projected increase in extreme rainfall intensity over time under climate change. The difference in storm intensity between the 2020s and 2040s is relatively larger compared to the difference between 2040s and 2060s, suggesting that the consequence of climate change is a resulting accelerated increase in extreme rainfall intensity in the near future.

Table 5.
Rainfall intensities for USDS design regarding return periods for different base years. The storm intensities of 2020 were obtained from the Climate Center of Hunan Province.
We composed the 24 h, 5 min interval rainfall time series using the storm intensity of 50- and 100-year return periods to drive the urban flood model to evaluate the flood risk. The areal proportion of flooding in the LWG watershed under 50-year and 100-year return period rainfall events, projected for the years 2020s, 2040s, and 2060s, under the context of climate change, as classified by different ponding depth ranges, is shown in Table 6.

Table 6.
Statistics of the flooding areal proportion in the LWG area responding to 50- and 100-year return periods projected in the 2020s, 2040s, and 2060s.
For each target decade, i.e., 2020s, 2040s, and 2060s, as the return period increases from 50 years to 100 years, the areal proportion of flooding in almost all ponding depth ranges shows an increasing trend. For example, in 2020, the proportion of the area with ponding depth > 500 mm is 0.99% for the 50-year return period and 1.38% for the 100-year return period. This indicates that more extreme rainfall events (longer return periods) lead to a greater extent of flooding across various depth levels.
For both 50-year and 100-year return period events, from 2020 to 2040 and then to 2060, the areal proportion of flooding in each ponding depth range generally increases. Taking the 100-year return period and ponding depth > 500 mm as an example, the proportion rises from 1.38% in 2020 to 1.52% in 2040 and further to 1.62% in 2060. This suggests that under climate change, the flooding situation in the LWG area is projected to worsen over time, with a larger area being affected by flooding of different depths in the future compared to the present.
Across all years and return periods, the areal proportion of flooding is relatively large in the 300–500 mm ponding depth range. For instance, in 2020, under the 50-year return period, this range accounts for 5.29% of the area, which is higher than the proportions in other depth ranges (except for the <150 mm range in some cases). This indicates that for the LWG area, flooding with ponding depths between 300 and 500 mm is a significant component of the overall flooding pattern under these return period events.
Generally, most flooding risk areas are located in regions with a lower elevation. Figure 12 and Figure 13 depict the spatial distribution of flood risk areas in the LWG region under 50-year and 100-year return period rainfall events, with flood risk categorized by ponding depth as 2–150 mm, 151–300 mm, 301–500 mm, and larger than 500 mm. Under a 50-year return rainfall, flooded areas are relatively limited, with most regions having ponding depths in the 2–150 mm range in 2020. Only scattered small areas show higher depths. Compared to 2020, the extent of flooded areas increases in 2040, as there is a noticeable expansion in regions with ponding depths of 151–300 mm and 301–500 mm, and a slight increase in areas with depth > 500 mm. Flooded areas continue to expand in 2060. The coverage of higher ponding depth regions is more extensive than in 2040, indicating a worsening flood situation. Under the 100-year return rainfall period, flooded areas are larger than those under the 50-year return period in 2020. More regions exhibit ponding depths of 151–300 mm, 301–500 mm, and >500 mm, though the overall extent is still less than in the future. The flooded area expands further compared to 2020 under the 100-year return period. Higher ponding depth regions are more widespread, with a notable increase in the area with depth > 500 mm. Flooded areas reach the largest extent among all scenarios. The distribution of regions with ponding depths of 151–300 mm, 301–500 mm, and >500 mm is the most extensive, showing a significant increase in flood risk over time. Based on Changsha’s 2024 unit-area GDP of 900 million CNY/km2 and population density of 12,000 people/km2, it is projected that areas with >500 mm ponding depth will incur approximately 256 million CNY in losses and expose 3400 people to risks by the 2060s.
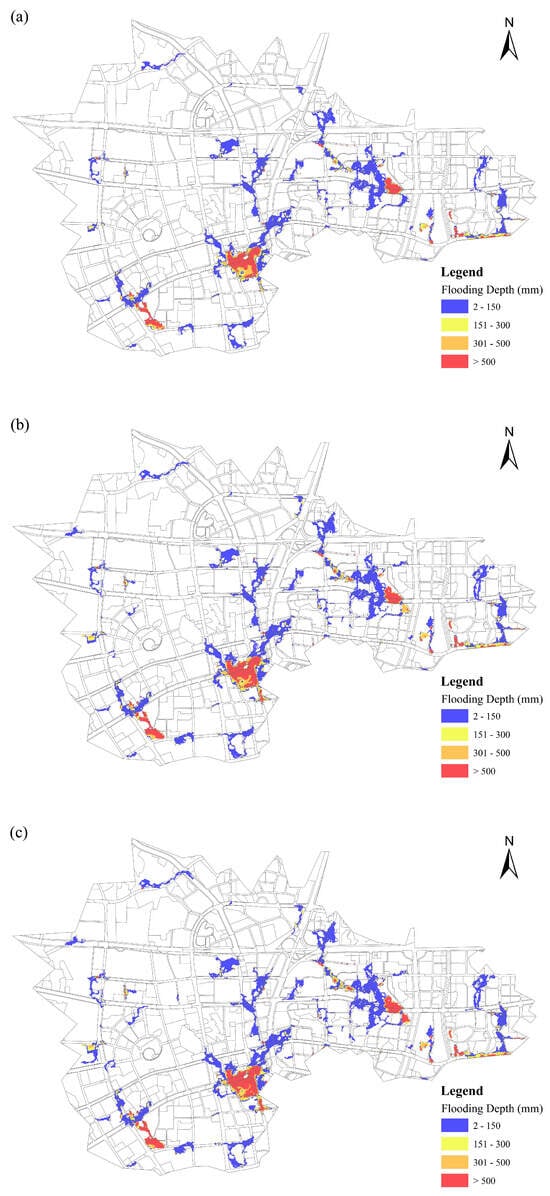
Figure 12.
Spatial distribution of 50-year return period flood risk areas under different inundation depths projected across (a) 2020, (b) 2040, and (c) 2060.
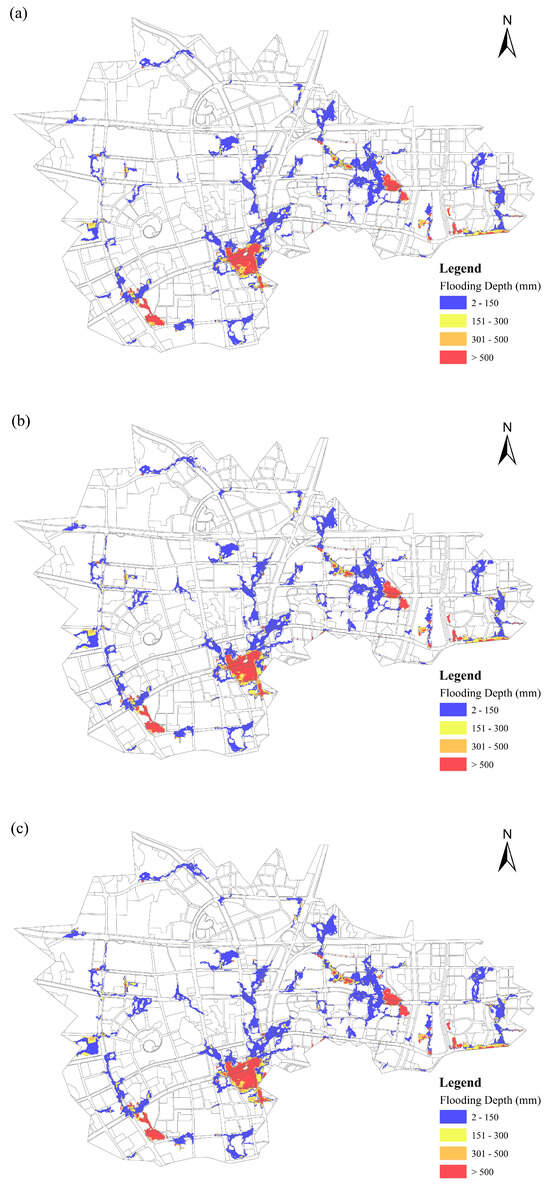
Figure 13.
Spatial distribution of 10-year return period flood risk areas under different inundation depths projected across (a) 2020, (b) 2040, and (c) 2060.
Overall, for both return periods, flood risk in the study area is projected to increase from 2020 to 2060, with larger areas affected and greater proportions of regions experiencing higher ponding depths in the future. Moreover, the construction land has expanded at an annual rate of 3.2% since 2010, with peri-urban green spaces and agricultural lands declining by 15–20% under the “Changsha Metropolitan Area Development Plan (2021–2035)”. Such land-use transitions would amplify surface runoff volumes and flood peak magnitudes beyond the model’s current projections, particularly in low-lying southern regions of the LWG watershed where historical waterlogging is concentrated. To address this, adaptation strategies must integrate land-use planning with flood risk management, complementing the upgrading of drainage infrastructure, e.g., expanding pipe sizes in critical corridors.
5. Discussion
This study established an integrated framework to assess the resilience of urban stormwater drainage systems in CSC under future extreme climate scenarios. Our results project a significant increase in extreme rainfall intensities and consequent flood risk, particularly for long-return-period events.
5.1. Non-Stationarity of Extreme Rainfall and the Inadequacy of Traditional IDF Curves
The primary finding of this study is the profound non-stationarity projected for extreme precipitation in CSC under RCP 8.5, a high-emission scenario. Our analysis reveals a significant temporal evolution in rainfall extremes, with 24 h rainfall intensities for long-return-period events rising sharply from the 2020s to the 2060s, exemplified by a 32% increase for the 200-year return period. This intensification is consistent with global observations and climate model projections, which consistently indicate a trend of increasing frequency and intensity of extreme rainfall due to climate change [58]. For instance, an analysis of historical data in Washington State found that a 50-year return period storm increased in intensity by 37% over 25 years, effectively becoming an 8.4-year event [59]. Similarly, He et al. [60] projected that 100-year floods could become 5-year or 10-year events in regions like the Yellow River basins if the global temperature rises by 4 °C.
A critical nuance of our analysis is the differential sensitivity of rainfall events based on their rarity. We found that short-return-period events, i.e., 2–10 years, show minimal change, while long-return-period events (≥20 years) are intensified significantly. This pattern suggests that the thermodynamic drivers of extreme convection, which are highly sensitive to atmospheric warming and increased moisture-holding capacity, disproportionately influence rare, high-intensity storms compared to more frequent, lower-intensity events often associated with larger-scale synoptic patterns.
This demonstrates that non-stationarity directly undermines the core assumption of traditional USDS design, which relies on stationary IDF curves derived from historical data. Our results provide spatially and temporally explicit validation for broader warnings that stationary curves risk substantially underestimating future rainfall loads. For example, Zhou et al. [61] projected that design intensities across China may need to be increased by 20–80% to account for climate change, a range that encompasses our findings for CSC. Similar trends of IDF curve inadequacy are being reported worldwide [18,62,63]. Therefore, our work provides compelling evidence for the urgent need to develop and officially adopt non-stationary IDF curves to ensure the future resilience of urban drainage infrastructure.
5.2. From Intensified Rainfall to Escalating Urban Flood Risk and Design Implications
The primary consequence of the projected rainfall non-stationarity is a direct and quantifiable increase in inland flood risk. Our hydraulic modeling for the LWG watershed establishes a clear causal chain, translating the increased rainfall intensities into worsening flood outcomes. The model projects a marked expansion of flood-prone areas and an increase in ponding depths from the 2020s to 2060s for both 50-year and 100-year return period events. For the 100-year event, the area characterized by the most impactful ponding depths, i.e., 300–500 mm, is projected to expand by 21%, while the most severe flood zones (ponding depth > 500 mm) grow from 1.38% to 1.62% of the watershed area.
This direct cascade from climate forcing to hydrological impact underscores the primary threat that intensified precipitation poses to existing urban drainage systems. The results quantitatively confirm that systems designed based on historical climate data will be progressively overwhelmed by future extremes. Our findings are consistent with other studies that have linked climate change to increased flood hazards in Chinese cities. For example, Zou et al. [21] estimated substantial economic losses from a 100-year flood in Beijing under a high-emission scenario, while Liu et al. [23] reported a probabilistic increase in urban flooding risk of over 50% on average for China under future climate scenarios. Our study adds a critical temporal and mesoscale dimension to this body of work, projecting the evolution of risk at the watershed level for specific future decades, i.e., 2040s vs. 2060s, and for a comprehensive range of return periods.
These findings collectively underscore the critical inadequacy of stationary IDF-based USDS design and point to the urgent need for adaptive strategies to keep pace with climate change. To enhance urban flood resilience, there is an imperative to proactively upgrade USDS design standards for critical areas, such as densely populated neighborhoods, key infrastructure corridors, and low-lying zones, to at least a 10-year return period. Also, this upgrade must be grounded in climate-adjusted projections, ensuring the system can withstand the intensified precipitation events identified in this study rather than relying on outdated historical climate data.
Beyond gray infrastructure upgrades, a deeper integration of SUDS, which include green roofs, permeable pavements, and bioretention basins, into Changsha’s sponge city development is essential. SUDS can complement traditional drainage infrastructure by reducing surface runoff, enhancing infiltration, and mitigating the peak flow of stormwater, thereby alleviating pressure on the upgraded USDS. This combination of updated gray infrastructure standards and nature-based SUDS solutions creates a more robust, multi-layered defense against the escalating flood risks highlighted in our analysis, as it addresses both immediate drainage capacity gaps and long-term climate adaptability.
Importantly, these research outcomes and proposed strategies extend beyond local urban infrastructure optimization; they also contribute meaningfully to the United Nations Sustainable Development Goals (UN SDGs). Specifically, by improving the scientific understanding of climate-induced urban flood risks and providing evidence-based guidance for resilient drainage system design, the research directly aligns with SDG 11 (Sustainable Cities and Communities), which prioritizes making cities and human settlements safe, resilient, and sustainable. The proposed USDS upgrades and SUDS integration directly support this goal by reducing flood hazards and enhancing livability in Changsha. Additionally, the study’s focus on climate-adjusted design standards and adaptive strategies responds to SDG 13 (Climate Action), which calls for urgent action to combat climate change and its impacts. By linking local drainage system improvements to global climate resilience agendas, the research elevates the practical and normative value of its findings, turning technical solutions into contributions to broader sustainable development objectives.
5.3. Limitations and Uncertainties
While this study presents a comprehensive framework for assessing future flood risk, several limitations and associated uncertainties must be acknowledged. These considerations are crucial for the correct interpretation of our results and highlight pathways for future research.
The climate projections underpinning this analysis rely on a single GCM, the MRI-CGCM3, under a high-emission scenario (RCP8.5). Although the MRI-CGCM3 has demonstrated strong performance in simulating subtropical climate patterns and was optimally configured for this region, this approach does not capture the full range of uncertainty inherent in climate modeling. The findings thus represent a plausible, high-impact future trajectory rather than a probabilistic forecast. Future work would benefit from employing a multi-model ensemble of GCMs from CMIP6 under various Shared Socioeconomic Pathways (SSPs) to quantify the uncertainty range and improve the robustness of the precipitation projections.
Uncertainties are introduced through the dynamical downscaling process and bias correction. While the WRF model was optimized for extreme rainfall simulation in CSC, and quantile mapping effectively reduced systematic bias, regional climate models are sensitive to physical parameterizations and internal variability. The bias-correction method, calibrated on historical data, assumes that the correction function remains valid under future climate conditions, an assumption that may not hold perfectly as climate extremes evolve. These methodological choices, while standard and justified, contribute to the overall uncertainty of the projected rainfall intensities.
The urban flood model, though carefully calibrated and validated, incorporates simplifying assumptions. The model parameters for infiltration and surface roughness were derived from current land-use conditions and held constant for future scenarios. This approach does not account for potential future changes in urban morphology, soil compaction, or the long-term performance degradation of green infrastructure. Furthermore, the model assumes that the drainage network is fully operational and does not consider the risk of system component failures, e.g., pipe blockages, which can significantly exacerbate flooding during extreme events. Future research could integrate land-use change projections and reliability analysis of drainage components to provide a more dynamic and comprehensive risk assessment.
6. Conclusions
This study developed an integrated assessment framework to evaluate the resilience of USDS to climate change in CSC. By combining dynamic climate downscaling, non-stationary frequency analysis, and high-resolution hydraulic modeling, this study provides a comprehensive quantification of future flood risks.
Firstly, we reveal a significant intensification of extreme rainfall, particularly for long-return-period events, with climate projections under the RCP8.5 scenario. A 32% increase in the 24 h rainfall depth for the 200-year return period is projected from the 2040s to the 2060s. A critical finding is the differential sensitivity, where short-return-period events show minimal change, while long-return-period events are substantially amplified. This demonstrates that the assumption of stationarity in rainfall extremes is no longer valid.
Secondly, the intensification of rainfall directly translates into worsened flood outcomes. Hydraulic modeling for the LWG watershed shows a marked expansion of flood-prone areas from the 2020s to the 2060s. For the 100-year return period event, the area with ponding depths greater than 500 mm is projected to increase by 17%, and the dominant 300–500 mm ponding zone expands by 21%. This quantifiably confirms that USDS, designed based on historical climate data, will be progressively overwhelmed.
Thirdly, the projected increases in rainfall intensity and resulting flood risk underscore the critical inadequacy of traditional USDS design reliant on stationary IDF curves. Our findings are consistent with and provide localized evidence for broader warnings that such curves underestimate future design rainfall, potentially by 20–80% in China, thereby jeopardizing urban flood safety.
To enhance urban resilience, this study recommends the urgent update of USDS design standards for critical areas to at least a 10-year return period, using climate-adjusted, non-stationary IDF curves. Priority should be given to regions where flood risk intensifies most sharply, specifically the southern low-lying zones of the LWG watershed and eastern high-urbanization districts of CS. High-priority zones, where projected expansion of ponding depth > 500 mm or high socioeconomic value, e.g., commercial centers and dense residential clusters, require immediate pipe upsizing (targeting diameter 300–600 mm pipes currently designed for 1–2-year return periods) and integration of SUDS. Medium-priority zones include regions with projected expansion of 300–500 mm ponding and moderate socioeconomic value, e.g., western suburban residential areas. For these zones, phased pipe upgrades and cost-effective SUDS (e.g., permeable pavement) are sufficient. Meanwhile, SUDS should be embedded in Changsha’s sponge city planning to target specific runoff hotspots.
While this study is based on a single climate model and static urban parameters, the proposed framework is scalable. Future work should employ multi-model climate ensembles and integrate dynamic land-use projections to further reduce uncertainties and provide more robust, long-term risk assessments for urban water management.
The integrated assessment framework proposed in this study, including coupling dynamic climate downscaling, non-stationary extreme value analysis, and high-resolution 1D-2D hydraulic modeling, exhibits notable flexibility due to its modular design and parameter-adjustable components. This flexibility enables seamless adaptation to diverse geographical, climatic, and urban contexts, making it a valuable tool for urban flood risk assessment beyond the case study watershed.
Author Contributions
Conceptualization, Z.B., W.H. and N.S.; methodology, Z.B. and Y.W.; validation, Z.B. and W.H.; investigation, Z.B., Y.W. and Z.L.; writing—original draft preparation, Z.B.; writing—review and editing, Z.B., Y.W., W.H., N.S. and Z.L.; funding acquisition, Z.B. and W.H. All authors have read and agreed to the published version of the manuscript.
Funding
This research was funded by the Zhuhai Science and Technology Plan Project in the Social Development Field, grant number 2420004000113.
Institutional Review Board Statement
Not applicable.
Informed Consent Statement
Not applicable.
Data Availability Statement
The original contributions presented in this study are included in the article. Further inquiries can be directed to the corresponding author.
Conflicts of Interest
All authors declare that the research was conducted in the absence of any commercial or financial relationships that could be construed as a potential conflict of interest.
References
- Gao, Y.; Tan, X.; Liu, Y.; Xia, M.; Chen, X. Combined effects of future urban development and rainfall patterns on flood characteristics in the Qinhuai River basin. Urban Clim. 2025, 59, 102256. [Google Scholar] [CrossRef]
- Zhao, Z.; Sadaghiani, M.R.S.; Yang, W.; Hua, P.; Zhang, J.; Krebs, P. Estimating storm runoff extreme in small ungauged catchments using an integrated modeling approach. Sustain. Horiz. 2024, 9, 100092. [Google Scholar] [CrossRef]
- Fang, D.; Hao, L.; Cao, Z.; Huang, X.; Qin, M.; Hu, J.; Liu, Y.; Sun, G. Combined effects of urbanization and climate change on watershed evapotranspiration at multiple spatial scales. J. Hydrol. 2020, 587, 124869. [Google Scholar] [CrossRef]
- Moazzem, S.; Bhuiyan, M.; Muthukumaran, S.; Fagan, J.; Jegatheesan, V. A Critical Review of Nature-Based Systems (NbS) to Treat Stormwater in Response to Climate Change and Urbanization. Curr. Pollut. Rep. 2024, 10, 286–311. [Google Scholar] [CrossRef]
- Luo, K.; Zhang, X. Increasing urban flood risk in China over recent 40 years induced by LUCC. Landsc. Urban Plan. 2022, 219, 104317. [Google Scholar] [CrossRef]
- Cea, L.; Costabile, P. Flood Risk in Urban Areas: Modelling, Management and Adaptation to Climate Change. A Review. Hydrology 2022, 9, 50. [Google Scholar] [CrossRef]
- Zhang, Y.; Wu, T.; Arkema, K.K.; Han, B.; Lu, F.; Ruckelshaus, M.; Ouyang, Z. Coastal vulnerability to climate change in China’s Bohai Economic Rim. Environ. Int. 2021, 147, 106359. [Google Scholar] [CrossRef]
- Du, Q.; Sun, Y.; Guan, Q.; Pan, N.; Wang, Q.; Ma, Y.; Li, H.; Liang, L. Vulnerability of grassland ecosystems to climate change in the Qilian Mountains, northwest China. J. Hydrol. 2022, 612, 128305. [Google Scholar] [CrossRef]
- Gu, X.; Ye, L.; Xin, Q.; Zhang, C.; Zeng, F.; Nerantzaki, S.D.; Papalexiou, S.M. Extreme Precipitation in China: A Review on Statistical Methods and Applications. Adv. Water Resour. 2022, 163, 104144. [Google Scholar] [CrossRef]
- Zhang, M.; Yang, X.; Ren, L.; Pan, M.; Jiang, S.; Liu, Y.; Yuan, F.; Fang, X. Simulation of Extreme Precipitation in Four Climate Regions in China by General Circulation Models (GCMs): Performance and Projections. Water 2021, 13, 1509. [Google Scholar] [CrossRef]
- Yang, L.; Yang, Y.; Shen, Y.; Yang, J.; Zheng, G.; Smith, J.; Niyogi, D. Urban development pattern’s influence on extreme rainfall occurrences. Nat. Commun. 2024, 15, 3997. [Google Scholar] [CrossRef] [PubMed]
- Zhang, X.; Mao, F.; Gong, Z.; Hannah, D.M.; Cai, Y.; Wu, J. A disaster-damage-based framework for assessing urban resilience to intense rainfall-induced flooding. Urban Clim. 2023, 48, 101402. [Google Scholar] [CrossRef]
- Manandhar, B.; Cui, S.; Wang, L.; Shrestha, S. Urban Flood Hazard Assessment and Management Practices in South Asia: A Review. Land 2023, 12, 627. [Google Scholar] [CrossRef]
- Tang, Z.; Wang, P.; Li, Y.; Sheng, Y.; Wang, B.; Popovych, N.; Hu, T. Contributions of climate change and urbanization to urban flood hazard changes in China’s 293 major cities since 1980. J. Environ. Manag. 2024, 353, 120113. [Google Scholar] [CrossRef]
- Yazdanfar, Z.; Sharma, A. Urban drainage system planning and design--challenges with climate change and urbanization: A review. Water Sci. Technol. 2015, 72, 165–179. [Google Scholar] [CrossRef]
- Zhang, H.; Yang, Z.; Cai, Y.; Qiu, J.; Huang, B. Impacts of Climate Change on Urban Drainage Systems by Future Short-Duration Design Rainstorms. Water 2021, 13, 2718. [Google Scholar] [CrossRef]
- Ferdowsi, A.; Piadeh, F.; Behzadian, K.; Mousavi, S.-F.; Ehteram, M. Urban water infrastructure: A critical review on climate change impacts and adaptation strategies. Urban Clim. 2024, 58, 102132. [Google Scholar] [CrossRef]
- Tamm, O.; Saaremäe, E.; Rahkema, K.; Jaagus, J.; Tamm, T. The intensification of short-duration rainfall extremes due to climate change—Need for a frequent update of intensity–duration–frequency curves. Clim. Serv. 2023, 30, 100349. [Google Scholar] [CrossRef]
- Monachese, A.P.; Gómez-Villarino, M.T.; López-Santiago, J.; Sanz, E.; Almeida-Ñauñay, A.F.; Zubelzu, S. Challenges and Innovations in Urban Drainage Systems: Sustainable Drainage Systems Focus. Water 2024, 17, 76. [Google Scholar] [CrossRef]
- Xu, T.; Xie, Z.; Jiang, F.; Yang, S.; Deng, Z.; Zhao, L.; Wen, G.; Du, Q. Urban flooding resilience evaluation with coupled rainfall and flooding models: A small area in Kunming City, China as an example. Water Sci. Technol. 2023, 87, 2820–2839. [Google Scholar] [CrossRef]
- Zou, J.; Chen, B.; Duan, C.; Wang, H. Assessing Economic Loss from Urban Waterlogging in Beijing under Climate Change Using a Hydraulic Model. ACS Sustain. Chem. Eng. 2024, 12, 13090–13105. [Google Scholar] [CrossRef]
- Wang, M.; Fu, X.; Zhang, D.; Chen, F.; Liu, M.; Zhou, S.; Su, J.; Tan, S.K. Assessing urban flooding risk in response to climate change and urbanization based on shared socio-economic pathways. Sci. Total Environ. 2023, 880, 163470. [Google Scholar] [CrossRef] [PubMed]
- Liu, W.; Feng, Q.; Engel, B.A.; Yu, T.; Zhang, X.; Qian, Y. A probabilistic assessment of urban flood risk and impacts of future climate change. J. Hydrol. 2023, 618, 129267. [Google Scholar] [CrossRef]
- Luo, N.; Guo, Y.; Feng, J.; Ding, R.; Gao, Z.; Zhao, Z. Dynamic Downscaling Simulation and Projection of Precipitation Extremes Over China Under a Shared Socioeconomic Pathway Scenario. J. Geophys. Res. Atmos. 2022, 127, e2022JD037133. [Google Scholar] [CrossRef]
- Huang, D.; Gao, S. Impact of different reanalysis data on WRF dynamical downscaling over China. Atmos. Res. 2018, 200, 25–35. [Google Scholar] [CrossRef]
- Bao, J.; Feng, J.; Wang, Y. Dynamical downscaling simulation and future projection of precipitation over China. J. Geophys. Res. Atmos. 2015, 120, 8227–8243. [Google Scholar] [CrossRef]
- Zhang, J.; Li, C.; Zhang, X.; Zhao, T. Improving simulations of extreme precipitation events in China by the CMIP6 global climate models through statistical downscaling. Atmos. Res. 2024, 303, 107344. [Google Scholar] [CrossRef]
- Yoshikane, T.; Yoshimura, K. A downscaling and bias correction method for climate model ensemble simulations of local-scale hourly precipitation. Sci. Rep. 2023, 13, 9412. [Google Scholar] [CrossRef]
- Gao, J.; Pesaresi, M. Downscaling SSP-consistent global spatial urban land projections from 1/8-degree to 1-km resolution 2000–2100. Sci. Data 2021, 8, 281. [Google Scholar] [CrossRef]
- Lazoglou, G.; Anagnostopoulou, C.; Tolika, K.; Kolyva-Machera, F. A review of statistical methods to analyze extreme precipitation and temperature events in the Mediterranean region. Theor. Appl. Climatol. 2018, 136, 99–117. [Google Scholar] [CrossRef]
- Bali, T.G. The generalized extreme value distribution. Econ. Lett. 2003, 79, 423–427. [Google Scholar] [CrossRef]
- Hosking, J.R.M.; Wallis, J.R. Parameter and Quantile Estimation for the Generalized Pareto Distribution. Technometrics 1987, 29, 339–349. [Google Scholar] [CrossRef]
- Hossain, I.; Khastagir, A.; Aktar, M.N.; Imteaz, M.A.; Huda, D.; Rasel, H.M. Comparison of estimation techniques for generalised extreme value (GEV) distribution parameters: A case study with Tasmanian rainfall. Int. J. Environ. Sci. Technol. 2021, 19, 7737–7750. [Google Scholar] [CrossRef]
- Zhang, B.; Chen, M.; Ma, Z.; Zhang, Z.; Yue, S.; Xiao, D.; Zhu, Z.; Wen, Y.; Lu, G. An online participatory system for SWMM-based flood modeling and simulation. Environ. Sci. Pollut. Res. Int. 2022, 29, 7322–7343. [Google Scholar] [CrossRef]
- Available online: https://www.mmm.ucar.edu/ (accessed on 15 July 2019).
- Yukimoto, S.; Adachi, Y.; Hosaka, M.; Sakami, T.; Yoshimura, H.; Hirabara, M.; Tanaka, T.Y.; Shindo, E.; Tsujino, H.; Deushi, M.; et al. A New Global Climate Model of the Meteorological Research Institute: MRI-CGCM3—Model Description and Basic Performance. J. Meteorol. Soc. Jpn. Ser. II 2012, 90A, 23–64. [Google Scholar] [CrossRef]
- Zhang, L.; Chen, X.; Lu, J.; Fu, X.; Zhang, Y.; Liang, D.; Xu, Q. Precipitation projections using a spatiotemporally distributed method: A case study in the Poyang Lake watershed based on the MRI-CGCM3. Hydrol. Earth Syst. Sci. 2019, 23, 1649–1666. [Google Scholar] [CrossRef]
- Yuan, W. Diurnal cycles of precipitation over subtropical China in IPCC AR5 AMIP simulations. Adv. Atmos. Sci. 2013, 30, 1679–1694. [Google Scholar] [CrossRef]
- Available online: http://esgf-node.llnl.gov/ (accessed on 10 August 2019).
- Taylor, K.E.; Stouffer, R.J.; Meehl, G.A. An Overview of CMIP5 and the Experiment Design. Bull. Am. Meteorol. Soc. 2012, 93, 485–498. [Google Scholar] [CrossRef]
- Available online: http://www.gscloud.cn/ (accessed on 20 June 2020).
- Gao, S.; Huang, D.; Du, N.; Ren, C.; Yu, H. WRF ensemble dynamical downscaling of precipitation over China using different cumulus convective schemes. Atmos. Res. 2022, 271, 106116. [Google Scholar] [CrossRef]
- Yang, Q.; Yu, Z.; Wei, J.; Yang, C.; Gu, H.; Xiao, M.; Shang, S.; Dong, N.; Gao, L.; Arnault, J.; et al. Performance of the WRF model in simulating intense precipitation events over the Hanjiang River Basin, China—A multi-physics ensemble approach. Atmos. Res. 2021, 248, 105206. [Google Scholar] [CrossRef]
- Liu, Y.; Chen, X.; Li, Q.; Yang, J.; Li, L.; Wang, T. Impact of different microphysics and cumulus parameterizations in WRF for heavy rainfall simulations in the central segment of the Tianshan Mountains, China. Atmos. Res. 2020, 244, 105052. [Google Scholar] [CrossRef]
- Tewari, M.; Chen, F.; Dudhia, J.; Ray, P.; Miao, S.; Nikolopoulos, E.; Treinish, L. Understanding the sensitivity of WRF hindcast of Beijing extreme rainfall of 21 July 2012 to microphysics and model initial time. Atmos. Res. 2022, 271, 106085. [Google Scholar] [CrossRef]
- Liu, H.; Zhao, X.; Duan, K.; Shang, W.; Li, M.; Shi, P. Optimizing simulation of summer precipitation by weather research and forecasting model over the mountainous southern Tibetan Plateau. Atmos. Res. 2023, 281, 106484. [Google Scholar] [CrossRef]
- Tang, J.; Lu, Y.; Wang, S.; Guo, Z.; Lu, Y.; Fang, J. Projection of Hourly Extreme Precipitation Using the WRF Model Over Eastern China. J. Geophys. Res. Atmos. 2022, 128, e2022JD036448. [Google Scholar] [CrossRef]
- Deng, C.; Chi, Y.; Huang, Y.; Jiang, C.; Su, L.; Lin, H.; Jiang, L.; Guan, X.; Gao, L. Sensitivity of WRF multiple parameterization schemes to extreme precipitation event over the Poyang Lake Basin of China. Front. Environ. Sci. 2023, 10, 1102864. [Google Scholar] [CrossRef]
- Gu, Y.; Peng, D.; Deng, C.; Zhao, K.; Pang, B.; Zuo, D. Atmospheric–hydrological modeling for Beijing’s sub-center based on WRF and SWMM. Urban Clim. 2022, 41, 101066. [Google Scholar] [CrossRef]
- Available online: https://cran.r-project.org/web/packages/ismev/index.html (accessed on 20 April 2020).
- Sidek, L.M.; Jaafar, A.S.; Majid, W.H.A.W.A.; Basri, H.; Marufuzzaman, M.; Fared, M.M.; Moon, W.C. High-Resolution Hydrological-Hydraulic Modeling of Urban Floods Using InfoWorks ICM. Sustainability 2021, 13, 259. [Google Scholar] [CrossRef]
- Wang, K.; Chen, J.; Hu, H.; Tang, Y.; Huang, J.; Wu, Y.; Lu, J.; Zhou, J. Urban Waterlogging Simulation and Disaster Risk Analysis Using InfoWorks Integrated Catchment Management: A Case Study from the Yushan Lake Area of Ma’anshan City in China. Water 2024, 16, 3383. [Google Scholar] [CrossRef]
- Wei, H.; Wu, H.; Zhang, L.; Liu, J. Urban flooding simulation and flood risk assessment based on the InfoWorks ICM model: A case study of the urban inland rivers in Zhengzhou, China. Water Sci. Technol. 2024, 90, 1338–1358. [Google Scholar] [CrossRef]
- Available online: https://boards.autodesk.com/icm/ (accessed on 10 August 2023).
- Wang, L.; Zhu, J.; Wang, D. Comparative analysis of high-resolution CMIP6 GCM and CMIP5 RCM: Unveiling biases and advancements in simulating compound extreme events in China. Clim. Dyn. 2025, 63, 91. [Google Scholar] [CrossRef]
- Wu, X.; Zhao, X.; Chen, P.; Zhu, B.; Cai, W.; Wu, W.; Guo, Q.; Iribagiza, M.R. Assessing the effects of combined future climate and land use/cover changes on streamflow in the Upper Fen River Basin, China. J. Hydrol. Reg. Stud. 2024, 53, 101853. [Google Scholar] [CrossRef]
- Tong, Y.; Gao, X.; Han, Z.; Xu, Y.; Xu, Y.; Giorgi, F. Bias correction of temperature and precipitation over China for RCM simulations using the QM and QDM methods. Clim. Dyn. 2020, 57, 1425–1443. [Google Scholar] [CrossRef]
- Myhre, G.; Alterskjaer, K.; Stjern, C.W.; Hodnebrog, O.; Marelle, L.; Samset, B.H.; Sillmann, J.; Schaller, N.; Fischer, E.; Schulz, M.; et al. Frequency of extreme precipitation increases extensively with event rareness under global warming. Sci. Rep. 2019, 9, 16063. [Google Scholar] [CrossRef]
- Rosenberg, E.A.; Keys, P.W.; Booth, D.B.; Hartley, D.; Burkey, J.; Steinemann, A.C.; Lettenmaier, D.P. Precipitation extremes and the impacts of climate change on stormwater infrastructure in Washington State. Clim. Change 2010, 102, 319–349. [Google Scholar] [CrossRef]
- He, Y.; Manful, D.; Warren, R.; Forstenhäusler, N.; Osborn, T.J.; Price, J.; Jenkins, R.; Wallace, C.; Yamazaki, D. Quantification of impacts between 1.5 and 4 °C of global warming on flooding risks in six countries. Clim. Change 2022, 170, 15. [Google Scholar] [CrossRef]
- Zhou, Q. A Review of Sustainable Urban Drainage Systems Considering the Climate Change and Urbanization Impacts. Water 2014, 6, 976–992. [Google Scholar] [CrossRef]
- Martel, J.-L.; Brissette, F.P.; Lucas-Picher, P.; Troin, M.; Arsenault, R. Climate Change and Rainfall Intensity–Duration–Frequency Curves: Overview of Science and Guidelines for Adaptation. J. Hydrol. Eng. 2021, 26, 03121001. [Google Scholar] [CrossRef]
- Xu, M.; Bravo de Guenni, L.; Córdova, J.R. Climate change impacts on rainfall intensity–duration–frequency curves in local scale catchments. Environ. Monit. Assess. 2024, 196, 372. [Google Scholar] [CrossRef]
Disclaimer/Publisher’s Note: The statements, opinions and data contained in all publications are solely those of the individual author(s) and contributor(s) and not of MDPI and/or the editor(s). MDPI and/or the editor(s) disclaim responsibility for any injury to people or property resulting from any ideas, methods, instructions or products referred to in the content. |
© 2025 by the authors. Licensee MDPI, Basel, Switzerland. This article is an open access article distributed under the terms and conditions of the Creative Commons Attribution (CC BY) license (https://creativecommons.org/licenses/by/4.0/).