Abstract
The rapid proliferation of heterogeneous applications, from latency-critical video delivery to bandwidth-intensive file transfers, poses increasing challenges for modern communication networks. Traditional traffic engineering approaches often fall short in meeting diverse Quality of Experience (QoE) requirements under such conditions. To overcome these limitations, this study proposes a QoE-driven distribution framework for mixed traffic in Software-Defined Networking (SDN) environments. The framework integrates flow categorization, adaptive path selection, and feedback-based optimization to dynamically allocate resources in alignment with application-level QoE metrics. By prioritizing delay-sensitive flows while ensuring efficient handling of high-volume traffic, the approach achieves balanced performance across heterogeneous service demands. In our 15-RSU Mininet tests under service number = 1 and offered demand = 10 ms, JOGAF attains max end-to-end delays of 415.74 ms, close to the 399.64 ms achieved by DOGA, while reducing the number of active hosts from 5 to 3 compared with DOGA. By contrast, HNOGA exhibits delayed growth of up to 7716.16 ms with 2 working hosts, indicating poorer suitability for latency-sensitive flows. These results indicate that JOGAF achieves near-DOGA latency with substantially lower host activation, offering a practical energy-aware alternative for mixed traffic SDN deployments. Beyond generic communication scenarios, the framework also shows strong potential in Intelligent Transportation Systems (ITS), where SDN-enabled vehicular networks require adaptive, user-centric service quality management. This work highlights the necessity of coupling classical traffic engineering concepts with SDN programmability to address the multifaceted challenges of next-generation networking. Moreover, it establishes a foundation for scalable, adaptive data distribution strategies capable of enhancing user experience while maintaining robustness across dynamic traffic environments.
1. Introduction
Software-Defined Networking (SDN) decouples the control plane from the forwarding plane, thereby enabling network-wide visibility and programmability. These features make SDN particularly attractive for fine-grained traffic engineering (TE) and Quality of Experience (QoE)-aware forwarding across heterogeneous traffic types, including interactive applications, multimedia streaming, IoT telemetry, and bulk transfers. Early studies have demonstrated that SDN serves as a key enabler for QoE mechanisms, as centralized controllers are capable of enforcing global policies and dynamically adapting flow rules in response to application requirements and network conditions [1].
With the rapid growth of multimedia traffic, the proliferation of IoT devices, and the emergence of latency-sensitive applications such as augmented and virtual reality (AR/VR), the demand for QoE-driven data distribution strategies has intensified. Such strategies must effectively manage mixed traffic flows—encompassing both unicast and multicast, as well as real-time and elastic services—while minimizing control overhead and maintaining scalability [2]. To address these challenges, several approaches have been proposed. Centralized TE with flow-splitting and multipath routing allows SDN controllers to compute multiple paths and dynamically distribute flows across them, thereby balancing load and achieving per-flow QoS targets. Recent studies have further incorporated reinforcement learning (RL) and optimization techniques to adapt flow-splitting decisions under varying traffic loads [3,4]. Multicast-aware delivery and hybrid unicast/multicast switching have also been investigated, where SDN-enabled multicast trees and hybrid SDN solutions reduce redundant transmissions for overlapping receivers, such as in live streaming scenarios. Li et al. have proposed [5] deployment mechanism for the Software-Defined Vehicular Network (SDVN) to enhance traffic prediction across multiple areas by utilizing a two-tier distributed architecture equipped with multiple controllers. Moreover, controllers can dynamically switch between unicast and multicast modes based on group size and link conditions [6,7]. Edge-aware distribution and in-network caching represent another promising direction: by integrating SDN with edge/fog computing and caching mechanisms, end-to-end delay can be reduced and QoE for video or AR applications can be significantly enhanced, as controllers orchestrate content placement and request redirection [8].
In this paper, we have formalized QoE-oriented data distribution under per-host energy constraints and presented the optimization problem. A QoE-loss metric that jointly captures delay penalties and energy cost effects is introduced. We design three greedy heuristics (DOGA, HNOGA, JOGAF) and provide pseudo-code and analysis. Besides, we have implemented the algorithms in Mininet and evaluated them on realistic topologies against baselines. We provide runtime profiles, parameter justifications, and a discussion on suitability for latency-critical services and energy–delay trade-offs.
2. Related Work
Application-driven QoE control loops have been extensively investigated, in which QoE models—mapping objective QoS parameters to subjective QoE outcomes—are integrated into the controller’s decision-making process. By leveraging cross-layer feedback (e.g., buffer occupancy, frame drops), controllers are able to dynamically adjust routing policies, prioritize traffic, or modify adaptive bitrate (ABR) settings in real time [9]. Complementary to these approaches, machine learning and data-driven orchestration techniques have been applied to traffic classification and prediction. Deep learning and graph neural networks enable proactive traffic steering and prefetching, while reinforcement learning (RL)-based methods are capable of directly learning traffic engineering (TE) policies that optimize QoE metrics rather than relying solely on QoS proxies [10].
In parallel, Xu et al. [11] introduced an asynchronous dynamic aggregation method that enhances the robustness, efficiency, and adaptability of satellite–ground communication in federated learning, leading to improved resource utilization and more effective data processing. Similarly, Mwase et al. [12] proposed DAI-NET, which provides a structured framework for identifying and mitigating communication bottlenecks in collaborative training for industrial applications, thereby facilitating the development of more efficient algorithms and communication protocols. In another study, Beshley et al. [13] sought to design a more responsive and user-centric service model for heterogeneous wireless networks by incorporating dynamic resource allocation strategies, ultimately improving user satisfaction. Building on this, an intelligent queue management algorithm has been proposed to ensure accurate differentiation of QoS requirements for IoT services through service category-based priority scheduling, dynamic resource allocation, and delay-adaptive control. Simulation results demonstrate that this approach significantly reduces end-to-end transmission delay compared to traditional proportional fair scheduling, thereby enhancing both transmission performance and resource utilization efficiency in 4G/5G network environments [14].
At the hardware level, the Service Management Center (SMC) consolidates data collection, resource and task management, equipment maintenance, and fault diagnosis through a cloud service platform [15]. By employing both Quality of Control (QoC) and Quality of Service (QoS) as design criteria, the SMC provides unified management and control of underlying devices such as smart meters and industrial robots, leading to higher efficiency in industrial process control. From the perspective of energy consumption, the design of energy-aware communication models in task offloading scenarios requires comprehensive consideration of the coupling between communication delay and energy consumption. Exploiting the advantages of edge computing can effectively reduce the energy consumption of battery-powered devices, while dynamic offloading strategies tailored to network conditions further improve efficiency. Meanwhile, expanding research on event-driven communication paradigms and non-HTTP protocols is essential for enabling systematic energy consumption evaluations across communication stages, thereby facilitating more efficient energy management for mobile and IoT applications [16].
Various optimization formulations have been introduced to address these challenges from complementary perspectives, ranging from exact mathematical models to adaptive heuristics and metaheuristics, each balancing computational tractability with solution quality:
- Mixed Integer Quadratically Constrained Programming (MIQCP): Captures discrete placement decisions and quadratic constraints (e.g., link capacity, service chaining), enabling fine-grained and resource-efficient allocations.
- Integer Linear Programming (ILP): Focuses on cost minimization and efficient mapping of VNFs to infrastructure nodes/links, delivering exact solutions for small–medium scale networks.
- Multi-objective optimization: Simultaneously considers conflicting objectives (e.g., cost, energy, delay), yielding Pareto-optimal placements that balance performance and sustainability.
- Markov Approximation & Matching Theory: Provide adaptive, probabilistic methods for joint placement and chaining, enabling dynamic adaptation to fluctuating traffic and operational costs. These approaches deliver near-optimal solutions with low runtime complexity, efficiently exploring large solution spaces and managing nonlinearities as well as mixed objectives (e.g., latency, load balancing, energy), often outperforming deterministic methods in complex environments.
Collectively, these formulations enrich the optimization toolkit: exact models ensure theoretical optimality under given constraints, while heuristics and metaheuristics enable scalable and adaptive solutions. The integration of both approaches enhances resource utilization, service quality, and operational cost-efficiency in dynamic network environments [17].
In Table 1, each cited paper is summarized to explicitly state how related works differ from each other. Key distinctions emphasized: (i) joint QoE + energy objective (explicitly optimized), (ii) host-activation minimization (practical energy metric for RSU/edge hosts), (iii) greedy joint allocation across hosts and paths suitable for SDN controller deployment (low implementation complexity compared to many DRL methods). While earlier works ([9,10,11,12,13,14,15,16,17]) advance QoE control, learning-based orchestration, energy-aware offloading, and multi-objective optimization in isolation, JOGAF offers a unified, graph-based optimization framework that: jointly manages QoE, energy, and network efficiency, learns adaptive, topology-aware control policies, and achieves scalable, real-time performance across heterogeneous environments.

Table 1.
Comparison table of related works.
Despite these advances, managing mixed traffic continues to present inherent trade-offs. For instance, prioritizing low-latency interactive flows may reduce throughput for bulk transfers, while multicast optimization can compromise fairness among competing unicast flows. Consequently, evaluation metrics have evolved beyond traditional Quality of Service (QoS) indicators, including delay, data packet loss rate, jitter and link utilization to integrate Quality of Experience (QoE)–driven evaluation criteria, including rating models similar to the Mean Opinion Score (MOS) for video and voice, along with control-plane overhead. Recent studies underscore that optimizing QoS alone is insufficient, as QoE-driven policies frequently yield different prioritization and resource allocation strategies [18,19].
3. Materials and Methodology
3.1. Communication Requirements for Mixed Traffic Flows
Building upon the framework outlined in Figure 1, vehicles within mixed traffic flows are classified into five distinct groups: Normal vehicles, autonomous vehicles (with or without Mobile Edge Computing, MEC, support), and MEC-enabled trams. For the purposes of this chapter, the intelligent transportation system (ITS) is assumed to operate within a representative urban environment characterized by diverse ITS applications and roadside units (RSUs) positioned along central road segments. Given the stringent service demands of vehicular applications, particularly in relation to edge computing capacity, Software-Defined Networking (SDN) offers an effective means of enhancing user-perceived Quality of Experience (QoE) through centralized coordination and management of network resources. Accordingly, the communication requirements of the five identified vehicle categories in mixed traffic scenarios are systematically summarized:
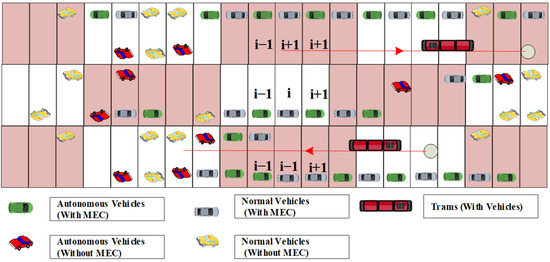
Figure 1.
Composition of vehicle types in mixed traffic flow.
As depicted in Figure 1, the considered traffic scenario consists of five distinct vehicle types: MEC-integrated autonomous vehicles, autonomous vehicles operating independently of MEC, MEC-assisted regular vehicles, conventional vehicles without MEC integration, and MEC-supported trams. The roadside units (RSUs) are interconnected through high-speed wired Ethernet, ensuring reliable backbone communication. Vehicles located within the coverage area of an RSU establish connectivity through vehicle-to-infrastructure (V2I) communication, whereas those outside the coverage range rely on vehicle-to-vehicle (V2V) links to forward information. On this basis, the communication demands associated with heterogeneous traffic flows are subsequently formalized and modeled.
In the urban road scenario illustrated in Figure 1, each roadside unit (RSU) is positioned at the midpoint of a six-lane bidirectional roadway, where the central two lanes are designated exclusively for tram operations. Non-MEC-equipped autonomous and conventional vehicles are disconnected from the SDN–RSU cloud infrastructure. The population of autonomous units without MEC capabilities constitutes a relatively tiny segment of the total fleet, since these vehicles typically generate substantial amounts of video and radar data that require auxiliary processing and computation within the SDN–RSU cloud. By contrast, a considerable proportion of conventional vehicles operate without MEC, owing to their relatively limited communication and computational demands in producing data streams. Prior to the formal modeling of communication requirements, the relevant physical parameters are systematically documented in Table 2.
Table 2.
Data flow.
As summarized in Table 2, let the total number of vehicles within the considered area at time be denoted as . For each RSU belonging to the SDN–RSU cloud architecture, maintaining consistent transmission power across communication links is assumed, while the transmission power of an individual vehicle is represented as . Considering a mixed bidirectional traffic, the vehicle count within the operational range of an RSU is symbolized by , whereas the count of vehicles beyond its coverage limit is designated as . Throughout the information exchange among nodes, relay-induced interference between the two opposing traffic streams is considered negligible due to its relatively weak impact.
3.2. Vehicle User QoE Modeling
In addressing the QoE problem and considering the transmission requirements inherent in mixed traffic flow scenarios, this study draws on the modeling framework proposed by Sha et al. [20] for user QoE in mobile device network offloading contexts. Specifically, delay and energy consumption are adopted as primary evaluation metrics for modeling vehicular user QoE in intelligent transportation systems. Beyond these two dimensions, it is also essential to account for the heterogeneity of ITS application scenarios by explicitly incorporating distinct application backgrounds into the model. By integrating these factors, the QoE perception cost function is formulated as a composite measure of energy consumption, transmission delay, and application context, as expressed in Equation (1).
where is the weight factor between the two cost types of delay and energy consumption, which is used to characterize the different application backgrounds of I TS vehicle users; that is, different types of ITS applications have different weights for energy consumption and delay. is the delay of all vehicle users in the entire ITS in the current time slot, which is the global minimum delay obtained by comprehensive comparison of all vehicle users in the entire ITS in the current time slot. The current delay of the vehicle users of the entire intelligent transportation system is expressed as a constant measured based on the minimum delay, so that it can be weighted and added to the energy consumption. In addition, is the energy consumption of the vehicle users in the current time slot of the entire intelligent transportation system. Since the unit of energy consumption is a standard energy consumption unit measured by the number of working hosts, it is essentially a constant without a unit, so the above operation is not required.
Furthermore, to simplify the modeling of communication requirements, the Doppler frequency shift is disregarded, as vehicle mobility in urban roads is generally low. Based on these assumptions, the maximum achievable channel transmission rate—whether over a V2I or V2V link—can be expressed according to the Shannon capacity formulation, as given in Equation (2).
For Equation (2), the parameter is assigned different values depending on the type of channel: for V2I links and for V2V links. Furthermore, when the channel corresponds to V2I communication, the signal-to-noise ratio is expressed as ; otherwise, for V2V communication, it is represented as . Considering the scenario depicted in Figure 1, where RSUs are deployed and five categories of vehicles coexist on the roadway, the aggregate communication demand imposed on the SDN–RSU cloud by the mixed traffic flow can be formally expressed using Equation (3).
Here, denotes the communication demand of vehicle type at the current time. Within the SDN–RSU cloud, five categories of vehicles coexist, and each RSU provides coverage for a specific area. Consequently, the total demand within a single RSU coverage region can be obtained by aggregating the requirements of all five vehicle types. It is worth noting, however, that two categories—autonomous and conventional vehicle types excluded from MEC-assisted communication frameworks—are excluded from SDN–RSU cloud communications. As a result, the effective communication load is determined by the remaining three types of vehicles. Among them, MEC-enabled autonomous vehicles typically generate flows characterized by stringent low-latency constraints, whereas MEC-enabled conventional vehicles tend to produce data streams with comparatively relaxed latency requirements. Given the coexistence of such heterogeneous traffic flows with varying delay sensitivities, the SDN–RSU cloud must concurrently satisfy the QoS demands of all active information streams.
Following a comprehensive modeling of communication requirements for mixed traffic flows and vehicle user QoE in intelligent transportation systems, here introduces an SDN-based data distribution strategy. The proposed approach aims to optimize vehicle user QoE by simultaneously minimizing latency and the number of active computing hosts, while ensuring that energy consumption constraints are satisfied.
3.3. Scenario Description of the Data Distribution Strategy
In response to the national call for energy conservation and emission reduction, an environmentally friendly energy-saving SDN RSU cloud is established here, and the following parameters are further introduced, which are listed in Table 3.
Table 3.
Parameters of data flow distribution strategy.
Based on the parameters in Table 3, the mathematical problem is abstracted as follows: Given a fixed set of RSUs connected to each other through a wired network, each RSU is located in the middle of the main road and the secondary road. The network structure is modeled as a graph comprising a finite RSU set ; the nodes correspond to RSUs, and the edges indicate their wired interconnections. With respect to the information services, the average demand set , in the time period , there is an initial configuration . For any wired edge connected between two RSUs, let each network link have a bandwidth capacity denoted by . For a given service K at node M, the corresponding traffic demand is represented by , with an associated average demand . To optimize the network configuration, a mathematical model is employed to determine the deployment that satisfies energy constraints while minimizing the number of active hosts over the specified time period. This formulation ensures that the system efficiently allocates resources while maintaining service quality and adhering to energy limitations. The value is defined as the sum of the delays in all edges of a specific single route from RSU to n, which contains processing time, queuing time , transmission time and propagation time.
3.4. Mathematical Model Construction
In order to achieve the goal of “green transportation” and respond to the national carbon neutrality strategy, within the intelligent transportation framework, the SDN–RSU cloud architecture serves to, the energy (power) that each RSU can use is strictly limited in the proposed model. Table 4 lists the output parameters of the model.
Table 4.
SDN RSU cloud output parameter description.
As summarized in Table 4, for an SDN–RSU cloud operating under energy (power consumption) constraints, the output parameters correspond to the optimal network configuration required to satisfy system demands, including load distribution, routing paths, and related metrics. To address the SDN–RSU cloud optimization problem under energy limitations, two weighted objectives are considered: (1) minimizing network delay based on the current bandwidth under a given energy constraint, and (2) minimizing the number of service hosts to deploy while maximizing the overall service capacity of the SDN–RSU cloud within the energy budget. These optimizations are performed under the assumption that a minimal set of redundant RSUs remains active for short periods to mitigate potential network instability caused by sudden surges in communication demand. The corresponding data distribution objective function under energy constraints is formally defined in Equation (4).
Minimizing the number of operational hosts is inherently at odds with the goal of reducing SDN–RSU cloud latency. A weighting factor is therefore employed in Equation (4) to balance these competing objectives. Values of exceeding 0.5 indicate that cloud delay minimization is prioritized, whereas smaller values favor reducing the number of active hosts. In addition, the optimization problem also needs to minimize the QoE loss function. The constraints of the objective function (4) are listed from (5) to (23) as follows:
The objectives of minimizing the number of active hosts and reducing SDN–RSU cloud delay are inherently conflicting. To balance these competing goals, a weighting constant is introduced in Equation (4) to control the relative priority of each term. Specifically, when > 0.5, the model emphasizes minimizing the number of active hosts over delay reduction, whereas when < 0.5, the priority is reversed. Furthermore, the objective function incorporates a term to minimize the QoE loss function, ensuring the user-perceived service quality. The constraints associated with the objective function are detailed in Equations (5)–(23).
Constraint (5) characterizes all traffic routes between RSUs M and n, accounting for both locally generated and relayed traffic along each route. The delay on each edge is a function of its corresponding traffic load, along with the corresponding index in the lookup table facilitates rapid retrieval of these values. Constraint (6) maps the traffic load on each edge to a predefined set E g of discrete units. To maintain feasibility, Constraint (7) restricts the load on edge E to be no greater than its capacity. Additionally, the one-to-one relationship between traffic load and delay for each edge E is imposed by Formulas (8) and (9), ensuring precise mapping between these two metrics.
The total delay between RSUs M and n is quantified as the total delay across all relevant network components across all edges traversed along the route, as expressed in Equation (10). Constraint (11) specifies the maximum allowable delay threshold for service K, ensuring QoS requirements are met. Constraint (12) indicates the activation status of a route, reflecting whether it is currently utilized for traffic forwarding.
Formula (13) enforces the presence of a minimum of one operational service host at each RSU M throughout the considered time period. Constraint (14), in turn, specifies the service threshold for service K in terms of the number of hosts allocated, thereby regulating the capacity available to meet the service demand.
Equation (15) defines the resource constraint, specifying the maximum number of active hosts permissible at a single RSU. This restriction embodies the cost-related factor whereby the operational expenses associated with service hosting increase with the number of working hosts. Consequently, minimizing these hosts contributes to a reduction in the SDN–RSU cloud’s operating costs. The number of active hosts must be strictly constrained.
The variables are subject to the constraints defined in Equations (16) and (17), where the variable takes the value 1 if the corresponding condition is satisfied, and 0 otherwise. The communication process between RSUs can be summarized as follows: the existence of a service demand implies a corresponding traffic load. Equation (18) ensures that each RSU server is capable of satisfying or exceeding the information transmission requirements of the vehicles. Constraints (19) and (20) further restrict routing to paths that prevent non-service-related network load between RSU servers and vehicle users. Additionally, Equations (21) and (22) guarantee sufficient capacity to carry control plane rules, representing the operational overhead generated by the SDN–RSU cloud itself.
Constraint (23) imposes an upper limit on the energy consumption of each RSU, aiming to reduce carbon emissions. This constraint emphasizes that the SDN–RSU cloud design not only seeks to enhance user-perceived quality of experience and minimize network latency but also prioritizes energy efficiency and the reduction in power consumption.
3.5. Greedy Algorithm
Analyzing the objective function, the variable is continuous and non-negative, whereas the number of active hosts is an integer, representing a discrete variable. Consequently, the overall problem is NP-hard. To address this challenge, a greedy algorithmic approach is employed. Subject to energy consumption limits, the Joint Optimization Greedy Algorithm with Finite resources (JOGAF—Algorithm 1) is designed to manage the limited computational and communication resources of individual RSUs, while simultaneously aiming to minimize SDN–RSU cloud delay and active hosts. On this basis, the algorithm further seeks to reduce the QoE loss function to enhance user-perceived service quality.
| Algorithm 1: Joint Optimization Greedy Algorithm with Finite resources—JOGAF |
| For to |
| While current step < previous step (in initial setting, previous step ) |
| For to |
| Migrate the service demand of n the RSU M to the path with the minimum working hosts between the RSU servers I |
| If Service needs cannot be met |
| Increase working hosts in the selected n RSU servers |
| End If |
| For the layer loop, choose the network configuration with the minimum latency |
| End For |
| End While |
| End For |
For comparison, two additional single-objective greedy algorithms are introduced: (1) the Host Number Optimization Greedy algorithm (HNOGA), which focuses solely on minimizing the number of active hosts; and (2) the Delay Optimization Greedy Algorithm (DOGA), which prioritizes minimizing SDN–RSU cloud delay regardless of the hosting cost or the number of active hosts. The detailed procedures for these three greedy algorithms are outlined as follows:
In Algorithm 2: Delay Optimization Greedy Algorithm—DOGA, for a service Ser, the initial value of its user experience quality loss function is set to infinity. In each iteration step, the QoE loss function value is calculated. When it no longer becomes smaller, the loop is exited.
| Algorithm 2: Delay Optimization Greedy Algorithm—DOGA |
| For to |
| While current step < previous step (in initial setting, previous step ) |
| For to |
| Migrate the service demand of the RSU M to the path with the minimum delay between the RSU server |
| If service requirements cannot be met |
| Increase the number of working hosts in the selected n RSU servers |
| End If |
| For the layer loop, choose the network configuration with the minimum latency |
| End For |
| End While |
| End For |
In Algorithm 3: HNOGA, its inner loop selects the path with the least working hosts between the RSU service object and the RSU server each time, which is the same as the condition for exiting the loop of the DOGA.
| Algorithm 3: Host Number Optimization Greedy algorithm—HNOGA |
| For to |
| While current step < previous step (in initial setting, previous step ) |
| For to |
| Migrate the service demand of the RSU to the path with the least number of operational hosts among the designated RSU servers |
| If service requirements cannot be met |
| Increment the count of operational hosts within the chosen n RSU nodes. |
| End If |
| For layer 1, round-robin selects the network configuration with the minimum number of working hosts |
| End For |
| End While |
| End For |
Analytical complexity: Let S = number of service requests (Ser), H = number of candidate hosts, P = average number of candidate paths per host, and N, |E| be node/edge counts. We added the following worst-case time/space complexities:
- DOGA (decoupled, per-flow greedy): For each of S flows, DOGA scans H hosts and P paths per host ⇒ Time: O(S · H · P). Space: O(H + N + |E|) for routing tables and temporary arrays.
- HNOGA (hierarchical nested optimization): HNOGA performs nested host-selection with additional local optimization per host ⇒ Time: O(S · H2 · P) worst case (practical average lower due to pruning). Space: O(H2 + N).
- JOGAF (joint-optimization greedy with local search): JOGAF performs a joint host+path selection with limited local search iterations I ⇒ Time: O(I · S · H · P · log H) (log H from priority updates). Space: O(H + N + |E|). To evaluate the impact of different weight distributions between the two objectives—minimizing SDN–RSU cloud delay and minimizing active hosts—the JOGAF incorporates weight hyperparameters within the objective function. Specifically, the delay optimization weight (DW) and optimization of the host count weight (HW) are varied across three experimental configurations: JOGAF (DW = 0.1, HW = 0.9), JOGAF (DW = 0.5, HW = 0.5), and JOGAF (DW = 0.9, HW = 0.1). Each configuration solves the objective function according to the specified weight distribution, allowing an analysis of the trade-offs between latency reduction and host minimization in the SDN–RSU cloud.
4. Experimental Simulation and Result Analysis
4.1. Experimental Environment and Initial Network Configuration
Regarding the SDN–RSU cloud architecture, the controller configuration follows the design presented in Figure 2, utilizing RYU. Experimental simulations are conducted using the Mininet 2.3.0 platform (Open Networking Foundation, Palo Alto, CA, USA) on a workstation equipped with the following hardware components specifications: Intel® Core™ i7-14700KF 3.40 GHz, Ubuntu 20.04 operating system, 64 GB of RAM, and an NVIDIA GeForce RTX 4080 (16 GB) GPU.
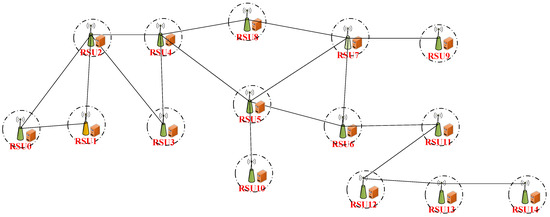
Figure 2.
SDN RSU cloud topology structure.
The experimental scenario is situated in Kongjiang Road, Yangpu District, Shanghai, where a coverage area comprising 15 fixed RSUs is established. Vehicle demands within the coverage of each RSU are collected and summarized, accounting for temporal fluctuations in traffic flow. The scenario location selection criteria are listed as follows: (a) Kongjiang Road exhibits a mixture of traffic types and service demands (urban arterials with both safety-critical and infotainment loads), (b) publicly available/partially anonymized trace or municipal sensor data allowed extraction of realistic vehicle counts and mobility patterns, and (c) the road’s traffic density and heterogeneity make it a representative urban ITS scenario in which competing QoE objectives surface. The detailed network topology employed in the simulation is illustrated in Figure 2.
According to Figure 2, each RSU is configured with an OpenFlow switch alongside a dedicated server, and this physical host configuration is consistent across all RSUs in the network. Within the experimental SDN–RSU cloud, each RSU, operating within its service range, communicates with five classes of vehicles. The OpenFlow switches manage all network traffic over multiple paths, aiming to minimize overall SDN–RSU cloud latency.
Given that each RSU is geographically distributed across distinct urban zones, real-time traffic states and flow dynamics demonstrate notable spatial heterogeneity. Consequently, once the model is supplied with the communication demands and the initial network setup, the problem is formulated to simultaneously minimize SDN–RSU cloud communication latency and the number of active hosts under energy consumption constraints. On this basis, the QoE loss function is further minimized to enhance the perceived quality of experience for vehicle users. To facilitate intuitive and quantitative result analysis, the communication demand generated by the mixed traffic flow comprising five vehicle types is aggregated into parameter set demand prior to simulation. During the experiments and numerical analyses, the data packet size is fixed at 1240 bytes. The values of the experimental input parameters are summarized in Table 5.
Table 5.
Initial setting parameters of network topology and operating environment.
As indicated in Table 5, the quantity of services for network demand initiates at one and progressively rises continuously with an interval of 1 until there is no feasible solution. After preliminary experiments, it was found that the larger the network demand, the fewer services can be run concurrently. In contrast, for demands of 5 Mbps, the system restricts to 20 services. For network demands equal to or exceeding 50 Mbps, only 1 service could be accommodated. For the vehicle traffic information transmission demand generated in the SDN-RSU cloud architecture, it starts from 5 Mbps and increases with an interval of 5 Mbps. 5 Mbps intervals are chosen to reflect the granularity of per-service bitrate adaptation in typical vehicular infotainment flows and to better resolve performance changes across moderate-to-high bitrate demands. For each edge connecting RSUs, the network capacity is configured at 100 Mbps. Each service can accommodate up to five hosts, and the maximum number of services per RSU is limited to five. The parameter governing the network’s fine granularity is set to 1. Initially, no hosts are assumed to be active, and the control plane for the entire network is initialized to 0. The large constant used to define model constraints A is assigned a value of 100,000. Parameters B, which regulate the “delay weight” (DW) and “host weight” (HW), are specified as 0.1, 0.5, and 0.9, corresponding, respectively, to the configurations of JOGAF with DW/HW pairs of (0.1, 0.9), (0.5, 0.5), and (0.9, 0.1). A redundancy factor R of 1.5 is applied to mitigate potential network demand surges. To promote energy efficiency, the energy consumption limit per RSU is imposed at .
In this context, 5 Mbps represents a particular instance of an SDN RSU cloud. For experimental analysis, a network demand of 10 Mbps is selected to provide a representative scenario. At this demand level, the maximum number of concurrently running services is 10, thereby allowing the model to incorporate a greater number of service instances. Preliminary tests under 10 Mbps involved incrementally increasing the number of services from 1 to 10, with a step size of 1. The outcomes for all three algorithms—JOGAF, DOGA, and HNOGA—are summarized in Table 6.
Table 6.
The performance outcomes of the three algorithms—JOGAF, DOGA, and HNOGA—when demand = 10 Mbps.
Table 6 illustrates the variation in the number of active hosts for JOGAF, DOGA, and HNOGA as the number of services increases from 1 to 10. For the JOGAF algorithm, the three hyperparameter configurations yield largely similar results in terms of both network latency and active hosts. Notably, JOGAF (DW = 0.1, HW = 0.9) and JOGAF (DW = 0.5, HW = 0.5) produce identical outcomes, indicating no substantial difference between these settings. When compared with DOGA, JOGAF achieves comparable latency while utilizing fewer hosts across most service instances. Specifically, when the number of services reaches 10, JOGAF (DW = 0.1, HW = 0.9) achieves an average latency of 1126.07 ms, whereas HNOGA reaches 12,476.71 ms, corresponding to a 68.4% reduction in latency. Compared to DOGA (1052.40 ms), JOGAF still maintains a 6.5% lower number of working hosts while achieving similar latency performance.
The JOGAF algorithm demonstrates superior performance by effectively balancing both network latency and the number of active hosts. In contrast, although HNOGA requires significantly fewer hosts per service instance, it induces a dramatic increase in overall SDN RSU cloud latency, often exceeding that of JOGAF and DOGA by an order of magnitude. Consequently, HNOGA’s strategy, which prioritizes host reduction at the expense of latency, is unsuitable for SDN RSU cloud environments. When latency is assigned a higher weight (JOGAF DW = 0.9, HW = 0.1), the latency for certain service instances (Ser = 1, 2, 3, 7, 10) remains comparable to the other hyperparameter configurations. For other instances (Ser = 4, 5, 6, 8, 9), the number of active hosts increases, while the resulting reduction in cloud latency is minimal. This indicates that excessively optimizing for latency incurs additional host overhead, which is not justified in the context of the SDN RSU cloud. Under identical communication demands, the energy consumption of each active host is assumed to be constant. Each computing task requires 40 M CPU cycles, with a single cycle consuming 8.2 nJ, making energy consumption proportional to the task size. Our energy proxy (host count × per-host baseline power) simplifies per-host dynamic power consumption and ignores per-Virtual Machine/CPU utilization variability and heterogeneous host efficiencies. Consequently, the number of working hosts can serve as a representative metric for energy consumption under the same network demand.
For comparative purposes, the energy consumed by a single working host during a given time interval is treated as a standard energy unit. For instance, under a 15 Mbps transmission demand, higher values of active hosts correspond to greater energy consumption, as summarized in Table 7. During the optimization of the objective function, the coefficient R multiplies the number of active hosts to accommodate surges in communication demand, potentially generating idle hosts. These idle hosts are excluded when evaluating energy consumption, so that only active hosts are considered for a fair comparison across the three algorithms.
Table 7.
Energy consumption comparison when the demand = 15 Mbps.
From Table 7, when the communication demand is 15 Mbps, JOGAF (DW = 0.1, HW = 0.9) and JOGAF (DF = 0.5, HW = 0.5) have the same energy consumption value, which means that there is no essential difference in the energy consumption of the JOGAF algorithm under these two hyperparameter configurations. When compared across algorithms, JOGAF consumes 41.5% less energy than HNOGA and 12.6% less than DOGA under the 15 Mbps communication demand. This confirms that JOGAF achieves a favorable trade-off between latency and energy efficiency. For JOGAF (DW = 0.9, HW = 0.1), at that time, it consumed more energy than JOGAF (DW = 0.1, HW = 0.9) and JOGAF (DW = 0.5, HW = 0.5), which shows that the algorithm is more concerned with reducing SDN RSU cloud latency than energy consumption. At that time, the difference between the DOGA and JOGAF (DW = 0.5, HW = 0.5) is that it pursues extremely low cloud latency and has higher energy consumption. When it comes to the HNOGA, the situation becomes completely different. Although it shows less energy consumption than other algorithms, it brings a rapid increase in SDN RSU cloud latency. We have clarified the positioning of JOGAF as complementary to traditional TE algorithms, since it operates at a higher abstraction layer, integrating QoS–QoE–energy trade-offs within a single learning-based control paradigm. Although the HNOGA is not suitable in most cases, it can still be used for short-term system operation when the system is subject to large-scale energy limitations.
4.2. QoE Analysis
The QoE of ITS vehicle users, considering the influence of delay and energy consumption, the SDN network traffic demand is gradually increased when Ser = 1, and the change in the loss function value of the user experience quality under different algorithms is tested until there is no feasible solution for the network configuration. After a large number of experimental tests, it was found that for the simulated SDN network, the maximum traffic demand with a feasible network configuration is 53 Mbps. Starting from 5 Mbps, with 5 Mbps as an interval, the user experience quality loss function values under the network demand of 5 Mbps to 53 Mbps are tested, respectively; starting from the network demand of 50 Mbps, due to the maximum carrying capacity of the adjacent network, the test is carried out with 1 Mbps as an interval. In addition, for the five algorithms, the QoE loss function values in three cases are tested, respectively, which are used to analyze and compare the weight factors between the two cost types of delay and energy consumption. The impact on the QoE loss function value is shown in Figure 3:
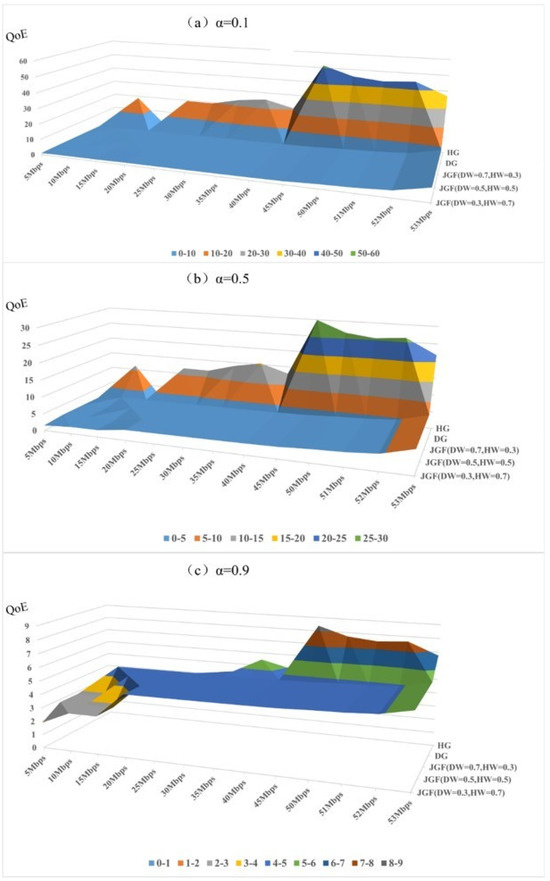
Figure 3.
QoE loss function values for the three algorithms in all cases.
As shown in Figure 3, the QoE loss function value increases monotonically with network traffic demand across all algorithms. The growth becomes significantly steeper as the SDN network approaches its carrying capacity, indicating that congestion has a pronounced negative effect on user experience. This behavior confirms that maintaining network load within a moderate operating range is essential to preserve acceptable QoE levels in SDN-based vehicular environments.-In three cases, the detailed results of the QoE loss function corresponding to the five algorithms HNOGA, DOGA, JOGAF (DW = 0.1, HW = 0.9), JOGAF (DW = 0.5, HW = 0.5) and JOGAF (DW = 0.9, HW = 0.1) under different network requirements are compared. In Figure 3, for the user experience quality under all three conditions, the overall change trend of the QoE loss function value continues to increase with the increase in network traffic; especially when the SDN network traffic is close to the network carrying capacity, the increase slope of the QoE loss function value is steeper. The near-capacity region corresponds to the operating range where network load exceeds approximately 90% of total link capacity, which is also reflected by the sharp gradient change in the QoE-loss curve. The above phenomenon shows that in order to ensure that users have a good experience, the traffic of the SDN network should always be kept in the normal range. Once the network is close to the carrying limit, the user experience quality will drop sharply. In addition, by comparing the QoE loss function values in Figure 3a–c, the larger the value, the smaller the range of the loss function value. This phenomenon shows that as the proportion of delay decreases, the overall loss function value becomes smaller; that is, delay plays a major role in affecting the quality of user experience. For applications dominated by delay in intelligent transportation systems, such as autonomous driving, the optimization of delay will play a decisive role in improving the quality of user experience. On the other hand, regardless of the value, for the user experience quality of different algorithms under the same network demand, the loss function of the HNOGA is usually higher than the loss function values of the other four algorithms; when the network demand increases, the above phenomenon is more prominent. This phenomenon shows that the HNOGA excessively pursues energy saving, resulting in a large gap in its user experience quality compared to other algorithms. In addition, by comparing the QoE loss function values of the three versions of the JOGAF algorithm, JOGAF (DW = 0.1, HW = 0.9), JOGAF (DW = 0.5, HW = 0.5) and JOGAF (DW = 0.9, HW = 0.1), it is found that their loss function values under the same network requirements are relatively close, indicating that the choice of JOGAF algorithm hyperparameters has no obvious impact on the user experience quality of the algorithm itself.
5. Conclusions and Future Works
In this work, we analyze and model user QoE in intelligent transportation systems and design a data distribution strategy within the SDN framework. The strategy aims to effectively balance network latency, the number of active hosts, and energy consumption, thereby enhancing overall user experience. Since the problem is NP-hard, three greedy algorithms—DOGA, HNOGA, and JOGAF (with three hyperparameter variants)—are proposed to obtain approximate solutions. Experimental results show that JOGAF (DW = 0.1, HW = 0.9) and JOGAF (DW = 0.5, HW = 0.5) achieve comparable SDN RSU cloud delay performance to the DOGA, while simultaneously reducing the number of active hosts and energy consumption under specific communication requirements. Extensive simulations demonstrate that JOGAF consistently outperforms traditional greedy algorithms (DOGA and HNOGA), achieving up to 68% lower latency and over 40% energy savings under representative traffic conditions. This indicates that, with appropriate hyperparameters, JOGAF achieves superior overall performance and exhibits good applicability in SDN RSU cloud environments.
By contrast, although the HNOGA significantly decreases the number of active hosts and energy consumption, it often causes a sharp increase in SDN RSU cloud delay compared with JOGAF and DOGA, and this effect becomes more pronounced as network demand increases. Analysis of QoE further reveals that the QoE loss function grows with increasing traffic load; in particular, when SDN traffic approaches maximum capacity, QoE deteriorates rapidly. Moreover, as the weight of delay decreases, the overall QoE loss function also decreases, confirming that delay is the dominant factor in QoE degradation. Under the same network demand, the QoE loss of HNOGA is consistently higher than that of the other four algorithms, and this discrepancy becomes more significant at higher demand levels. This suggests that the strong emphasis on energy saving in HNOGA comes at the cost of substantial QoE degradation.
Comparisons among the three JOGAF variants (DW = 0.1, HW = 0.9; DW = 0.5, HW = 0.5; DW = 0.9, HW = 0.1) show that their QoE loss function values are relatively close, indicating that hyperparameter selection has limited influence on QoE performance. Further analysis demonstrates that the RSU count strongly affects the feasibility of network configurations: larger topologies make it increasingly difficult to find feasible solutions under the same network requirements. Accordingly, when configuring SDN–RSU cloud architectures for ITS scenarios, the scale of a single-region cloud should be carefully controlled. For large-scale topologies, a multi-controller distributed architecture is recommended, which can sustain overall resource efficiency while improving end-user service perception. Therefore, the multi-controller architecture is prosperous to be a potential extension and future research direction.
In all, for future works, first, the proposed JOGAF framework can be enhanced through adaptive hyperparameter learning, where delay and host weights (DW, HW) are dynamically tuned via reinforcement learning or meta-optimization, enabling the algorithm to autonomously balance QoE and energy efficiency under varying network loads. Second, to better capture the dynamics of vehicular networks, real-world mobility traces and heterogeneous service models (e.g., V2X safety messages, infotainment, and sensor data) will be incorporated into large-scale simulation and testbed environments.
Furthermore, integrating edge intelligence and federated learning mechanisms into the SDN RSU cloud could enable predictive control and distributed model training while preserving data privacy. These extensions will help establish a more comprehensive framework for QoE-aware, energy-efficient, and scalable ITS service management.
Simulation experiments confirm that the proposed method significantly enhances the responsiveness of delay-sensitive services without compromising data flow performance. In the broader context of Intelligent Transportation Systems (ITS), where mixed vehicular communication flows coexist within SDN-enabled Vehicular Ad Hoc Networks (VANETs), the proposed strategy provides a solid foundation for user-centric data distribution and QoE-aware service design.
Author Contributions
Conceptualization, H.L. (Hongming Li), H.L. (Hao Li) and Y.J.; Methodology, H.L. (Hao Li) and H.L. (Hongming Li); Software, H.L. (Hongming Li) and Y.J.; Validation, H.L. (Hao Li); Formal Analysis, H.L. (Hongming Li) and H.L. (Hao Li); Investigation, H.L. (Hongming Li) and Y.J.; Resources, H.L. (Hongming Li) and Y.J.; Data Curation, H.L. (Hongming Li), H.L. (Hao Li) and Z.W.; Writing—Original Draft Preparation, H.L. (Hao Li); Writing—Review and Editing, H.L. (Hao Li), H.L. (Hongming Li)., Y.J. and Z.W.; Visualization, H.L. (Hongming Li) and Y.J.; Supervision, H.L. (Hao Li) and Z.W.; Project Administration, H.L. (Hao Li); Funding Acquisition, H.L. (Hao Li). All authors have read and agreed to the published version of the manuscript.
Funding
This research was funded by China Postdoctoral Science Foundation, grant number 2024M762090.
Institutional Review Board Statement
Not applicable.
Informed Consent Statement
Not applicable.
Data Availability Statement
The raw data supporting the conclusions of this article will be made available by the authors on request.
Acknowledgments
The authors would like to thank Tongji University for their support during the experiments.
Conflicts of Interest
The authors declare no conflicts of interest. The funders had no role in the design of the study; in the collection, analyses, or interpretation of data; in the writing of the manuscript; or in the decision to publish the results.
References
- Al Jameel, M.; Kanakis, T.; Turner, S.; Al-Sherbaz, A.; Bhaya, W.S. A Reinforcement Learning-Based Routing for Real-Time Multimedia Traffic Transmission over Software-Defined Networking. Electronics 2022, 11, 2441. [Google Scholar] [CrossRef]
- Prasanth, L.L.; Uma, E. A Computationally Intelligent Framework for Traffic Engineering and Congestion Management in Software-Defined Network (SDN). Eurasip J. Wirel. Commun. Netw. 2024, 2024, 63. [Google Scholar] [CrossRef]
- Barakabitze, A.A.; Walshe, R. SDN and NFV for QoE-Driven Multimedia Services Delivery: The Road towards 6G and beyond Networks. Comput. Netw. 2022, 214, 109133. [Google Scholar] [CrossRef]
- Yang, J.; Zhang, H.; Jiao, W.; Guo, Z.; Alqahtani, F.; Tolba, A.; Shen, Y. Joint Optimization of Layering and Power Allocation for Scalable VR Video in 6G Networks Based on Deep Reinforcement Learning. J. Syst. Archit. 2025, 162, 103401. [Google Scholar] [CrossRef]
- Li, H.; Li, H.; Ji, Y.; Wang, Z. A Multi-Area Software-Defined Vehicular Network Control Plane Deployment Mechanism Oriented to Traffic Prediction. Appl. Sci. 2025, 15, 5545. [Google Scholar] [CrossRef]
- Pei, X.; Sun, P.; Hu, Y.; Li, D.; Chen, B.; Tian, L. Enabling Efficient Routing for Traffic Engineering in SDN with Deep Reinforcement Learning. Comput. Netw. 2024, 241, 110220. [Google Scholar] [CrossRef]
- Tosounidis, V.; Pavlidis, G.; Sakellariou, I. Deep Q-Learning for Load Balancing Traffic in SDN Networks. In Proceedings of the 11th Hellenic Conference on Artificial Intelligence, Athens, Greece, 2–4 September 2020; pp. 135–143. [Google Scholar] [CrossRef]
- Farahani, R.; Tashtarian, F.; Erfanian, A.; Timmerer, C.; Ghanbari, M.; Hellwagner, H. ES-HAS: An Edge-and SDN-Assisted Framework for HTTP Adaptive Video Streaming. In Proceedings of the 31st ACM Workshop on Network and Operating Systems Support for Digital Audio and Video, Istanbul, Turkey, 28 September–1 October 2021; pp. 51–57. [Google Scholar] [CrossRef]
- Liotou, E.; Xenakis, D.; Georgara, V.; Kourouniotis, G.; Merakos, L. Cache-Enabled Adaptive Video Streaming: A QoE-Based Evaluation Study. Future Internet 2023, 15, 221. [Google Scholar] [CrossRef]
- Prabu, U.; Geetha, V. Minimizing the Maximum Link Utilization for Traffic Engineering in SDN: A Comparative Analysis. Procedia Comput. Sci. 2025, 252, 296–305. [Google Scholar] [CrossRef]
- Xu, Z.; Jin, M.; Lin, J.; Liu, Y.; Xu, J.; Xiong, Z.; Cai, H. Connection-Density-Aware Satellite-Ground Federated Learning via Asynchronous Dynamic Aggregation. Future Gener. Comput. Syst. 2024, 155, 312–323. [Google Scholar] [CrossRef]
- Mwase, C.; Jin, Y.; Westerlund, T.; Tenhunen, H.; Zou, Z. DAI-NET: Toward Communication-Aware Collaborative Training for the Industrial Edge. Future Gener. Comput. Syst. 2024, 155, 193–203. [Google Scholar] [CrossRef]
- Beshley, M.; Kryvinska, N.; Beshley, H. Quality of Service Management Method in a Heterogeneous Wireless Network Using Big Data Technology and Mobile QoE Application. Simul. Model. Pract. Theory 2023, 127, 102771. [Google Scholar] [CrossRef]
- Beshley, M.; Kryvinska, N.; Seliuchenko, M.; Beshley, H.; Shakshuki, E.M.; Yasar, A.U.H. End-to-End QoS “Smart Queue” Management Algorithms and Traffic Prioritization Mechanisms for Narrow-Band Internet of Things Services in 4G/5G Networks. Sensors 2020, 20, 2324. [Google Scholar] [CrossRef] [PubMed]
- Liang, G.; Li, W. A Novel Industrial Control Architecture Based on Software-Defined Network. Meas. Control 2018, 51, 360–367. [Google Scholar] [CrossRef]
- Caiazza, C.; Giordano, S.; Luconi, V.; Vecchio, A. Edge Computing vs Centralized Cloud: Impact of Communication Latency on the Energy Consumption of LTE Terminal Nodes. Comput. Commun. 2022, 194, 213–225. [Google Scholar] [CrossRef]
- El Mensoum, I.; Wahab, O.A.; Kara, N.; Edstrom, C. MuSC: A Multi-Stage Service Chains Embedding Approach. J. Netw. Comput. Appl. 2020, 159, 102593. [Google Scholar] [CrossRef]
- Jin, Z.; Xu, H.; Kong, Z.; Pan, C. A Resilient Routing Strategy Based on Deep Reinforcement Learning for Urban Emergency Communication Networks. Comput. Netw. 2025, 257, 110898. [Google Scholar] [CrossRef]
- Zhao, L.; Bi, Z.; Lin, M.; Hawbani, A.; Shi, J.; Guan, Y. An Intelligent Fuzzy-Based Routing Scheme for Software-Defined Vehicular Networks. Comput. Netw. 2021, 187, 107837. [Google Scholar] [CrossRef]
- Sha, J.; Wu, J.; Wang, M.; Pu, Y.; Lu, S.; Bilal, M. QoE-Aware Edge Server Placement in Mobile Edge Computing Using an Enhanced Genetic Algorithm. Int. J. Intell. Netw. 2025, 6, 65–78. [Google Scholar] [CrossRef]
- Zheng, Q.; Zheng, K.; Chatzimisios, P.; Liu, F. Joint Optimization of Link Scheduling and Resource Allocation in Cooperative Vehicular Networks. Eurasip J. Wirel. Commun. Netw. 2015, 2015, 170. [Google Scholar] [CrossRef]
Disclaimer/Publisher’s Note: The statements, opinions and data contained in all publications are solely those of the individual author(s) and contributor(s) and not of MDPI and/or the editor(s). MDPI and/or the editor(s) disclaim responsibility for any injury to people or property resulting from any ideas, methods, instructions or products referred to in the content. |
© 2025 by the authors. Licensee MDPI, Basel, Switzerland. This article is an open access article distributed under the terms and conditions of the Creative Commons Attribution (CC BY) license (https://creativecommons.org/licenses/by/4.0/).