Article

Moving Colorable Graphs: A Mobility-Aware Traffic Steering Framework for Congested Terrestrial–Sea–UAV Networks

by
Anastasios Giannopoulos
1,2,* and
Sotirios Spantideas
1,2
1
Department of Ports Management and Shipping, National and Kapodistrian University of Athens, Evripus Campus, 34400 Euboea, Greece
2
Research & Development Department, Four Dot Infinity (FDI), Kifisias Avenue, Chalandri, 15231 Athens, Greece
*
Author to whom correspondence should be addressed.
Appl. Sci. 2025, 15(21), 11560; https://doi.org/10.3390/app152111560
Submission received: 12 October 2025 / Revised: 20 October 2025 / Accepted: 28 October 2025 / Published: 29 October 2025
(This article belongs to the Section Computing and Artificial Intelligence)

Abstract

Efficient spectrum allocation and telecom traffic steering in densified heterogeneous maritime communication networks remains a critical challenge due to user mobility, dynamic interference, and congestion across terrestrial, aerial, and sea-based transmitters. This paper introduces the Moving Colorable Graph (MCG) framework, a dynamic graph-theoretical representation of interferences that extends conventional graph coloring to capture the spatiotemporal evolution of heterogeneous wireless links under varying channel and traffic conditions. The formulated spectrum allocation problem is inherently non-convex, as it involves discrete frequency assignments, mobility-induced dependencies, and interference coupling among multiple transmitters and users, thus requiring suboptimal yet computationally efficient solvers. The proposed approach models resource assignment as a time-dependent coloring problem, targeting to optimally support users’ diverse demands in dense port-area networks. Considering a realistic port-area network with coastal, sea and Unmanned Aerial Vehicle (UAV) radio coverage, we design and evaluate three MCG-based algorithm variants that dynamically update frequency assignments, highlighting their adaptability to fluctuating demands and heterogeneous coverage domains. Simulation results demonstrate that the selective reuse-enabled MCG scheme significantly decreases network outage and improves user demand satisfaction, compared with static, greedy and heuristic baselines. Overall, the MCG framework may act as a flexible scheme for mobility-aware and congestion-resilient resource management in densified and heterogeneous maritime networks.

1. Introduction

The maritime industry is undergoing a profound digital transformation, with vessels, ports, and offshore infrastructures increasingly relying on broadband wireless connectivity to support navigation, logistics, safety, and passenger services [1,2]. Emerging applications such as real-time vessel tracking, high-definition video surveillance, autonomous navigation, and cloud-assisted decision support require high-capacity and low-latency communication links across vast, dynamic and heterogeneous maritime environments [3]. As a result, the deployment of Maritime Communication Networks (MCNs) leveraging 5G and beyond technologies has become a critical enabler of the maritime digitalization [4,5].
However, this evolution introduces fundamental bottlenecks such as spectrum congestion (waste of spectral resources), heterogeneity (diverse types of maritime transmitters/receivers), mobility (moving targets) and environment variability (changing quality of communication links). In high-density maritime areas such as commercial ports, straits, or shipping lanes, multiple vessels, Unmanned Aerial Vehicles (UAVs), buoy-mounted Base Stations (BSs), and coastal infrastructures must share limited spectral resources [6]. Unlike terrestrial networks, where dense infrastructure allows for frequency reuse, maritime environments are characterized by a scarcity of available spectrum and rapidly varying interference patterns. This leads to inefficient spectrum utilization and an increased probability of service outages, especially under congestion scenarios.

1.1. Challenges in Dense Maritime Communication Networks

A typical Dense Heterogeneous MCN (DH-MCN) in a port area brings together a diverse set of infrastructure and mobile entities, each playing a distinct role in ensuring seamless connectivity [7,8]. Coastal BSs, often deployed on port infrastructure, serve as the backbone, offering high-capacity terrestrial coverage for vessels at berth or near the coast [3,9]. Vessel-mounted radio access points extend connectivity onboard and provide localized coverage for crew, cargo monitoring, and passenger services [10]. To handle peak-hour surges or coverage blind spots, UAVs are increasingly deployed as agile aerial BSs, dynamically repositioned to reinforce congested areas or track moving ships [9]. Buoy-mounted or sea-surface relays complement the system by acting as low-power, persistent nodes that expand coverage further offshore and facilitate handovers between vessels and shore infrastructure [11]. Finally, satellite links provide wide-area, backhaul connectivity and guarantee service continuity as ships transition beyond the port’s immediate range [5]. Together, these heterogeneous elements form densified and time-varying MCN, but their coexistence also exacerbates spectrum management challenges.
There are unique characteristics that are coupled with the DH-MCN. A cargo vessel entering a crowded port may suddenly compete for spectrum with dozens of other ships, dockside networks, and even buoy-based relays, while overhead UAVs provide temporary coverage for moving fleets [12]. Weather conditions, sea currents, and the irregular movement of vessels further reshape the interference landscape, making the network inherently unstable [13,14,15]. In such a setting, static or pre-planned spectrum allocation quickly becomes obsolete. What is needed instead is a spectrum management approach that evolves with the network itself, capable of following mobility, absorbing heterogeneity, and adapting to ever-changing interference patterns.
The problem becomes even more pronounced when users’ demands peak within the short-range coverage area of congested ports. In such cases, mobile operators often deploy additional transmitters, such as small cells on vessels, UAV transmitters, or temporary shore-side units, to alleviate traffic overload [7]. While these deployments help fill coverage gaps and support the growing data needs of maritime users, they inevitably introduce new interference with the existing coastal BSs, or even between each other (e.g., UAV-to-UAV interference, or UAV-to-ship interference). The resulting spectrum overlap can cause sharp fluctuations in link quality, particularly when vessels, port pedestrians move in and out of coverage zones or when UAVs adjust their trajectories. In such dense and dynamic conditions, conventional frequency allocation schemes cannot ensure consistent Quality of Service (QoS) [13]. This calls for a time-varying Dynamic Spectrum Access (DSA) strategy tailored for DH-MCNs, where allocation decisions continuously adapt to user mobility, rapidly changing channel conditions, and stringent service demands.

1.2. Limitations of Existing Frequency Allocation Methods

Frequency allocation has long been recognized as a fundamental challenge in wireless communication networks, and several classes of methods have been applied to maritime environments with varying levels of success [16,17,18,19]. Static allocation strategies, where spectral resources are pre-assigned based on long-term planning or fixed coverage zones, offer simplicity but fail to account for the highly dynamic nature of maritime networks [20]. These schemes cannot adapt to vessel mobility, short-term congestion, or the irregular deployment of UAV or buoy relays, resulting in frequent underutilization of resources and severe service degradation during peak demand.
To improve adaptability, greedy and heuristic-based algorithms have been employed, where channels are allocated iteratively based on local interference conditions or user demands [20,21,22]. While such methods can react to short-term changes, their localized application to specific problems also limits their direct application in dense port environments, where the number of nodes and interference relationships grows rapidly. More recently, Machine Learning (ML) [23] and Deep Reinforcement Learning (DRL) [24,25] approaches have been introduced to tackle frequency allocation in dynamic networks. These methods aim to learn adaptive allocation policies by interacting with the environment, showing promise in capturing complex dependencies between mobility, interference, and traffic demand. However, DRL-based solutions face critical limitations in DH-MCNs: (i) they often require large volumes of training data that are not always available in maritime scenarios, (ii) their convergence time can be prohibitive in fast-changing topologies, and (iii) their need to be continuously retrained on unknown states (due to frequent environment changes) raise complexity and feasibility concerns. Taken together, existing methods either lack adaptability (static), suffer from generalization abilities (greedy), or face high complexity and deployment barriers (DRL). This creates a clear need for adaptive frameworks that explicitly capture the spatiotemporal dynamics of mobility, heterogeneity, and interference in DH-MCNs [26].
Overall, despite progress, most DSA solutions remain relatively explored for dense and heterogeneous port-area networks, where mobility, interference coupling, and heterogeneity interact in complex ways. Also, most of the studies are focused on traditional wireless networks, usually not focusing on integrated coverage by terrestrial–sea–UAV transmitters under mobility. This motivates the exploration of graph-theoretic methods, and, in particular, graph coloring, which offers a principled yet lightweight framework to approximate the allocation problem by focusing on conflict relationships. By extending the interference graph to capture temporal dynamics, spectrum allocation can evolve with the network itself, thus requiring models that resolve resource conflicts in a temporally adaptive yet computationally efficient manner.

1.3. Objectives and Contributions

The above limitations highlight the need for developing DSA methods specialized to DH-MCNs, which not only capture interference relationships at a given instant, but also evolves over time to reflect mobility, congestion, and the dynamic deployment of heterogeneous nodes [3,26]. To this end, this paper introduces the concept of Moving Colorable Graphs (MCGs), a graph theory-based abstraction method for DSA in DH-MCNs. MCGs rely on dynamically constructing interference graphs based on the instantaneous topology, users’ demands and interference levels [16]. Given an interference graph, where vertices correspond to maritime users and edges represent conflicts (i.e., inability to assign the same frequency channel), we can use graph coloring approaches [27,28,29]. The latter are used to color each vertex of a graph, given a set of available colors, such that there is no pair of neighboring vertices with the same color. In MCN terms, MCGs are used to dynamically assign the maximum number of frequency channels (colors) such that to maximize the number of satisfied users (i.e., no interference between interfering users). By embedding temporal evolution into the interference graphs of DH-MCNs, the proposed framework allows spectrum allocation to be reformulated as a time-varying graph coloring problem, where solutions must balance two objectives, namely (i) mitigating interferences and (ii) maximizing the satisfaction rate of the users.
The main contributions of this paper are threefold:
  • Moving colorable graphs are introduced as a general modeling framework for dynamic spectrum allocation in dense and heterogeneous maritime communication networks, including terrestrial, aerial and sea transmitters. The concept bridges the gap between static interference graphs and time-varying real-world deployments, capturing the joint effects of mobility, congestion, and multi-tier heterogeneity in port environments.
  • We design and analyze a family of MCG-based frequency allocation algorithms that incrementally update spectrum assignments over time, balancing the trade-off between allocation optimality and re-coloring overhead. The proposed variants, including the unweighted (UW-MCG), priority-based (PR-MCG), and selective-reuse (SR-MCG), enable different levels of adaptivity and service differentiation.
  • A selective reuse (SR-MCG) mechanism is introduced to further enhance spectrum utilization by allowing controlled PRB reuse between non-conflicting users when interference remains within acceptable SINR margins. This relaxation mechanism significantly reduces uncolored users under heavy congestion while preserving service guarantees for prioritized traffic.
  • We implement and evaluate the proposed framework in a realistic dense-port scenario involving multiple heterogeneous transmitters (CBS, ABS, SBS) and mixed traffic profiles (Voice and Mobile broadband services). Simulation results demonstrate the superior throughput and demand satisfaction achieved by MCG-based methods compared to classical baselines.

2. Background and Graph Coloring

2.1. Spectrum Management in Maritime Communication Networks

DH-MCNs combine heterogeneous radio access infrastructures such as coastal BSs, vessel-mounted access points, buoy relays and UAV platforms to cover users at sea and ground [3,10,30]. Traditional spectrum management strategies in such environments follow either licensed allocations (e.g., LTE/5G bands) [31] or unlicensed access (e.g., Wi-Fi hotspots) [32], but both face severe challenges in dense and heterogeneous maritime scenarios. Licensed bands are scarce and tightly regulated, while unlicensed bands often suffer from congestion and unpredictable interference. Unlike terrestrial cellular systems, where dense deployment enables frequent reuse of frequencies, maritime environments exhibit large coverage areas, irregular topologies, and mobility-driven dynamics that exacerbate spectrum scarcity [33,34].
The spectrum allocation problem in DH-MCNs can be formulated as a non-convex optimization problem, where the goal is to assign frequency channels to active users while mitigating interference and ensuring that traffic demands are satisfied [35]. Each user, whether a vessel, UAV, or buoy, requires a minimum data rate subject to a Signal-to-Interference-plus-Noise Ratio (SINR) constraint [19]. Formally, the objective is to maximize the aggregate system throughput (or equivalently the demand satisfaction ratio), subject to resource availability and interference coupling between users. This problem is inherently non-convex due to the mutual interference terms and binary allocation variables, making it NP-hard in general. Exact solutions are computationally prohibitive in dynamic maritime environments, which motivates the use of graph-theoretic abstractions and heuristic methods that provide tractable and scalable approximations.

2.2. Graph Coloring in Wireless Communications

A widely adopted method to capture interference relationships in wireless networks is the interference graph [16,27,28,29]. In this formulation, each vertex represents a DH-MCN user (e.g., vessel user, crew, pedestrian, port office user, UAV user), and an edge connects two vertices if the simultaneous use of the same frequency channel by the corresponding users would cause harmful interference. Specifically, an edge is created if at least one of the two users would fail to meet the required SINR threshold under channel reuse. The frequency allocation problem is then transformed into a graph coloring problem, where each color corresponds to a frequency channel, and adjacent vertices must receive different colors [27]. The objective is to color the graph such that no two adjacent vertices share the same color, while minimizing the total number of colors used or optimizing allocation performance metrics such as throughput or fairness. This representation provides a clear and tractable way of modeling conflicts in dense maritime environments, where user positions and interference patterns evolve rapidly over time.
In classical graph coloring, the graph is assumed to be static, with vertices and edges remaining unchanged, and the problem is to find a valid coloring that minimizes the number of colors (chromatic number) or optimizes resource usage. This approach has been extensively studied in wireless cellular and ad hoc networks [36], offering tractable heuristics for interference management. However, it fails to account for temporal dynamics in networks where user positions, connectivity, and interference evolve continuously. To overcome this, dynamic graph coloring can be adopted, where the graph can change over time as nodes move or as new interference relationships appear. Despite progress, existing methods typically assume simplified mobility patterns or homogeneous nodes (e.g., vehicular networks, same-type transmitters), making them unsuitable for DH-MCNs [33,36]. In such environments, the technical parameters of all transmitters and their resulting channel modeling should be differently treated before applying graph coloring. These limitations highlight the need for a new framework that explicitly integrates the temporal evolution and heterogeneity of interference graphs in heterogeneous and mobile settings.

3. System Model

3.1. Dense and Heterogeneous MCN Architecture

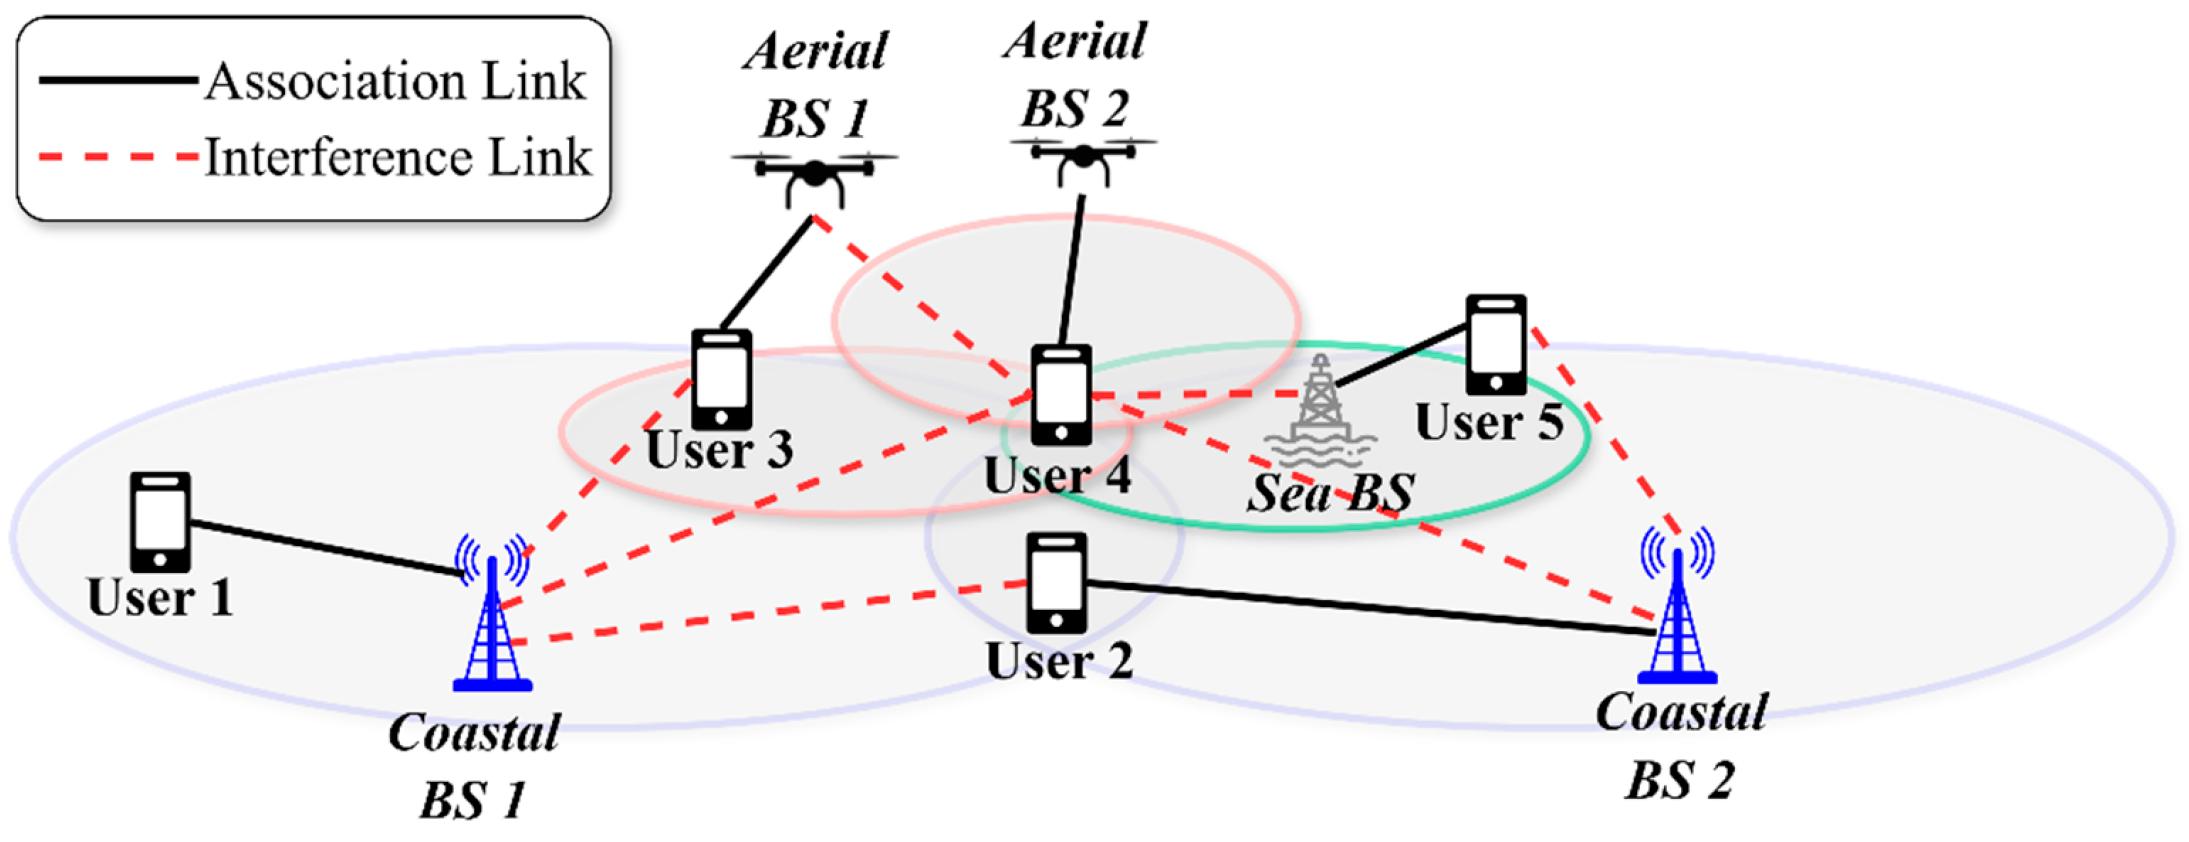
The system considered is a DH-MCN, deployed in a dense port area as illustrated in Figure 1. Considering a congested scenario, the architecture includes multiple types of BSs and heterogeneous users, all coexisting within overlapping coverage zones. Due to the presence of mobility, congestion, and interference coupling, spectrum allocation is modeled as a dynamic and time-varying problem [37], as further detailed in the following subsections.
Without loss of generality, the network consists of three categories of BSs. Coastal BSs (CBSs) are the shore-based terrestrial stations with wide coverage, serving both shore users and nearby vessels. The set of CBSs is denoted as B c . Aerial BSs (ABSs) are drawn from the set B a and considered as UAV-mounted stations providing on-demand flexible coverage to assist congested areas or track vessel clusters. Also, Sea BSs (SBSs) are further assumed to co-exist as buoy-, ship- or offshore-platform-mounted stations extending connectivity into the sea/port zone. The set of SBSs is denoted as B s . Under these notations, the set of all BSs can be represented by B = B c B a B s . The simultaneous operation of all transmitting BSs is dedicated to cover ground and sea users around the port area. We let P b (in Watts) denote the transmitting power of BS b B . Different transmission power levels are considered for each BS type, meaning that P b { P C B S , P A B S , P S B S } , where P C B S , P A B S , P S B S is the power budget (in Watts) of CBS, ABS and SBS, respectively.
User Equipment (UE) classes include shore UEs (i.e., pedestrian or handheld devices in the port area, typically connected to CBSs), sea/vessel UEs (i.e., users inside the vessels, either passengers or sensors supporting vessel operations), and in-office UEs (i.e., stationary users inside port facilities with high-capacity demands). The set of users is defined as U = U s h U v U i n , where U s h , U v , U i n represent shore users, vessel users, and in-office users, respectively. The demand of user u at time t is d u t (in Mbps). Without loss of generality, each user may request two types of services, including voice (low-rate, latency-sensitive) and mobile-broadband (MBB) services (high-rate, throughput-oriented).
Each user is associated with one BS through an association link based on received signal strength and demand requirements. Each BS b B maintains a pool K b of Physical Resource Blocks (PRBs), which are allocated to associated users. We assume 5G New Radio (5G-NR) transmission protocol [38], in which the number of available PRBs per BS is computed based on the available total bandwidth B (in MHz) and subcarrier spacing (in kHz) [39]. We denote the serving BS of user u as b u B . Thus, the allocation variable x u , k t notates whether user u U occupies PRB k K b u at time slot t , and can be written as:
x u , k t = 1 , i f   P R B   k K b ( u )   i s   a s s i g n e d   t o   u s e r   u   a t   t i m e   t 0 , o t h e r w i s e
Each BS can serve multiple users, while each user can be served by one BS over a single PRB. When a BS serves a certain UE over a particular PRB, the UE not only receives the wanted signal, but also collects unwanted interference from other BSs transmitting over the same PRB [40]. In Figure 2, we indicatively consider a snapshot of a DH-MCN area with two CBSs, two ABSs and one SBS. Aerial and sea transmitters are deployed around the port to increase capacity at the overcrowded and high-demand area [41]. Given the dense placement of BSs, users located at the overlapping coverage edges experience severe interference from the neighboring transmitters.

3.2. Channel and Interference Models

As mentioned, interference in the DH-MCN arises when multiple users are assigned the same PRB within overlapping coverage zones. At each time slot t , the SINR of user u U served by BS b B over PRB k K b is given by [33]:
S I N R u , k t = P b u , k t g b u , u t 2 σ 2 + v U , v u b B , b b u P b , k t g b , u t x v , k t
where P b , k t is the transmit power of BS b   on PRB k , g b , u t is the channel gain between BS b and user u , and σ 2 denotes the receiver’s thermal noise power. Given the maximum power budget of all BSs, the total power of each BS b B , accumulated over all PRBs, must satisfy the following constraint:
k K b P b , k t P b
The channel gain g b , u t between BS b and user u is defined as [33]:
g b , u t = k K b P L b u , u F b u , u x u , k t
where P L b , u is the path loss component and F b , u is the fading component between BS b and user u . To adopt realistic DH-MCN conditions, we assume different channel coefficients per BS type. Specifically, the path loss is computed as P L b , u t = K b D b , u a b , where D b , u is the Euclidean distance between user u and BS b , K b is a constant, and a b is the path loss exponent of BS b [42]. The latter depends on the propagation environment (i.e., propagation between user and CBS, ABS, or SBS) and has BS-specific values as a b { a C B S , a A B S , a S B S } , where a C B S , a A B S , a S B S is the path loss exponent of CBS, ABS and SBS, respectively. We assume that a C B S > a S B S > a A B S to reflect that (i) CBS-to-UE propagation has the most challenging conditions (due to the buildings around the urban port area), and (ii) ABS-to-UE has the lowest propagation losses (due to the low amplitude of UAVs that serve UEs with direct line-of-sight coverage). In the same logic, BS-specific small-scale fading channel coefficients F b , u are assumed to reflect realistic scatting effects of the propagation. For CBSs, a Rayleigh fading [43] channel F b , u S B S ~ R a y l e i g h is adopted due to the presence of buildings and obstacles around the coastal port area. On the contrary, ABSs and SBSs typically have line-of-sight propagation with users at vessels and, hence, a Rician fading [44] component is considered. Specifically, F b , u A B S ~ R i c i a n K r A B S and F b , u B B S ~ R i c i a n K r B B S , with K r A B S and K r B B S reflecting the Rician K-factors for ABS and BBS, respectively. Also, since users covered by ABSs have stronger line-of-sight than users served by BBSs, we assume that K r A B S > K r S B S because propagation from BBSs may have obstructions from nearby vessels.
Each user must achieve a minimum SINR to satisfy its demand requirement d u t . The instantaneous data rate of user u at time t is computed as [45]:
R u a c h t = B K b u log 2 1 + S I N R u , k t
where R u a c h t is the bitrate (in Mbps) of user u served by BS b u over PRB k , according to the Shannon formula [45]. The first ratio term indicates the bandwidth of a single PRB, derived by dividing the total channel bandwidth B with the number of available PRBs K b . Note that, any pair of users that are served by the same BS cannot occupy the same PRB. Thus, the number of users covered by a single BS cannot exceed the number of available PRBs. However, frequency (or PRB) reuse is feasible for users associated with different BSs. When two interfering links share the same PRB, the SINR of at least one user may fall below the threshold, leading to unsatisfied demand. The achieved bitrate of a certain user depends on the allocated PRB and the achieved SINR. Thus, a user is considered satisfied if R u a c h t d u t .
The interference relationships between users are captured through the interference graph (see Section 4), where vertices correspond to users and edges denote conflicts (i.e., cases where joint PRB allocation violates the SINR constraint). Spectrum allocation (as a traffic steering method) is then reformulated as a graph coloring problem, where each PRB is a color and adjacent vertices must be assigned different colors to guarantee demand satisfaction.

3.3. Mobility and Congestion Models

The DH-MCN topology evolves dynamically due to the heterogeneous mobility of vessels, aerial platforms, and sea BSs. Let r u t = x u t , y u t denote the 2D position of user u at time slot t . Vessel users exhibit continuous motion along predefined port routes or shipping lanes [46]. Without loss of generality, a simplified model for vessel trajectories can be expressed as:
r u t + Δ t = r u t + v u t Δ t
where v u t is the velocity vector of vessel user u at time t , and Δ t denotes the slot duration. Vessel arrivals and departures near port docks induce sharp variations in local user density, leading to temporary demand surges.
Aerial BSs are mounted on UAVs, whose positions are denoted as r a t = x a t , y a t for b B a . Their trajectories are either pre-planned (e.g., circular surveillance around the port perimeter) or dynamically adapted to reinforce congested areas [47]. In this work, we assume that ABSs are concentrated on top of the highest-demand port areas, according to the algorithm presented in [47]. UAV repositioning causes time-varying interference footprints, since coverage zones overlap intermittently with coastal and sea BSs. Similarly, SBSs mounted on buoys experience drift caused by sea currents, modeled as a slow stochastic perturbation of their nominal positions [48], as reflected by:
r s t + Δ t = r s t + e b t
where e b t is a small random displacement vector for b B s .
For all users in the DH-MCN, we assume a random walk model [49] with low velocity (1–3 m/s). Congestion is formally defined at the level of each BS. Let U b t = { u U : b u = b } denote the set of users associated with BS b at time t . Since each user occupies a single PRB, a congestion event occurs when the number of active users exceeds the available PRBs, which means | U b t | > | K b | .

4. Moving Colorable Graphs: Concept and Optimization

4.1. Definition of MCGs and Optimization Problem

At any given time slot t , the interference relationships among active users in the DH-MCN can be represented by a conflict graph G t = U t , E t , where U t is the set of active users (vertices), and E t is the set of interference-induced conflict edges. Each vertex u U t corresponds to a user requesting a PRB allocation, and an edge u , v E t indicates that users u and v cannot simultaneously occupy the same PRB because at least one would experience an unsatisfied demand. This means that an edge u , v E t in the interference graph indicates that R u ach t < d u t or R v ach t < d v t if the two users occupy the same PRB. Formally, the conflict condition is written as:
u , v E t k K such   that min { R u ach k , t , R v ach k , t } < min { d u t , d v t }
While G t captures the instantaneous interference structure, it provides only a static snapshot of the network. In a dynamic maritime environment, where user mobility and varying congestion continuously reshape interference patterns, it is necessary to explicitly model the temporal evolution of the conflict graph and the association of PRBs to users. We therefore define the MCG G c t as a time-varying colored version of the graph G t so that the interference conflicts are mitigated and the users’ demands are satisfied. The purpose of the MCG abstraction is to provide a unified spatiotemporal framework that allows the spectrum allocation problem to be reformulated as a dynamic graph-coloring process, where the goal is to track and update feasible allocations as the conflict topology evolves.
In this setting, a color represents a unique PRB index k K b . Hence, coloring the graph G t corresponds to assigning PRBs to users so that no two adjacent vertices share the same color. We define, for each time slot t , the color (or PRB) of vertex u as k u t K b . At each time slot t , the goal is to determine a coloring vector C t = k 1 t , k 2 t , , k U t t . Hence, the final MCG problem for traffic steering is formally defined as a dynamic optimization task over a time horizon T = { 1 ,   2 ,   ,   T } :
max C t t = 1 T u U t 1 { R u ach t d u t }
s . t .           ( C 1 )   k u t k v t , u , v E t , t ,   ( C 2 )   b B k K b P b , k t P b , u U ( C 3 )   R u a c h t d u t ,   u U ( C 4 )   u U t x u , k , k K b ( u ) , b B ( C 5 )   b B k K b x u , k t = 1 , u U t
The objective function in (9) aims to maximize the total number of satisfied users across all time slots within the considered time horizon. At each time slot t , the indicator function 1 { R u ach t d u t } evaluates whether the achieved rate R u ach t of user u meets or exceeds its target demand d u t . The maximization is performed with respect to the coloring vector C t , which defines the PRB (color) assigned to each user. This formulation therefore seeks a sequence of feasible PRB allocations that jointly maximize demand satisfaction while respecting interference, power, and resource constraints at every time slot.
Constraint (C1) enforces the graph coloring rule, ensuring that any two users connected by an edge in the conflict graph G t are assigned different PRBs. Constraint (C2) limits the total transmission power per BS, preventing the aggregated PRB power budget from exceeding the maximum available power P b . Constraint (C3) guarantees QoS satisfaction, requiring that the achievable rate of every active user meets its instantaneous demand. Constraint (C4) ensures exclusive PRB occupancy, such that each PRB at a BS can be allocated to at most one associated user at a time. Finally, (C5) enforces unique resource assignment per user, ensuring that every user occupies exactly one PRB in each time slot. Overall, problem (9) formalizes the MCG optimization as a time-coupled dynamic graph coloring task that evolves with the topology. The solution defines the optimal PRB-color mapping that maximizes network-wide demand satisfaction while maintaining interference-free allocations and power feasibility across all BSs.

4.2. Tutorial Perspective

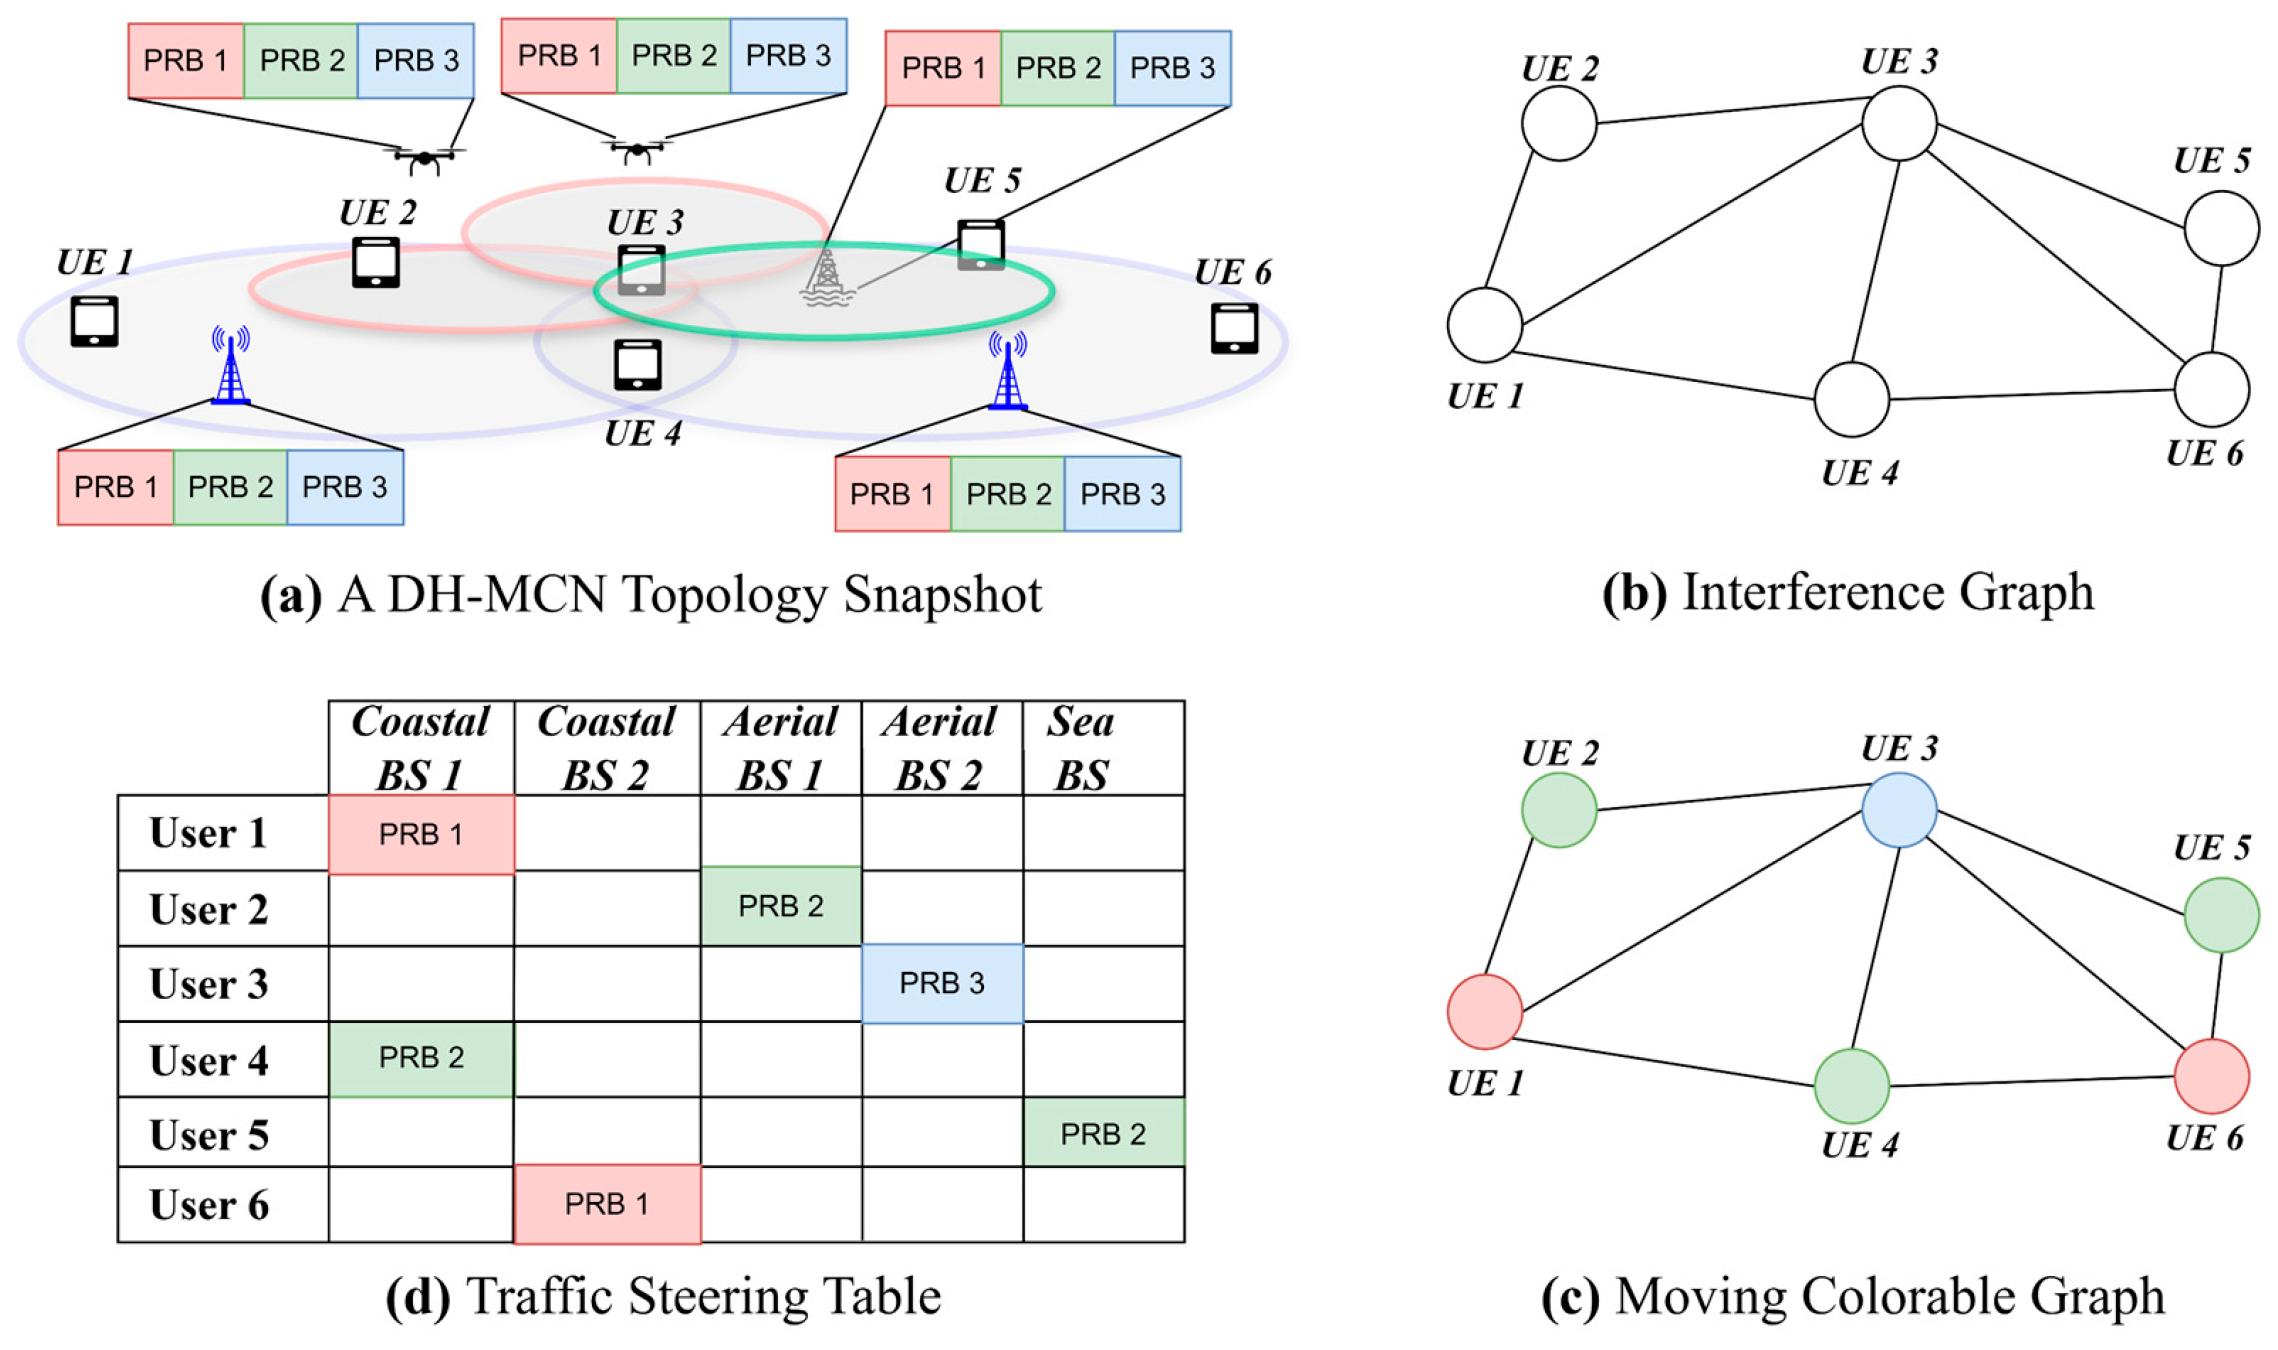
To illustrate how the static frequency assignment problem becomes dynamic under the MCG paradigm, consider the example depicted in Figure 3, which demonstrates traffic steering and PRB allocation in a DH-MCN for a single network snapshot. Figure 3a shows a portion of the maritime port area with six active users (UE 1–6) associated with coastal, aerial, and sea base stations. Each BS operates over three available PRBs, shown as colored resources (red, green, blue). Due to overlapping coverage areas, several users are located at interference boundaries where multiple BSs transmit simultaneously on the same PRBs.
The corresponding interference graph, shown in Figure 3b, represents each user as a vertex, while an edge between two vertices indicates that the respective users cannot be assigned the same PRB because at least one would violate its demand requirement.
From this graph, the system derives the MCG of Figure 3c, where each color corresponds to a distinct PRB. Vertices sharing the same color are users operating on identical PRBs without violating SINR constraints, whereas adjacent vertices always differ in color to avoid mutual interference. Figure 3d summarizes the same allocation as a traffic steering table, which lists the selected BS and PRB for each user. This table demonstrates that feasible colorings directly translate into valid resource allocation decisions satisfying both association and interference constraints.
While Figure 3 captures a single static snapshot, real DH-MCNs are inherently dynamic. Figure 4 provides a conceptual view of this temporal evolution. At the initial time instance t 0 , the MCG reflects the interference relations among the six users according to their current positions and BS associations. As users’ positions change, vessels move, UAVs reposition, or buoy relays drift, the interference topology changes. As such, new edges appear and others disappear, requiring the graph to be partially recolored to preserve feasible PRB assignments. These incremental transformations demonstrate the time-varying nature of MCGs, where each graph G c t 0 evolves smoothly into G c t 1 and G c t 2 , enabling the system to adapt spectrum allocation to network mobility.

4.3. Handling Non–Fully Colored Graphs

In dense or severely congested network conditions, the interference graph G t may not be fully colorable within the available PRB set K [27,29]. This occurs when the chromatic number χ G t (i.e., the minimum number of distinct colors required to color all vertices without conflicts) exceeds the number of available PRBs ( χ G t > | K | ) [27]. In such cases, no feasible assignment exists that satisfies all users simultaneously, and certain vertices must remain uncolored, representing temporarily unsatisfied users. This phenomenon typically appears during peak congestion, when interference density is high, or when the number of users grows beyond the system’s instantaneous spectrum capacity.
To mitigate the effects of non–fully colored graphs, several policies can be adopted to ensure a suboptimal coloring, usually by relaxing the constraints in (9) [50]. Without loss of generality, here we consider the following:
  • Priority-Based Partial Coloring [50]: Each user u U t is assigned a weight w u t proportional to its service class or demand urgency. Voice services correspond to low-throughput and delay-sensitive traffic (e.g., VoIP, safety signaling). Typical throughput requirements range between 64–256 kbps, but they demand high reliability and priority. MBB services, on the other hand, represent high-throughput, delay-tolerant applications (e.g., video streaming, data upload/download, IoT data aggregation). Their throughput demands typically range between 2–5 Mbps depending on the service tier, but they can tolerate moderate delay and controlled interference fluctuations. Weights reflect the urgency or criticality of the service and influence the order in which vertices are colored during the MCG-based allocation. Hence, we consider the following formulation:
    w u t = w H ,             i f   d u t   i s   V o i c e w L ,             i f   d u t     i s   M B B
    where w H > w L are the weight of Voice and MBB users. The coloring algorithm then prioritizes vertices with higher weights, ensuring that critical services such as voice or safety-related links are preserved, while low-priority MBB users may be temporarily deferred. Based on (9), the objective thus becomes to maximize the weighted satisfaction ratio:
max C t t = 1 T u U t w u t 1 { R u ach t d u t }
In this formulation, if the number of available PRBs is insufficient, high-priority (voice) users retain their assignments, while low-priority (MBB) users may remain temporarily uncolored or be served under relaxed SINR conditions

5. Proposed Graph-Based Algorithm

5.1. Workflow

Problem (9) is inherently non-convex due to the discrete nature of the coloring variables and the nonlinear coupling introduced by the SINR expressions in R u a c h t , defined in (5). The binary allocation indicators x u , k t and the conflict constraints (C1) transform the feasible space into a combinatorial one, while the SINR term involves fractional interference dependencies that make the rate function neither convex nor concave in the decision variables. As a result, the optimization problem cannot be solved optimally, and only sub-optimal solutions may be found, especially under high congestion. Moreover, the equivalence between the PRB assignment and graph coloring implies that finding an optimal coloring satisfying all constraints is NP-hard, since the chromatic number of the conflict graph is unknown and must be approximated. Consequently, practical solutions rely on heuristic or greedy algorithms that aim for near-optimal dynamic colorings with tractable computational complexity.
The proposed solution approach for problem (9) (and the objective function in (11)) is based on a dynamic graph-coloring algorithm that operates iteratively over time, following the evolution of the MCGs. As abstracted in Figure 5, the proposed algorithmic workflow is summarized as follows:
Phase I—Initialization and Environment Setup: At the beginning of the simulation horizon, the DH-MCN environment is initialized by loading the system parameters, including the positions of BSs, the set of active users U 0 , the available PRBs K b for each BS b B , and the transmit power budgets P b . The channel coefficients g b , u 0 are computed using the adopted propagation model, and the corresponding SINR values S I N R u , k 0 are derived for all candidate user–PRB pairs. The priority weights w u 0 are also assigned according to the user service type (Voice or MBB).
Phase II—Temporal Iteration Loop: For every time slot t = 1 ,   2 , , T , the algorithm updates the system state and executes the following steps:
  • Step 1 (Topology and Channel Update): User and BS positions are updated according to the corresponding mobility models (see Section 3.3). The path-loss and small-scale fading parameters are recalculated, and new SINR values are estimated based on (2).
  • Step 2 (Interference Graph Construction): Using the updated SINR values and user demands d u t , the conflict graph G t is built by connecting each user’s pair u , v   according to (8). Each vertex u carries an associated weight w u t to indicate its service priority.
  • Step 3 (Graph Coloring/PRB Assignment): The graph-coloring stage constitutes the core of the proposed MCG-based allocation mechanism and is presented in detail in Algorithm 1 of Section 5.2. The outcome is the final allocation of PRBs to users in the form of a traffic steering table (see Figure 3d).
  • Step 4 (Performance Evaluation and Re-coloring Check): After the coloring step, the achieved rates R u a c h t are evaluated. Users not satisfying their demand are recorded, and the overall Demand Satisfaction Ratio (DSR) is updated as:
    DSR t = 100 % U t u U t m i n { R u a c h t , d u t } d u t
If the network topology between consecutive time slots changes only slightly (i.e., few edges differ between G t and G t 1 , the algorithm performs incremental re-coloring, reusing most of the previous assignments to minimize resource reconfiguration.
  • Step 5 (MCG Update): The resulting colored graph G c t is appended to the sequence G = G c 1 , , G c T , forming the Moving Colorable Graph representation of the network evolution.
Phase III—Termination: At the end of the observation window, the algorithm outputs the full set of color assignments vector C t , the temporal sequence of satisfaction ratios is stored.

5.2. Graph Coloring Algorithm

The pseudocode of the proposed Weighted MCG-Based Graph Coloring Procedure is presented in Algorithm 1. Given the constructed conflict graph and the set of available PRBs, the objective is to assign one PRB (color) to each user so that adjacent users in G (t) do not share the same PRB. The algorithm proceeds in two main phases:
Initial Unweighted Coloring: The algorithm first attempts to color the graph without considering user priorities, following a greedy order based on vertex degree (i.e., users with the highest number of conflicts are colored first) [27]. This step aims to cover as many users as possible under interference constraints, maximizing the instantaneous satisfaction ratio.
Priority-Based Recoloring: If, after the first phase, some users remain uncolored, a priority-based recoloring process is triggered [50]. The conflict graph is reconstructed with priority weights w u ( t ) determined by the service type in (10). The vertices are then sorted in decreasing order of w u ( t ) , ensuring that voice users are colored first. Remaining PRBs are subsequently assigned to the remaining MBB users if feasible. In this way, critical low-throughput and latency-sensitive voice users maintain service continuity, while non-critical MBB users may temporarily (during a few time slots) experience partial satisfaction.
Algorithm 1. Weighted MCG-Based Graph Coloring Procedure
Inputs: Conflict graph G ( t ) ; PRB set K ; Demands d u ( t ) , SINR values SIN R u , k ( t ) ; service type S u { voice , MBB } , selective_reuse ∈ {TRUE, FALSE} %optional flag
% ------Initial Unweighted Coloring------
1:  Initialize all users as uncolored: k u t , u U t
2:  Sort vertices by descending degree in G (t)
3:  for each user u in sorted order do
4:      for each PRB k K do
5:          if k is not used by any neighbor v then
6:              Assign PRB k to user u: k u t k
7:              break
8:          end_if
9:      end_for
10:  end_for
11:  Identify uncolored users U u n t = { u U t : k u t = }
     % ------Priority-Based Recoloring (if needed)------
12:  if  U u n t > 0  then
13:       Assign weights w u t = w H for voice users, w L for MBB users
14:       Reconstruct  G (t) with weighted vertices
15:       Sort vertices in descending w u t
16:       for each user u in sorted order do
17:           for each PRB k K do
18:               if k is not used by any higher-priority neighbor v  then
19:                   Assign PRB k to user u: k u t k
20:                   break
21:               end_if
22:          end_for
24:       Identify remaining uncolored users U u n ( 2 ) t
         % ------Optional Selective Reuse------
25:       if selective_reuse = TRUE and | U _un2(t)| > 0 then
26:           for each uncolored user u U u n ( 2 ) t  do
27:               for each PRB k ∈ K do
28:                   if (k unused in B S ( u ) ) and (∀ v using k R v a c h , n e w t d v t  then
29:                      Assign PRB k to user u: k u t k
30:                      mark u as “partially satisfied”
31:                      break
32:                   end_if
33:               end_for
34:           end_for
35:       end_if
36:  end_if
37:  Compute  DSR t using (12)
38:  return coloring vector C ( t ) , U u n t , U u n ( 2 ) t
Evidently, the proposed weighted MCG-based Graph Coloring algorithm operates in two main phases plus one optional, namely (i) an unweighted greedy coloring followed by (ii) a priority-based recoloring and, optionally, includes (iii) a third selective reuse phase for uncolored users. During the first phase (lines 1–11), each user is assigned a feasible PRB from the PRB set using a greedy traversal of the conflict graph. This phase aims to maximize the total number of initially served users by minimizing intra- and inter-BS conflicts. In the second phase (lines 12–24), a weighted recoloring is triggered when uncolored users remain after the initial pass. Each vertex is assigned a weight according to its service class (voice or MBB), and vertices are resorted by descending weight. This ensures that high-priority (voice) users are recolored first, preserving QoS guarantees under limited spectrum conditions. The optional block (lines 25–35) introduces the Selective Reuse mechanism, which can be activated by setting selective_reuse = TRUE. In this phase, any remaining uncolored users are reconsidered for PRB allocation through controlled reuse of existing PRBs, provided that two safety constraints are simultaneously satisfied (line 28). If these conditions hold, the PRB is assigned to the uncolored user and the user is marked as partially satisfied, reflecting a degraded but nonzero service state. This optional mechanism, although it introduces an extra delay, effectively extends spectrum utilization under congestion while maintaining QoS for already served users.
Overall, the three variants of MCG defined in Algorithm 1 represent incremental design stages that address different operational goals in DH-MCNs. Unweighted Coloring stage emphasizes baseline interference avoidance, while Priority-based Recoloring MCG adds QoS-aware priority mechanisms inspired by service differentiation in maritime safety communication standards. Finally, Selective Reuse-enabled MCG introduces controlled reuse motivated by spectrum reuse principles in interference-limited heterogeneous networks. These three variants enable deployment flexibility while providing a consistent comparison of allocation strategies within a unified MCG framework.

5.3. Complexity Insights

By default (selective_reuse = FALSE), this algorithm maintains linear complexity per time slot, approximately O U t K , since each user attempts at most one feasible PRB search across its neighborhood. This is because each user performs at most one scan of all PRBs, this scan remains linear per time slot, as both the degree-sorting and neighborhood lookups are bounded by the small, fixed number of PRBs per BS. By separating the unweighted greedy pass and the priority-based recoloring, the algorithm achieves a balanced trade-off, since it first seeks to maximize the number of served users (coverage objective), and then ensures service continuity for voice users under spectrum scarcity (QoS objective).
When selective_reuse = TRUE, an additional reuse check is performed for each remaining uncolored user, involving potential interference tests against users in other BSs already using the same PRB. In the worst case (dense interference graph), this adds an extra factor proportional to the number of inter-BS reuse candidates, leading to a quasi-quadratic term O U t K + O U u n 2 t K N c o n f , where U u n ( 2 ) U ( t ) is typically small (only uncolored users) and N c o n f is the average number of conflicting neighbors per user. In practice, since selective reuse is applied only to a limited subset of users, the overall runtime remains near-linear with moderate overhead, while significantly increasing the achieved DSR. Overall, the inclusion of the Selective Reuse block provides a tunable balance between computational cost and spectral efficiency. When disabled, the algorithm preserves lightweight linear complexity suitable for real-time MCG updates. When enabled, it allows for dynamic PRB reuse decisions that improve user satisfaction under severe congestion, at the expense of slightly higher (but still tractable) complexity.

6. Numerical Results

6.1. Simulation Setup

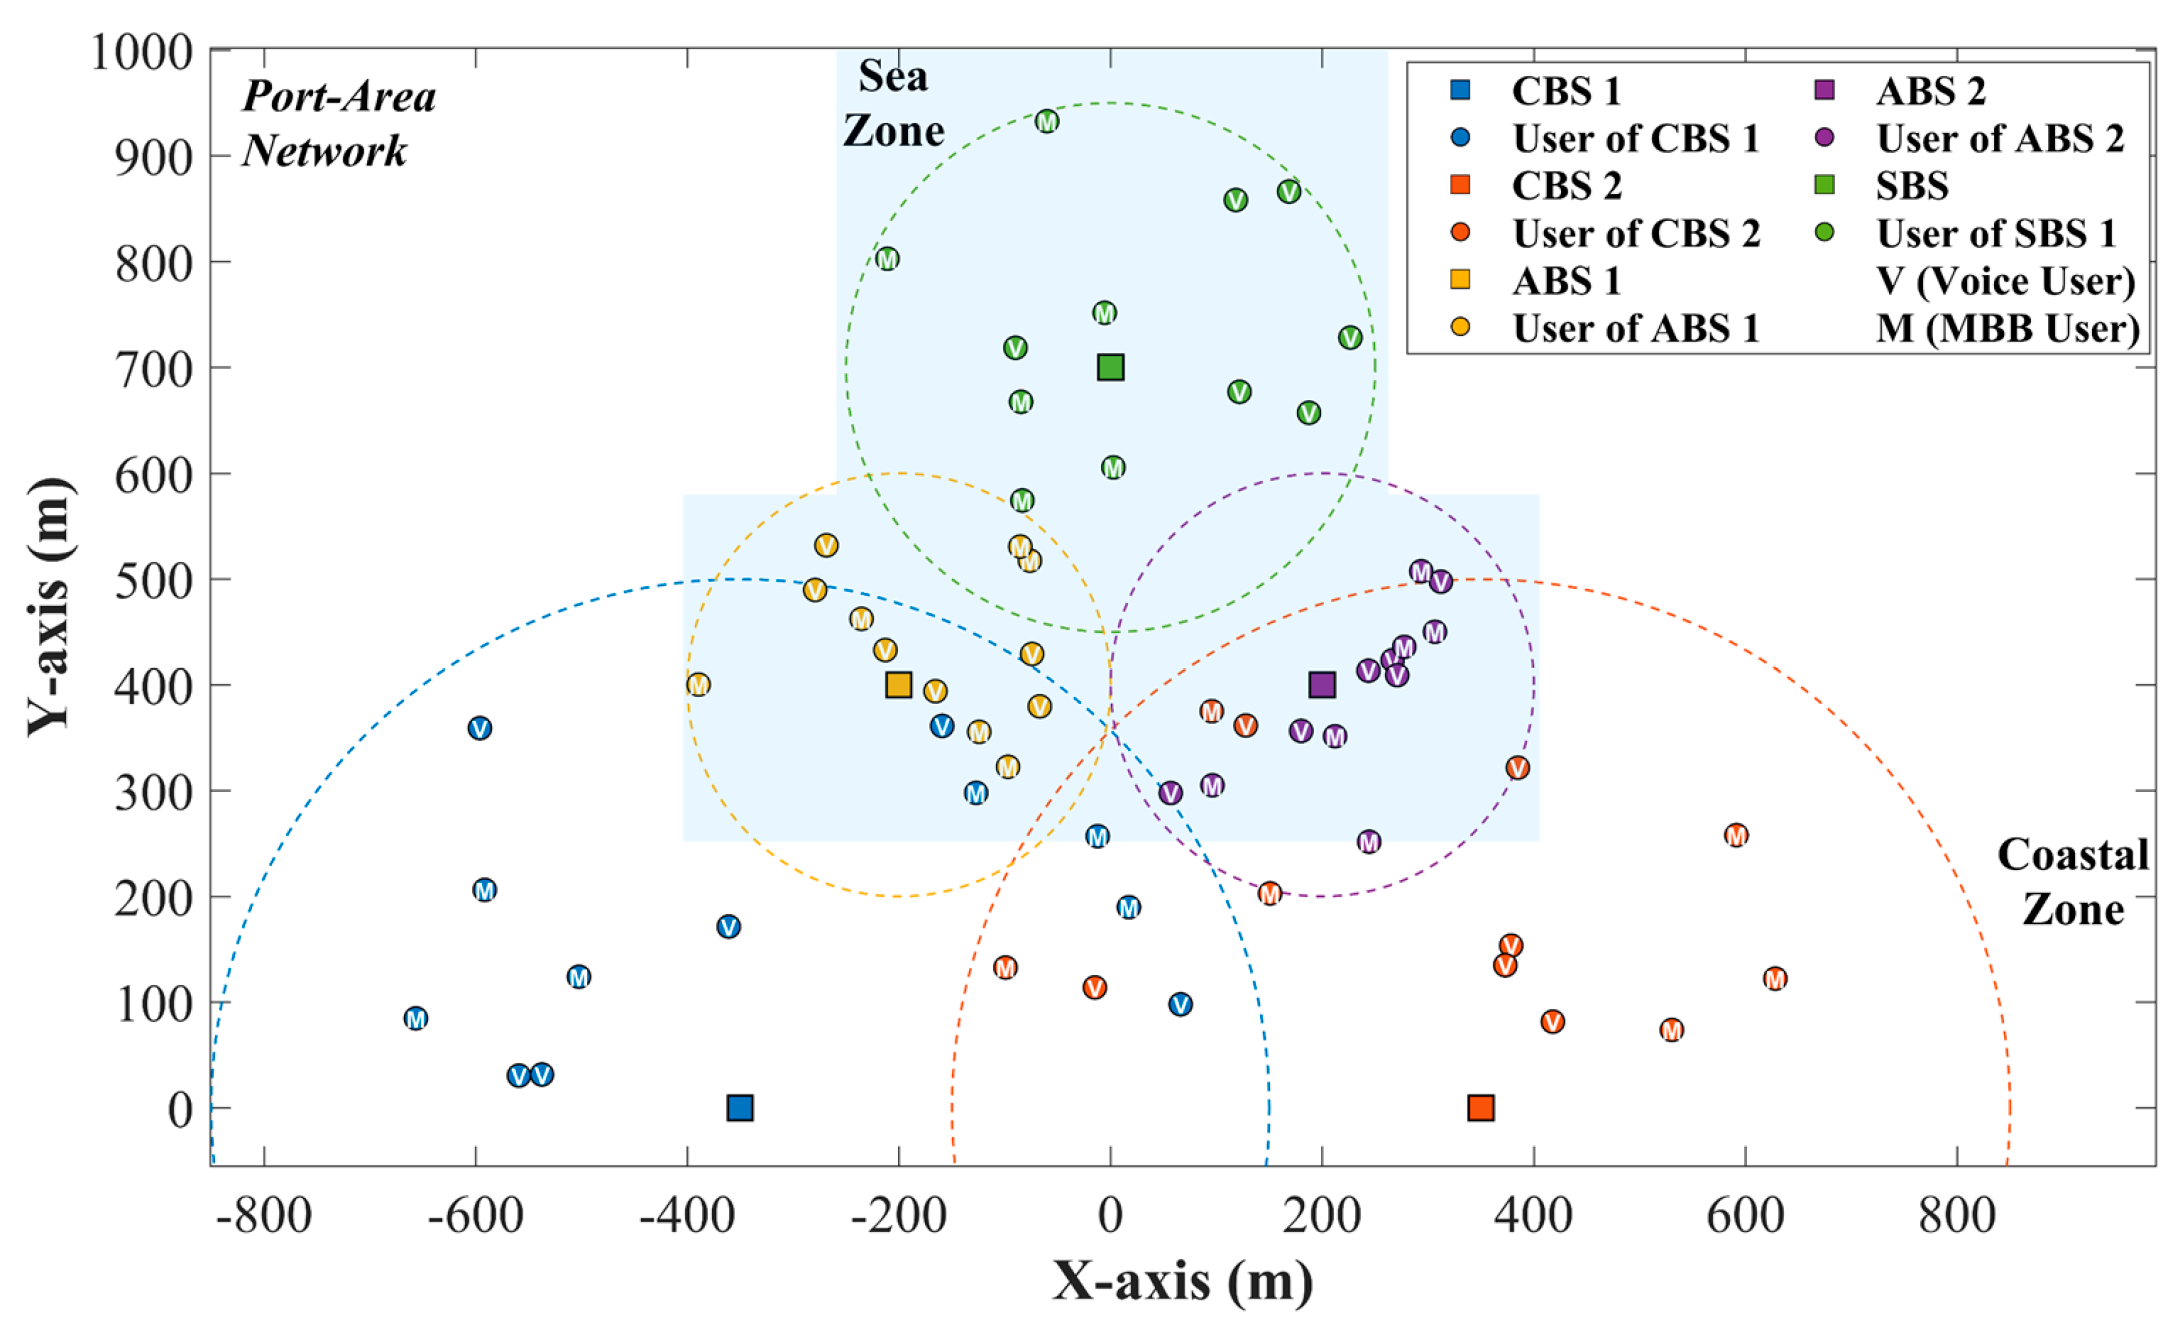
The simulation environment considers a heterogeneous terrestrial–sea–UAV network composed of five BSs serving users located across a port-area with coastal and sea zones, as illustrated in Figure 6. The topology consists of two CBSs deployed on land near the port area, two ABSs positioned above the sea–port interface, and one SBS providing offshore coverage. These BSs cooperatively form a multi-tier DH-MCN supporting heterogeneous traffic demands over a shared 5 MHz system bandwidth (5G NR communication technology). The two CBSs have wide coverage radii of 500 m to emulate coastal macro-cells, ABSs cover 200 m radius each to serve near-shore traffic, and the SBS extends 250 m for offshore service. The resulting topology clearly distinguishes the Coastal and the Sea Zone, where circular regions denote BS coverage and users are labeled as V (voice) or M (MBB).
The simulation evolves over N e p = 100 episodes, each comprising T = 100 time slots. At each episode, users are randomly placed within BSs coverage areas and move for 100 consecutive time slots. Users’ and BS positions are updated at the beginning of each time slot based on the mobility models presented in Section 3.3. The overall bandwidth is subdivided into a set of PRBs (available per BS) computed according to 5G numerology μ = 1 [39]. This corresponds to a 30 kHz sub-carrier spacing. Guard bands of 0.25 MHz are reserved on each side, resulting in a total of C = 12 available PRBs per BS (the precise number depends on the numerology and guard bands). Each PRB has a bandwidth of 360 kHz.
By default, the total number of users is 60, all reusing the same pool of PRBs under harmful interference conditions. Voice users request a fixed-rate demand of 256 kbps, while MBB users request 3 Mbps [51]. Per BS, 50% of users are voice type and 50% are MBB type, giving a balanced mix of QoS-sensitive and throughput-intensive traffic. The channel model accounts for diverse propagation conditions across tiers (see Section 3.1). CBSs adopt an urban macrocell profile with path-loss exponent α C B S = 2.7 , while ABSs follow a line-of-sight air-to-sea model with α A B S = 2.2 . The SBS uses a maritime close-in model with α S B S = 2.5 . Rician fading is considered for the ABS and SBS links with respective K -factors of 8 dB and 6 dB, while Rayleigh fading applies to CBS channels. Per-PRB transmit powers are configured as 0.1 W for CBSs, 0.01 W for ABSs [52], and 0.01 W for the SBS [53]. To calculate the SINR from (2), thermal noise at the receiver is modeled at −104 dBm. All parameters set for the simulation environment are tabulated in Table 1. For the rest of the sections, we assume these default values, unless we state explicit parameter modifications to evaluate their impact on traffic steering performance.

6.2. Performance Under Varying Demand and Conflict Intensity

This subsection investigates the sensitivity of the proposed MCG–based traffic steering framework to changes in traffic composition, specifically the balance between Voice and MBB users. The ratio of Voice/MBB demand directly affects both the number of service requirements and the potential interference relationships among users. Therefore, it provides a direct measure of conflict intensity in DH-MCNs. To this end, five user distributions were tested, namely {90%/10%, 80%/20%, 70%/30%, 60%/40%, 50%/50%}, where the first percentage denotes the portion of Voice users and the second corresponds to MBB users. For each configuration, 100 independent episodes were executed, each running a series of 100 sequential time slots. In every episode, users were randomly deployed following the network topology of Figure 6, the MCG was constructed, and three algorithmic variants of the proposed framework were applied for PRB assignment, all derived from Algorithm 1:
  • Unweighted Coloring-based MCG (UW-MCG): corresponds to lines 1–11 of Algorithm 1. All users are treated equally, and PRB allocation follows a degree-based greedy procedure without considering service heterogeneity. This baseline seeks to maximize coverage without QoS awareness.
  • Priority-Based Recoloring MCG (PR-MCG): includes the weighted recoloring phase (lines 12–24 of Algorithm 1). Higher weights are assigned to Voice users so that the algorithm prioritizes their allocation when spectrum contention arises (i.e., uncolored users exist), ensuring service continuity under congestion.
  • Selective Reuse-enabled MCG (SR-MCG): extends PR-MCG by activating the selective-reuse option (lines 25–35 of Algorithm 1). Uncolored users may reuse PRBs already assigned to other BSs, provided this reuse does not degrade the originally satisfied users. This variant increases spectral efficiency by exploiting interference-tolerant reuse.
At the end of each episode (and for each MCG algorithm variant), we compute the (i) total number of conflicts (as the number of graph edges in the interference graph), (ii) total outage (as the percentage of users remained uncolored), and (iii) DSR as defined in (12), which quantifies the percentage of overall demand fulfillment, computed separately for Voice and MBB users. Note that the episode-specific metrics are computed as the mean across time slots. The total number of conflicts reflects the overall interference intensity, or the number of interfering UE pairs (edges) in the MCG, whereas the total outage metric represents the percentage of unserved users per time slot/episode (lower values indicate higher system accessibility).
Figure 7 reports the total conflicts, outage and DSR (averaged across all episodes) as a function of different Voice/MBB ratio combinations. Evidently from Figure 7a, as the share of MBB users increases, the conflict intensity rises due to higher rate requirements and denser PRB reuse, whereas Voice-dominant configurations yield fewer interfering edges. From the total outage scores shown in Figure 7b, UW-MCG exhibits the highest outage, especially in balanced or MBB-heavy conditions, since equal weighting causes contention among high-rate users. PR-MCG significantly reduces outage in Voice-rich setups by prioritizing low-rate services, while SR-MCG achieves the lowest outage (e.g., 2% for the 90%/10% setup) overall by enabling safe reuse of PRBs among non-conflicting BSs. Figure 7c presents the DSR for both Voice and MBB categories, where PR-MCG and SR-MCG maintain enhanced Voice satisfaction (~90%) even under congested conditions, validating the effect of priority weighting. For the PR-MCG scheme, MBB users show reduced DSR in Voice-dominant settings due to spectrum scarcity. However, SR-MCG consistently outperforms the other schemes by recovering partially unsatisfied users through controlled reuse. Overall, these results demonstrate that integrating priority awareness and selective reuse in the MCG framework enhances both spectral utilization and service reliability. The SR-MCG scheme delivers the most balanced performance, sustaining high DSR for Voice traffic while minimizing overall outage as conflict intensity varies.

6.3. Impact of Transmitting Power and PRB Bandwidth

To further assess the adaptability of the proposed MCG-based spectrum allocation framework, we investigate the impact of two critical physical-layer parameters, namely (i) the transmitting power of heterogeneous BSs and (ii) the PRB bandwidth determined by the numerology index μ and the total available channel bandwidth B . These experiments complement the previous analysis on varying demand and conflict intensity, highlighting how power asymmetry and PRB bandwidth influence the achievable DSR under different schemes.
Two independent evaluation passes were conducted. In the first, the PRB bandwidth was fixed to 360 kHz (corresponding to B = 5 MHz, and μ = 1 ), while five power configurations at the BSs were tested: P C B S , P A B S , P S B S {(1, 0.001, 0.001), (0.1, 0.001, 0.001), (0.01, 0.001, 0.001), (0.1, 0.01, 0.01), (0.1, 0.1, 0.1)} (all values in Watts). In the second pass, the power configuration was fixed to P C B S , P A B S , P S B S = (0.1 W, 0.001 W, 0.001 W), and four PRB settings were explored, specifically B W P R B   {360 kHz, 720 kHz, 1440 kHz, 2880 kHz}. For each parameter setting, 100 independent episodes were simulated (as in Section 6.2) with random initial user placements and fixed Voice/MBB user ratio (50%/50%). The solutions of the three MCG algorithm variants were obtained at each time slot.
Figure 8 summarizes the results, separating the outcomes per service type (Voice vs. MBB) and per parameter family (Power vs. PRB Bandwidth). Each subplot reports the mean DSR across 100 episodes and 100 time slots per episode. Figure 8a,b depict the DSR variation with different power combinations for Voice and MBB users, respectively, whereas Figure 8c,d illustrate the DSR under increasing PRB bandwidth settings. From Figure 8a,b, it is observed that increasing the transmit power of auxiliary BSs (ABSs and SBSs) enhances both Voice and MBB satisfaction, with Voice users benefiting more consistently due to their lower demands. However, when CBSs transmit at high power (i.e, 1 W , see blue lines), interference becomes dominant, slightly degrading performance, for both Voice and MBB users. PR-MCG and SR-MCG maintain higher DSR than UW-MCG, confirming the effectiveness of priority weighting and selective reuse in mitigating congestion. From Figure 8c,d, as the PRB bandwidth increases, the capacity per PRB grows, thus enhancing the achievable data rates of all users. Voice users exhibit marginal gains at moderate PRB bandwidth values, while MBB users benefit significantly from larger PRB bandwidth, reflecting their higher throughput demands. Once again, SR-MCG consistently achieves the best trade-off between efficiency and coverage, approaching full satisfaction rates (98% for 2880 kHz PRB bandwidth) when higher PRB bandwidth is combined with balanced transmit powers.

6.4. Benchmarking Against Baselines

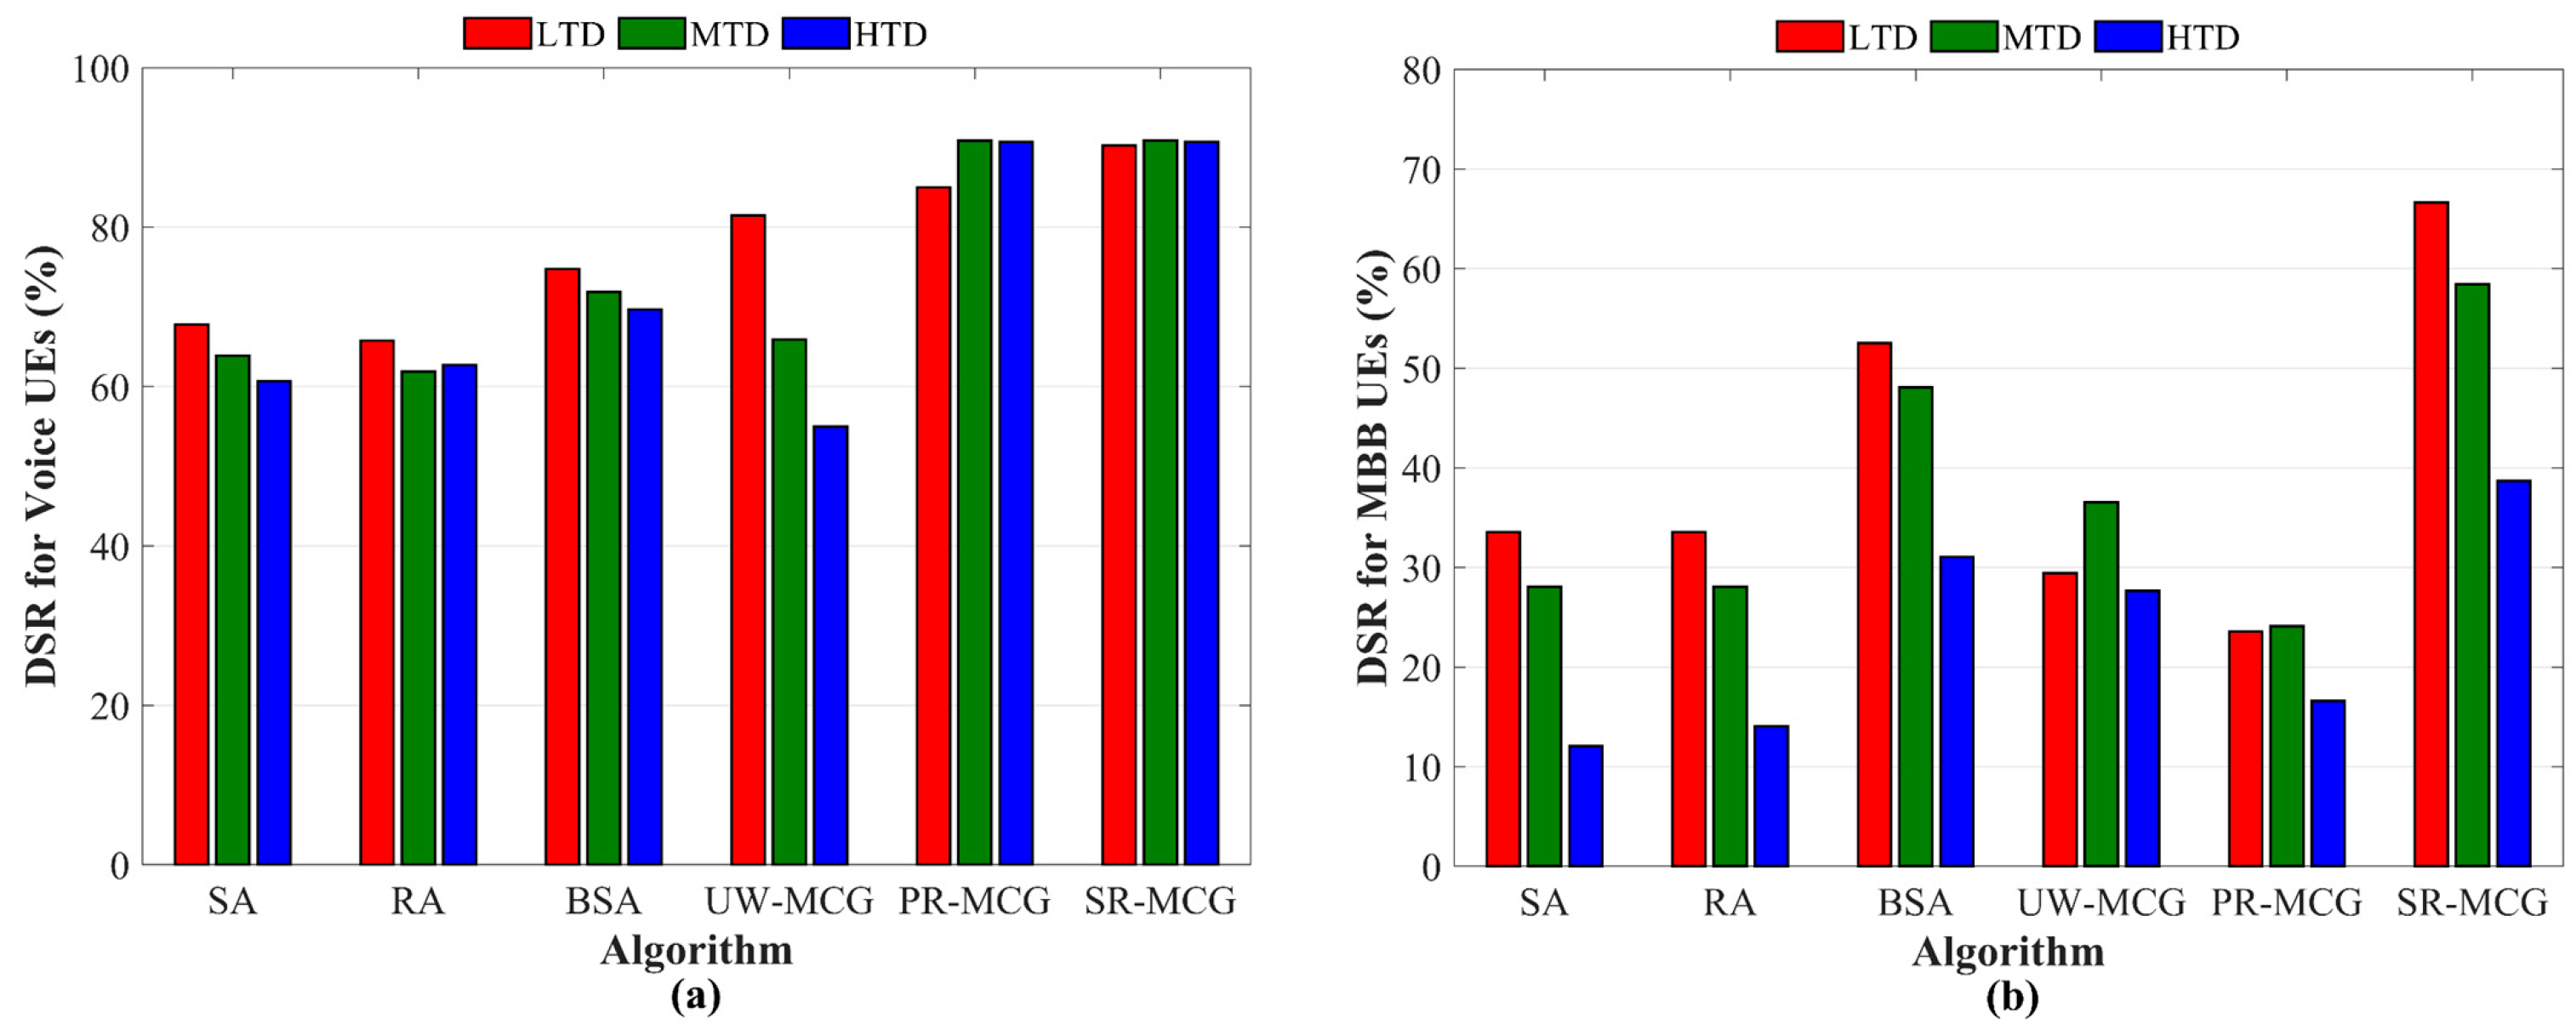
To validate the performance advantages of the proposed MCG framework, we benchmarked its three variants (UW-MCG, PR-MCG, and SR-MCG) against a set of classical baseline schemes. The objective of this analysis is to evaluate how adaptive, conflict-aware coloring strategies compare with traditional static or channel-driven heuristics under different traffic demand levels. All simulations adopt the same DH-MCN architecture described in Section 6.1. Three representative traffic regimes were defined according to the ratio of Voice/MBB users and the target throughput of MBB flows:
  • Low Traffic Demand (LTD): 90% Voice/10% MBB, Demand for MBB d M B B = 1 Mbps.
  • Moderate Traffic Demand (MTD): 70% Voice/30% MBB, d M B B = 2 Mbps.
  • High Traffic Demand (HTD): 50% Voice/50% MBB, d M B B = 3 Mbps.
Each scenario was executed over 100 independent episodes, with random user positions per episode, and all algorithms sharing identical initialization and channel conditions. The evaluation metric of each algorithm was the average DSR across episodes, calculated separately for Voice and MBB users. Apart from the three MCG algorithm variants, the following allocation policies were compared:
  • Static PRB Allocation (SA): Each BS assigns PRBs sequentially (user 1 occupies PRB 1, user 2 occupies PRB 2, and so on), without interference awareness.
  • Random PRB Allocation (RA): Each BS randomly assigns available PRBs among its associated users, avoiding intra-cell reuse.
  • Best Signal-based PRB Allocation (BSA): Users are sorted by received signal strength and allocated PRBs greedily, favoring high-SNR links.
Figure 9 presents the average DSR values obtained for Voice and MBB users under the three traffic regimes (LTD, MTD, HTD). In Figure 9a, all schemes maintain high DSR values for Voice users, with performance gradually improving from SA/RA/BSA to the MCG-based methods. The unweighted UW-MCG already enhances interference isolation through graph coloring, while PR-MCG further boosts Voice reliability under heavy congestion due to its explicit priority weighting. SR-MCG consistently achieves near-optimal satisfaction (above 90%) even in the high-demand regime, confirming the benefits of selective reuse. In contrast, Figure 9b reveals larger performance differences for MBB users, whose higher rate requirements exacerbate resource scarcity. Static and random allocations (SA, RA) yield low DSR (below 35%) under MTD/HTD due to uncoordinated PRB assignment. SR-MCG outperforms all the baselines in all traffic regimes, highlighting the framework’s ability to balance fairness and efficiency through conflict-aware resource reuse. Importantly, BSA exhibits achieves the second-highest DSR for MBB users because it exploits the channel quality by prioritizing users with stronger received signals, thereby maximizing individual throughput of MBB users. Overall, the benchmarking confirms that SR-MCG dynamic coloring substantially outperforms conventional PRB allocation heuristics, providing both interference resilience and demand satisfaction across diverse load conditions.

6.5. Theoretical Justification of MCG Superiority over Baselines

The superiority of MCG-based spectrum allocation over static and greedy heuristics arises from its graph-theoretic approach. Static allocation ignores conflict graph structure, which in dense DH-MCNs leads to frequent PRB collisions proportional to the average conflict degree D ¯ . Greedy heuristics make locally optimal decisions but cannot minimize the chromatic number χ G , often generating deadlocks when high-degree nodes compete for the same PRB. In contrast, the MCG formulation ensures that PRB assignment always respects graph degeneracy ordering, which bounds χ G D + 1 , where D is the maximum vertex degree. PR-MCG further introduces vertex weights, preventing starvation of service-priority users. Finally, SR-MCG expands the feasible allocation space by allowing controlled reuse under SINR constraints, effectively reducing the chromatic number of the interference graph while maintaining feasibility. These properties theoretically explain the improved DSR trends observed in the simulation results.

6.6. Assumptions and Potential Limitations

Although the proposed MCG framework demonstrates stable performance under dense maritime deployments, it is subject to several practical limitations. First, the conflict graph construction assumes slot-level synchronization among BSs, which may not hold in fully distributed deployments with asynchronous PRB updates. However, distributed graph maintenance is a promising direction for future work. Second, the MCG relies on channel gain information evaluated at each time slot, and therefore unpredictable maritime effects such as wave-induced fading, UAV drift, and shadowing from docked vessels may introduce CSI staleness, affecting coloring optimality. Third, the current implementation assumes ideal backhaul signaling for interference awareness, while packet delays could temporarily distort conflict relationships. Finally, the computational burden of graph updates grows with user density, requiring lightweight graph compression techniques for large-scale deployments. These limitations outline future extensions toward robust, distributed, and delay-aware MCG variants.

7. Conclusions and Future Directions

This paper introduced the MCG-based framework as a dynamic modeling and optimization paradigm for spectrum allocation in congested port-area networks under mobility, congestion, and heterogeneity. By extending traditional static graph coloring to time-evolving maritime and port communication networks, MCG algorithm provides a unified way to capture link conflicts, PRB allocations, and selective reuse opportunities across terrestrial, aerial, and sea-based transmitters. Comprehensive simulations in realistic dense port scenarios demonstrated that selective reuse-enabled MCG allocation scheme improves overall throughput and user demand satisfaction compared to baseline static and greedy methods. The results highlight the ability of MCGs to maintain near-optimal performance for both voice and mobile broadband services in highly dynamic conditions.
Future research will focus on integrating MCGs with DRL policies to enable adaptive and experience-driven spectrum management. DRL agents may receive conflict graph features as input state and decide the optimal PRB allocation policy that maximizes long-term objectives, such fairness and satisfaction. Moreover, embedding MCG models into a Network Digital Twin (NDT) environment will facilitate predictive coloring and proactive conflict mitigation. Finally, upcoming work will extend the framework to multi-domain ground–air–sea-satellite networks incorporating satellite links, moving toward holistic spectrum management in next-generation 6G maritime ecosystems.

Author Contributions

Conceptualization, A.G.; methodology, A.G. and S.S.; software, A.G.; validation, S.S.; formal analysis, A.G.; investigation, A.G. and S.S.; writing—original draft preparation, A.G.; writing—review and editing, S.S.; visualization, A.G. All authors have read and agreed to the published version of the manuscript.

Funding

This research received no external funding.

Institutional Review Board Statement

Not applicable.

Informed Consent Statement

Not applicable.

Data Availability Statement

The raw data and code supporting the conclusions of this article will be made available by the authors on request.

Acknowledgments

The authors would like to thank UNITY—6G project partner consortium for their fruitful collaboration and conceptualization on the design of Integrated Terrestrial/Non-Terrestrial Network Model. The UNITY-6G (“Unified Architecture for Open RAN-Enabled Distributed, Scalable and Sustainability-Enhanced 6G Networks”) project is funded by EU HORIZON-JU-SNS-2024 program, under grant agreement No. 101192650.

Conflicts of Interest

The authors declare no conflicts of interest.

Abbreviations

The following abbreviations are used in this manuscript:
ABSAerial Base Station
BSBase Station
BSABest Signal-based PRB Allocation
BWBandwidth
CBSCoastal Base Station
DH-MCNDense Heterogeneous Maritime Communication Network
DRLDeep Reinforcement Learning
DSADynamic Spectrum Access
DSRDemand Satisfaction Rate
MCGMoving Colorable Graph
MCNMaritime Communication Network
MLMachine Learning
PR-MCGPriority-based Recoloring for Moving Colorable Graph
PRBPhysical Resource Block
QoSQuality of Service
RARandom PRB Allocation
SAStatic PRB Allocation
SBSSea Base Station
SINRSignal-to-Interference-plus-Noise Ratio
SR-MCGSelective Reuse-enabled Coloring for Moving Colorable Graph
UAVUnmanned Aerial Vehicles
UEUser Equipment
UW-MCGUnweighted Coloring for Moving Colorable Graph

References

  1. Kapidani, N.; Bauk, S.; Davidson, I.E. Digitalization in developing maritime business environments towards ensuring sustainability. Sustainability 2020, 12, 9235. [Google Scholar] [CrossRef]
  2. Xylouris, G.; Nomikos, N.; Kalafatelis, A.; Giannopoulos, A.; Spantideas, S.; Trakadas, P. Sailing into the future: Technologies, challenges, and opportunities for maritime communication networks in the 6G era. Front. Commun. Netw. 2024, 5, 1439529. [Google Scholar] [CrossRef]
  3. Giannopoulos, A.; Gkonis, P.; Kalafatelis, A.; Nomikos, N.; Spantideas, S.; Trakadas, P.; Syriopoulos, T. From 6G to SeaX-G: Integrated 6G TN/NTN for AI-Assisted Maritime Communications—Architecture, Enablers, and Optimization Problems. J. Mar. Sci. Eng. 2025, 13, 1103. [Google Scholar] [CrossRef]
  4. Alqurashi, F.S.; Trichili, A.; Saeed, N.; Ooi, B.S.; Alouini, M.S. Maritime communications: A survey on enabling technologies, opportunities, and challenges. IEEE Internet Things J. 2022, 10, 3525–3547. [Google Scholar] [CrossRef]
  5. Wei, T.; Feng, W.; Chen, Y.; Wang, C.X.; Ge, N.; Lu, J. Hybrid satellite–terrestrial communication networks for the maritime Internet of Things: Key technologies, opportunities, and challenges. IEEE Internet Things J. 2021, 8, 8910–8934. [Google Scholar] [CrossRef]
  6. Zhang, J.; Wang, M.M.; Xia, T.; Wang, L. Maritime IoT: An architectural and radio spectrum perspective. IEEE Access 2020, 8, 93109–93122. [Google Scholar] [CrossRef]
  7. Li, X.; Feng, W.; Chen, Y.; Wang, C.X.; Ge, N. Maritime coverage enhancement using UAVs coordinated with hybrid satellite–terrestrial networks. IEEE Trans. Commun. 2020, 68, 2355–2369. [Google Scholar] [CrossRef]
  8. Li, X.; Feng, W.; Chen, Y.; Wang, C.X.; Ge, N. UAV-enabled accompanying coverage for hybrid satellite–UAV–terrestrial maritime communications. In Proceedings of the 2019 28th Wireless and Optical Communications Conference (WOCC), Beijing, China, 9–10 May 2019; pp. 1–5. [Google Scholar] [CrossRef]
  9. Fahim, P.; Rezaei, J.; Jayaraman, R.; Poulin, M.; Montreuil, B.; Tavasszy, L. The physical Internet and maritime ports: Ready for the future? IEEE Eng. Manag. Rev. 2021, 49, 136–149. [Google Scholar] [CrossRef]
  10. Yau, K.L.A.; Peng, S.; Qadir, J.; Low, Y.C.; Ling, M.H. Towards smart port infrastructures: Enhancing port activities using information and communications technology. IEEE Access 2020, 8, 83387–83404. [Google Scholar] [CrossRef]
  11. Haidine, A.; Aqqal, A.; Dahbi, A. Communications backbone for environment monitoring applications in smart maritime ports—Case study of a Moroccan port. In Proceedings of the 2021 IEEE Asia-Pacific Conference on Geoscience, Electronics and Remote Sensing Technology (AGERS), Casablanca, Morocco, 22–24 September 2021; pp. 136–140. [Google Scholar] [CrossRef]
  12. Armitage, S.; Awty-Carroll, K.; Clewley, D.; Martinez-Vicente, V. Detection and classification of floating plastic litter using a vessel-mounted video camera and deep learning. Remote Sens. 2022, 14, 3425. [Google Scholar] [CrossRef]
  13. Abdel-Malek, M.A.; Azab, M. UAV-fleet management for extended NextG emergency support infrastructure with QoS and cost aware. Internet Things 2024, 25, 101043. [Google Scholar] [CrossRef]
  14. Shivkumar, S.; Supriya, M. A framework for fleet management using IoT and predictive analytics. In Proceedings of the 2024 15th International Conference on Computing Communication and Networking Technologies (ICCCNT), Kanpur, India, 3–5 June 2024; pp. 1–6. [Google Scholar] [CrossRef]
  15. Kalafatelis, A.S.; Nomikos, N.; Giannopoulos, A.; Alexandridis, G.; Karditsa, A.; Trakadas, P. Towards predictive maintenance in the maritime industry: A component-based overview. J. Mar. Sci. Eng. 2025, 13, 425. [Google Scholar] [CrossRef]
  16. Tan, L.; Feng, Z.; Li, W.; Jing, Z.; Gulliver, T.A. Graph coloring-based spectrum allocation for femtocell downlink interference mitigation. In Proceedings of the 2011 IEEE Wireless Communications and Networking Conference (WCNC), Cancun, Mexico, 28–31 March 2011; pp. 1248–1252. [Google Scholar] [CrossRef]
  17. Zhang, J.; Yang, J.; Zhang, Y.; Zhang, S. A dynamic spectrum allocation algorithm for a maritime cognitive radio communication system based on a queuing model. Information 2017, 8, 119. [Google Scholar] [CrossRef]
  18. Wu, R.; Li, Z.; Xie, Z.; Liang, X. Intelligent spectrum sharing strategy for integrated satellite–maritime heterogeneous mobile networks. IEEE Trans. Veh. Technol. 2023, 73, 6780–6794. [Google Scholar] [CrossRef]
  19. Giannopoulos, A.; Spantideas, S.; Trakadas, P. Spatiotemporal graph coloring for frequency assignment in spectrum-constrained ground–air–sea networks. Authorea Prepr. 2025. [Google Scholar] [CrossRef]
  20. Falk, J.; Zebelein, C.; Haubelt, C.; Teich, J. A rule-based quasi-static scheduling approach for static islands in dynamic dataflow graphs. ACM Trans. Embed. Comput. Syst. 2013, 12, 74. [Google Scholar] [CrossRef]
  21. Hasan, M.K.; Ismail, A.F.; Islam, S.; Hashim, W.; Pandey, B. Dynamic spectrum allocation scheme for heterogeneous network. Wirel. Pers. Commun. 2017, 95, 299–315. [Google Scholar] [CrossRef]
  22. Hao, D.D.; Zou, S.H.; Cheng, S.D. Heuristic algorithms for dynamic spectrum assignment in open spectrum system. J. Softw. 2008, 19, 479–491. [Google Scholar] [CrossRef]
  23. Kaur, A.; Kumar, K. A comprehensive survey on machine learning approaches for dynamic spectrum access in cognitive radio networks. J. Exp. Theor. Artif. Intell. 2022, 34, 1–40. [Google Scholar] [CrossRef]
  24. Li, F.; Shen, B.; Guo, J.; Lam, K.Y.; Wei, G.; Wang, L. Dynamic spectrum access for Internet of Things based on federated deep reinforcement learning. IEEE Trans. Veh. Technol. 2022, 71, 7952–7956. [Google Scholar] [CrossRef]
  25. Giannopoulos, A.E.; Spantideas, S.T.; Zetas, M.; Nomikos, N.; Trakadas, P. FedShip: Federated over-the-air learning for communication-efficient and privacy-aware smart shipping in 6G communications. IEEE Trans. Intell. Transp. Syst. 2024, 25, 19873–19888. [Google Scholar] [CrossRef]
  26. Xi, Y.; Yeh, E.M. Distributed algorithms for spectrum allocation, power control, routing, and congestion control in wireless networks. In Proceedings of the 8th ACM International Symposium on Mobile Ad Hoc Networking and Computing (MobiHoc 2007), Montréal, QC, Canada, 9–14 September 2007; pp. 180–189. [Google Scholar] [CrossRef]
  27. Welsh, D.J.; Powell, M.B. An upper bound for the chromatic number of a graph and its application to timetabling problems. Comput. J. 1967, 10, 85–86. [Google Scholar] [CrossRef]
  28. Wang, Y.; Wei, Z.; Du, H.; Sang, L.; Yang, D. A spectrum allocation algorithm based on bandwidth matching and interference avoidance in cognitive radio networks. In Proceedings of the 2012 IEEE 23rd International Symposium on Personal, Indoor and Mobile Radio Communications (PIMRC), Sydney, Australia, 9–12 September 2012; pp. 950–955. [Google Scholar] [CrossRef]
  29. He, Q. A new model of spectrum allocation based on the graph theory. In Recent Advances in Computer Science and Information Engineering; Qian, Z., Cao, L., Su, W., Wang, T., Eds.; Springer: Berlin/Heidelberg, Germany, 2012; Volume 4, pp. 675–681. [Google Scholar] [CrossRef]
  30. Salani, W.; Mfupe, L.; Oyerinde, O.O. Dynamic spectrum allocation in the C-band: An overview. Appl. Sci. 2025, 15, 9762. [Google Scholar] [CrossRef]
  31. Jo, S.W.; Shim, W.S. LTE-maritime: High-speed maritime wireless communication based on LTE technology. IEEE Access 2019, 7, 53172–53181. [Google Scholar] [CrossRef]
  32. Villegas, E.G.; Ferré, R.V.; Paradells, J. Frequency assignments in IEEE 802.11 WLANs with efficient spectrum sharing. Wirel. Commun. Mob. Comput. 2009, 9, 1125–1140. [Google Scholar] [CrossRef]
  33. Ibrahim, A.M.; Chen, Z.; Wang, Y.; Eljailany, H.A.; Ipaye, A.A. Optimizing V2X communication: Spectrum resource allocation and power control strategies for next-generation wireless technologies. Appl. Sci. 2024, 14, 531. [Google Scholar] [CrossRef]
  34. Giral, D.; Hernández, C.; Rodríguez-Colina, E. Spectrum decision-making in collaborative cognitive radio networks. Appl. Sci. 2020, 10, 6786. [Google Scholar] [CrossRef]
  35. Guan, Z.; Wang, Y.; He, M. Deep reinforcement learning-based spectrum allocation algorithm in Internet of Vehicles discriminating services. Appl. Sci. 2022, 12, 1764. [Google Scholar] [CrossRef]
  36. Basloom, S.; Nazar, A.; Aldabbagh, G.; Abdullah, M.; Dimitriou, N. Resource allocation using graph coloring for dense cellular networks. In Proceedings of the 2016 International Conference on Computing, Networking and Communications (ICNC), Kauai, HI, USA, 15–18 February 2016; pp. 1–5. [Google Scholar] [CrossRef]
  37. Yuan, L.; Qin, L.; Lin, X.; Chang, L.; Zhang, W. Effective and efficient dynamic graph coloring. Proc. VLDB Endow. 2017, 11, 338–351. [Google Scholar] [CrossRef]
  38. Lien, S.Y.; Shieh, S.L.; Huang, Y.; Su, B.; Hsu, Y.L.; Wei, H.Y. 5G new radio: Waveform, frame structure, multiple access, and initial access. IEEE Commun. Mag. 2017, 55, 64–71. [Google Scholar] [CrossRef]
  39. Lin, X.; Li, J.; Baldemair, R.; Cheng, J.F.T.; Parkvall, S.; Larsson, D.C.; Werner, K. 5G new radio: Unveiling the essentials of the next generation wireless access technology. IEEE Commun. Stand. Mag. 2019, 3, 30–37. [Google Scholar] [CrossRef]
  40. Al Kassir, H.; Giannopoulos, A.; Spantideas, S.; Trakadas, P.; Xylouris, G.; Kourtis, M.A.; Zaharis, Z.D. Automated end-to-end AI/ML lifecycles for radio management in 6G networks. In Proceedings of the 2024 IEEE Future Networks World Forum (FNWF), Montreal, QC, Canada, 9–11 October 2024; pp. 365–371. [Google Scholar] [CrossRef]
  41. Wang, J.; Zhou, H.; Li, Y.; Sun, Q.; Wu, Y.; Jin, S.; Xu, C. Wireless channel models for maritime communications. IEEE Access 2018, 6, 68070–68088. [Google Scholar] [CrossRef]
  42. Kurt, S.; Tavli, B. Path-loss modeling for wireless sensor networks: A review of models and comparative evaluations. IEEE Antennas Propag. Mag. 2017, 59, 18–37. [Google Scholar] [CrossRef]
  43. Tan, C.C.; Beaulieu, N.C. On first-order Markov modeling for the Rayleigh fading channel. IEEE Trans. Commun. 2000, 48, 2032–2040. [Google Scholar] [CrossRef]
  44. Wang, L.C.; Liu, W.C.; Cheng, Y.H. Statistical analysis of a mobile-to-mobile Rician fading channel model. IEEE Trans. Veh. Technol. 2008, 58, 32–38. [Google Scholar] [CrossRef]
  45. Lee, S.; Park, S. Mobility-assisted digital twin network optimization over industrial Internet of Things. Appl. Sci. 2024, 14, 9090. [Google Scholar] [CrossRef]
  46. Alam, M.M.; Spadon, G.; Etemad, M.; Torgo, L.; Milios, E. Enhancing short-term vessel trajectory prediction with clustering for heterogeneous and multi-modal movement patterns. Ocean Eng. 2024, 308, 118303. [Google Scholar] [CrossRef]
  47. Lyu, J.; Zeng, Y.; Zhang, R.; Lim, T.J. Placement optimization of UAV-mounted mobile base stations. IEEE Commun. Lett. 2016, 21, 604–607. [Google Scholar] [CrossRef]
  48. Tadokoro, K.; Kinugasa, N.; Kato, T.; Terada, Y.; Matsuhiro, K. A marine-buoy-mounted system for continuous and real-time measurement of seafloor crustal deformation. Front. Earth Sci. 2020, 8, 123. [Google Scholar] [CrossRef]
  49. Xiong, H.; Yao, L.; Tan, H.; Wang, W. Pedestrian walking behavior revealed through a random walk model. Discret. Dyn. Nat. Soc. 2012, 2012, 405907. [Google Scholar] [CrossRef]
  50. Chow, F.; Hennessy, J. Register allocation by priority-based coloring. In Proceedings of the 1984 SIGPLAN Symposium on Compiler Construction, Montreal, QC, Canada, 17–22 June 1984; pp. 222–232. [Google Scholar] [CrossRef]
  51. Sroka, P.; Kułacz, Ł.; Janji, S.; Dryjański, M.; Kliks, A. Policy-based traffic steering and load balancing in O-RAN-based vehicle-to-network communications. IEEE Trans. Veh. Technol. 2024, 73, 9356–9369. [Google Scholar] [CrossRef]
  52. Che, Y.; Zhao, Z.; Luo, S.; Wu, K.; Duan, L.; Leung, V.C.M. UAV-Aided Wireless Energy Transfer for Sustaining Internet of Everything in 6G. Drones 2023, 7, 628. [Google Scholar] [CrossRef]
  53. Williams, Z.; Soto Calvo, M.; Lee, H.S.; Aljber, M.; Jeong, J.-S. A Low-Cost Autonomous Multi-Functional Buoy for Ocean Currents and Seawater Parameter Monitoring, and Particle Tracking. J. Mar. Sci. Eng. 2025, 13, 1629. [Google Scholar] [CrossRef]
Figure 1. A three-tier Dense Heterogeneous MCN (DH-MCN) urban area with two Coastal BSs, two Aerial BSs and one Sea BS.
Applsci 15 11560 g001
Figure 2. Association and interference links in DH-MCN. Due to dense placement around the port, coverage edge users experience the accumulated interference from all adjacent transmitters.
Applsci 15 11560 g002
Figure 3. Demonstration of Traffic Steering in DH-MCN using MCGs for a given snapshot. Available PRBs 1-3 correspond to colors read, green and blue, respectively.
Applsci 15 11560 g003
Figure 4. Time evolution of MCGs across three different DH-MCN snapshots. Colors correspond to different PRB assignments.
Applsci 15 11560 g004
Figure 5. Proposed generalized Traffic Steering algorithmic framework for DH-MCNs based on MCGs. Step 0 initializes the environment, while steps 1–7 loop over time slots. At each time slot, a PRB allocation vector is derived in the form of a colored graph.
Applsci 15 11560 g005
Figure 6. An example of the simulation DH-MCN topology considered in this section for a single snapshot. BS-user associations are color-coded, with users being uniformly distributed within the Port-Area Network. ABSs and BBS are activated in the Sea Zone to extend the coastal coverage of the CBSs. ‘V’ and ‘M’ letters inside user circles denotes the requested service (Voice and MBB).
Applsci 15 11560 g006
Figure 7. Performance results of three MCG variants (UW-MCG, PR-MCG, SR-MCG) for varying traffic demand distributions. (a) Total number of interference graph edges as a function of different Voice/MBB user ratios. (b) Outage (percentage of unserved users) as a function of different Voice/MBB user ratios for the three MCG schemes. (c) DSR as a function of different Voice/MBB user ratios for the three MCG schemes, computed separately for Voice and MBB services.
Applsci 15 11560 g007
Figure 8. Performance results of three MCG variants (UW-MCG, PR-MCG, SR-MCG) for varying physical-layer parameters. (a) DSR (%) of Voice users as a function of different MCG schemes for varying power configurations at the BSs. (b) DSR (%) of MBB users as a function of different MCG schemes for varying power configurations at the BSs. (c) DSR (%) of Voice users as a function of different MCG schemes for varying PRB bandwidth configurations. (d) DSR (%) of MBB users as a function of different MCG schemes for varying PRB bandwidth configurations.
Applsci 15 11560 g008
Figure 9. Performance results of six PRB allocation algorithms (SA, RA, BSA, UW-MCG, PR-MCG, SR-MCG) under three traffic scenarios (LTD, MTD, HTD). (a) DSR (%) of Voice users as a function of different schemes for three traffic scenarios. (b) DSR (%) of MBB users as a function of different schemes for three traffic scenarios.
Applsci 15 11560 g009
Table 1. Default Topology and System Simulation Parameters.
ParameterSymbolValueParameterSymbolValue
Number of BS c | B | 5CBS 1,2 positions-(−350, 0) m, (350, 0) m
CBSs, ABSs, SBS( | B c | , | B a | , | B s | ) (2, 2, 1)ABS 1, 2 positions-Dynamic [47]
Number of Episodes N e p 100SBS position-(0, 700) m (small drifts)
Time slots T 100CBS radius R C B S 500 m
Total Bandwidth B 5 MHzABS radius R A B S 200 m
Numerology μ 1SBS radius R S B S 250 m
Guard band B g u a r d 0.25 MHzCBS transmit power P C B S 1 W
PRBs per BS K b 12ABS transmit power P A B S 0.1 W
Number of users | U | 60SBS transmit power P S B S 0.1 W
Voice/MBB user ratio-50%/50%Noise power σ 2 −104 dBm
Voice demand d v o i c e 256 kbpsPath-loss exponents ( a C B S , a S B S , a A B S ) (2.7, 2.2, 2.5)
MBB demand d M B B 3 MbpsRician K-factors K r A B S ,   K r S B S (8 dB, 6 dB)
Disclaimer/Publisher’s Note: The statements, opinions and data contained in all publications are solely those of the individual author(s) and contributor(s) and not of MDPI and/or the editor(s). MDPI and/or the editor(s) disclaim responsibility for any injury to people or property resulting from any ideas, methods, instructions or products referred to in the content.