Abstract
Accurate source locating and a complete data catalogue of the seismic network are the prerequisites for seismic analysis methods to identify coal burst risks. Comprehensively understanding the spatial characteristics of source location errors and seismic data integrity is a key insight for optimising seismic networks and enhancing monitoring performance. Based on the monitored seismic data in a burst-prone longwall, this study develops two novel methodologies, Emulation-Testing-based Source Locating Accuracy Analysis (ETSLA) and Probability-based Magnitude of Completeness (PMC) method, to evaluate seismic monitoring performance in underground coal mines. The results indicate that ETSLA effectively quantifies vector characteristics of source location errors, revealing anisotropic error distributions in the studied longwall. The PMC method presents significant differences among geophones regarding their wave detection capacities. The detection probability of the seismic network for the events demonstrates progressive enhancement with increasing energy magnitude. In field practice, ETSLA can correct misclassified burst types by accounting for location errors. The Seismic data inferred using the PMC method can retrace missing seismic activity, and the inferred high-energy zones accurately correlate with actual burst damage locations. The study can serve as a reference to enhance the quality of seismic monitoring for precise early warning of coal burst risks.
1. Introduction
A coal burst is a seismic phenomenon that triggers the collapse of coal and rock mass in underground coal mines, leading to the high-speed ejection of debris into roadways and posing a great danger to miners and mining equipment [1]. In recent decades, frequent coal bursts have been reported in most mining countries, such as China, Australia, Poland, the United States, South Africa, etc. [2,3,4,5]. Despite nearly a hundred years of study, coal bursts remain one of the most formidable mining hazards due to their complex occurrence mechanism and the considerable uncertainty surrounding various causation factors, such as tectonic structures, high geo-stress, and unfavourable mining layout.
As a powerful method to identify dynamic rock failure and explore damage mechanisms in underground mines, seismic monitoring has been widely used for coal burst prediction and control. Based on seismology knowledge, multiple seismic analysis methods have been developed to evaluate coal burst risks, such as b-value [6], peak particle velocity [7], source mechanism [8], seismic energy [9], etc., which show encouraging results in mining applications. However, due to unfavourable monitoring environments and complex geological conditions in underground mines, there are still significant deficiencies in seismic monitoring, particularly regarding the accuracy of source location and seismic data completeness. Gibowicz and Kijko [10] reported that the magnitude of source location error falls within the range of 20 to 100 m, contingent upon the quantity of deployed sensors and the seismic network configuration. In the Upper Silesian Coal Basin (USCB) in Poland, the seismic location error for horizontal coordinates is approximately 50 m, whereas it may reach up to 100 m for vertical coordinates [11]. The epicentre error for seismic monitoring systems in mines in Canada and South Africa varies between 4 and 61 m, with an average of 15 to 23 m [12]. Also, in areas such as goafs, coal and rock mass near longwall faces, and fault structures, the proportion of actual seismic events not effectively monitored by the seismic network can be as high as 50% [13]. The monitored seismic dataset struggles to reflect the actual seismic response characteristics of the coal and rock masses in the mining area. Therefore, effectively improving the accuracy of source location and the completeness of seismic datasets is key and a prerequisite for achieving precise coal burst identification.
An unfavourable seismic network layout can significantly compromise the accuracy when locating the source. Due to the influence of underground mining disturbance, geophones of the seismic monitoring system are typically deployed 100–200 m away from the longwall face, making it challenging to cover the complete mining area. Therefore, many scholars focus on optimising the layout of seismic networks to enhance the accuracy of source location. For example, Gong et al. [14] established a genetic algorithm-based model to automatically solve for the minimum location error scheme, which can reduce source location error by up to 230 m. Cong [15] established an objective function for jointly solving the velocity model with multiple sources. He constructed an inversion algorithm based on a layered wave velocity model to achieve accurate source location. Leśniak [16] optimised the seismic network to minimise location errors, showing that the best geophone layout has minimal average errors. For uniaxial geophone monitoring systems, multiple solutions may arise through using arrival-time difference due to the lack of 3D monitored seismic waves. Yongtao et al. [17] established an objective function based on the D-value theory, considering factors such as the probability of seismic events, the importance of the monitoring area, and the feasibility of the network layout to provide a network layout scheme for underground mines. Although the findings mentioned above have laid a solid theoretical foundation for improving the source-locating performance in underground mines, there has not been in-depth research on the anisotropic characteristics of source location errors in the mining area where the network cannot fully envelop, which can be a key factor in the false prediction of coal burst risks. Therefore, comprehensively understanding the precise characteristics of locating errors and specifically optimising the seismic network are key issues for enhancing coal burst prediction performance using seismic analysis methods.
Also, seismic networks used in underground coal mines often faces limitations imposed by the layout of excavations, making it difficult to achieve a uniform detection capacity across the entire region of interest. Areas with poor seismic detection capacity may have an incomplete seismic catalogue, which can cause significant biases in seismic observations, both spatially and temporally, leading to substantial deviations in burst risk evaluation [10,18,19]. In seismology, the magnitude of completeness, mc, is commonly used for evaluating the integrity of the seismic catalogue. It is based on the Gutenberg–Richter law and defined as the minimum magnitude threshold above which all earthquakes in a given region are reliably detected and recorded [20]. Many scholars have studied how to determine mc accurately. For example, Mignan et al. [21] proposed a Bayesian function algorithm to analyse the earthquake number—magnitude curve to determine a reliable minimum completeness magnitude. Godano [22] used statistical methods to obtain an accurate minimum completeness magnitude through the harmonic mean of the earthquake dataset. Much of the research has applied the Gutenberg–Richter law in mine seismology, yielding promising results [6,23]. However, since the Gutenberg–Richter relationship applies to natural earthquakes caused by large-scale tectonics, it is necessary to filter out non-natural earthquakes and noise datasets when calculating the minimum completeness magnitude, which significantly increases the complexity of the analysis. Therefore, some scholars have begun indirectly determining seismic completeness by studying the monitoring capacity of seismic networks. D’Alessandro et al. [24] established a simulated evaluation method for seismic networks to estimate the minimum completeness magnitude through forward modelling of detected seismic waveforms. Cao and Gao [25] described the monitoring efficiency of seismic networks through the signal-to-noise ratio characteristics of seismic waveform signals. Notably, a method called Probability-based Magnitude of Completeness (PMC), developed by Schorlemmer and Woessner [26], can be suitable for complex underground environments. The method utilises historical seismic data to analyse the waveform detection capability of each geophone, considering varying source magnitudes and distances. This enables the calculation of the network’s probability of detecting seismic events at different energy levels. PDE is not limited to sparse seismic data in space and can calculate detection probabilities across the area of interest. Also, as the PDE method focuses on the seismic signal picking ability of geophones and does not follow the Gutenberg–Richter law assumption, seismic events from all types of sources, such as noises and events induced by drilling and blasting, are acceptable for analysis. Therefore, this method has great potential for investigating seismic monitoring quality in underground mines in terms of data integrity.
To comprehensively understand the seismic monitoring performance and provide insights into the seismic network optimisation in underground mines, this paper proposes two new approaches to evaluate the source location accuracy and data completeness. First, Emulation-Testing-based Source Locating Accuracy Analysis (ETSLA) is developed to depict the magnitude and anisotropic characteristics of source location errors in the monitored mining area. This evaluates source-locating accuracy through numerous emulation tests, which can simulate errors in wave arrival pickings and the velocity field in the complex underground monitoring environment. Then, the PMC method is applied in underground mining to calculate the wave detection capacity of geophones and the seismic event detection probability of the seismic network. Two months of seismic data from a burst-prone longwall in a Chinese coal mine are used to demonstrate the two methods. The vector characteristics of source location errors are quantified to demonstrate anisotropic error distributions in the studied longwall. The differences in wave detection capacities among geophones are compared, and the detection probabilities for seismic events with varying energy levels are explored. The potential use of ETSLA and PMC methods for identifying coal burst types and seismic data inference, respectively, is discussed. The outcome of this study can serve as a reference to enhance the quality of seismic monitoring for early warning of precise coal burst risks.
2. Methodology
2.1. Emulation-Testing-Based Source Locating Accuracy (ETSLA) Analysis
During seismic monitoring in underground mines, seismic sources are mainly mislocated due to random location scatters and systematic bias [10,18]. Random location scatter is the source-locating error induced by the manually selected arrival times of seismic waves. The error magnitude depends on the clarity of the waveform and the seismologists’ experience and preference in selecting wave arrivals. Systematic bias is the source-locating error induced by the wave velocity model for seismic locating. In underground environments, geological structures and mining conditions often result in a highly complex wave velocity field that cannot be accurately detected. The difference between the wave velocity model and the actual one can cause source mislocation. Since random location scatters and systematic bias are both inevitable, it is necessary to understand their characteristics, which influence source-locating accuracy.
According to the classical Geiger’s method, if random location scatters and systematic bias are considered, which are assumed to follow the Gaussian distribution, for geophone i, the relationship between the travel time , a source-locating result , and wave velocity () can be represented as
where is the systematic bias, and is the location of the ith geophone. The time residual for the ith geophone can be calculated as
where is the actual arrival time of seismic wave received by the ith geophone, is the occurrence time of the source, and is the random location scatters. An optimised source-locating result can be derived when the sum of squared time residuals of all n available geophones becomes the minimum:
According to Equations (1)–(3), a source-locating result considering random location scatters and systematic bias can be derived. Figure 1 shows a flow chart showing the process of locating a seismic event with errors of location scatter and systematic bias.
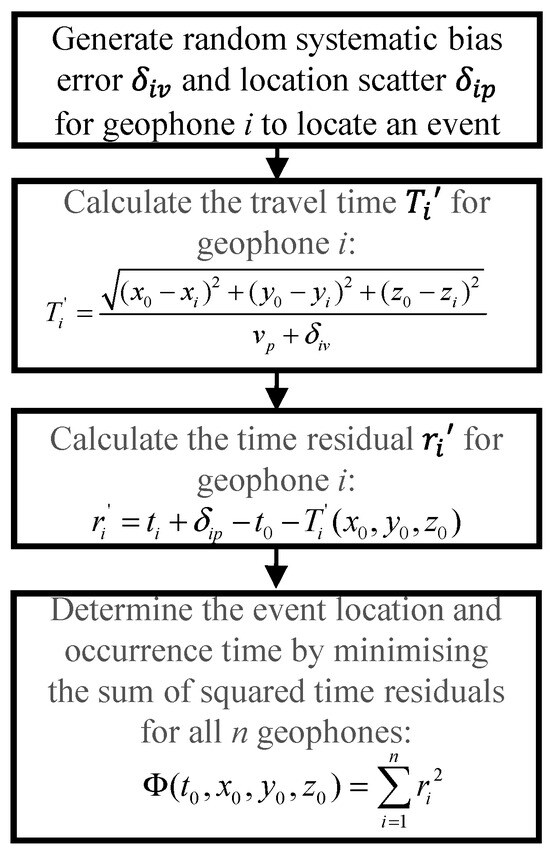
Figure 1.
Flow chart for locating a seismic event with errors of location scatters and systematic bias.
If we continuously mislocate the source by providing a random and , an elliptical distribution of source-locating results will be presented, representing the so-called emulation tests. The size and orientation of the ellipse can demonstrate the magnitude and vector characteristics of the source location error, which is shown in Figure 2. The average location error can also be calculated using the emulation testing results:
where , denote the location of the kth emulation test and is the number of emulation tests.
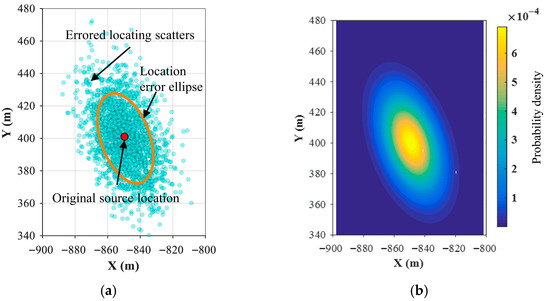
Figure 2.
Location error ellipse of the seismic monitoring system and its probability density distribution: (a) emulation testing results’ distribution; (b) probability density of source location and error ellipse parameters.
2.2. Probability-Based Magnitude of Completeness (PMC) Method
For a single geophone in the seismic network of underground mines, it is assumed that its capacity for detecting a seismic wave is related to the epicentral distance to the seismic event (R) and source energy magnitude (logE), which can be defined in a two-dimensional space:
where is the wave detection capacity, and N+ and N− are the number of detected and undetected seismic events around the geophone, respectively. These events are selected according to the criterion :
Here, M represents an equivalent distance in the epicentral distance–magnitude relationship graph, which is explained in detail by Schorlemmer and Woessner [26]. In Equation (6), ΔM is the energy magnitude difference between the seismic event and the reference point (logE, R). ΔM* is the energy magnitude difference between the seismic event and M*, which is converted by the epicentral distance R based on the distance–magnitude conversion relationship [26].
By using the detection capacity for individual geophones, the probability of detecting a seismic event using m geophones, , can be calculated as
According to Geiger’s source-locating method, a seismic event can only be recorded if it is detected by four or more geophones, which also equals one minus the detecting probability, using no more than three geophones. Therefore, for a seismic event with energy magnitude of logE at location (x, y), its detecting probability can be calculated as
For the target mining area, the detection probability distribution of the seismic network to different energy levels can be derived by dividing the area of interest into grids and calculating for each grid using Equation (8). Figure 3 shows a flow chart for the and calculations.
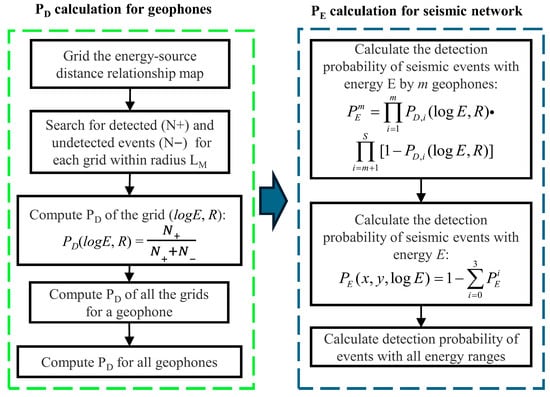
Figure 3.
Flow chart for PD and PE calculation.
Compared to the conventional MC method, the PMC method is not limited to setting a magnitude threshold for a specific complete data catalogue. Instead, it can determine the detection probability of the seismic network across all magnitudes, providing a spatial assessment of the network’s monitoring capability. Additionally, the PMC method relies solely on the feasibility of manual arrival-time selection as the key criterion for evaluating seismic network detection capability, regardless of source type. As a result, this approach effectively removes the confounding effects of noise and human-made seismic events from the datasets, ensuring the objectivity of the analysis. This is an inherent advantage of the PMC method.
3. Site Overview
3.1. Geology and Coal Bursts
The proposed two methods were demonstrated at Mengcun Coal Mine, in the central–western region of the Binchang Mining Area, Shaanxi Province, China, where the mined coal seam is nearly horizontal, with an average thickness of 16.25 m. The target longwall, LW401102, is the second longwall in 401 Panel, where the fully mechanised top-coal caving mining method was used. The longwall is 180 m wide and 1790 m long, and its average mining depth is 700 m. As shown in Figure 4, to the north of LW401102 is a 40 m coal pillar and the tailgate of LW401103, while to the south is a 75 m coal pillar and the LW402101 goaf. The east and west sides are bordered by the main roadways of the 401 Panel.
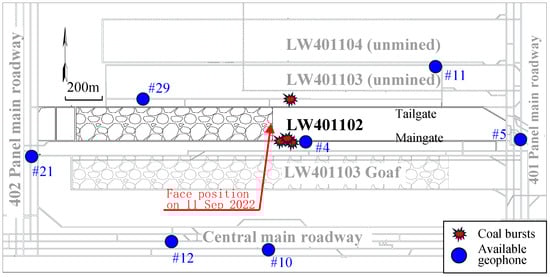
Figure 4.
LW401102 layout, distribution of available geophones, and coal burst damage locations.
Due to the great mining depth, strong burst proneness, and the multi-layered, thick, and hard composite sandstone roof of the coal seam, the mine has experienced frequent coal burst hazards. In September 2022, four coal bursts were reported; three occurred in the LW401102 tailgate within a 50 m range ahead of the longwall face, and one occurred in the LW401103 tailgate within a 100 m range ahead of the longwall face, which is also shown in Figure 4. The coal burst events involved energy ranges from 115 kJ to 347 kJ. Floor heave and anchor mesh cracking were observed in the damaged roadways, which severely impact the normal and safe production of the mine.
3.2. Seismic Monitoring System
The mine is equipped with the Polish SOS seismic monitoring system for the real-time observation of damage and stress conditions of the coal and rock mass. The seismic network has 32 single-component geophones deployed in the mine. Geophones have a response frequency range of 1–600 Hz, a sampling rate of 500 Hz, and a maximum data transmission rate of 1 MB/s. During the LW401102 retreat period, four near-field geophones were installed in the longwall roadways ahead of the face and moved as the longwall advanced, and other far-field geophones were fixed in the surrounding area.
In this study, a total of 6633 monitored seismic events from 1 August to 11 September 2022 in LW401102 were analysed. The distribution of seismic events with different energy magnitudes is shown in Figure 5. Strong seismic events with energies over 10 k were mainly located around the intersection between the longwall face and the two roadways. Seven available geophones were used for seismic monitoring in LW401102 during this period; their layout is shown in Figure 4. Since near-field geophones frequently experience signal interference due to intense mining-induced noise, only Geophone #4, in the maingate ahead of the longwall face, was used as a near-field geophone. The other six geophones, placed more than 600 m from the longwall face, served as far-field geophones. The near-field geophone was used to detect medium–low-energy events, and far-field geophones were used to capture medium–high-energy events. This configuration made it particularly difficult to accurately detect seismic activity in LW401102 during the study period. Figure 6 illustrates both the cumulative event count curve and the energy-level distribution histogram. The distribution deviates from the Gutenberg–Richter power-law function, indicating a notable absence of medium-to-high-energy events in the catalogue.
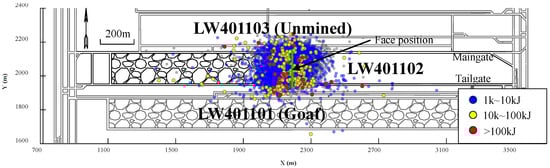
Figure 5.
Distribution of seismic events with different energy magnitudes in LW401102 during August and September 2022.
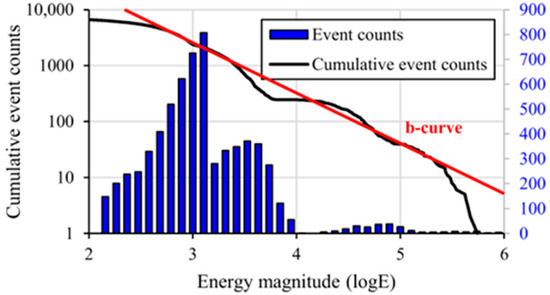
Figure 6.
Event counts distribution of seismic data catalogue in LW401102.
4. Results
4.1. Location Errors Characteristics
Before using the ETSLA method, errors of system bias and random scatter should first be determined. Statistical data in the studied site reveal that about 85% of P-wave arrival picking errors are within ±0.007 s, which is designated as the standard deviation . However, accurately estimating the variations in wave velocity in underground mines is difficult due to factors such as stress conditions and geological complexity, which are specific to each site. Related research indicates P-wave velocity variations can vary from 200–600 m/s to over 2 km/s in different mines [27,28]. In this study, a homogeneous velocity model with values of 3700 m/s is used, and the standard deviation of is set at 200 m/s. To achieve a good balance between accuracy and computational efficiency, 2000 emulation tests were conducted on each 100 m2 grid in the area of interest.
Figure 7 shows the vector characteristics of the source location error in LW401102. Significant differences in magnitude and directions of the source location error are presented in the longwall. The minimum source location error is located in the longwall within 200 m of the longwall face, with horizontal errors ranging from 37.7 m to 40.5 m. In this zone, the long axis of the error ellipse is oriented in the southeast–northwest direction, which indicates that the source location error is greater in the south–north direction than in the east–west direction. However, due to the lack of sufficient geophones to form a seismic network envelope, the zone more than 400 m ahead of the longwall face exhibits extremely high horizontal location errors, with values to from 70 m to 105.3 m. Specifically, the long axis of the location error ellipse in this zone is generally oriented in the southeast–northwest direction. In contrast, the long axis of the error ellipse in the LW401102 goaf is oriented in the northeast–southwest direction, demonstrating a significant anisotropic characteristic of source location error. The key vector characteristics of location error ellipses across different zones arise from variations in geophone coverage patterns. Geophones are evenly distributed in all directions where the major and minor axes of their error ellipses are nearly equal. Conversely, areas with significant differences between these axes often lack sufficient geophone coverage along the major axis. For example, the LW401102 goaf zone has no geophones in the northeast and southwest directions, while zones more than 400 m ahead of the longwall face experience geophone shortages in the southeast and northwest directions.
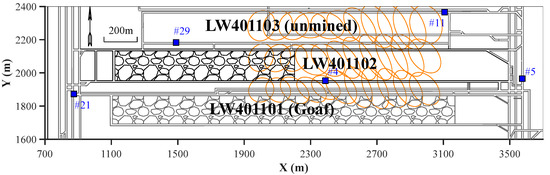
Figure 7.
Distribution of error ellipses for locating seismic sources in LW401102.
Figure 8 illustrates the extreme value range of positioning error variation for the seismic network at different distances ahead of the LW401102 face. It can be seen that the network achieves optimal source-locating accuracy within 200 m behind the goaf area, with errors ranging between 28 and 41 m. Within the 200 m zone ahead of the face, location errors exhibit an initial rise followed by a decline, reaching a minimum of 30 m and a maximum of 50 m. Beyond this 200 m range, the minimum error stabilises at 30–35 m while the maximum error significantly increases to over 70 m. Integrating the results displayed in Figure 7 suggests that such a location discrepancy may stem from insufficient network coverage in the northwest–southeast direction.
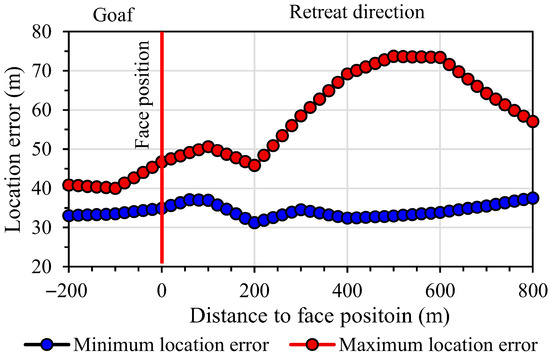
Figure 8.
Minimum and maximum location error around the LW401102 face.
The results indicate relatively low source-locating accuracy and significant vector characteristics of location errors occurred in various regions of LW401102 for the seismic network in Mengcun Coal Mine. These errors are highly likely to lead to substantial deviations in seismic analyses. Compared with the traditional scalar value of location error, the error ellipse can more comprehensively describe the vector characteristics of the source-locating accuracy, providing a reference for optimisation and a data foundation to provide precise seismic early warning of coal bursts.
4.2. Detection Probability Evaluation of Seismic Network Using the PMC Method
4.2.1. Wave Detection Capacity of Geophone ()
Based on the proposed PMC method, the wave detection capacity of each available geophone during the study period was analysed, and the results are shown in Figure 9. As shown in the figure, the complex underground mining environment results in significant differences in the wave detection capacities of geophones at different positions. During the LW401102 retreat, geophones #4, #5, and #10 exhibited a relatively high performance in detecting seismic waves. Geophone #5 had a of over 0.9 for events with logE ≥ 2 occurring within 1500 m, which indicates that the geophone can monitor almost the entire seismic response in the longwall and serves as the primary monitoring geophone (see Figure 9a). The wave detection capacity of Geophone #10 is not as good as that of Geophone #5, which achieved an average of over 0.9 for events with logE ≥ 2 occurring within approximately 850 m (see Figure 9b). A possible reason for this phenomenon could be the attenuation of seismic wave signals and the complex wave velocity field caused by the LW401101 goaf. Although geophone #4 is the closest available geophone to the LW401102 face, it is more susceptible to the noise generated by mining disturbances compared to geophones #5 and #10, which results in the wave detection capacity being significantly influenced by the propagation distance of seismic waves. For seismic events with logE 4–6, the detectable distance ranges of geophone #4 range from 0 to 900 m, with a corresponding decrease from 0.9 to about 0.2. For seismic events with logE = 2–4, the detectable distance of geophone #4 is 0 to 800 m, and the corresponding drops from 0.7 to approximately 0.1 (see Figure 9c).
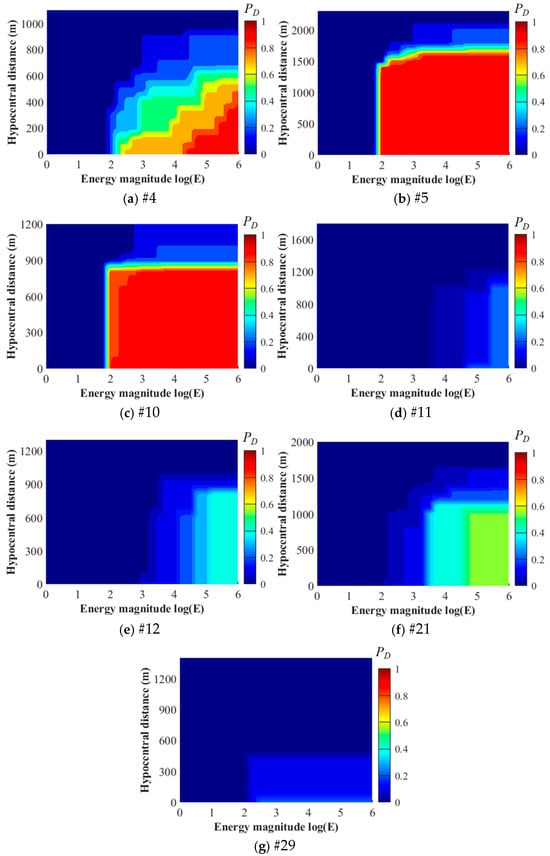
Figure 9.
Wave detection capacity for available geophones around LW401102.
Compared to geophones #4, #5, and #10, geophones #12 and #21, located in the main roadway of the panel, exhibit a significant reduction in wave detection capacity. Geophone #21 has a specific detection capacity for seismic events with logE 3.5–6 occurring within 1100 m, with a width of about 0.4–0.5. Still, it has almost no capacity to detect events with logE ≤ 3.5 (see Figure 9f). Geophone #12 only has the specific capacity to detect seismic events with logE 5–6 occurring within about 900 m, with a width of approximately 0.4 (see Figure 9e). For events with magnitudes of logE 3–4, the of geophone #12 quickly drops to only 0.1–0.3, and it is almost unable to detect events with logE ≤ 3. Geophones #11 and #29, located on the north side of LW401102, also present weak wave detection capacities. The of geophones #11 is only 0.1–0.2 for events with logE 5–6 occurring within 1000 m (see Figure 9d), while the of geophones #29 is only about 0.1 for events with logE = 2–6 occurring within 400 m (see Figure 9g). These results indicate that the distribution of detection probabilities can reflect the comprehensive influence of factors such as source energy, distance, mining-induced noise, propagation path, and even installation method on the geophones. This provides a quantitative description of the wave detection capacity characteristics of geophones at different locations in the mining field.
4.2.2. Event Detection Probability of Seismic Network ()
Based on the results of all available geophones, the detection probability distribution of seismic events with different energy levels in LW401102 during the study period was analysed, and the results are shown in Figure 10. In Figure 10a, a minimal probability for the seismic network is presented to detect events with an energy level of logE 3, which reveals a from 0.1 to 0.2 within a 500 m range ahead of the longwall face and in the LW401101 goaf area. This implies that the seismic network will miss most of the seismic activities at an energy level of logE = 3. Compared to Figure 10a, Figure 10b indicates a significant improvement in the detection of seismic sources at the energy level of logE 4, with a maximum reaching 0.4. The detection probability distribution exhibits a trend of spreading outward from Geophone #4, covering a 200 m range ahead of the longwall face and parts of the goaf adjacent to LW401101. Beyond 200 m ahead of the face, for the sources at the energy level of logE 4, gradually decreases and drops to 0 at about 600 m ahead of the face. This result suggests that although the seismic network has the specific capacity to detect seismic events at the energy level of logE = 4, detection ability remains below half, indicating a relatively high likelihood of missing events. Figure 10c shows that the maximum for seismic events at the logE = 5 energy level further increases to about 0.6, with a distribution pattern similar to that of the logE = 4 level, which spreads outward from Geophone #4. Its detection area covers a 700 m range ahead of the LW401102 face and most of the LW401101 goaf area. For seismic events at the energy level of logE 6, the maximum of the seismic network further increases to 0.7, and the area with the maximum covers a 200 m range ahead of the LW401102 face (see Figure 10d). Also, the 0.7 detection probability coverage in the LW401102 tailgate and LW401101 goaf is greater than that in the LW401102 maingate, which indicates that the seismic network can more comprehensively monitor high-energy events in these areas.
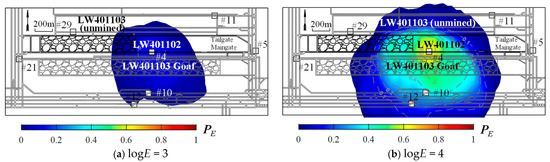
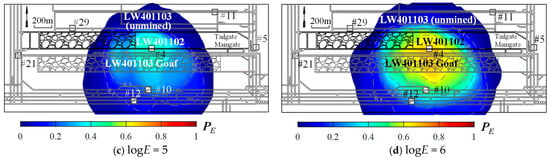
Figure 10.
Detection probability distribution of a seismic network in LW401102 for seismic events with different energy levels.
These results demonstrate that the seismic network in underground mines exhibits significant differences in detection capacities for seismic events of different energy levels and displays highly non-uniform spatial distribution characteristics. Considering the distribution of available geophones in LW401102 shown in Figure 4, the scarcity of available geophones and their distances from the mining area are the main reasons for the low overall detection probability for LW401102. Therefore, priority should be given to considering the number and spatial distribution of available geophones, as a greater number of available geophones distributed around the mining area enhances the adaptability of the PMC method.
In this study, it is challenging to directly validate the PMC method due to the lack of continuous geophone waveform recordings. Therefore, based on the relationship between elevated seismic energy/event count and increased coal burst risk, the PMC method was indirectly validated by inferring the seismic data. For details, see Section 5.3.
5. Discussion
5.1. Direct and Indirect Coal Burst Classification After Location Error Consideration
According to the burst occurrence mechanism, coal and rockbursts can be classified into two basic types: direct bursts and indirect bursts [10]. A direct burst is typically found in a similar or even identical manner to the damage zone, which is directly linked to the formation of fractures during mining activity. In most cases, a direct burst results from burst damage without any stress or energy input. It is generally a function of mining activity, measured by the excavation rate [29]. In contrast, an indirect burst triggers burst damage by suddenly increasing stresses in the coal/rock mass via seismic waves. This often involves shear failure mechanisms, such as fault slip at distant seismic sources hundreds of metres from the damage zone, accompanied by significant energy release [30].
Despite decades of research clearly classifying coal and rockburst types, field applications remain challenging due to inadequate seismic monitoring quality, making precise burst type identification difficult in many practical scenarios [31]. Direct bursts are always erroneously classified as indirect ones due to the mislocation of the source by the seismic network. This error occurs when the source is located tens of metres away from the actual damage zone. ETSLA can help identify the types of coal bursts by correcting the source location. Usually, a direct burst is determined if the damage zone is within the near-field area of the burst event, which is defined as a circle with a source radius that can be calculated using the seismic event magnitude [32]. Usually, a direct burst will be identified if the damage zone is within the near-field area of the burst event, which is defined as a circle of source radius , which can be calculated using the seismic event magnitude [33]:
Due to locating inaccuracies, the damage zone of a direct burst can extend beyond the near-field region of a seismic source. This can be corrected using the ETSLA results if the distance between the damage zone and the near-field boundary falls within the location error ellipse margin of the seismic source. Table 1 shows the distance from damage zones to burst events and the identified burst types after considering the location errors for the four coal bursts in LW401102 that occurred in September 2022. It can be seen that the burst damage induced by the No.1 coal burst is within the source radius of the burst source, which is identified as a direct burst type. The No.2 and No.4 coal bursts, which occurred on 22 and 29 September 2022, respectively, have distances between the burst events and the damage zones that are much larger than their source radii, even considering location errors. Thus, they are identified as indirect burst types. The No.3 coal burst has a longer distance between its original location and burst damage zone (26.4 m) than its radius (8.83 m), and was identified as an indirect burst. However, as the location error of the area where the No.3 burst event occurred was in the range 35.4~49.5 m, the minimum burst event distance that could damage the roadway can be 0, which means that the actual burst type is likely to be a direct one. The disaster control strategy can be adjusted based on this result to achieve optimal effectiveness in disaster prevention and mitigation.

Table 1.
Coal bursts characteristics in LW401102 and their burst type identification after considering the location error.
5.2. Seismic Detection Probability Availability
The PMC method achieves a quantitative spatial description of the detection capacity of seismic networks in underground mines. As it is a statistical method, sufficient historical seismic data is required to ensure the reliability of the results. It is preferable to achieve reliable results with shorter timeframes or less historical seismic data. Therefore, the result for seismic events with logE = 5 on 11 September 2022 (shown in Figure 10c) was used as the baseline to assess weekly similarity over the prior 6-week period. Here, the cosine similarity method was used to calculate their similarity. calculates the cosine of the angle between two arrays. The smaller the angle, the higher the similarity between two arrays. The cosine of the angle between the arrays and is
Figure 11 shows the number of seismic events used for available geophones to calculate weekly results and the corresponding similarity compared with the result on 11 September 2022. Due to variations in seismic detection capabilities, the number of seismic events identified by different geophones within the same week varied significantly. Geophones #4, #5, and #10 demonstrate stronger wave detection capabilities, with each being used to pick waves for approximately 500 seismic events each week, making them the primary monitoring geophones. Geophones #12 and #21 exhibit slightly inferior detection capabilities, picking waves of around 300–400 seismic events per week and functioning as secondary monitoring geophones. This phenomenon can be explained by the greater distance to the seismically active zone and the goaf influence. In contrast, Geophones #11 and #29 possess the weakest detection capabilities, contributing to wave-picking for only about 200 seismic events in total over the five weeks, relegating them to auxiliary roles. The weekly similarity analysis reveals that, after four weeks of data collection, the results on 28 August 2022, achieved approximately 95% similarity with the benchmark results from 11 September 2022. This demonstrates that a four-week historical data collection period is sufficient for the PMC method to reliably evaluate the monitoring capabilities of the seismic network.
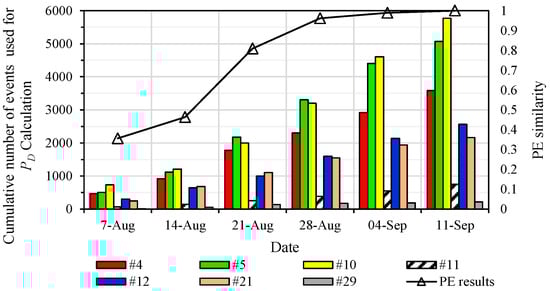
Figure 11.
similarity and number of seismic events used for available geophones to calculate weekly results in LW401102.
5.3. Coal Burst Risks Evaluation by Seismic Data Inference
As mentioned in the introduction, an incomplete seismic catalogue can lead to misjudgements of coal and rockburst risks based on the seismic analysis results. After understanding the detection probability characteristics of the seismic network through the use of the PMC method, it is possible to infer the actual seismic activity from seismic observations based on the law of large numbers. For a given area where m seismic events were monitored, with a detection probability of , , …, , the actual event counts () and energies () were, respectively, inferred to be
Based on the results in Section 4.2.2, the inferred seismic event counts and energy distribution in LW401102 were analysed, as shown in Figure 12. After inference, seismic events increased from 290 to 1424, representing a 391% growth, while total energy rose from 2.58 MJ to 9.44 MJ, showing a 365% improvement. As shown in Figure 12a, the initial high-energy zones were concentrated 50 m ahead of the tailgate, with maximum energy levels reaching logE of 5.5. After data inference, these zones expanded across the entire longwall face, including previously undetected areas near the maingate where energy levels reached logE of 6 at 100 m ahead (Figure 12b). This spatial distribution closely matched the recorded coal bursts in September 2022. This demonstrates that the inferred seismic energy effectively reconstructs the seismic response characteristics of the mining area, accurately reflecting the damage and failure state of the coal-rock mass.
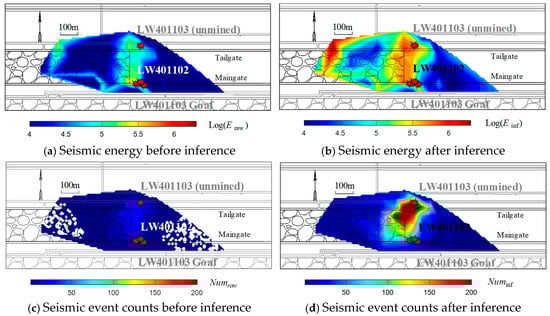
Figure 12.
Seismic event counts and energy distribution ahead of LW401102 before and after data inference using the PMC method.
Similarly, after data inference, seismic events remained concentrated on the LW401102 maingate side (see Figure 12d). Event counts significantly increased, exceeding 200 and extending coverage to 150 m ahead of the longwall face. However, the limited detection rates persisted in the tailgate region. This discrepancy arises from the tendency to over-interpret low-energy events using the PMC method, which obscures correlations with the observed coal burst damage. Consequently, the inferred seismic energy provides more accurate indicators of coal burst damage than the inferred seismic event counts.
5.4. ETSLA and PMC Applicability
The ETSLA and PMC methods provide a theoretical framework for enhancing seismic monitoring quality. Regarding source location accuracy, the vector characteristics of the location error ellipses calculated by the ETSLA method can be utilised to identify the weak direction of the geophone coverage envelope. A ratio closer to 1 indicates superior performance in source location. Deploying seismic geophones along the major axis of the location error ellipse can significantly increase the locating accuracy. Also, for critical observation zones, such as seismic active zones ahead of the longwall face, increasing the density of near-field geophones can effectively reduce the size of the error ellipses and improve source location accuracy.
Regarding seismic data completeness, the PMC method can provide a reference for evaluating the installation quality and signal reception performance of geophones. Suppose a geophone generally demonstrates a low detection capacity for seismic events across various energy levels. This may result from significant signal attenuation caused by poor coupling between the geophone and the coal-rock mass. Suppose a geophone exhibits weak detection capacities for low-to-medium-energy seismic events. In that case, it should be replaced with a more sensitive geophone to enhance the completeness of the seismic data catalogue. Furthermore, the variation in critical zones can serve as a primary criterion for assessing seismic data integrity through the PMC method. A higher indicates improved data integrity for seismic events at the same energy level.
6. Conclusions
This study comprehensively evaluated seismic monitoring system performance in underground coal mines through two novel methods. The key findings are summarised as follows:
- (1)
- The ETSLA method effectively quantifies the vector characteristics of source location errors, revealing anisotropic error distributions ranging from 37.7 to 105.3 m in LW401102. Optimal source-locating accuracy was observed within 200 m of the longwall face, while areas beyond 400 m exhibited extreme errors up to 105.3 m due to inadequate geophone coverage. The error ellipse model provides critical spatial references for network optimisation and burst risk assessment.
- (2)
- The PMC method reveals significant differences among geophones regarding their wave detection capacities. Geophones #4, #5, and #10 exhibited superior wave detection capabilities, achieving probabilities between 0.7 and 0.9 for seismic waves from events with logE ≥ 2 within 1500 m, while geophones #11 and #29 exhibited <0.2 probability due to signal attenuation and mining noise interference.
- (3)
- Significant variations are presented in seismic event detection probability across energy levels in LW401102. The detection probability demonstrates progressive enhancement with increasing energy magnitude, rising from 0.1–0.2 at logE = 3 to 0.7 at logE = 6, though spatial coverage remains non-uniform. The limited geophone distribution primarily constrains overall seismic monitoring performance, highlighting the importance of geophone quantity and spatial arrangement for seismic networks.
- (4)
- ETSLA can correct misclassified burst types by accounting for location errors, such as reclassifying a coal burst from an indirect type to a direct one after error margin consideration. Seismic data in LW401102, inferred using the PMC method, increased event counts by 391% and energy estimates by 365%, accurately correlating inferred high-energy zones with actual burst damage locations.
- (5)
- ETSLA and PMC methods provide actionable insights for seismic network redesign, emphasising denser geophone deployment in low-probability zones, prioritised coverage of key production areas, and dynamic adjustment of monitoring parameters based on anisotropic error characteristics.
ETSLA introduces vector-based error ellipse analysis, quantifying anisotropic location accuracy in complex mine environments. PMC achieves detection probability mapping across varying energy levels without relying on the Gutenberg–Richter law. Both approaches pioneer spatially explicit evaluations for optimising seismic networks and improving coal burst risk assessment accuracy.
Author Contributions
Conceptualisation, A.C.; methodology, C.W.; formal analysis, B.J.; investigation, H.L.; writing—original draft preparation, Y.Y. All authors have read and agreed to the published version of the manuscript.
Funding
This research was funded by the National Natural Science Foundation of China (52304105) and the Independent Research Project of State Key Laboratory for Fine Exploration and Intelligent Development of Coal Resources, CUMT (SKLCRSM23X006).
Institutional Review Board Statement
Not applicable.
Informed Consent Statement
Not applicable.
Data Availability Statement
The data supporting the results are available from the Mengcun coal mine, Shaanxi, China, on an internal data server; access is restricted and data can only be accessed with prior permission from the coal mine.
Conflicts of Interest
The authors declare no conflicts of interest.
References
- Zhang, C.; Canbulat, I.; Hebblewhite, B.; Ward, C.R. Assessing coal burst phenomena in mining and insights into directions for future research. Int. J. Coal Geol. 2017, 179, 28–44. [Google Scholar] [CrossRef]
- Hebblewhite, B.; Galvin, J. A review of the geomechanics aspects of a double fatality coal burst at Austar Colliery in NSW, Australia in April 2014. Int. J. Coal Sci. Technol. 2017, 27, 3–7. [Google Scholar] [CrossRef]
- Iannacchione, A.T.; Tadolini, S.C. Occurrence, predication, and control of coal burst events in the US. Int. J. Coal Sci. Technol. 2016, 26, 39–46. [Google Scholar]
- Patyńska, R.; Mirek, A.; Burtan, Z.; Pilecka, E. Rockburst of parameters causing mining disasters in Mines of Upper Silesian Coal Basin. E3S Web Conf. 2018, 36, 03005. [Google Scholar] [CrossRef]
- Jiang, Y.; Pan, Y.; Jiang, F.; Dou, L.; Ju, Y. State of the art review on mechanism and prevention of coal bumps in China. J. China Coal Soc. 2014, 39, 205–213. (In Chinese) [Google Scholar]
- Wesseloo, J.; Woodward, K.R.; Pereira, J. Grid-based analysis of seismic data. J. South. Afr. Inst. Min. Metall. 2014, 114, 815–822. [Google Scholar]
- Wang, X. Numerical Modeling of Seismic Wave Propagation in Underground Mines. Ph.D. Thesis, Laurentian University of Sudbury, Sudbury, ON, Canada, 2015. [Google Scholar]
- Ma, J.; Dong, L.; Zhao, G.; Li, X. Focal mechanism of mining-induced seismicity in fault zones: A case study of yongshaba mine in China. Rock Mech. Rock Eng. 2019, 52, 3341–3352. [Google Scholar] [CrossRef]
- Mendecki, M.J.; Wojtecki, Ł.; Zuberek, W.M. Case studies of seismic energy release ahead of underground coal mining before strong tremors. Pure Appl. Geophys. 2019, 176, 3487–3508. [Google Scholar] [CrossRef]
- Gibowicz, S.J.; Kijko, A. An Introduction to Mining Seismology; Polish Academy of Sciences: Warsaw, Poland, 1994. [Google Scholar]
- Stec, K. Characteristics of seismic activity of the Upper Silesian Coal Basin in Poland. Geophys. J. Int. 2007, 168, 757–768. [Google Scholar] [CrossRef]
- Kijko, A.; Sciocatti, M. Optimal spatial distribution of seismic stations in mines. Int. J. Rock Mech. Min. Sci. Geomech. Abstr. 1995, 32, 607–615. [Google Scholar] [CrossRef]
- Wang, C.; Si, G.; Zhang, C.; Cao, A.; Canbulat, I. A Statistical Method to Assess the Data Integrity and Reliability of Seismic Monitoring Systems in Underground Mines. Rock Mech. Rock Eng. 2021, 54, 5885–5901. [Google Scholar] [CrossRef]
- Gong, S.; Dou, L.; Cao, A.; He, H.; Du, T.; Jiang, H. Study on optimal configuration of seismological observation network for coal mine. Chin. J. Geophys. 2010, 53, 457–465. (In Chinese) [Google Scholar]
- Cong, S. Microseismic Source Location Method Research Based on Ground-Underground Layout in Coal Mine. PhD Thesis, Xi’an University of Science and Technology, Xi’an, China, 2019. Available online: https://kns.cnki.net/kcms2/article/abstract?v=o8vMLOX1CKvSXp1nGRJKciUMm8VdGDzJYtzLn9T3Ldk7AnMiLXtmkX6zE621LE6-GTUmtpShUTNapmnJ8-CpEjK3vkHO67HqWbxXc_15_pXlURAopcUPJb4VqdigZH0iSlNSDqQfQiFwqhDjKqIWgqEk8q-fhAKVzZDPQGZjkBNfD4wCtFUEfDXz6KJRPNka&uniplatform=NZKPT&language=CHS (accessed on 16 December 2020).
- Leśniak, A. Seismic network configuration by reduction of seismic source location errors. Int. J. Rock Mech. Min. Sci. 2015, 80, 118–128. [Google Scholar] [CrossRef]
- Gao, Y.-T.; Wu, Q.-L.; Wu, S.-C.; Ji, M.-W.; Cheng, A.-P.; Yang, K. Optimization of microseismic monitoring networks based on the theory of D-optimal design. J. Univ. Sci. Technol. Beijing 2013, 35, 1538–1545. [Google Scholar]
- Gibowicz, S.J.; Lasocki, S. Seismicity induced by mining: Ten years later. Adv. Geophys. 2001, 44, 39–181. [Google Scholar]
- Woessner, J.; Wiemer, S. Assessing the quality of earthquake catalogues: Estimating the magnitude of completeness and its uncertainty. Bull. Seismol. Soc. Am. 2005, 95, 684–698. [Google Scholar] [CrossRef]
- Zúñiga, F.R.; Wyss, M. Inadvertent changes in magnitude reported in earthquake catalogs: Their evaluation through b-value estimates. Bull. Seismol. Soc. Am. 1995, 85, 1858–1866. [Google Scholar] [CrossRef]
- Mignan, A.; Werner, M.; Wiemer, S.; Chen, C.; Wu, Y. Bayesian estimation of the spatially varying completeness magnitude of earthquake catalogs. Bull. Seismol. Soc. Am. 2011, 101, 1371–1385. [Google Scholar] [CrossRef]
- Godano, C. A new method for the estimation of the completeness magnitude. Phys. Earth Planet. Inter. 2017, 263, 7–11. [Google Scholar] [CrossRef]
- Wesseloo, J. Evaluation of the spatial variation of b-value. J. South. Afr. Inst. Min. Metall. 2014, 114, 823–828. [Google Scholar]
- D’Alessandro, A.; Luzio, D.; D’Anna, G.; Mangano, G. Seismic network evaluation through simulation: An application to the Italian National Seismic Network. Bull. Seismol. Soc. Am. 2011, 101, 1213–1232. [Google Scholar] [CrossRef]
- Cao, A.; Gao, S.S. Temporal variation of seismic b-values beneath northeastern Japan island arc. Geophys. Res. Lett. 2002, 29, 41–43. [Google Scholar] [CrossRef]
- Schorlemmer, D.; Woessner, J. Probability of detecting an earthquake. Bull. Seismol. Soc. Am. 2008, 98, 2103–2117. [Google Scholar] [CrossRef]
- Mason, I. Algebraic reconstruction of a two-dimensional velocity inhomogeneity in the High Hazles seam of Thoresby colliery. Geophysics 1981, 46, 298–308. [Google Scholar] [CrossRef]
- Dubiński, J.; Lurka, A.; Mutke, G. Seismic hazard assessment using bendray and rectilinear passive tomography in the Polkowice-Sieroszowice copper mine. In Proceedings of the 8th International Symposium on Rockburst and Seismicity in Mines, Saint-Petersburg, Russia, 1–7 September 2013; pp. 1–7. [Google Scholar]
- Goszcz, A. Tectonophysical origin of mining tremors. Publ. Inst. Geophys. Pol. Acad. Sci. 1986, M-8, 61–75. [Google Scholar]
- Ortlepp, W.; Stacey, T. Rockburst mechanisms in tunnels and shafts. Tunn. Undergr. Space Technol. 1994, 9, 59–65. [Google Scholar] [CrossRef]
- Ortlepp, W. RaSiM comes of age—A review of the contribution to the understanding and control of mine rockbursts. In Proceedings of the 6th International Symposium on Rockburst and Seismicity in Mines, Perth, Australia, 9–11 March 2005; pp. 3–20. [Google Scholar]
- Kaiser, P.K.; Cai, M. Critical review of design principles for rock support in burst-prone ground–time to rethink! In Proceedings of the 7th International Symposium on Ground Support in Mining and Underground Construction, Perth, Australia, 13–15 May 2013; pp. 3–37. [Google Scholar]
- Ryder, J.A.; Jager, A.J. A Textbook on Rock Mechanics for Tabular Hard Rock Mines; The Safety in Mines Research Advisory Committee: Johannesburg, South Africa, 2002; p. 232.
Disclaimer/Publisher’s Note: The statements, opinions and data contained in all publications are solely those of the individual author(s) and contributor(s) and not of MDPI and/or the editor(s). MDPI and/or the editor(s) disclaim responsibility for any injury to people or property resulting from any ideas, methods, instructions or products referred to in the content. |
© 2025 by the authors. Licensee MDPI, Basel, Switzerland. This article is an open access article distributed under the terms and conditions of the Creative Commons Attribution (CC BY) license (https://creativecommons.org/licenses/by/4.0/).