Abstract
The Loess Plateau is one of the most landslide-prone regions in China, where rainfall-induced shallow loess landslides severely constrain regional economic and social development. Therefore, investigating the stability of shallow loess slopes under rainfall conditions is of great significance. Taking Yuzhong County in Gansu Province as an example, this study uses the SINMAP model (Version 2.0) to assess slope stability. The areas of unstable zones under different rainfall intensities were identified, and the spatial distribution of hazard sites was analyzed to evaluate the applicability of this deterministic physical model in the study area. Furthermore, a Personnel Risk Level (PRL) determined by combining population density with the Stability Index (SI, defined as the probability that the factor of safety exceeds 1: SI = Prob (FS > 1)) was proposed and applied to assess the potential impact of landslides on local residents. The novelty of this study lies in three aspects: (1) targeting Yuzhong County (a loess region with scarce comprehensive landslide risk assessments) to fill the regional research gap, (2) quantifying PRL through a modified hazard index (HI = population density × (1/SI)) to achieve spatialized risk mapping for vulnerable populations, and (3) systematically analyzing the dynamic response of slope stability to five gradient rainfall intensities (from light rain to severe rainstorm) and verifying model sensitivity to key parameters. The results show that as rainfall intensity increases, stable areas gradually decrease while unstable areas expand, with stable zones progressively transforming into unstable ones. Greater rainfall intensity also leads to an increase in the number of landslides within unstable zones. The proposed PRL helps delineate the severity of hazards in different townships, providing new references for mitigating casualties and property losses caused by landslides.
1. Introduction
China is one of the countries that are most severely affected by geological hazards worldwide. These hazards include landslides, rockfalls, debris flows, and others, with landslides accounting for approximately 51% of all geological hazards [1,2,3,4,5]. Landslides can cause extensive damage, such as destroying transportation networks and buildings, and can even result in casualties, thus posing serious threats to various sectors [6,7,8,9,10]. Lanzhou City, located on the Loess Plateau, is a region characterized by rugged terrain with frequent landslides [11,12,13], where rainfall is the primary triggering factor. In recent years, due to changing climatic conditions and the increasing occurrence of extreme rainstorms, loess areas have become increasingly prone to new landslides and the reactivation of old ones [14]. Rainfall-induced landslides, which account for over 90% of all cases in China [15,16], are highly destructive and unpredictable, and severely hinder economic and social development in loess regions. Therefore, investigating the stability of shallow loess slopes under rainfall conditions is of great importance [17].
Researchers have employed various methods to assess the hazards of rainfall-induced shallow landslides, which generally include qualitative, semi-quantitative statistical, and deterministic quantitative analyses. Traditional qualitative and semi-quantitative methods are convenient for regional hazard risk assessments but come with several limitations: qualitative analysis relies heavily on experts’ subjective judgment (prone to errors), and semi-quantitative methods (e.g., information value models [18,19,20,21], regression models [22,23,24,25], artificial neural networks [26,27,28,29,30,31]) reduce subjective bias but struggle with dependent variables (topographic features of shallow landslides often disappear post-failure [32,33,34]). Deterministic physical models (e.g., SHALSTAB [35], SINMAP [36], TRIGRS [37], SCOOPS3D) offer physically meaningful insights and more accurate results.
Among them, the SINMAP (Stability Index Mapping) model is a distributed quantitative model based on the theories of hydrological models and slope stability models, aiming to assess the risk of shallow landslides within an area. This model performs a quantitative analysis of slope stability changes under rainfall conditions on a spatial scale, providing crucial support for regional landslide disaster assessment. In terms of hydrology, the model uses TOPMODEL (TOPgraphy-based hydrological MODEL) to calculate the terrain humidity index and establish the relationship between regional terrain and rainfall accumulation. In terms of the slope stability model, an infinite slope stability model is adopted, and the formula representing the slope stability coefficient is derived based on the introduction of the terrain humidity index, establishing a quantitative relationship between effective rainfall and slope stability. This means that the SINMAP model has unique advantages: (1) it allows a reasonable range of parameter uncertainty instead of requiring highly precise single-parameter inputs [38]; (2) it integrates the infinite slope stability model with a steady-state hydrological model, making it more suitable for rainfall-induced shallow landslides [36]; and (3) it has been verified to have high prediction accuracy (up to 96.7%) in loess and colluvial areas [32,39,40,41].
Existing studies have applied SINMAP to loess landslide assessment (e.g., Feng et al. [39] analyzed regional stability; Keles et al. [32] evaluated susceptibility in the Guneysu catchment), but gaps remain. Some of these gasps are: (1) Previous evaluations of landslide sensitivity have mainly been based on the maximum rainfall at the time of the landslide occurrence. (2) Previous applications rarely combine model results with population vulnerability to achieve quantitative personnel risk mapping. (3) Few studies have focused on Yuzhong County (a typical loess region with frequent landslides but scarce systematic risk assessments).
However, shallow landslides can also occur before the rainfall reaches a relatively high level. Therefore, exploring the influence of different rainfall amounts on landslide sensitivity can provide a great help for the prediction and inversion analysis of landslide disasters. To address these gaps, this study uses ArcGIS to analyze the spatial distribution of landslides in Yuzhong County, (2) applies SINMAP to simulate slope stability under five rainfall scenarios, (3) proposes a PRL index to assess population risk, and (4) verifies model accuracy and sensitivity. It aims to provide a theoretical basis for disaster prevention and mitigation in the study area.
2. Materials and Methods
2.1. Overview of the Study Area
Yuzhong County is located in the central part of Gansu Province, in the eastern outskirts of Lanzhou. It lies between 35°34′ and 36°26′ N and between 103°49′ and 104°34′ E. The county stretches approximately 66.4 km from east to west and 96.9 km from north to south, covering a total area of 3302 km2. Situated deep inland and far from the ocean, Yuzhong County has a temperate semi-arid continental monsoon climate. According to data from the Yuzhong County Meteorological Station, the long-term mean annual precipitation is 394.51 mm, with the maximum annual precipitation (1971–2000) reaching 526.3 mm. The maximum daily and hourly precipitation amounts are 98.1 mm and 35.3 mm, respectively.
The terrain in the study area is characterized by higher elevations in the south and lower elevations in the north, with a concave middle section that forms a saddle-shaped topography. The main peaks of Xinglong Mountain and Maxian Mountain in the south reach elevations of 3670 m and 3250 m, respectively. The elevation of Yuzhong North Mountain in the north ranges from 2200 to 2400 m, while the elevation between the northern and southern mountains ranges from 1600 to 2000 m. The central area mainly consists of loess hills and alluvial–proluvial plains, with the terrain sloping northwestward from the southwest, southeast, and northeast [42].
The slope factor of Yuzhong County was extracted using 1∶50,000 DEM data, and it was divided into basic units of 10° (Figure 1). The area of Yuzhong County with a slope less than 10° accounted for 24.23%; between 10° and 20°, 29.59%; between 20° and 30°, 29.03%; between 30° and 40°, 15.09%; between 40° and 50°, 1.93%; between 50° and 60°, 0.12%; and the areas with a slope greater than 60° were very rare, accounting for only 1.01%. It can be seen that the terrain of the study area is mostly small-angle slopes less than 40°, so the disasters generated are inevitably shallow-layer collapse disasters, and it is suitable to use SINMAP infinite slope analysis.
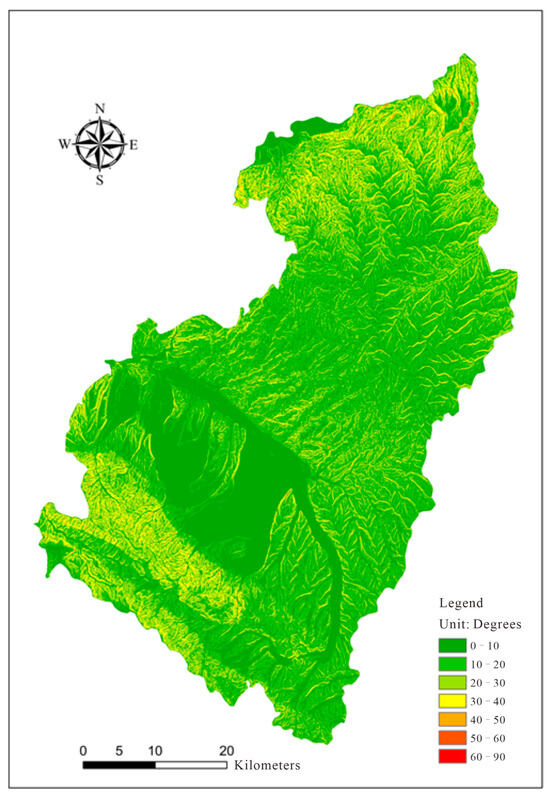
Figure 1.
Terrain slope of Yuzhong County.
Regarding topography, Yuzhong County is located within the Qilian Mountain orogenic belt, in the Qilian Block. Due to the uplift of the central Qilian Block since the Quaternary period and erosion by water flow, the local terrain has developed into a loess hilly landscape (Figure 2). Based on the formation causes and morphological characteristics of the landscape, its landform can be classified into three types: erosion–construction mid-mountain, erosion–erosion loess hilly area, and accumulation plain. Among them, the erosion–construction mid-mountain is the main distribution area of debris flows and landslides, accounting for 48.1% of the total land area of the study area. The study area is located at the western edge of the Loess Plateau. Due to the intense uplift caused by the new tectonic movement in this region, the terrain is highly dissected. The loess terrain is mainly composed of ridges and mounds. There are significant differences in the terrain between the north and the south. The north is a low mountainous area covered with metamorphic rocks and granite, the middle is an eroded and eroded loess hilly area and a high terrace hilly area covered by Malan loess, and the south is a high terrace area buried by loess in the mountains.
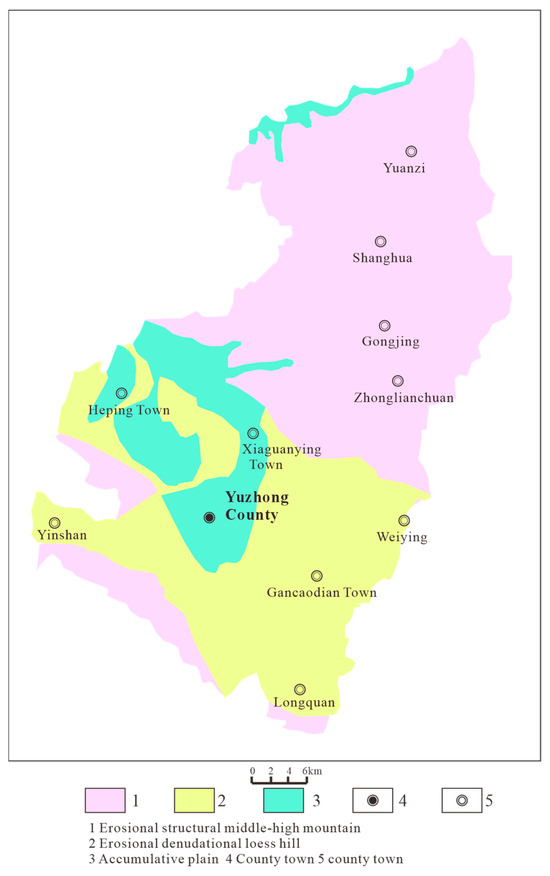
Figure 2.
Topography of Yuzhong County.
Stratigraphically, the area belongs to the Huangyuan–Lanzhou subregion, which is situated in the eastern segment of the Qilian Mountains division within the Qilian Mountain stratigraphic region of the North China Plate [42]. The study area is mostly covered by the Quaternary Period loose strata. The underlying strata include the Lower Archean Maixian Mountain Group, Middle Archean Galgan Group, Xinglong Mountain Group, Huashishan Group, Mesozoic Jurassic, Upper Cretaceous, and Neogene Paleogene and Quaternary strata. Among them, the lithology of the pre-quaternary strata includes basalt, granite, black mica schist, gneiss, dolomite, marble, amphibolite, conglomerate, boulder conglomerate, sandstone, and sandy mudstone. The Quaternary strata are mainly composed of red-yellow sandy loess-like sub-sandy soil and wind-blown Malan loess (Figure 3).
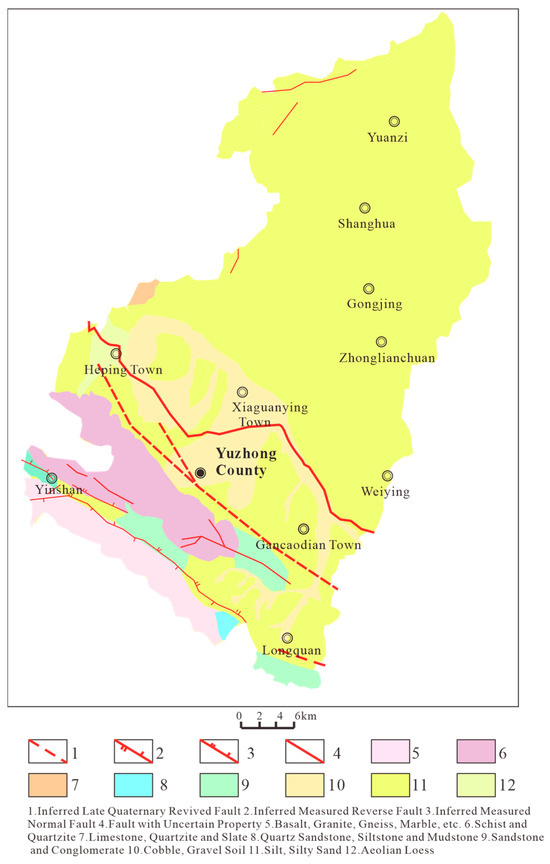
Figure 3.
Stratigraphic lithology of Yuzhong County.
According to the geological hazard risk survey report of Yuzhong County, Lanzhou City, Gansu Province (1:5000), the lengths, widths, heights and volumes of the landslide bodies, as well as the scale and current stability of the landslide disaster points in Yuzhong County, were statistically analyzed. The latest data show that there are 176 potential landslide disaster points in Yuzhong County (Supplementary Materials). Among them, 95% are soil slopes, 95% are shallow landslides with a slope thickness of less than 10 m, and 95% are small-scale. It can be seen that the slope deformation in the study area is mainly small-scale deformation. Based on the DEM elevation data of the study area, Figure 4 shows a map of landslide disaster points and the terrain elevation of the study area.
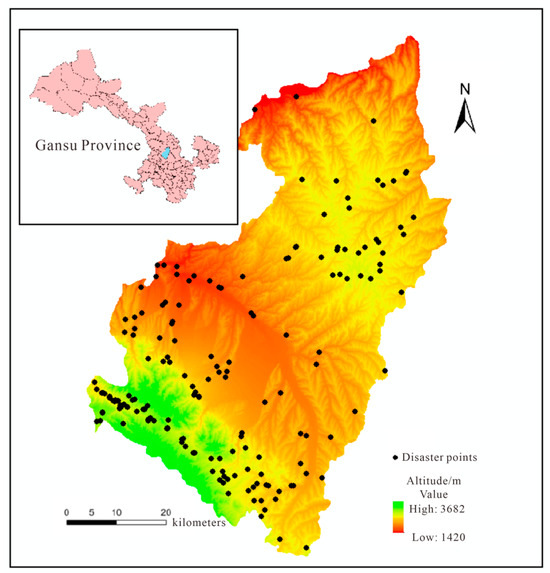
Figure 4.
Landslide disaster points of Yuzhong County.
2.2. Principle of the SINMAP Model
Pack et al. [36] developed the theoretical foundation of the SINMAP model based on the infinite slope stability model combined with a steady-state hydrological model. The SINMAP model defines a Stability Index (SI) using multiple parameters and classifies regions into different stability categories accordingly. The infinite slope stability model is shown in Figure 5. This study uses the SINMAP model, Version 2.0 [36]; the Stability Index approach for terrain stability hazard mapping uses version ArcGIS 9.x and higher.
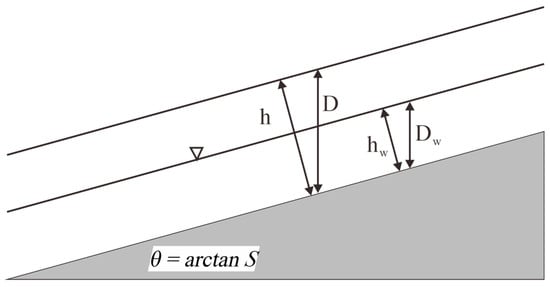
Figure 5.
The infinite slope stability model (quoted from Pack, 1998 [36]).
In the infinite slope stability model, the factor of safety (FS) is defined as the ratio of resisting forces to driving forces within the soil layer on the slope surface, expressed as
In Equation (1), represents the cohesion provided by plant roots (N·m−2); , the inherent cohesion of the soil (N·m−2); , the slope angle (°); , the unit weight of saturated soil (kg·m−3); , acceleration due to gravity, typically 9.81 (m·s−2); , the vertical depth of the soil layer (m); , the height of the groundwater table (m); , the unit weight of water (kg·m−3); and , the internal friction angle (°). Subscripts and indicate the water phase and soil, respectively.
When accounting for the hydrological model, the soil thickness h is defined as the thickness measured perpendicular to the slope surface, rather than vertical soil depth:
By simplifying Equation (1), a dimensionless expression of FS can be derived as
In Equation (3), the dimensionless cohesion C, the topographic wetness index w, and the density ratio of water to soil r are defined as follows:
In Equation (5), R denotes the steady-state groundwater recharge (mm·d−1); a, the specific contributing area (m2); and T, the hydraulic transmissivity (m2·d−1).
The Stability Index (SI) is calculated from the factor of safety (FS) while accounting for the influence of uncertain parameters. These uncertain parameters include the dimensionless cohesion (C), the internal friction angle (φ), and the combined rainfall intensity parameter (R/T). According to the equations above, when C and φ reach their maximum values and R/T reaches its minimum value, FS attains its maximum value (FSmax), indicating the most stable condition. Conversely, when C and φ reach their minimum values and R/T reaches its maximum, FS attains its minimum value (FSmin), representing the least stable condition. If FSmin > 1, then SI = 1, indicating that the slope is permanently stable. If FSmin < 1 and FSmax > 1, then SI falls within the range 0 < SI < 1, implying that slope failure is possible, and the value of SI represents the probability of such failure. If FSmax < 1, then SI = 0, indicating that the slope is extremely unstable. Based on different SI values, six stability classes can be defined, as shown in Table 1.

Table 1.
Stability Classification.
2.3. Personnel Risk Level Distribution
To further assess the impact of landslides on local populations, the concept of Personnel Risk Level (PRL) is introduced () [43]. Based on the geological disaster risk investigation report of Yuzhong County, Lanzhou City, Gansu Province (1:50,000), the population density of Yuzhong County is shown in Figure 6.
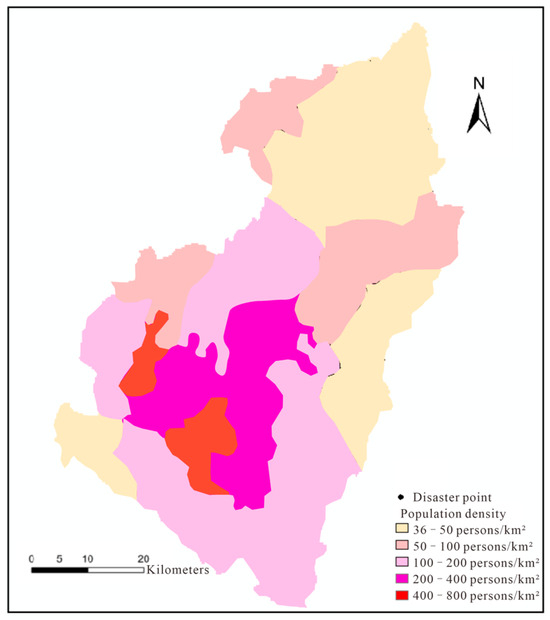
Figure 6.
Population Density of Each Township in Yuzhong County.
Figure 6 shows that population density is highest in Chengguan and Dingyuan Towns, followed by Liangta, Jiaotai, and Xiaokangying Townships and Xiaoganying Town, and it is relatively low in Heping Town; Mapo, Jinya, Qingshuiyi, and Xinying Towns; and Gaoya, Longquan, and Ganshadi Townships (100–200 people/km2).
To simplify the research, the average population density of each region is taken to represent the population density of the entire region. Take Chengguan Town as an example, which has an average population of approximately 400 to 800 people per square kilometer. Therefore, the average population is the sum of the lowest and highest population divided by 2, which is 600 people per square kilometer. Thus, the average population density per square kilometer for each level of the study area is 45, 75, 150, 300, and 600, respectively. The Stability Index is then calculated using its setting method: 0, 0.5, 1, 1.25, and 1.5 (described in Table 1).
2.4. Data Preparation and Parameter Settings
The SINMAP model operates based on a Digital Elevation Model (DEM). In this study, the DEM was obtained from the Geospatial Data Cloud with a resolution of 30 m, and in the Discussion section, the influence of digital elevation resolution on stability zoning is analyzed and applied to the subsequent research.
According to the principles of the SINMAP model, the required input parameters include the slope angle () and the specific catchment area (a), both derived from the DEM; the physical parameters of the soil and rock mass obtained through laboratory tests, including the density ratio of water to soil (r), the internal friction angle (φ), and the cohesion (C); and the parameters related to the topographic wetness index (w), such as the hydraulic transmissivity (T) and the steady-state groundwater recharge (R). Yuzhong County is located on the western margin of the Loess Plateau, which is extensively covered with Malan loess. Given the generally uniform engineering geological conditions across the study area, the same set of physical parameters (Table 2) was used for the entire simulation, thereby avoiding significant errors that could arise from modifying a single parameter independently.

Table 2.
Physical Parameters Selected for the Model.
The hydraulic transmissivity (T) and steady-state groundwater recharge (R) are key parameters in the SINMAP model. Since the rainfall intensity ratio (R/T) is typically small and challenging to input directly, it is often expressed as the inverse ratio, T/R. After multiple validations within the watershed of the study area, it was determined that when T/Rmax = 3000 m and T/Rmin = 1000 m, the simulation results correspond well with observed conditions. The long-term average daily rainfall in Yuzhong County is 7.9 mm, which is used as the steady-state groundwater recharge R. Based on this value, the hydraulic transmissivity is estimated to range from approximately 7.9 to 23.7 m2·d−1 [44]. According to classifications published by the China Meteorological Administration, rainfall is categorized as follows: light rain for 24 h precipitation between 0.1 and 9.9 mm; moderate rain for 10.0 to 24.9 mm; heavy rain for 25.0 to 49.9 mm; rainstorm for 50.0 to 99.9 mm; and severe rainstorm for 100.0 to 249.9 mm. Historical data from 1971 to 2000 show a maximum daily rainfall of 98.1 mm in Yuzhong County. Rainstorms (daily precipitation ≥ 50 mm) occur approximately every 4–5 years, while heavy rains (daily precipitation ≥ 25 mm) occur on average 34.5 times annually. Five rainfall scenarios were selected, 7.9 mm·d−1 (light rain), 20 mm·d−1 (moderate rain), 40 mm·d−1 (heavy rain), 80 mm·d−1 (rainstorm), and 150 mm·d−1 (severe rainstorm). Using the corresponding hydraulic transmissivity values, the rainfall parameter T/R was calculated for each scenario, as summarized in Table 3

Table 3.
T/R Values for Different Rainfall Categories.
2.5. Establishment of the SINMAP Model and Analysis of Influencing Factors
SINMAP is essentially a spatial analysis model based on GIS, rather than a traditional “physical model”. It combines the spatial data processing capabilities of GIS with a simplified physical model to assess the shallow stability of slopes regionally. The specific modeling process is shown in Figure 7.
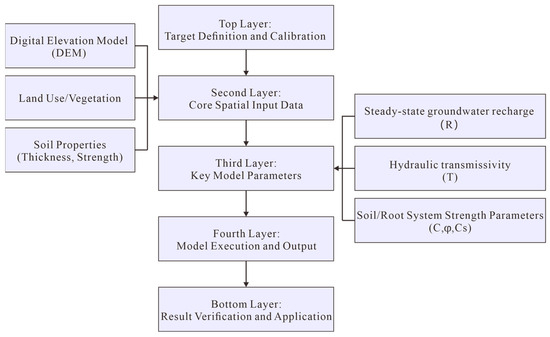
Figure 7.
Method of establishing the SINMAP model.
Firstly, target definition and parameter calibration are carried out, which determines the accuracy of the model and is the most crucial step in SINMAP. Given that it is extremely difficult to directly measure soil depth and water conductivity, the model conducts regional calibration by adjusting the T/R ratio. The basis for this is the known landslide inventory. The unstable areas (SI < 1) output by the model are compared with the actual landslide disaster points that occurred historically, so that the predicted unstable areas can be maximally matched with the known landslide disaster points.
Secondly, data are input. This is the foundation of GIS analysis. All data need to be converted into raster format. The functions of the input data vary. For instance, slope determines the sliding force, and the catchment area is used to estimate the amount of water flowing towards that point.
Thirdly, regarding the model parameter settings, various indicators such as density, porosity ratio, compression coefficient, internal friction angle, and cohesion are tested and calculated through laboratory experiments. The seepage coefficient and steady-state groundwater recharge amount are derived through trial calculations. The basis for the validity of the trial calculations is that the distribution of the terrain moisture index, which is greater than 1, is similar to the water system distribution in the study area, thus meeting the requirements. The inversion analysis method can be used to calculate the soil seepage coefficient.
Finally, the model calculates and outputs the result. In this stage, SINMAP software substitutes all of the above data into the infinite slope formula, calculates each raster pixel, generates a Stability Index distribution map, and analyzes the calculation results.
According to Figure 7 and Equation (1), the core factors influencing the analysis results of SINMAP can be summarized as follows: Topographic factors (determined using the DEM): Slope (θ): This is the most direct influencing factor. The greater the slope, the greater the sliding force and the worse the stability. Topographic location: For example, concave slopes (catchment areas) are more likely to collect water flow than convex slopes (drainage areas), leading to an increase in groundwater level and a decrease in stability. Hydrological factors: Steady-state groundwater recharge (R): Rainfall is the main external driving force that triggers landslides. The higher the R value, the greater the infiltration water volume, the higher the pore water pressure, and the worse the stability. Hydraulic transmissivity (T): This represents the soil’s drainage capacity. The higher the T value, the easier the water is to be discharged, and the less likely it is to form a high water level, resulting in better stability. The T/R ratio is the core of model sensitivity. Geotechnical factors: Soil internal friction angle (φ) and cohesion (C): These determine the soil’s shear strength. The higher the values, the better the stability. Soil thickness (z): The greater the thickness, the greater the weight of the sliding mass, but at the same time, the root system’s soil-stabilizing effect () may also be stronger. The influence is complex, but it is usually the main source of model uncertainty. Root system cohesion (): Vegetation enhances soil strength through its roots and is an important stabilizing factor. Human and ecological factors: Vegetation coverage change: Deforestation significantly reduces Cs and may change hydrological processes (such as interception and evaporation), thereby affecting stability. Land use: Unreasonable excavation and filling will directly change the slope and stress state.
3. Results
3.1. Stability Distribution Under Different Rainfall Intensities
Based on the SINMAP modeling and calculation process shown in Figure 7, the distribution map of the stability distribution in Yuzhong County under different rainfall intensities is obtained, as shown in Figure 8.
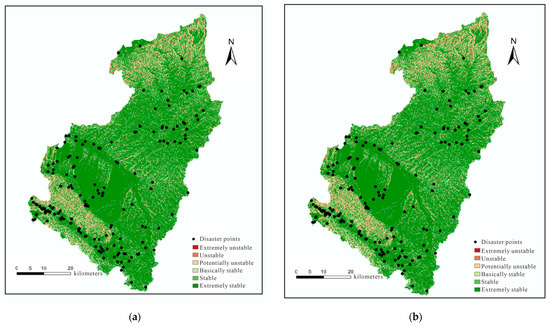
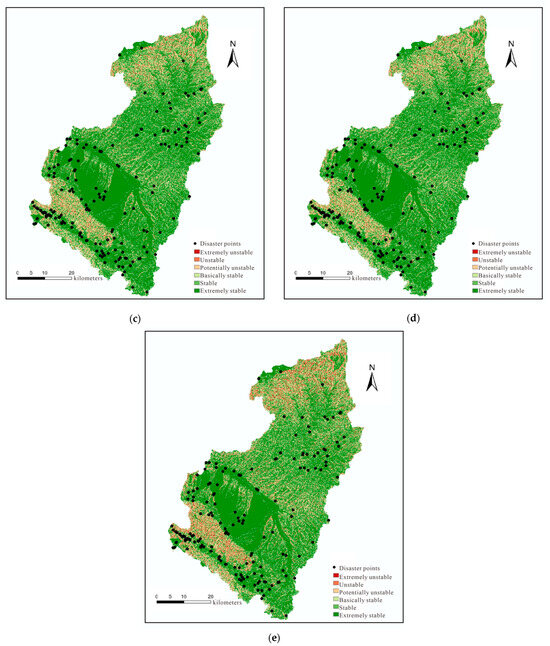
Figure 8.
Comparison of stability distribution under different rainfall intensities:. (a) 7.9 mm; (b) 20 mm; (c) 40 mm; (d) 80 mm; (e) 150 mm.
Figure 8 indicates that with rainfall intensity increases, the extent of stable areas decreases, while unstable areas expand. Unstable zones are predominantly located in regions characterized by higher elevations, steeper slopes, and more developed drainage networks.
Quantifying the area of unstable zones offers a clearer representation of the effects of varying rainfall intensity. Changes in area and corresponding proportions are presented in Table 4 and Figure 9.

Table 4.
Stability Area Statistics.
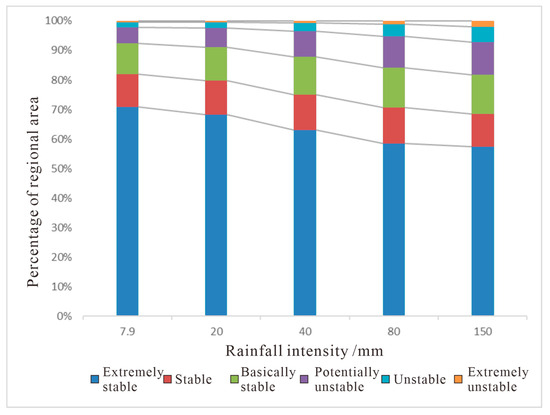
Figure 9.
Regional area changes under different rainfall intensities.
In comparing the percentages of different stability zones under varying rainfall intensities (Figure 9), it is evident that under light rain conditions, stable areas occupy the largest proportion. As rainfall intensity increases progressively from moderate rain to heavy rain and rainstorm, the proportion of the extremely stable zone decreases by approximately 5% at each step. From rainstorm to severe rainstorm, the proportion of the extremely stable area remains nearly constant, indicating that these zones are minimally affected by further increases in rainfall intensity. The proportions of stable and basically stable zones fluctuate only slightly with increasing rainfall intensity, remaining within a 1% range. In contrast, the area of unstable zones increases significantly with rising rainfall intensity. Specifically, the proportion of potentially unstable zones increases from 5.6% to 10.96%; unstable zones increase from 1.63% to 5.3%; and extremely unstable zones rise from 0.47% to 1.91%. These data indicate that increasing rainfall intensity drives a gradual conversion of stable areas into unstable ones.
3.2. Landslide Distribution and Density
Statistical analysis was conducted under different rainfall intensities to investigate the number of 176 landslide disaster points in each stability zone within the study area. The proportion of landslides in each stability zone under different rainfall intensities is depicted in Figure 10.
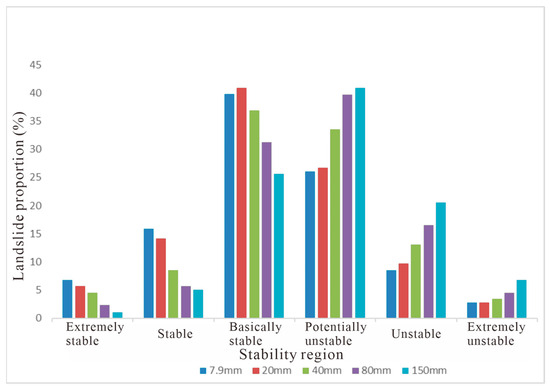
Figure 10.
Proportion of landslides in different stability zones under different rainfall intensities.
Figure 10 indicates that the spatial distribution of landslide disaster points generally exhibits a normal distribution pattern, where the landslide disaster points are concentrated in the “basically stable” and “potentially unstable” zones. Moreover, with rainfall intensity increases, the number of landslide disaster points in the extremely stable, stable, and basically stable zones decreases, with the total number in stable zones dropping from 110 to 56. In contrast, the number of landslide disaster points in the potentially unstable, unstable, and extremely unstable zones increases, with the total number in unstable zones rising from 66 to 120. These results validate the practical applicability of the SINMAP model, and based on the observed trends, it is possible to predict the likely locations of landslides under different rainfall conditions. Combining the changes in the area of each stability zone with the spatial distribution of landslide disaster points, the landslide hazard point density was calculated, which is shown in Table 5.

Table 5.
Density Statistics of Landslide Disaster Points.
Table 5 indicates that the landslide density remains highly consistent across all rainfall intensities: the extremely stable zones consistently exhibit the lowest landslide density, while the extremely unstable zones show the highest. As rainfall intensity increases, the landslide density within each stability zone decreases to varying extents. In stable zones, this decrease is mainly due to a reduction in the number of landslides, whereas in unstable zones it is primarily due to the expansion of the area covered by these zones [44].
3.3. Personnel Risk Level Distribution Under Different Rainfall
Distribution maps of Personnel Risk Levels under different rainfall intensities are shown in Figure 11.
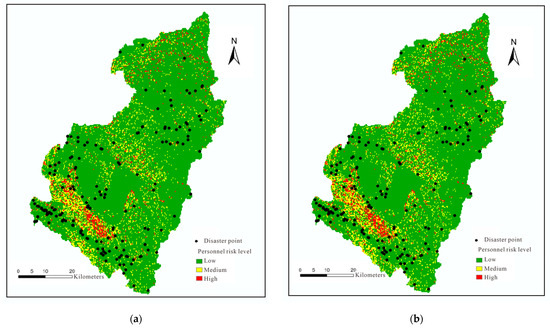
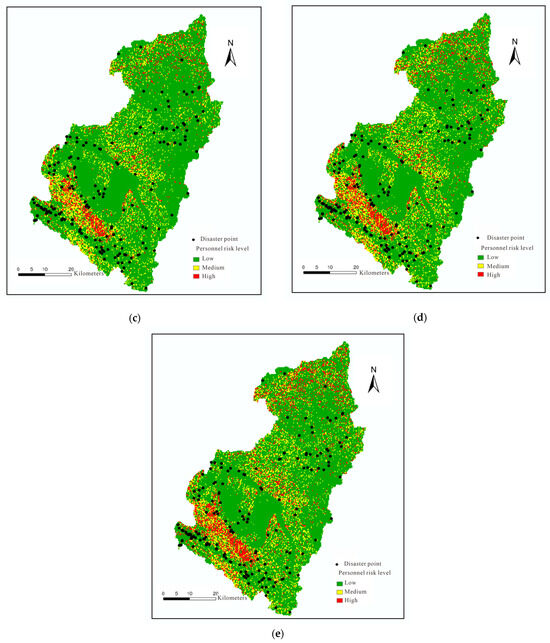
Figure 11.
Comparison of personnel risk level distributions under different rainfall intensities: (a) 7.9 mm; (b) 20 mm; (c) 40 mm; (d) 80 mm; (e) 150 mm.
Figure 11 indicates that high-Personnel-Risk-Level-areas are mainly concentrated in the southern part of Chengguan Town, the southwestern part of Lianda Township, and the central and southern parts of Dingyuan Town. Medium-Personnel-Risk-Risk-Level areas are primarily distributed throughout Mapo Township; the southwestern part of Xiaokangying Township; the northern part of Qingshuiyi Township; the northwestern and southern parts of Heping Town; the entire Xiaguan Ying Town; the northern parts of Jinya Town, Haxian Township, Shanghuacha Township, and Yuanzicha Township; and the southern part of Qingcheng Town. Chengguan Town, Lianda Township, and Dingyuan Town are all located in densely populated areas where human engineering activities are frequent, particularly road and railway construction and slope cutting for residential development. Such activities compromise the natural stability of slopes and create favorable conditions for the occurrence and expansion of landslides.
The area proportion of each risk level under varying rainfall intensities was calculated, which is shown in Table 6, and the number of landslides associated with each risk level are shown in Table 7.

Table 6.
Statistical table for area of each risk level.

Table 7.
Number of landslides in each risk level area.
Table 6 and Table 7 show that as rainfall intensity increases, the areas classified as low Personnel Risk Level gradually decrease, along with a reduction in the number of landslides within these areas. In contrast, the areas classified as medium and high Personnel Risk Levels expand, and the number of landslides in these zones increases. This indicates that changes in rainfall intensity alter the spatial extent of each risk zone, and the risk level associated with landslide disaster points in different locations changes accordingly. According to the hazard classification, there are two large-scale landslides, seventeen medium-scale landslides, and 157 small-scale landslides identified within Yuzhong County. Compared to the distribution of landslide disaster points within the stability zones, more landslides are found in areas classified as low risk, which aligns well with the actual occurrence patterns of landslides.
Based on the results in Table 7, stability histograms for different rainfall intensities are plotted in Figure 12. It can be clearly seen that the area with a low Personnel Risk Level accounts for a relatively high proportion. As the rainfall level increases, the area with a low Personnel Risk Level decreases, while the areas with medium and high Personnel Risk Levels gradually increase. However, the extent of decrease and increase is relatively small.
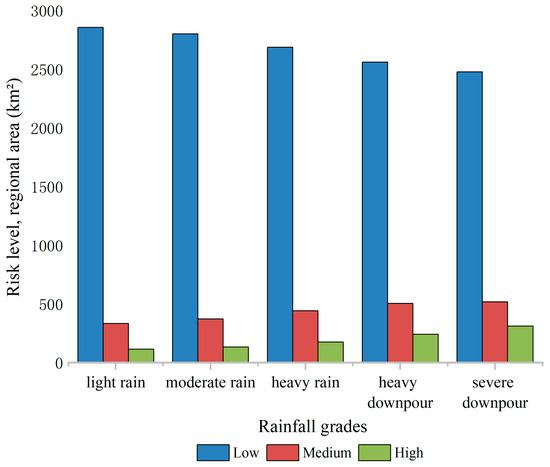
Figure 12.
Histogram of Personnel Risk Levels under different rainfall intensities.
4. Discussion
4.1. Study Results and Their Comparison with Similar Studies
This study utilized the SINMAP model to predict the spatial distribution of landslide stability in Yuzhong County, Gansu Province. The results show that with the intensity of rainfall increases, stable areas transform into unstable ones, leading to a significant increase in the number of landslides. The proposed PRL method can effectively assess the severity of disasters and provide a basis for disaster prevention and mitigation. However, there are still certain aspects that we have not taken into consideration. firstly, The regional slope stability evaluation results obtained through SINMAP simulation in this article are merely a preliminary prediction and assessment of the regional slope stability. Secondly, The accuracy of digital elevation maps has a significant impact on the simulation, and improving the accuracy of the digital elevation maps used in the simulation helps to enhance the accuracy of the simulation results. Lastly, the mechanical and hydrological parameters and soil thickness values the main factors for the SINMAP model.
Keles et al. [32] first determined the residual soil thickness in the Eastern Black Sea Region throughout the catchment. The data obtained in this study enabled the accurate application of the SINMAP mathematical model based on steady-state hydrological conditions and infinite slope stability approaches in the Guneysu catchment area, his study showed that if the mechanical and hydrological parameters and soil thickness values for different soils can be well characterized, the SINMAP mathematical model can have a predictive performance of more than 90%. Our study provides detailed soil thickness parameters for the disaster sites in the Yuzhong area, including the thickness of potential landslide bodies, as shown in the Supplementary Materials. The comparative analysis reveals that Keles research results have higher accuracy. However, it is worth noting that the soil type in the study area of his research is residual soil rather than loess. Loess, as a typical type of fine soil, has extremely high water sensitivity. Under the influence of rainfall, its structural integrity is significantly lost, and it is prone to cause shallow slope disasters. This is also the focus of the subsequent research, that is, considering the structural property of loess in the SINMAP model.
Feng et al. [39] Comparative Analysis of Machine Learning Methods and a Physical Model for Shallow Landslide Risk Modeling, The results showed that shallow landslides mainly occurred on shady slopes with elevations of 1068–1249 m, slope gradients of 36–60 and concave shapes. Shallow landslides mainly occurred in areas with high rainfall erosion, SPI and STI values. The susceptibility of shallow landslides changed parabolically with the change in the NDVI and mainly occurred in grassland and shrubland. Our study quantifying PRL through a modified hazard index to achieve spatialized risk mapping for vulnerable populations, it involves a more detailed consideration of the parameter settings in the SINMAP model.
Furthermore, the author has conducted preliminary research on the selection of parameters for the SINMAP model. For instance, a study was carried out on the method for evaluating the stability of shallow loess landslides triggered by rainfall based on the maximum entropy—infinite slope model [45]. The results show that based on the Maxent model, the landslide in Zhidan County is mainly affected by five indicators, such as slope, rainfall, landform, road buffer zone and normalized vegetation coverage index. The contribution rates to historical disaster points are 27.1%, 20.3%, 18.8%, 18.7% and 6.2%, respectively. Compared with the traditional SINMAP model, the density of disaster points in the unstable area of the model increased by 17.26%, 16.54%, 17.39%, 14.20% and 12.96%, respectively, under the conditions of light rainfall, moderate rainfall, heavy rainfall, rainstorm and downpour. The results of the Maxent-SINMAP model have a larger stable area than those of the SINMAP model, and there is no historical disaster distribution in the expanded area of the stable area.
4.2. Model Sensitivity Analysis
The SINMAP model divides larger areas into unstable or stable regions [46]. Therefore, in order to characterize the slope instability under different rainfall intensities, the potential unstable, unstable, and extremely unstable areas were selected for area analysis. The accuracy of the landslide sensitivity model was determined using the ROC curve. The ROC curve is often used to evaluate the accuracy of diagnostic tests. The area under the ROC curve (AUC) ranges from 0.5 to 1. A value of AUC closer to 1 indicates a more accurate model, while a value close to 0.5 indicates a less accurate model. The ROC curve of the SINMAP model is obtained as 0.87, as shown in Figure 13, indicating the accuracy of the model.
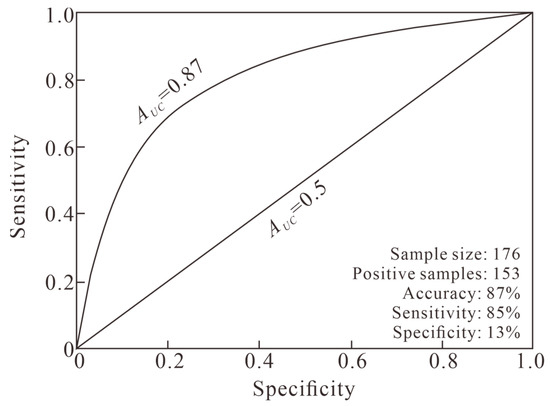
Figure 13.
ROC curve of the SINMAP model.
4.3. Model Validation
To further confirm the rationality of the stability classifications and Personnel Risk Levels, five representative landslides within the study area were selected for validation. These include the landslide near the Vocational College of Resources and Environment in Heping Town; the Zhongyu Plastic Factory landslide in Taiping Village, Heping Town; the Greening Company landslide in Heping Town; the Xiaodakou Heihucha landslide in Shanghua Township; and the Jiangjiaying Village landslide in Dingyuan Town. The locations of these landslide disaster points were compared with the previously generated distribution maps. As shown in Figure 14 and Figure 15, the comparison results demonstrate that the evaluation is reliable.
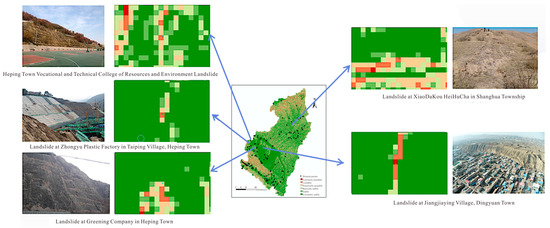
Figure 14.
Validation of stability classification results in the study area.
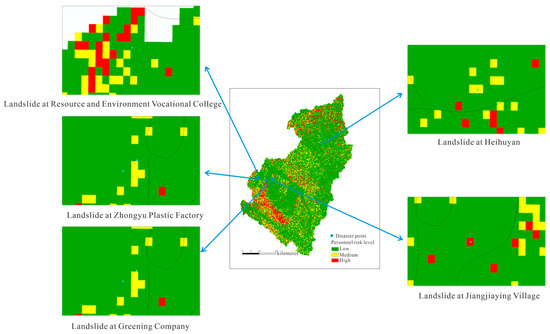
Figure 15.
Validation of Personnel Risk Level results in the study area.
4.4. Limitations and Future Work
This study did not consider seismic factors, which may also trigger landslides in the region. Future work could incorporate seismic risk into the model. Additionally, higher-resolution DEM data and more detailed soil parameter measurements could improve model accuracy. The proposed PRL formula requires further validation in other regions to enhance its generalizability.
5. Conclusions
This study utilized the SINMAP model to predict the spatial distribution of landslide stability in Yuzhong County, Gansu Province. The results show that under rainfall intensities of 7.9 mm, 20 mm, 40 mm, 80 mm, and 150 mm, the proportions of unstable areas are 7.7%, 8.95%, 12.21%, 15.82%, and 18.17%, respectively. These findings demonstrate that as rainfall intensity increases, the extent of unstable zones gradually expands, with stable zones progressively transitioning into unstable ones.
The increase in rainfall intensity also leads to a higher number of landslides occurring within unstable areas. This confirms the trend of increasing landslide proportions across different stability zones as rainfall intensifies, further validating the applicability and accuracy of using the SINMAP model for this type of analysis.
This study proposes a Personnel Risk Level (PRL) that integrates population density with the Stability Index (SI). When assessing a specific region, the model should first be used to predict potential landslide locations under various rainfall scenarios. Subsequently, by determining the rainfall intensity and the number of people potentially affected, the hazard level for the area can be effectively defined, thereby helping to reduce casualties and property losses caused by landslides.
Chengguan Town, Lianda Township, and Dingyuan Town are identified as key areas requiring focused prevention measures. It is important to address landslides triggered by human activities and to implement effective mitigation measures for existing landslides—such as drainage systems and retaining structures—to reduce potential damage.
Based on the findings of this study, future work can be further developed in the following directions: Firstly, the model parameters and assumptions can be refined. For instance, conducting detailed sensitivity analyses on soil mechanical parameters (e.g., cohesion and internal friction angle) and integrating higher-resolution remote sensing data and field measurements can enhance the precision of the SINMAP model. Secondly, the Personnel Risk Level (PRL) assessment framework can be expanded by incorporating more vulnerability factors, such as building types and the age distribution of the population, to achieve a more comprehensive risk evaluation. Lastly, integrating real-time rainfall monitoring data within the model to develop a dynamic landslide early warning system would significantly improve its practical application.
Supplementary Materials
The following supporting information can be downloaded at: https://www.mdpi.com/article/10.3390/app152111556/s1.
Author Contributions
Conceptualization, P.W. and H.T.; formal analysis, M.W.; methodology, H.M.; software, F.L.; validation, P.W., H.T. and H.M.; writing—original draft, M.W.; writing—review and editing, Y.D., F.L. and H.M. All authors have read and agreed to the published version of the manuscript.
Funding
This work was supported by the National Natural Science Foundation of China (No. 42372336) and Chang’an University, supported by the Special Fund for Basic Scientific Research of Central Universities (300102262505).
Institutional Review Board Statement
Not applicable.
Informed Consent Statement
Not applicable.
Data Availability Statement
The original contributions presented in this study are included in this article. Further inquiries can be directed to the corresponding author.
Acknowledgments
The all authors in this article thank the editors and anonymous reviewers for their helpful suggestions.
Conflicts of Interest
The authors declare no conflicts of interest.
References
- He, L.; Wu, X.; He, Z.; Xue, D.; Luo, F.; Bai, W.; Kang, G.; Chen, X.; Zhang, Y. Susceptibility Assessment of Landslides in the Loess Plateau Based on Machine Learning Models: A Case Study of Xining City. Sustainability 2023, 15, 14761. [Google Scholar] [CrossRef]
- Xie, C.; Huang, Y.; Li, L.; Li, T.; Xu, C. Detailed Inventory and Spatial Distribution Analysis of Rainfall-Induced Landslides in Jiexi County, Guangdong Province, China in August 2018. Sustainability 2023, 15, 13930. [Google Scholar] [CrossRef]
- Wei, L.; Zeng, Z.; Yan, J. Factors Affecting the Stability of Loess Landslides: A Review. Appl. Sci. 2024, 14, 2735. [Google Scholar] [CrossRef]
- Xiao, Y.; Wei, L.; Liu, X. Failure Mechanism and Movement Process Inversion of Rainfall-Induced Landslide in Yuexi Country. Sustainability 2025, 17, 5639. [Google Scholar] [CrossRef]
- Liu, Z.; Huang, J.; Li, Y.; Liu, X.; Qiang, F.; He, Y. A Bibliometric Analysis of Geological Hazards Monitoring Technologies. Sustainability 2025, 17, 962. [Google Scholar] [CrossRef]
- Zhang, F.; Huang, X. Trend and Spatiotemporal Distribution of Fatal Landslides Triggered by Non-Seismic Effects in China. Landslides 2018, 15, 1663–1674. [Google Scholar] [CrossRef]
- Wang, D.; Hao, M.; Chen, S.; Meng, Z.; Jiang, D.; Ding, F. Assessment of Landslide Susceptibility and Risk Factors in China. Nat. Hazards 2021, 108, 3045–3059. [Google Scholar] [CrossRef]
- Gao, H.; Zhang, X. Landslide Susceptibility Assessment Considering Landslide Volume: A Case Study of Yangou Watershed on the Loess Plateau (China). Appl. Sci. 2022, 12, 4381. [Google Scholar] [CrossRef]
- Petrucci, O. Landslide Fatality Occurrence: A Systematic Review of Research Published between January 2010 and March 2022. Sustainability 2022, 14, 9346. [Google Scholar] [CrossRef]
- Dandridge, C.; Stanley, T.A.; Kirschbaum, D.B.; Lakshmi, V. Spatial and Temporal Analysis of Global Landslide Reporting Using a Decade of the Global Landslide Catalog. Sustainability 2023, 15, 3323. [Google Scholar] [CrossRef]
- Shu, H.; He, J.; Zhang, F.; Zhang, M.; Ma, J.; Chen, Y.; Yang, S. Construction of Landslide Warning by Combining Rainfall Threshold and Landslide Susceptibility in the Gully Region of the Loess Plateau: A Case of Lanzhou City, China. J. Hydrol. 2024, 645, 132148. [Google Scholar] [CrossRef]
- Mao, J.; Su, Q.; Zhu, Y.; Xiao, Y.; Yan, T.; Zhang, L. Multi-Sensor Remote Sensing for Early Identification of Loess Landslide Hazards: A Comprehensive Approach. Appl. Sci. 2025, 15, 6890. [Google Scholar] [CrossRef]
- Zhang, M.; Tang, X. Quantification and Analysis of Factors Influencing Territorial Spatial Conflicts in the Gully Region of the Loess Plateau: A Case Study of Qingyang City, Gansu Province, China. Sustainability 2025, 17, 3552. [Google Scholar] [CrossRef]
- Zhang, Z.; Zeng, R.; Meng, X.; Zhao, S.; Wang, S.; Ma, J.; Wang, H. Effects of Changes in Soil Properties Caused by Progressive Infiltration of Rainwater on Rainfall-Induced Landslides. Catena 2023, 233, 107475. [Google Scholar] [CrossRef]
- Li, W.; Liu, C.; Scaioni, M.; Sun, W.; Chen, Y.; Yao, D.; Chen, S.; Hong, Y.; Zhang, K.; Cheng, G. Spatio-Temporal Analysis and Simulation on Shallow Rainfall-Induced Landslides in China Using Landslide Susceptibility Dynamics and Rainfall I-D Thresholds. Sci. China Earth Sci. 2017, 60, 720–732. [Google Scholar] [CrossRef]
- Shen, S.; Deng, L.; Tang, D.; Chen, J.; Fang, R.; Du, P.; Liang, X. Landslide Hazard Assessment Based on Ensemble Learning Model and Bayesian Probability Statistics: Inference from Shaanxi Province, China. Sustainability 2025, 17, 1973. [Google Scholar] [CrossRef]
- Ma, J.; Zeng, R.; Meng, X.; Zhang, Z.; Zhao, S.; Wei, Z. Field Research on Preferential Infiltration in Rainfall-Induced Loess Landslides. Eng. Geol. 2025, 354, 108184. [Google Scholar] [CrossRef]
- An, K.; Kim, S.; Chae, T.; Park, D. Developing an Accessible Landslide Susceptibility Model Using Open-Source Resources. Sustainability 2018, 10, 293. [Google Scholar] [CrossRef]
- Yang, F.-Y.; Zhuo, L.; Xiao, M.-L.; Xie, H.-Q.; Liu, H.-Z.; He, J.-D. A Statistical Risk Assessment Model of the Hazard Chain Induced by Landslides and Its Application to the Baige Landslide. Appl. Sci. 2023, 13, 3577. [Google Scholar] [CrossRef]
- Wei, Z.; Li, Y.; Dong, J.; Cao, S.; Ma, W.; Wang, X.; Wang, H.; Tang, R.; Zhao, J.; Liu, X.; et al. The Identification and Influence Factor Analysis of Landslides Using SBAS-InSAR Technique: A Case Study of Hongya Village, China. Appl. Sci. 2024, 14, 8413. [Google Scholar] [CrossRef]
- Hou, C.; Liu, H.; Wang, X.; Hu, J.; Tang, Y.; Yao, X. Landslide Susceptibility Analysis Based on Dataset Construction of Landslides in Yiyang Using GIS and Machine Learning. Appl. Sci. 2025, 15, 5597. [Google Scholar] [CrossRef]
- Chen, W.; Sun, Z.; Han, J. Landslide Susceptibility Modeling Using Integrated Ensemble Weights of Evidence with Logistic Regression and Random Forest Models. Appl. Sci. 2019, 9, 171. [Google Scholar] [CrossRef]
- Huangfu, W.; Wu, W.; Zhou, X.; Lin, Z.; Zhang, G.; Chen, R.; Song, Y.; Lang, T.; Qin, Y.; Ou, P.; et al. Landslide Geo-Hazard Risk Mapping Using Logistic Regression Modeling in Guixi, Jiangxi, China. Sustainability 2021, 13, 4830. [Google Scholar] [CrossRef]
- Li, X.; Li, S. Large-Scale Landslide Displacement Rate Prediction Based on Multi-Factor Support Vector Regression Machine. Appl. Sci. 2021, 11, 1381. [Google Scholar] [CrossRef]
- Wang, H.; Xu, J.; Tan, S.; Zhou, J. Landslide Susceptibility Evaluation Based on a Coupled Informative–Logistic Regression Model—Shuangbai County as an Example. Sustainability 2023, 15, 12449. [Google Scholar] [CrossRef]
- Oh, H.-J.; Lee, S. Shallow Landslide Susceptibility Modeling Using the Data Mining Models Artificial Neural Network and Boosted Tree. Appl. Sci. 2017, 7, 1000. [Google Scholar] [CrossRef]
- Ma, S.; Chen, J.; Wu, S.; Li, Y. Landslide Susceptibility Prediction Using Machine Learning Methods: A Case Study of Landslides in the Yinghu Lake Basin in Shaanxi. Sustainability 2023, 15, 15836. [Google Scholar] [CrossRef]
- Gao, F.; Gao, X.; Yang, C.; Li, J. Research on the Evolution Network Model of the Landslide Disaster Chain: A Case Study of the Baige Landslide. Appl. Sci. 2024, 14, 499. [Google Scholar] [CrossRef]
- Tynchenko, Y.; Kukartsev, V.; Tynchenko, V.; Kukartseva, O.; Panfilova, T.; Gladkov, A.; Nguyen, V.; Malashin, I. Landslide Assessment Classification Using Deep Neural Networks Based on Climate and Geospatial Data. Sustainability 2024, 16, 7063. [Google Scholar] [CrossRef]
- Ji, Q.; Liang, Y.; Xie, F.; Yu, Z.; Wang, Y. Automatic and Efficient Detection of Loess Landslides Based on Deep Learning. Sustainability 2024, 16, 1238. [Google Scholar] [CrossRef]
- Li, M.; Tian, H. Insights from Optimized Non-Landslide Sampling and SHAP Explainability for Landslide Susceptibility Prediction. Appl. Sci. 2025, 15, 1163. [Google Scholar] [CrossRef]
- Keles, F.; Nefeslioglu, H.A. Infinite Slope Stability Model and Steady-State Hydrology-Based Shallow Landslide Susceptibility Evaluations: The Guneysu Catchment Area (Rize, Turkey). Catena 2021, 200, 105161. [Google Scholar] [CrossRef]
- Lin, W.; Yin, K.; Wang, N.; Xu, Y.; Guo, Z.; Li, Y. Landslide Hazard Assessment of Rainfall-Induced Landslide Based on the CF-SINMAP Model: A Case Study from Wuling Mountain in Hunan Province, China. Nat. Hazards 2021, 106, 679–700. [Google Scholar] [CrossRef]
- Gao, J.; Shi, X.; Li, L.; Zhou, Z.; Wang, J. Assessment of Landslide Susceptibility Using Different Machine Learning Methods in Longnan City, China. Sustainability 2022, 14, 16716. [Google Scholar] [CrossRef]
- Montgomery, D.R.; Dietrich, W.E. A Physically Based Model for the Topographic Control on Shallow Landsliding. Water Resour. Res. 1994, 30, 1153–1171. [Google Scholar] [CrossRef]
- Pack, R.; Tarboton, D.; Goodwin, C. The SINMAP Approach to Terrain Stability Mapping. In Proceedings of the 8th Congress of the International Association of Engineering Geology, Vancouver, BC, Canada, 21–25 September 1998; pp. 1–8. [Google Scholar]
- Baum, R.L.; Savage, W.Z.; Godt, J.W. TRIGRS—A Fortran Program for Transient Rainfall Infiltration and Grid-Based Regional Slope-Stability Analysis, Version 2.0; Open-File Report; US Geological Survey: Reston, VA, USA, 2008. [Google Scholar]
- Meisina, C.; Scarabelli, S. A Comparative Analysis of Terrain Stability Models for Predicting Shallow Landslides in Colluvial Soils. Geomorphology 2007, 87, 207–223. [Google Scholar] [CrossRef]
- Feng, L.; Guo, M.; Wang, W.; Chen, Y.; Shi, Q.; Guo, W.; Lou, Y.; Kang, H.; Chen, Z.; Zhu, Y. Comparative Analysis of Machine Learning Methods and a Physical Model for Shallow Landslide Risk Modeling. Sustainability 2023, 15, 6. [Google Scholar] [CrossRef]
- He, J.; Qiu, H.; Qu, F.; Hu, S.; Yang, D.; Shen, Y.; Zhang, Y.; Sun, H.; Cao, M. Prediction of Spatiotemporal Stability and Rainfall Threshold of Shallow Landslides Using the TRIGRS and Scoops3D Models. Catena 2021, 197, 104999. [Google Scholar] [CrossRef]
- Yang, J. Landslide Damage from Extreme Rainstorm Geological Accumulation Layers within Plain River Basins. J. Coast. Res. 2018, 82, 1–11. [Google Scholar] [CrossRef]
- Wang, H. Analysis of the Causes of Loess Disasters under Human Engineering Activities. World Gard. 2021, 4, 187–188. [Google Scholar]
- Terhorst, B.; Kreja, R. Slope Stability Modelling with SINMAP in a Settlement Area of the Swabian Alb. Landslides 2009, 6, 309–319. [Google Scholar] [CrossRef]
- Yang, W.; Qiu, H.; Pei, Y.; Hu, S.; Cao, M. Evaluation of Shallow Loess Landslide Stability in Typical Loess Hilly Region: A Case Study of Zhidan County in Yan’an Area of Shaanxi Province. Quat. Sci. 2019, 39, 408–419. [Google Scholar]
- Fan, L.; Yahong, D.; Huandong, M.; Qian, F. A study of the stability evaluation method of rainfall-induced shallow loess landslides based on the Maxent-Sinmap slope model. Hydrogeol. Eng. Geol. 2023, 50, 146–158. [Google Scholar]
- Bueechi, E.; Klimeš, J.; Frey, H.; Huggel, C.; Strozzi, T.; Cochachin, A. Regional-Scale Landslide Susceptibility Modelling in the Cordillera Blanca, Peru—A Comparison of Different Approaches. Landslides 2019, 16, 395–407. [Google Scholar] [CrossRef]
Disclaimer/Publisher’s Note: The statements, opinions and data contained in all publications are solely those of the individual author(s) and contributor(s) and not of MDPI and/or the editor(s). MDPI and/or the editor(s) disclaim responsibility for any injury to people or property resulting from any ideas, methods, instructions or products referred to in the content. |
© 2025 by the authors. Licensee MDPI, Basel, Switzerland. This article is an open access article distributed under the terms and conditions of the Creative Commons Attribution (CC BY) license (https://creativecommons.org/licenses/by/4.0/).