Abstract
Distributed operational data rarely translates directly into business decisions. Meanwhile, in almost all industries, including the automotive industry, especially in the premium segment, it is crucial to identify the factors conducive to closing the transaction at an early stage. The aim of this study is to develop classification models that make it possible to predict the probability of success of a particular Mercedes-Benz offer with regard to vehicle configuration. Such a tool enables optimal allocation of resources (salespeople’s time, media budgets, production capacity), which is confirmed by the literature on customer relationship management. This study evaluates the usefulness of four machine learning algorithms—Random Forest (RF), Gradient Boosting Machine (GBM), eXtreme Gradient Boosting (XGBoost), and Support Vector Machine with an RBF kernel (SVM-RBF)—in forecasting sales, which was encoded as the binary variable Success. Among the tested models, Random Forest achieved the best results with an accuracy of 84.3%, F1-score of 0.73, and AUC of 0.90, indicating a very good ability to distinguish between successful and unsuccessful transactions. The results can be used for lead prioritization, dynamic discounting, optimization of marketing campaigns, and distribution/production planning.
1. Introduction
Although the use of information assets is becoming increasingly common in modern enterprise, many companies still struggle to transform distributed operational information into strategic business decisions. This problem is particularly evident in industries where early recognition of sales success factors is very important for competitive advantage. The automotive sector, and especially the premium segment, is a perfect example of such a market. Here, early recognition of sales success factors is crucial for gaining a market advantage, and every decision regarding resource allocation has a direct impact on profit [1,2,3]. Today, customers are increasingly demanding, and each transaction results from a complex process where every detail matters—from vehicle configuration to resource allocation. Modern automotive companies collect information about vehicle configurations and sales history, but unfortunately, this information is often used only for reporting purposes and not for active forecasting and optimization of sales activities, which leads to the loss of market opportunities. Thus, there is a clear gap between passive data collection and its proactive use to generate business value [4,5,6]. Transforming data into operational knowledge is a key challenge in customer relationship management (CRM) [7,8]. This is due to the traditional approach focusing on the general aspects of management, often omitting a detailed analysis of the impact of a specific product configuration on closing the transaction. Companies still rely on the intuition and experience of salespeople, which, while valuable, is not fully scalable or optimal. It is in this gap that there is huge potential that can revolutionize the approach to sales management. With a growing number of vehicle customization options, you need a tool that systematically analyzes and predicts which combinations of features have the best chance of market success [9,10]. This article responds to such a diagnosed need, proposing an innovative approach to forecasting sales success using machine learning models [11]. Unlike older studies that often focused on generic predictive models, this study focuses on accurately predicting sales success for specific vehicle configurations using real-world sales data. The results of the presented study are directly applicable in the optimization of business activities and can be used to prioritize leads, personalize offers, and plan production more effectively, which confirms the growing importance of predictive analytics in company strategy [12,13,14]. Therefore, this study aims not only to confirm the usefulness of algorithms but above all to provide specific, practical solutions. The goal is not only to build the right model but above all to create a tool that will help a company optimize the allocation of its resources, such as salespeople’s time, marketing budgets, or production capacity, in a real way. The results can also be used for dynamic discounting and sales planning, which will directly translate into increased efficiency and profit. Therefore, without a doubt, this article makes an important contribution to the scientific literature in the field of business analytics, sales management, and machine learning applications.
The main scientific contributions of this work can be summarized as follows:
- An innovative, data-driven approach to predicting the success of sales transactions in the automotive industry based on actual configuration data was proposed;
- A systematic comparison of four machine learning algorithms—Random Forest, Gradient Boosting Machine, eXtreme Gradient Boosting, and Support Vector Machine with an RBF kernel—was conducted using multiple classification quality measures (accuracy, Kappa, F1-score, AUC);
- The most important technical features of vehicles (including engine type, drive, and model) that have the greatest impact on the likelihood of a successful sale were identified;
- Practical management recommendations were presented on the use of predictive results in the areas of sales, marketing, and production planning.
In addition to these contributions, the present study makes a clear scientific advance by linking technical configuration data of premium vehicles with transaction-level sales outcomes using multiple state-of-the-art machine learning algorithms. This integration of product-level features with predictive analytics fills a methodological gap identified in the literature, where previous research often relied on aggregated or simulated sales data. The proposed analytical framework combines technical modeling with practical decision support, offering a replicable approach that can be adapted to other high-configuration industries. Consequently, this study extends the existing body of knowledge on machine learning applications in customer relationship management by demonstrating how configuration-specific predictions can inform managerial decisions in sales, marketing, and production planning.
The research process involved four main steps, shown in Figure 1.
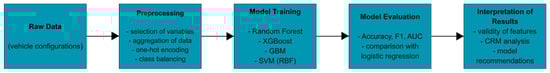
Figure 1.
Research process stages.
The structure of the article is as follows: Section 2 presents a review of the literature on the subject, Section 3 describes the data used and the methodology applied, and Section 4 presents the classification results, which are compiled and presented in Section 5, while Section 6 contains a discussion of these results, and at the end, Section 7 is given, in which the summary of conclusions and directions for further research are presented.
2. Literature Review
The digital transformation of corporate processes has fundamentally altered the ways in which companies retrieve, manage, and utilize data for decision-making [15,16,17,18,19]. In sales-oriented organizations, operational data is often distributed across different systems and departments, which complicates its direct translation into actionable business insights [20,21,22,23,24]. Nonetheless, recent advances in data analytics and machine learning (hereinafter referred to as ML) provide powerful mechanisms for integrating such data into predictive models [25,26,27,28,29,30,31], enabling more precise forecasts of customer behavior and sales outcomes [32,33,34,35,36,37,38,39,40,41,42]. In highly competitive sectors such as the automotive industry, in particular in the premium vehicle segment, early recognition of transaction success factors has become an essential determinant of organizational performance [43,44]. Furthermore, companies increasingly recognize that distributed operational data, when appropriately analyzed, can provide actionable insights for resource allocation, marketing strategies, and production planning [45,46]. The following sections of the literature review are broken down into the following thematic categories: “Customer relationship management and predictive analytics”, “Machine Learning in sales forecasting”, “Model evaluation in predictive sales”, and, last but not least, “Applications in the Automotive Industry”.
2.1. Customer Relationship Management and Predictive Analytics
Customer relationship management (hereinafter referred to as CRM) has long been regarded as a strategic framework for managing customer interactions and fostering long-term relationships [47,48,49]. Whilst traditional CRM relied noticeably on descriptive and diagnostic analytics, the integration of predictive modeling has shifted the paradigm toward proactive decision-making. Predictive analytics in CRM enables organizations to forecast sales probabilities, identify high-value leads, and optimize resource allocation, including salesforce time, advertising budgets, and production planning [24,50]. Research has consistently highlighted the importance of prioritizing sales opportunities based on predicted success probabilities. Ref. [51] demonstrated that predictive CRM systems significantly improve lead scoring by incorporating machine learning algorithms, thereby reducing opportunity costs. Similarly, ref. [52] showed that predictive big data analytics enables dynamic discounting strategies, where companies can adapt pricing to maximize both profitability and customer retention. For some premium automotive brands, these approaches are particularly valuable given the complex nature of customer preferences, the high-involvement purchase process, and the significant costs associated with marketing and production.
2.2. Machine Learning in Sales Forecasting
The adoption of machine learning techniques for sales forecasting has expanded across industries, offering superior accuracy compared to traditional statistical methods. Ensemble methods such as Random Forest (hereinafter referred to as RF), Gradient Boosting Machine (hereinafter referred to as GBM), and eXtreme Gradient Boosting (hereinafter referred to as XGBoost) are frequently employed due to their robustness, ability to model nonlinear interactions, and tolerance for high-dimensional data [53,54]. RF is considered an ensemble of decision trees that improves the classification stability by averaging multiple predictions [55]. RF has been widely applied in marketing analytics and has shown reliable performance in predicting customer churn and purchase likelihood [56]. On the other side, GBM builds additive models iteratively, minimizing loss functions and capturing complex interactions, and has been applied in financial and retail forecasting, showing strong results in predicting customer purchase intentions [57]. XGBoost being an optimized implementation of GBM, XGBoost is known for its scalability and efficiency. Studies have demonstrated its superior performance in handling structured tabular data, particularly in e-commerce and automotive sales contexts [43].
Support Vector Machine with an RBF kernel (hereinafter referred to as SVM-RBF) represents a kernel-based method effective for classification tasks, especially in cases with nonlinear boundaries [58]. SVMs have been successfully used in customer segmentation and purchase prediction, although they may require careful parameter tuning and are less scalable with large datasets [59].
2.3. Model Evaluation in Predictive Sales
In order to ensure the practical applicability of predictive models, it is crucial to evaluate them with appropriate performance metrics (i.e., indicators or methods). While accuracy remains a standard measure, it can be misleading in imbalanced datasets where one outcome (e.g., unsuccessful transactions) dominates. Therefore, measures such as Cohen’s Kappa and the F1-score for the positive class are widely recommended [60]. These metrics allow researchers to assess not only the overall correctness of a model but also its ability to capture less frequent, yet strategically important, successful sales. For instance, in a dataset of automotive sales, the number of completed transactions may be relatively small compared to inquiries or failed negotiations. Thus, evaluating models based on the F1-score for the positive class ensures that predictive tools align with managerial objectives, such as prioritizing high-potential leads or optimizing campaign effectiveness [61].
2.4. Applications in the Automotive Industry
The automotive industry provides a particularly relevant context for the application of predictive sales models due to its capital-intensive nature and the complexity of purchase decisions. Predictive analytics has been used for lead prioritization, enabling sales representatives to focus on customers most likely to convert [51]. Similarly, predictive models support dynamic pricing strategies, helping companies determine when and how to apply discounts to secure deals without eroding profitability [52]. Furthermore, predictive tools contribute to campaign optimization, allowing firms to tailor marketing initiatives based on predicted responsiveness [50,62]. Finally, predictive analytics enhances production and distribution planning by aligning supply with anticipated demand, thus minimizing inventory costs and ensuring the availability of preferred configurations [61,63]. The importance of operational parameters such as fuel consumption and pollutant emissions is also often highlighted, which confirms their relevance in shaping customer purchase decisions [64]. Recent case studies in the premium vehicle market underscore the potential of ML-driven sales forecasting. Ref. [43], for instance, demonstrated that gradient boosting models significantly improved the accuracy of predicting customer purchase behavior in the automobile industry. These findings suggest that integrating RF, GBM, XGBoost, and SVM-RBF into CRM practices can provide premium automotive firms with a competitive advantage by enabling data-driven decision-making across sales, marketing, and production. The following, Table 1, encompasses a literature review summary including all of the above topic-related sub-divisions (categories).

Table 1.
Literature review summary.
In summary, existing research clearly confirms the potential of machine learning methods in predicting customer behavior and sales results, but most of it focuses on general predictive models or analyses conducted in the context of retail and finance. Relatively few studies use actual premium vehicle configuration data to model the probability of a successful sales transaction. The literature also lacks studies comparing different classification algorithms in an integrated manner, using consistent evaluation measures (accuracy, F1-score, AUC, Kappa). Most previous studies are limited to analyzing individual methods, without practical interpretation of their results in the context of business decisions. This study addresses this gap by proposing an empirical comparison of four popular machine learning algorithms on real sales data from a premium manufacturer and indicating how the results obtained can be translated into managerial decisions regarding lead prioritization, discount policy, and production planning. Thus, this study creates an analytical framework combining technical (modeling) and managerial (application of results) perspectives, which constitutes its innovative contribution to the literature on the subject.
3. Materials and Methods
3.1. Data Preparation and Division
The analyzed database, amounting to more than 60,000 observations, consisted of technical data on passenger cars sold, covering a list of models offered in 2021–2023 on the Polish market. Each observation corresponded to a single vehicle configuration, defined by a combination of model, engine type, drive type, fuel type, and selected equipment items. After aggregation, 261 unique vehicle configurations were found. Each configuration was marked as either a sales success (yes) or no success (no), depending on whether it met an assumed threshold for the number of units sold during the analysis period. More complex description of vehicle configuration variables can be found in the Appendix A. The target variable (success) was binary and took the values yes and no. The original distribution of classes was 25.7% success and 74.3% no success, indicating a moderate imbalance of classes. Qualitative variables were coded as zero-one variables. The outcome variable was declared as a factor with levels of “no” and “yes”. Numerical variables were subjected to centering and scaling. To balance the classes in the learning process, minority class oversampling was applied using the upSample() function from the caret package. Oversampling was performed only on the training set to avoid overestimating the test results. The next step was to prepare the data for modeling by dividing the observation set into training data (80%) and test data (20%). The division was carried out in a way that preserved the proportions of the success variable classes to avoid imbalance in the training and test data and ensured that the models would be trained on one dataset and their effectiveness evaluated on a separate test set, allowing for an objective assessment of their generalization ability. The study compared four classes of machine learning algorithms: Random Forest, Gradient Boosting Machine, XGBoost, and Support Vector Machine with an RBF kernel. The selection of these methods was dictated by their recognized effectiveness in binary classification tasks with complex predictors and their ability to capture nonlinear relationships between a vehicle’s technical variables and its sales success. Random Forest represents ensembling algorithms with high resistance to overfitting and good interpretability through feature importance analysis. GBM and XGBoost belong to the class of boosting methods that allow complex interactions to be modeled and often achieve the highest accuracy in prediction tasks with a limited number of features. SVM with the RBF kernel was chosen for its ability to capture nonlinear decision boundaries in the feature space and good stability in small samples. In addition, logistic regression, which is a classic benchmark for linear classification models, was introduced as a base model. Such a set-up allows for simultaneous comparison of methods with different levels of complexity and interpretability, providing a more complete assessment of their usefulness in the context of automotive CRM applications. All analyses were carried out in the R environment (version 4.2.2) using the following libraries: caret, randomForest, xgboost, gbm, pROC and, as an auxiliary, tidyverse, ggplot2, and dplyr. To ensure comparability and replicability, all models were learned using five-fold cross-validation and a predetermined list of random kernels assigned to each validation iteration. Hyperparameters were selected using grid search with optimization relative to the F1-score measure. The range of searches included
- Random Forest: A number of trees (ntree) from 100 to 1000, number of features per split (mtry) from 3 to 8;
- GBM: Number of iterations (n.trees) from 100 to 500, tree depth (interaction.depth) 1–5;
- XGBoost: Learning rate (eta): 0.01–0.3, number of trees: 200–800, depth: 3–8;
- SVM (RBF): Regularization parameter C: 0.1–10; gamma kernel parameter: 0.001–0.1.
The study was conducted in the R environment version 4.5.1.
The results presented in the article correspond to the configurations that maximized the F1-score in the validation set. A predictor importance (feature importance) analysis was performed for all models. For the Random Forest, GBM, and SVM models, the built-in varImp() function from the caret package was used, while for the XGBoost model, the xgb.importance() method based on the Gain measure was used. The results are illustrated in graphs (which are placed in Section 4) showing the relative impact of each technical feature of a vehicle on the probability of sales success.
3.2. ML Models Used in the Study
3.2.1. Logistic Regression
In order to ensure a more comprehensive assessment of the effectiveness of the machine learning models, a simple baseline model was first proposed for analysis, logistic regression, which is a commonly used interpretable benchmark in binary classification. The logistic regression model describes the relationship between the dependent variable Y (in this case, sales success) and a set of explanatory variables . The probability of success can be expressed using the equation
where
—a constant term.
—regression coefficients for individual independent variables. These coefficients are estimated using the maximum likelihood method so that the resulting model best reproduces the observed relationships between the characteristics and the outcome variable.
The results indicate that the logistic regression model achieved accuracy = 0.68 (95% CI: 0.54–0.80); F1-score = 0.32; AUC = 0.74; Kappa = 0.12; sensitivity = 0.27; specificity = 0.84; balanced accuracy = 0.55. Analysis of the regression coefficients showed that most of the technical variables did not reach statistical significance (p > 0.1), and only engine type (p = 0.054) and EQE model (p = 0.056) showed a weak relationship with the probability of sales success. The coefficient values for these variables were small ( = −0.0035; = −2.29), confirming the limited predictive power of the linear model. These results suggest that a simple linear model has limited ability to represent the complex, nonlinear relationships between a vehicle’s technical characteristics and sales success, confirming the validity of using more advanced algorithms in this context.
3.2.2. Random Forest
The first model was Random Forest. The goal was to build a simple but effective classification model that handles nonlinear relationships and interactions between variables well. Random Forest is based on the aggregation of multiple decision trees, which reduces the risk of overfitting. Random Forest aggregates predictions from (T) decision trees:
where
is the prediction returned by the decision tree in the model.
is the set of predictions from all decision trees for a given input (x).
mode selects the class that occurs most frequently among the predictions of all trees.
3.2.3. XGBoost
The second model used was XGBoost. The goal was to use the gradient boosting algorithm, which is effective in classification tasks thanks to iterative improvement in decision trees and minimization of the loss function. XGBoost minimizes the loss function, e.g., log-loss for binary classification:
where
—actual label;
—predicted probability.
3.2.4. GBM Model
The third approach was ensemble learning, which creates a strong predictive model by sequentially adding weak base models, most often decision trees. Each subsequent tree is trained based on the errors of the previous model, minimizing the loss function using gradient descent. Thanks to its iterative approach and the ability to adjust the parameters, the GBM model can achieve very high effectiveness. The optimization metric for the model is ROC AUC (Area Under the Curve), which measures the model’s ability to distinguish between classes. ROC AUC assesses the model’s ability to distinguish between classes:
where
—True Positive Rate;
—False Positive Rate.
3.2.5. SVM Model with RBF Kernel
Finally, a Support Vector Machine (SVM) model with a radial kernel (RBF—Radial Basis Function) was proposed. This model aims to find a hyperplane that separates classes in the feature space best, maximizing the margin between classes. In the case of nonlinearly separable data, the RBF kernel transforms the data into a higher-dimensional space where separation becomes possible. The RBF kernel function is defined as
where
—feature vectors;
—the square of the Euclidean distance between points;
—a parameter regulating the “width” of the kernel, which controls the degree of influence of individual points on classification.
The SVM objective can be written as an optimization problem:
with restrictions
where
w—hyperplane weight vector;
b—free term;
—transformation of the data into a higher-dimensional space;
—slack variables allowing for classification error tolerance;
C—hyperparameter controlling the trade-off between margin maximization and classification error minimization;
—class labels.
The four different models proposed are justified by their advantages as well as the differences between them. Random Forest is easy to use and resistant to overfitting and handles nonlinearities well. XGBoost requires more complex data preparation, but its iterative approach to building trees often allows for better optimization. Automatic testing of multiple models (RF, GBM) with hyperparameter tuning results in slower training due to cross-validation and testing of multiple hyperparameter combinations but can provide good class discrimination. Support Vector Machine with a radial kernel is a versatile algorithm that handles nonlinear relationships well, which can be useful if the data has complex patterns and can be a good contrast to decision tree models. The SVM model with an RBF kernel offers an alternative approach based on data geometry. Tree models are more resistant to noise in the data and easier to interpret but may be more prone to overfitting in the absence of regularization. SVM, by its nature, can better handle data with clear, nonlinear decision boundaries, provided that the hyperparameters are properly tuned.
3.3. Comparison of Models
The final stage of the analysis was to compare the trained classification models in terms of key evaluation metrics, accuracy, Kappa coefficient, and F1-score, for the positive class. The goal was to select the model that performed the classification task best, taking into account both overall fit and the ability to correctly identify the positive class. A confusion matrix was used for each model to calculate the selected metrics:
3.3.1. Accuracy
This measures the percentage of correct predictions made by the model in relation to all predictions. This is a basic metric, but it can be misleading in the case of unbalanced datasets where one class dominates.
where
—True Positives;
—True Negatives;
—False Positives;
—False Negatives.
3.3.2. F1-Score for the Positive Class
F1-score is the harmonic mean of precision and recall, which makes it particularly useful for unbalanced data where the effectiveness of identifying the positive class is important. F1-score balances between minimizing false positives and false negatives.
where
3.3.3. Kappa Coefficient
The Kappa coefficient measures the agreement between the model’s predictions and the actual labels, taking into account the expected random agreement. It is a more rigorous metric than accuracy because it corrects for the influence of random matching, which is important in the case of unbalanced data.
where
—expected accuracy (equal to accuracy);
—expected random accuracy, calculated based on the distribution of classes in actual and predictive data.
3.3.4. AUC Metric
The AUC metric allows you to evaluate the model’s ability to distinguish between classes at different decision thresholds. The AUC takes values from 0.5 (random model) to 1.0 (perfect model). The formula for the AUC is not analytical but is calculated numerically based on the ROC curve.
3.3.5. Feature Importance
For tree models (Random Forest, XGBoost, GBM), the feature importance was analyzed, which allowed us to identify key variables influencing predictions. In the SVM model with an RBF kernel, feature importance was estimated indirectly.
4. Classification Results
4.1. Random Forest
In accordance with the adopted methodology, the basic statistics listed in the methodology section were used to evaluate the model. The model achieved an accuracy of 0.8431 (84.31%), which means that it correctly classified over 84% of cases. This value is higher than the No Information Rate (0.7451), suggesting that the model outperforms a simple guessing strategy based on the dominant class. The 95% confidence interval for the model’s accuracy ranges from 0.7141 to 0.9298, which is a relatively wide range, but nevertheless indicates good prediction quality. The Kappa index is 0.625, which indicates good model consistency above random. The model achieved a sensitivity of 0.8462, which means that it correctly identifies 84.62% of actual positive cases (“yes”). The specificity is 0.8421, which indicates effective recognition of negative class cases (“no”) in over 84% of cases. The positive predictive value (PPV) is 0.6471, meaning that 64.71% of cases predicted as “yes” actually belong to this class. In turn, the negative predictive value (NPV) is 0.9412, which means that the model accurately predicts cases of the “no” class with a very high probability (over 94%). The balanced accuracy index is 0.8441, which confirms the balanced effectiveness of the model for both classes. The F1-score for the positive class is 0.7333, which indicates a good balance between precision and sensitivity. The AUC is 0.8968, which suggests that the model has a very good ability to distinguish between classes.
An analysis of the importance of variables showed that the variable “engine version”, whose significance was normalized to 100, is the clear leader in terms of its impact on the model’s result. This indicates that the engine version and the resulting capacity are crucial for predicting the sales success of a vehicle. This is understandable given the growing environmental awareness of consumers and the differences in operating costs between the various versions. Specific vehicle models and features related to drive and fuel followed in the rankings. The GLE model (19.56) proved to be the most significant model in the dataset—its high value may indicate that this premium SUV has clear and predictable sales patterns. The fuel type gasoline (17.12) and four-wheel drive (15.35) also play an important role, which may reflect customer preferences related to driving economy and operating conditions. Other important models are GLC (14.14), CLA (13.53), C-Class (11.36), B-Class (10.65), and GLB (8.55). These are models with a relatively higher frequency of occurrence, probably representing the mid-range and higher segments of the market. The A-Class (8.37) also makes a contribution, albeit a slightly smaller one, which may suggest greater randomness in its sales or a strong influence of other variables not taken into account (e.g., price, additional equipment). The distribution of the remaining variables is shown in Figure 2.
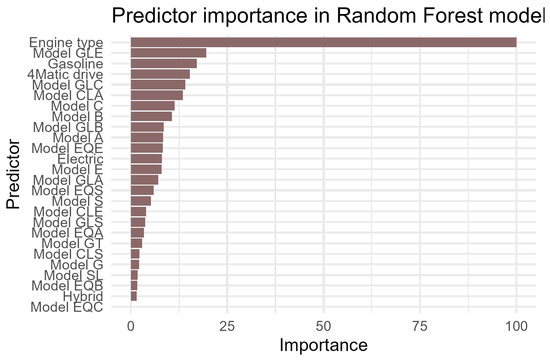
Figure 2.
Random Forest variable importance.
In summary, the model is based primarily on the technical characteristics of the vehicle, such as engine version, fuel type, and the presence of a 4 × 4 drive. Specific models also have a significant impact, especially those in the SUV and premium segments (GLE, GLC, CLA). Electric vehicles are beginning to play a notable role in prediction, reflecting changing market trends. However, gasoline-powered vehicles still dominate. Niche luxury or sports models are less important, which may be due to their limited market share and greater volatility in sales results.
4.2. XGBoost
The XGBoost model achieved an accuracy of 72.55%, which means that it correctly classified almost three-quarters of the cases. However, this value is lower than the No Information Rate (NIR = 74.51%), which suggests that the model does not outperform simple guessing based on predicting the most frequent class. This is also confirmed by the high p-value (0.6920), which excludes the statistical significance of this difference. The 95% confidence interval for accuracy ranges from 58.26% to 84.11%, indicating moderate uncertainty in estimating the model’s effectiveness. The Kappa index (0.3121) indicates limited agreement of the model with random guessing—an improvement over pure chance, but insignificant from the point of view of the quality of the classifier. The sensitivity value (0.5385) means that the model correctly identifies about 54% of positive cases (“yes”). This is a relatively low result and suggests problems with detecting sales successes. The specificity of 0.7895 shows that the model recognizes the negative class (“no”) well, which may be due to the excessive predominance of this class in the dataset. The PPV is 0.4667 and the NPV is 0.8333, confirming that the model is better at recognizing failure than success. The balanced accuracy (0.6640) is higher than the random result (0.5) but still indicates limited balance of the model with respect to both classes. The F1-score for the positive class is 0.5, which shows an average balance between precision and sensitivity. The AUC is 0.7996, which indicates a moderately good ability of the model to distinguish between classes, despite weaker results at the standard threshold of 0.5.
The XGBoost model also reveals the hierarchy of variables that had the greatest impact on predictions. The “engine type” variable clearly dominates, achieving the highest share of information gain (Gain = 47.3%). This means that once again, the type of engine used is the most important factor determining the likelihood of sales success.
Other significant variables are the GLE model (6.46%) and GLC (6.24%), 4MATIC (all-wheel drive) (5.86%), and CLA (5.74%) models—i.e., specific models from the SUV and premium segments and the presence of a four-wheel drive. This confirms that the vehicle segment and its functional characteristics are of great predictive importance. Similarly, gasoline-powered vehicles have a high position (5.41%). Electric models such as the EQE, EQS, EQA, GLA, and E had a relatively small impact (Gain < 2%), even though electric power reached a moderate level of significance (1.8%). This may mean that electric cars were not yet a major factor in sales success in the sample, but their impact was beginning to be noticeable. The distribution of the remaining variables is shown in Figure 3.
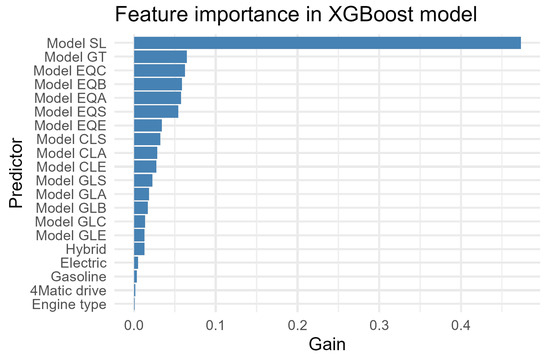
Figure 3.
XGBoost variable importance.
Overall, the XGBoost model achieves moderate classification results, better than random, but not significantly better than simple majority class guessing. The model’s biggest limitation is its insufficient sensitivity to sales successes, which may be the result of unbalanced data. The model identifies cases of failure well but has difficulty accurately recognizing successes. From a business perspective, this may limit its usefulness in marketing or logistics decisions. The model most often bases its decisions on engine type, fuel type, and specific vehicle model—especially SUVs and 4 × 4 versions. These characteristics are the most important indicators of potential sales success in the available data.
4.3. GBM Model
The GBM model achieved an accuracy of 78.43%, which means that almost four out of five cases were correctly classified. This value is higher than the No Information Rate (NIR = 74.51%). The 95% confidence interval for accuracy ranges from 64.68% to 88.71%, indicating moderate confidence in the effectiveness estimate, typical for a medium-sized test sample. The Kappa index is 0.496, which means moderate agreement between the model results and random classification. Compared to the XGBoost model (Kappa = 0.3121), GBM achieves a significantly higher classification quality compared to random label assignment. Sensitivity (0.7692) indicates that the model correctly identifies almost 77% of positive class cases (“yes”), i.e., sales successes. Specificity (0.7895) shows that the model recognizes about 79% of negative class cases (“no”), which means it has a good ability to distinguish between the two classes. The PPV value is 0.5556, so of all the cases that the model predicted as successes, about 56% actually were successes—better than in the XGBoost model (PPV = 0.47) but worse than in the Random Forest model (PPV = 0.65). The NPV (0.9091), on the other hand, indicates that the model accurately identifies failures—over 90% of cases marked as “no” actually were failures. A balanced accuracy of 0.7794 indicates a good, balanced model performance for both classes. An F1-score of 0.6452 shows moderate effectiveness in classifying the positive class. The AUC is 8623, which is a high value, meaning that the model distinguishes well between successful and unsuccessful sales cases—even if it does not always classify cases optimally at the default threshold (0.5).
The key variables in this model are again engine type—52.14%. This variable absolutely dominates among the predictive features—it accounts for more than half (52%) of the total importance. The remaining variables are the GLE model—7.50%—and gasoline fuel—7.23%. The distribution of the remaining variables is presented in Figure 4.
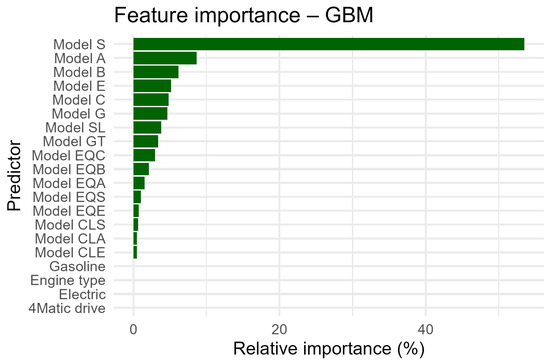
Figure 4.
GBM variable importance.
The GBM model in the analysis of vehicle sales success is based primarily on the engine version. Specific SUV and premium vehicle models (GLE, GLC, CLA) as well as drive type and fuel type are also very important. The GBM model achieves significantly better classification results than those of XGBoost, especially in terms of sensitivity and F1-score, which makes it more useful in detecting sales success. Although the overall accuracy slightly exceeds the NIR, the model is characterized by a good balance between classes and a high AUC value, which indicates its good predictive ability. The model performs particularly well in recognizing negative cases (lack of success) but also identifies sales successes better than other comparable models, making it more useful in applications requiring the detection of “yes” cases (e.g., for campaign forecasting, marketing investments, etc.).
4.4. SVM Model with RBF Kernel
The SVM model with an RBF kernel achieved an accuracy of 80.39%, which means that four out of five observations were correctly classified. This result is higher than the NIR = 74.51%. The 95% confidence interval for accuracy ranges from 66.88% to 90.18%, indicating moderate uncertainty in estimating the model’s effectiveness—typical for a medium-sized sample. The Kappa value = 0.4563 indicates moderate agreement with random classification. The model performs better than a random classifier but still does not reach a level > 0.6. Sensitivity = 0.5385, so the model correctly identifies about 54% of sales successes, indicating a moderate ability to detect “yes” cases. The positive predictive value (PPV = 0.6364) indicates that approximately 63.64% of observations predicted as “yes” were indeed so, which indicates good precision in predicting success. The F1-score is 0.5833, which indicates average effectiveness for the positive class. The specificity of 0.8947 shows that the model performs very well in recognizing the lack of sales success—with almost 90% accuracy in this class. The NPV of 0.8500 means that 85% of cases classified as “no” were indeed not successful. Balanced accuracy (0.7166) suggests a good balance of prediction, though not perfect, while an AUC of 0.7955 shows a good class discrimination ability despite moderate sensitivity at the default threshold.
The SVM model with an RBF kernel is characterized by good overall effectiveness (80%) and very high specificity (89%), which means that it classifies sales failures well. However, its sensitivity (54%) and F1-score (58%) for the positive class are only moderate, which means that the model often fails to detect sales successes, although when it does, it is accurate. The SVM model with an RBF kernel is an effective classifier, especially in nonlinear problems, but its operation is based on transforming the feature space using a kernel function. As a result, it does not provide directly interpretable variable importance coefficients, as previous models did. To determine which variables had the greatest impact on the prediction, a function was used that approximated the importance of variables based on the impact of features on the classification margin, based on an assessment of how a change in the value of a given variable affected the classification—the greater the impact, the higher the importance value. These values are standardized relative to the most important variable (100%). In this way, it was determined that the most important variables were—as in previous results—engine type—100%; 4MATIC drive—98.4%; the GLE model—82%; CLA—70%; GLC—53%.
The distribution of the remaining variables is presented in Figure 5.
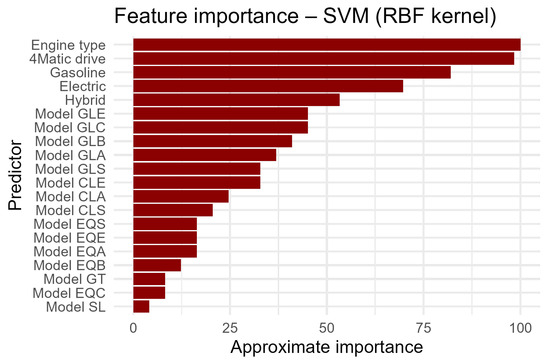
Figure 5.
SVM model variable importance.
The SVM model with an RBF kernel also shows the greatest sensitivity to technical characteristics of the vehicle, such as engine type and drive, and to specific models—especially SUVs and premium class vehicles. Although SVM classifiers do not offer directly interpretable feature weights, the approximation used provides practical insight into the decision structure of the model. However, it should be noted that this interpretation is based on a heuristic estimate of the impact of variables, and the values obtained should be treated as relative rather than absolute measures of impact. In summary, the model can be useful in situations where it is more important to avoid false positives (e.g., limited marketing budget) but less effective in the context of maximizing the detection of actual successes. In practice, the SVM can serve as a conservative filter, minimizing the risk of over-allocating resources to low-quality leads.
5. Results
Table 2 summarizes the calculated metrics for all developed models.
Table 2.
Key evaluation metrics for classification models.
The worst results were recorded for logistic regression, which achieved an accuracy of 0.68, meaning that it correctly classified about 68% of cases. The results confirm that while logistic regression is a valuable baseline tool, complex nonlinear algorithms significantly improve the effectiveness of sales success prediction in the context of complex interactions between vehicle configuration features. In addition, no variables have strong predictive power, and even those with borderline significance indicate very weak effects.
The Random Forest model achieves the highest overall effectiveness (accuracy = 84%) and the best balance between sensitivity and specificity, making it the most reliable sales success classifier. GBM has a slightly lower overall effectiveness but still a very good F1-score and AUC, which means a good balance between precision and the ability to detect successes. SVM (RBF) offers high specificity, which means that it rarely confuses cases of non-successes, but it is less effective at detecting successes. XGBoost has the lowest classification effectiveness, with a problematically low sensitivity and F1-score—the model is not recommended for use. Based on the already existing literature [65,66,67,68], it may seem that the XGBoost model should outperform other tree-based algorithms; however, in this case, this result can be explained by several factors. First, the post-aggregation dataset is not very large (261 vehicle configurations) and includes mostly categorical variables that, when coded, form a large number of sparse binary features with a small number of observations. Under such conditions, algorithms with a more random structure, such as Random Forest, perform better with a small number of examples and reduce the risk of overfitting. Second, the XGBoost hyperparameter tuning process was limited due to sample size and learning time, which could lead to partial model mismatches and result in under-fitting. XGBoost’s sensitivity to the choice of regularization parameters is also crucial, and its effects are particularly evident precisely in the case of small sets. It is worth noting that the confidence interval for the accuracy of the Random Forest model (95% CI: 0.7141–0.9298) is relatively wide. This indicates moderate uncertainty in assessing the performance of the classifier, due primarily to the limited size of the test sample (representing 20% of the 261 observations) and the variability in the vehicle configurations analyzed. The small number of cases in some categories may have increased the variance in the estimates. Future studies plan to increase the number of observations by expanding the sales period analyzed or combining data from several markets, which would yield narrower confidence intervals and more stable estimates of performance measures.
6. Discussion
The model comparison aligns broadly with prior findings on ensemble vs. linear classifiers. In this study, Random Forest (RF) clearly led (84% accuracy, balanced sensitivity/specificity), outperforming the others. This is consistent with large-scale benchmarks showing that RF often beats simpler methods—Couronné et al. (2018) found RF had higher accuracy than logistic regression on 69% of datasets [69].
One notable divergence concerns XGBoost. We found XGBoost to be the poorest (only 53% sensitivity, low F1-score), whereas many studies report XGBoost as very strong. For example, Imani et al. (2025) report that a carefully tuned XGBoost + SMOTE attained the highest F1-score and significantly outperformed RF under class imbalance [68]. Airlangga (2024) similarly found XGBoost gave the best recall (0.9525) and AUC (0.7854) in predicting customer purchase intent, whereas RF gave a more modest, balanced result [70]. The fact that XGBoost underperformed in this case likely stems from the research’s small, categorical-heavy sample and limited hyperparameter tuning, conditions under which XGBoost may underfit. In contrast, the SVM (RBF) showed very high specificity (around 89%) but low sensitivity, which qualitatively fits the view that SVMs can create tight decision boundaries at the expense of recall unless carefully tuned.
The key objective of this study was to derive actionable business recommendations from the obtained results. For example, for the sales and marketing department, the Random Forest model could be implemented as a predictor of sales success, as it provides high-quality classification of both classes. It could be integrated with the CRM system to evaluate new models or marketing strategies. The same model can—in the form of a percentage field—classify new inquiries, allowing advisors to focus on contacts with a probability of success exceeding 75% and receive automatic alerts when the forecast falls below 40% and a stronger incentive is needed (e.g., a test drive, service voucher, or extended warranty).
If managers want to run “what-if” simulations—for example, to check the impact of a new equipment package or to raise or lower a discount—GBM will be more useful. This algorithm, although slightly inferior to Random Forest in terms of raw effectiveness, offers greater transparency thanks to SHAP analysis and facilitates the interpretation of the relationship between offer features and the likelihood of purchase. However, in situations where each misclassified positive case can mean costly, unnecessary contact with the customer, minimizing false alarms becomes a priority. In such cases, the most sensible choice is the SVM model with an RBF kernel—a model with the highest specificity (approximately 89%) which effectively eliminates low-quality leads, albeit at the cost of slightly lower sensitivity.
The recommendations resulting from the analysis extend to several areas of the company’s operations. In the sales department, it is advisable to prioritize configurations identified by the models as the most profitable: 4MATIC cars, mid-range gasoline engines, and GLE, GLC, and CLA models. It is worth building a demonstration fleet with these variants in order to maximize test drive conversions. In marketing, campaigns should focus on consumer segments that most often choose the aforementioned configurations, and it is a good idea to enrich the message for electric vehicles with educational content—models show that a lower propensity to purchase EVs may result from an insufficient understanding of the offer.
Logistics and finance will also benefit. The total probabilities of success aggregated at the equipment version level can feed into the production material requirement planning system so that expensive, slow-moving vehicle variants are sent to the factory with lower priority, which relieves working capital and reduces the risk of excess inventory. The implementation of a probabilistic discount matrix—constructed on the basis of the estimated conversion probability—allows the pricing department to reduce the median discount while maintaining the target sales volume. At the same time, simulation scenarios generated using the Gradient Boosting Machine model enable ex ante quantification of margin sensitivity to discount-level modifications of several percentage points, which significantly reduces the financial risk even before the pricing campaign is launched.
An examination of the impact of individual variables on the classification performance conducted by means of a feature importance analysis for each of the models studied indicated that variables related to engine type (engine type), fuel type (fuel type), and drive (4Matic drive) had the greatest impact on sales success. For the tree models (Random Forest and GBM), specific model variants in the GLE, GLC, and EQS series also showed high importance, while for the SVM model, binary characteristics describing the drive configurations and engine type were of greatest importance.
Although this study was conducted on data on a single brand and domestic market, the results obtained have high potential for generalizability. The methods used—Random Forest, GBM, XGBoost, and SVM—belong to the class of model-independent algorithms, which allows them to be transferred to other datasets without a significant change in architecture. The structure of the predictors, including technical product features, equipment parameters, and drive variants, can easily be replaced by other sets of features describing products from different segments, e.g., commercial vehicles, motorcycles, and even highly configured consumer goods (e.g., consumer electronics).
More broadly, the developed algorithm (refer to the algorithm figure here) is universal in nature and can form the basis for recommendation systems, demand prediction, or personalization of offers in other industries as well.
In order to maintain the relevance of recommendations, it is recommended to revalidate and retrain models on a quarterly basis in an automated enterprise environment, combined with continuous monitoring of data drift and production metrics. It is also worth considering integration with the corporate BI platform, which will enable management to continuously monitor the impact of individual offer attributes on the likelihood of sales and quickly adjust the product strategy and marketing communication. In a scenario where the company prioritizes volume growth even at the expense of higher lead handling costs, it is recommended to calibrate the decision threshold or use a cost-sensitive (asymmetric) loss function in the SVM model, which will increase the sensitivity of the classifier with a minimal decrease in specificity.
This study has several limitations that were previously mentioned and must be taken into account when interpreting the results obtained. First, the analysis is based on data from only one manufacturer, which limits the ability to directly generalize the results to other segments of the automotive market. Differences in product strategies, pricing structure, and brand positioning can significantly affect sales patterns. Second, the time scope of the analysis (2021–2023) covers only three years, a relatively short and potentially specific period (including the impact of macroeconomic changes, the COVID-19 pandemic, or the transition to electric drives). Third, the data is geographically limited to the Polish market, which means that the results obtained may not reflect consumer behavior in other European or global markets. Fourth, the binary definition of the target variable (“success”/“lack of success”) used in the study, based on the threshold of the third quartile of the number of units sold, is a simplification of market reality and does not reflect the entire spectrum of sales performance.
Despite these limitations, the results provide valuable insights into the feasibility of using machine learning methods to analyze product configurations and their sales effectiveness. Future research plans to expand the dataset to include other brands, a longer analysis period, and the introduction of more complex measures of success (e.g., margin or market share metrics), which will allow for broader generalization and deeper validation of the models.
The obtained results not only verify statistical accuracy but also translate predictive analytics into measurable operational decisions—from lead prioritization, through dynamic discounting, to production planning. Nevertheless, further improvements in quality are necessary to increase the usefulness of the models in the long term. To this end, it is necessary to continue refining them and, in particular, to revalidate them regularly using the latest observations. It will be particularly important to enrich the dataset with detailed technical parameters of the vehicles sold, which will enable more advanced feature engineering and potentially improve the quality of the predictions further. It is also important to calibrate the decision thresholds in line with changing business objectives.
7. Conclusions
This study showed that the use of machine learning algorithms to predict the sales success of premium vehicles, based on Mercedes-Benz data, is both scientifically justified and practically useful. Of the four models analyzed, Random Forest showed the highest performance (accuracy 0.8431; F1 = 0.7333; AUC = 0.8968) and the most balanced results in terms of sensitivity (0.8462) and specificity (0.8421). Such high stability and overall prediction quality indicate that the model can serve as a primary predictive tool in CRM-class systems to support product configuration recommendation processes. The GBM model, despite its slightly lower accuracy (0.7843) and F1 value (0.6452), offers additional interpretive advantages. Because of its ability to track the impact of individual predictors on the outcome, it can be successfully used for what-if analysis and for testing alternative sales scenarios. The RBF kernel SVM, with its very high specificity (0.8947), is particularly useful in situations where reducing false positive classifications and minimizing costly, unnecessary customer interactions are key. The XGBoost model, on the other hand, although it achieved the lowest metrics in its current configuration (accuracy 0.7255; F1 = 0.5000; AUC = 0.7996), due to its flexibility in the selection of the hyperparameters and potential for further optimization, remains a valuable starting point for future comparative studies and experiments on more complex datasets. It is also worth noting that in order to more fully evaluate the effectiveness of the proposed methods, a simple baseline model—logistic regression—was proposed as a benchmark in the study, which achieved an accuracy of 0.6792, an F1-score = 0.3200, and an AUC = 0.7439. The low values of the metrics confirmed the limited ability of this model to capture the complex, nonlinear relationships between vehicle technical features and sales success.
The results confirm that appropriately selected predictive models can effectively support business processes—from lead prioritization and dynamic discounting, through marketing campaign optimization, to production planning. In practice, this means that a company can allocate its sales and marketing resources more consciously. For example, Random Forest enables quick filtering of leads and directing advisors’ activities towards contacts with the highest conversion potential, which increases the efficiency of the sales team. GBM, on the other hand, allows you to simulate the effects of price changes or equipment packages and verify their impact on the likelihood of sales, making it a particularly useful tool for pricing and product strategy departments. SVM can act as a conservative gatekeeper, eliminating low-quality leads and thus reducing marketing budget waste.
Business benefits also arise at the operational and financial levels. The use of models in production planning allows volumes to be adjusted to actual market preferences and reduces the risk of overproduction in niche segments. In logistics and finance, the implementation of discount matrices based on sales probability allows, on the one hand, the median of discounts granted to be limited and, on the other hand, sales volumes to be maintained at the assumed level. In marketing, on the other hand, models allow the most promising configurations to be identified, such as premium SUVs with a 4MATIC drive or medium-capacity gasoline engines, enabling more precise campaign targeting and better alignment of the message with the target segment.
In summary, the results obtained from classifiers allow not only for the assessment of their statistical accuracy but above all for the translation of predictive analytics into measurable business decisions. However, it is crucial to continue improving the models—regular revalidation, monitoring data drift, and enriching the dataset with detailed technical parameters of vehicles and customer information. This will enable more advanced feature engineering and further improvement in prediction quality. From a strategic perspective, the implementation of such solutions into integrated CRM and BI platforms can form the basis of a competitive advantage, allowing the company to respond more quickly to changing market conditions and manage resource allocation more effectively.
Author Contributions
Conceptualization: O.S. and M.S.; methodology: O.S. and J.H.; software: J.H. and M.M.; validation: O.S., R.C., and A.B.; formal analysis: A.B. and M.M.; investigation: M.S. and J.H.; resources: R.C. and A.B.; data curation: M.M. and R.C.; writing—original draft preparation: O.S., M.S., J.H., R.C., A.B., and M.M.; writing—review and editing: O.S., M.S., J.H., R.C., A.B., and M.M.; visualization: J.H. and M.M.; supervision: O.S., M.S., and A.B.; project administration: O.S. All authors have read and agreed to the published version of the manuscript.
Funding
This study was financed by the Faculty of Security, Logistics and Management, Military University of Technology, research grant no. 065/2025.
Institutional Review Board Statement
Not applicable.
Informed Consent Statement
Not applicable.
Data Availability Statement
Restrictions apply to the availability of these data. Data were obtained from Mercedes-Benz Polska Sp. z o.o. and are available from the authors with the permission of Mercedes-Benz Polska Sp. z o.o.
Acknowledgments
The authors acknowledge Mercedes-Benz Polska Sp. z o.o. for providing the data.
Conflicts of Interest
The authors declare no conflicts of interest.
Appendix A
Structure of Input Data
The analyzed set included 261 unique vehicle configurations described by the following variables:
- Model (factor)—model variant (e.g., A, C, E, GLA, GLC, GLE, EQE, EQS etc.);
- Fuel (factor)—type of fuel (petrol, diesel, hybrid, electric);
- Engine type (numeric)—a technical characteristic of the engine;
- Drive (factor)—type of drive (e.g. 4MATIC, 2WD);
- Number of sales (integer, goal definition only)—the number of units sold in a given configuration between 2021 and 2023.
- Success (factor: no/yes)—goal variable; yes, if the number of sales ≥ Q3 (definition by the third quartile).
References
- Gandomi, A.; Haider, M. Beyond the hype: Big data concepts, methods, and analytics. Int. J. Inf. Manag. 2015, 35, 137–144. [Google Scholar] [CrossRef]
- Kozłowski, E.; Wiśniowski, P.; Gis, M.; Zimakowska-Laskowska, M.; Borucka, A. Vehicle Acceleration and Speed as Factors Determining Energy Consumption in Electric Vehicles. Energies 2024, 17, 4051. [Google Scholar] [CrossRef]
- Zoltners, A.A.; Sinha, P.; Sahay, D.; Shastri, A.; Lorimer, S.E. Practical insights for sales force digitalization success. J. Pers. Sell. Sales Manag. 2021, 41, 87–102. [Google Scholar] [CrossRef]
- Sanchez-Segura, M.I.; González-Cruz, R.; Medina-Dominguez, F.; Dugarte-Peña, G.L. Valuable Business Knowledge Asset Discovery by Processing Unstructured Data. Sustainability 2022, 14, 12971. [Google Scholar] [CrossRef]
- Keusch, F.; Struminskaya, B.; Kreuter, F.; Weichbold, M. Combining Active and Passive Mobile Data Collection: A Survey of Concerns. In Big Data Meets Survey Science, 1st ed.; Hill, C.A., Biemer, P.P., Buskirk, T.D., Japec, L., Kirchner, A., Kolenikov, S., Lyberg, L.E., Eds.; Wiley: Hoboken, NJ, USA, 2020; pp. 657–682. [Google Scholar] [CrossRef]
- Challagalla, G.; Venkatesh, R.; Kohli, A.K. Proactive Postsales Service: When and why does it Pay Off? J. Mark. 2009, 73, 70–87. [Google Scholar] [CrossRef]
- Qaium, H.; Maliha, Z.N.; Sharif, B.N.; Arif, H. Influence of Artificial Intelligence on Customer Relationship Management (CRM). Int. J. Commun. Networks Inf. Secur. (IJCNIS) 2024, 16, 653–662. [Google Scholar]
- Ajiva, O.A.; Ejike, O.G.; Abhulimen, A.O. Addressing challenges in customer relations management for creative industries: Innovative solutions and strategies. Int. J. Appl. Res. Soc. Sci. 2024, 6, 1747–1757. [Google Scholar] [CrossRef]
- Khalid, H.M.; Dangelmaier, M.; Lim, T. The CATER approach to vehicle mass customization. In Proceedings of the 2007 IEEE International Conference on Industrial Engineering and Engineering Management, Singapore, 2–4 December 2007; pp. 1273–1276. [Google Scholar] [CrossRef]
- Helo, P.; Xu, Q.; Kyllönen, S.; Jiao, R. Integrated Vehicle Configuration System—Connecting the domains of mass customization. Comput. Ind. 2010, 61, 44–52. [Google Scholar] [CrossRef]
- Usuga Cadavid, J.P.; Lamouri, S.; Grabot, B. Trends in Machine Learning Applied to Demand & Sales Forecasting: A Review. In Proceedings of the International Conference on Information Systems, Logistics and Supply Chain, Lyon, France, 8–11 July 2018. [Google Scholar]
- Ansari, K.; Ghasemaghaei, M. Big Data Analytics Capability and Firm Performance: Meta-Analysis. J. Comput. Inf. Syst. 2023, 63, 1477–1494. [Google Scholar] [CrossRef]
- Oesterreich, T.D.; Anton, E.; Teuteberg, F. What translates big data into business value? A meta-analysis of the impacts of business analytics on firm performance. Inf. Manag. 2022, 59, 103685. [Google Scholar] [CrossRef]
- Borucka, A.; Grzelak, M. Application of Logistic Regression for Production Machinery Efficiency Evaluation. Appl. Sci. 2019, 9, 4770. [Google Scholar] [CrossRef]
- Ma, L.; Zeng, J.; Zhang, B.; Jiao, R.; Gong, C. Smart Strategies for Local Energy Grids: Optimizing Energy Management with Hybrid Electric Vehicle Integration. Eksploat. I Niezawodn.—Maint. Reliab. 2025, 27, 206049. [Google Scholar] [CrossRef]
- Ahmed, A.; Alshurideh, M.; Al Kurdi, B.; Salloum, S.A. Digital Transformation and Organizational Operational Decision Making: A Systematic Review. In Proceedings of the International Conference on Advanced Intelligent Systems and Informatics 2020; Series Title: Advances in Intelligent Systems and Computing; Hassanien, A.E., Slowik, A., Snášel, V., El-Deeb, H., Tolba, F.M., Eds.; Springer International Publishing: Berlin/Heidelberg, Germany, 2021; Volume 1261, pp. 708–719. [Google Scholar] [CrossRef]
- Tian, H.; Qiu, Y.; Wang, H.; He, J.; Liu, L.; Sun, Y.; Du, X.; Chen, C. Research on Dynamic Weighted FMECA for Reliability of CNC Machine Tools Based on Spherical Fuzzy Sets. Eksploat. I Niezawodn.—Maint. Reliab. 2025, 27, 203500. [Google Scholar] [CrossRef]
- Kim, K.; Kim, B. Decision-Making Model for Reinforcing Digital Transformation Strategies Based on Artificial Intelligence Technology. Information 2022, 13, 253. [Google Scholar] [CrossRef]
- Rumin, P.; Kotowicz, J.; Zastawna-Rumin, A. Predictive maintenance of belt conveyor idlers based on measurements, analytical calculations and decision-making algorithms. Eksploat. I Niezawodn.—Maint. Reliab. 2025, 27, 202096. [Google Scholar] [CrossRef]
- Petrie, R.; Denvil, S.; Ames, S.; Levavasseur, G.; Fiore, S.; Allen, C.; Antonio, F.; Berger, K.; Bretonnière, P.A.; Cinquini, L.; et al. Coordinating an operational data distribution network for CMIP6 data. Geosci. Model Dev. 2021, 14, 629–644. [Google Scholar] [CrossRef]
- Wang, Y.; Wang, G.; Wu, Y.; Zhang, G.; Zheng, R. Optimal predictive maintenance for a nonstationary gamma process. Eksploat. I Niezawodn.—Maint. Reliab. 2025, 27, 203543. [Google Scholar] [CrossRef]
- Fan, C.; Chen, M.; Wang, X.; Wang, J.; Huang, B. A Review on Data Preprocessing Techniques Toward Efficient and Reliable Knowledge Discovery From Building Operational Data. Front. Energy Res. 2021, 9, 652801. [Google Scholar] [CrossRef]
- He, X.; Su, C.; Zhang, Y.; Tang, J. Optimal Imperfect Predictive Maintenance Based on Interval Remaining UsefulLife Prediction. Eksploat. I Niezawodn.—Maint. Reliab. 2025, 27, 203458. [Google Scholar] [CrossRef]
- Ngai, E.; Xiu, L.; Chau, D. Application of data mining techniques in customer relationship management: A literature review and classification. Expert Syst. Appl. 2009, 36, 2592–2602. [Google Scholar] [CrossRef]
- Shang, C.; You, F. Data Analytics and Machine Learning for Smart Process Manufacturing: Recent Advances and Perspectives in the Big Data Era. Engineering 2019, 5, 1010–1016. [Google Scholar] [CrossRef]
- Borucka, A.; Sobczuk, S. The Use of Machine Learning Methods in Road Safety Research in Poland. Appl. Sci. 2025, 15, 861. [Google Scholar] [CrossRef]
- Zhang, J.Z.; Srivastava, P.R.; Sharma, D.; Eachempati, P. Big data analytics and machine learning: A retrospective overview and bibliometric analysis. Expert Syst. Appl. 2019, 184, 115561. [Google Scholar] [CrossRef]
- Zhang, H.; Wang, Q. Risk identification model of aviation system based on text mining and risk propagation. Eksploat. I Niezawodn.—Maint. Reliab. 2024, 27, 192767. [Google Scholar] [CrossRef]
- Mittal, S.; Sangwan, O.P. Big Data Analytics using Machine Learning Techniques. In Proceedings of the 2019 9th International Conference on Cloud Computing, Data Science & Engineering (Confluence), Noida, India, 10–11 January 2019; pp. 203–207. [Google Scholar] [CrossRef]
- Adi, E.; Anwar, A.; Baig, Z.; Zeadally, S. Machine learning and data analytics for the IoT. Neural Comput. Appl. 2020, 32, 16205–16233. [Google Scholar] [CrossRef]
- Li, X.; Song, K.; Shi, J. Degradation generation and prediction based on machine learning methods: A comparative study. Eksploat. I Niezawodn.—Maint. Reliab. 2024, 27, 192168. [Google Scholar] [CrossRef]
- Boone, T.; Ganeshan, R.; Jain, A.; Sanders, N.R. Forecasting sales in the supply chain: Consumer analytics in the big data era. Int. J. Forecast. 2019, 35, 170–180. [Google Scholar] [CrossRef]
- Bhattacharya, S.; Chandra, S.; Dhar, D. Customer behaviour forecasting using predictive analysis of sales data. In Proceedings of the Second International Conference on Innovations in Software Architecture and Computational Systems (ISACS 2022), Kolkata, India, 21–22 July 2022; p. 020008. [Google Scholar] [CrossRef]
- Choudhury, P.; Starr, E.; Agarwal, R. Machine learning and human capital complementarities: Experimental evidence on bias mitigation. Strateg. Manag. J. 2020, 41, 1381–1411. [Google Scholar] [CrossRef]
- Schmidt, A.; Kabir, M.W.U.; Hoque, M.T. Machine Learning Based Restaurant Sales Forecasting. Mach. Learn. Knowl. Extr. 2022, 4, 105–130. [Google Scholar] [CrossRef]
- Semenov, I.; Jacyna, M.; Milewska, B. Improvement uptime of the aging truckload fleets through optimizing maintenance activities. Eksploat. I Niezawodn.—Maint. Reliab. 2025, 28. [Google Scholar] [CrossRef]
- Dairu, X.; Shilong, Z. Machine Learning Model for Sales Forecasting by Using XGBoost. In Proceedings of the 2021 IEEE International Conference on Consumer Electronics and Computer Engineering (ICCECE), Guangzhou, China, 15–17 January 2021; pp. 480–483. [Google Scholar] [CrossRef]
- Malik, S.; Khan, M.; Abid, M.K.; Aslam, N. Sales Forecasting Using Machine Learning Algorithm in the Retail Sector. J. Comput. Biomed. Inform. 2024, 6, 282–294. [Google Scholar]
- Sajawal, M.; Usman, S.; Sanad Alshaikh, H.; Hayat, A.; Ashraf, M.U. A Predictive Analysis of Retail Sales Forecasting using Machine Learning Techniques. Lahore Garrison Univ. Res. J. Comput. Sci. Inf. Technol. 2022, 6, 33–45. [Google Scholar] [CrossRef]
- Gustriansyah, R.; Ermatita, E.; Rini, D.P. An approach for sales forecasting. Expert Syst. Appl. 2022, 207, 118043. [Google Scholar] [CrossRef]
- Eglite, L.; Birzniece, I. Retail Sales Forecasting Using Deep Learning: Systematic Literature Review. Complex Syst. Inform. Model. Q. 2022, 30, 53–62. [Google Scholar] [CrossRef]
- Xie, P.; Li, C. Dynamic Modeling and Optimization of Energy Storage in Peer-to-Peer Energy Trading Systems. Eksploat. I Niezawodn.—Maint. Reliab. 2024, 27, 195761. [Google Scholar] [CrossRef]
- Deniz, E.; Çökekoğlu Bülbül, S. Predicting Customer Purchase Behavior Using Machine Learning Models. Inf. Technol. Econ. Bus. 2024, 1, 1–6. [Google Scholar] [CrossRef]
- Gedam, V.V.; Raut, R.D.; Lopes de Sousa Jabbour, A.B.; Narkhede, B.E.; Grebinevych, O. Sustainable manufacturing and green human resources: Critical success factors in the automotive sector. Bus. Strategy Environ. 2021, 30, 1296–1313. [Google Scholar] [CrossRef]
- Wang, Y.; Kung, L.; Byrd, T.A. Big data analytics: Understanding its capabilities and potential benefits for healthcare organizations. Technol. Forecast. Soc. Chang. 2018, 126, 3–13. [Google Scholar] [CrossRef]
- Mukherjee, S.; Das, A. Industrial Data Operations: Empowering the Energy Industry with Smarter Data Management Solutions. In Proceedings of the GOTECH, Dubai City, United Arab Emirates, 21–23 April 2025. [Google Scholar] [CrossRef]
- Kumar, V.; Reinartz, W.J. Customer Relationship Management: Concept, Strategy, and Tools, 3rd ed.; Springer Texts in Business and Economics; Springer: Berlin/Heidelberg, Germany, 2018. [Google Scholar] [CrossRef]
- Ledro, C.; Nosella, A.; Vinelli, A. Artificial intelligence in customer relationship management: Literature review and future research directions. J. Bus. Ind. Mark. 2022, 37, 48–63. [Google Scholar] [CrossRef]
- Guerola-Navarro, V.; Gil-Gomez, H.; Oltra-Badenes, R.; Soto-Acosta, P. Customer relationship management and its impact on entrepreneurial marketing: A literature review. Int. Entrep. Manag. J. 2024, 20, 507–547. [Google Scholar] [CrossRef]
- Ascarza, E. Retention Futility: Targeting High-Risk Customers Might be Ineffective. J. Mark. Res. 2018, 55, 80–98. [Google Scholar] [CrossRef]
- Hassani, H.; Huang, X.; Silva, E. Digitalisation and Big Data Mining in Banking. Big Data Cogn. Comput. 2018, 2, 18. [Google Scholar] [CrossRef]
- Fang, K.; Jiang, Y.; Song, M. Customer profitability forecasting using Big Data analytics: A case study of the insurance industry. Comput. Ind. Eng. 2016, 101, 554–564. [Google Scholar] [CrossRef]
- Probst, P.; Wright, M.N.; Boulesteix, A. Hyperparameters and tuning strategies for random forest. WIREs Data Min. Knowl. Discov. 2019, 9, e1301. [Google Scholar] [CrossRef]
- Chen, T.; Guestrin, C. XGBoost: A Scalable Tree Boosting System. In Proceedings of the 22nd ACM SIGKDD International Conference on Knowledge Discovery and Data Mining, San Francisco, CA, USA, 13–17 August 2016; ACM: New York, NY, USA, 2016; pp. 785–794. [Google Scholar] [CrossRef]
- Breiman, L. Random Forests. Mach. Learn. 2001, 45, 5–32. [Google Scholar] [CrossRef]
- Verbeke, W.; Martens, D.; Baesens, B. Social network analysis for customer churn prediction. Appl. Soft Comput. 2014, 14, 431–446. [Google Scholar] [CrossRef]
- Natekin, A.; Knoll, A. Gradient boosting machines, a tutorial. Front. Neurorobot. 2013, 7. [Google Scholar] [CrossRef] [PubMed]
- Hsu, C.W.; Chang, C.C.; Lin, C.J. A Practical Guide to Support Vector Classification; Technical Report; Department of Computer Science, National Taiwan University: Taipei, Taiwan, 2003. [Google Scholar]
- Sharma, A.; Kumar Panigrahi, P. A Review of Financial Accounting Fraud Detection based on Data Mining Techniques. Int. J. Comput. Appl. 2012, 39, 37–47. [Google Scholar] [CrossRef]
- Sokolova, M.; Lapalme, G. A systematic analysis of performance measures for classification tasks. Inf. Process. Manag. 2009, 45, 427–437. [Google Scholar] [CrossRef]
- Kamble, S.S.; Gunasekaran, A.; Sharma, R. Analysis of the driving and dependence power of barriers to adopt industry 4.0 in Indian manufacturing industry. Comput. Ind. 2018, 101, 107–119. [Google Scholar] [CrossRef]
- Moussa, A.; Aoulmi, Z. Improving Electric Vehicle Maintenance by Advanced Prediction of Failure Modes Using Machine Learning Classifications. Eksploat. I Niezawodn.—Maint. Reliab. 2025, 27, 201372. [Google Scholar] [CrossRef]
- Ghodake, S.P.; Malkar, V.R.; Santosh, K.; Jabasheela, L.; Abdufattokhov, S.; Gopi, A. Enhancing Supply Chain Management Efficiency: A Data-Driven Approach using Predictive Analytics and Machine Learning Algorithms. Int. J. Adv. Comput. Sci. Appl. 2024, 15, 672–686. [Google Scholar] [CrossRef]
- Adamiak, B.; Andrych-Zalewska, M.; Merkisz, J.; Chłopek, Z. The uniqueness of pollutant emission and fuel consumption test results for road vehicles tested on a chassis dynamometer. Eksploat. I Niezawodn.—Maint. Reliab. 2024, 27, 195747. [Google Scholar] [CrossRef]
- Cherif, I.L.; Kortebi, A. On using eXtreme Gradient Boosting (XGBoost) Machine Learning algorithm for Home Network Traffic Classification. In Proceedings of the IEEE 2019 Wireless Days (WD), Manchester, UK, 24–26 April 2019; pp. 1–6. [Google Scholar] [CrossRef]
- Dhaliwal, S.S.; Nahid, A.A.; Abbas, R. Effective Intrusion Detection System Using XGBoost. Information 2018, 9, 149. [Google Scholar] [CrossRef]
- Fatima, S.; Hussain, A.; Amir, S.B.; Awan, M.G.Z.; Ahmed, S.H.; Aslam, S.M.H. XGBoost and Random Forest Algorithms: An in Depth Analysis. Pak. J. Sci. Res. 2023, 3, 26–31. [Google Scholar] [CrossRef]
- Imani, M.; Beikmohammadi, A.; Arabnia, H.R. Comprehensive Analysis of Random Forest and XGBoost Performance with SMOTE, ADASYN, and GNUS Under Varying Imbalance Levels. Technologies 2025, 13, 88. [Google Scholar] [CrossRef]
- Couronné, R.; Probst, P.; Boulesteix, A.L. Random forest versus logistic regression: A large-scale benchmark experiment. BMC Bioinform. 2018, 19, 270. [Google Scholar] [CrossRef]
- Airlangga, G. Comparative Study of XGBoost, Random Forest, and Logistic Regression Models for Predicting Customer Interest in Vehicle Insurance. Sinkron 2024, 8, 2542–2549. [Google Scholar] [CrossRef]
Disclaimer/Publisher’s Note: The statements, opinions and data contained in all publications are solely those of the individual author(s) and contributor(s) and not of MDPI and/or the editor(s). MDPI and/or the editor(s) disclaim responsibility for any injury to people or property resulting from any ideas, methods, instructions or products referred to in the content. |
© 2025 by the authors. Licensee MDPI, Basel, Switzerland. This article is an open access article distributed under the terms and conditions of the Creative Commons Attribution (CC BY) license (https://creativecommons.org/licenses/by/4.0/).