1. Introduction
Rail freight transport is a key part of modern logistics, offering a sustainable, high-capacity, and cost-effective alternative to road transport. In line with the European Union’s strategic objectives of decarbonization and decongestion, recent policies have encouraged the use of trains to increase network capacity [
1,
2]. In this context, the ability to ensure operational safety and structural reliability of freight wagons takes relevance.
Freight rail operations rely on mechanical couplings (such as buffers, hooks, and drawgears) to keep the physical link between wagons and to ensure the proper dynamic of the entire freight vehicle [
3,
4]. These components are responsible for both load transmission and dynamic stability and are of great importance; indeed, any malfunction, deformation, or misalignment in these components can compromise the safety of the operations and create economic consequences across the logistics chain. A broken coupling or knuckle can cause a train to separate, triggering an emergency brake and potentially resulting in derailments [
5,
6,
7]. Such events are dangerous (especially if they involve hazardous cargo) and lead to operational disruption. For example, in heavy-haul trains, the lateral stability of couplers is closely monitored because even slight angular deviations can threaten train handling and stability [
8]. This suggests that one of the most important things is to monitor coupling properly, from both a safety and an operational point of view.
Traditionally, the condition of mechanical couplings and related wagon components has been assessed through periodic manual inspections and onboard sensing devices. Maintenance staff typically perform visual checks on couplers, looking for signs of wear, cracks, or incorrect engagement during pre-departure inspections. However, manual inspections are intensive, subjective, and limited in frequency, which means that issues can occur and go unnoticed between scheduled checks. Visibility is often constrained (e.g., poor lighting or inaccessible inspection angles), and inspectors might miss defects until they escalate.
Driven by these limitations, the rail industry is increasingly turning toward real-time monitoring, condition-based maintenance strategies, and railways damage detection [
9,
10]. Instead of fixed inspection intervals, condition-based maintenance calls for servicing equipment when data indicates the need [
11]. This approach can be really pertinent for freight couplings and suspension elements [
12,
13], which experience highly variable stress cycles. Real-time monitoring systems can track coupling performance (e.g., forces, displacements, and alignment) during train operation and alert operators to anomalies [
14,
15,
16]. Recent technological advances have made such continuous monitoring feasible; for example, digital retrofitting of freight wagons with sensors and wireless communication units allows live data on wagon health to be collected and analyzed. Intelligent freight wagons have demonstrated the value of this data-driven approach, detecting faults and wear conditions that would not have been caught during periodic checks [
17].
Among emerging monitoring technologies, computer vision has gained attention as a non-invasive and cost-effective solution to improve safety in the normal functioning of trains [
18,
19,
20]. One of the main targets of the onboard vision systems can be for assessing the condition of mechanical components. Vision-based monitoring uses cameras and image analysis algorithms to visually inspect components, which in the context of freight wagons means monitoring the couplers, buffers, and other parts for signs of damage or abnormal behavior.
A key advantage of using cameras is that physical contact is not required to monitor the components. This means that the sensor does not interfere with the normal functioning of the mechanical system and avoids issues of sensor durability. Instead, cameras can be positioned either on board or on the wayside to capture images or video of the wagon connections in service. Vision systems can directly measure the relative motion or alignment between mechanical components [
21,
22]. Tracking visual markers or features on consecutive wagons can be useful to quantify displacements or angular rotations at the coupling; with the ongoing digitalization of rail assets and improvements in image processing, such vision techniques are becoming increasingly practical for railway maintenance [
23]. Computer vision offers a complementary approach to traditional sensors, providing continuous visual data about coupling conditions without direct sensor installation on every component [
24].
In recent years, computer vision has therefore emerged as one of the main technologies driving automation in the railway sector. Early approaches, such as that by [
25], demonstrated the feasibility of deep learning use for rail track monitoring, paving the way for the new AI-based generation. Since then, several solutions have used Convolutional Neural Networks (CNNs) and multimodal sensing to improve detection accuracy and environmental robustness. In [
26,
27], CNN-based systems for rail surface and defect detection have been developed, achieving high precision under controlled conditions. In [
27], a model has been proposed to reduce computational complexity, enabling a near real-time inference on embedded GPUs. In [
28], it is possible to find a comprehnsive study on the use of CNNs for track maintenance, highlighting the need for a reliable generalization under variable lighting conditions. More recent developments have focused on enhancing computational efficiency and enabling real-time onboard operation. The method proposed in [
29] is a lightweight convolutional network for missing bolt detection, optimized for deployment on resource-limited embedded devices. The study by [
30] presents RH-Net, a CNN–transformer hybrid architecture that achieved high accuracy and real-time performance for obstacle detection. The study by [
31] improved generalization through the use of multiple CNNs across multiple track conditions, while [
32] proposed an FPGA-based AI solution for fault detection that balances energy efficiency and computational speed. Hybrid vision–sensor systems have also been explored: The authors of [
33] developed a wayside AI-assisted vision system that integrates optical inspection with vibration sensing. The authors of [
34] implemented an unsupervised anomaly detection framework based on autoencoders, identifying visual irregularities without prior labeling. Further lightweight approaches, such as that by [
35], further demonstrate the trend toward embedded, real-time, and efficient visual inspection systems. Despite these advances, many limitations remain: many current systems depend on high-end computing or offline data processing, which affects their scalability for deployment. Moreover variations in illumination, vibration, and occlusion remain key challenges affecting robustness. While significant progress has been achieved, there is still a clear need for cost-effective, onboard, and real-time vision systems capable of maintaining reliable performance under operating conditions. Based on these considerations, this study proposes a vision-based monitoring framework designed to overcome limitations such as dependence on high-end hardware, limited adaptability, and a lack of 3D motion estimation. This work introduces a practical computer vision approach designed for onboard implementation.
The main objective of this study is to develop a vision-based 3D monitoring system capable of estimating the angular excursions and longitudinal displacements of mechanical couplings in freight wagons during operation in order to support condition-based maintenance and enhance safety under real field conditions. Therefore, the main contributions can be summarized as follows:
Development of an RGB-D vision-based system for 3D monitoring of railway wagon couplings, designed for real operating conditions.
Integration of depth-based reconstruction with a normalized cross-correlation tracking algorithm to compute 3D geometric measurements without physical contact.
Experimental validation by deploying the proposed methodology on a T3000 articulated freight wagon, thus demonstrating measurements consistent with operational standards.
Design of a processing pipeline suitable for embedded implementation, supporting condition-based maintenance and safety monitoring strategies in rail transport.
This paper is organized as follows: In
Section 2, the system setup is illustrated; the computer vision algorithm is described in
Section 3; experimental results are presented in
Section 4. Finally, conclusions and future developments are drawn in
Section 5.
2. System Setup
The experimental setup is installed on the extremity of a T3000 articulated wagon. The T3000 wagon is a modern articulated intermodal freight wagon manufactured by
Ferriere Cattaneo SA (Gubiasco, Switzerland) for the transport of both semi-trailers and containers.
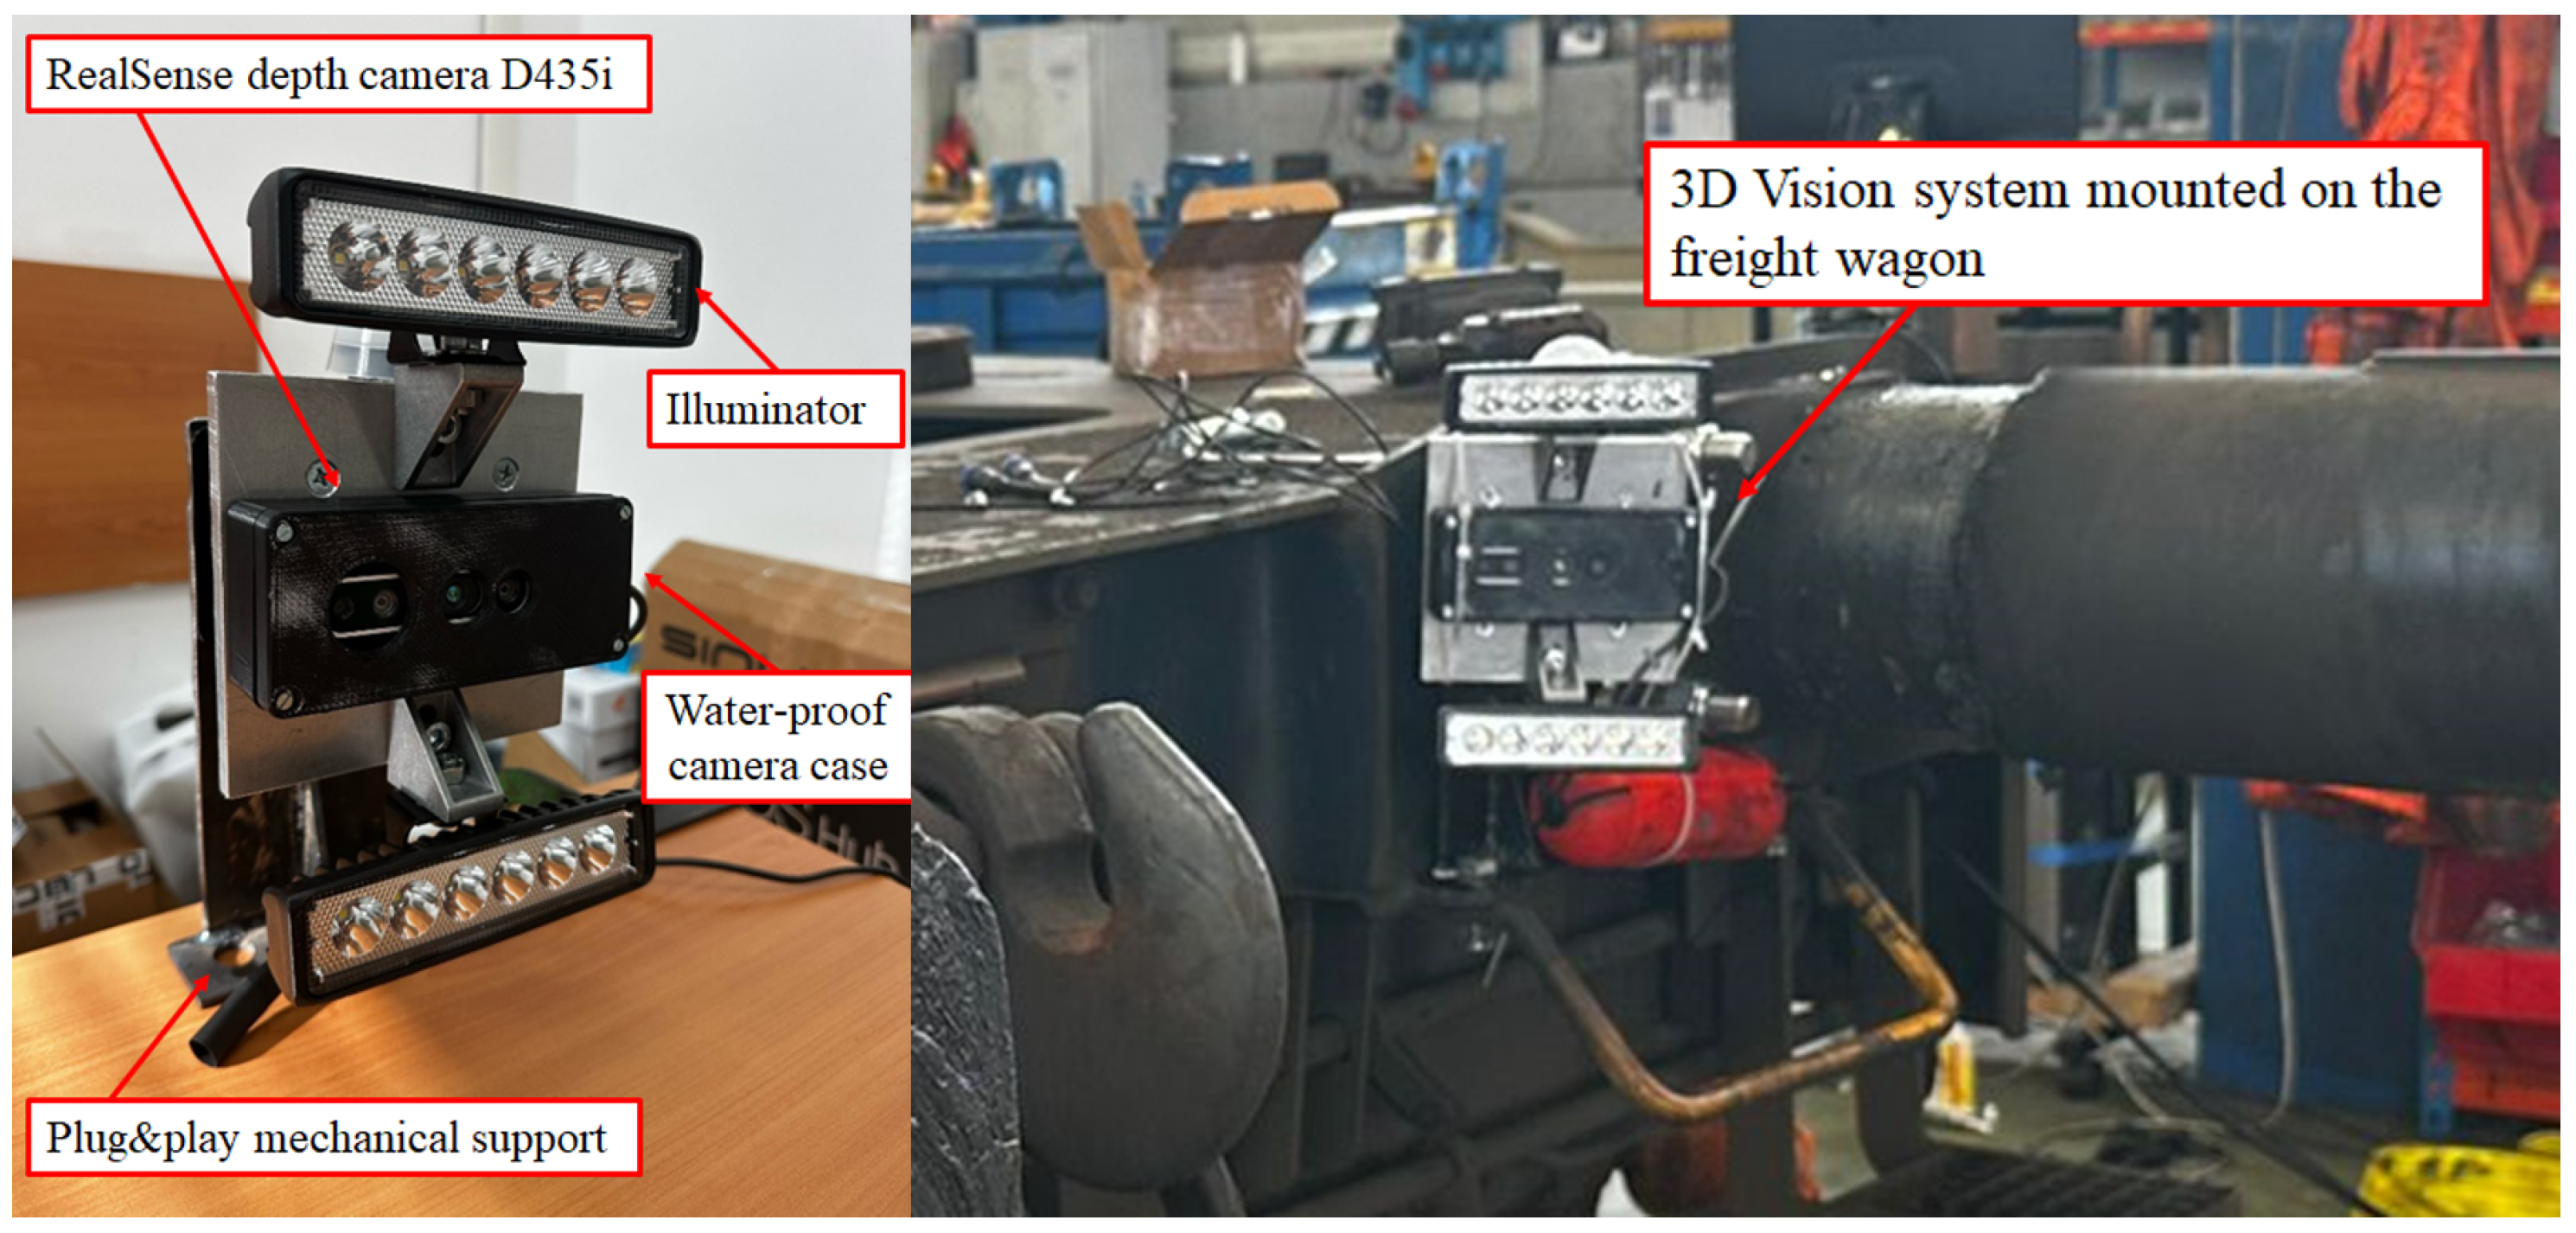
Figure 1 details the position of the setup and highlights the buffer and hook which are seen by the camera.
The setup involves an RGB-D vision system designed for monitoring railway freight wagons, buffers, and hooks (
Figure 2) mounted on the wagon chassis and oriented toward the coupler region. The camera is connected to an HP compact computing unit (NUC type) running Ubuntu and ROS2, which manages the real-time acquisition and synchronization of data streams.
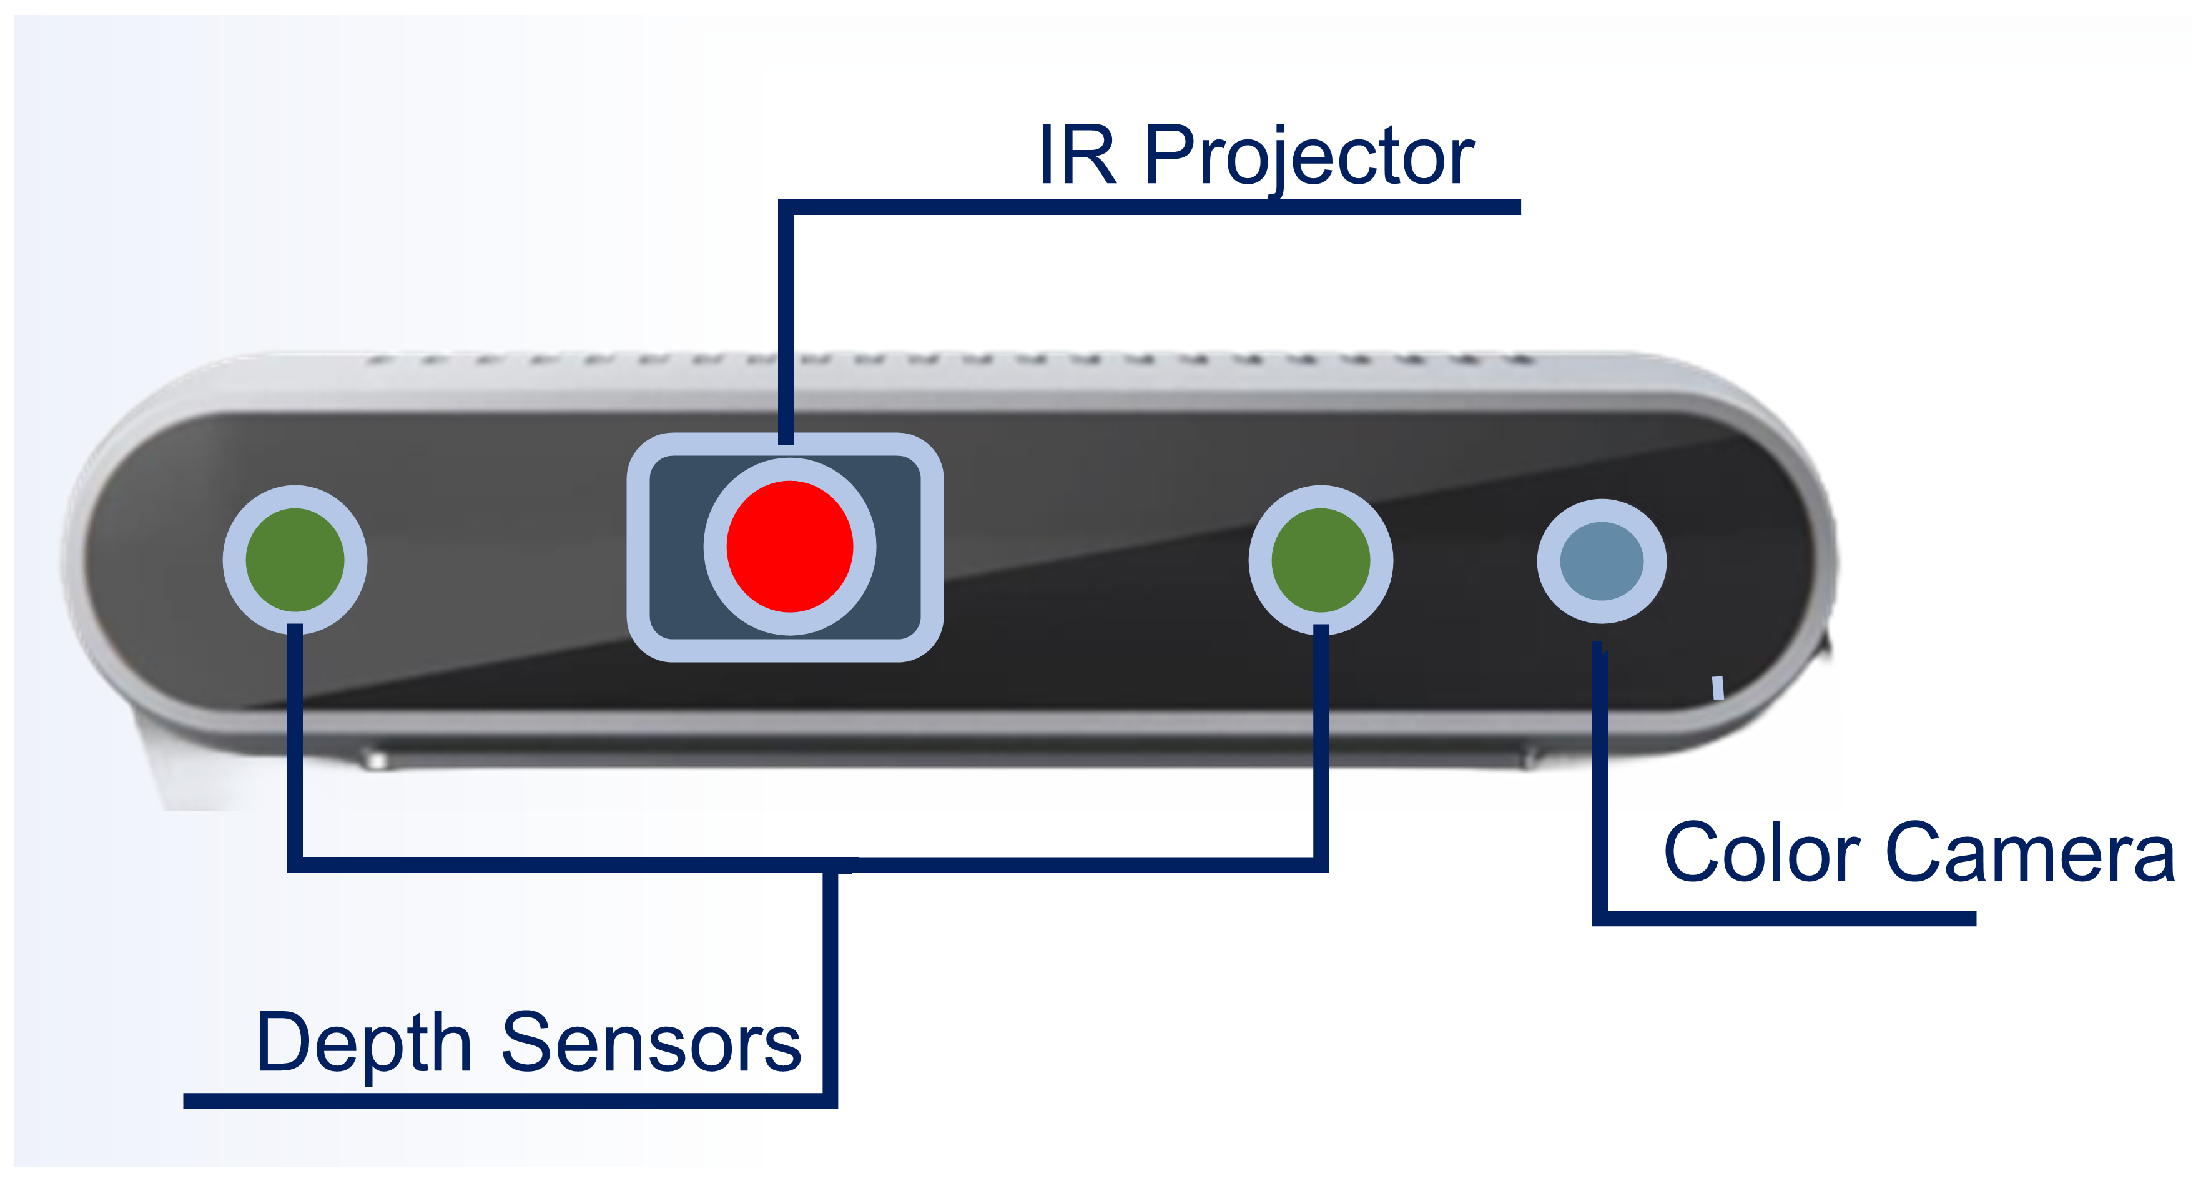
The camera is configured and installed upside down for operational requirements, involving a 180-degree rotation of captured frames in subsequent data processing stages. The post-process stage begins with a Python script developed using the pyrealsense2 library (Intel RealSense SDK 2.0, Intel Corporation, Santa Clara, CA, USA; accessed on 10 July 2024). script developed to handle data recorded in a compressed .bag file format. This script extracts synchronized RGB and depth images, aligns them spatially and temporally, and saves these images as structured MATLAB data (MATLAB R2024a, MathWorks, Natick, MA, USA). (.mat files) for further processing. In our setup, the RealSense D435i camera (in
Figure 3) recorded synchronized RGB (640 × 480) and depth (640 × 480) frames at 15 fps, ensuring uniform temporal sampling for all the following analyses.
Intrinsic parameters for 3D reconstruction, such as focal lengths
and principal points
, are also extracted from the calibration process and stored. In matrix form, these scalars are compacted into the camera matrix
K, where
In addition to the intrinsic parameters, the calibration process also provided the extrinsic parameters and the lens distortion coefficients. The extrinsic parameters define the transformation matrix that relates the right stereo camera to the left one, while the distortion coefficients characterize the radial and tangential distortions introduced by the lens. These parameters are essential for accurately back-projecting the 2D tracked points into 3D space, ensuring a geometric analysis. Environmental factors influenced the setup significantly: a transparent protective panel placed in front of the camera to achieve protection standards introduced potential image distortions; therefore, post-process steps were implemented to reduce this effect. In order to ensure measurement accuracy, the calibration process was carried out with the protective housing already installed in front of the camera using a standard chessboard calibration pattern. This procedure compensated for any optical distortions introduced by the transparent panel and guaranteed the correctness of the camera parameters. The camera and supporting structure were rigidly mounted to minimize vibration effects and mechanical oscillations during train motion. The experiments were conducted under natural daylight conditions, with moderate variations in illumination typical of outdoor rail environments. Despite minor motion blur and lighting changes, the combination of frame rate and depth-based reconstruction ensured stable feature tracking performance throughout the test.
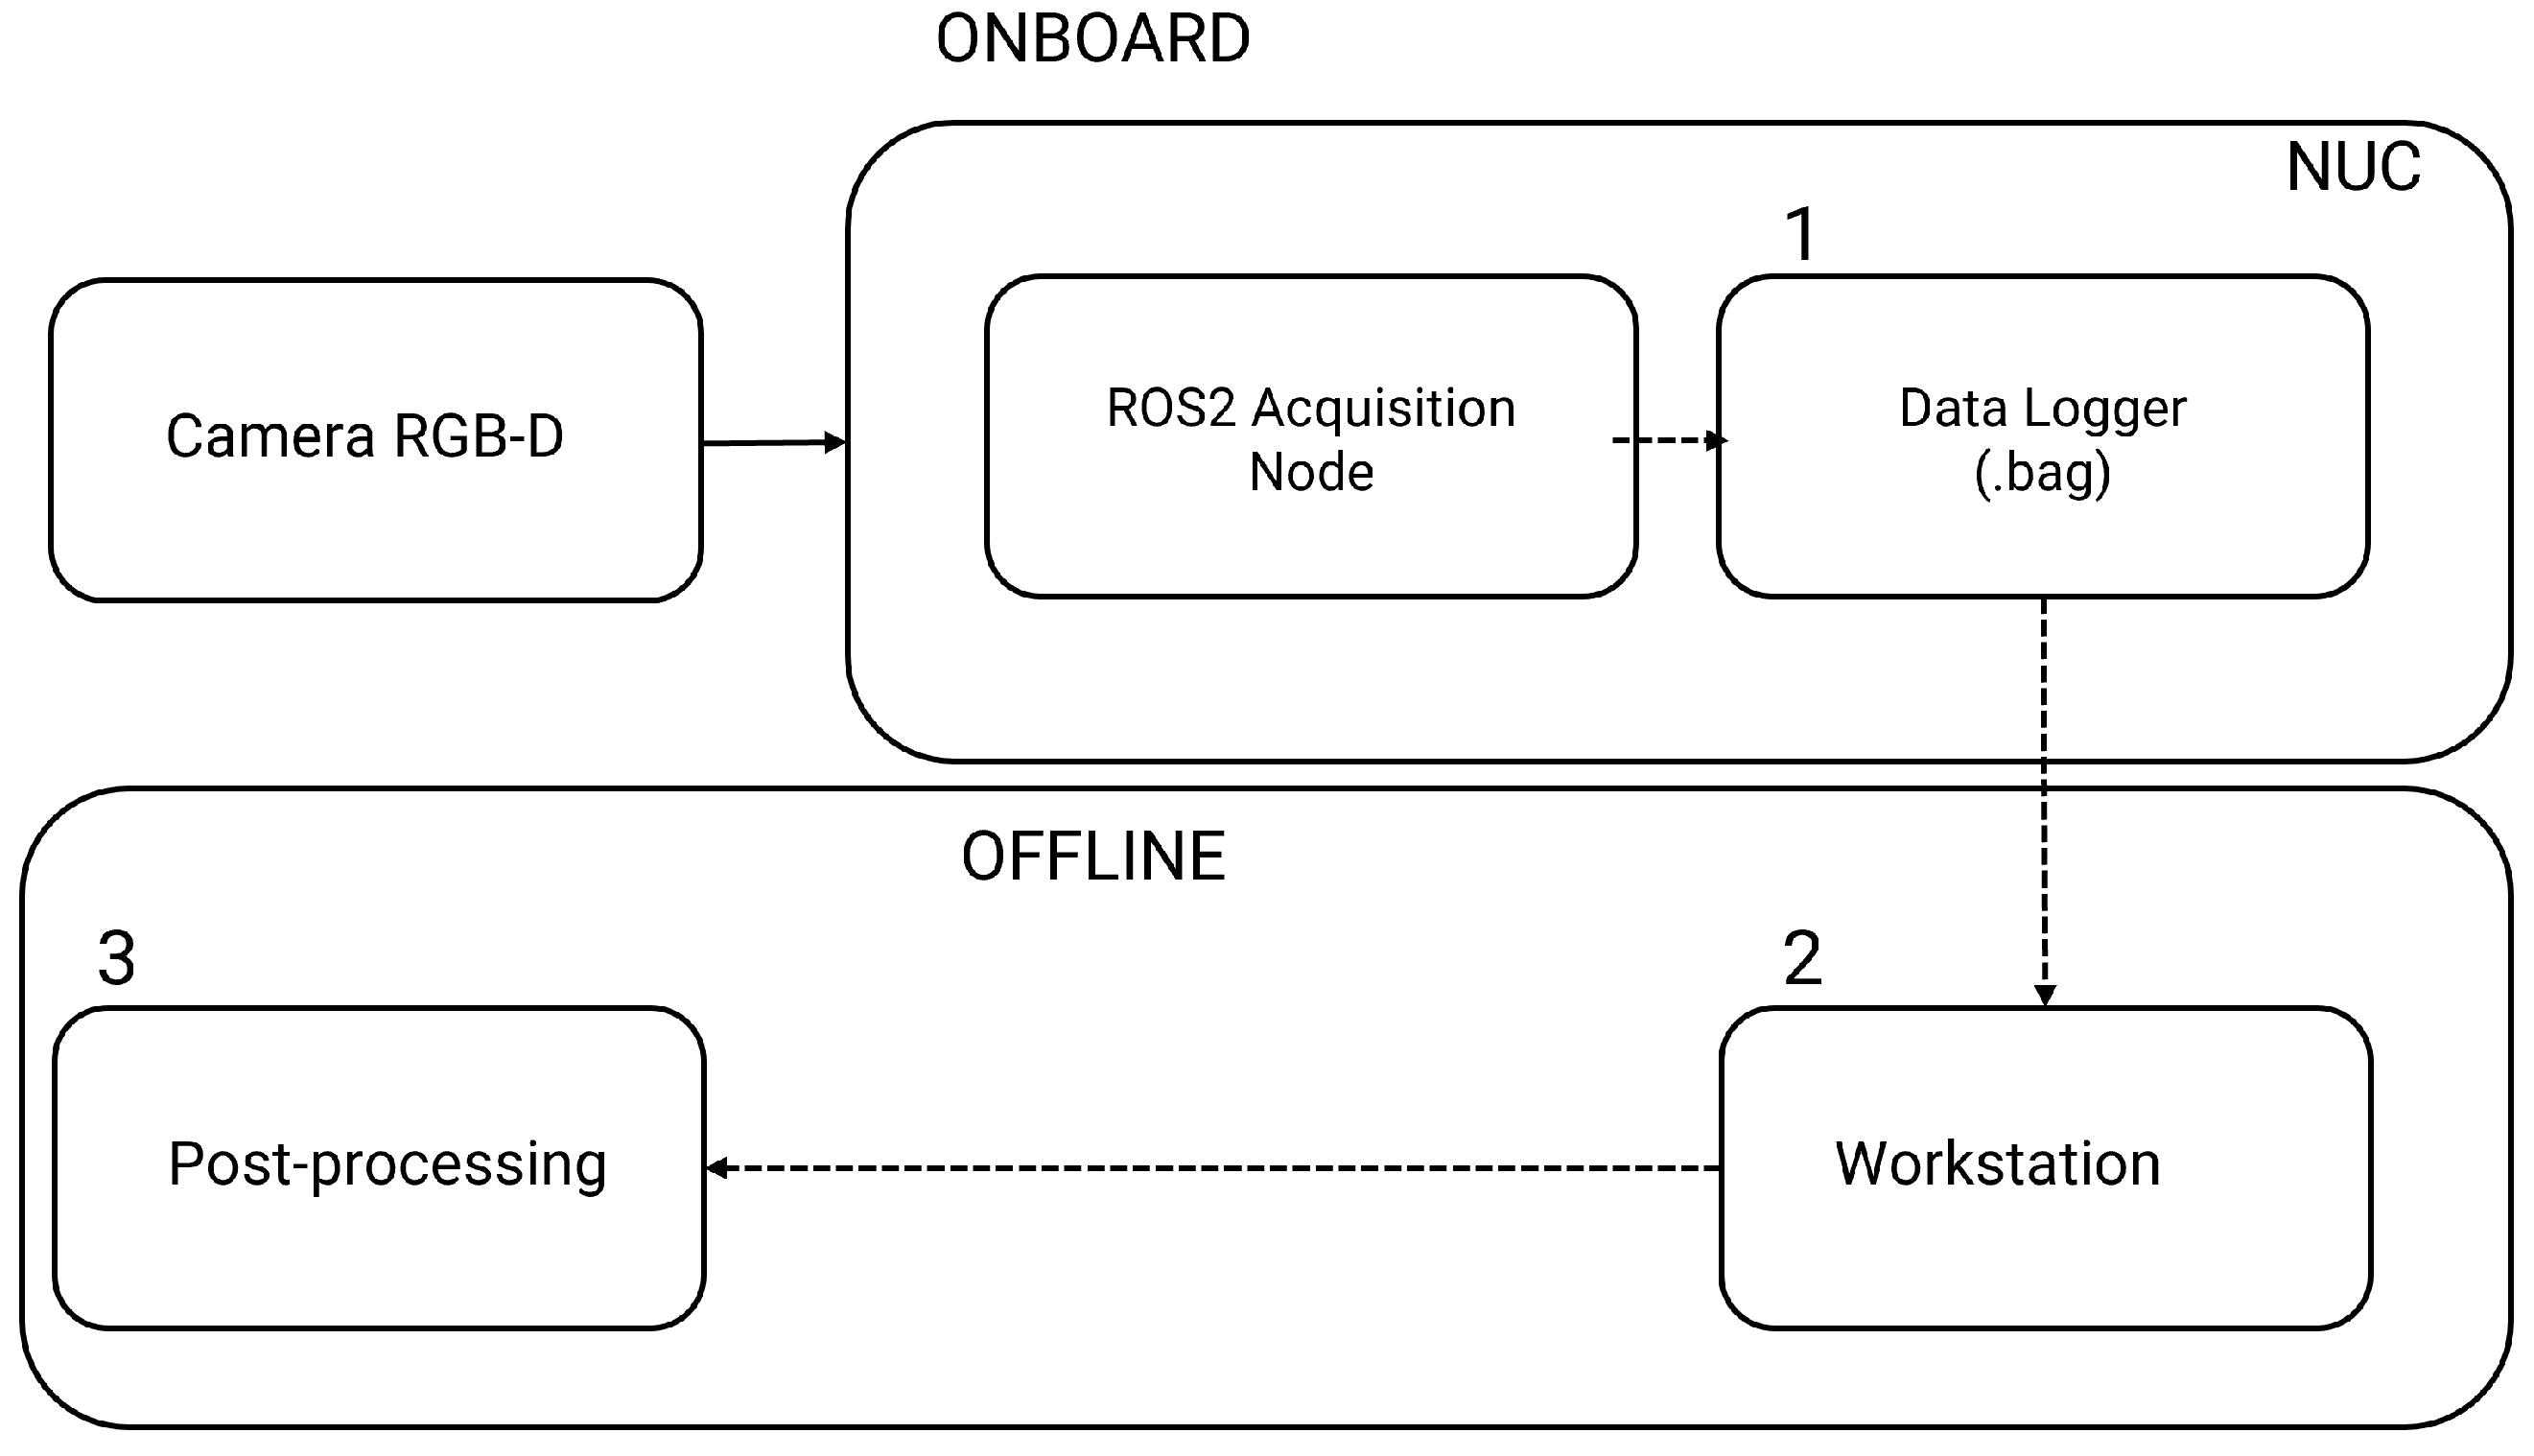
The functioning architecture (
Figure 4) of the system can be divided into three main modules: (1) real-time image acquisition, data recording and timestamping, (2) offline feature extraction and motion estimation, and (3) post-processing and visualization of results.
The monitored scene consists of specific mechanical components of railway freight wagons, particularly hooks and buffers, chosen for better analysis of the relative movements between two carriages and for their relevance to the structural integrity connection and safety of railway operations. The positioning of the camera was strategically selected to provide better coverage of these components, ensuring the analysis of their displacement and orientation during motion. Moreover, such a choice minimized interferences with normal operations performed on the wagon, such as coupling and uncoupling with adjacent wagons or loading operations.
3. Description of the Computer Vision Method
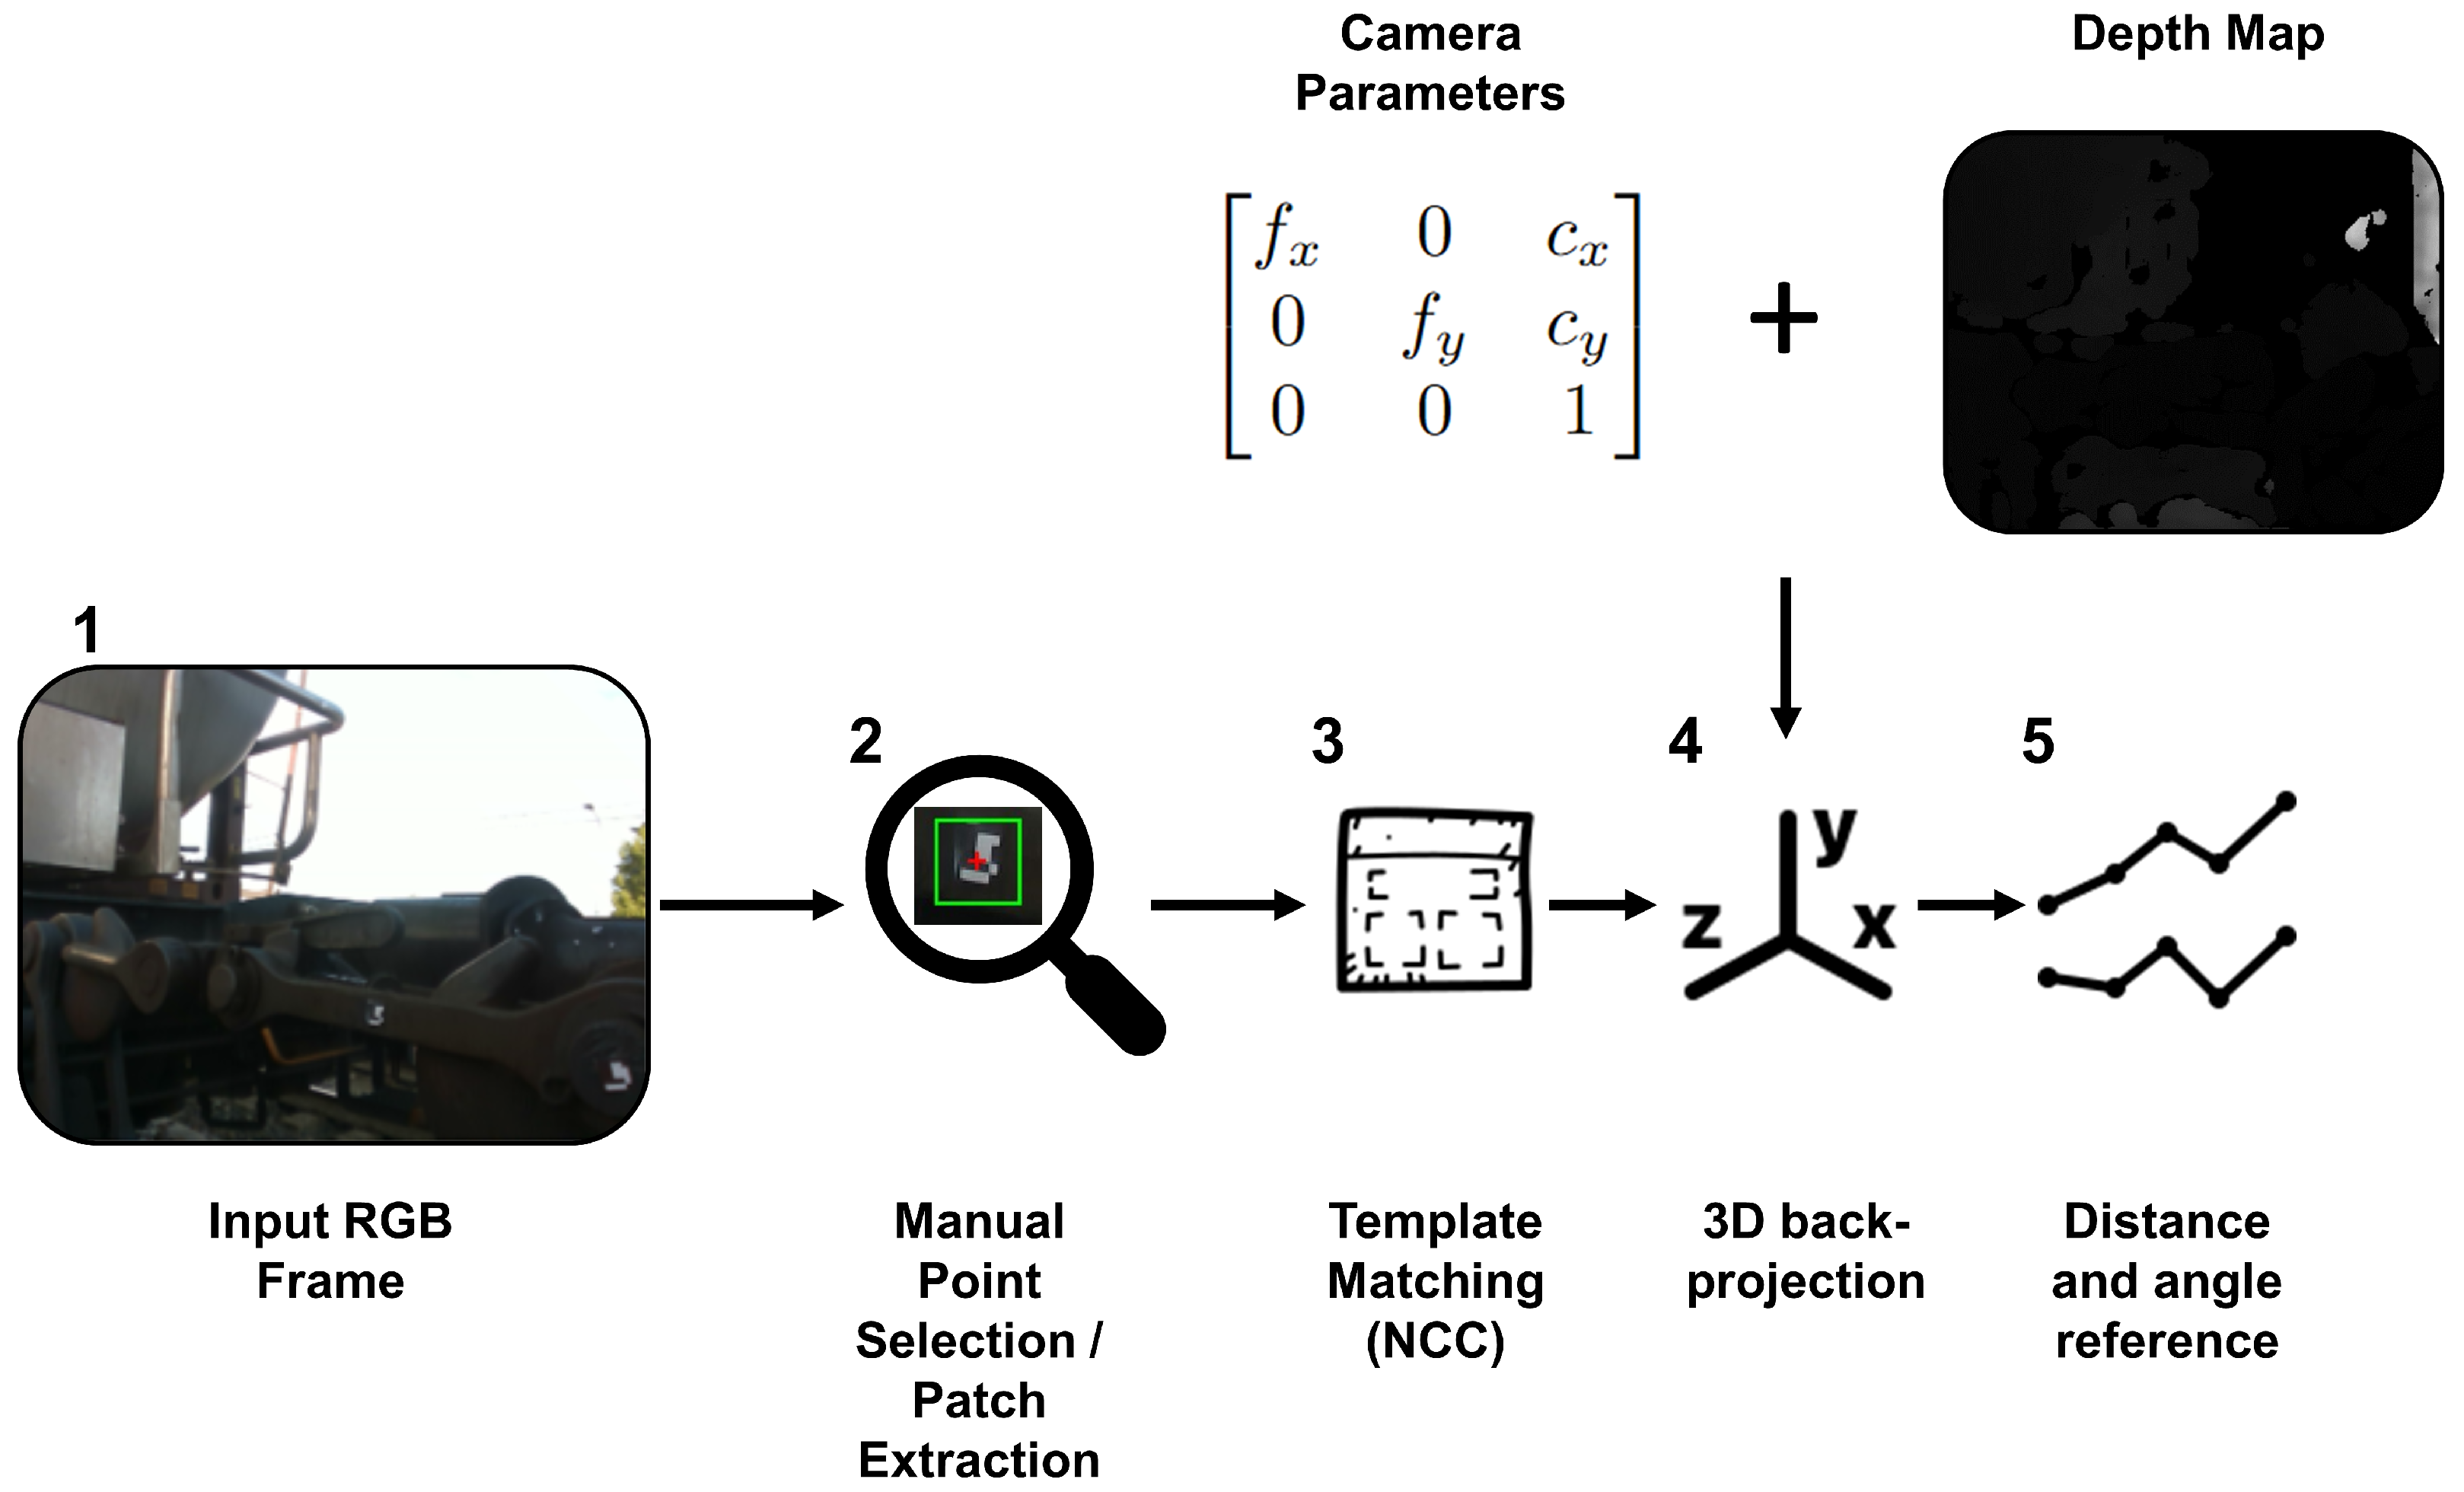
The computer vision algorithm developed for this system is structured as a multistage pipeline that integrates manual picking input with automated detection and tracking, as shown in
Figure 5.
The main processing steps of the proposed algorithm, as illustrated in
Figure 5, are summarized as follows:
Acquire synchronized RGB and depth frames.
Manually select points of interest on the initial RGB frame.
For each frame k:
- 3.1
Perform normalized cross-correlation (NCC) within a region of interest to track template 2D positions.
- 3.2
Extract valid depth values and back-project the tracked points to 3D coordinates.
- 3.3
Compute the hook angle and the buffer displacement .
Apply a moving-average filter to smooth signals and compute and .
For every new frame, tracking is performed using a template matching approach based on normalized cross-correlation (NCC) [
36]. For each tracked point, the algorithm searches for the best match of the reference path within a region of interest (ROI), in the current frame, centered around the last known 2D position. The algorithm computes the NCC between the template and candidate regions, selecting the location with the highest score as the updated position of the point:
where
represents the coordinates of the point that is recognized with the maximum correlation;
is the template patch;
is the ROI in the current frame; and
and
represent their respective mean intensities. This approach, while simple, is known for its effectiveness in relatively static or rigid scenes.
After each point is located in the 2D image, its depth value is extracted from the corresponding depth map. If the depth at that exact pixel is zero or otherwise invalid, the algorithm falls back on a local search: it scans a square neighborhood of size (
) centered on the pixel (
px default pixels, i.e., a radius of 15 px). The valid depth sample whose coordinates are closest to the center of this window is selected. Afterwards, each tracked 2D point is back-projected into 3D space using the previous depth information from the aligned depth images and the obtained intrinsic camera parameters:
where
z is the depth information. Using 3D information, it is possible to measure geometric changes and structural movement. Once two points are tracked (each point selected belongs to the hook in order to define an axis parallel to the axis of the hook), the algorithm can track the angle that the line connecting them forms with the optical axis (Z-axis) of the camera (hook case) and the projection along the object axis of the midpoint (buffer case). Given the 3D coordinates of the two tracked points at frame
k,
and
, the direction vector is computed, and the normalized direction is
The angle
between the segment and the camera Z-axis
is then calculated as
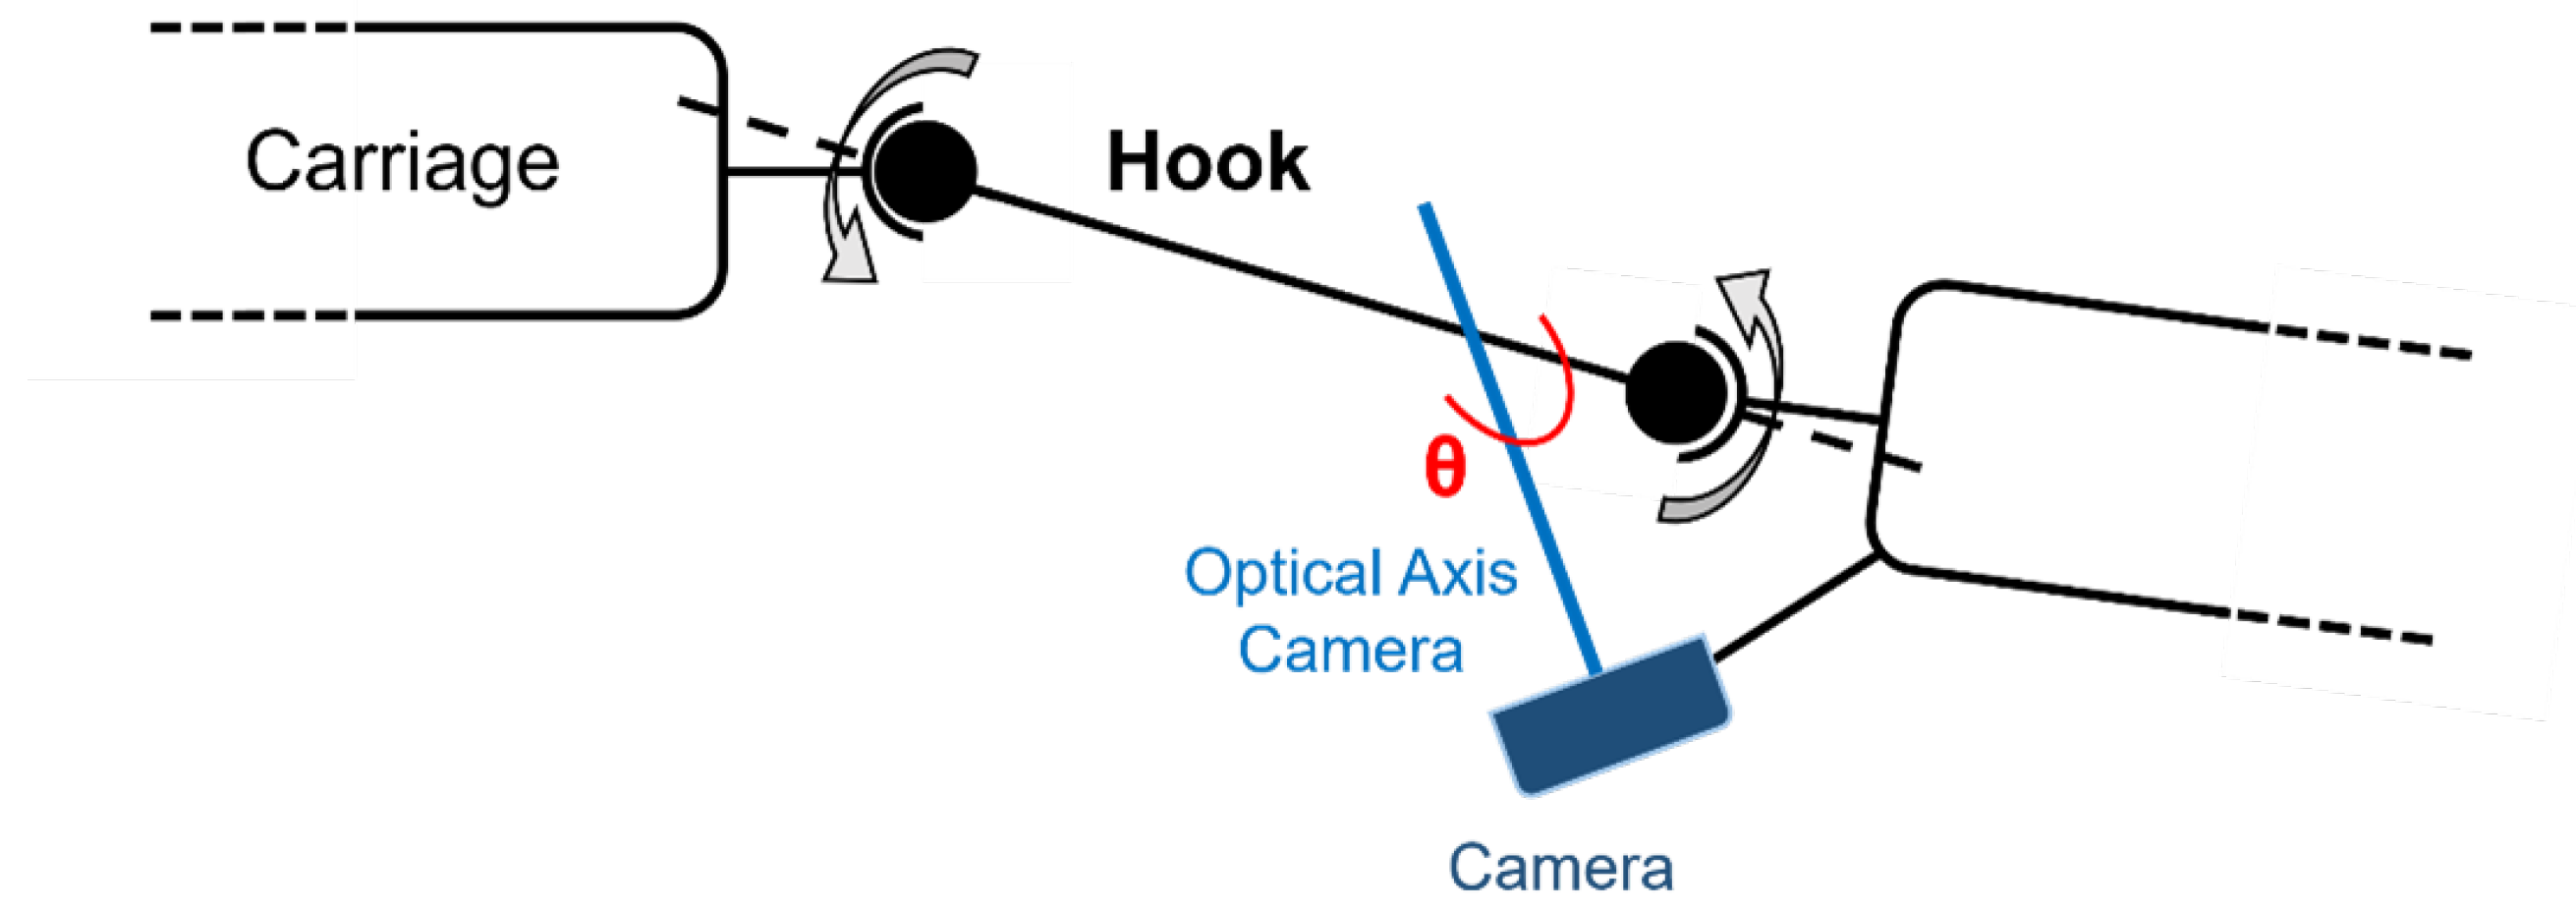
The angle in consideration is shown in
Figure 6.
While this angle can be transformed into the carriage reference frame if needed, for the purpose of this study, the primary scope is the angular excursion, that is, the range of angle values observed throughout the sequence.
This metric quantifies the rotation experienced by the monitored component, without having an explicit transformation to the wagon reference system. As a result, the maximum angular excursion is used as the practical index for monitoring changes in the geometry of the monitored system. On the other hand,
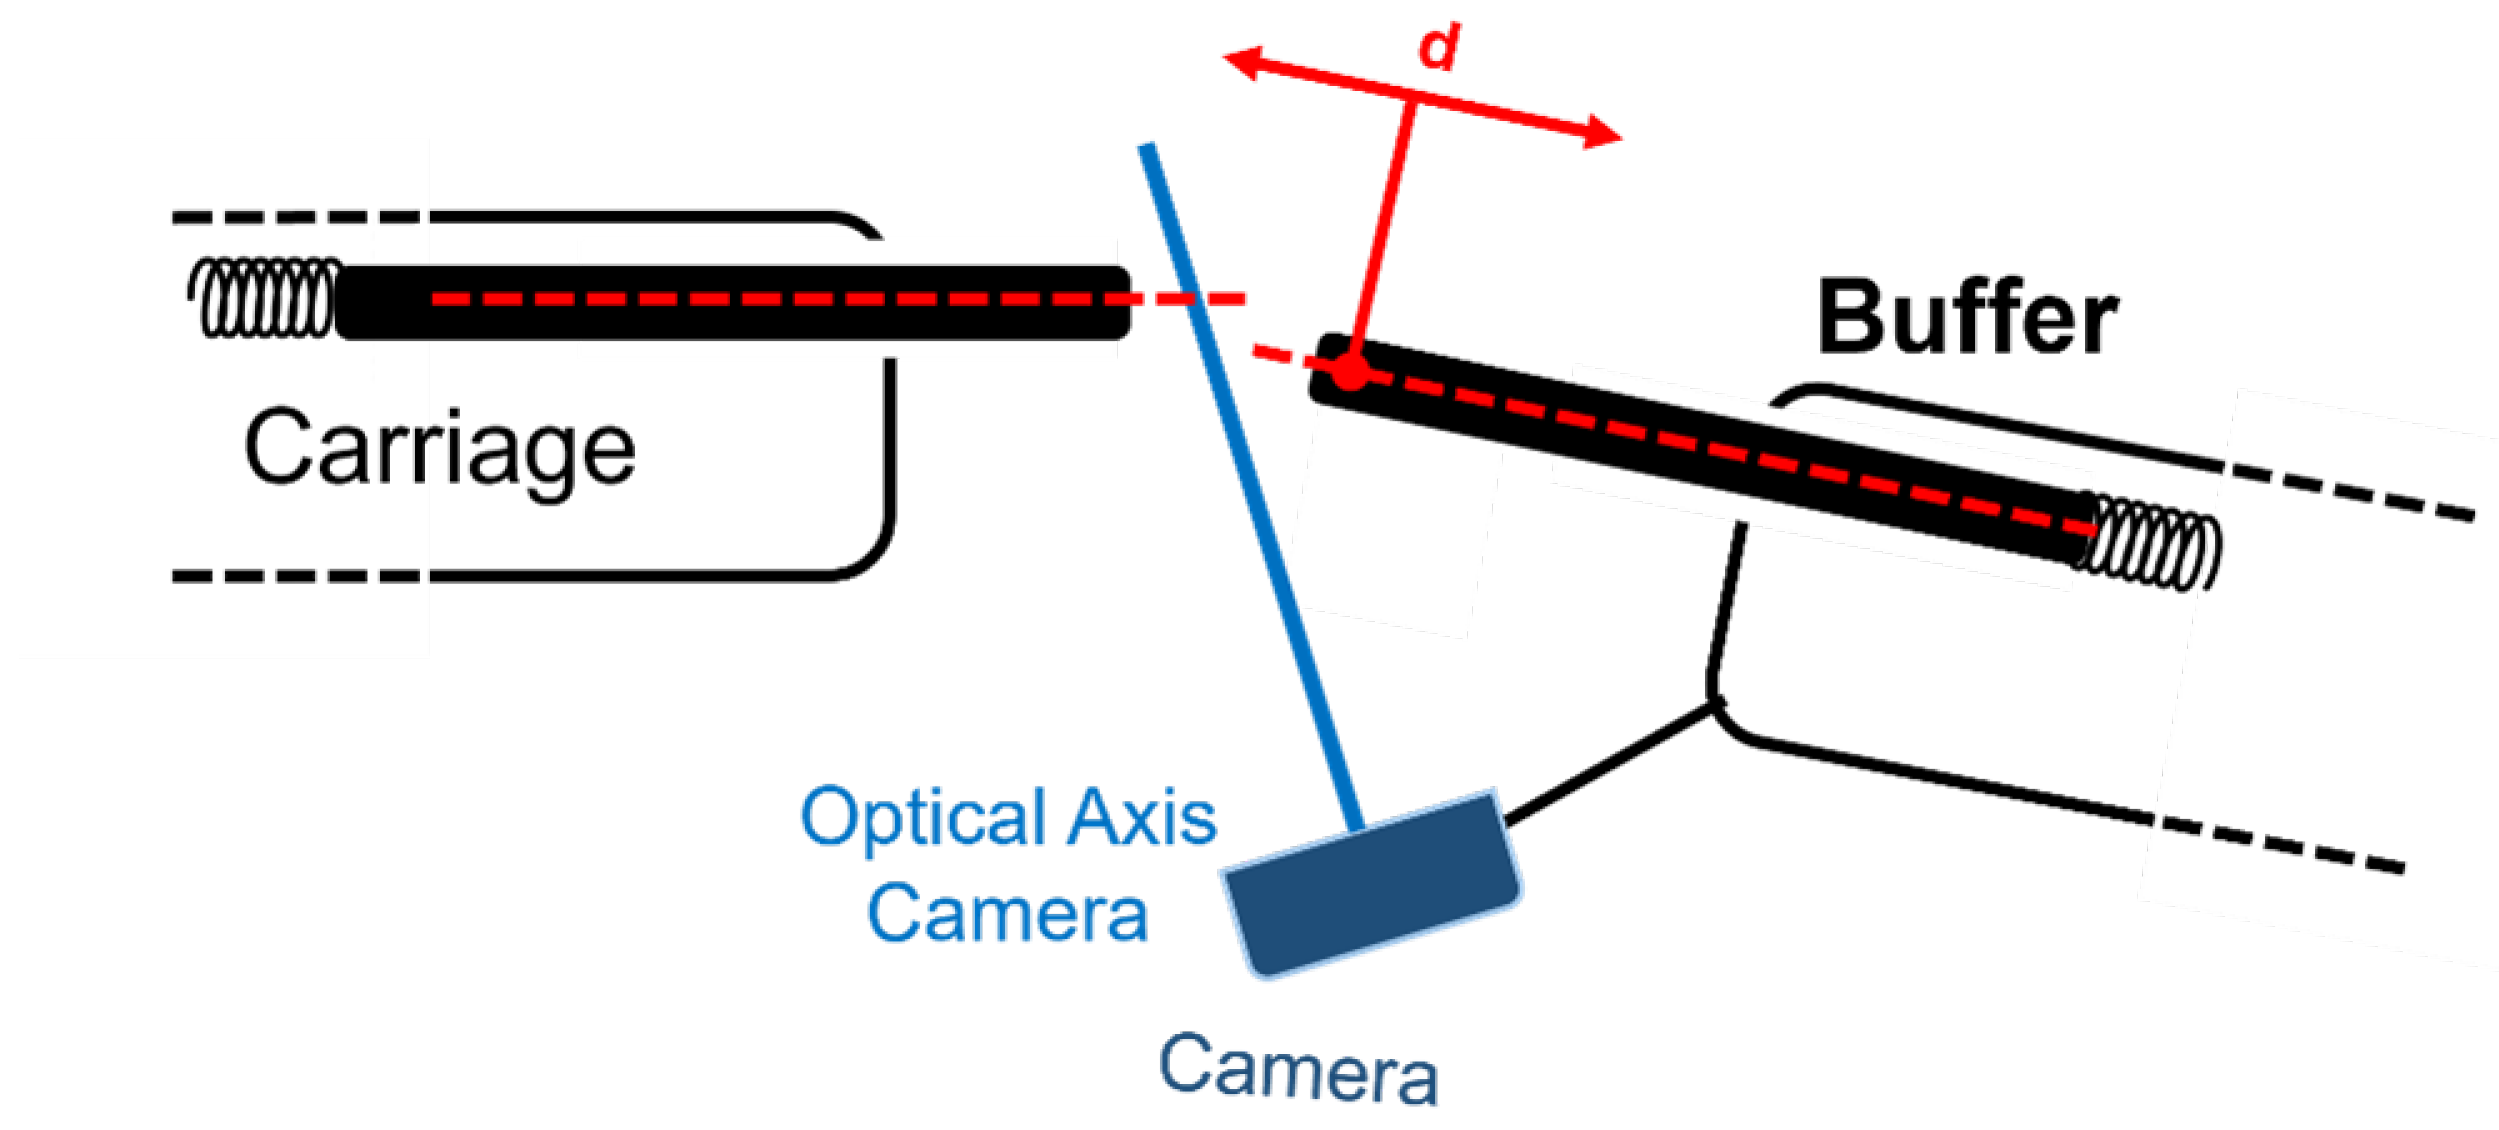
Figure 7 shows the displacement
d for the buffer along its main axis.
For each frame
k, the algorithm begins with the computation of the midpoint between the two tracked points (as conducted before, the two selected points belong to the buffer in order to draw an axis parallel to the buffer axis):
where
and
denote the 3D coordinates of the two points at frame
k. The axis of interest is defined by the line connecting the mean positions of the two point clouds across all frames, where
The projection of the midpoint at frame
k onto the reference axis with respect to
is then calculated as
As performed for the angle, the excursion of the displacement is then computed as
The pipeline is designed to be adaptable and easily accessible. It can be extended or integrated with other sensing modalities or high-level decision-making frameworks. The algorithm shows how combining RGB-D data, system calibration, and computer vision techniques can be implemented for practical and effective solutions for 3D structural monitoring in challenging, real-world environments such as railway operations.
4. Experimental Results
The experimental results presented in this section show the effectiveness of the proposed 3D tracking and analysis pipeline in a railway context. Scenario 1 focuses on the angular excursion of the hook axis with respect to the camera optical axis, while Scenario 2 analyzes the longitudinal displacements of the buffer along its main axis. Therefore, the whole analysis concentrates on the measurement of these angular and longitudinal variations recorded during operations. Such variations are interpreted as the actual dynamic response of the hook and buffer under real field conditions, rather than as deviations from predefined nominal parameters. These two cases represent key quantities for assessing coupling integrity and mechanical stability during wagon operation.
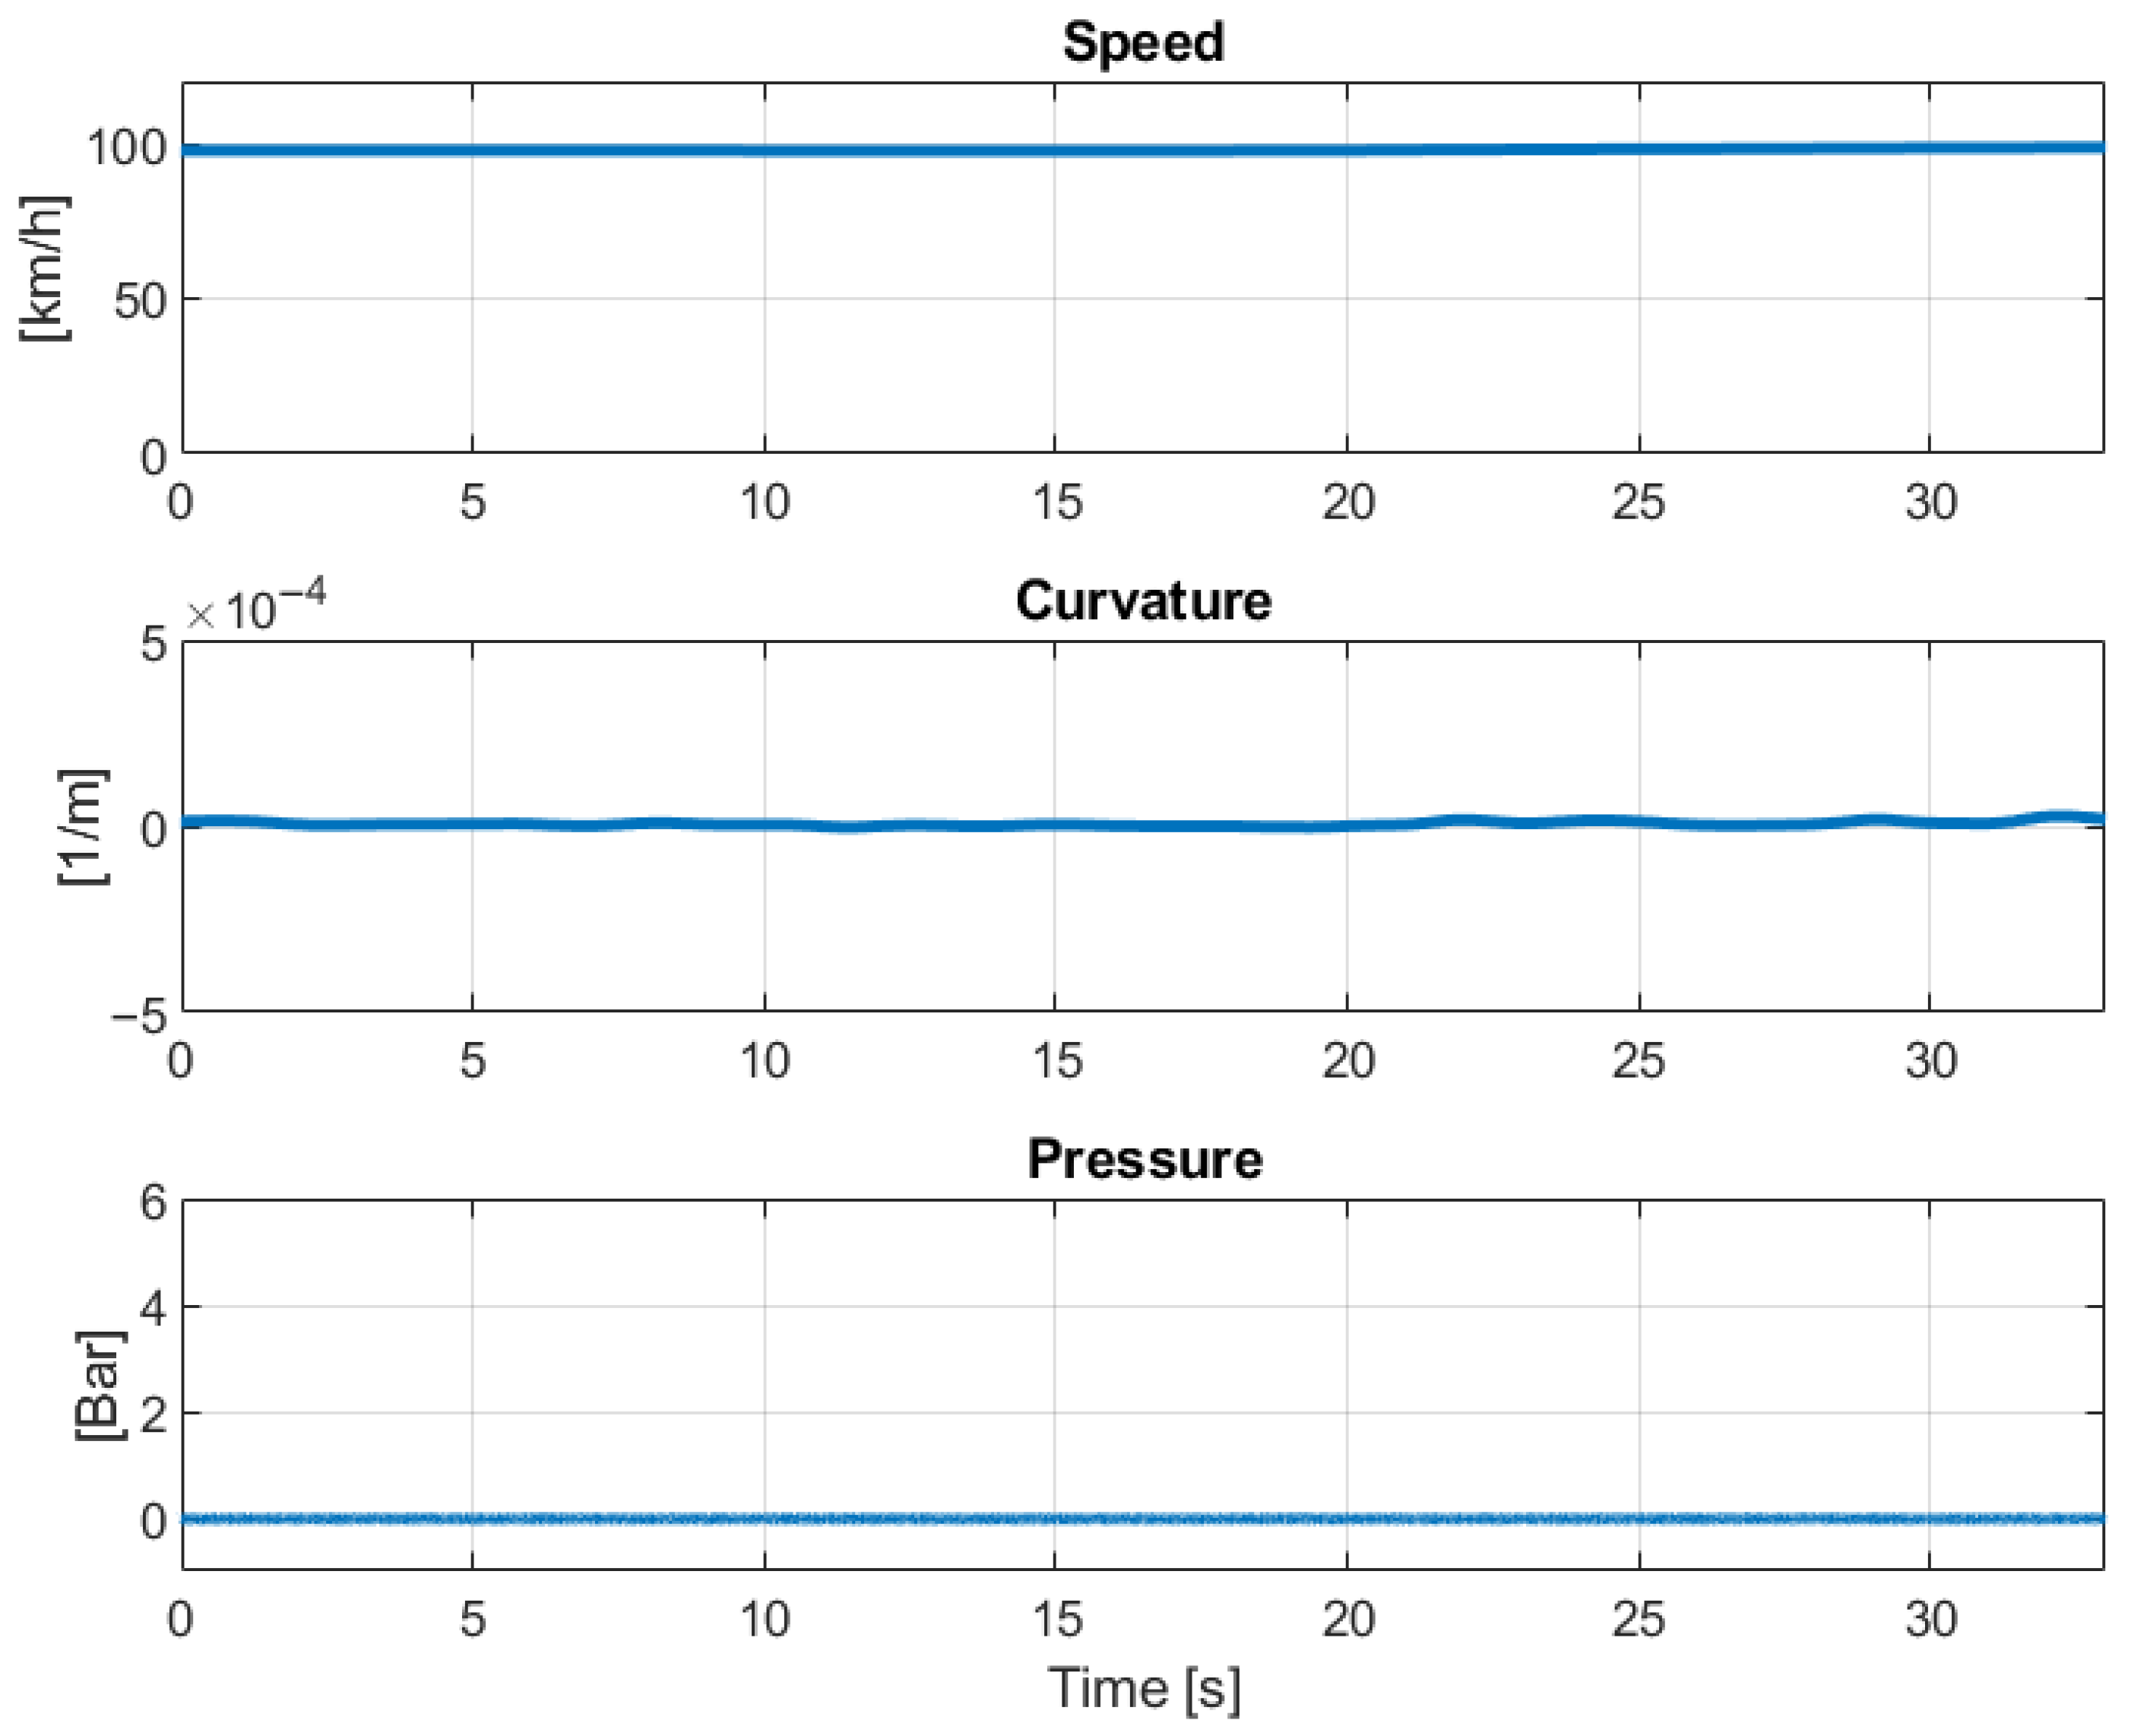
In order to gather the necessary data, the instrumented wagon was inserted in a freight trainset running on the Milano–Bari line in Italy. The trainset was composed of a single locomotive and 19 wagons, with the instrumented one in the middle of the composition. The post-process analysis was made considering an acquisition of approximately 33 s in the line section highlighted in
Figure 8. This line section is mainly straight, and it is traveled by wagons at an average speed of 100 km/h. A dedicated sensor installed at the braking cylinder test point of the wagon confirmed that the train was not braking during the maneuver.
As mentioned, for the hook (
Figure 6), the focus was on monitoring possible rotations or misalignments, which were quantified through the analysis of angular excursion. In contrast, for the buffer, the main interest was in tracking longitudinal displacement along the object axis (
Figure 7). In both cases, the raw measurements were post-processed using a moving average filter to suppress noise and highlight physically meaningful trends. The general form of the moving average for a discrete sequence
is given by
where
is the window size and
M is the half-window. In this specific case, few considerations have been assumed: given a train speed of 70 km/h and a camera frame rate of 15 fps, the distance covered in each frame is approximately 1.3 m. Considering that the standard length of a rail module is at least 12 m, the train covers 9.1 m in seven frames. Therefore, using a window of seven frames ensures that the moving average is computed over a segment shorter than the length of a single module. This choice provides a good compromise between signal smoothing and temporal resolution, as it reduces noise while preserving relevant changes related to each rail module.
4.1. Case: The Angle Between the Camera Optical Z-Axis and the Hook Axis
The first experimental scenario deals with the monitoring of rotation behavior of the hook, that is, the rigid mechanical component coupling two railway carriages.
Figure 9 shows the projection of the measured 3D axis and tracked points onto the camera image.
For this case, the critical metric is the angle
formed between the 3D line connecting the two tracked points on the hook and the optical Z-axis of the camera, as shown in
Figure 6. This measurement provides insight into potential rotations during the normal running of the train and becomes a parameter of primary interest for structural and safety monitoring. As the train moves, the angle
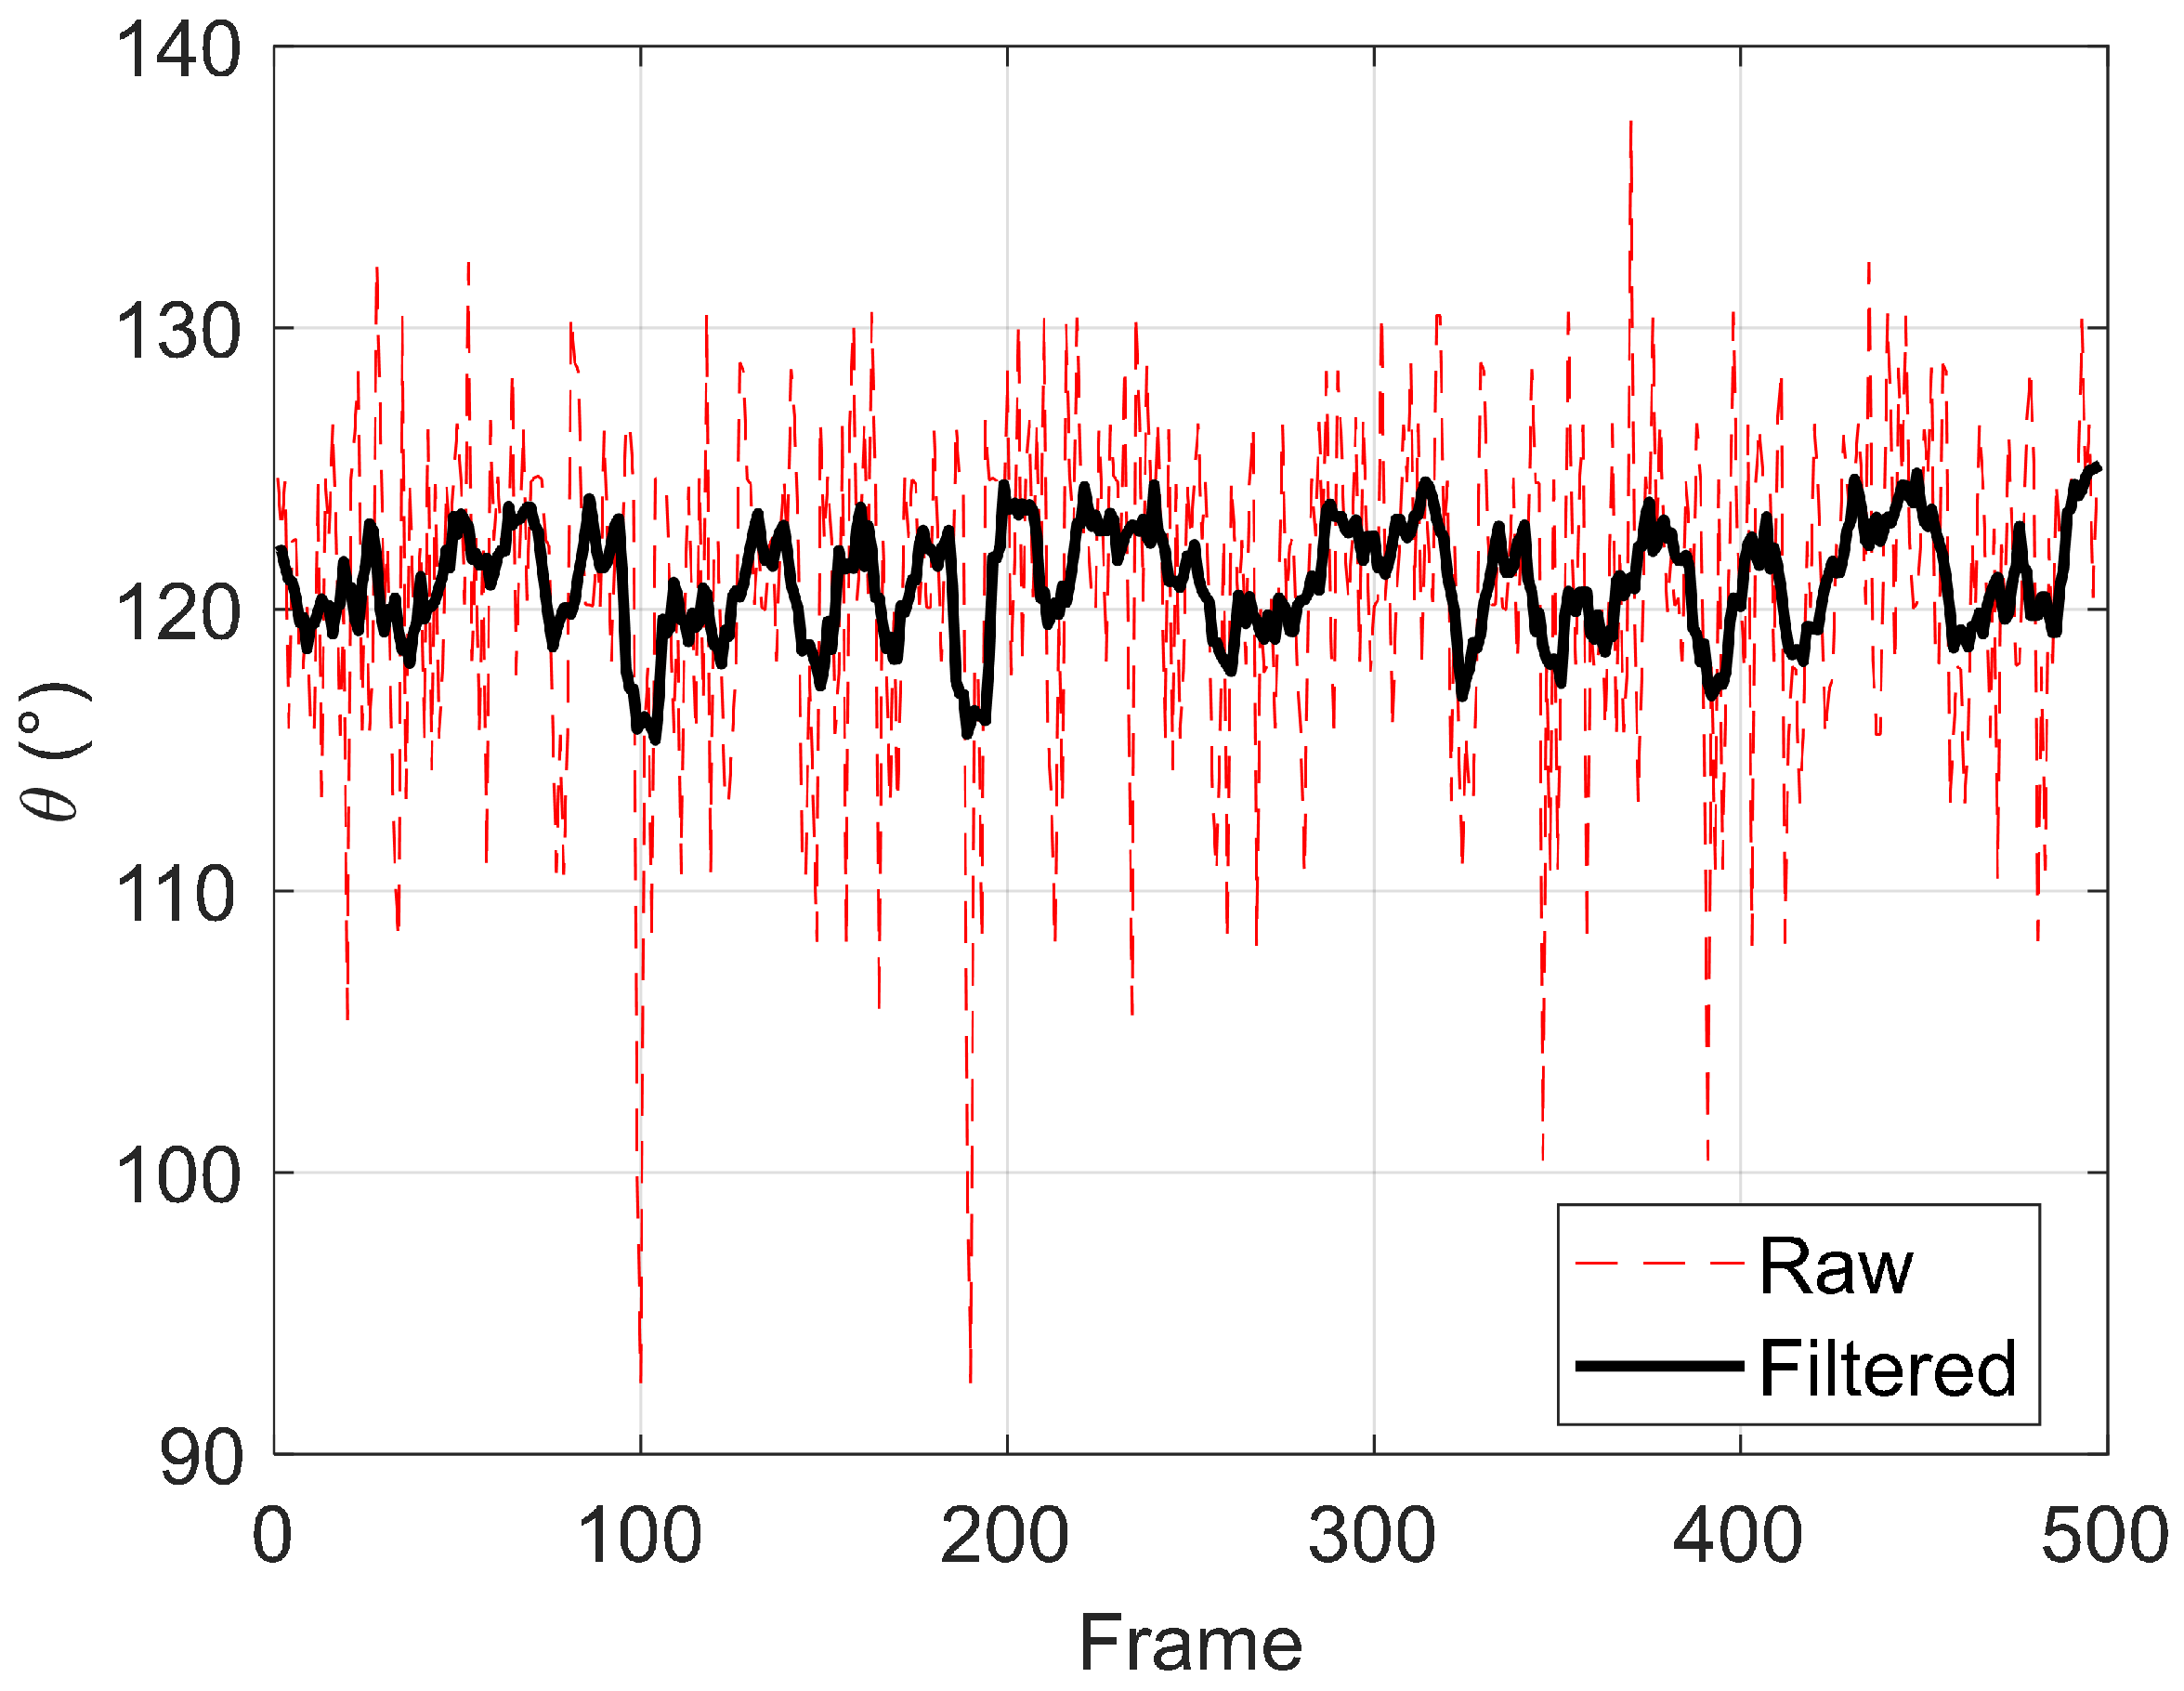
was computed for each frame, and its evolution is plotted in
Figure 10.
The result of this analysis is the excursion , defined as the difference between the maximum angle and the minimum angle measured during the sequence.
The filtered signal shows an excursion of 9.8°: the excursion can be interpreted as the actual range of rotational motion experienced by the hook during the monitoring period. In practical terms, this value can suggest misalignment or relative hunting motion between the two carriages and can be used as real-time alert systems in operational railway contexts. The measured filtered angular excursion of 9.8° falls within the range of operational values documented in the literature for freight wagon couplings under operational conditions [
37].
4.2. Case: Displacement Along the Buffer Axis
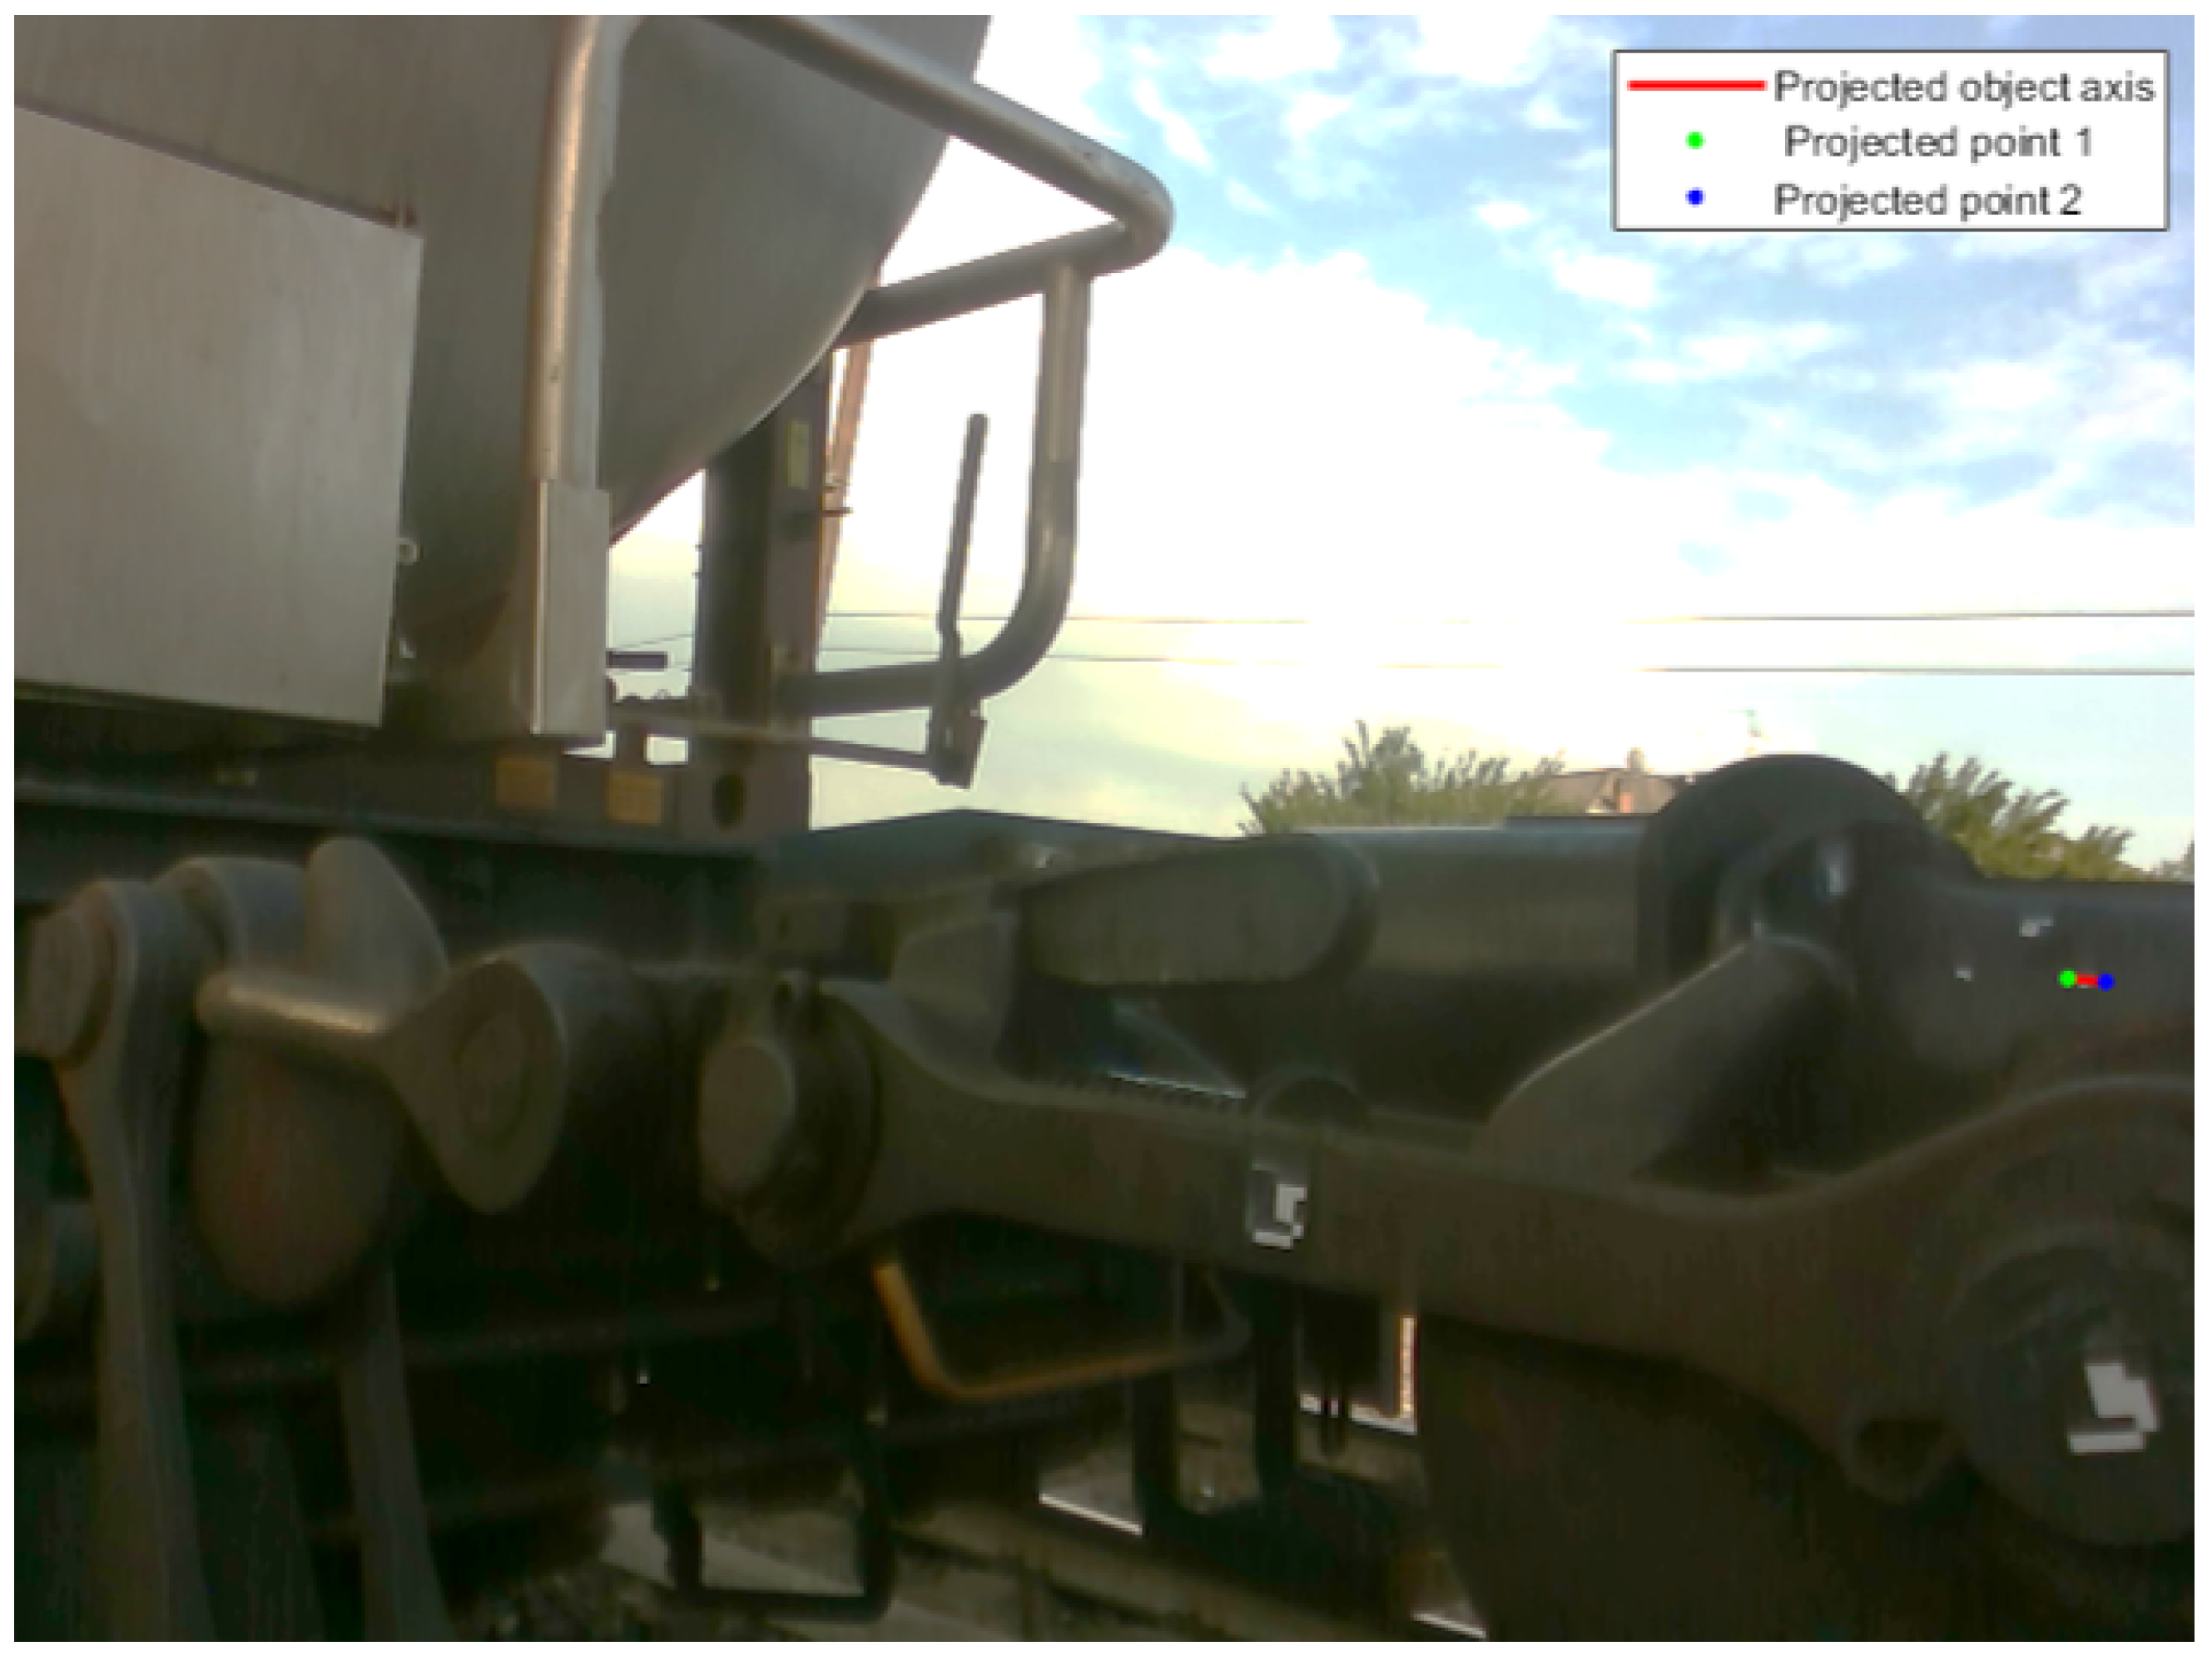
The second experimental scenario focuses on monitoring longitudinal displacement in the buffer, a structural component designed to absorb and compensate for relative motion between rail carriages. In this case, the metric is the displacement of the midpoint along the buffer axis.
Figure 11 shows the projection of the 3D object axis and the tracked points onto the camera image, providing a visual representation of the measured geometry. At each frame, the instantaneous midpoint between the tracked points is computed, and its projection onto the mean axis is taken: this operation yields the displacement signal
, which characterizes the dynamic response of the buffer.
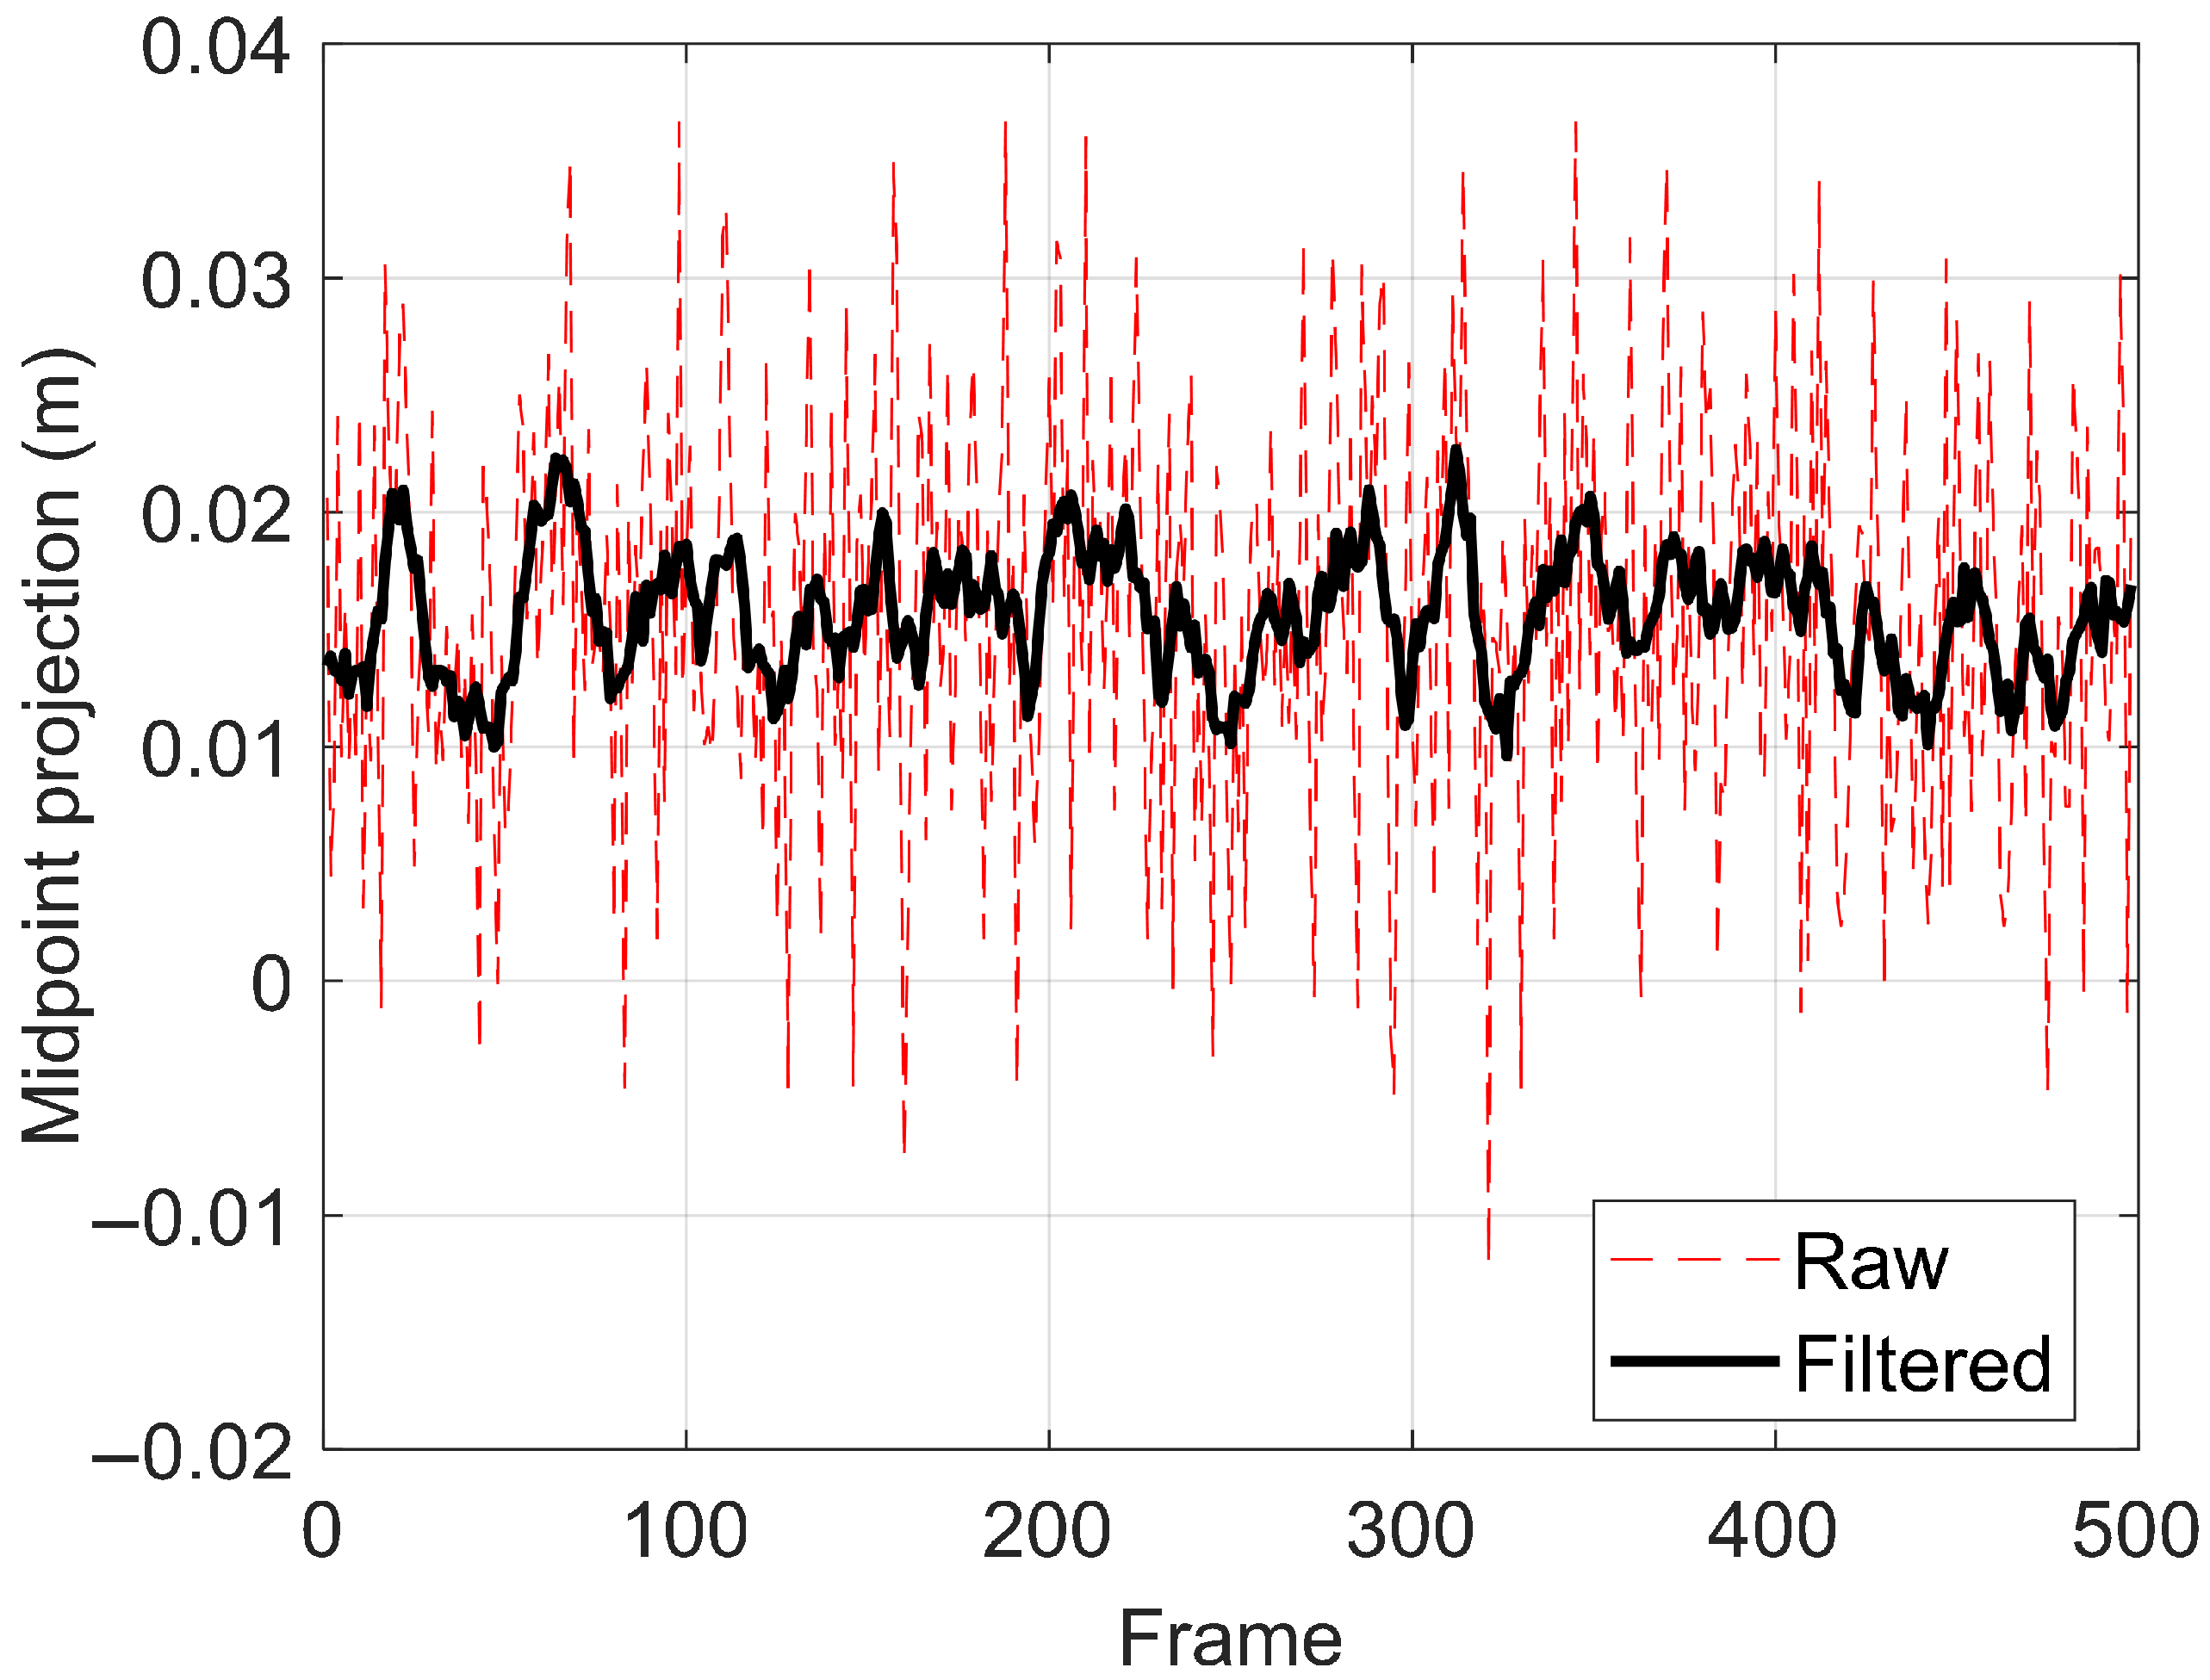
The evolution of this displacement is shown in
Figure 12, where both raw and filtered signals are plotted. The unfiltered displacement has high-frequency oscillations, reflecting both measurement noise and small tracking errors inherent to real-world conditions. Application of the moving average filter reduces this variability, allowing the detection of trends and shifts which maybe otherwise be masked.
The range of the filtered displacement signal is about 17 mm. This displacement is within the European standards, which state that freight wagon buffers typically have stroke capacities of 105–110 mm for standard applications. The displacement excursion provides an index for assessing buffer performance and identifying possible abnormal events.
5. Discussion
The experimental results confirm the capability of the proposed vision-based system to measure the angular excursion and longitudinal displacements of the freight wagon couplings under real operating conditions. Compared with other computer vision approaches for railway inspection [
26,
27,
29,
30], the proposed system focuses specifically on the 3D monitoring of mechanical connections, which has received limited attention in the literature. Unlike existing image-based defect detection systems that rely on 2D analysis or require defined environments, the proposed method integrates RGB-D sensing to reconstruct real geometric quantities in dynamic field conditions. When compared to lightweight CNN-based systems such as those proposed in [
29,
30], the approach proposed in this paper does not require a learning phase, avoiding dependency on large datasets. This makes it more adaptable to new environments and mechanical configurations. Nevertheless, some limitations must be considered. Indeed, the accuracy of the 3D reconstruction can be affected by illumination changes and partial occlusions caused by vibrations or dust. However, in the proposed setup, the regions of interest were selected over feature-rich areas, ensuring robust correlation even under variable lighting. This strategy mitigated the typical sensitivity of the NCC algorithm to brightness fluctuations, occlusions, and scale changes, resulting in consistent tracking performance throughout the field tests and better point tracking over time. The depth accuracy of the Intel RealSense D435i camera was also considered. The camera was recalibrated together with its protective housing, and the corrected intrinsic parameters were used for depth map computation. The built-in infrared (IR) projector generates a structured-light pattern that enhances depth estimation reliability in low-texture regions. Although depth uncertainty can propagate through the 3D reconstruction process, its impact on the angular measurement
is limited due to normalization. The longitudinal displacement measurement may be slightly more affected; however, given the tested range and the camera’s specified accuracy (less than 2% at 2 m), the resulting 3D estimates are sufficiently precise for monitoring purposes. The manual initialization of feature points limits full automation and may reduce scalability to very large datasets. However, this limitation can be readily mitigated by integrating automatic initialization strategies, e.g., classical keypoint detectors and descriptors (ORB/SIFT/AKAZE) combined with robust matching and RANSAC-based pose estimation, with modern lightweight object/keypoint detectors (YOLO-based or deep keypoint networks) to define regions of interest automatically. Additionally, the current implementation relies on post-processing, and further optimization is required to achieve fully embedded real-time performance, but the first computational performance estimation was also carried out to evaluate the algorithmic overhead with respect to the image acquisition rate. Considering that RGB-D frames are recorded at 15 fps (corresponding to an acquisition period of approximately 0.0667 s per frame), the post-processing algorithm required an average computational time of 0.0188 s per frame when executed on a workstation equipped with an Intel
® Core™ i9-13900 (Intel Corporation, Santa Clara, CA, USA). processor and 32 GB of RAM. This means that the processing time accounts for approximately 28% of the image acquisition period, demonstrating that the developed vision pipeline introduces a limited computational load and could achieve real-time feasibility when integrated into embedded hardware. These findings demonstrate the robustness and applicability to field conditions while highlighting the remaining challenges to be addressed in future developments.
6. Conclusions
This work presented the development and experimental test of a vision-based 3D monitoring system for railway freight wagons. The system, based on an RGB-D camera and a computer vision pipeline, was designed to estimate angular excursions and longitudinal displacements of critical coupling components such as hooks and buffers under real operating conditions. The experimental results demonstrated the capability of the proposed approach to track rigid components with good consistency, highlighting correct trends after filtering. Hook angular excursion analysis provided a practical index for identifying potentially dangerous excursions that can lead to hazardous situations, while Buffer displacement monitoring offered an indicator of abnormal elastic deflection of the buffer. These results confirm the feasibility of using vision-based solutions as complementary tools for condition-based maintenance and safety monitoring in freight operations. Despite the promising outcomes, some limitations emerged, particularly those related to illumination variability, image distortions caused by protective housing, and tracking sensitivity to occlusions. The proposed approach demonstrated stable performance and computational feasibility, confirming that the processing pipeline is suitable for real-time operation on embedded systems. The pipeline, thought and designed for embedded execution, showed computational times compatible with real-time operation, which will be experimentally validated in future work. Although the current validation was conducted under real operating conditions, the consistency of the system was indirectly assessed by comparing the measured angular excursions and displacements with reference ranges reported in the literature. This provided a first-level consistency check between the obtained values and known operational limits. Future developments will include laboratory experiments on instrumented prototypes, where the proposed vision-based measurements will be quantitatively compared against a ground-truth reference. These tests will allow the estimation of accuracy and repeatability through standard performance indices such as RMSE and MAE, supporting the definition of quantitative error models for the proposed method. In light of these considerations, the main findings of this research can be outlined as follows: (1) the proposed RGB-D vision system computes the 3D angular excursion and longitudinal displacement of wagon couplings in real operating conditions; (2) the NCC method, combined with depth reconstruction, achieves accurate and repeatable measurements without the need for physical contact; (3) the experimental results demonstrate consistency with known operational limits reported in the literature, confirming the reliability of the approach; and (4) the developed system architecture ensures real-time data acquisition and computational feasibility for embedded implementation. From a theoretical point of view, this study contributes to extending the application of computer vision and depth-based sensing to 3D geometric monitoring in railway environments, where traditional sensing technologies are difficult to apply. From a practical perspective, the proposed framework supports condition-based maintenance strategies and provides a non-invasive method for the continuous monitoring of freight wagons, potentially enhancing safety and operational efficiency in modern rail transport. The proposed solution is a step toward automated, non-invasive monitoring of mechanical couplings, contributing to the digitalization of freight operations and the improvement of safety, reliability, and efficiency across modern logistics chains. Future work will focus on improving robustness through advanced feature extraction and multi-sensor fusion, coupling the RGB-D stream with inertial and force sensors. Larger datasets and different operational scenarios will be used to further validate the pipeline to assess real-time deployment on embedded hardware.

