1. Introduction
Influenza is an acute respiratory disease caused by viruses classified into types A, B, C, and D [
1,
2,
3,
4]. Among them, influenza A and B viruses are the primary pathogens responsible for human influenza, with influenza A having the potential to cause global pandemics. Common symptoms of influenza include fever, headache, muscle pain, and fatigue, with severe cases potentially leading to fatal outcomes. High-risk groups include the elderly, individuals with cardiovascular or pulmonary diseases, and patients with renal dysfunction, anemia, or immunodeficiency [
5,
6]. Therefore, rapid and accurate influenza diagnosis is crucial for timely treatment.
Current detection methods for influenza viruses include nucleic acid-based assays, antigen tests, serological analysis, and high-throughput sequencing techniques [
7]. Among these, antigen tests are widely used in clinical practice due to their simplicity, short turnaround time, and minimal requirements for specialized equipment and expertise [
8]. The commonly used influenza rapid antigen test (RAT) employs the sandwich immunoassay (SIA) principle, where the viral antigen in the sample binds to a labeled antibody, which subsequently interacts with a secondary antibody immobilized on the test zone. The two antibodies bound to the antigen form a sandwich-like structure. This structure induces a color change upon detection of the influenza virus, allowing qualitative assessment within 10–30 min [
9]. The fluorescent sandwich immunoassay (FSIA) utilizes fluorescently labeled microspheres conjugated with antibodies to capture the viral antigen, subsequently binding to a secondary antibody immobilized in the test zone. Fluorescence emission is detected upon UV excitation to determine the test result [
10]. Compared to SIA, FSIA provides improved sensitivity and specificity, allowing for more reliable detection even at low viral loads [
11,
12]. The increased accuracy of FSIA helps minimize misinterpretation risks and enhances diagnostic reliability so that patients can receive proper treatment in time.
However, RATs may yield false-negative or false-positive results due to operator error, low viral load, test sensitivity and specificity variations, or inadequate sample collection [
13]. Misinterpretation of results can cause delays in seeking medical treatment. Machine vision-assisted interpretation of RAT results offers improved reliability and enables quantitative concentration analysis, reducing errors caused by human vision and environmental factors. In 2021, Lin et al. applied image interpretation techniques in the field of biomedicine [
14]. They constructed an image acquisition system using a USB camera to capture the colorimetric results of fecal occult blood colloidal gold rapid test strips at various reagent concentrations, aiming to determine the corresponding concentration levels. In the same year, Turbé et al. utilized a tablet to capture images and applied deep learning-based image analysis algorithms to interpret HIV rapid diagnostic tests [
15]. In 2022, Schary et al. developed a rapid testing detection system using a smartphone in combination with a 3D-printed dark chamber environment [
16]. To mitigate variations among different test kits that could affect concentration estimation, most studies have adopted the control line (C line) as a reference, using the ratio of the test line (T line) to the C line as a standardized metric to improve result accuracy [
17,
18].
Quick Response Codes (QR codes) are two-dimensional barcodes invented by Japan’s Denso Wave company in 1994. Compared with traditional one-dimensional barcodes, QR codes have faster reading speeds and larger data capacity. QR codes have been widely used in IOT research and can also be applied in biomedicine. For example, in 2001, Qian et al. applied visible-light LEDs and QR codes to develop indoor positioning technology [
19]. Shukran et al. proposed the use of mobile device-based QR code labels to enhance laboratory chemical inventory management and introduced a QR tag inventory system implemented in the chemical laboratory of the National Defense University of Malaysia [
20]. In this paper, the reagent casings employed were all printed with QR codes. In addition to identifying the test item, specimen type, and batch number, the endpoints of the QR code can also serve as reference coordinates for image processing.
Perspective transformation is a technique that projects an image onto a new visual plane, also known as projection mapping. This technology is widely used in three-dimensional image processing, including correcting image perspective distortion, performing image scaling, and achieving three-dimensional reconstruction. For example, in a 2023 study, Jin et al. addressed the problem of single-image camera calibration by applying perspective field mapping. By predicting the direction and angle at each pixel, their method significantly improved the accuracy of image cropping and calibration. Furthermore, it was applied to tasks such as image composition and perspective consistency verification [
21]. The method proposed by Abu Raddaha et al. in 2024 employs automatic ROI identification and perspective transformation techniques to geometrically rectify road images captured by vehicle-mounted cameras, enhancing the ability to detect potholes [
22]. In 2025, Zhang et al. proposed a multimodal fusion projection technique that enhances cross-modal perception by applying perspective transformation to project the 3D coordinates detected by LiDAR onto the image plane of a camera. This approach improves the system’s flexibility and real-time performance [
23]. To enhance the stability of detection, this study applied a perspective transformation based on the reference coordinates to transpose the region of interest to the center of the image.
The method established in this paper utilizes machine vision technology to provide a convenient and precise approach for interpreting fluorescent rapid tests, enabling quantitative analysis of fluorescence signals through image processing. To enhance reliability, QR codes were applied both for reading test data and as reference coordinates for image processing. A perspective transformation was applied to position the rapid test at the center of the image, ensuring stability and allowing consistent detection of weak fluorescence reactions on the rapid test.
2. Materials and Methods
2.1. Detection Target
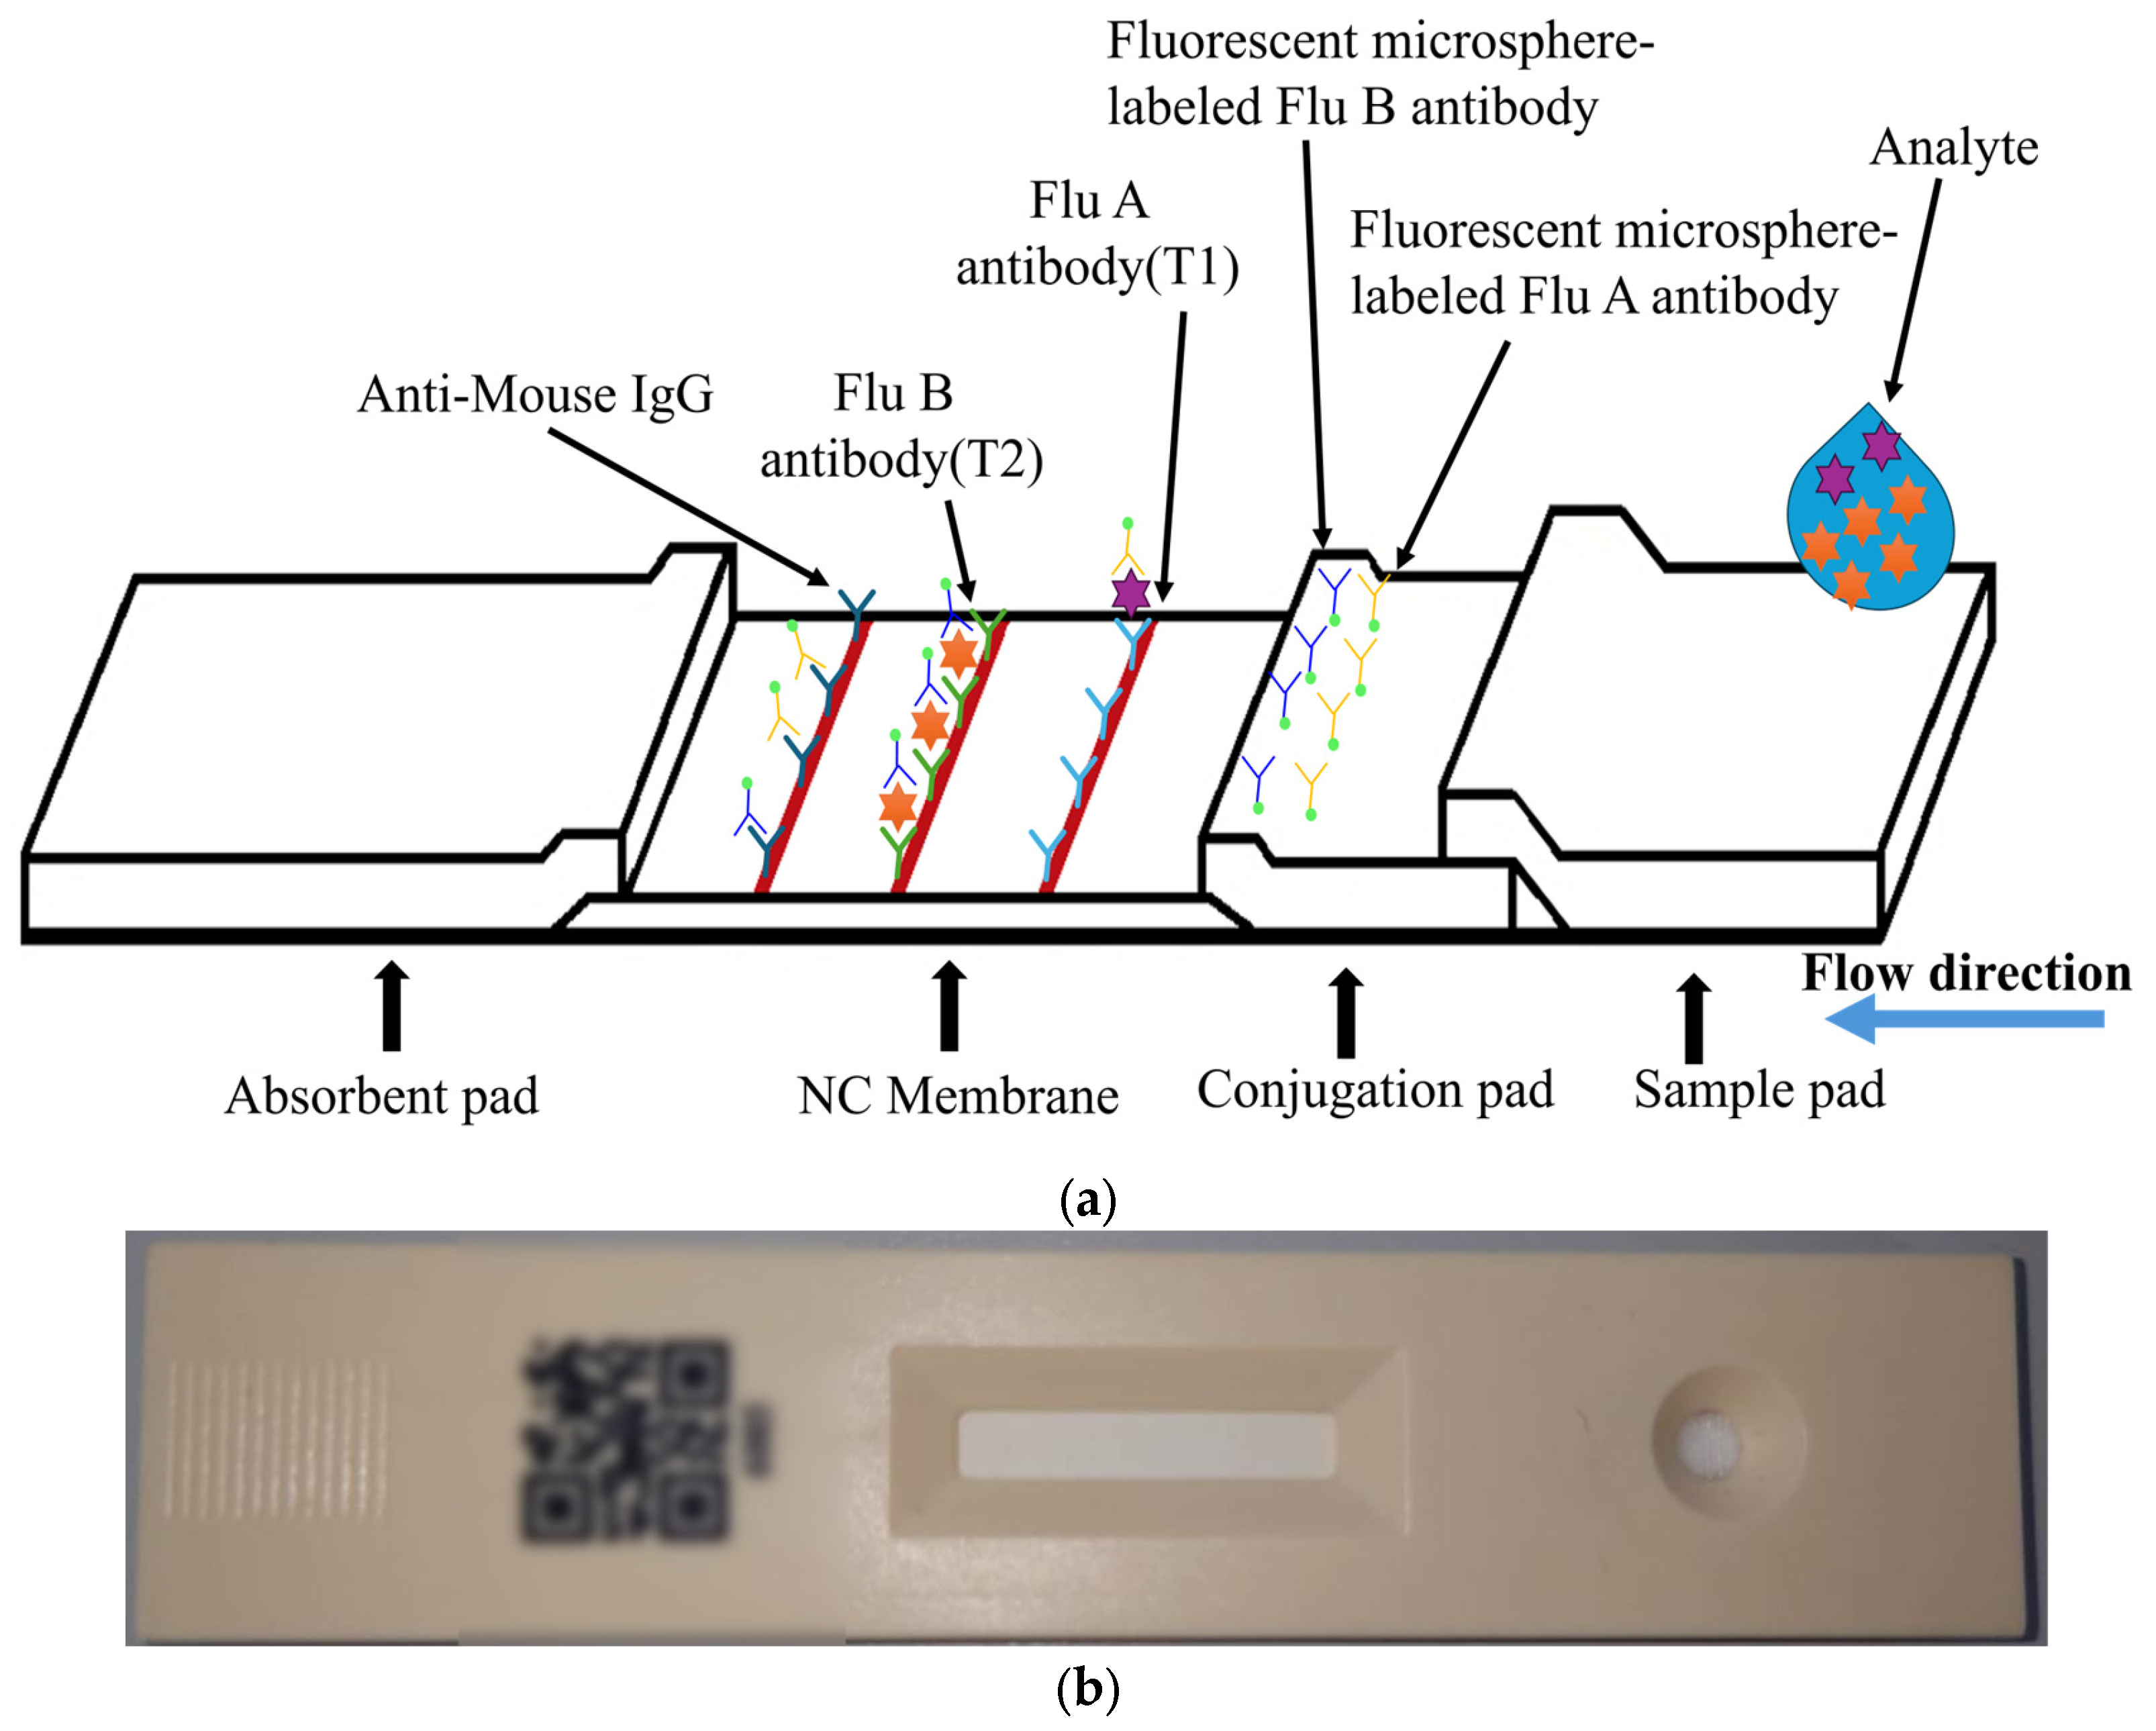
The target of detection in this paper is a fluorescent rapid test, which utilizes the high specificity of a fluorescent sandwich immunoassay to simultaneously detect influenza A (Flu A) and influenza B (Flu B). When irradiated with a 365 nm ultraviolet (UV) LED, the fluorescent microspheres are excited to emit a 520 nm fluorescence signal that is visible to the naked eye. The structure of the rapid test used in this paper is shown in
Figure 1. The nitrocellulose (NC) membrane of the test strip contains two test lines (T1 and T2 lines) and one control line (C line). The T1 line is coated with antibodies specific to influenza A virus antigens, enabling the formation of a sandwich complex with labeled antibodies that have bound to Flu A antigens. Similarly, the T2 line is coated with antibodies specific to influenza B virus antigens, allowing the formation of a sandwich complex with labeled antibodies that have bound to Flu B antigens. The control line (C line) is coated with IgG antibodies that bind to the labeled antibodies, serving as an internal control to verify the validity of the test results.
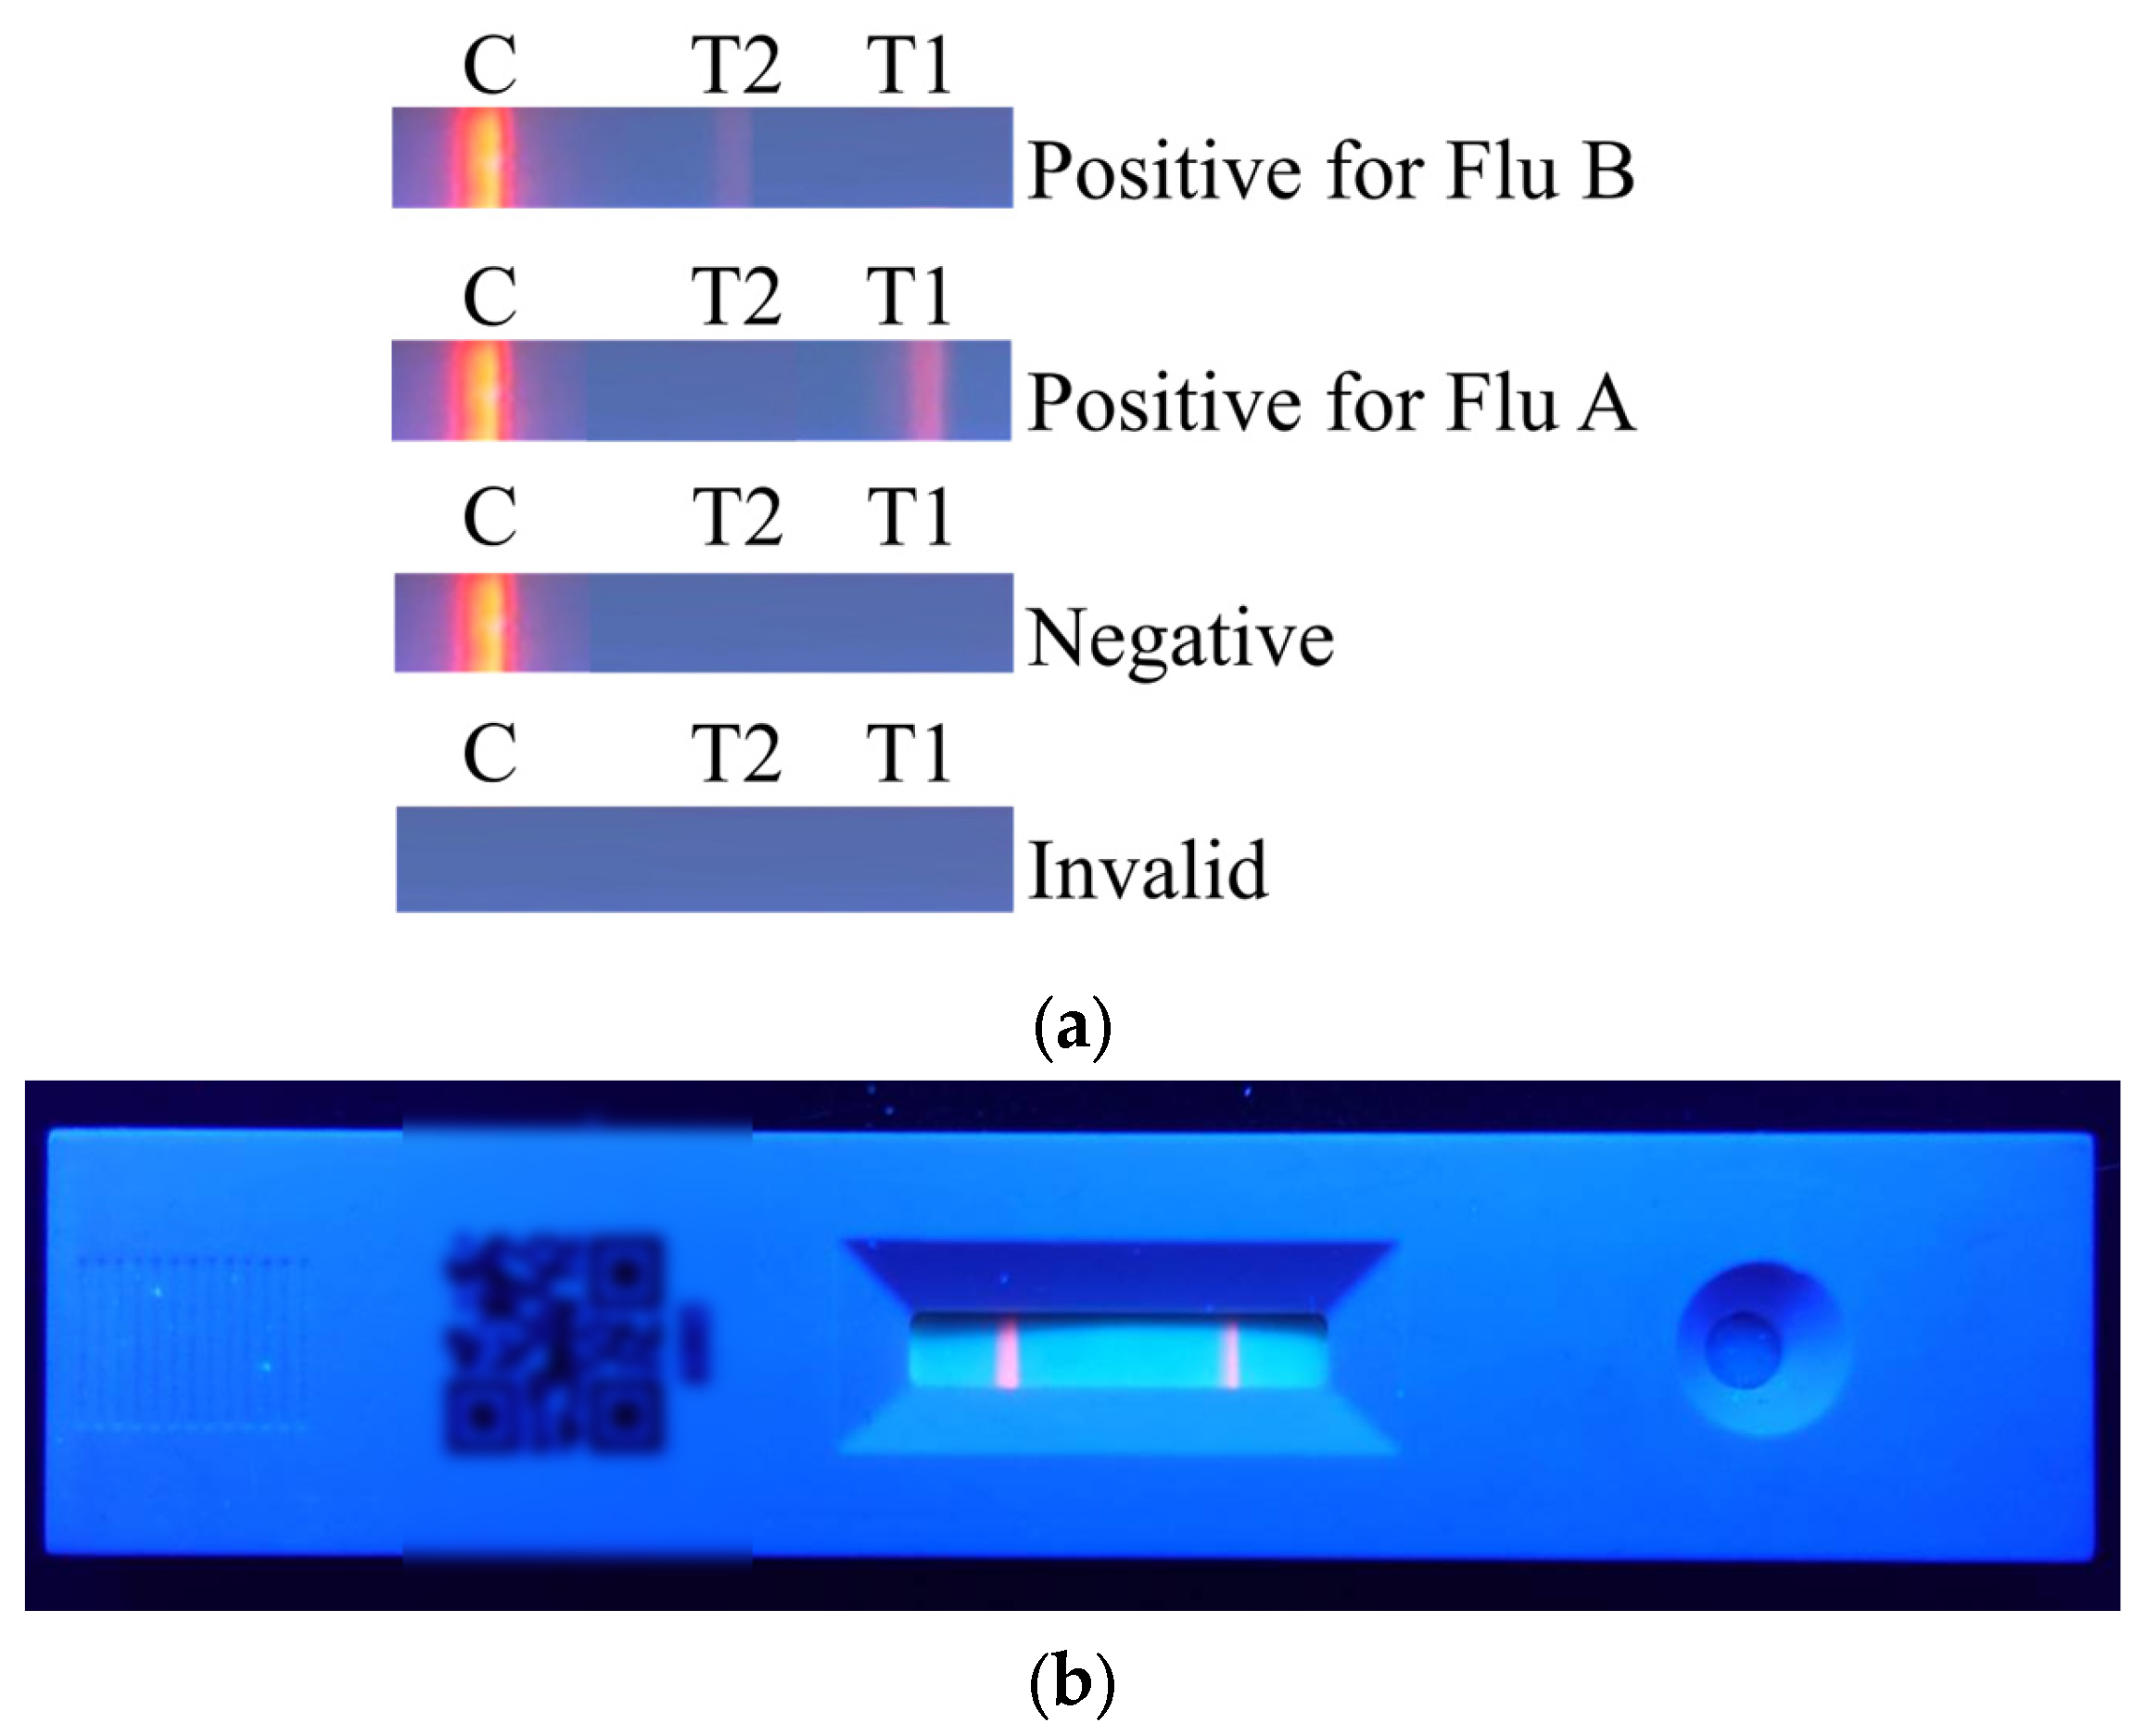
The results of the rapid test are shown in
Figure 2a. The C line will appear regardless of whether the sample contains the viral antigen. If the C line does not appear, it indicates that the rapid test kit or the sample is invalid. When only the C line appears, the result is considered negative. When both the T1 line and the C line appear, the result indicates a positive reaction for Flu A. When both the T2 line and the C line appear, the result indicates a positive reaction for Flu B. The actual rapid test result is shown in
Figure 2b.
2.2. Experimental Environment
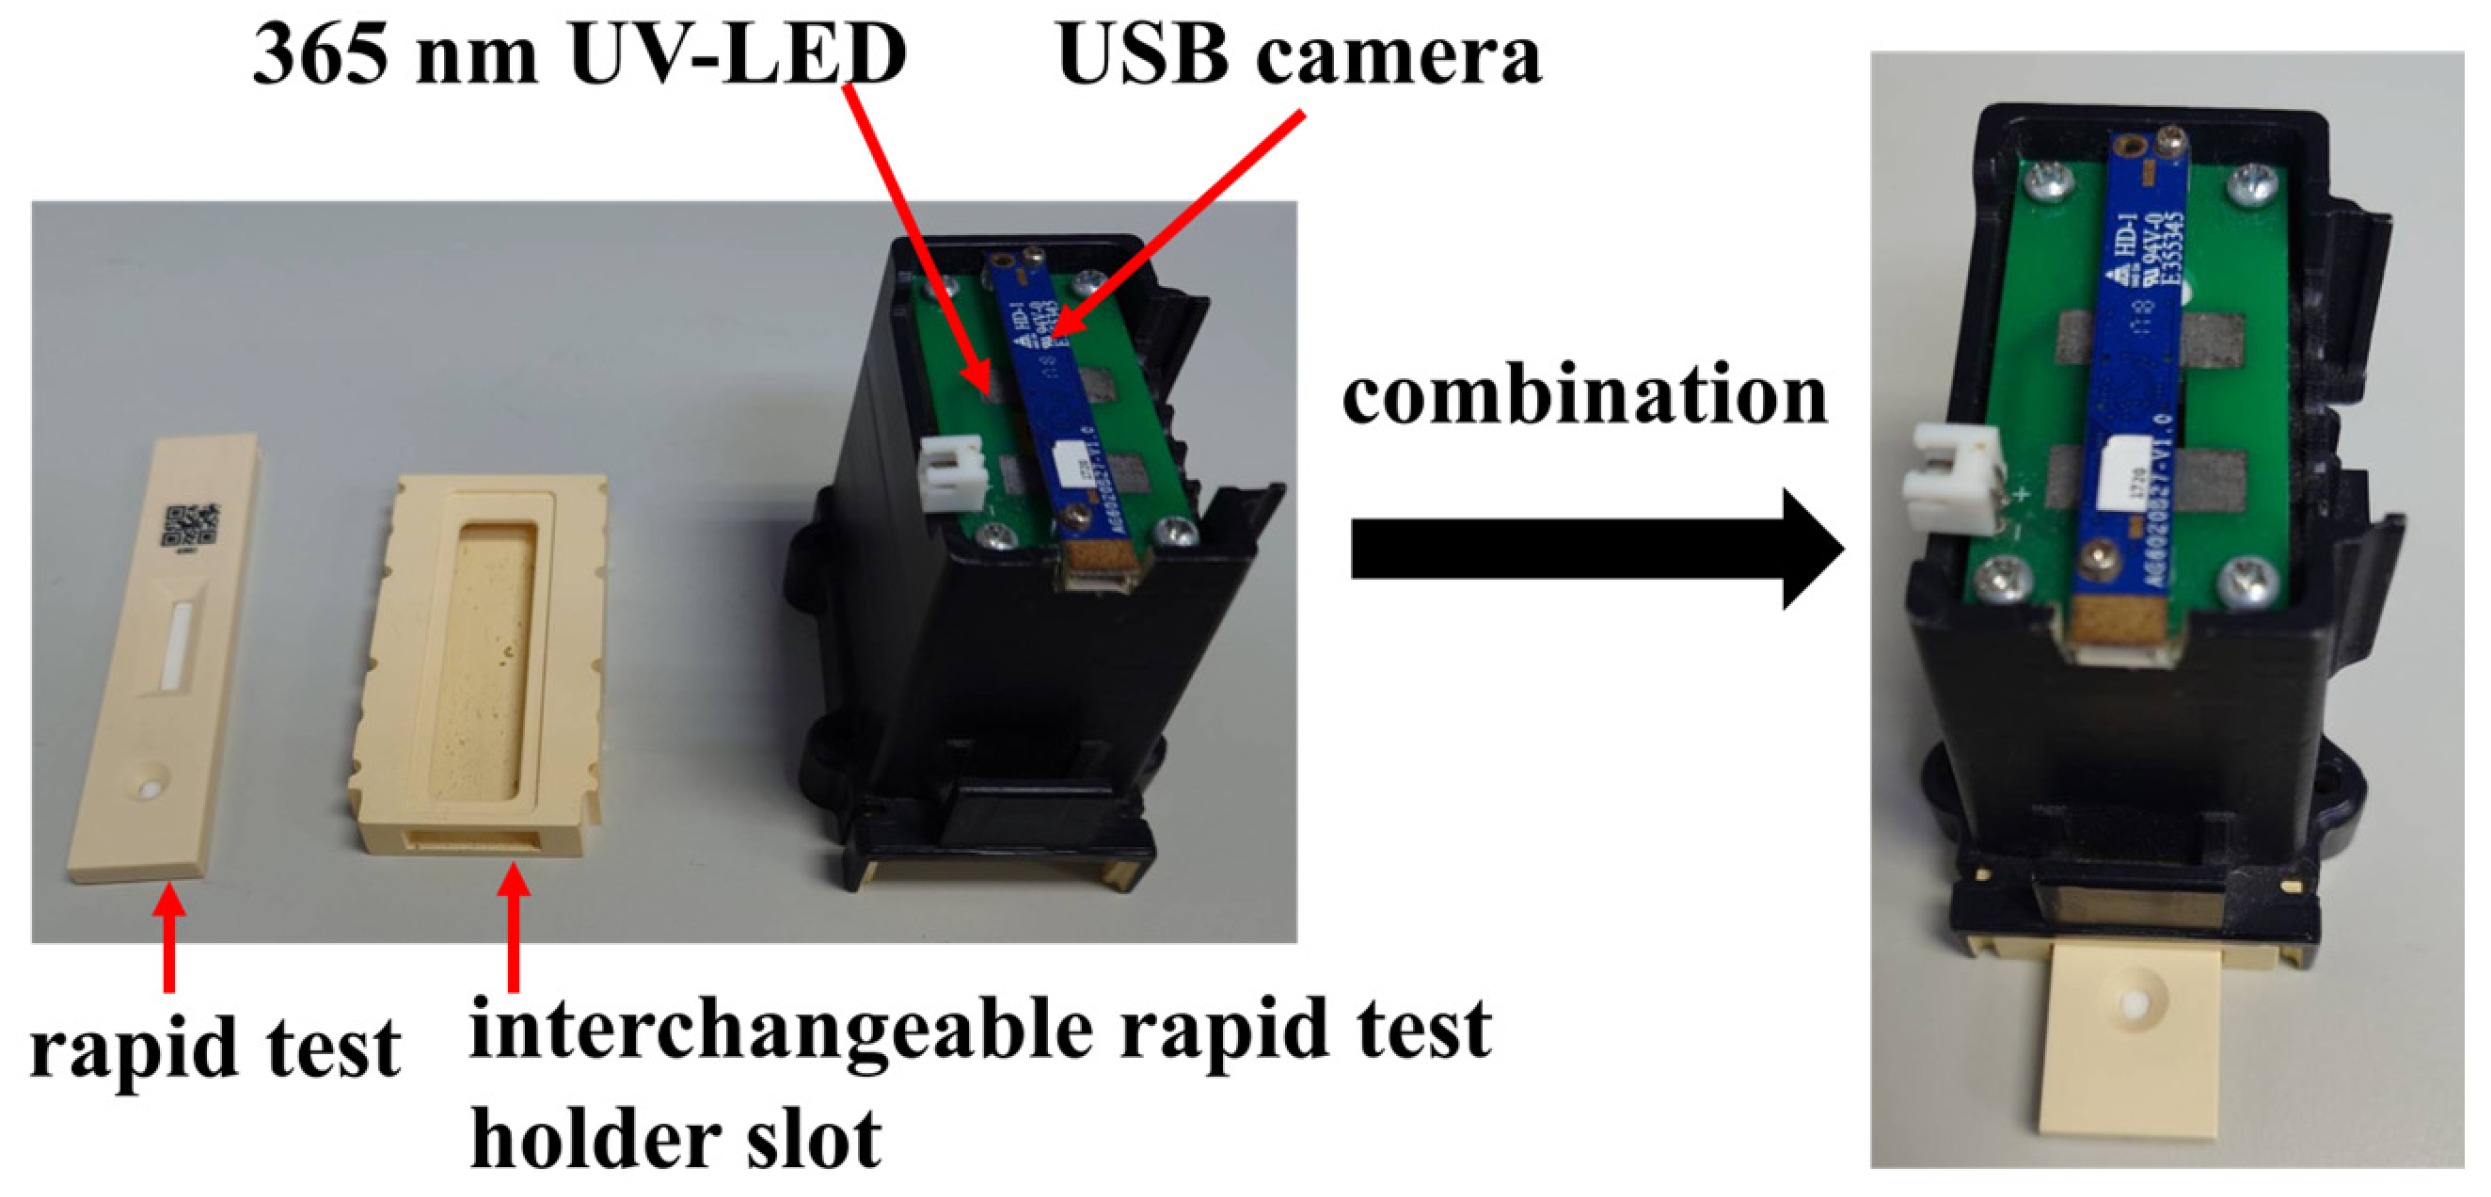
The experimental setup in this paper was conducted inside a dark chamber specifically designed for optical detection, as shown in
Figure 3. The chamber integrates a USB camera and a 365 nm ultraviolet (UV) LED. Upon UV excitation, the rapid test emits fluorescence, which is then captured by the camera for analysis. To minimize misjudgment caused by variations in the imaging environment, both the camera and UV LED are fixed at designated positions within the chamber. The inner walls of the chamber are coated with light-absorbing material to prevent internal reflections from interfering with image interpretation.
At the bottom of the chamber, a replaceable rapid test slot is installed for the rapid test. During operation, the rapid test is inserted into the slot and aligned with the bottom edge, ensuring that it remains within the focal range of the camera. The replaceable design of the slot allows for future adaptation to different types of rapid tests by simply fabricating a new slot tailored to the dimensions of the desired test, thereby enhancing the system’s compatibility and scalability.
2.3. Established Method
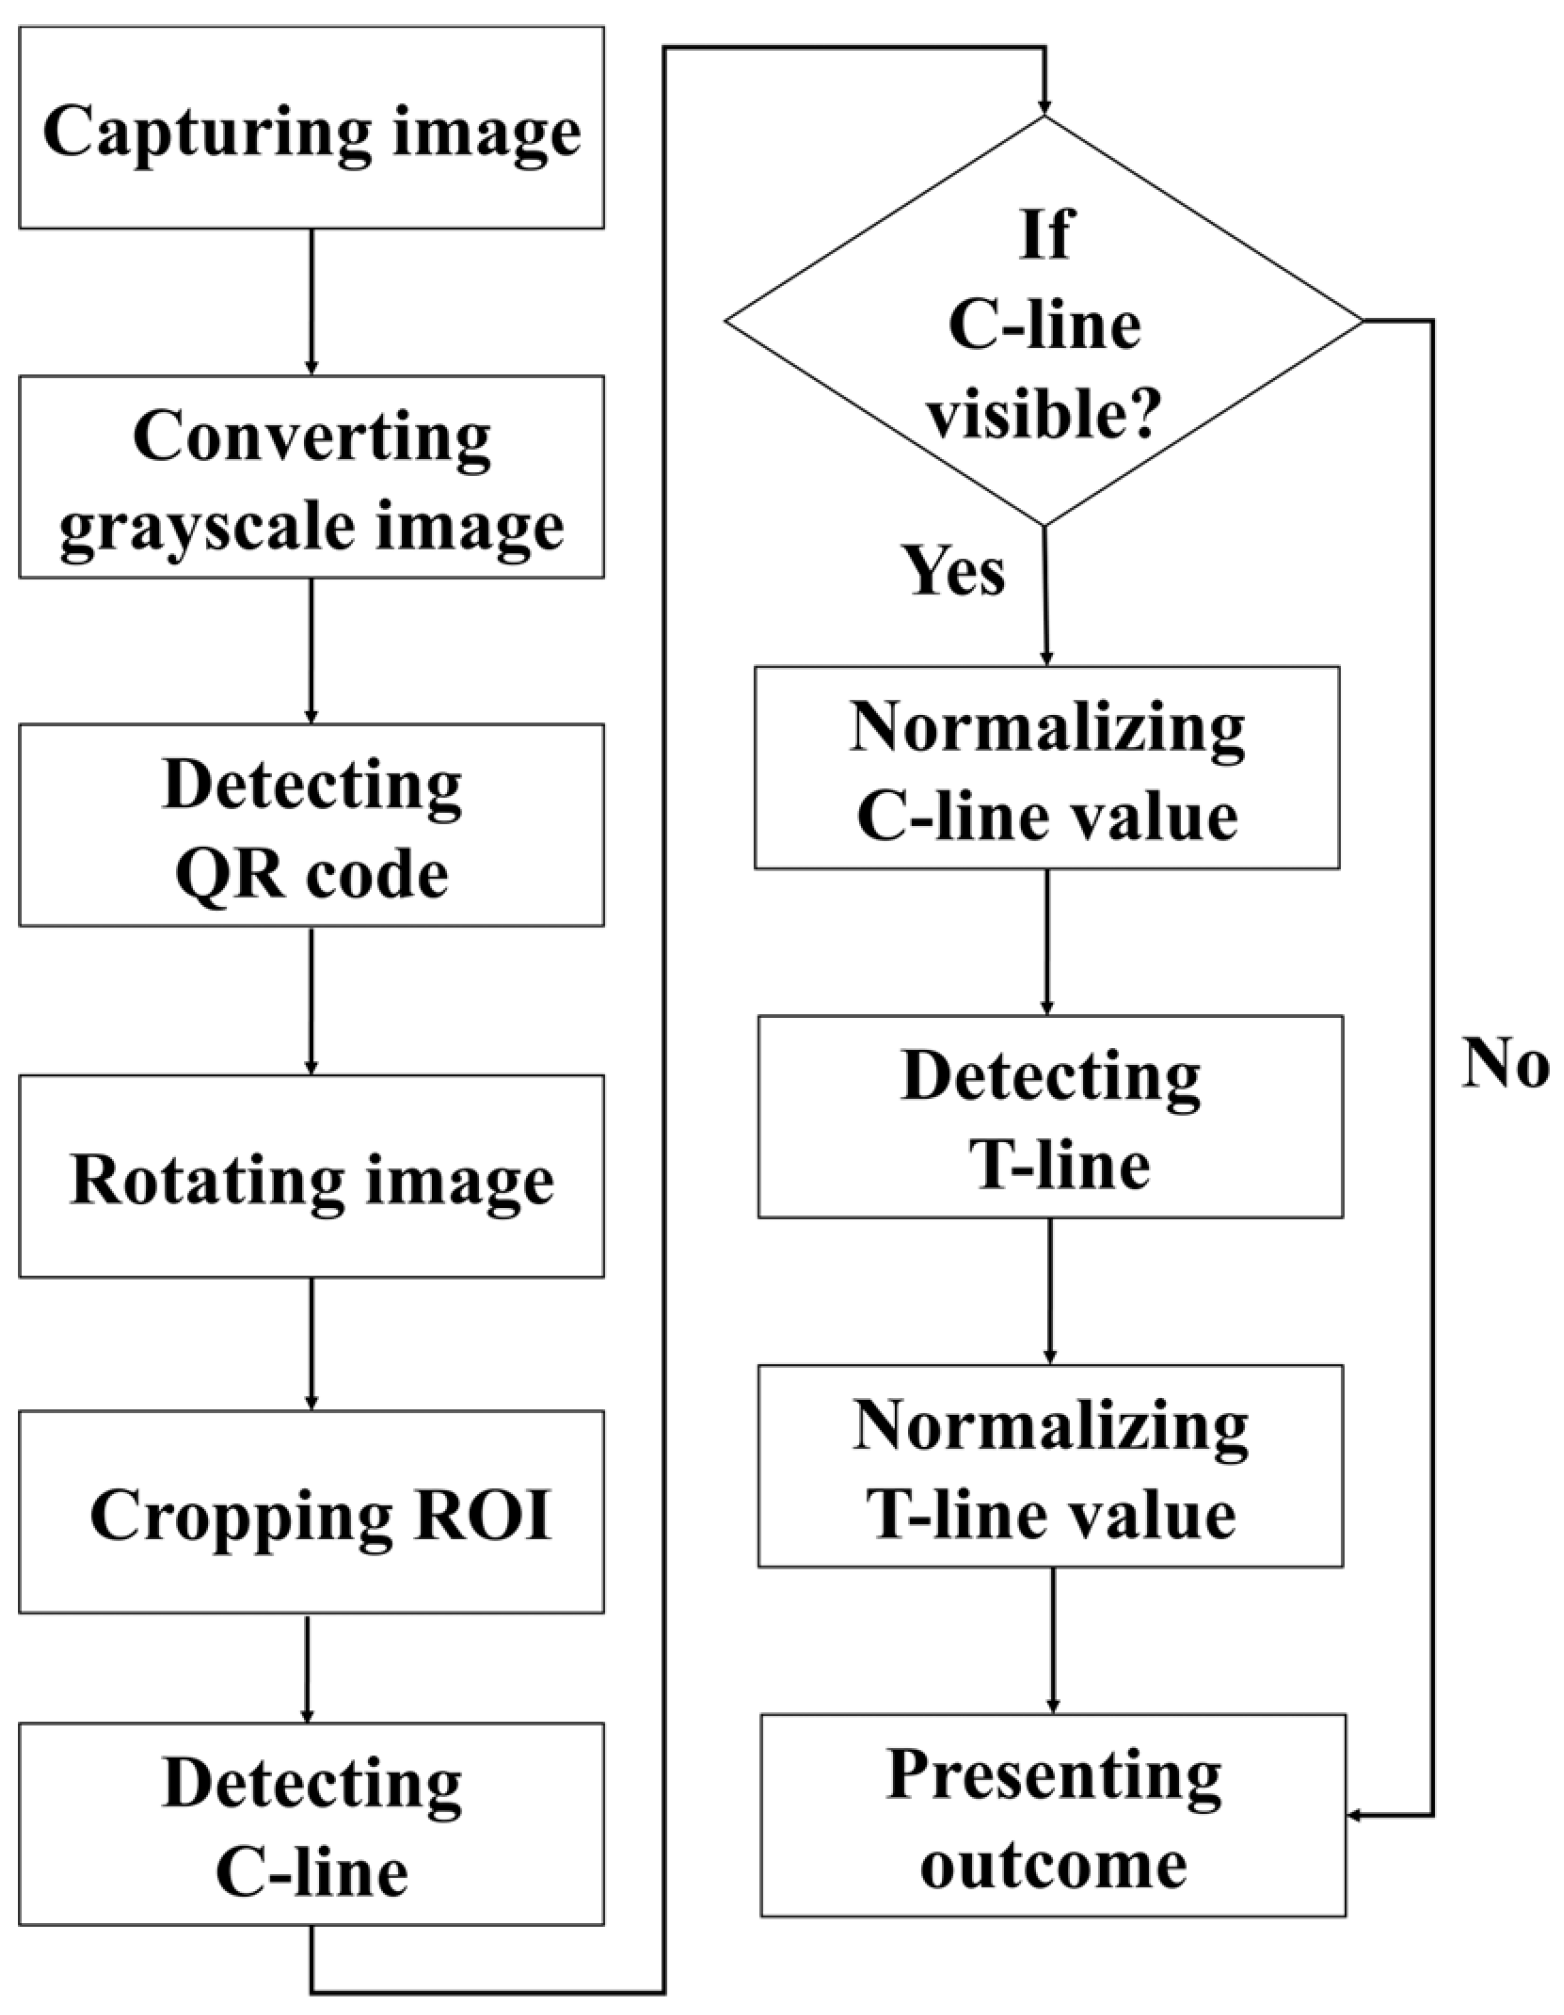
The detection procedure established in this paper is illustrated in
Figure 4. First, the rapid test was imaged using a USB camera, and the captured RGB color image was converted into a grayscale image for subsequent analysis. The detection procedure began with locating the QR code, followed by reading the recorded information regarding the test type and batch number. The endpoints of the QR code were then extracted as reference coordinates to perform perspective transformation, thereby rotating the image and aligning the rapid test at the center of the frame. Next, the display region of the rapid test was segmented and defined as the region of interest (ROI), which was subsequently subjected to result interpretation and quantitative analysis. During the analysis, the presence of the control line (C line) was first verified. If the C line was absent, the reagent was immediately classified as invalid, and the test line (T line) was not analyzed further. If the C line was present, its signal intensity was normalized, after which the existence of the T line was detected, and its corresponding intensity was also normalized.
2.4. Region of Interest (ROI) Cropping
In this paper, each rapid test used includes a fixed-position QR code that encodes relevant information such as the test item, specimen type, and batch number. In addition to serving as an identifier for the rapid test, the endpoints of the QR code also provide reference markers for image processing. After reading the QR code data, its corner coordinates are used to perform perspective transformation that centers the rapid test in the image through rotation and alignment.
Once the rapid test is centered, the portion of the image above the QR code is cropped to prevent interference during ROI selection caused by the presence of the code. ROI extraction is performed through contour detection. The image is first binarized to enhance edges, and contours approximating a rectangular shape are identified. Among these, the largest contour whose center is horizontally aligned with the QR code is selected. This region is then cropped and used as the ROI for interpretation and quantitative analysis.
2.5. Result Detection
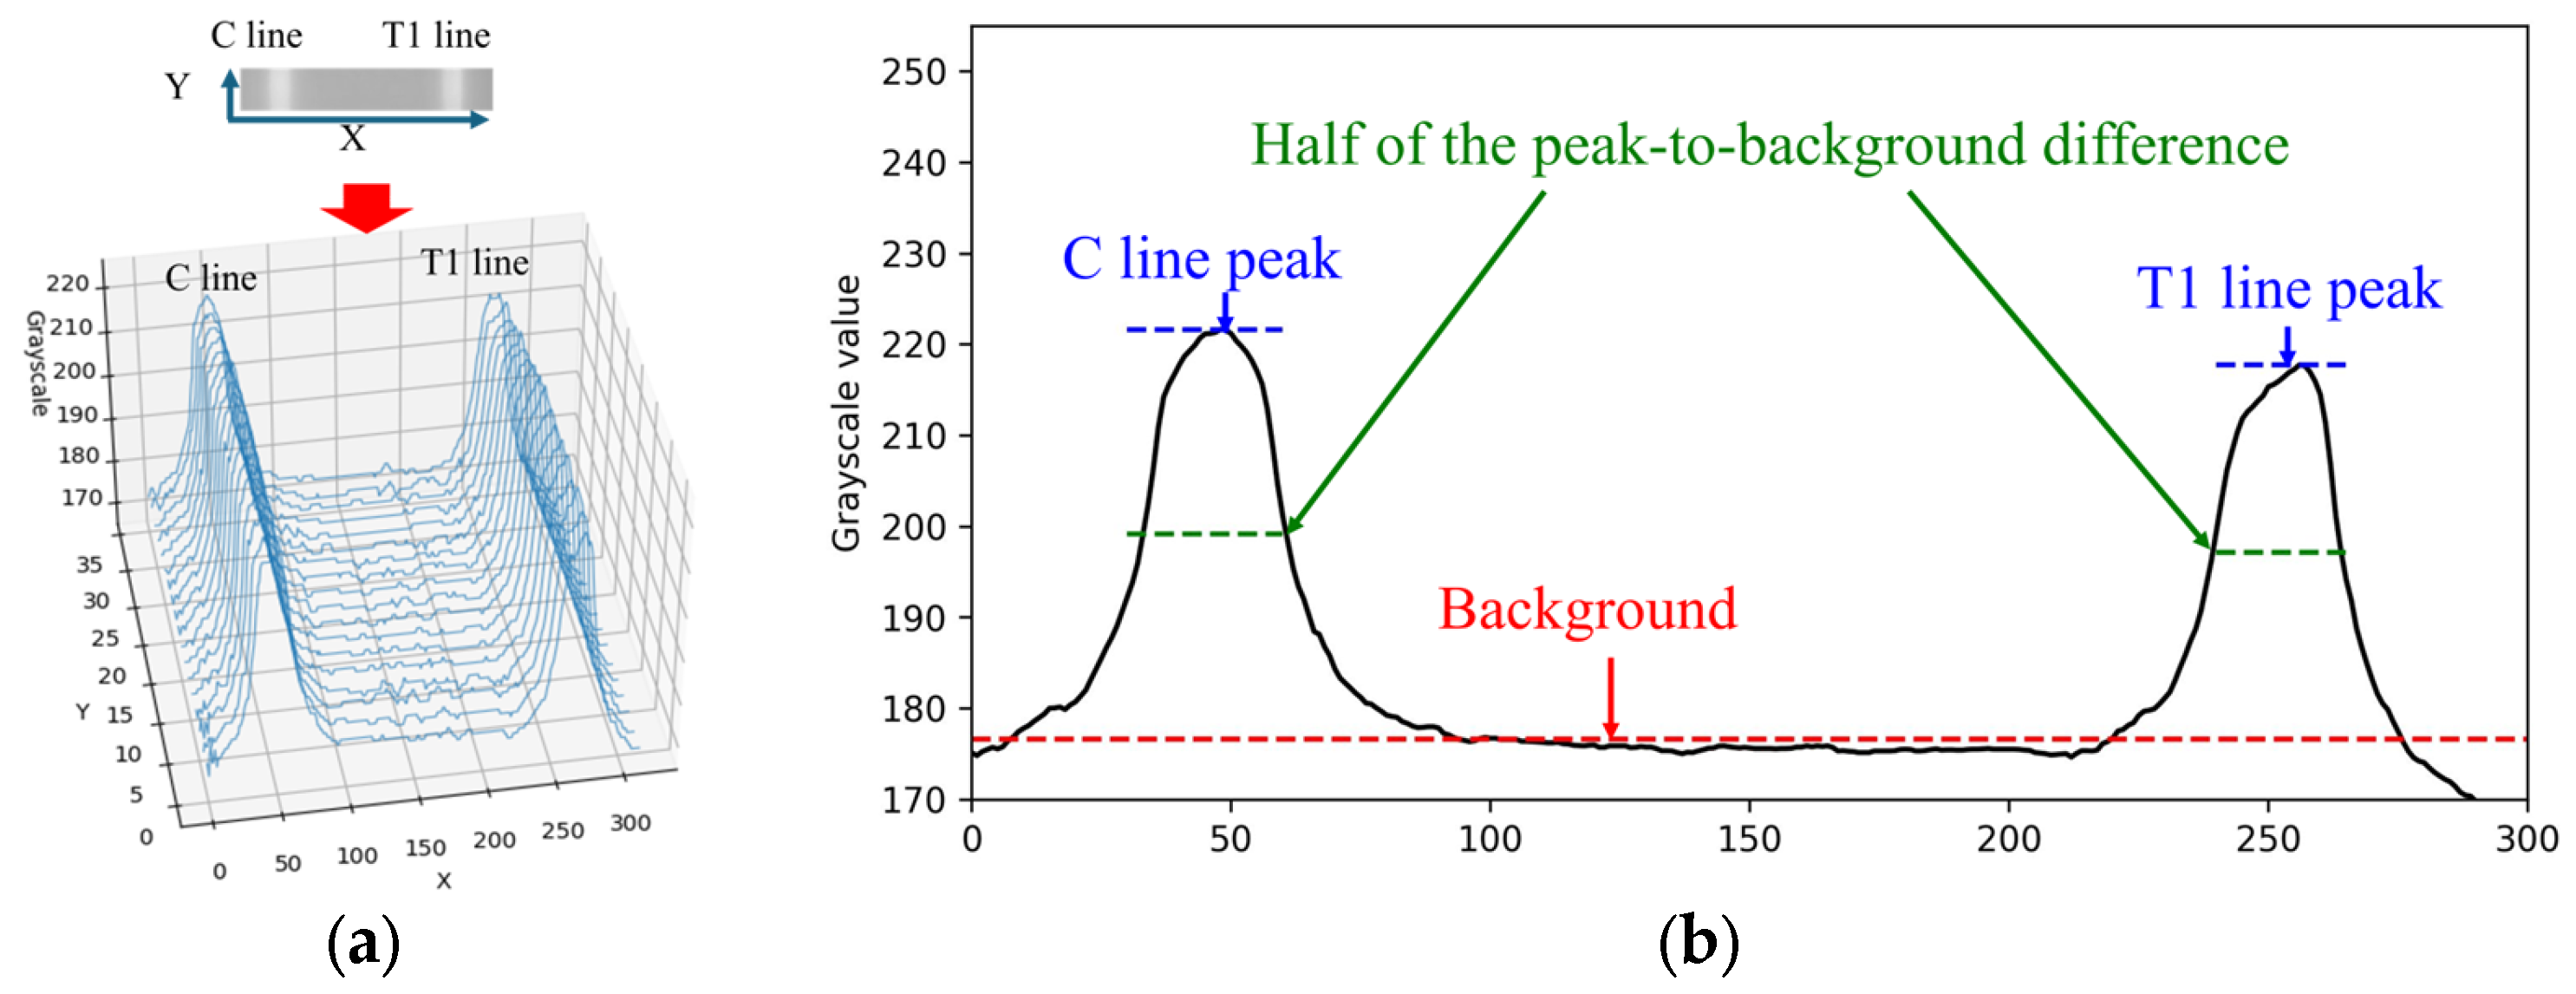
When the rapid test result is positive for Flu A, both the C line and T1 line appear simultaneously within the cropped ROI image. The grayscale values along the X-direction of the rapid test exhibit a waveform-like distribution, as shown in
Figure 5a. This paper utilizes the characteristics of this distribution to perform numerical normalization for the C line, T1 line, and T2 line. The grayscale values of the ROI image are summed and averaged along the Y-direction to obtain the average grayscale distribution along the X-direction, as illustrated in
Figure 5b.
Automatic Multiscale-based Peak Detection (AMPD) is an algorithm for detecting peaks in noisy signals. It was proposed by Scholkmann et al. in 2012 [
24]. The method is based on the calculation and analysis of the Local Maxima Scalogram and uses multiscale technology to identify the true peak in the signal. The AMPD algorithm does not require any parameters to be set before analysis and is quite robust to high-frequency and low-frequency noise. Since the mean grayscale distribution along the X-direction exhibited a waveform-like pattern, the AMPD algorithm is then applied to identify the peak positions in the distribution. Based on the relative positions along the X-axis, the presence of the C line and T line is determined, followed by numerical normalization.
The normalization methods for the C line, T1 line, and T2 line were identical. Taking the C line as an example, the normalization process was performed as follows. First, let I(x) denote the grayscale intensity at position x along the C line region. The background value I
bg was defined as the median grayscale intensity of the entire image, representing the baseline level of non-line regions. The peak grayscale intensity of the C line was denoted as I
peak. The difference between the C line peak and the background was first calculated as follows:
To obtain a more stable measurement, this paper defines a reference threshold at half the difference between the peak and the background value. The calculation equation is expressed as follows:
Subsequently, all grayscale values
within the region where
were extracted and averaged to obtain the representative C line intensity:
Finally, the normalized intensity of the C line is calculated as
This normalization method was consistently applied to the T1 line and T2 line using the same computational procedure, with the corresponding symbols replaced by IT1 and IT2, respectively.
4. Discussion
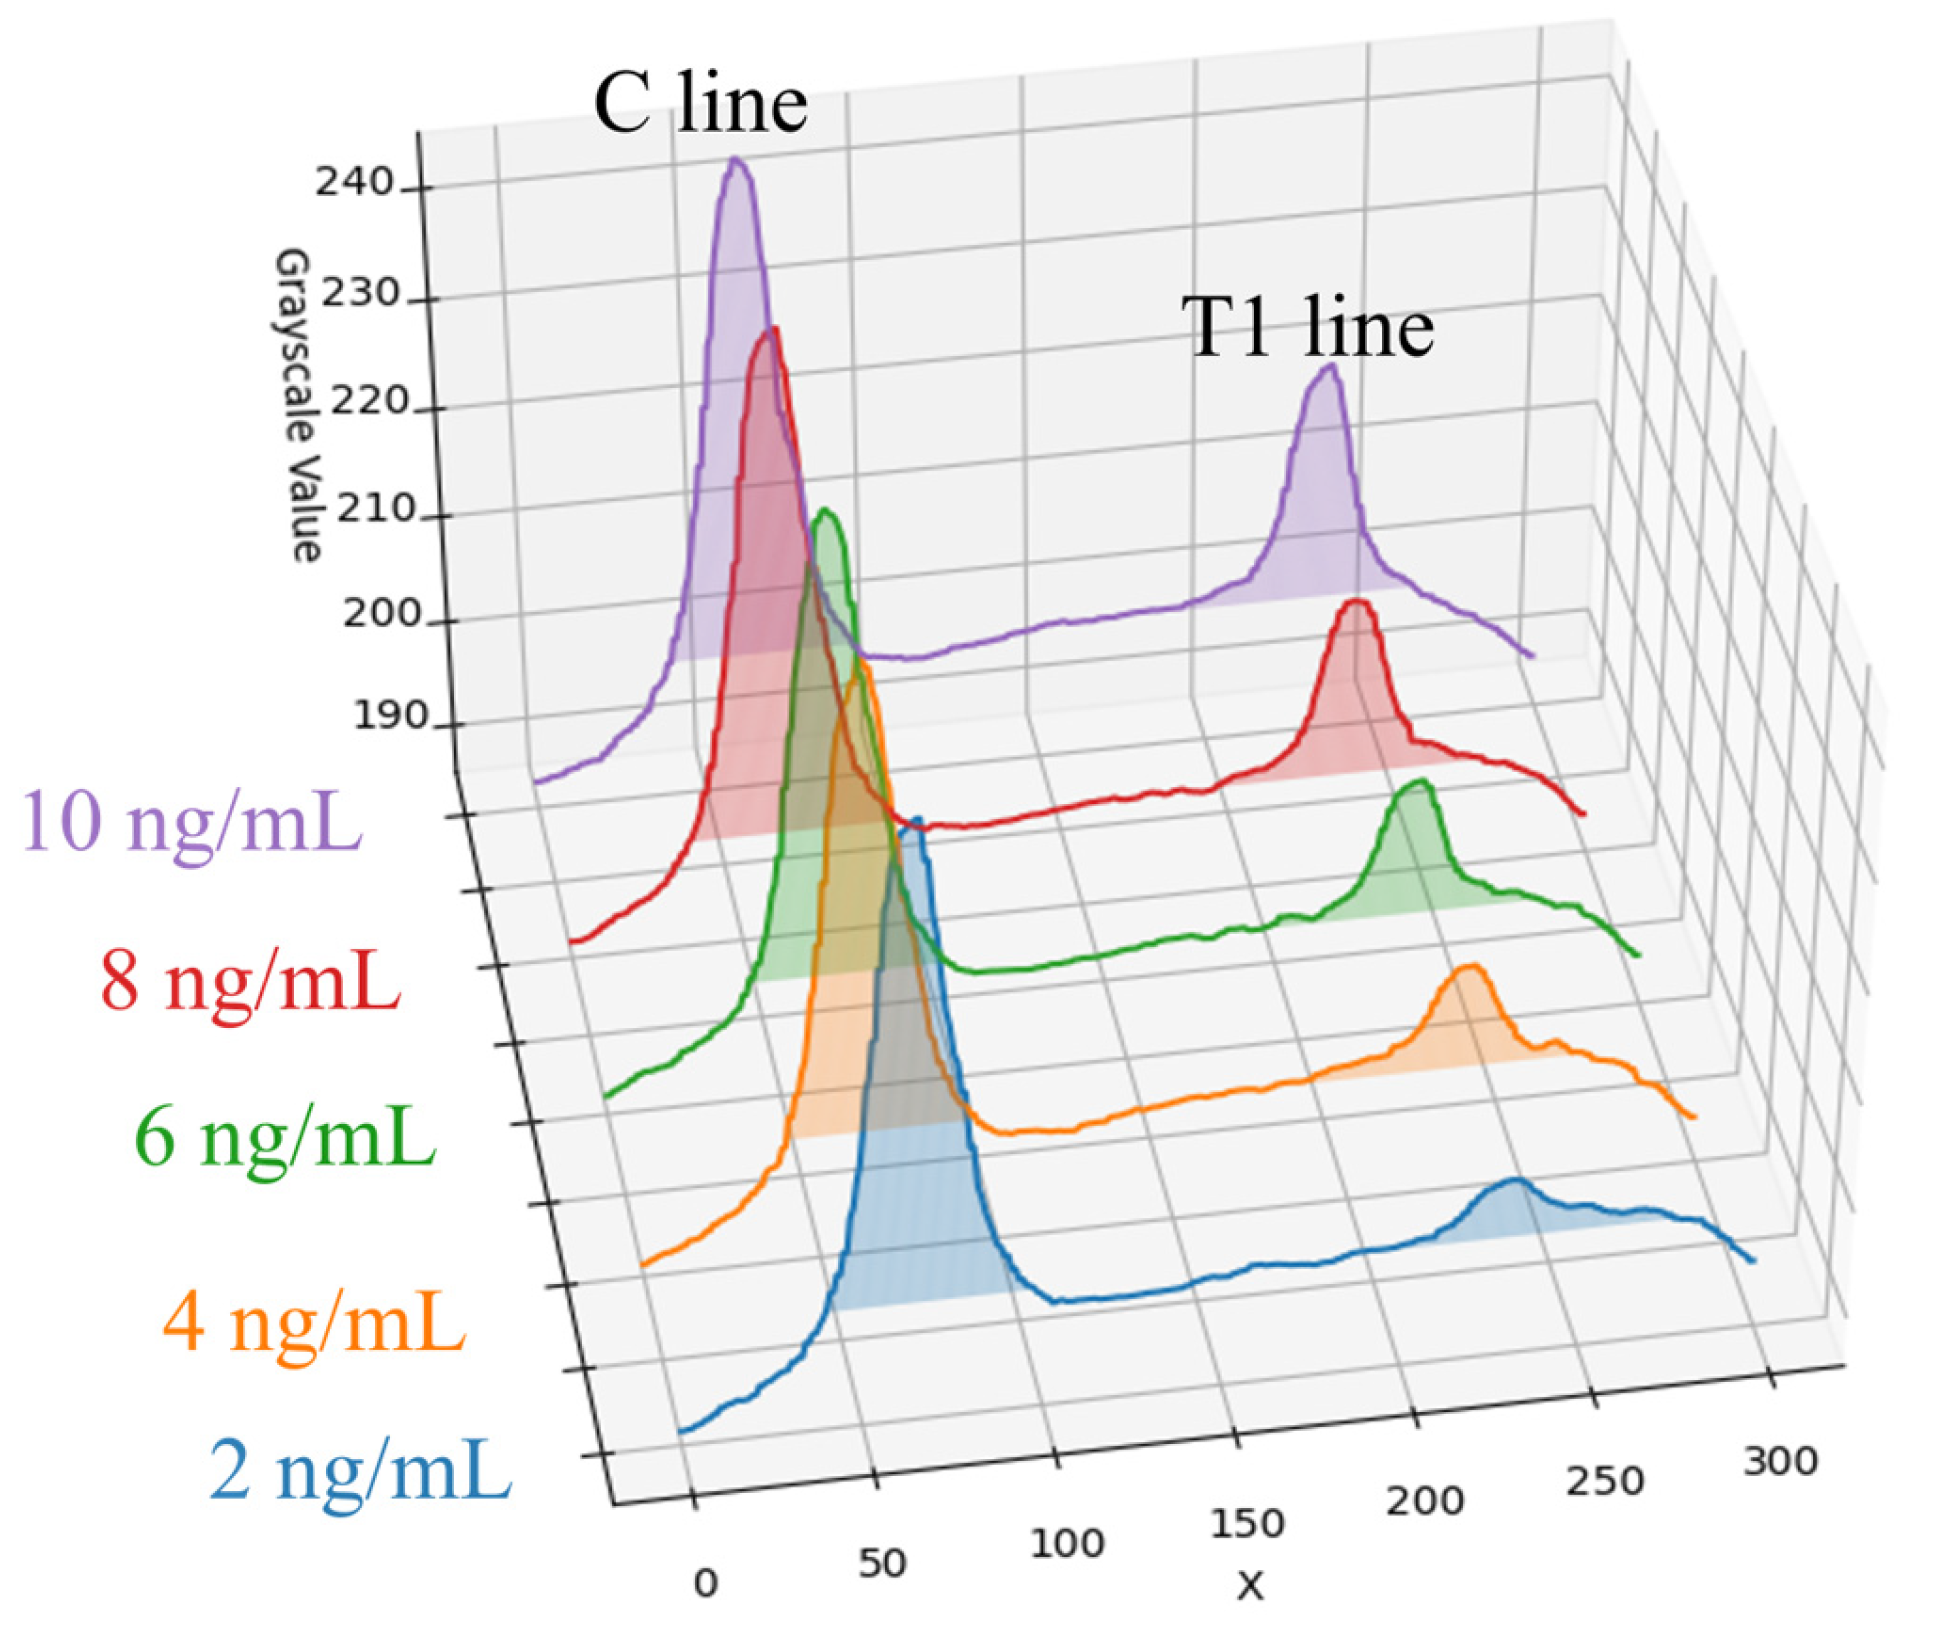
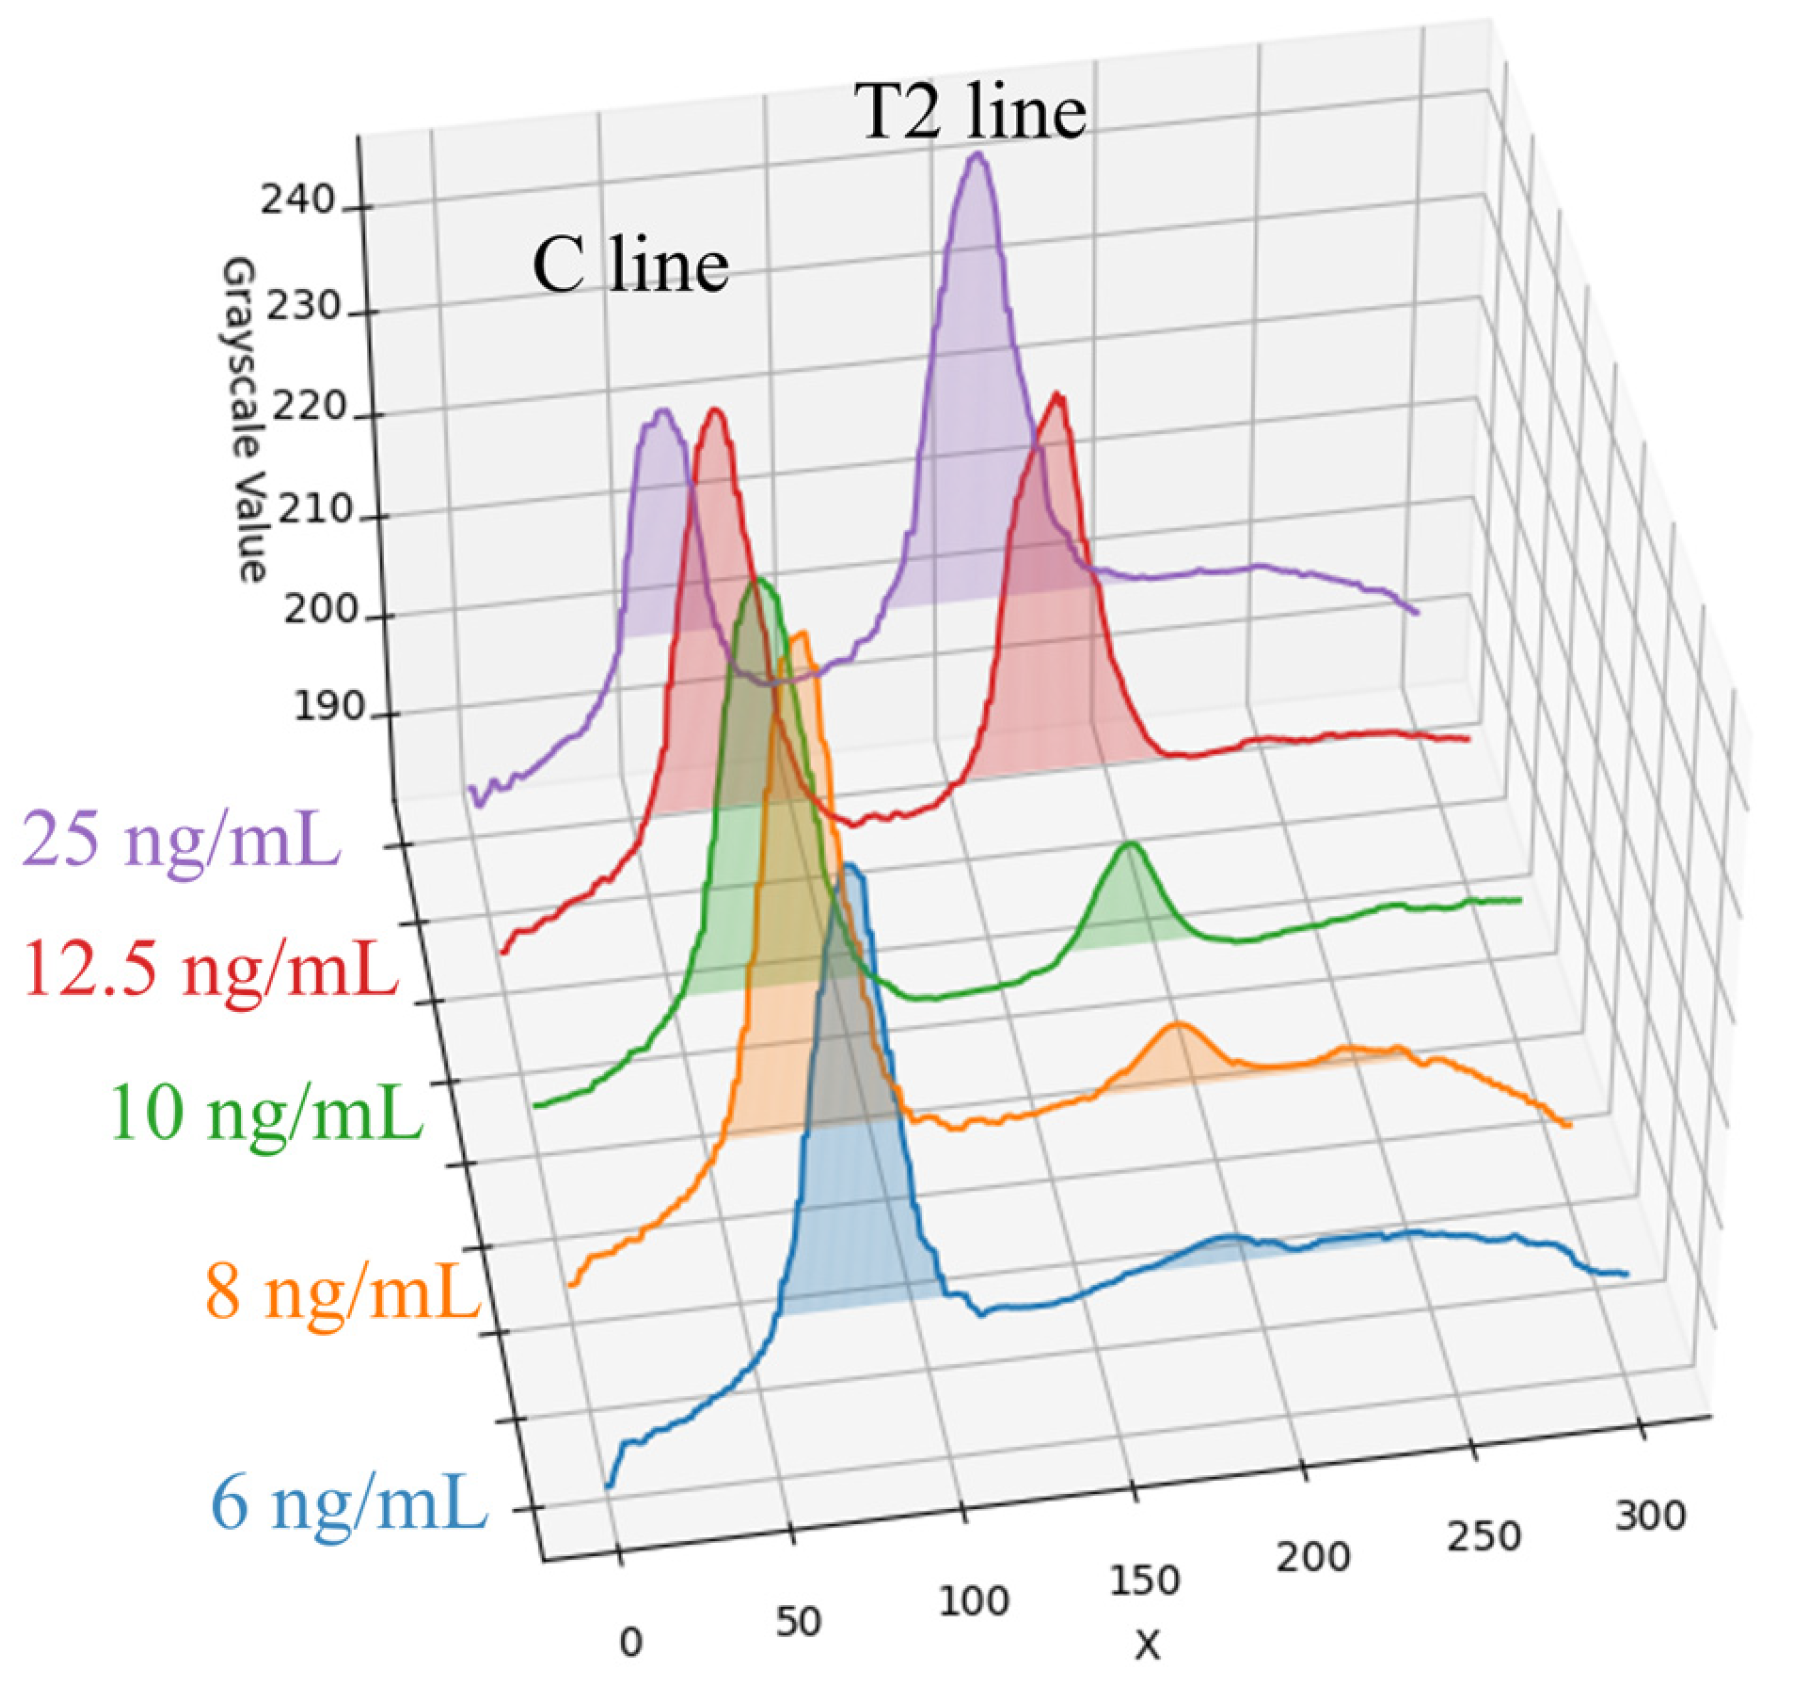
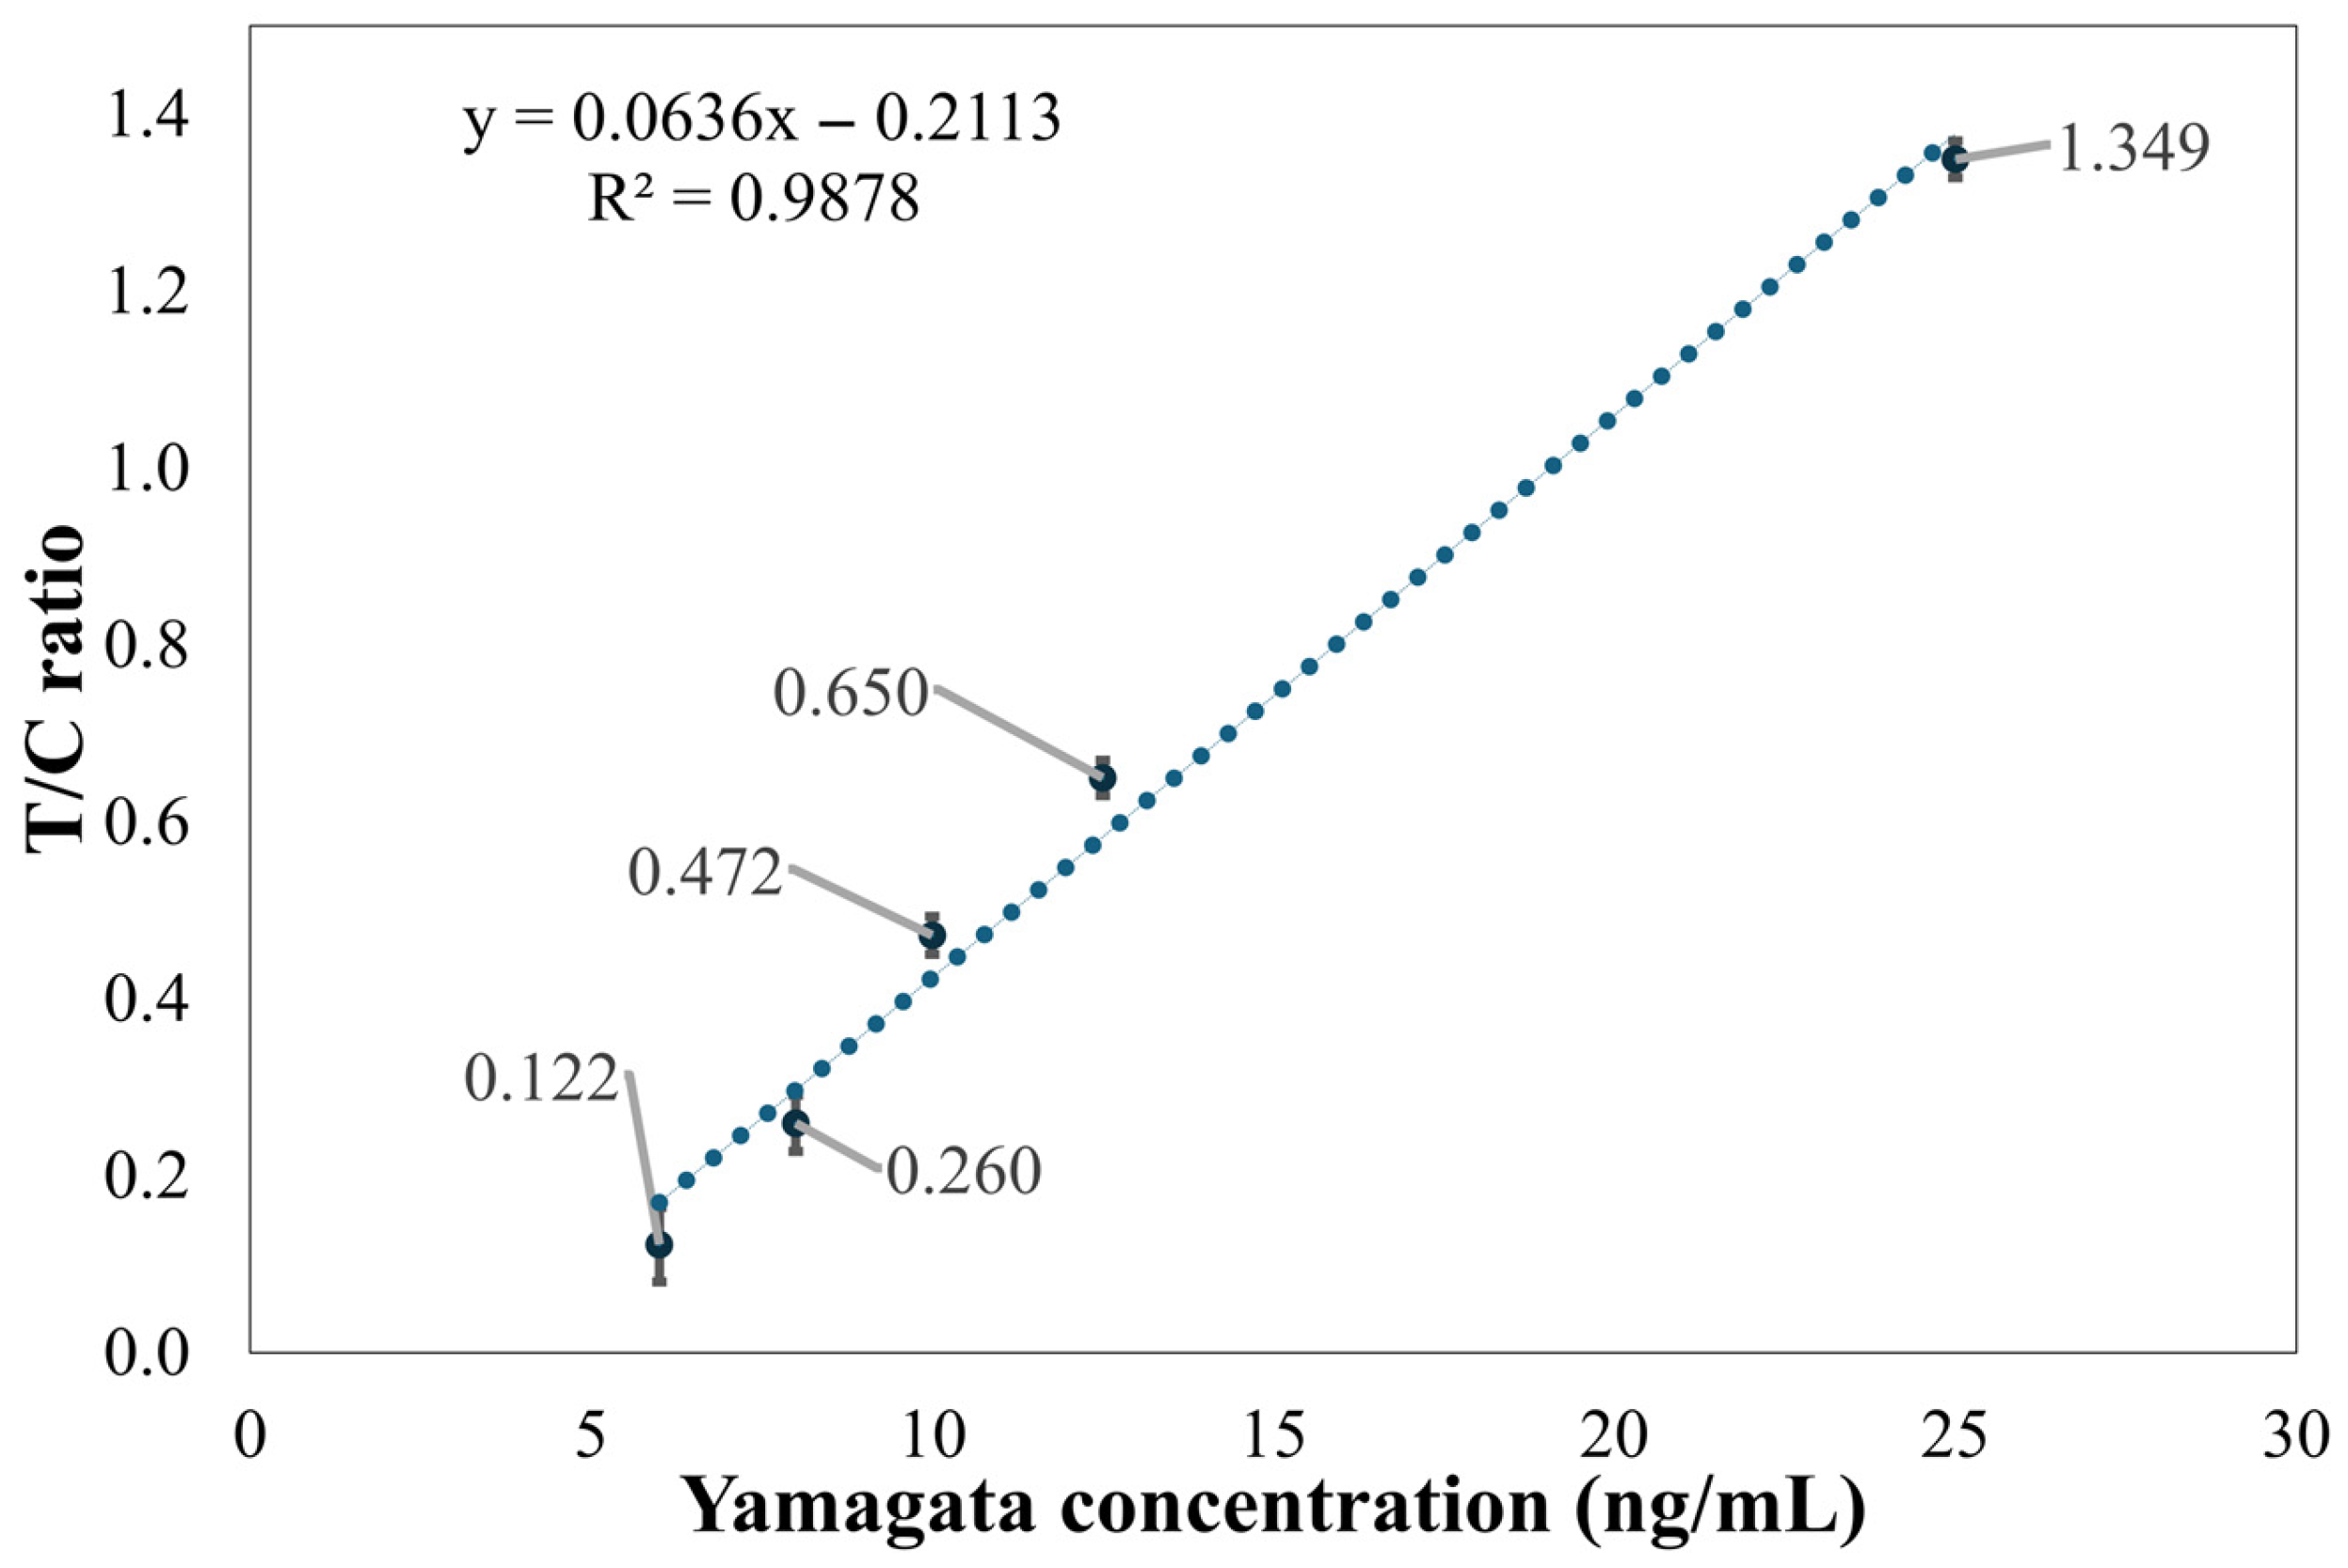
In this paper, a dark chamber equipped with a UV-LED light source was used. This configuration not only effectively excites the fluorescent or chromogenic reactions of the reagents but also simplifies the system design and reduces the chamber size, thereby facilitating overall device miniaturization. Notably, under high-concentration conditions (25 ng/mL) of Flu B (Yamagata) samples, the peak intensity of the C line exhibited a smaller difference from the background signal compared to the T line. This phenomenon is likely due to antibody saturation or competitive binding effects in the reagent system, resulting in a reduction in the C line signal. To mitigate the influence of such effects on result interpretation, this paper employed the T/C intensity ratio as the output metric to improve the stability and accuracy of quantitative analysis.
In addition, the background threshold was determined based on the median grayscale value within the ROI, rather than the overall mean. This choice was made because mean values are more susceptible to distortion from high-intensity signals, particularly from the T and C lines at higher sample concentrations. Such distortion can lead to an overestimation of the background level, subsequently causing underestimation of the actual analyte concentration and compromising quantification accuracy. Using the median as the reference background value thus enhances the robustness and reliability of the data.
4.1. Limitations of the Method
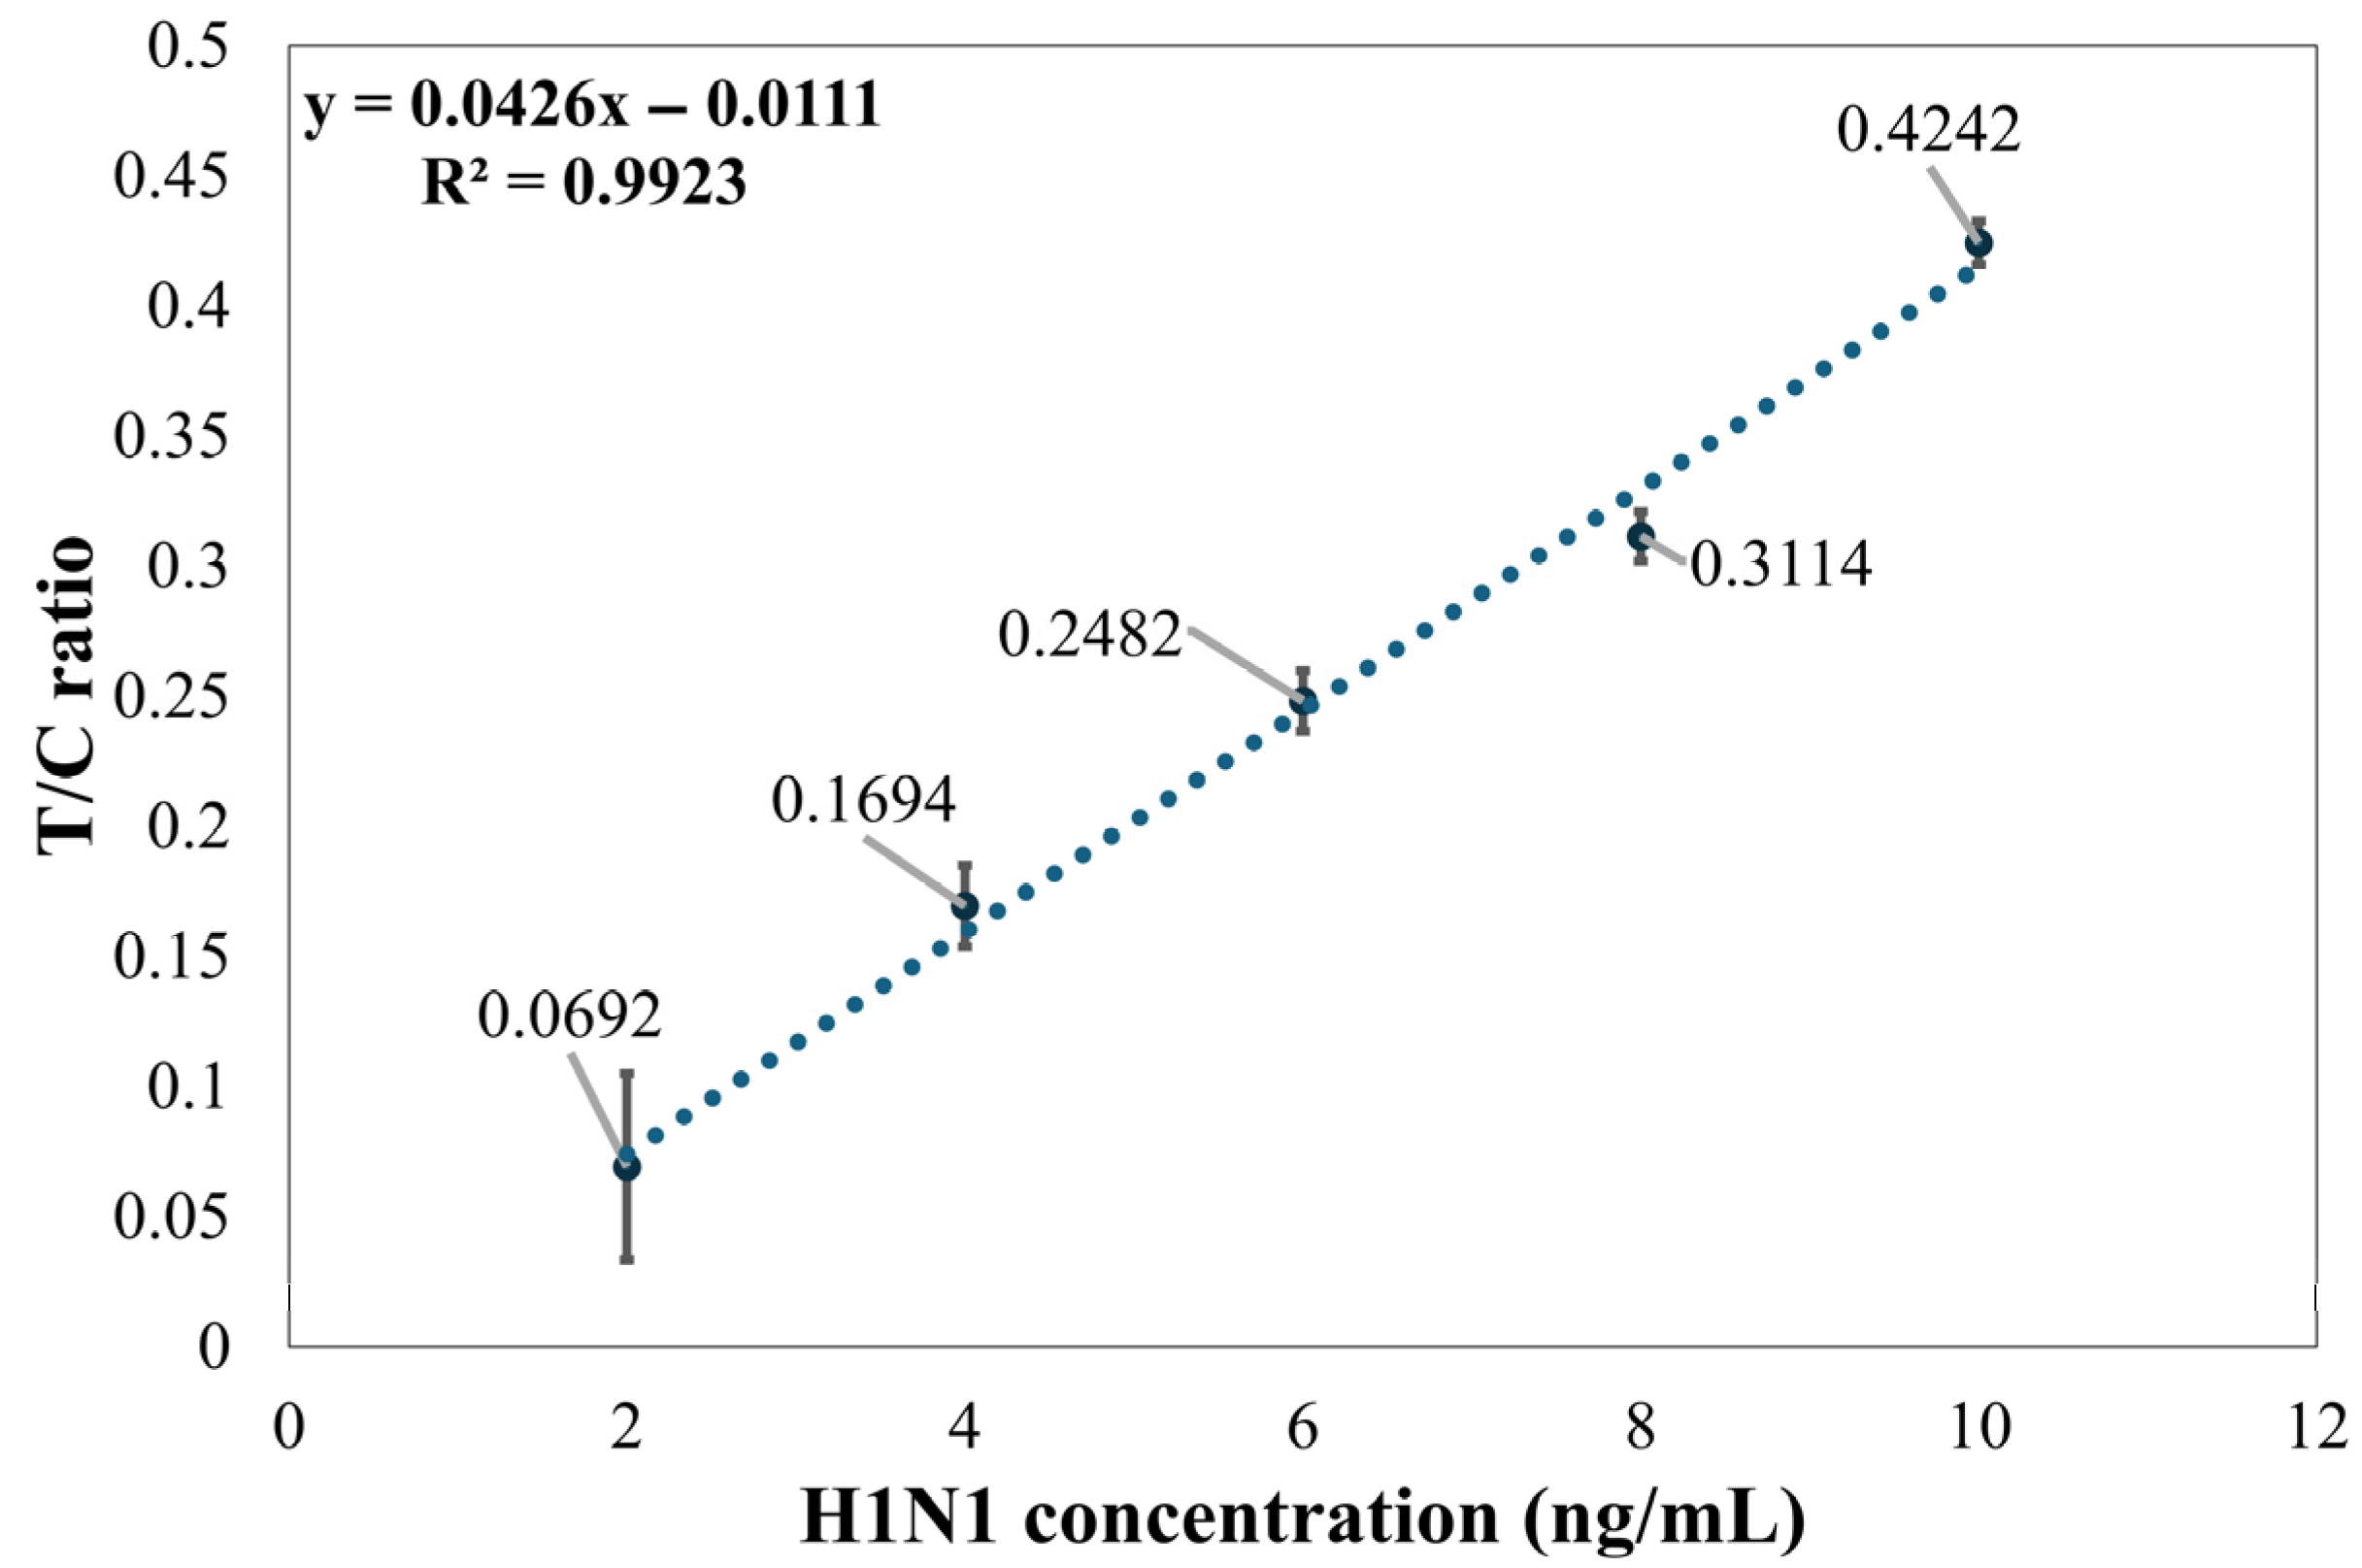
Although the established method demonstrated high linearity under specific conditions (e.g., R2 of 0.9923 for Flu A (H1N1)), several key limitations must be addressed when evaluating its broad applicability such as variability at low concentrations, validation on specific influenza strains, and environmental and reagent-related restrictions.
The method faces challenges in the detection of low-concentration samples. Experimental results show that as the detection limit is approached, signal variability significantly increases. For instance, at a concentration of 2 ng/mL for Flu A (H1N1), the variability of the T/C ratio was significant; thus, the stable detection limit for this method was determined to be 4 ng/mL. Similarly, Flu B (Yamagata) showed significant variability at a concentration of 8 ng/mL, and at 6 ng/mL and below, the T2 line signal intensity was close to the background level.
The validation experiments in this paper were conducted using two specific standard test samples: Flu A (H1N1) and Flu B (Yamagata). This indicates that the method’s efficacy and performance have been validated only for these two specific strains. Its performance on other influenza strains such as Flu A (H3N2) or Flu B (Victoria) remains to be further confirmed in future studies [
9,
26,
27].
The currently developed detection method is specifically designed for use in a dark chamber equipped with a UV-LED light source, which limits its immediate application in general clinics or home settings. Moreover, this image processing method is designed for fluorescent rapid tests and cannot be directly used to interpret conventional colloidal gold (non-fluorescent) rapid tests.
4.2. Future Outlook
To overcome the aforementioned limitations and expand the applicability of the established method, future research will proceed in two main directions. First, the test strips and concentration ranges should be adjusted to broaden the range of potential applications. Second, this study can be integrated with neural networks to enable more sophisticated image detection, such as using smartphone imaging under normal lighting conditions and applying the approach to non-fluorescent rapid test reagents.
However, when developing such deep learning-based systems, it is essential to consider the cautions raised by Dell’Olmo et al. in their study on CNN-based forgery detection [
28]. Their work highlights the major challenge of dataset dependency, emphasizing that the performance of CNN architectures is strongly influenced by the intrinsic characteristics of the training datasets. Their analysis demonstrated that factors such as sample size, class imbalance, and the intrinsic complexity of manipulations, which in our case refers to the subtlety of the signal, are critical determinants of a model’s generalization capability.
