Abstract
This study uses a pointwise statistical approach to analyze Near-Infrared Spectroscopy (NIRS) signals in preterm infants with and without Patent Ductus Arteriosus (PDA). The analysis focuses on three signals: blood oxygenation (SpO2), cerebral oxygenation (rSO2-1), and renal oxygenation (rSO2-2), across three newborn groups: without PDA (no-PDA), with hemodynamically insignificant PDA (PDA), and with hemodynamically significant PDA (hsPDA). While NIRS is widely used in medicine, its research, featuring statistical analysis, has been limited. Smoothed signals were tested using pointwise ANOVA and Tukey HSD to detect significant group differences. Results showed distinct patterns in rSO2-1 and rSO2-2, with the hsPDA group standing out in rSO2-1 and the no-PDA group in rSO2-2, demonstrating the value of this method in biomedical signal analysis. Pointwise ANOVA shows more time periods with significant differences compared to the SpO2 signal. The time period with the most significant differences is between 2 and 6 h, with additional peaks of p-values below 0.05 occurring before 2 h. These findings demonstrate the value of FDA in improving statistical analysis of biomedical NIRS signals and support its use in future research.
1. Introduction
Biomedical Near-Infrared Spectroscopy (NIRS) provides continuous, temporal measurements of regional oxygenation in tissues such as the brain and kidneys. In premature neonates, these signals reflect rapid physiological changes caused by Patent Ductus Arteriosus (PDA), respiratory instability, or impaired perfusion. However, traditional statistical techniques to this type of data, which are typically focused on discrete time intervals or averaged values, do not necessarily illustrate how these signals evolve over time. This restriction can lead to the loss of temporal data and hide clinically significant short-term events.
Functional Data Analysis (FDA) offers an alternative, understanding each signal as a continuous curve rather than a collection of discrete data points. This method preserves the signal’s entire temporal structure and allows you to test hypotheses point by point, similar to pointwise ANOVA or Tukey’s HSD tests, to identify differences between groups at specific moments. These approaches demonstrate enhanced sensitivity and interpretability for high-frequency biological data.
This study investigates whether FDA-based pointwise testing can more effectively distinguish the hemodynamic effects of PDA compared to traditional statistical analysis. Table 1 shows how the suggested method is different from traditional methods in both theory and practice.

Table 1.
Comparison between traditional statistical and functional/pointwise analysis approaches for biomedical NIRS signals.
As shown in Table 1, functional and pointwise approaches provide a more thorough, time-resolved interpretation of physiological signal dynamics, allowing doctors to detect periods of altered perfusion that conventional analysis would miss. The following sections explain how these approaches were used to measure cerebral and renal oxygenation signals in preterm infants with and without PDA.
Meanwhile, ref. [1] proposed a completely new classification model based on prediction bands, which also uses functional spectral information. This method was able to outperform classical methods such as SIMCA (Soft Independent Modelling of Class Analogy), which was considered the gold standard in classification spectroscopic models. The new method allows for the integration of decision uncertainty into the interpretation of model results, which is particularly relevant when solving clinical questions. This allows for making not only “probable” but also “safe” decisions with a known level of risk.
The versatility of FDA methods allows their application to be extended beyond the limited experimental conditions. For example, in the study [2], FDA was applied to industrial wine production to eliminate spectral data discrepancies between different instruments. This demonstrated the flexibility of FDA in practical, real-world conditions, where instrument heterogeneity or data imbalance often interferes with analysis. Using FDA, it is possible to normalize spectra and increase data usability without additional calibration, which can also be applied to standardize clinical data.
Furthermore, ref. [3] highlights the ability of FDA to handle spectral data with strong wave-to-wave correlation, high dimensionality, and sparse observations. These methods allow modeling of complex data relationships, including adaptive filters, trend smoothing, and providing interpretation that can be understood even by non-statisticians. This is especially valuable in biomedicine, where clarity is one of the conditions for successful clinical integration.
One of the most important aspects of analyzing time series signals is the ability to interpret not only the signal values, but also their dynamics, frequency, and deviations. Khan et al. [4] showed how using fNIRS signals and the innovative ETEP feature extraction method can distinguish pain-induced hemodynamic changes. This method allowed to detect subtle signal differences more effectively than traditional analysis methods. This confirms that FDA-based algorithms are more sensitive to temporal structure features, which often reflect pathological processes.
One of the most important methodological insights comes from the ability of FDA to capture the entire signal trajectory as a single mathematical curve. This allows for not only statistical analysis, but also modeling and prediction. In addition, FDA methods reduce the need for data re-modeling, since they work directly with continuous functions. In comparison, classical methods often require data aggregation or filtering, which can remove essential physiological information. This approach is particularly supported by studies such as [5], which show that recurrent “hidden” (subclinical) hypoxia can only be identified using time-course-based analysis methods.
Finally, the flexibility of FDA methods is manifested not only in the analytical but also in the clinical plane. Studies show that FDA allows for inferences about temporal changes in physiological signals, which are often transient and remain unidentified in classical analyses. FDA also allows for the integration of additional variables (e.g., patient age, condition, intervention) into the analysis, which allows for the creation of more sensitive and individualized assessment models.
Analysis of biomedical signals using near-infrared spectroscopy (NIRS) is particularly relevant for monitoring premature newborns. NIRS allows noninvasive assessment of cerebral and splanchnic (most often intestinal and renal) oxygen saturation by measuring regional oxygen saturation (rSO2), and can also interpret changes in oxygen consumption by fractional oxygen extraction (FTOE). Such data are particularly valuable in early neonatal adaptation, assessing hemodynamically significant patent ductus arteriosus (PDA), respiratory failure, or circulatory regulation disorders. However, with increasing application, questions arise about the reliability of these signals, the unity of interpretation, and the limitations of clinical practice.
A study presented at [6] showed that VLBW (very low birth weight) premature neonates with hemodynamically significant PDA (hsPDA) had statistically significantly lower cerebral saturation (rSO2) than those with occluded ductus arteriosus. Meanwhile, renal rSO2 was also lower in the hsPDA group. This suggests that PDA significantly alters not only central but also peripheral organ perfusion. During the study, it was observed that even with higher oxygen supply and respiratory support, newborns in the hsPDA group still had lower rSO2. This indicates that oxygenation support alone cannot compensate for the impaired blood distribution characteristic of the “ductal steal” phenomenon caused by PDA.
The study [7] further highlights this difference. After packed red blood cell (PRBC) transfusion, improved cerebral rSO2 and decreased cerebral FTOE were observed in both PDA and non-PDA groups. However, the response of splanchnic tissues to transfusion was different: in the PDA group, splanchnic saturation remained low, while FTOE was high. This clearly indicates that PDA has a selective effect on different zones of the circulatory basin, affecting splanchnic perfusion more than cerebral, probably due to differences in autoregulatory mechanisms. Thus, NIRS data allow the detection of organ perfusion asymmetry, which may not be visible with conventional SpO2 or arterial data.
A more biological basis for NIRS interpretation is provided by the study [8]. It performed a parallel Doppler ultrasound and NIRS analysis, showing a significant correlation between regional rSO2 and vascular flow velocity (resistive index, RI). These results support the idea that FTOE is not just a theoretical concept, but also an objective indicator of circulatory efficiency. The study showed that after PDA treatment (ibuprofen) in all three studied areas—brain, intestine and kidney—rSO2 increased, while FTOE decreased. These dynamic metrics indicate that NIRS not only measures, but also responds to clinical decisions—which gives NIRS predictive value.
However, the interpretation of NIRS is complicated by several key factors. First and foremost, device variation. The study [9] showed that even using the same NIRO-300 device, brain rSO2 values can vary by 5–6%. It is also emphasized that the data from INVOS 5100 and NIRO-300 can differ by up to 14%, which prevents the universalization of normative values. Another aspect is the physiology of the study area: kidney and intestinal tissues are characterized by greater variation due to the presence of air, feces or gas in the intestine, which can distort light absorption and scattering trajectories.
This issue is further highlighted by [10], which discusses that skin thickness, tissue composition, and fat layer thickness (e.g., 5–10 mm) can reduce the NIRS signal by up to 50%. This is especially important when analyzing signals from somatic areas such as the kidneys or the abdominal region. Thus, differences in rSO2 between patients do not always indicate a true physiological difference—they may be the result of technical or anatomical factors.
However, even with these limitations, NIRS remains a unique tool for capturing “invisible” hypoxia. Reference [5] showed that neonates at low risk (little or no respiratory support) had long series of recurrent episodes of cerebral hypoxia that were not disturbed by conventional pulse oximetry (SpO2 remained within normal limits). This suggests that cerebral rSO2 is more sensitive than systemic SpO2. This also illustrates the added value of NIRS in long-term monitoring, especially at the end of the NICU when other monitoring parameters decrease.
Another important study [11] confirms that both cerebral and renal rSO2 correlate with blood gas parameters and hematological parameters. Hemoglobin and hematocrit values were positively associated with rSO2. This provides additional biological support for these indicators, demonstrating that NIRS not only captures a signal but also reflects the overall systemic physiological state. Such a connection between physiological laboratory tests and non-invasive rSO2 data allows them to be used in clinical decisions as an additional source of information.
An interesting aspect is presented by [12], which used dual-channel NIRS analysis in infants during ECMO. Although there is no direct connection with PDA, this study shows that even in the presence of significant changes in blood flow (e.g., vascular ligation), NIRS signals reflect changes in both ischemia and perfusion. This allows for the expansion of the application of NIRS even in extreme physiological situations, including PDA, when blood flow between zones becomes uneven.
In summary, SpO2 measurements reflect arterial oxygen saturation, but do not provide information about oxygen utilization in tissues. Meanwhile, rSO2 provides a “local” saturation level, allowing conclusions to be drawn about the perfusion, oxygen supply and consumption of a specific organ. This information is further refined by FTOE, which reflects the difference between systemic SpO2 and regional rSO2. At the same time, it creates a comprehensive picture of the hemodynamic status, especially relevant in the case of PDA, where the distribution of perfusion is asymmetric between the brain and the kidneys. PDA remains one of the most significant hemodynamic challenges in neonatal intensive care practice. Although physiological closure of the ductus occurs in most infants within the first 72 h of life, in premature infants the PDA can remain open and become hemodynamically significant (hsPDA), affecting systemic blood flow, organ perfusion and oxygen supply. In clinical situations where PDA is suspected or established, an accurate assessment of its impact is essential to decide on the need for treatment, medical or surgical. NIRS technology, which assesses regional oxygen saturation (rSO2) and fractional oxygen extraction (FTOE), serves as a non-invasive way to monitor changes in organ oxygenation in this area.
The study, published in [6], clearly demonstrated that preterm infants with hsPDA had significantly lower cerebral rSO2 values than those with closed or hemodynamically insignificant PDA. In addition, renal saturation was also significantly lower in the hsPDA group, indicating that PDA has systemic effects on both central and peripheral perfusion. This analysis also highlighted that differences in rSO2 existed despite more intensive respiratory support and supplemental oxygen in the hsPDA group. This suggests that oxygenation does not compensate for impaired perfusion, and statistical analysis of rSO2 becomes extremely valuable in decision-making.
In turn, the study [7] emphasizes the impact of PDA on splanchnic circulation. After packed red blood cell (PRBC) transfusion, an increase in rSO2 was observed in the brain region in both groups—with and without PDA. However, only in the group with PDA closure, splanchnic (intestinal) saturation indicators improved. When the PDA remained open, this effect did not occur, and FTOE remained high. This asymmetric response suggests that although cerebral perfusion is partially protected by autoregulatory mechanisms, intestinal blood flow is directly dependent on systemic hemodynamics and is more vulnerable to the phenomenon of “ductal steal”, when blood leaks from the systemic circulation through the patent ductus arteriosus.
Furthermore, studies show that even PDA, which is not assessed as hemodynamically significant according to the classical echocardiographic classification, can affect organ oxygenation. Arman et al. [8] revealed that even in the presence of “nehsPDA”, statistically significant differences in FTOE and rSO2 are observed before and after ibuprofen treatment. This suggests that the mere presence of PDA—even without clear criteria for hsPDA—can affect perfusion. These changes are reflected in statistical analysis using FDA methods, which allow for the assessment of time course differences, identification of critical periods, and accurate recording of changes after treatment.
In turn, ref. [13] study with an animal model highlights the dynamics of PDA opening and closing: in mice up to 24–26 h. after birth, the ductus can be pharmacologically opened or closed, and then only with a limited response. This provides additional value for time-specific signal assessment. In clinical practice, this means that rSO2 and FTOE measurements can be useful in identifying the critical time window in which treatment will be most effective. Such analyses are particularly suitable for use with pointwise statistical methods (e.g., pointwise ANOVA), which allow for the detection of significant differences at specific time points. Another essential clinical aspect is the integration of NIRS and statistical signal analysis in blood transfusion decisions. The study [5] showed that even with normal systemic SpO2, premature infants experience prolonged episodes of cerebral hypoxia that would be undetectable without NIRS. These data can be evaluated using pointwise analysis, identifying specific periods with critically low saturation, which allows deciding on the need for transfusion not only based on hemoglobin levels, but also on the actual imbalance of oxygen supply-demand. This helps not only to individualize clinical decisions, but also to reduce the number of transfusions.
The application of FDA methods in decision-making is also manifested in the assessment of long-term changes. Studies (e.g., [3]) have shown that FDA allows not only to identify momentary differences, but also to assess general signal trajectories and trends. At the clinical level, this means the ability to recognize long-term perfusion problems, even when individual saturation values remain within normal limits. Such models can be the basis for developing risk assessment algorithms that integrate rSO2, FTOE and signal course over time, thus helping to predict IVH, NEC or other complications.
Another important application area is the assessment of treatment effectiveness. The study [9] showed that newborns with low rSO2 (especially in the splanchnic region) were more likely to have long-term complications. In addition, a relationship was observed between splanchnic FTOE and the risk of intestinal ischemia. In this way, FDA analysis can be used not only as a diagnostic tool, but also as a tool for assessing therapeutic response. If rSO2 values improve after an intervention (e.g., PDA closure or transfusion), conclusions can be drawn about the success of the therapy, and if not, additional actions can be decided.
Despite the clinical importance of PDA and widespread use of NIRS, statistical studies exploring the continuous temporal patterns of NIRS signals remain limited. Most existing studies rely on traditional statistical approaches that analyze discrete time points or averaged values, potentially losing important dynamic information. In contrast, FDA enables the preservation and interpretation of the entire signal trajectory, offering a more comprehensive view of physiological processes over time. However, the application of FDA to NIRS data in the context of PDA has not yet been systematically explored. Therefore, this study aims to apply functional and pointwise data analysis to biomedical PDA NIRS signals. Specifically, our objectives are (1) to gain insights about the patterns of biomedical NIRS signals patterns from preterm infants with different PDA statuses and (2) to perform pointwise functional hypothesis testing to determine if there are significant differences between preterm infants groups for each signal.
2. Materials and Methods
In this section, all methods used will be introduced, described and explained. The overall workflow of data processing—including data collection, preparation, analysis and interpretation—is summarized in Figure 1.
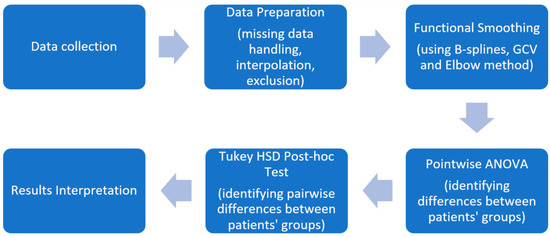
Figure 1.
Summary of the data processing workflow.
2.1. Data Collection
Perinatal and demographic data were collected, and cranial baseline ultrasound data were obtained. For two-site regional tissue oxygenation measurements, NIRS (NONIN SenSmart, X-100, Plymouth, MN, USA) was used. Neonatal/pediatric sensors (SenSmart 8004CB-NA non-adhesive with EQUANOXTM technology, Data Modul, Munich, Germany) were applied to the forehead lateral to the midline, superior to the eyebrow and inferior to the hairline, and on either the left or right posterior flank above the iliac crest and below the costal margin for measurements of cerebral and renal regional tissue oxygen saturation (rSO2), respectively, using a wrap to secure the sensor. The NIRS device was left in place for continuous data acquisition. Recordings were briefly interrupted every 3 h to reposition the sensor medially or laterally to prevent skin bruising or breakdown. All NIRS data were recorded 1 h before treatment (T0) and 24 h (T1), 24–48 h (T3), and 48–72 h (T4) after the beginning of the first dose drug infusion. Simultaneously, SpO2 was measured to calculate the fractional tissue oxygen extraction (FTOE), which reflects the balance between tissue oxygen delivery and tissue oxygen consumption, indirectly reflecting tissue perfusion [14].
A prospective observational study was carried out in a tertiary-level neonatal intensive care unit (NICU) of the Neonatology Center, Vilnius University Hospital Santaros Klinikos, from November 2017 to June 2020. Subject inclusion/exclusion criteria is published in previous papers [6]. The study was approved by the Vilnius Regional Biomedical Research Ethics Committee (No. 158200-17-940-446, issued on 12 September 2017) and registered at clinicaltrials.com (reg. No NCT04295395). Informed parental consent was obtained before enrolment.
2.2. Data Preparation
The dataset consisted of continuously collected medical data from preterm newborns, which inevitably included missing values (NAs) due to factors such as signal interruptions or technical issues. To address these missing values, a two-step approach was applied:
- Signals with 30% or more NA values for a specific patient were excluded from further analysis to ensure data quality and reliability.
- For signals with less than 30% missing data, the remaining NA values were imputed using interpolation techniques, implemented with the R library zoo [15]:
- For NAs within the signal (middle)—linear interpolation was used to estimate missing values based on surrounding data points, using the na.approx function.where is the interpolated value at the position , and are the known values before and after and and are their respective indices .
- For NAs at the beginning of the signal—the first observed value for that patient and signal was carried backward to fill in missing values, using the na.locf function with the “next observation carried backward” (NOCB) method.
- For NAs at the end of the signal—the last observed value for that patient and signal was carried forward to fill in missing values, using the na.locf function with the “last observation carried forward” (LOCF) method.
Oxygenation signals were carefully examined to identify values that would not be physiologically possible, as oxygen levels close to 0 are not realistic and likely indicate recording errors (e.g., due to infant movement or technical malfunctions). To address this a minimum threshold of 20 was established for oxygenation values. Any values below 20 were replaced with 20, ensuring that the data aligned with physiological expectations and maintained consistency across the analysis.
2.3. Functional Data Analysis and Smoothing
Since the NIRS data was collected at 1 min intervals, it was decided to use a FDA approach to treat this discrete data as smooth and continuous functions. FDA allows observed data to be considered as single functional entities rather than a sequence of individual observations. As noted by Ramsay and Silverman (2005), it enables researchers “to think of observed data functions as single entities, rather than merely as a sequence of individual observations” [16].
In this context, a dataset is considered functional when each observation , where , is a real-valued function defined over a continuous domain . Hence, each is treated as a point within a function space.
To transform the discrete data into functional form, it is necessary to convert it into a smooth functional object. For this analysis, B-spline smoothing was selected due to its simplicity, flexibility, and suitability for non-periodic data, which aligns with the characteristics of the NIRS signals. Unlike Fourier smoothing, which is better suited for periodic data, or wavelet smoothing, which is optimal for handling discontinuities or rapid changes, B-splines provide a robust and computationally efficient way to capture the smooth physiological trends inherent in the data [17].
This process replaces discrete observations (where is the number of data points) with a continuous function . The function is represented as a linear combination of basis functions, enabling the data to be treated as a smooth curve. Consequently, the discrete values are transformed into functional representations , where is a smooth function formed by a linear combination of basis functions :
When these basis functions are specified, the conversion of the data into a functional data object involves computing the coefficients of the expansion.
To apply B-spline smoothing, the range, knots, and order need to be specified. Since the dataset consists of 6 h recordings collected every minute, the range was set to [1, 720]. The order of the B-splines was selected as 4, the default value, which is sufficient to capture the physiological trends in the signal while maintaining smoothness.
Knots, which define where the basis functions meet, play a critical role in determining the flexibility of the basis functions. The number of knots corresponds to the number of basis functions minus the order of the B-splines. To determine the optimal number of basis functions and, consequently, the number of knots, generalized cross-validation (GCV) was used. This approach also helps to select the smoothing parameter, which controls the trade-off between smoothness and fit. A larger results in smoother B-splines, while a smaller allows for a closer fit to the observed data.
The Generalized Cross-Validation (GCV) function is expressed as:
where is the number of observations, is the error sum of squares, is the effective degrees of freedom, determined by and number of basis functions.
The implementation of B-spline smoothing involved the optim.basis function from the fda.usc [18], which minimizes the GCV to select optimal parameters. Once the optimal number of basis functions and the smoothing parameter were determined through GCV, B-spline smoothing was applied to the selected data.
In addition to the optim.basis function, the Elbow method was used to determine the optimal number of basis functions. The Elbow method works by iterating through a range of possible numbers of basis functions (up to the maximum, which is the number of original curves) and calculating the GCV for each. The resulting number of basis functions and GCV values are then plotted. The goal is to identify the “elbow” point, where the GCV values start to level off while keeping the number of basis functions as low as possible.
Both the optim.basis function and the Elbow method were applied, and the optimal number of basis functions was selected based on their results. In cases where the two methods suggested different results—such as when optim.basis selected a very high number of basis functions to minimize GCV—the Elbow plot often provided a more balanced choice. The result from the Elbow method was preferred in such scenarios to ensure computational efficiency and avoid overfitting.
It is important to note that in real-world data, especially medical data, the Elbow plot does not always display a sharp “elbow.” Instead, there are often several points where the GCV starts to decrease at a slower rate. In these cases, the possible options for the optimal number of basis functions were narrowed down, and the choice closer to the optim.basis result was selected to ensure consistency with GCV minimization.
2.4. Pointwise ANOVA
Pointwise Analysis of Variance (ANOVA) is a statistical method used to compare mean functions between groups at specific points in time. Although it does not analyze the curves as a whole, it provides valuable insights into the differences between data groups and the statistical significance of those differences. Additionally, pointwise ANOVA allows for an understanding of how the significance of group differences is distributed over time, offering further interpretive insights [19,20].
Pointwise ANOVA checks the null hypothesis that all groups have the same mean value at each time against the alternative hypothesis that at least one pair of data groups has different mean values at time . Null and alternative hypotheses can be expressed as:
To test the hypothesis at each time, the total sum of squares (SST) is calculated by summing the between-group sum of squares (SSB) and the within-group sum of squares (SSW), where
where
is the mean for group at time .
And
The F-statistic is then calculated at every time as:
where is the mean square between groups, is the mean square within groups.
This means that the F-statistic compares the ratio of variance explained by group differences to the variance due to random error. By comparing to the F-distribution, the p-value and significance of the difference at each time are determined.
To account for multiple comparisons across time, pointwise ANOVA p-values were adjusted using the Benjamini–Hochberg false discovery rate (FDR) procedure (q = 0.05).
2.5. Pointwise Post Hoc Analysis—Tukey’s HSD Test
To investigate pairwise differences between groups, Tukey’s Honest Significant Difference (HSD) test is used as a post hoc analysis. This pointwise test evaluates whether the mean values of two groups differ significantly at each time point . The difference is defined as:
where and are the mean values of groups and at time , respectively.
Tukey HSD calculates the critical value for pairwise comparisons using the studentized range distribution. This calculation incorporates the number of groups, the total number of observations, and the mean square within groups (obtained from the ANOVA calculation). The test identifies statistically significant differences between group pairs at each time point, providing a more granular view of group-level differences over time.
2.6. Group Means Calculation
Group means were calculated at each recorded time point to obtain pointwise averages of the signals.
For group with subjects, the mean at time was calculated as
where is the number of groups and is the total number of subjects. These group means describe the average signal at each time point for each group and for the entire dataset.
2.7. Covariance
In order to find out how values of the curves at point relate to those at point , sample covariance function is used. The function is defined as:
where
The covariance function provides valuable insights into the relationships between different time points within the same group of data. It can help identify trends by showing whether values at time point and are correlated, indicating shared patterns, or whether they are more independent. Additionally, it reveals whether signals from different curves within the same group move together or diverge at specific times, offering a deeper understanding of the underlying dynamics.
For this analysis, the var.fd function from R library fda [21] was used to compute the covariance matrix. To facilitate interpretation, the covariance matrix was visualized as a heatmap. The heatmap’s color gradient and intensity represent the strength of the covariance, making it easier to identify periods of strong correlation or independence within the data.
3. Results
This section presents the results of the study obtained by applying pointwise statistical analysis methods (pointwise ANOVA and Tukey HSD post hoc test) to cerebral (rSO2-1), renal (rSO2-2) and systemic (SpO2) oxygen saturation signals in three groups of premature newborns: without patent ductus arteriosus (no-PDA), with hemodynamically insignificant (PDA) and hemodynamically significant (hsPDA) patent ductus arteriosus. The analysis was performed using Near-Infrared Spectroscopy (NIRS) technology data, which allows for the assessment of regional organ oxygenation in real time. The presentation of the results is structured in such a way that first the statistical differences over time between the groups for each signal are presented, followed by pairwise comparisons, dynamics of mean values and characteristics of raw signals. Such a sequence of analysis allows not only to identify statistically significant differences, but also to understand their clinical significance, to assess the nature of the hemodynamic effect and possible causes. Interpretation of the results is based on the physiological changes in perfusion caused by PDA, literature data, and the context of clinical practice, in order to determine the periods when interventions may be most effective.
Before conducting the analysis, data was prepared according to methodology described in Section 2.2. Signals with more than 30% NA values for a particular patient were excluded to ensure data quality and reliability. The number of signals before and after this exclusion is summarized in Table 2. The proportion of excluded data was limited (less than 10–15% per signal type), showing that most patient signals were retained.
Table 2.
Number of signals before and after removing missing data.
Figure 2 presents the data of a pointwise ANOVA test assessing cerebral oxygen saturation (rSO2-1) in three groups of preterm newborns: hsPDA (hemodynamically significant patent ductus arteriosus), PDA (non-significant PDA) and no-PDA (closed ductus). Table 3 provides summarized numerical values of this analysis, including percentage of time points with significant differences before and after FDR correction. The analysis reveals that there are more significant differences between the groups (p < 0.05) than in the analysis of the systemic SpO2 signal. The highest consistent statistical significance is observed between the 2 and 6 h period, as well as shorter peaks of significance up to 2 h. Post hoc analysis showed that in the pair of PDA and no-PDA groups, differences occur only at individual time points, while the pairs of hsPDA with no-PDA and hsPDA with PDA are characterized by longer and more consistent intervals of significance. This means that the hsPDA group, compared to the others, has the largest and most prolonged differences over time.

Figure 2.
Time-course differences in cerebral rSO2 between neonatal groups were determined using pointwise ANOVA. Statistical significance level (p-value = 0.05) is marked with red dashed line.
Table 3.
Summary of statistical results and group mean values for each signal.
The reason for these trends lies in the hemodynamic changes caused by hsPDA. In this condition, a patent ductus arteriosus allows blood to flow from the aorta to the pulmonary artery (left-to-right shunt), reducing systemic perfusion pressure and potentially limiting blood supply to the brain. In premature neonates, cerebral autoregulatory mechanisms are limited, so even moderate changes in systemic blood flow can cause a marked decrease in rSO2. This is also confirmed by [22,23], which indicates that hsPDA can lead to lower cerebral saturation, and autoregulatory limitations amplify the effects of perfusion fluctuations. The period between 2 and 6 h likely reflects the time when the effect of hsPDA is greatest and therapeutic interventions have not yet been initiated or are insufficiently effective.
The single peaks of significance before 2 h and till 6 h may be related to physiological adaptation of the circulation after birth or to short-term clinical events (e.g., positioning, procedures) that affect regional perfusion. Meanwhile, the period without significance (1–2 h) may indicate a temporary stabilization of hemodynamics between groups, possibly due to natural closure of the ductus in the hsPDA group or to the effect of the applied therapies. Additional explanation is provided by [7], which emphasizes that although cerebral perfusion is often partially protected by autoregulatory mechanisms, in the presence of a strong shunt, the decrease in rSO2 becomes consistent and clinically significant.
This result has direct clinical implications. Pointwise ANOVA not only allows us to identify that the groups differ, but also to precisely localize the periods when the differences are greatest. This may be important when deciding on the timing of interventions—if the greatest differences are found between 2 and 6 h, this interval could become a priority for hemodynamic assessment and treatment. Such an analytical approach allows us to identify critical periods, link them to possible causes and predict consequences, thereby strengthening the basis for decision-making in clinical practice.
Figure 3 presents the results of a Tukey HSD post hoc test evaluating the differences in cerebral oxygen saturation (rSO2-1) between three pairs: no-PDA and hsPDA, PDA and hsPDA, and PDA and no-PDA, during the first six hours after the start of observation.
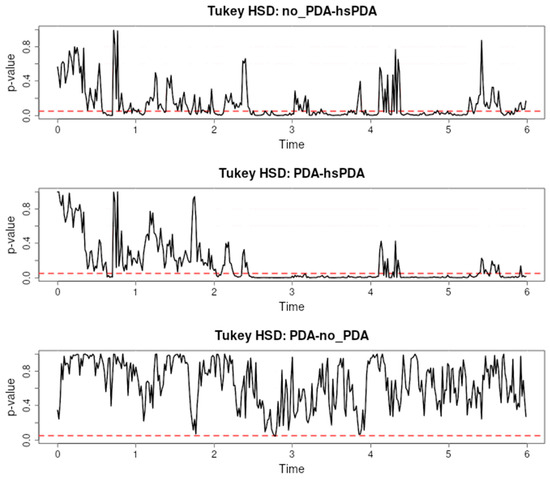
Figure 3.
Pairwise comparisons of cerebral rSO2 differences between PDA groups using Tukey HSD post hoc analysis. Statistical significance level (p-value = 0.05) is marked with red dashed line.
The first pair (no-PDA vs. hsPDA) shows long and consistent intervals of significance, especially from approximately the second to sixth hour, with additional short episodes of significance in the early period. This trend indicates that the hsPDA group had consistently lower cerebral rSO2 than the no-PDA group for most of the observation period. This difference can be explained by the hemodynamic changes characteristic of hsPDA: a patent ductus arteriosus causes a left-to-right shunt, reduces systemic blood pressure, and restricts blood supply to the brain. Premature infants have limited autoregulatory mechanisms, so fluctuations in perfusion are directly reflected in rSO2. These findings are also supported by the literature, for example, [24,25], which emphasizes that hsPDA can significantly reduce cerebral oxygenation.
In the second pair (PDA vs. hsPDA), long intervals of significance are also recorded, most pronounced between the second and fourth hours. This indicates that even hemodynamically insignificant PDA maintains a cerebral oxygenation profile that differs from hsPDA, although the differences are not as long as in the first pair. The same pathophysiological mechanism applies here—hsPDA causes a larger blood shunt and reduces cerebral perfusion to a greater extent than insignificant PDA, therefore the differences are consistent. Similar observations are presented in [26,27], where the effect of hsPDA on blood flow is described as more pronounced and longer lasting.
In the third pair (PDA vs. no-PDA), there are practically no significant differences—p-values range above 0.05 over the entire six-hour interval. This suggests that cerebral rSO2 is similar in these two groups. This similarity could be explained by the fact that insignificant PDA does not have a sufficient shunt to cause a significant decrease in cerebral perfusion, or that effective autoregulatory mechanisms compensate for the small changes in perfusion.
These results show a clear relationship between the hemodynamic significance of PDA and the differences in cerebral oxygenation: the larger the shunt and the effect on systemic perfusion, the longer and more pronounced the significance intervals. Pointwise post hoc analysis allows us to precisely identify these critical periods, providing clinicians with valuable information about the time when the effect of hsPDA is greatest and when interventions may be most effective.
Figure 4 and Table 3 presents the results of a pointwise ANOVA comparing arterial blood oxygen saturation (SpO2) values in three groups of preterm infants: hsPDA, PDA and no-PDA, during the first six hours after the start of observation. The horizontal axis represents time in hours, the vertical axis represents p-values, and the red dotted line represents the significance level of p = 0.05. It can be seen that the p-values fluctuate above the significance threshold for almost the entire observation period, and significant differences between groups are very few and occur only at isolated moments.
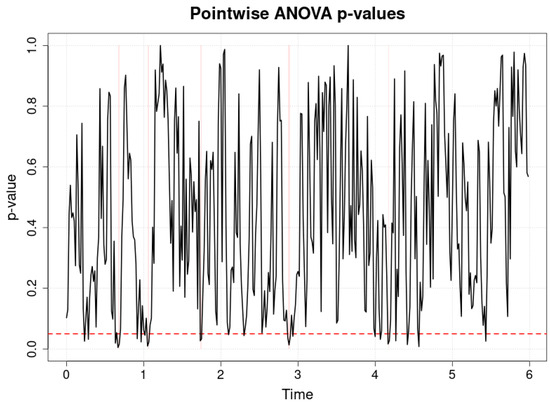
Figure 4.
Differences in systemic SpO2 between neonatal groups over time were determined using pointwise ANOVA. Statistical significance level (p-value = 0.05) is marked with red dashed line.
Interpretation of these results suggests that the SpO2 signal is not sensitive to detect differences between groups, especially when compared with cerebral oxygenation (rSO2) indicators. The reason lies in physiological and methodological aspects. SpO2 measures systemic arterial blood oxygen saturation, which reflects the oxygen supply status of the whole organism, but not the perfusion characteristics of specific organs or tissues. Therefore, even with significant differences in perfusion between groups (especially in the case of hsPDA), systemic SpO2 may remain similar because the body, including during intensive care interventions, compensates for the lack of perfusion by increasing oxygen delivery or making adjustments to respiratory parameters.
Mechanistically, as indicated in [28,29,30], cerebral oxygenation (rSO2) is more sensitive to hemodynamic changes due to limited autoregulation in the preterm newborn brain and a direct dependence on regional perfusion. SpO2, in contrast, can be maintained within normal limits despite local perfusion fluctuations, especially when supplemental oxygen and ventilatory support are used. For this reason, pointwise ANOVA detects fewer significant differences in the SpO2 signal and these differences are not consistent over time.
This trend also has a clinical context: SpO2 monitoring alone is not sufficient to identify hsPDA-induced perfusion changes in the brain or other organs. This is supported by the data presented at [7], where rSO2 analysis revealed differences between hsPDA and other groups, while SpO2 values remained similar. This difference highlights the value of NIRS technology as an additional monitoring tool. Figure 3 shows that the SpO2 signal is limited in assessing hemodynamic differences between hsPDA, PDA, and no-PDA groups. Although it remains important for overall monitoring of oxygenation status, pointwise analysis clearly shows that the sensitivity of this parameter to regional perfusion changes is low. In clinical practice, this means that in order to timely detect and manage the effects of hsPDA on organ oxygenation, it is necessary to use additional methods, such as NIRS, which provide regional perfusion information and allow for more targeted interventions.
Figure 5 shows the results of the Tukey HSD post hoc test comparing regional oxygenation rSO2 values between three groups of preterm infants: no-PDA and hsPDA, PDA and hsPDA, and PDA and no-PDA during the first six hours.
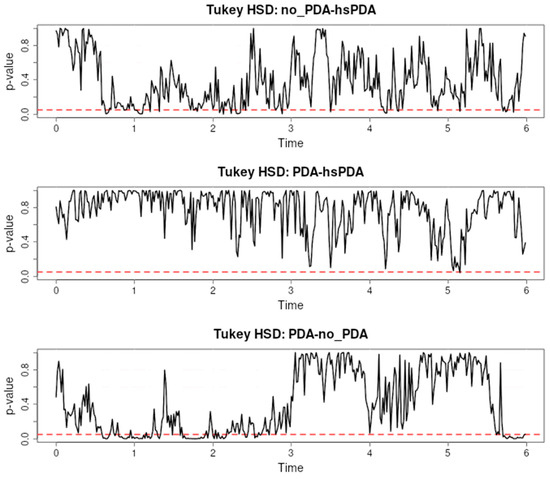
Figure 5.
Differences in systemic SpO2 between neonatal groups over time were determined using Tukey HSD post hoc analysis. Statistical significance level (p-value = 0.05) is marked with red dashed line.
The pairwise comparison of no-PDA and hsPDA shows several longer intervals with significant differences, especially from approximately 1 to 2.5 h and again after 3.5 h, with isolated episodes of significance at other time points. This suggests that patients in the hsPDA group had consistently lower rSO2 than the no-PDA group at certain time points, which is consistent with the physiological logic that in the presence of hsPDA, the left-to-right shunt reduces systemic perfusion pressure and may limit cerebral blood flow. As indicated in the literature [6], in premature newborns, autoregulatory mechanisms are limited, so perfusion fluctuations are more quickly reflected in rSO2 indicators.
In the comparison of the PDA and hsPDA pair, significant differences are detected only at very short intervals in the early observation period and in individual places later. This indicates that although the ductus in both groups is patent, in the case of hsPDA the larger shunt size and hemodynamic effect lead to a slightly lower rSO2, but the difference is not long-lasting during the entire observation period. This is consistent with the mechanistic concept that changes in regional perfusion are most pronounced in the presence of a pronounced shunt, but can be compensated by other factors.
In the comparison of the PDA and no-PDA pair, significant differences are more than in the previous pair, especially between 0.5 and 2 h. period, after which the differences disappear. This may be related to the initial hemodynamic adaptation after birth, when even a minor PDA can briefly affect cerebral perfusion, but later the effect decreases due to compensatory mechanisms.
The cause–effect relationship in Figure 5 is clear: cause—the presence of the PDA and its hemodynamic significance; mechanism—the size and direction of the shunt determine the differences in regional perfusion and oxygenation; consequence—the hsPDA group has a more frequent and longer-lasting decrease in rSO2 compared to the no-PDA group, while the PDA group occupies an intermediate position, with significant differences only in the early period. This analysis confirms that the Tukey HSD post hoc method allows for precise localization of time intervals in which group differences are statistically significant, which is important for clinical optimization of the timing of interventions.
Figure 6 and Table 3 shows the mean regional cerebral oxygenation (rSO2-1) values for the three groups of newborns—hsPDA, PDA and no-PDA—during the first six hours, as well as the overall mean for all groups. The horizontal axis represents time in hours, and the vertical axis represents the mean rSO2 value in percent. It is clearly seen that the hsPDA group (purple dashed line) has the lowest rSO2 level throughout the observation period, the PDA group (red dashed line) has the highest, and the no-PDA group (cyan dashed line) remains in an intermediate position. The overall mean for all subjects (black solid line) corresponds to the trajectory of the intermediate values. The cause–effect relationship here is clear and consistent with physiological mechanisms described in the literature (e.g., [31,32]). In the hsPDA condition, the greater left-to-right shunt through the patent ductus arteriosus leads to decreased systemic blood pressure and limits the flow of oxygen-rich blood to the brain. In preterm infants, the autoregulatory capacity of the brain is limited, and therefore the decrease in perfusion is directly reflected in rSO2 values. The consequence is consistently lower mean rSO2 values in the hsPDA group throughout the observation period.
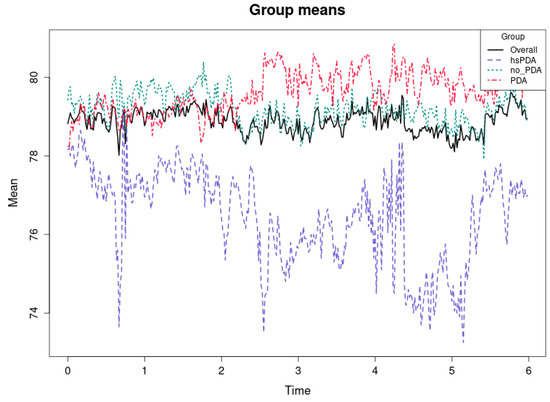
Figure 6.
Dynamics of mean values of cerebral rSO2 (rSO2-1) during the first 6 h between hsPDA, PDA and no-PDA groups.
The higher rSO2 values in the PDA group may seem unexpected, but this can be explained by several factors. First, a minor PDA may have a small or transient effect on perfusion, and in good overall hemodynamic status, cerebral oxygenation can be effectively maintained. Second, some of these infants may have received more intensive supportive therapy (e.g., optimized ventilation or fluid balance), which would increase rSO2 levels. This interpretation is consistent with the observations [33,34,35] that regional oxygenation can be maintained high if systemic perfusion is not significantly compromised.
The mean rSO2 values of the no-PDA group, which are between the other two groups, suggest that a completely closed ductus arteriosus does not always mean the highest oxygenation. This may be related to other factors, such as individual differences in cardiac function, blood pressure, or respiratory status.
From a clinical perspective, this trend emphasizes that hsPDA is associated with a persistent deficit in cerebral oxygenation, and the differences between the groups are clearly expressed throughout the observation period. This confirms the value of NIRS measurements for the early detection of hsPDA and the assessment of the need for potential interventions. Moreover, such averages, combined with pointwise analysis, allow us not only to identify statistical differences, but also to understand their clinical significance and impact on cerebral perfusion dynamics.
Figure 7 and Table 3 shows the mean rSO2-2 values over the first six hours in three groups of preterm infants—hsPDA, PDA, and no-PDA—and the overall mean for all groups.
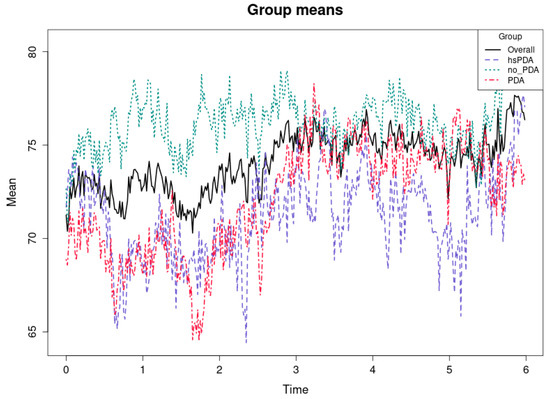
Figure 7.
Dynamics of mean renal rSO2 (rSO2-2) values during the first 6 h between hsPDA, PDA and no-PDA groups.
The cause–effect relationship here is very clear and consistent with the “ductal steal” mechanism described in the literature (e.g., [36,37]). In hsPDA, a large left-to-right shunt diverts blood flow from the systemic circulation to the lungs, thereby reducing perfusion to postductal organs, including the kidneys. Because renal perfusion is not protected by autoregulatory mechanisms as effectively as the brain [38,39], the changes in rSO2-2 in the hsPDA group are more pronounced and consistent. The result is a persistent oxygenation deficit in the hsPDA group.
The mean rSO2-2 values of the PDA group are only slightly higher than those of the hsPDA, and at some points practically coincide. This suggests that even hemodynamically insignificant PDA can have an effect on renal oxygenation, perhaps due to periodic changes in blood flow or other concomitant factors such as blood pressure or circulating blood volume. This observation is consistent with the fact that some studies (e.g., [40,41]) have documented that renal saturation may be more sensitive than cerebral saturation to even moderate hemodynamic changes.
The significantly higher rSO2-2 values of the no-PDA group indicate that the closed ductus arteriosus allows for the maintenance of a stable postductal blood supply to the kidneys. This reflects the physiological difference between the groups—with the ductus closed, there is no blood “leakage” into the pulmonary circulation, so perfusion to peripheral organs remains optimal.
From a clinical perspective, this study indicates that renal oxygenation tests may exhibit more sensitivity than cerebral measurements in evaluating the impact of hsPDA on systemic perfusion. The persistent disparities between hsPDA and other cohorts over time suggest that rSO2-2 serves as a valuable marker for identifying hemodynamically significant PDA and assessing treatment efficacy.
Figure 8 and Table 2 shows the average systemic oxygen saturation (SpO2) levels for the first six hours in three groups of preterm infants: hsPDA, PDA, and no-PDA. It also shows the average for all groups. The vertical axis shows the average SpO2 value in percent, while the horizontal axis shows time in hours. All three groups show high mean saturation values (92–94%), and the differences between the groups are minimal compared to the differences seen in the rSO2-1 or rSO2-2 plots. The cause-and-effect relationship here suggests that systemic SpO2, unlike regional oxygenation measures, is less sensitive to hemodynamic changes associated with PDA status. Even in the case of hsPDA, where left-to-right shunting results in reduced perfusion of postductal organs [42], systemic SpO2 can remain close to normal values due to compensatory mechanisms and intensive care support (e.g., optimized ventilation and oxygen therapy). As a result, the differences between groups are small and may be statistically insignificant most of the time. It can be seen that the mean SpO2 values of the no-PDA group are slightly higher than those of the hsPDA group, but this difference is small and may be of little clinical significance. The PDA group, as in other parameters, remains between hsPDA and no-PDA, but here the differences are even less pronounced. This is consistent with the mechanism that SpO2 reflects overall arterial saturation rather than regional perfusion variations. Consequently, systemic saturation measurements may not necessarily reflect even significant local perfusion abnormalities (e.g., in the kidneys or brain).

Figure 8.
Dynamics of mean systemic oxygen saturation (SpO2) values during the first 6 h between hsPDA, PDA and no-PDA groups.
This underscores the necessity of evaluating the impact of hsPDA on patients in addition to systemic SpO2. Although it is essential for the comprehensive monitoring of oxygenation status, the hemodynamic significance of PDA requires the use of supplementary regional oxygenation tests, such as NIRS, which enables the identification of minor changes in perfusion.
Figure 9 illustrates the unprocessed regional cerebral oxygenation (rSO2-1) data for each of the three groups: PDA, hsPDA, and no-PDA, over the initial six hours. The rSO2 values of the no-PDA group (right) are the highest and most stable, while the PDA group (left) has slightly lower values. The hsPDA group (middle) has the lowest mean value and a greater degree of signal fluctuation. This is evident when examining the data visually. The hemodynamic significance of the PDA and its impact on cerebral perfusion are the subjects of this cause-and-effect relationship. The systemic blood pressure and cerebral blood flow are substantially reduced in hsPDA due to the large left-to-right shunt. The decrease in perfusion is directly reflected in rSO2-1 values, and autoregulatory mechanisms in preterm neonates are limited [43,44]. The consequence is lower mean rSO2-1 values and greater variability in the hsPDA group.
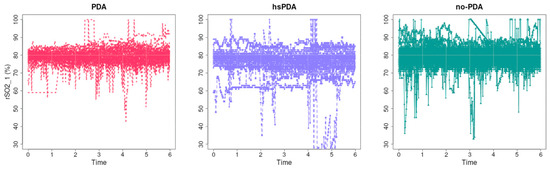
Figure 9.
Dynamics of untreated brain rSO2-1 values during the first 6 h in the hsPDA, PDA and no-PDA groups.
In the PDA group, values are slightly higher than in the hsPDA group, but lower than in the no-PDA group. This suggests that even hemodynamically insignificant PDA may have some effect on perfusion, perhaps due to periodic changes in blood flow or other systemic factors, although this effect is smaller than in the hsPDA group.
In the no-PDA group, rSO2-1 values remain high and relatively stable. This is consistent with physiological logic—when the ductus arteriosus is closed, there is no additional blood “leakage” to the lungs, therefore maintaining optimal perfusion pressure for the brain. This ensures better oxygen delivery and higher saturation values.
There is also a difference in signal variability: in the hsPDA group, big changes may be linked to hemodynamic instability, changes in breathing mode or oxygen delivery, and changes in perfusion during procedures. The lesser variations in the PDA and no-PDA groups may mean that the hemodynamics are more stable.
From a clinical point of view, such graphs clearly demonstrate the effect of hsPDA on cerebral oxygenation in real time and may be useful in assessing the effectiveness and need for therapy. Regular rSO2-1 measurements allow for the identification of critical periods when perfusion is insufficient and timely corrective measures to be taken.
Figure 10 presents the raw regional oxygenation rSO2-2 data (presumably renal or splanchnic oxygenation measurements) over the first six hours in three groups of neonates: PDA, hsPDA, and no-PDA.
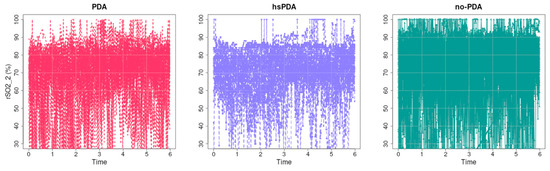
Figure 10.
Dynamics of raw rSO2-2 values during the first 6 h in the hsPDA, PDA and no-PDA groups.
Visually, it is clear that in the no-PDA group (right) the saturation values are highest and most concentrated at the upper end of the scale, indicating good and stable postductal perfusion. In the PDA group (left), the values are more widely distributed, with more cases in the lower part, indicating transient decreases in saturation. In the hsPDA group (middle), the mean rSO2-2 value is lowest, and the data scatter is greatest, with many values below 70%, and in some cases even close to 30%, indicating pronounced and frequent perfusion disorders.
The causal relationship here is consistent with the mechanism described in the literature (e.g., [6]). In hsPDA, the left-to-right shunt through the patent ductus arteriosus leads to a diversion of blood from the systemic circulation to the lungs, reducing the perfusion pressure of postductal organs such as the kidneys and intestines. Unlike the brain, these organs do not have such an efficient autoregulatory mechanism [45,46], and therefore the changes in rSO2-2 are more pronounced and the fluctuations are greater. The consequence is consistently lower and more unstable rSO2-2 values in the hsPDA group.
The profile of the PDA group data suggests that even a hemodynamically insignificant ductus can have an impact on postductal perfusion, possibly due to dynamic changes in blood flow or comorbid conditions. In contrast, the high and stable values in the no-PDA group confirm that postductal perfusion is optimal in the closed ductus condition. From a clinical perspective, this analysis demonstrates that renal/splanchnic oxygenation measurements are highly sensitive to the hemodynamic effects of hsPDA. Consistently lower and more fluctuating rSO2-2 data may be considered a marker to help identify neonates with significant PDA effects on systemic circulation and who may be candidates for early intervention.
Figure 11 presents the course of raw systemic oxygen saturation (SpO2) data over the first six hours in three groups of preterm infants—PDA, hsPDA, and no-PDA. Visually, it can be seen that in all groups, the majority of SpO2 values are high—usually above 90%—with significant transient saturation drops occurring sporadically.

Figure 11.
Dynamics of raw SpO2 values during the first 6 h in the hsPDA, PDA and no-PDA groups.
The causal relationship in this analysis suggests that systemic SpO2 is less sensitive to the hemodynamic effects of PDA status than regional oxygenation measures (e.g., rSO2-1 or rSO2-2). Even in the case of hsPDA, where left-to-right shunting through the ductus arteriosus may reduce postductal perfusion [47,48], systemic arterial saturation often remains close to normal due to compensatory mechanisms and intensive care support measures. This may include optimized ventilation, oxygenation, and hemodynamic support that maintain arterial blood saturation even in the presence of regional perfusion deficit.
Although it can be visually observed that the hsPDA group has slightly more transient SpO2 drops than the no-PDA or PDA groups, these drops are isolated and do not have a consistent temporal structure. The curves of the PDA and no-PDA groups show very similar saturation levels, with larger differences between the groups being observed only at the moments of individual drops. This is consistent with the mechanistic notion that SpO2 measurement reflects overall arterial saturation rather than local circulatory disturbances, and therefore significant regional perfusion reductions are not necessarily reflected in this parameter. From a clinical perspective, these data emphasize that SpO2 monitoring alone is not sufficient to assess the effects of hsPDA on the circulatory system. Although SpO2 is an essential indicator of overall oxygenation status, it does not replace regional oxygenation monitoring methods such as NIRS, which can reveal subtle changes in perfusion and their dynamics. The literature [49,50] suggests that NIRS measures may indicate perfusion disturbances before they are reflected in systemic changes.
4. Discussion
The results of this study revealed significant differences between groups of newborns with PDA of different hemodynamic significance when examining the structure of SpO2 and rSO2 signals. In the discussion, these findings are interpreted taking into account the physiological mechanisms of perfusion, their clinical significance, and the added value provided by signal analysis methods.
Figure 12 shows the SpO2 signal covariance heatmaps in three different clinical contexts—PDA, hsPDA and no-PDA groups. Visual analysis allows us to assess the homogeneity of the signals and the similarity between patients, and the main indicator is the sharpness of the diagonal. The more uniform and contrasting the diagonal, the more stable the signal structure between patients and the minimal differences. On the contrary, a weakened or fragmented diagonal reflects a greater variation between signals and lower physiological stability.

Figure 12.
Visualization of interpatient variation of SpO2 signals using covariance heatmap analysis.
The hsPDA group heatmap (middle graph) is the most clearly distinguished. Here, one extremely intense cluster is visible in the upper part of the time axis, but the diagonal itself remains quite weak and not uniform. This image shows that the signals in the group are not homogeneous—several patients have very pronounced and distinctive SpO2 variation patterns that stand out strongly from the others. This happens because of the way hsPDA makes the blood flow unstable: when there is a big left-to-right shunt flow, perfusion becomes unstable, and the body’s defenses can only partly keep oxygen saturation stable. This makes the signal structure more scattered, which can be seen directly in the picture. In clinical practice, this means that a uniform saturation dynamics model cannot be expected in the hsPDA patient group—the signal of each patient may reflect a different extent of perfusion impairment.
The heatmap of the PDA group (left graph) shows a slightly different picture. Here the diagonal is more visible than in the hsPDA case, but it is interrupted by several clear intense nodes. This structure signals that there is a certain generally maintained homogeneity in the group, but episodic differences between patients become apparent at separate time intervals. In clinical terms, this may mean that hemodynamically insignificant PDA does not cause a permanent perfusion deficit, but short-term perfusion fluctuations are still reflected in oxygen saturation signals. These changes, although not as long-term or significant as in the case of hsPDA, can still affect organ oxygenation, especially if other risk factors are present (e.g., unstable blood flow or fluctuations in respiratory support).
The heatmap of the no-PDA group (right graph) is characterized by the most clearly expressed diagonal structure, which is uniform and quite contrasting. There are fewer contrasting areas around the diagonal, so it can be concluded that the signals of patients in this group are the most homogeneous. This is fully consistent with physiological logic—after the closure of the ductus arteriosus, systemic perfusion becomes more stable, blood flow between central and peripheral organs is distributed more evenly, and therefore oxygen saturation signals vary less between patients. This shows that the SpO2 dynamics in the no-PDA group reflect a physiologically “normal” and uniform hemodynamic pattern, without additional disturbances caused by the patent duct.
When comparing all three groups, a clear cause-and-effect chain emerges: the greater the hemodynamic significance of the PDA, the less homogeneous the SpO2 signals between patients. In the case of hsPDA, the diversity of signals is greatest, since perfusion disorders are most pronounced and depend most on the individual patient’s compensatory capabilities. In the PDA group, the differences are episodic, reflecting temporary perfusion modifications. In the no-PDA group, the signals are most stable, indicating optimal circulatory conditions.
This result has a clear clinical meaning. Although SpO2 measurement is traditionally considered a general indicator of body oxygenation, heatmap analysis reveals that significant differences can be observed in this parameter between different PDA conditions, especially when analyzing data at the group level. This confirms that even if the average SpO2 values often do not differ between groups, the structure of signal variation can be a diagnostic indicator. In practice, this could be used as an additional tool to identify groups of patients at higher hemodynamic risk or to monitor the effectiveness of therapy based on changes in signal homogeneity over time.
Figure 12 clearly shows that signal covariance analysis additionally strengthens the traditional statistical interpretation of the results. It allows to assess not only the mean differences between groups, but also the interpatient homogeneity, which is especially important in clinical situations where hemodynamic changes can be very individual. A strong diagonal in the no-PDA group becomes an indicator of stability, while a weak and fragmented diagonal in the case of hsPDA is a sign of risk and instability.
Figure 13 presents the SpO2 signal covariance heatmaps for three groups: PDA, hsPDA and no-PDA. Analysis of these graphs provides additional information about the interpatient homogeneity and variation in the signals. The essential element by which the signal structure is assessed is the expressiveness of the diagonal: the brighter and more uniform the diagonal, the more similar the signals and the more uniform the hemodynamic state of the group. If the diagonal is dimmer and there are many contrasts throughout the area, this indicates greater signal diversity and instability of the patient’s physiology. The hsPDA group heatmap (middle graph) shows a fragmented diagonal structure, which is obscured by numerous surrounding contrasting areas. Instead of a uniform linear similarity between patients, several isolated intensity foci at different time points are evident here. Such a distribution indicates that there is a large interpatient signal difference in the group—some patients can maintain a relatively stable SpO2 profile, while others experience pronounced fluctuations. The clinical interpretation is clear: the hsPDA condition is characterized by systemic perfusion instability, which results in a highly individualized response of the body to hemodynamic stress. This situation explains why even the same intervention can have very different effects in hsPDA patients: their oxygenation dynamics depend on the size of the shunt, blood pressure, and autoregulatory reserves.

Figure 13.
Heatmap analysis of SpO2 signal covariance in PDA, hsPDA and no-PDA groups: comparison of interpatient homogeneity.
The heatmap of the PDA group (left graph) depicts a more developed diagonal, which, although not uniform, is still much more clearly visible than in the hsPDA case. Although this diagonal is interrupted by several stronger nodes, the overall structure shows greater signal homogeneity between patients. In clinical terms, this suggests that hemodynamically insignificant PDA does not have a permanent impact on perfusion, but can cause temporary, episodic fluctuations. Such signal differences can occur with a short-term change in respiratory rate, position change, or short-term fluctuations in blood pressure. In other words, in the PDA group, hemodynamics remain relatively stable, and the similarity of signals is higher than in the hsPDA case.
The heatmap of the no-PDA group (right graph) is characterized by the most pronounced and continuous diagonal line. In addition, there are relatively few contrast regions around it, which indicates high signal homogeneity. This result is fully consistent with the physiological model: after the closure of the ductus arteriosus, systemic blood flow becomes balanced, blood distribution between organs is stable, and oxygenation signals between patients are very similar. This picture confirms that the no-PDA group reflects a physiologically optimal state in which interpatient variation is minimal.
Analysis of Figure 13 reveals a clear gradient: from the most homogeneous signals in the no-PDA group to the fragmented, unstable structure in the hsPDA group. The PDA group is located in an intermediate position, reflecting episodic, but not continuous, perfusion effects. In clinical practice, such results are of great importance, as they demonstrate that the analysis of the structure of signal variation can provide more information than the average values alone. Even if the overall SpO2 indicators differ little between groups, their covariance heatmaps reveal real differences in interpatient dynamics, which have diagnostic and prognostic value.
These visualizations can be used as an additional tool in clinical decision-making—in particular, in determining which patients experience the most perfusion instability. A bright diagonal becomes an indicator of physiological stability, and its fragmentation—a sign of possible hemodynamic disturbance.
Figure 14 presents heatmaps of SpO2 signal covariance in three groups—PDA, hsPDA and no-PDA. As in the previous graphs, the key indicator is the integrity of the diagonal and its contrast. A bright, clear diagonal indicates signal similarity between patients, while its fragmentation or background contrasts—greater interpatient difference and variation in physiological status. The heatmap of the hsPDA group (middle graph) reveals a dim diagonal, the integrity of which has practically disappeared, and the image is dominated by several isolated contrast clusters in the peripheral temporal zones. Such a structure indicates that the SpO2 signals of the patients are very heterogeneous. This is logically related to the pathophysiology of hsPDA—a large left-right shunt destabilizes systemic perfusion, so some patients can maintain quite high saturation due to intensive support, while others experience pronounced saturation fluctuations. This signal variation confirms that hsPDA is not a homogeneous clinical phenomenon, but rather a heterogeneous syndrome, the effect of which on oxygenation depends largely on the individual compensatory capabilities of the organism. In clinical practice, this means that even during the same treatment scenario, SpO2 dynamics in hsPDA patients can differ dramatically, therefore additional parameters (e.g., rSO2) are needed that would more accurately reflect regional perfusion disorders.
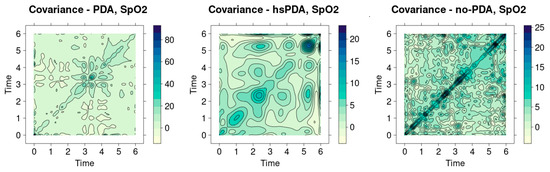
Figure 14.
Differences in the covariance structure of SpO2 signals between PDA, hsPDA and no-PDA groups.
The heatmap of the PDA group (left graph) shows an intermediate picture between hsPDA and no-PDA. The diagonal is visible here, but it is not solid, but interrupted by cross-nodes. This structure indicates that the signals of the patients are somewhat more homogeneous than in the case of hsPDA, but episodic differences remain. In a clinical sense, this can be associated with temporary perfusion variations that occur in the presence of a patent but hemodynamically insignificant duct. This indicates that although systemic oxygenation is not significantly impaired in this group, short-term saturation deviations can still be observed at certain points in time. This result confirms that PDA may have a subclinical impact on perfusion, which is not always reflected in the average indicators, but becomes apparent when analyzing the interpatient signal similarity.
The heatmap of the no-PDA group (right graph) is distinguished by a very bright, solid and contrasting diagonal line, which remains clear throughout the analysis interval. The contrasts around it are minimal, so it can be stated that the patient signals in this group are extremely homogeneous. This result is consistent with the physiological model: after the closure of the ductus arteriosus, systemic hemodynamics become stable, blood flow between organs is balanced, and SpO2 signals differ minimally between patients. This emphasizes that the no-PDA group reflects the physiological norm, in which the signal dynamics are almost identical in all patients.
This analysis confirms a clear gradation of the interpatient signal structure: in the no-PDA group, the signals are the most homogeneous, in the PDA group an intermediate level of homogeneity with episodic differences is visible, and in the hsPDA group the signal structure is fragmented and most heterogeneous. This pattern is clinically very significant. First, it shows that the analysis of SpO2 mean values alone is not sufficient—it is necessary to assess the interpatient homogeneity, which reveals the true hemodynamic stability within the group. Second, it can be an additional diagnostic criterion: the more fragmented the diagonal, the more likely hemodynamically significant PDA is. Third, these visualizations can be used to monitor the effectiveness of therapy—if the signal structure changes from fragmented to homogeneous after treatment, it can be assumed that perfusion is stabilizing.
Thus, Figure 14 reveals that signal covariance heatmap analysis is not only a statistical tool, but also a potentially valuable clinical tool that allows for the assessment of both group homogeneity and variation in perfusion dynamics between patients.
5. Conclusions
- Pointwise statistical analysis methods allow for time-specific differences between groups—pointwise ANOVA and Tukey HSD post hoc test provided the opportunity to accurately identify critical time intervals in which the differences in brain and kidney oxygenation between hsPDA, PDA and no-PDA groups were statistically significant, especially between 2 and 6 h of observation.
- hsPDA has the most pronounced negative effect on regional oxygenation—in the hsPDA group, lower brain (rSO2-1) and kidney (rSO2-2) oxygenation values were consistently recorded, which is consistent with the “ductal steal” mechanism-induced decrease in perfusion in central and peripheral organs.
- Kidney oxygenation (rSO2-2) may be a more sensitive indicator of hemodynamic changes than brain rSO2—larger and more constant rSO2-2 differences were recorded in the hsPDA and PDA groups, indicating that postductal organs are more responsive to perfusion changes due to weaker autoregulatory mechanisms.
- Systemic oxygenation (SpO2) is not a sufficiently sensitive indicator of the effect of hsPDA—although SpO2 remains essential for the overall assessment of the patient’s condition, its values usually did not differ between groups, as ventilation and oxygen therapy maintain normal arterial saturation despite regional perfusion disorders.
- The dynamics of the average values confirm the long-term effect of hsPDA—analysis of the average rSO2-1 and rSO2-2 values showed consistently lower oxygenation values in the hsPDA group throughout the 6 h observation period, while the PDA group occupied an intermediate position between hsPDA and no-PDA.
- Analysis of the raw signals reveals episodes of hemodynamic instability—a larger amplitude of rSO2 fluctuations was recorded in the hsPDA group, which may reflect episodic deterioration of perfusion associated with changes in respiratory rate, blood pressure or positioning.
- NIRS technology combined with FDA methods can improve clinical decision-making—the integrated application of statistical signal analysis allows for early identification of perfusion disorders, monitoring of therapy effectiveness, and individualizing the timing of interventions, especially in the management of hsPDA in newborns.
- Further validation of the study results should be done at a multi-center level. Prospective multi-center study would validate the initial critical NIRS monitoring curves using a larger number of subjects, which would allow for conclusions with greater statistical power.
- These findings have practical implications, as pointwise statistical approaches could be integrated into clinical monitoring systems to provide more detailed and time-specific information about organ perfusion. Similar findings could be used in newborn critical care units to independently identify cases when cerebral or renal oxygenation deviates dramatically from conventional patterns, allowing for faster therapeutic responses. The integration of continuous NIRS monitoring with pointwise analysis facilitates the creation of real-time decision-support tools that notify physicians of critical hemodynamic alterations resulting from PDA or other perfusion-related conditions. The methodologies examined may enhance the customization of therapeutic scheduling, specifically in determining optimal timings for PDA closure or blood transfusion, tailored to the unique oxygenation profiles of individual neonates. In conclusion, the integration of pointwise analytic methodologies into bedside monitoring software has the potential to enhance the consistency of clinical decision-making across multiple sites by defining explicit quantitative thresholds for assessing neonatal perfusion. To verify these findings and establish clinical cut-off values for the automatic identification of significant perfusion abnormalities, future multi-center investigations are essential.
Author Contributions
Conceptualization, T.Ž. and J.M.; methodology, T.Ž. and M.G.; software, M.G.; validation, T.Ž. and J.M.; formal analysis, M.G.; investigation, T.Ž.; resources, T.Ž.; data curation, T.Ž. and M.G.; writing—original draft preparation, J.M. and M.G.; writing—review and editing, T.Ž.; visualization, M.G.; supervision, T.Ž.; project administration, T.Ž.; funding acquisition, T.Ž. All authors have read and agreed to the published version of the manuscript.
Funding
This research received no external funding.
Institutional Review Board Statement
The study was conducted in accordance with the Declaration of Helsinki, and approved by the Vilnius Regional Biomedical Research Ethics Commit-tee (No. 158200-17-940-446, issued on 12 September 2017) and registered at https://clinicaltrials.gov/ (reg. No. NCT04295395), accessed on 27 October 2025.
Informed Consent Statement
Informed consent was obtained from all subjects involved in the study.
Data Availability Statement
Access to the data cannot be provided due to data protection regulations.
Acknowledgments
We would like to thank Jūratė Navikienė for NIRS data preparation.
Conflicts of Interest
The authors declare no conflicts of interest.
Abbreviations
The following abbreviations are used in this manuscript:
| ANOVA | Analysis of Variance |
| ECMO | Extracorporeal membrane oxygenation |
| ETEP | Extended-view totally extraperitoneal |
| FDA | Functional Data Analysis |
| fNIRS | Functional Near-Infrared Spectroscopy |
| fPCA | Functional principal component analysis |
| FPCA-BTW | Functional principal component analysis-block thresholding of wavelet |
| FTOE | Fractional oxygen extraction |
| GCV | Generalized Cross-Validation |
| hsPDA | Newborns group containing newborns with haemodynamically significant PDA |
| NICU | Neonatal intensive care unit |
| NIRS | Near-Infrared Spectroscopy |
| PDA | Patent Ductus Arteriosus |
| PRBC | Packed red blood cell |
| rSO2 | Regional tissue oxygenation |
| rSO2-1 | Cerebral oxygenation |
| rSO2-2 | Renal oxygenation |
| SIMCA | Soft Independent Modelling of Class Analogy |
| SpO2 | Blood oxygenation |
| Tukey HSD | Tukey’s honestly significant difference |
| VLBW | Very low birth weight |
References
- Hermane, A.T.; Pierre-Yves, S.; Pierre, L.; Philippe, H.; Eric, Z. A Probabilistic Class-Modelling Method Based on Prediction Bands for Functional Spectral Data: Methodological Approach and Application to near-Infrared Spectroscopy. Anal. Chim. Acta 2021, 1144, 130–149. [Google Scholar] [CrossRef] [PubMed]
- Cornelissen, R.J.; Le Roux, N.J.; Gardner-Lubbe, S.; Aleixandre Tudo, J.L.; Nieuwoudt, H.H. Detection and Quantification of Grapevine Bunch Rot Using Functional Data Analysis and Canonical Variate Analysis Biplots of Infrared Spectral Data. SAJEV 2023, 44, 144–155. [Google Scholar] [CrossRef]
- Ferraccioli, F.; Casa, A.; Stefanucci, M. An Adaptive Functional Regression Framework for Locally Heterogeneous Signals in Spectroscopy. J. R. Stat. Soc. Ser. C Appl. Stat. 2024, 73, 1370–1388. [Google Scholar] [CrossRef]
- Khan, M.U.; Aziz, S.; Murtagh, L.; Chetty, G.; Goecke, R.; Fernandez Rojas, R. Empirically Transformed Energy Patterns: A Novel Approach for Capturing fNIRS Signal Dynamics in Pain Assessment. Comput. Biol. Med. 2025, 192, 110300. [Google Scholar] [CrossRef] [PubMed]
- Noroozi-Clever, M.B.; Liao, S.M.; Whitehead, H.V.; Vesoulis, Z.A. Preterm Infants off Positive Pressure Respiratory Support Have a Higher Incidence of Occult Cerebral Hypoxia. J. Pediatr. 2023, 262, 113648. [Google Scholar] [CrossRef] [PubMed]
- Navikiene, J.; Virsilas, E.; Vankeviciene, R.; Liubsys, A.; Jankauskiene, A. Brain and Renal Oxygenation Measured by NIRS Related to Patent Ductus Arteriosus in Preterm Infants: A Prospective Observational Study. BMC Pediatr. 2021, 21, 559. [Google Scholar] [CrossRef]
- Smith, A.; Armstrong, S.; Dempsey, E.; EL-Khuffash, A. The Impact of a PDA on Tissue Oxygenation and Haemodynamics Following a Blood Transfusion in Preterm Infants. Pediatr. Res. 2023, 93, 1314–1320. [Google Scholar] [CrossRef]
- Arman, D.; Sancak, S.; Gürsoy, T.; Topcuoğlu, S.; Karatekin, G.; Ovalı, F. The Association between NIRS and Doppler Ultrasonography in Preterm Infants with Patent Ductus Arteriosus. J. Matern.-Fetal Neonatal Med. 2020, 33, 1245–1252. [Google Scholar] [CrossRef]
- Howarth, C.N.; Leung, T.S.; Banerjee, J.; Eaton, S.; Morris, J.K.; Aladangady, N. Regional Cerebral and Splanchnic Tissue Oxygen Saturation in Preterm Infants–Longitudinal Normative Measurements. Early Hum. Dev. 2022, 165, 105540. [Google Scholar] [CrossRef]
- Kakajiwala, A.; Kamath, N.; Nesargi, S.; Goto, L.; Hoffman, S.B.; Liberio, B.M.; Rumpel, J.A.; Khattab, M.; Nada, A.; Stoops, C.; et al. The Use of Near-Infrared Spectroscopy to Measure Kidney Oxygenation in the Neonatal Intensive Care Unit. Pediatr. Nephrol. 2025, 40, 3623–3635. [Google Scholar] [CrossRef]
- Lee, S.H.; Yoon, S.J.; Lim, J.H.; Han, J.H.; Shin, J.E.; Lee, S.M.; Eun, H.S.; Park, M.S. Clinical Usefulness of Regional Tissue Oxygen Saturation Monitoring Using Near-Infrared Spectroscopy in Neonates. Perinatology 2022, 33, 21. [Google Scholar] [CrossRef]
- Van Heijst, A.; Liem, D.; Hopman, J.; Van Der Staak, F.; Sengers, R. Oxygenation and Hemodynamics in Left and Right Cerebral Hemispheres during Induction of Veno-Arterial Extracorporeal Membrane Oxygenation. J. Pediatr. 2004, 144, 223–228. [Google Scholar] [CrossRef] [PubMed]
- Salem, A.; Lukemire, J.; Ou, J.; Shenvi, N.; Barbian, M.; Saakadze, N.; Hendrickson, J.; Easley, K.; Guo, Y.; Arthur, C.; et al. 508 Impacts of Red Blood Cell Transfusion and Enteral Feeding on Mesenteric Regional Tissue Oxygenation Dynamics in Very Preterm Infants. Am. J. Med. Sci. 2025, 369, S331–S332. [Google Scholar] [CrossRef]
- Als, H. Individualized Developmental Care for the Very Low-Birth-Weight Preterm Infant: Medical and Neurofunctional Effects. JAMA 1994, 272, 853. [Google Scholar] [CrossRef]
- Zeileis, A.; Grothendieck, G. Zoo: S3 Infrastructure for Regular and Irregular Time Series. J. Stat. Soft. 2005, 14, 1–27. [Google Scholar] [CrossRef]
- Ramsay, J.; Silverman, B.W. Functional Data Analysis; Springer Science & Business Media: New York, NY, USA, 2005; ISBN 978-0-387-40080-8. [Google Scholar]
- Ullah, S.; Finch, C.F. Applications of Functional Data Analysis: A Systematic Review. BMC Med. Res. Methodol. 2013, 13, 43. [Google Scholar] [CrossRef] [PubMed]
- Febrero-Bande, M.; Fuente, M.O.D.L. Statistical Computing in Functional Data Analysis: The R Package Fda. Usc. J. Stat. Soft. 2012, 51, 1–28. [Google Scholar] [CrossRef]
- Zhang, J.-T. Analysis of Variance for Functional Data; CRC Press: Boca Raton, FL, USA, 2013; ISBN 978-1-4398-6274-2. [Google Scholar]
- Majerek, D.; Rymarczyk, T.; Wójcik, D.; Kozłowski, E.; Rzemieniak, M.; Gudowski, J.; Gauda, K. Machine Learning and Deterministic Approach to the Reflective Ultrasound Tomography. Energies 2021, 14, 7549. [Google Scholar] [CrossRef]
- Ramos-Carreño, C.; Torrecilla, J.L.; Carbajo-Berrocal, M.; Marcos, P.; Suárez, A. Scikit-Fda: A Python Package for Functional Data Analysis. J. Stat. Soft. 2024, 109, 1–37. [Google Scholar] [CrossRef]
- van der Heide, M.; Muller Kobold, A.C.; Koerts-Steijn, K.K.R.; Hulzebos, C.V.; Hulscher, J.B.F.; Eaton, S.; Orford, M.; Bos, A.F.; Koerts, J.; Kooi, E.M.W. Ischemia Modified Albumin as a Marker of Hypoxia in Preterm Infants in the First Week after Birth. Early Hum. Dev. 2024, 189, 105927. [Google Scholar] [CrossRef]
- Chock, V.Y.; Vesoulis, Z.A.; El-Dib, M.; Austin, T.; van Bel, F. The Future of Neonatal Cerebral Oxygenation Monitoring: Directions After the SafeBoosC-III Trial. J. Pediatr. 2024, 270, 114016. [Google Scholar] [CrossRef]
- Alderliesten, T.; van Bel, F.; van der Aa, N.E.; Steendijk, P.; van Haastert, I.C.; de Vries, L.S.; Groenendaal, F.; Lemmers, P. Low Cerebral Oxygenation in Preterm Infants Is Associated with Adverse Neurodevelopmental Outcome. J. Pediatr. 2019, 207, 109–116.e2. [Google Scholar] [CrossRef]
- Köstekci, Y.E.; Erdeve, Ö. Patent Ductus Arteriosus (PDA): Recent Recommendations for to Close or Not to Close. Glob. Pediatr. 2024, 7, 100128. [Google Scholar] [CrossRef]
- Shimada, S.; Kasai, T.; Konishi, M.; Fujiwara, T. Effects of Patent Ductus Arteriosus on Left Ventricular Output and Organ Blood Flows in Preterm Infants with Respiratory Distress Syndrome Treated with Surfactant. J. Pediatr. 1994, 125, 270–277. [Google Scholar] [CrossRef]
- Nagafuji, M.; Fujiyama, S.; Doki, K.; Ishii, R.; Okada, Y.; Hanaki, M.; Nakamura, Y.; Takeuchi, S.; Hitaka, D.; Kanai, Y.; et al. Assessment of Blood Prostaglandin E2 Metabolite Levels among Infants Born Preterm with Patent Ductus Arteriosus: A Prospective Study. J. Pediatr. 2025, 276, 114285. [Google Scholar] [CrossRef]
- Schat, T.E.; van Zoonen, A.G.J.F.; van der Laan, M.E.; Mebius, M.J.; Bos, A.F.; Hulzebos, C.V.; Boezen, H.M.; Hulscher, J.B.F.; Kooi, E.M.W. Early Cerebral and Intestinal Oxygenation in the Risk Assessment of Necrotizing Enterocolitis in Preterm Infants. Early Hum. Dev. 2019, 131, 75–80. [Google Scholar] [CrossRef]
- Liem, K.D.; Greisen, G. Monitoring of Cerebral Haemodynamics in Newborn Infants. Early Hum. Dev. 2010, 86, 155–158. [Google Scholar] [CrossRef]
- Sakaguchi, K.; Saito, S.; Takada, M.; Takahashi, K.; Onodera, Y.; Kobayashi, T.; Kawamae, K.; Nakane, M. Correlation between Pulse-Wave Cerebral Tissue Oxygen Saturation and End-Tidal Carbon Dioxide during Cardiopulmonary Resuscitation. Am. J. Emerg. Med. 2025, 96, 134–139. [Google Scholar] [CrossRef]
- Noori, S.; Seri, I. 46–Cardiovascular Compromise in the Newborn Infant. In Avery’s Diseases of the Newborn, 11th ed.; Gleason, C.A., Sawyer, T., Eds.; Elsevier: Philadelphia, PA, USA, 2024; pp. 675–702.e10. ISBN 978-0-323-82823-9. [Google Scholar]
- Appavu, B.; Riviello, J.J. Multimodal Neuromonitoring in the Pediatric Intensive Care Unit. Semin. Pediatr. Neurol. 2024, 49, 101117. [Google Scholar] [CrossRef] [PubMed]
- Jani, P.; Balegarvirupakshappa, K.; Moore, J.E.; Badawi, N.; Tracy, M. Regional Oxygenation and Perfusion Monitoring to Optimize Neonatal Packed Red Blood Cell Transfusion Practices: A Systematic Review. Transfus. Med. Rev. 2022, 36, 27–47. [Google Scholar] [CrossRef] [PubMed]
- Moeslund, N.; Ertugrul, I.A.; Hu, M.A.; Dalsgaard, F.F.; Ilkjaer, L.B.; Ryhammer, P.; Pedersen, M.; Erasmus, M.E.; Eiskjaer, H. Ex-Situ Oxygenated Hypothermic Machine Perfusion in Donation after Circulatory Death Heart Transplantation Following Either Direct Procurement or in-Situ Normothermic Regional Perfusion. J. Heart Lung Transplant. 2023, 42, 730–740. [Google Scholar] [CrossRef]
- Xynogala, A.; Lunsford, K.; Koneru, A.; Gajbinkar, A.; Qin, Y.; Lindower, J.; Sellers, M.; Strom, C.; Paterno, F.; Lee-Riddle, G.; et al. Normothermic Regional Perfusion (NRP) Combined with Hypothermic Oxygenated Machine Perfusion (HMP-O2) Reduces Oxygen Deficit during Preservation in DCD Liver Allografts. Am. J. Transplant. 2025, 25, S94–S95. [Google Scholar] [CrossRef]
- Tang, G.; Wang, H.; Liu, L.; Ji, C.; Yi, J.; Zhang, L.; Liu, S. A Case Report on the Novel Application of CRRT in Renal Vein Shunting Surgery. Heliyon 2025, 11, e42645. [Google Scholar] [CrossRef]
- Lin, Y.-T.; Loh, C.Y.Y.; Chen, S.-H. The Effect on Venous Congestion of Diverting Arterial Flow in the Arterialized Venous Flap. J. Hand Surg. 2022, 47, 485.e1–485.e8. [Google Scholar] [CrossRef]
- Gomes, N.V.; Bolliger, D. Cerebral Autoregulation Monitoring: Time to Prioritize the Brain? J. Cardiothorac. Vasc. Anesth. 2025, 39, 1678–1680. [Google Scholar] [CrossRef]
- do Nascimento Silva, J.; Rodrigues, B.A.; Kawamoto, E.M. Neurogenesis Markers in Brain Aging and Their Serotonergic Modulation by Physical Exercise: A Narrative Review. NeuroMarkers 2025, 2, 100110. [Google Scholar] [CrossRef]
- Le Teurnier, Y.; Rozec, B.; Degryse, C.; Levy, F.; Miliani, Y.; Godet, G.; Daccache, G.; Truc, C.; Steinmetz, E.; Ouattara, A.; et al. Optimization of Cerebral Oxygenation Based on Regional Cerebral Oxygen Saturation Monitoring during Carotid Endarterectomy: A Phase III Multicenter, Double-Blind Randomized Controlled Trial. Anaesth. Crit. Care Pain Med. 2024, 43, 101388. [Google Scholar] [CrossRef] [PubMed]
- Rescoe, E.; Tang, X.; Perry, D.A.; Sleeper, L.A.; DiNardo, J.A.; Kussman, B.D.; Kheir, J.N. Cerebral Near-Infrared Spectroscopy Insensitively Detects Low Cerebral Venous Oxygen Saturations after Stage 1 Palliation. J. Thorac. Cardiovasc. Surg. 2017, 154, 1056–1062. [Google Scholar] [CrossRef] [PubMed]
- Lawrence, K.M.; Monos, S.; Adams, S.; Herkert, L.; Peranteau, W.H.; Munson, D.A.; Hopper, R.K.; Avitabile, C.M.; Rintoul, N.E.; Hedrick, H.L. Inhaled Nitric Oxide Is Associated with Improved Oxygenation in a Subpopulation of Infants with Congenital Diaphragmatic Hernia and Pulmonary Hypertension. J. Pediatr. 2020, 219, 167–172. [Google Scholar] [CrossRef]
- Sidorenko, I.; Kovtanyuk, A.; Feddahi, N.; Jahn, S.; Lück, E.; Brickmann, C.; Felderhoff-Müser, U.; Krüger, M.; Kerschbaum, H.; Lampe, R. Numerical Estimation of Optimal Limits of Cerebral Blood Flow and Oxygen Partial Pressure in Brain Tissue of Preterm Infants. Comput. Methods Programs Biomed. 2025, 270, 108984. [Google Scholar] [CrossRef]
- Prescott, S. Near Infrared Spectroscopy and Patent Ductus Arteriosus in the Preterm Neonate: A Systematic Review. J. Neonatal Nurs. 2017, 23, 9–27. [Google Scholar] [CrossRef]
- Izumikawa, K.; Shida, T.; Onodera, Y.; Tashima, Y.; Miyao, S.; Suda, T.; Suda, Y.; Kamimura, R.; Nagai, M.; Sugihara, M.; et al. Molecular Basis of the Autoregulatory Mechanism of Motor Neuron-Related Splicing Factor 30. J. Biol. Chem. 2025, 301, 110522. [Google Scholar] [CrossRef]
- Zhang, C.; Zhang, B.; Wen, T.; Fan, K. An Efficient Harvester with an Autoregulatory Driving Arm to Capture Random Wind Energy. Sens. Actuators A Phys. 2024, 368, 115125. [Google Scholar] [CrossRef]
- Lemmers, P.; Vijlbrief, D.; Benders, M.; Alderliesten, T.; Veldhuis, M.; Baerts, W.; Koopman-Esseboom, C.; Groenendaal, F.; van Bel, F. Delayed Surgical Closure of the Patent Ductus Arteriosus: Does the Brain Pay the Price? J. Pediatr. 2023, 254, 25–32. [Google Scholar] [CrossRef] [PubMed]
- Rios, D.R.; Martins, F.d.F.; El-Khuffash, A.; Weisz, D.E.; Giesinger, R.E.; McNamara, P.J. Early Role of the Atrial-Level Communication in Premature Infants with Patent Ductus Arteriosus. J. Am. Soc. Echocardiogr. 2021, 34, 423–432.e1. [Google Scholar] [CrossRef] [PubMed]
- Künzel, M.; Kohler, L.; Köhler, H.; Schulz, T.; Nuwayhid, R.; Osterhoff, G. Impact of Umbilical Fixation on Perfusion in Abdominoplasty: A Hyperspectral Imaging Study. JPRAS Open 2025, 45, 337–344. [Google Scholar] [CrossRef]
- Moynihan, A.; Boland, P.; Cucek, J.; Erzen, S.; Hardy, N.; McEntee, P.; Rojc, J.; Cahill, R. Technical and Functional Design Considerations for a Real-World Interpretable AI Solution for NIR Perfusion Analysis (Including Cancer). Eur. J. Surg. Oncol. 2024, 50, 108273. [Google Scholar] [CrossRef]


Disclaimer/Publisher’s Note: The statements, opinions and data contained in all publications are solely those of the individual author(s) and contributor(s) and not of MDPI and/or the editor(s). MDPI and/or the editor(s) disclaim responsibility for any injury to people or property resulting from any ideas, methods, instructions or products referred to in the content. |
© 2025 by the authors. Licensee MDPI, Basel, Switzerland. This article is an open access article distributed under the terms and conditions of the Creative Commons Attribution (CC BY) license (https://creativecommons.org/licenses/by/4.0/).