Article

Assessing the Relationship Between Cerebral Metabolic Rate of Oxygen and Redox Cytochrome C Oxidase During Cardiac Arrest and Cardiopulmonary Resuscitation

1
Department of Physics, Toronto Metropolitan University, 350 Victoria Street, Toronto, ON M5B 2K3, Canada
2
Institute for Biomedical Engineering, Science & Technology (iBEST), Li Ka Shing Knowledge Institute, St. Michael’s Hospital, Toronto, Canada
3
Schwartz Reisman Emergency Institute, Toronto, ON M5G 1X5, Canada
4
North York General Hospital, 4001 Leslie St., Toronto, ON M2K 1E1, Canada
5
Keenan Research Centre, Li Ka Shing Knowledge Institute, St. Michael’s Hospital, 30 Bond St., Toronto, ON M5B 1W8, Canada
*
Authors to whom correspondence should be addressed.
Appl. Sci. 2025, 15(3), 1542; https://doi.org/10.3390/app15031542
Submission received: 1 January 2025 / Revised: 25 January 2025 / Accepted: 29 January 2025 / Published: 3 February 2025
(This article belongs to the Special Issue Biomedical Optics and Imaging: Latest Advances and Prospects)

Abstract

:
Evaluating brain oxygen metabolism during cardiac arrest and cardiopulmonary resuscitation (CPR) is essential for improving neurological outcomes and guiding clinical interventions in high-stress medical emergencies. This study focused on two key indicators of brain oxygen metabolism: the cerebral metabolic rate of oxygen (CMRO2) and the oxidation state of redox cytochrome c oxidase (rCCO). Using advanced techniques such as hyperspectral near-infrared spectroscopy (hNIRS) and laser Doppler flowmetry (LDF), we conducted a comprehensive analysis of their relationship in pigs during and after cardiac arrest and CPR. Both the entire duration of these experiments and specific time intervals were investigated, providing a detailed view of how these metrics interact. The data reveal a non-linear relationship between rCCO and CMRO2. Our findings contribute to a deeper understanding of how the brain manages oxygen during critical episodes, potentially guiding future interventions in neurological care and improving outcomes in emergency medical settings.

1. Introduction

Out-of-hospital cardiac arrest is a significant medical emergency, affecting more than 350,000 individuals annually in the United States. Despite extensive advancements in emergency care, the survival rates for these events remain low: less than 23% of patients who experience out-of-hospital cardiac arrest survive long enough to be admitted to the hospital, and only about 10% ultimately survive to hospital discharge [1]. Among those who do survive, brain injury remains a leading cause of morbidity and mortality, with over two-thirds of survivors enduring irreversible neurological damage during their hospital stay. These dire outcomes highlight the urgent need for a deeper understanding of the physiological changes in the brain during and after cardiac arrest. Recent reviews of clinical trials registered on ClinicalTrials.gov highlight that most of the out-of-hospital cardiac arrest (OHCA) studies focus on interventional procedures, devices, and drugs, with a growing emphasis on neurological monitoring strategies [2].
The brain’s vulnerability to oxygen deprivation during cardiac arrest makes it particularly susceptible to ischemic injury [3]. Any disruption in oxygen delivery can lead to severe consequences, including secondary brain injury in conditions such as ischemia, severe traumatic brain injury, and sub-arachnoid hemorrhage [4]. Post-cardiac arrest brain injury is the leading cause of mortality in patients revived from cardiac arrest and the primary cause of long-term disability in survivors [5]. Cardiac arrest (CA) and cardiopulmonary resuscitation (CPR) introduce significant fluctuations in brain oxygen metabolism, posing a severe challenge to preserving cerebral function during these critical events.
Brain function relies heavily on the precise balance between its metabolic needs, the adequate delivery of oxygen and nutrients, and the efficient removal of cellular waste. Achieving this balance necessitates the constant regulation of the cerebral blood flow (CBF) [6]. The rapid and precise restoration of the CBF and oxygenation is crucial for preserving brain function, yet the complex interactions between cerebral perfusion, oxygen metabolism, and neuronal survival during these critical moments are not fully understood. Monitoring cerebral perfusion parameters—such as the cerebral tissue oxygen saturation, the cerebral blood volume, the CBF, the cerebral metabolic rate of oxygen (CMRO2), and redox cytochrome c oxidase (rCCO) activity—is essential for improving patient outcomes. These metrics offer vital insights into the brain’s oxygen metabolism, a process critical for maintaining cerebral health, especially under the stress conditions of cardiac arrest.
Understanding the relationship between the CMRO2, mitochondrial activity, and oxygen delivery is crucial for assessing cerebral health and function. Mitochondrial activity, particularly involving rCCO, plays a key role in oxygen consumption within the electron transport chain, with its oxidation state influenced by factors such as the oxygen availability and electron flow [4,7,8,9]. This understanding provides insight into neurovascular coupling and how these processes are altered in pathological conditions. It is a key step in neurocritical care, as it can guide interventions aimed at preserving brain function and reducing neurological damage.
Advancements in measurement techniques have enhanced our ability to quantify rCCO, with hyperspectral near-infrared spectroscopy (hNIRS) providing detailed in-sights into its activity. This advancement is critical for understanding how rCCO activity correlates with oxygen delivery and consumption. However, not everyone has access to these sorts of technologies. To overcome this issue, mathematical models play a huge role. Mathematical models have been employed to study the interactions among CBF, CMRO2, and rCCO, providing a framework to understand these relationships more comprehensively. These models help in analyzing how changes in one parameter can affect the others, offering deeper insights into neurovascular coupling and alterations in pathological conditions.
Previous studies have explored the coupling between oxygen consumption, mitochondrial function, and oxygen delivery in the brain. For instance, research utilizing a multimodal NIRS-MRI approach has quantified the interplay between CBF, CMRO2, and the redox state of rCCO in response to physiological challenges such as hypercapnia and varying oxygenation levels [10]. This research has revealed that the relationship between CBF and rCCO oxidation is dynamic and can vary depending on the type of physiological challenge, thereby providing valuable insights into the complex dynamics of neurovascular coupling under different conditions [10].
Some researchers employed advanced imaging techniques to probe these relationships with greater precision. For example, functional MRI (fMRI) studies in macaques measured the laminar ∆CMRO2 in the primary visual cortex during visual stimulation, showing that ∆CMRO2 peaked in the middle cortical layers, which corresponded with autoradiographic measures of metabolism [11]. This study also highlighted a strong relationship between the peak CMRO2 and the highest cytochrome oxidase intensity, further refining our understanding of oxygen metabolism in the brain.
In addition, research using an hNIRS-DCS (Diffuse Correlation Spectroscopy) setup has investigated the interdependence of CBF, CMRO2, and rCCO during minor perturbations such as hypoxia [12]. These studies have focused on the brain’s responses to less extreme conditions, offering a nuanced understanding of how these critical variables interact in relatively stable environments.
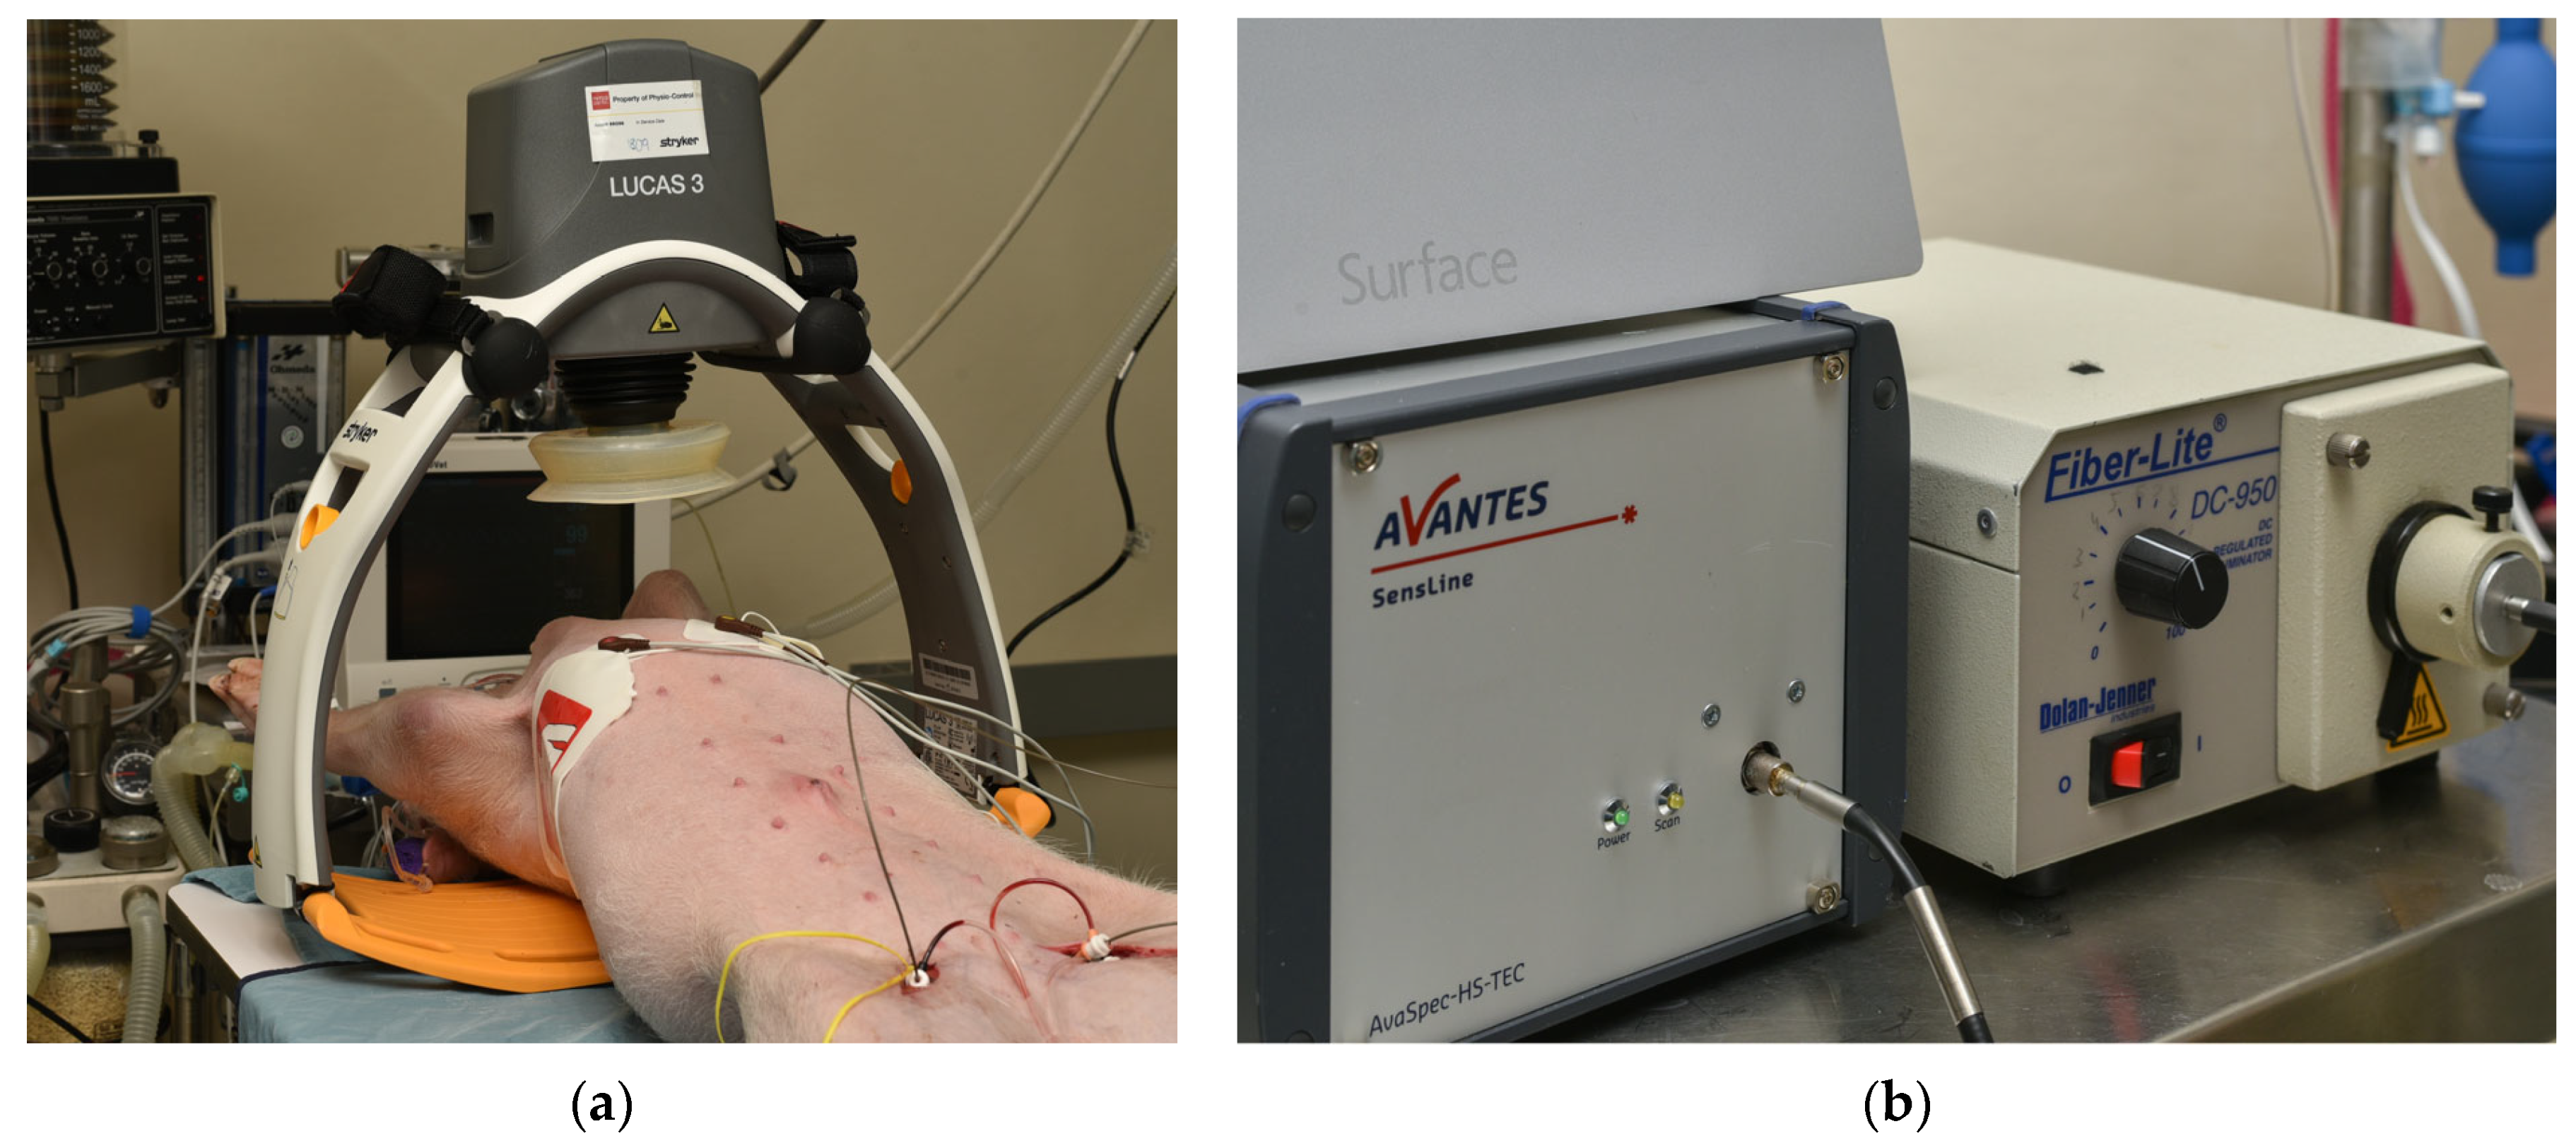
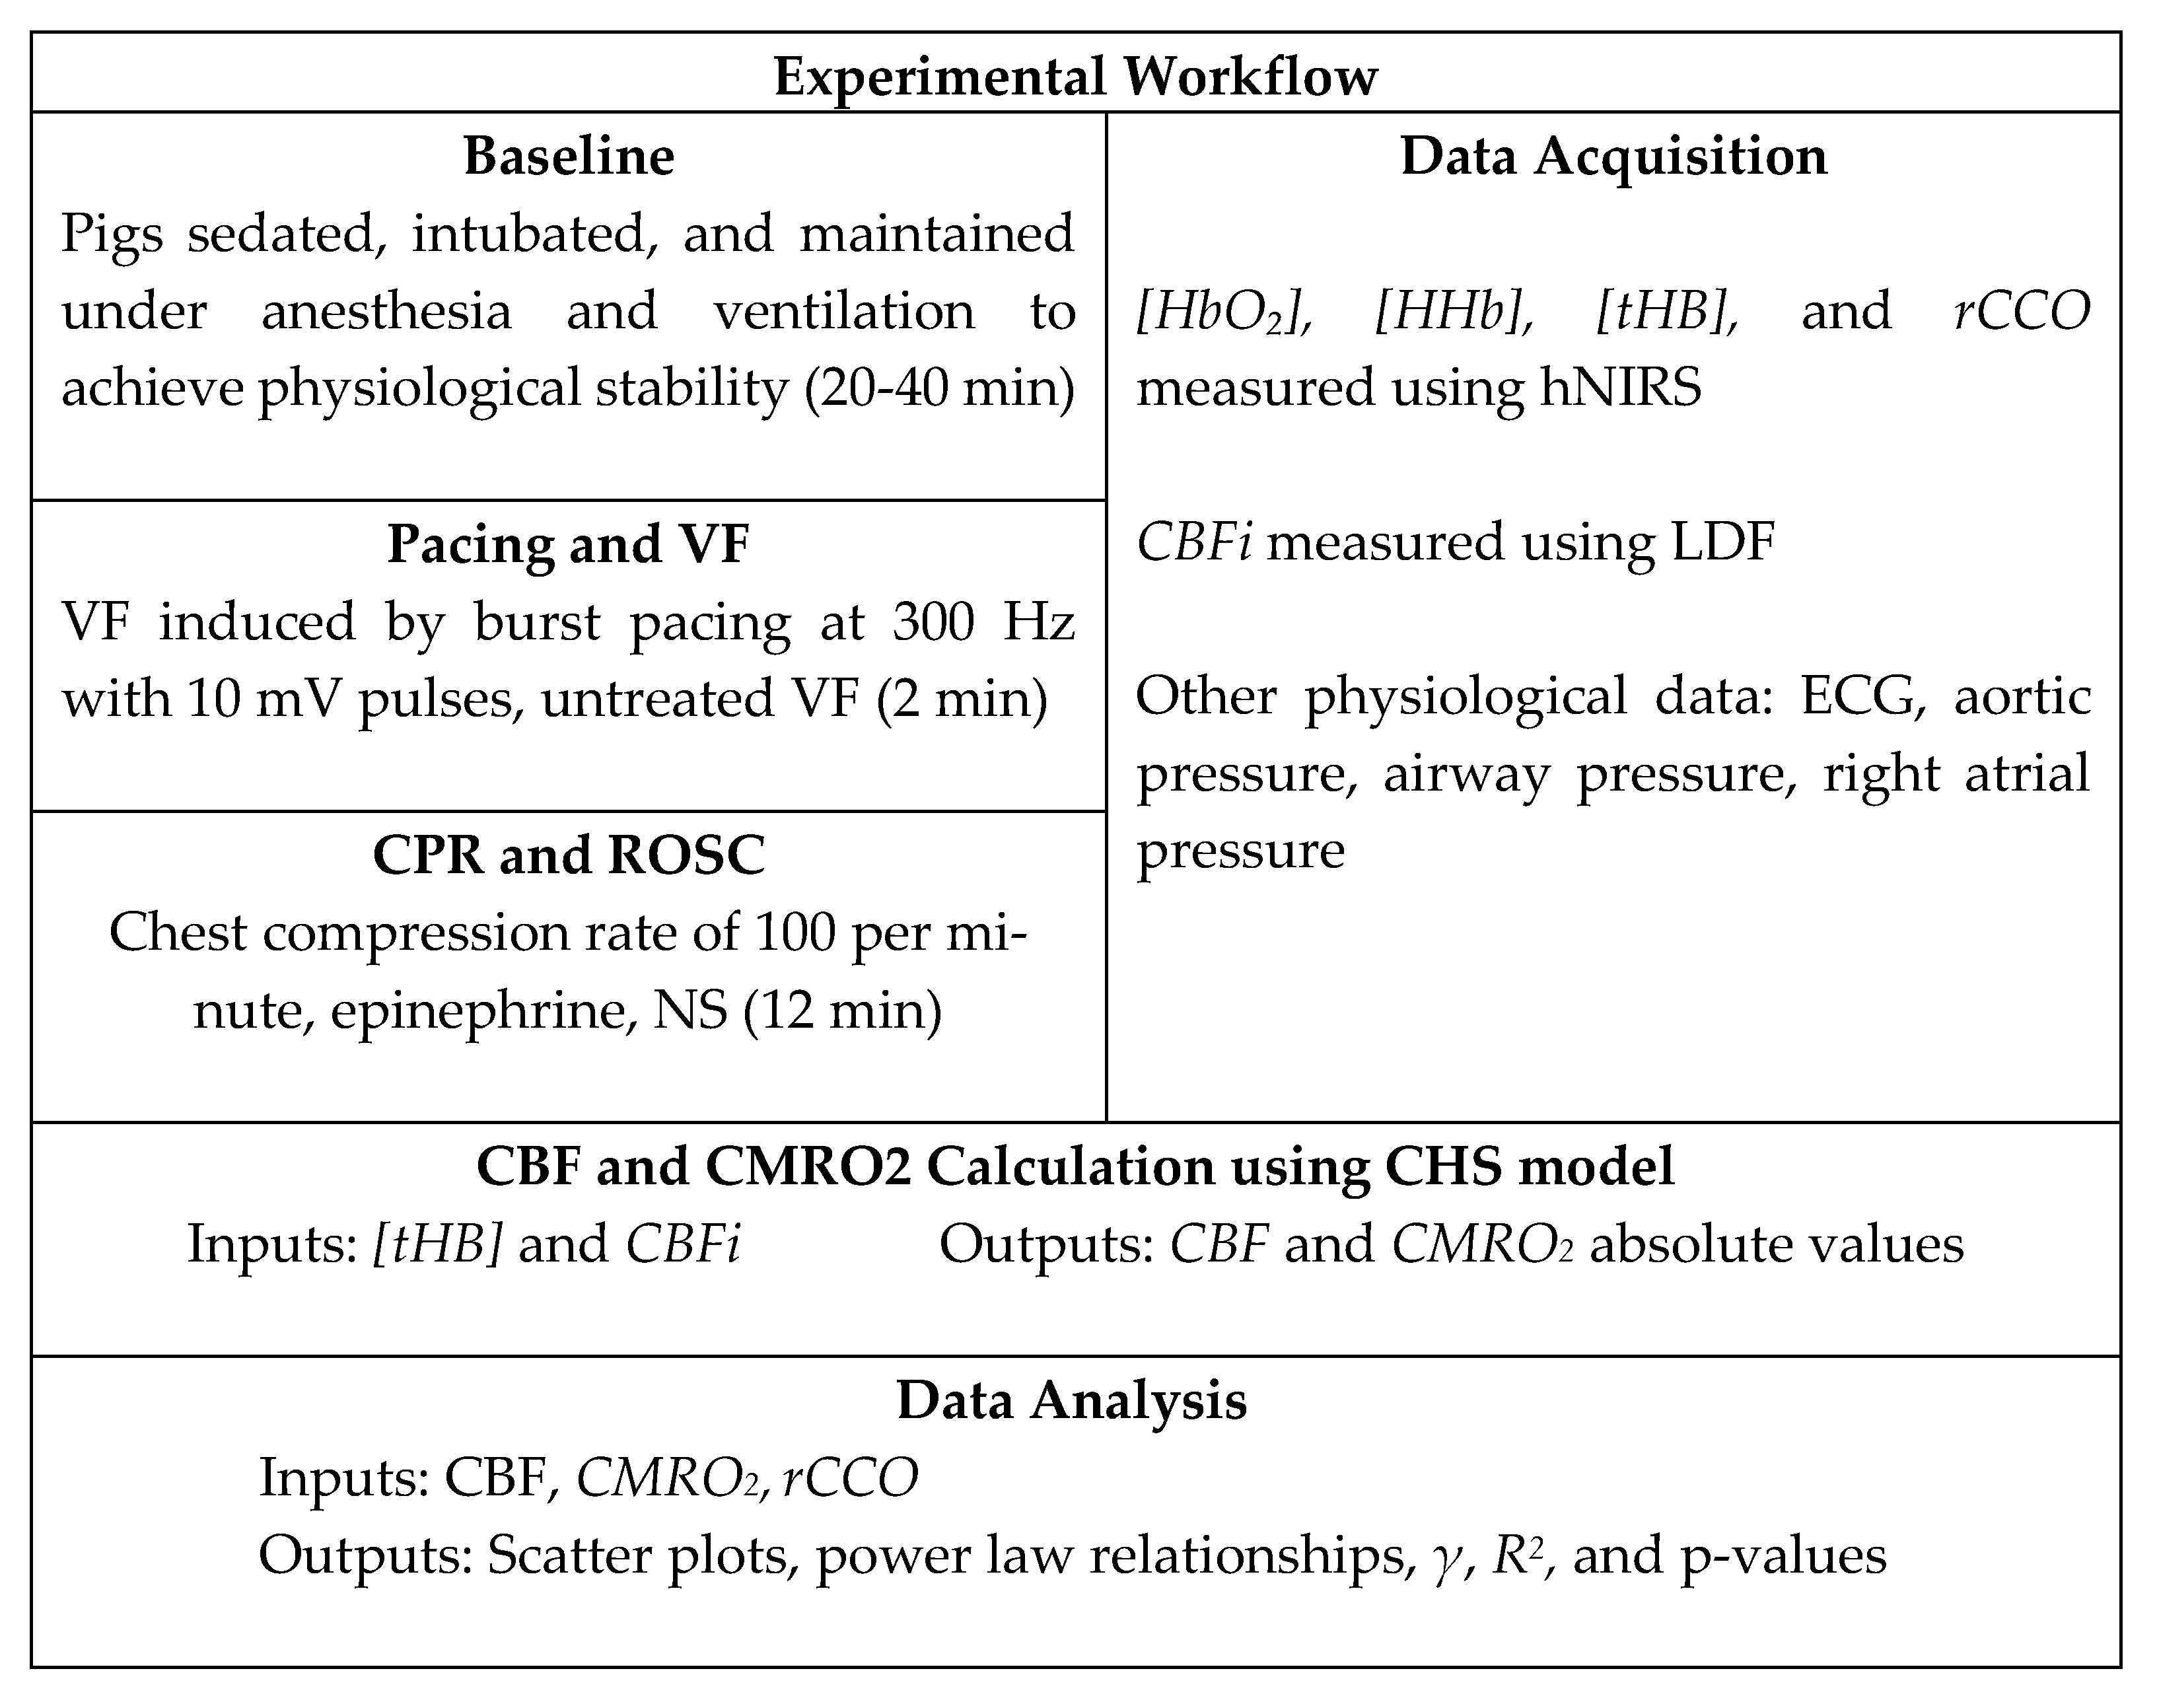
In the present study, we analyzed the data obtained invasively from a pig model of cardiac arrest to examine the intricate relationships between rCCO, CMRO2, and CBF during CA and CPR. We used laser Doppler flowmetry (LDF) to measure CBF and intracerebral hNIRS to assess changes in oxyhemoglobin ([HbO2]), deoxyhemoglobin ([HHb]), and rCCO. These measurements provided insights into variations in the cerebral blood volume (CBV), rCCO, and the CMRO2 throughout the critical phases of cardiac arrest and resuscitation. By investigating these relationships in a model that closely mimics the human condition, we aimed to deepen the understanding of the brain’s metabolic responses to such critical events. Ultimately, the findings of this research could contribute to the development of more effective strategies for managing brain injury in cardiac arrest patients, potentially improving survival rates and long-term neurological outcomes.

2. Materials and Methods

2.1. Cardiac Arrest and CPR Setup

Ten female pigs (6–9 weeks old, 33–39kg) were selected for this study to eliminate the influence of sex differences in susceptibility to ventricular fibrillation (VF) and because female pigs typically exhibit a higher rate of return of spontaneous circulation (ROSC). The animals were fasted overnight before being sedated with an intramuscular injection of ketamine (20 mg/kg; “Ketalean,” Bimeda-MTC Animal Health, Cambridge, ON, Canada). The level of anesthesia was continually assessed and the rate of the anesthetic agent adjusted to ensure no discomfort. After sedation, the pigs were intubated and maintained under anesthesia with continuous isoflurane (1–3% mixed with oxygen). Ventilation was supported using an Ohmeda ventilator (Ohio Medical Products, Madison, WI, USA) with the settings adjusted to stabilize physiological parameters such as the pH (7.35–7.45), PCO2 (35–45 mm Hg), and PO2 (>100 mm Hg). To prevent hypovolemia, normal saline (NS) was administered intravenously through a cannulated ear vein at a rate of 2–4 mL/kg/h. Electrocardiogram (ECG) leads were attached, and defibrillation patches (Zoll Medical, Inc., Chelmsford, MA, USA) were applied to monitor the cardiac activity. The aortic and right atrial pressures were continuously monitored via femoral artery catheters (Mikro-Tip Transducer; Millar Instruments, Houston, TX, USA), providing real-time data to detect the onset of cardiac arrest (VF) [13]. Figure 1 shows the experimental setup, including the positioning of the automatic compression device on the left and the hNIRS system on the right.
All pigs were euthanized with an anesthetic overdose with 5% isoflurane followed by T61 (0.3mL/kg) IV or by inducing VF at the end of the experiment. All experimental protocols adhered to the guidelines for reporting in vivo experiments [14]. Ethical approval was obtained from the Animal Care Committee of St. Michael’s Hospital (Toronto, ON, Canada), and all procedures were conducted in accordance with the Guide for the Care and Use of Laboratory Animals as outlined by the U.S. National Institutes of Health (NIH publication number 85–23, revised in 1996).

2.2. Resuscitation Protocol

Before inducing VF, the administration of anesthetic gasses was halted for 15 min, and the animals were sedated with propofol and fentanyl to minimize any anti-arrhythmic effects from the anesthetic gasses. VF was then induced by burst pacing at a frequency of at least 300 Hz with a 10 mV pulse, using a pacing catheter (AM-2200, AD Instruments, Castle Hill, Australia) inserted into the right ventricle. CPR was initiated after 2 min of VF, consisting of chest compressions at a rate of 100 per minute using an automatic piston device (LUCAS; Physio-Control Inc./Jolife AB, Lund, Sweden). Mechanical ventilation was maintained at a rate of 10 breaths per minute with pure oxygen using the Ohmeda ventilator. An intravenous bolus of 0.015 mg/kg of epinephrine in NS (0.1 mg/mL concentration) was administered after 2 min of CPR, followed by a 10 mL NS flush, with additional doses given every 4 min for a total of three doses. Additionally, a continuous infusion of NS equivalent to the volume of epinephrine started after 2 min of CPR and continued for a total duration of 12 min.

2.3. Cerebral hNIRS and LDF Setup and Measurements

We used a custom-built hyperspectral near-infrared spectroscopy (hNIRS) system [15,16] to invasively measure the absolute concentrations of [HbO2] and [HHb] and the differential signal between oxidized and reduced cytochrome c oxidase (ΔrCCO) in the brain tissue. The hNIRS optodes were placed on the dura mater at a 20 mm interoptode distance/through holes drilled in the skull. With a differential path length factor (DPF) of 5 and a 20 mm optode spacing, the average optical path length was calculated to be approximately 100 mm, with a penetration depth of about 16 mm [16,17,18], chosen to minimize interference from the dura mater, which is approximately 1 mm thick. The hNIRS system included a highly sensitive spectrometer (AvaSpec, Avantes, Lafayette, CO, USA) with a custom 0.5 mm slit that captured spectral data in the 700–1000 nm wavelength range (Figure 1). The hNIRS diffusion model was applied to analyze the data, allowing for the determination of changes in the cerebral [HbO2], [HHb], and ΔrCCO [13]. The dynamic changes in chromophore concentrations were extracted using a multi-step data-fitting algorithm based on an analytical solution to the diffusion equation for a semi-infinite medium, incorporating an extrapolated boundary condition. This algorithm provided the tissue concentrations of [HbO2], [HHb], and ΔrCCO. The total tissue hemoglobin concentration ([tHB]) in μM per liter and the tissue oxygen saturation (tSO2) were computed using the following equations:
[tHB] = [HbO2] + [HHb],
tSO2 = [HbO2]/([tHB]) × 100%.
The cerebral blood flow velocity index (CBFi) was measured using a laser Doppler flowmeter (LDF) (Periflux; Perimed Inc., Ardmore, PA, USA). The LDF probe was placed on the dura mater through a hole drilled in the pig’s skull. Throughout the experiments, the mean aortic pressure and right atrial pressure were continuously monitored using catheters equipped with micro-manometer tips.
The experimental workflow is summarized in Figure 2, outlining the sequential phases of animal preparation, experimental protocols, data acquisition, data interpretation, and analysis.

2.4. Analysis Methods

The data analysis was conducted using MATLAB R2023a (MathWorks, Natick, MA, USA). We analyzed data during periods of cardiac arrest or ventricular fibrillation (VF), CPR, and, in cases where it occurred, ROSC. Each of these phases was examined individually to assess physiological responses under different conditions. Outliers were systematically identified and excluded to ensure the accuracy and reliability of the results.
The analysis included the use of hNIRS diffusion modeling [15,16,17,18,19,20] to assess the cerebral oxygenation, deoxygenation, and rCCO levels.
The absolute values of CBF and CMRO2 were calculated using the non-linear version of the Coherent Hemodynamic Spectroscopy (CHS) model [21]. This approach integrates experimental data obtained from hNIRS and LDF, allowing for accurate assessment during significant physiological perturbations, such as cardiac arrest and CPR [22].
CBF was derived from the model’s fitted capillary blood flow factor (cBFf) and CBFi measured using LDF. The time-dependent velocity of the capillary blood flow c c ( t ) was calculated as
c c   t m m s = c B F f m m s .   C B F i t .
Using the capillary cross-sectional area (3.85×10⁻⁷ cm2), the brain tissue density (1.081 g/mL) and the total volume of capillaries in the brain tissue (2.7%), the absolute CBF per 100 g of brain tissue was computed as
C B F t m l   b l o o d 100   g   t i s s u e . m i n = 18.75   ( s . c m 2 100   g   t i s s u e . m i n ) × c c t m m s .
This value falls within accepted ranges reported in similar studies, supporting its validity. However, further validation is part of our ongoing work [23,24,25,26].
CMRO2 was calculated using the equation called “the Fick’s principle” [27]:
C M R O 2   t m l   O 2 100   g   t i s s u e   . m i n = k m l   O 2 g   H b ×   [ t H b ] ( g l ) × C B F t m l   b l o o d 100   g   t i s s u e   . m i n × S a t S v t ,
where S a t and S v t represent the time-dependent arterial and venous oxygen saturations, respectively, and k is a factor describing the amount of O2 bound to hemoglobin when completely saturated (1.39 mL of O2 per g of Hb). CMRO2 is expressed in units of mL O2/100 g/min.
The venous oxygen saturation was calculated using the CHS model [28]. To do so, the non-linear version of this model was used [21,22]. The results closely matched the equations suggested by the authors [27]:
S v ( t ) = 4 3 tSO 2 t     1 3 S a ( t ) ,
where tSO2 is the tissue oxygen saturation measured by hNIRS.
Possible non-linearities among the variables of interest, rCCO and CMRO2, rCCO and CBF, and CMRO2 and CBF, were investigated by fitting the relationships with the power law:
Y X = a + k X γ ,
where k is a scaling factor, γ > 0 is the power exponent, and X and Y are the change in either the CMRO2, CBF, or rCCO. In the cases of non-linear relationships, γ was significantly different from 1.

2.5. Statistical Analysis

We applied statistical techniques to ensure the robustness and reliability of the identification of relationships between the CBF and CMRO2, CBF and rCCO, and CMRO2 and rCCO. Correlation coefficients (R) and p-values were calculated using MATLAB’s fitnlm function, with statistical significance defined as p < 0.05. To evaluate the power law exponent (γ) for each relationship, we conducted a one-sample t-test to determine if the mean value of γ was statistically different from 1 or 0. This analysis tested whether the observed relationships deviated from linearity (γ = 1) or if the exponent indicated no significant relationship (γ = 0). This approach provided valuable insight into the nature of coupling between the variables. A similar method was applied to assess whether the intercept term (a) and the scaling factor (k) were significantly different from 0, further verifying the strength and validity of the fitted models.
To evaluate the adequacy of the sample size in detecting significant non-linear relationships, we conducted a one-sample t-test to determine whether the observed power law exponent (γ) values significantly deviated from 1, indicative of a linear relationship [29]. Using a sample size of 10 pigs, a significance level of α = 0.05, and the observed means and standard deviations of γ, we calculated the effect size (Cohen’s d) [30,31] for all relationships during the CA and CPR phases. The effect size was computed as the standardized mean difference using the formula
d = μ 1 / σ ,
where μ is the observed mean, and σ is the standard deviation. The statistical power was then calculated using the MATLAB function sampsizepwr, which evaluates the statistical power based on the effect size, sample size, and significance level.

3. Results

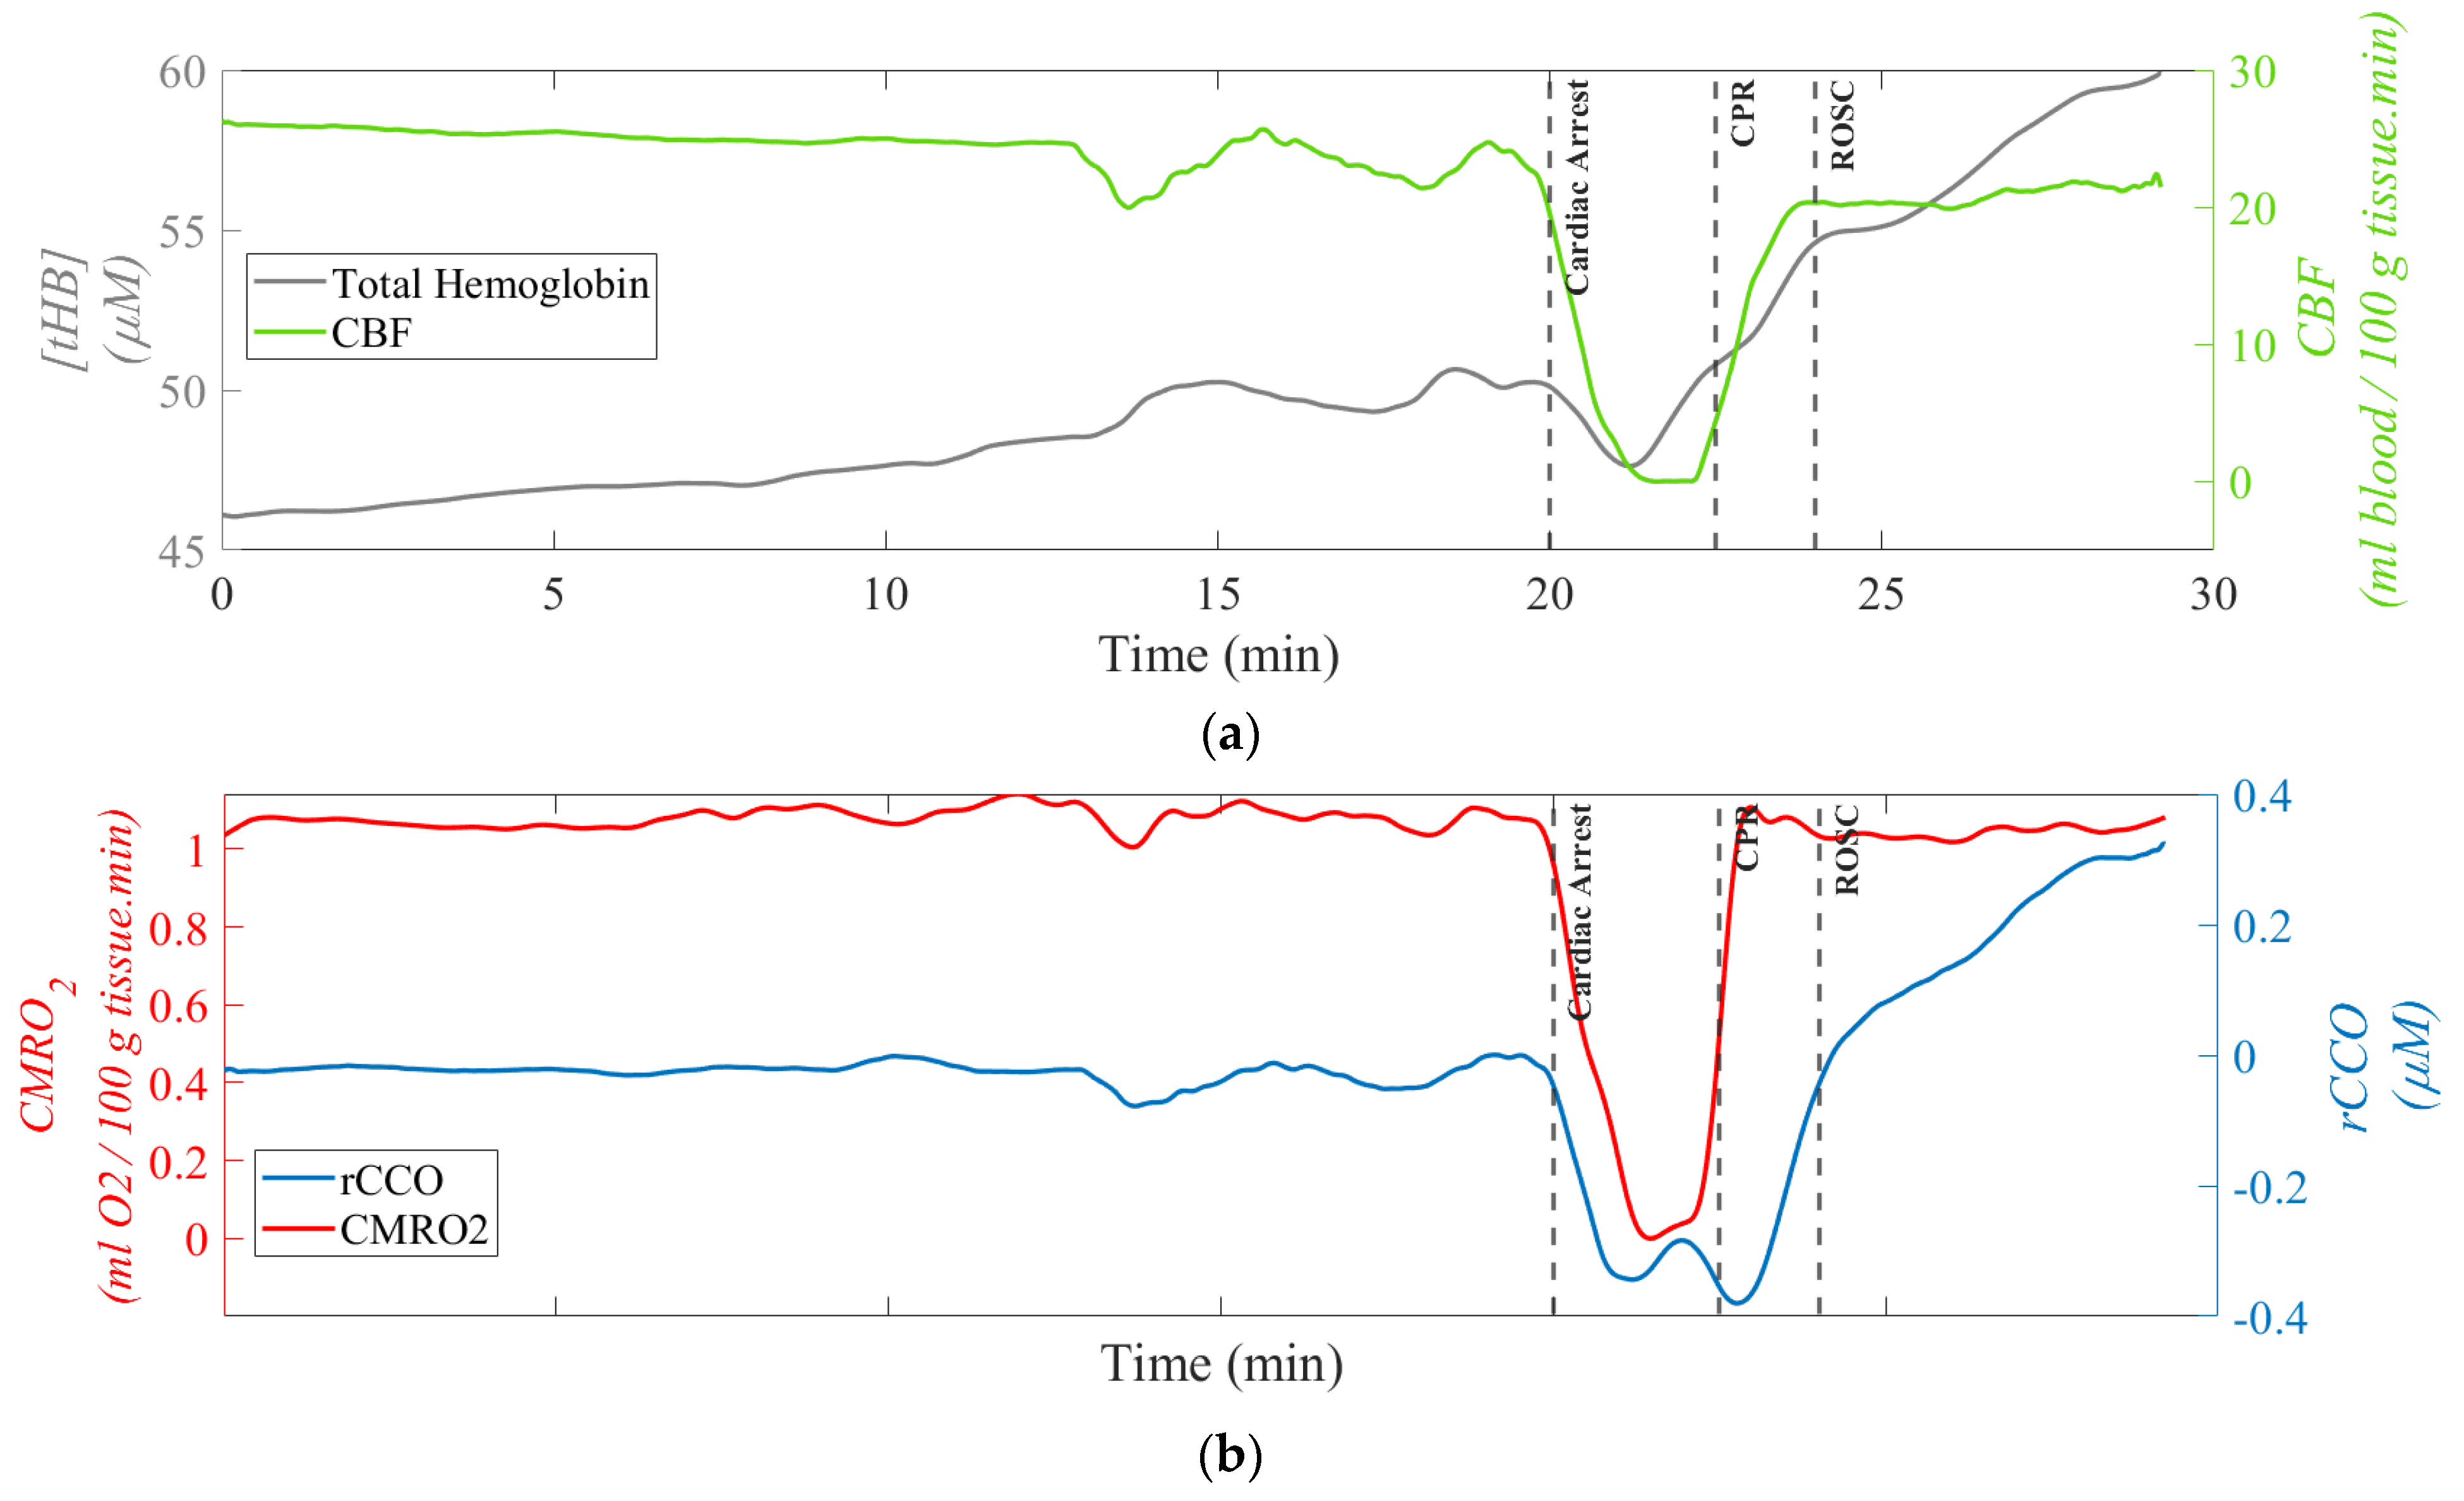
Figure 3 presents representative time traces of [tHB], rCCO, CMRO2, and CBF for one of the pigs, serving as an example of absolute value calculations as well as the normalized CBF, rCCO, and CMRO2 in pairs. The top two plots show [tHB] versus CBF and rCCO versus CMRO2 in absolute values. [tHB] and rCCO values are given in μM, while CBF and CMRO2 are expressed in mL blood/100 g tissue/min and mL O2/100 g tissue/min, respectively.
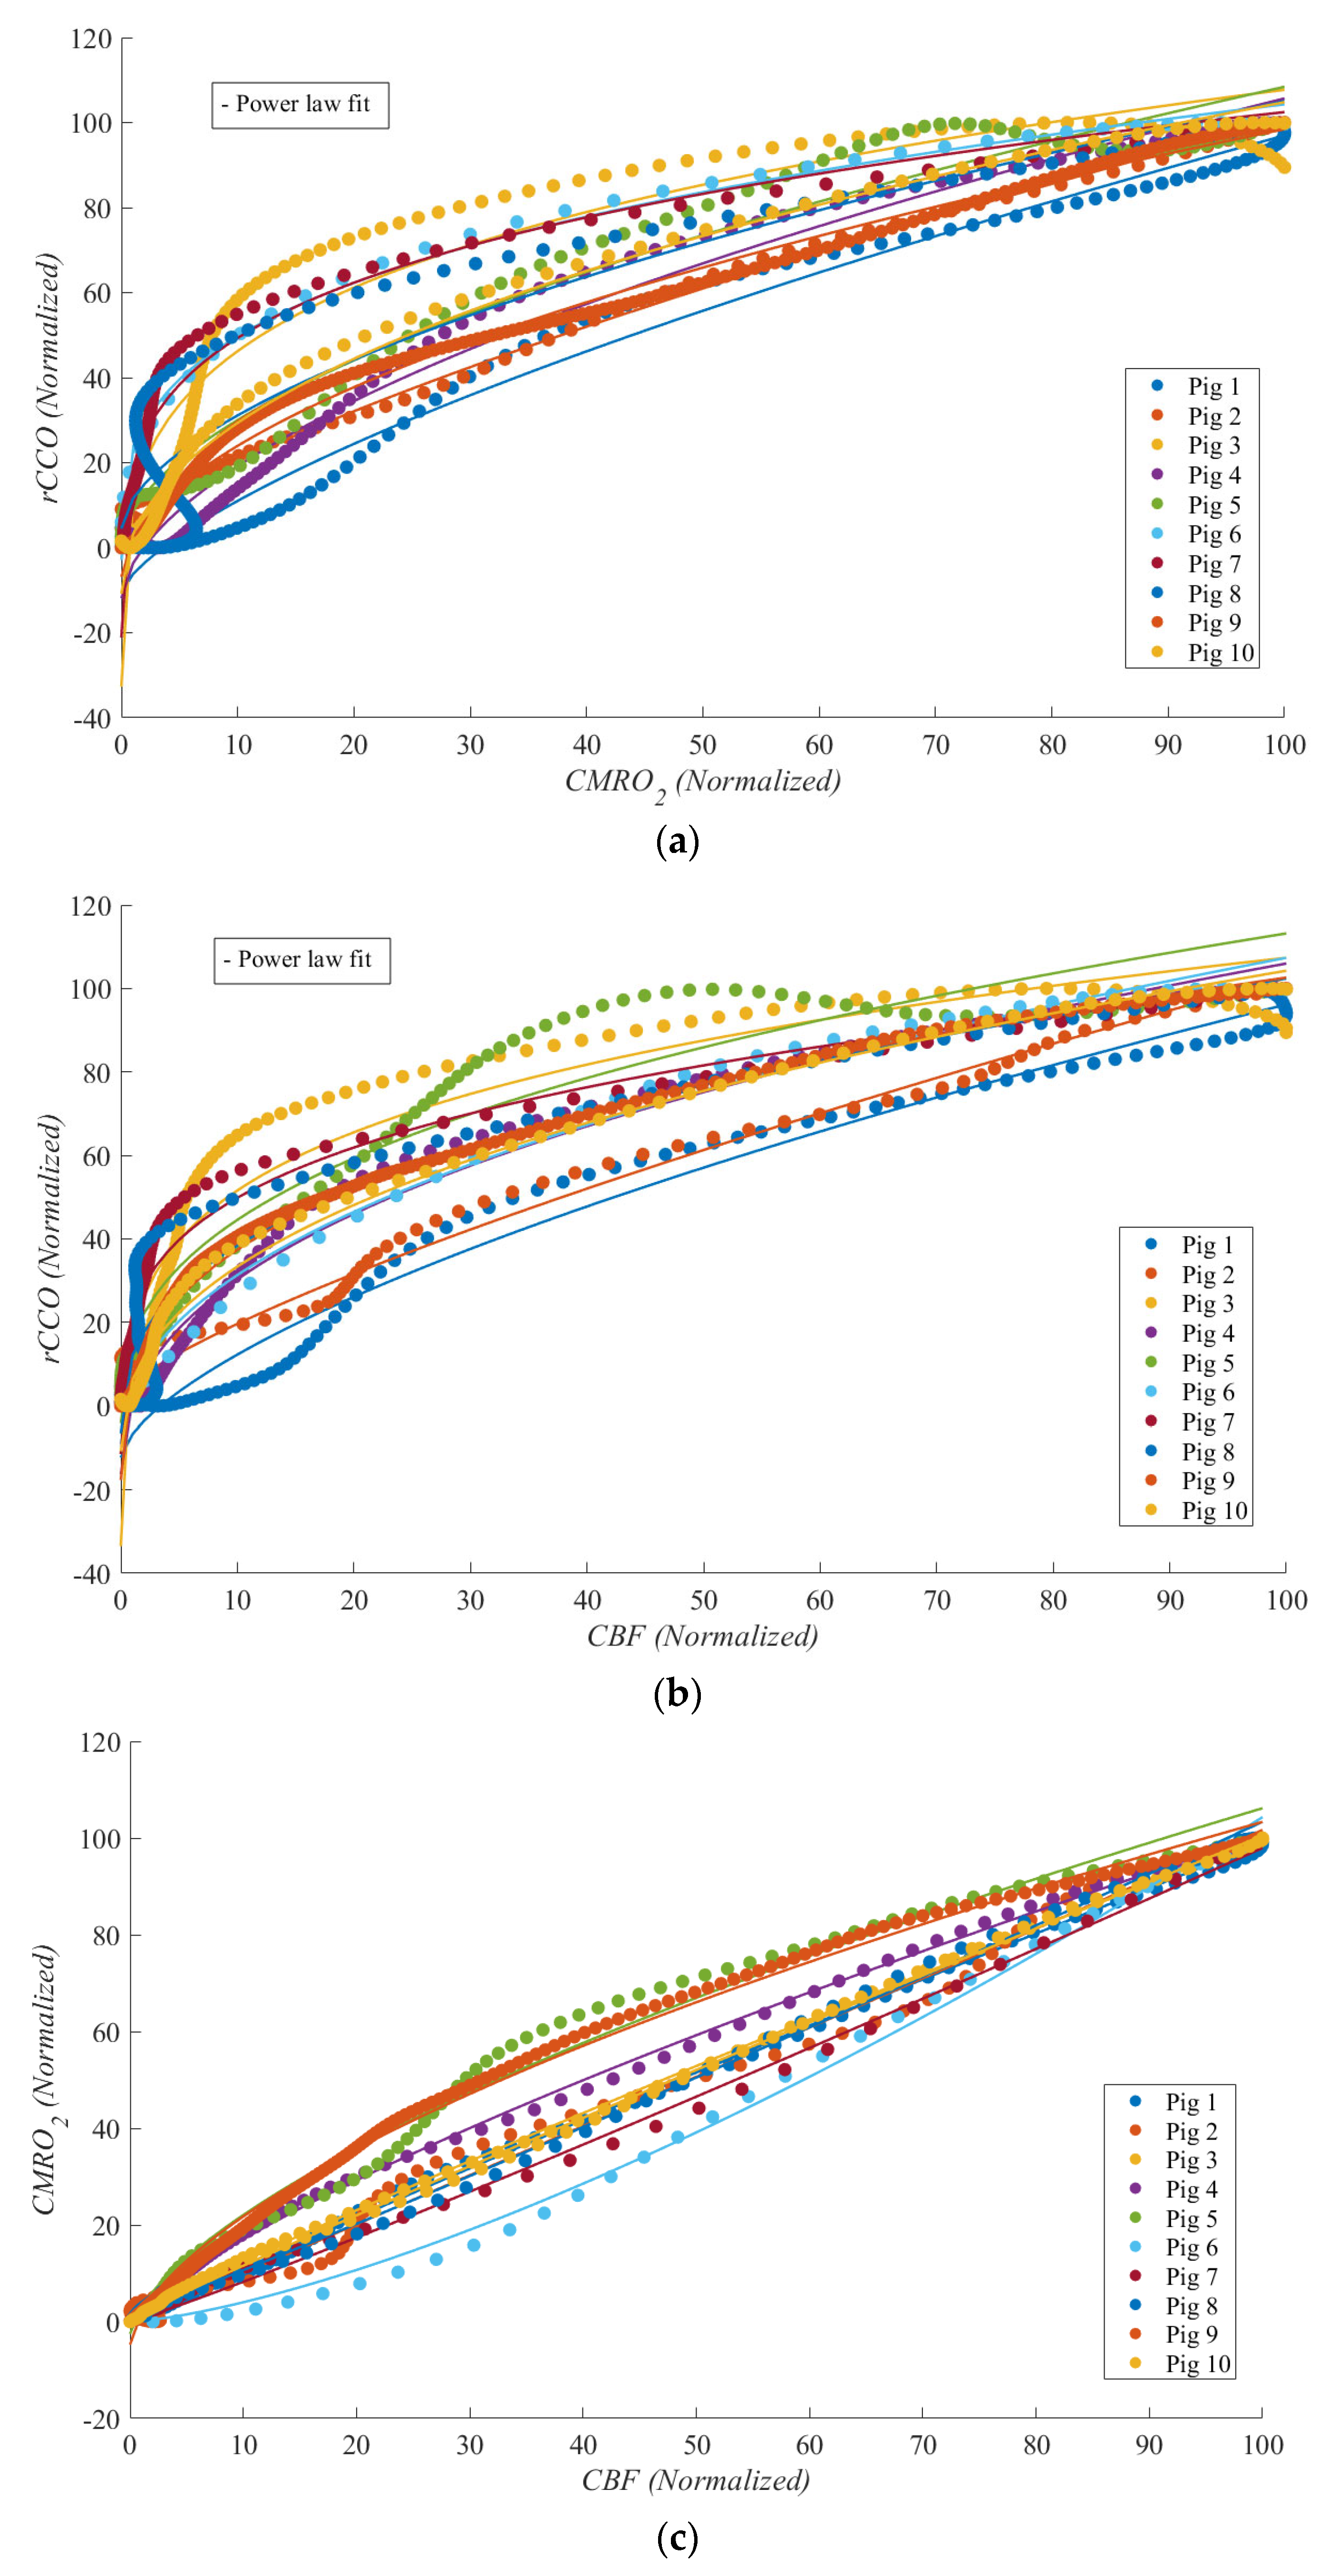
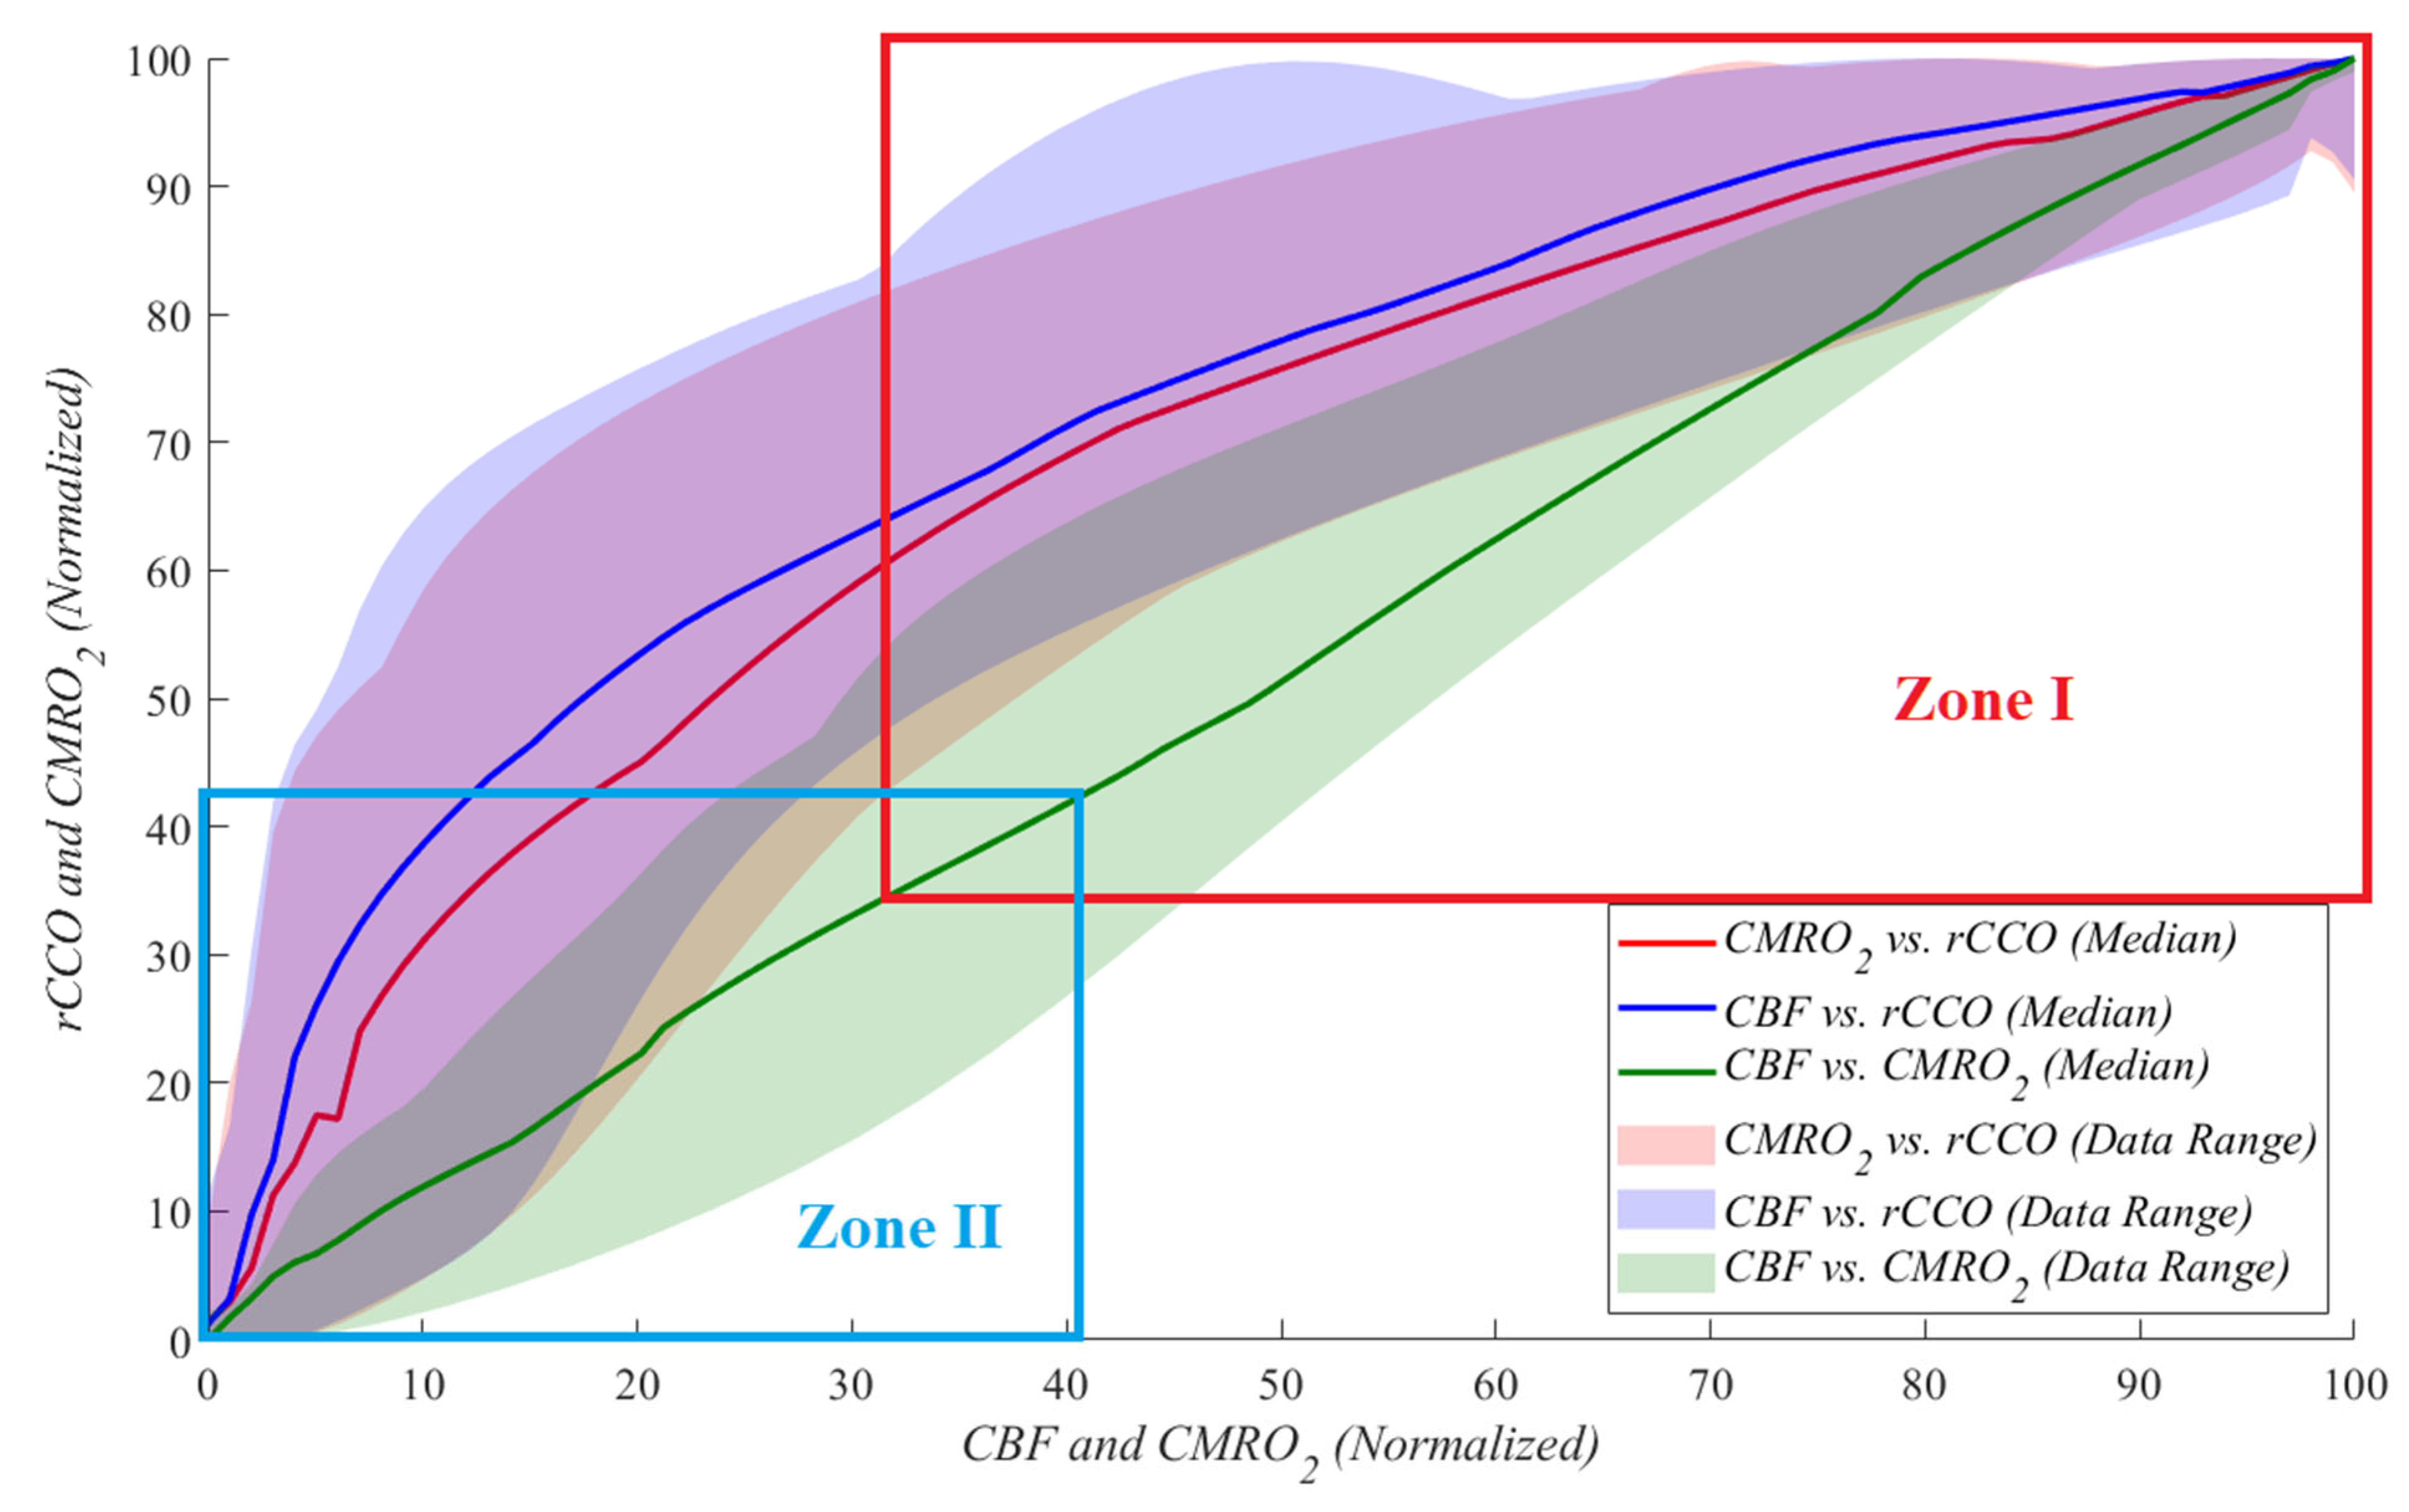
Figure 4 illustrates these relationships during cardiac arrest, with each dataset normalized to its maximum value for comparability. Each relationship is represented by a unique color, with median lines shown as solid lines and data ranges depicted by shaded areas. These plots highlight the linear and non-linear dynamics between rCCO, CMRO2, and CBF under the extreme physiological conditions of cardiac arrest.
Table 1 presents the values of the power law fit R2, power law γ means ± standard deviations, t-test p-values, and statistical power corresponding to Figure 4. From Table 1, one can see that for the CMRO2 vs. rCCO and CBF vs. rCCO (Figure 4a and Figure 4b, respectively) the “square-root” type of relationship (γ ≈ 0.5) was established with high statistical significance and power, despite a relatively low sample size of 10.
To further analyze the data shown in Figure 5 and to compare them to similar studies reporting approximately 60-70% reductions from the baseline, the data obtained were investigated by dividing them into two zones. During cardiac arrest, zone I represents the period from the baseline to a 70% drop relative to the baseline, while zone II corresponds to a 60% to 100% drop (complete cessation of blood flow). The results indicate that as the blood flow approached zero, the parameters exhibited increasingly random behavior. This is reflected in the standard deviation of the power law γ values, with CMRO2 vs. rCCO showing a standard deviation of 0.388, CBF vs. rCCO of 0.350, and CBF vs. CMRO2 of 0.314. These findings highlight the variability and instability of physiological responses during severe reductions in perfusion. This suggests that during severe ischemia, the relationships between these parameters become less predictable, reflecting the breakdown of normal regulatory mechanisms. While variability at this level is expected under extreme conditions, it highlights the need for careful interpretation and potentially more complex modeling to accurately capture metabolic dynamics during CA. Table 2 provides the median and standard deviation values for γ across both zones and for all three relationships.
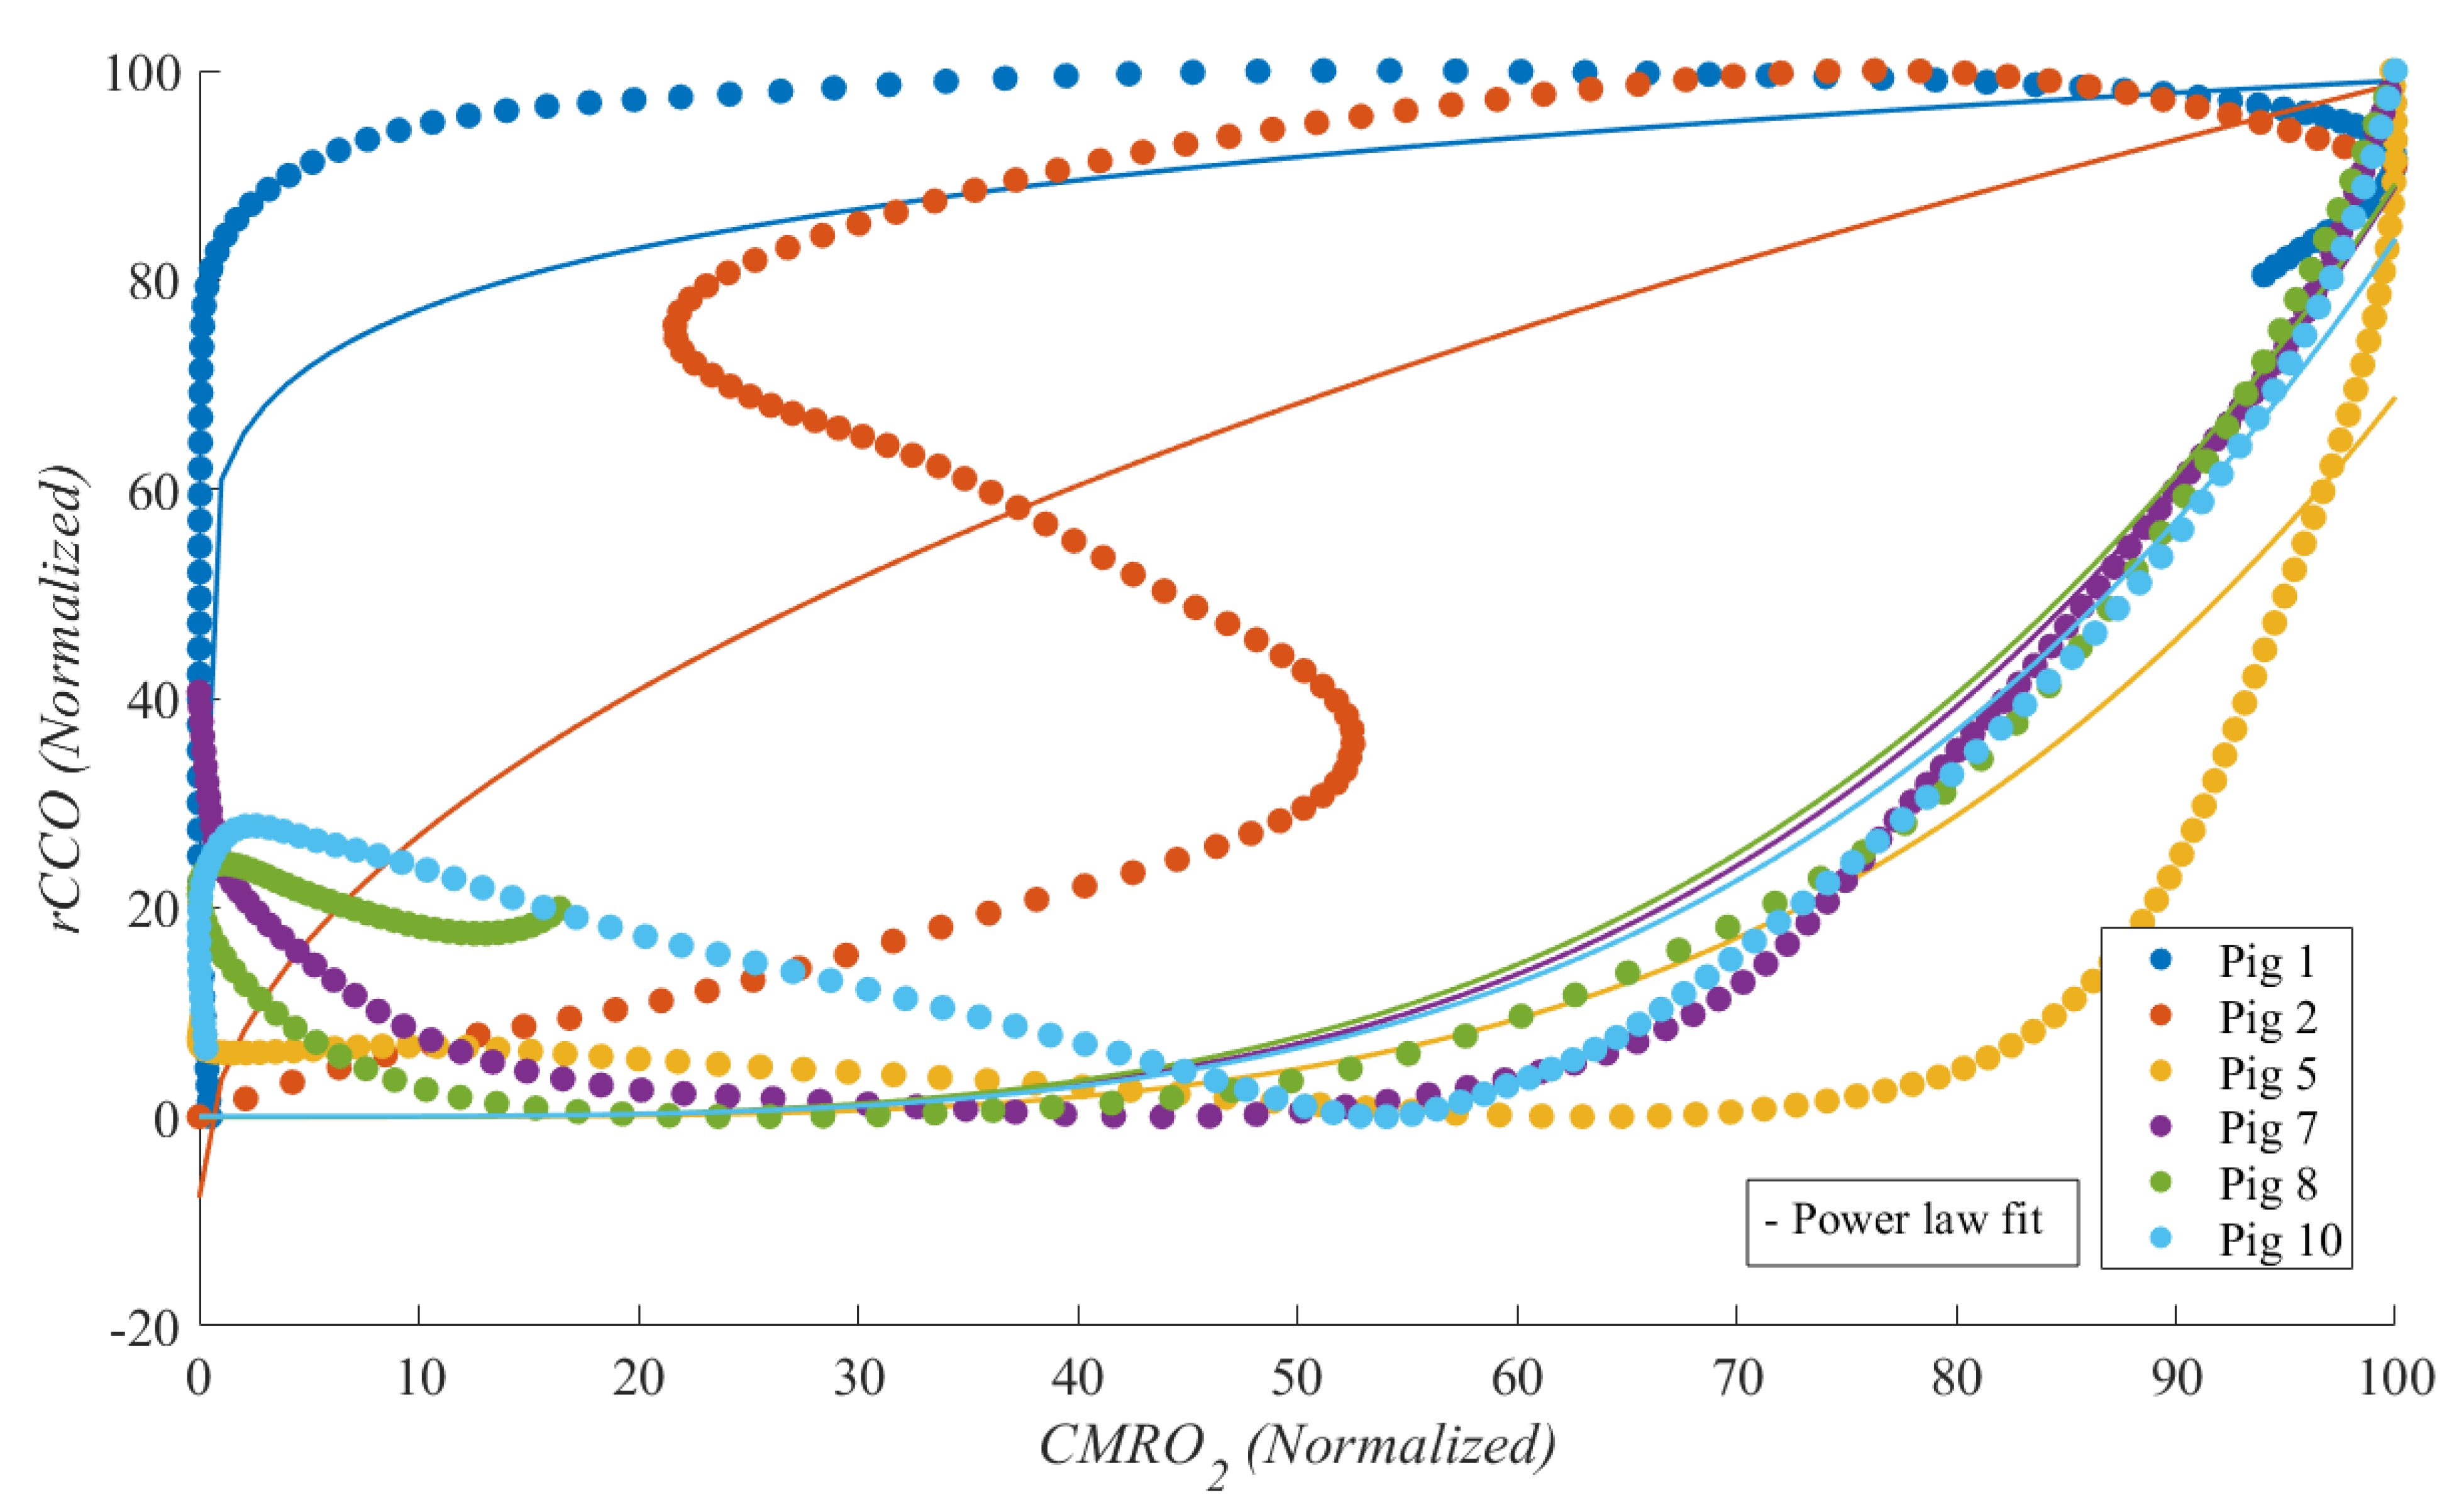
Due to the volatile conditions during CPR, characterized by intense movements and mechanical compressions, analyzing physiological markers was challenging compared to doing so for stable periods for most experiments. As a result, no clear relationships between rCCO and other variables were observed, and the data appeared random. This is reflected in the low R2 values for the power law fits. Figure 6 shows a scatter plot of CMRO2 vs. rCCO, illustrating this lack of a correlation. However, as expected, CBF and CMRO2 maintained a strong linear relationship. In most experiments, MATLAB was unable to fit the power law model for rCCO-related data, resulting in fewer than 10 pigs being represented in Figure 6. Nonetheless, R2 values and the median power law γ, along with their standard deviations, are presented in Table 3.
Table 3 summarizes the R2 values, power law γ means with standard deviations, t-test p-values, and statistical powers for each relationship during CPR. From Table 3, one can see that during CPR the interactions involving rCCO exhibited significant non-linear dynamics with γ>1, underscoring the complexity of cerebral metabolism during cardiac arrest. However, p-values greater than 0.05 indicated relatively low statistical significance. The statistical power for the values of γ in Table 3 was below 50%.
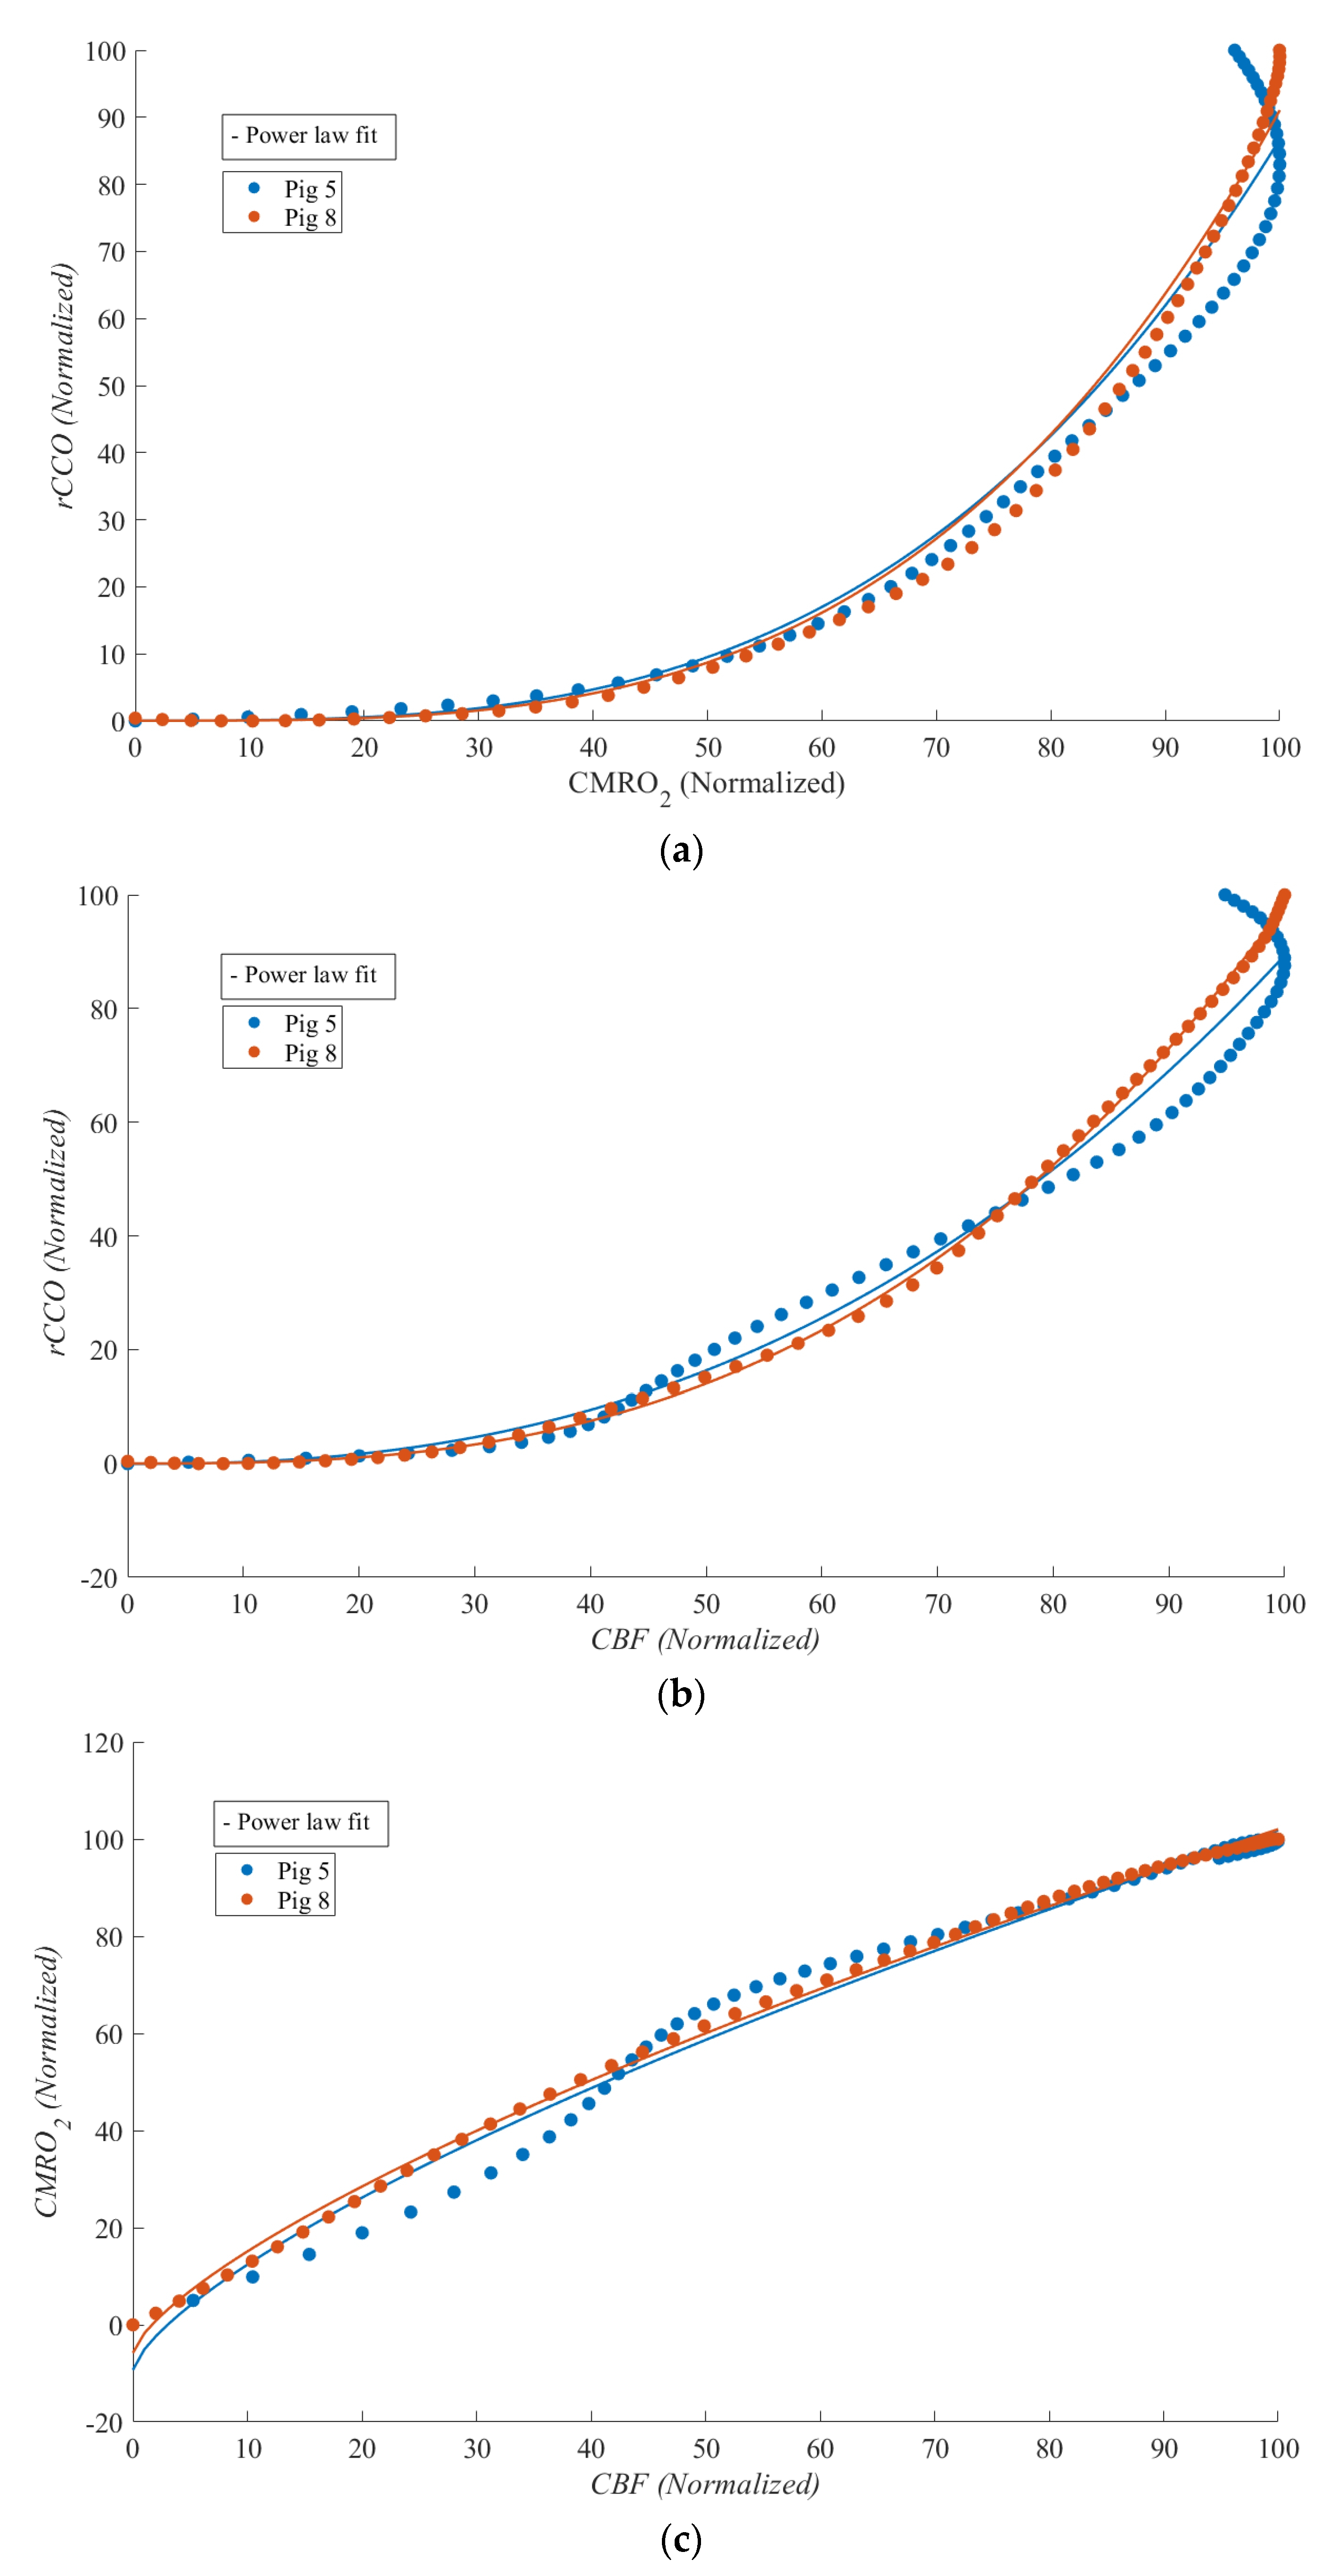
Figure 7 shows CBF vs. CMRO2, CBF vs. rCCO, and CMRO2 vs. rCCO for two of the experiments during which ROSC was achieved, enabling the study of physiological relationships during this phase. Although statistical analysis was not feasible due to the limited sample size, strong non-linear relationships were observed between rCCO and CMRO2, as well as between rCCO and CBF. Notable differences compared to the cardiac arrest phase included the emergence of a weak non-linear relationship between CBF and CMRO2 and a marked change in curvature for the other two relationships (with γ shifting from approximately 0.5 during cardiac arrest to around 3 during ROSC).
In addition to the power law exponent γ, the intercept a and the scaling factor k in Equation (7) were calculated for each relationship during cardiac arrest and CPR. A one-sample t-test confirmed that k and γ were positive and significantly different from zero (p < 0.05) during cardiac arrest, reflecting strong coupling between CMRO2, CBF, and rCCO under ischemic conditions. The p-values for γ ≠ 1 (non-linearity) and γ ≠ 0 (presence of coupling) are presented in Table 2 and Table 3, indicating significant deviations from linearity during cardiac arrest (p < 0.05), except for in the CBF vs. CMRO2 relationship, where γ≈1, suggesting a predominantly linear flow–metabolism coupling. Conversely, during CPR, a and k were not significantly different from zero (p > 0.05) in the CBF vs. rCCO and CMRO2 vs. rCCO relationships, underscoring the absence of meaningful coupling. However, k in the CBF vs. CMRO2 relationship remained significant (p < 0.05), reinforcing that partial linearity persisted between the flow and metabolism, even under the dynamic and mechanically unstable conditions introduced by chest compressions. These findings highlight the non-linear and disrupted nature of cerebral metabolism during CPR, with preservation of linear flow–metabolism interactions between CBF and CMRO2.

4. Discussion

Near-infrared spectroscopy (NIRS) has demonstrated the potential to detect cardiac arrest (CA) and monitor tissue oxygenation even in the absence of a pulse waveform. This suggests its application in identifying CA outside hospital settings and continuously monitoring patients until circulation is restored [32]. In this study, CA and cardiopulmonary resuscitation (CPR) in pigs using hyperspectral NIRS combined with laser Doppler flowmetry (LDF) were investigated. Broadband NIRS captures the full NIR spectrum at each time point, providing (1) the ability to detect chromophores beyond [HbO2] and [HHb], such as cytochrome c oxidase (CCO) and water; (2) improved accuracy in determining the chromophore concentration by resolving full spectral features; and (3) the capability to determine the path length and absolute concentrations using second differential spectral methods [33].
Our study aimed to analyze the relationship between redox cytochrome c oxidase (rCCO), the cerebral metabolic rate of oxygen (CMRO2), and the cerebral blood flow (CBF) during CA, CPR, and the return of spontaneous circulation (ROSC). Our results, obtained invasively directly from the brain, reveal distinct patterns of interaction between these variables, shedding light on the non-linear dynamics governing cerebral metabolism under extreme physiological conditions. The findings of this study emphasize the potential for advanced neuro-monitoring techniques to guide resuscitation strategies, particularly for critical care physicians managing post-cardiac arrest patients. Future clinical practice could integrate the continuous real-time monitoring of cerebral oxygen metabolism to optimize CPR’s effectiveness and improve long-term neurological recovery.
The strong linear relationship observed between CBF and CMRO2, with R2 values approaching 1.0, aligns with expectations based on Fick’s principle, indicating a robust coupling between oxygen delivery and consumption. This consistency underscores the fundamental role of CBF in sustaining cerebral oxygen metabolism. In contrast, the relationships involving rCCO deviated from linearity, particularly during CA. The power law fits for CMRO2 vs. rCCO and CBF vs. rCCO exhibited lower R2 values and γ exponents of around 0.5, suggesting that mitochondrial function and oxygen utilization become less predictable as the blood flow diminishes. During cardiac arrest, the scaling factor k and power law exponent γ were consistently positive and significant (p < 0.05), reflecting strong coupling between CMRO2, CBF, and rCCO, while the intercept a was not significant for CBF vs. CMRO2, suggesting proportional flow–metabolism coupling without a baseline offset. In contrast, during CPR, a and k were not significant for rCCO-related relationships, indicating disrupted mitochondrial coupling, likely due to mechanical chest compressions. However, k remained significant for CBF vs. CMRO2, highlighting the partial preservation of a linear flow–metabolism interaction even under unstable conditions. This suggests that while cerebral blood flow and oxygen metabolism coupling persists during CPR, mitochondrial dynamics are more sensitive to resuscitative efforts, emphasizing the need to protect mitochondrial function for better neurological outcomes.
Interestingly, during CPR, the relationships between rCCO and CMRO2 or CBF weakened, likely due to the physical disturbances and hemodynamic fluctuations induced by mechanical chest compressions. The low R2 values during CPR reflect the challenges of accurately capturing cerebral metabolism under such turbulent conditions. This finding highlights the need for refined measurement techniques to mitigate motion artifacts and enhance data reliability.
The p-values for γ ≠ 1 across the entire cardiac event reveal distinct patterns in the relationships between CMRO2, CBF, and rCCO during CA, CPR, and ROSC. The relationship between CBF and CMRO2 consistently showed a p > 0.05 (p = 0.428 during CA and p = 0.831 during CPR), indicating that the coupling between oxygen delivery and consumption persisted even during mechanical compressions. Conversely, the relationships involving rCCO demonstrated a p < 0.05 for γ ≠ 1 during CA and ROSC (p = 0.000 and p = 0.015, respectively), reflecting significant deviations from linearity. This suggests that mitochondrial function follows non-linear behavior under ischemic and reperfusion conditions. During CPR, the relationships between rCCO and CMRO2 or CBF weakened, as indicated by a p > 0.05, which may reflect the hemodynamic instability introduced by chest compressions. Despite this, p-values for γ ≠ 0 remained highly significant (p < 0.001), highlighting the ongoing metabolic contribution of rCCO even during turbulent periods.
The scaling factor k, which represents the proportional relationship between the variables of interest, was consistently positive and statistically significant across all phases of the study (CA, CPR, and ROSC). This finding aligns with physiological expectations, suggesting that even during severe reductions in the cerebral blood flow, a positive relationship between CMRO2, CBF, and rCCO persists, reflecting the brain’s ongoing metabolic activity and mitochondrial function. The significance of k during CPR highlights the resilience of cerebral metabolism, even under the dynamic and mechanically unstable conditions introduced by chest compressions. This reinforces the importance of preserving mitochondrial function during resuscitation efforts, as it may play a critical role in improving neurological outcomes post-ROSC.
To further analyze these relationships, we separated the data obtained during CA into two zones: zone I (baseline to a ≈70% drop) and zone II (60% to 100% drop in the blood flow). The results revealed increasing randomness in physiological responses as the blood flow approached zero, with greater variability in the power law γ values observed in zone II. The standard deviations of γ for CMRO2 vs. rCCO (0.388), CBF vs. rCCO (0.350), and the CBF vs. CMRO2 (0.314) suggest heightened instability in mitochondrial and metabolic responses near the complete cessation of perfusion.
The segmentation of the data into zone I and zone II enabled a more detailed analysis of metabolic responses. This division allowed for a direct comparison with prior non-invasive studies in small piglets by Milej et al. [12], which focused on smaller perturbations in CBF from the baseline values. In zone I, for the CMRO2 vs. rCCO relationship, p = 0.07, suggesting near-linearity. This result corresponds closely to those of [12], where the relationship between rCCO and CMRO2 was found to be not significantly different from one. The relationship between CMRO2 and CBF remained linear with γ = 0.975 ± 0.339 and p = 0.813 for γ ≠ 1, indicating that oxygen delivery and consumption are tightly coupled under moderate reductions in blood flow. Interestingly, this result contrasts with the findings of [12], where the same relationship exhibited mild non-linearity (γ = 1.39 ± 0.31) during carotid occlusion. One possible explanation for this difference is the nature of the ischemic event. In Milej et al. [12], ischemia was induced gradually under anesthesia, which may have allowed for compensatory mechanisms that introduced non-linearity. In contrast, our study involved CA, characterized by a rapid and complete cessation of blood flow, likely overwhelming autoregulatory mechanisms and preserving a direct linear relationship between CBF and CMRO2 during the initial phase of ischemia.
However, in zone II, as the blood flow approached zero, non-linear responses emerged. The relationships between CBF and rCCO (p = 0.023) showed significant deviations from linearity, reflecting increased variability in mitochondrial responses under severe ischemia. These findings contrast with the linearity observed during moderate occlusion in [12] and emphasize the need for non-linear modeling to fully capture metabolic dynamics during extreme reductions in blood flow. The comparison between zone I and zone II highlights the shift from linear to non-linear behavior as ischemia deepens. While prior studies concentrated on milder ischemic conditions, our data illustrate the breakdown of linear relationships during extreme drops in blood flow, emphasizing the need for non-linear modeling to fully capture the metabolic dynamics of CA and CPR.
Motion artifacts from mechanical chest compressions during CPR pose challenges to accurate data recording. In our study, we minimized these effects by invasively placing LDF probes and hNIRS optodes on the dura mater through cranial drilling and securing them with sutures, providing an ideal setup for data acquisition. However, in real-life clinical scenarios, non-invasive sensor placements would be more affected by motion. Future research should explore modeling techniques, such as advanced signal processing or machine learning, to mitigate motion artifacts and improve the reliability of cerebral oxygen monitoring in practical applications.
Unfortunately, our study observed only two ROSC cases out of a total of ten experiments. During ROSC, the non-linear relationship between CMRO2 and rCCO persisted but exhibited a significant shift, with γ values increasing to approximately 3. This sharp contrast to the values of γ observed during CA suggests dynamic changes in mitochondrial activity and oxygen utilization as circulation is restored. The observed non-linearity may reflect the brain’s attempt to rapidly restore homeostasis following prolonged ischemia. However, the differences in metabolic and mitochondrial responses between CA, CPR, and ROSC phases warrant further investigation in larger cohorts.
Additionally, in this study we focused on the relative changes in rCCO rather than on the absolute values, as we did not have baseline measurements of oxidized and reduced CCO concentrations. This limitation should be considered when interpreting the results, as absolute values would provide a more comprehensive understanding of the physiological changes occurring during CA and CPR. To advance our understanding, leveraging mathematical models presents several advantages. By identifying and quantifying the mathematical relationships between physiological variables, we can predict one variable based on measurements of another. This approach becomes particularly valuable in situations where advanced measurement technologies are unavailable or impractical. Mathematical models can provide meaningful insights and predictions in such contexts.
In our future research, we will focus on evaluating the validity and applicability of existing hemometabolic models to describe the mathematical relationships between rCCO, CMRO2, and CBF. A key part of this effort will involve applying the BrainSignal model [34], which provides a comprehensive framework for analyzing these interactions. Unlike CHS, which lacks the capacity to calculate rCCO, BrainSignal incorporates mitochondrial metabolism, allowing for the quantification of rCCO. In this study, the availability of hNIRS enabled us to directly measure rCCO, offering insights into mitochondrial function during CA and CPR.
Moving forward, we aim to apply the BrainSignal model to mathematically estimate rCCO in contexts where direct measurements are not feasible. By integrating this model with our experimental data, we seek to uncover more precise correlations between rCCO, CMRO2, and CBF under various physiological conditions. This dual approach—combining experimental data from hNIRS with predictive modeling—will not only deepen our understanding of cerebral metabolism but also enhance the development of tools capable of predicting cerebral hemodynamic responses in both clinical and research settings. Ultimately, these efforts could bridge the gap between experimental measurements and real-time predictive monitoring, furthering the potential for the non-invasive assessment of brain metabolism in critical care environments.

5. The Limitations of the Study

Despite the valuable insights provided by this study, several limitations should be acknowledged. The invasive nature of the experimental setup, involving the placement of hNIRS optodes and LDF probes directly on the dura mater, limits its direct applicability to clinical settings. While this approach minimized motion artifacts and ensured high-quality data, non-invasive methodologies would be more suitable for real-world clinical applications. Future research should focus on developing and validating robust non-invasive techniques for cerebral oxygenation and metabolism monitoring under similar conditions.
The sample size of ten pigs, while sufficient for detecting significant trends, imposes constraints on the generalizability of the results for the CPR and ROSC epochs. The small cohort size limited our ability to perform detailed subgroup analyses or assess the effects of specific interventions, such as varying doses of epinephrine, on cerebral metabolism. Previous studies [13,35] have shown that the adrenaline (epinephrine) dosage significantly influences resuscitation success rates, highlighting its critical role during CPR. Future research with larger sample sizes should aim to assess how pharmacological interventions influence cerebral oxygen metabolism and neurological outcomes during cardiac arrest and resuscitation.
The limited number of cases with a ROSC further restricted the scope of analysis for this phase. Expanding the sample size in future studies could provide a more comprehensive understanding of the physiological responses and improve the statistical power.
Lastly, the lack of baseline measurements for the absolute concentrations of cytochrome C oxidase represents another limitation. While the relative changes in rCCO provided valuable insights, absolute values would have enhanced the interpretation of mitochondrial function during cardiac arrest and resuscitation. Incorporating baseline measurements in future studies could offer a more detailed characterization of the physiological changes occurring during these critical events.

6. Conclusions

This study demonstrated a non-linear relationship between CMRO2 and rCCO during cardiac arrest, CPR, and ROSC, providing insights into cerebral oxygen metabolism under critical conditions. These findings could inform strategies to enhance neurological monitoring during resuscitation. Future research involving CHS and BrainSignal hemometabolic models should focus on refining measurement techniques to minimize motion artifacts during CPR and validating the observed relationships in larger animal models or clinical settings. By enhancing our understanding of cerebral metabolism under extreme conditions, these efforts may contribute to improved strategies for mitigating brain injury and enhancing patient outcomes during cardiac arrest and resuscitation.

Author Contributions

Methodology, R.M., S.L. and V.T.; software, N.S.; investigation, N.S. and V.T.; data curation, R.M. and N.S.; writing—original draft, N.S.; writing—review and editing, NS. and V.T.; supervision, R.M., S.L. and V.T.; funding acquisition, S.L. All authors have read and agreed to the published version of the manuscript.

Funding

This research received no external funding.

Institutional Review Board Statement

All animals in the project received humane and proper treatment in accordance with the policies formulated by St. Michael’s Hospital Animal Care Committee, the Animals for Research Act 1968-69, and with the recommendations of the Canadian Council on Animal Care. PI accepts responsibility for keeping the foregoing information current, especially with respect to the methodology. The protocol code is ACC #113.

Informed Consent Statement

Not applicable.

Data Availability Statement

The results of this study are available from the corresponding author on reasonable request.

Conflicts of Interest

The authors declare no conflicts of interest.

References

  1. Yan, S.; Gan, Y.; Jiang, N.; Wang, R.; Chen, Y.; Luo, Z.; Zong, Q.; Chen, S.; Lv, C. The global survival rate among adult out-of-hospital cardiac arrest patients who received cardiopulmonary resuscitation: A systematic review and meta-analysis. Crit. Care 2020, 24, 61. [Google Scholar] [CrossRef] [PubMed]
  2. D’Andria Ursoleo, J.; Bugo, S.; Losiggio, R.; Bottussi, A.; Agosta, V.T.; Monaco, F. Characteristics of Out-of-Hospital Cardiac Arrest Trials Registered in ClinicalTrials. gov. J. Clin. Med. 2024, 13, 5421. [Google Scholar] [CrossRef] [PubMed] [PubMed Central]
  3. Buunk, G.; van der Hoeven, J.G.; Meinders, A.E. Cerebral blood flow after cardiac arrest. Neth. J. Med. 2000, 57, 106–112. [Google Scholar] [CrossRef] [PubMed]
  4. Lemiale, V.; Dumas, F.; Mongardon, N.; Giovanetti, O.; Charpentier, J.; Chiche, J.D.; Carli, P.; Mira, J.P.; Nolan, J.; Cariou, A. Intensive care unit mortality after cardiac arrest: The relative contribution of shock and brain injury in a large cohort. Intensive Care Med. 2013, 39, 1972–1980. [Google Scholar] [CrossRef] [PubMed]
  5. Claassen, J.A.H.R.; Thijssen, D.H.J.; Panerai, R.B.; Faraci, F.M. Regulation of cerebral blood flow in humans: Physiology and clinical implications of autoregulation. Physiol. Rev. 2021, 101, 1487–1559. [Google Scholar] [CrossRef] [PubMed] [PubMed Central]
  6. Rolfe, D.F.; Brown, G.C. Cellular energy utilization and molecular origin of standard metabolic rate in mammals. Physiol. Rev. 1997, 77, 731–758. [Google Scholar] [CrossRef] [PubMed]
  7. Fukuda, R.; Zhang, H.; Kim, J.W.; Shimoda, L.; Dang, C.V.; Semenza, G.L. HIF-1 regulates cytochrome oxidase subunits to optimize efficiency of respiration in hypoxic cells. Cell 2007, 129, 111–122. [Google Scholar] [CrossRef] [PubMed]
  8. Davidson, J.O.; Gonzalez, F.; Gressens, P.; Gunn, A.J. Newborn Brain Society Guidelines and Publications Committee. Update on mechanisms of the pathophysiology of neonatal encephalopathy. Semin. Fetal Neonatal Med. 2021, 26, 101267. [Google Scholar] [CrossRef] [PubMed]
  9. Sekhon, M.S.; Ainslie, P.N.; Griesdale, D.E. Clinical pathophysiology of hypoxic ischemic brain injury after cardiac arrest: A “two-hit” model. Crit. Care 2017, 21, 90. [Google Scholar] [CrossRef]
  10. Hashem, M.; Wu, Y.; Dunn, J.F. The relationship between cytochrome c oxidase, CBF and CMRO2 in mouse cortex: A NIRS-MRI study. J. Cereb. Blood Flow. Metab. 2023, 43, 1351–1364. [Google Scholar] [CrossRef] [PubMed] [PubMed Central]
  11. Bohraus, Y.; Merkle, H.; Logothetis, N.K.; Goense, J. Laminar differences in functional oxygen metabolism in monkey visual cortex measured with calibrated fMRI. Cell Rep. 2023, 42, 113341. [Google Scholar] [CrossRef] [PubMed]
  12. Milej, D.; Rajaram, A.; Suwalski, M.; Morrison, L.B.; Shoemaker, L.N.; St Lawrence, K. Assessing the relationship between the cerebral metabolic rate of oxygen and the oxidation state of cytochrome-c-oxidase. Neurophotonics 2022, 9, 035001. [Google Scholar] [CrossRef] [PubMed] [PubMed Central]
  13. Nosrati, R.; Lin, S.; Mohindra, R.; Ramadeen, A.; Toronov, V.; Dorian, P. Study of the Effects of Epinephrine on Cerebral Oxygenation and Metabolism During Cardiac Arrest and Resuscitation by Hyperspectral Near-Infrared Spectroscopy. Crit. Care Med. 2019, 47, e349–e357. [Google Scholar] [CrossRef]
  14. McAnally, J.R. The use of animals in research … the views of a young researcher. J. Okla. Dent. Assoc. 1993, 83, 34–35. [Google Scholar]
  15. Nosrati, R.; Lin, S.; Ramadeen, A.; Monjazebi, D.; Dorian, P.; Toronov, V. Cerebral Hemodynamics and Metabolism During Cardiac Arrest and Cardiopulmonary Resuscitation Using Hyperspectral Near Infrared Spectroscopy. Circ. J. 2017, 81, 879–887. [Google Scholar] [CrossRef]
  16. Nosrati, R.; Ramadeen, A.; Hu, X.; Woldemichael, E.; Kim, S.; Dorian, P.; Toronov, V. Simultaneous Measurement of Cerebral and Muscle Tissue Vc During Cardiac Arrest and Cardiopulmonary Resuscitation. In Optical Techniques in Neurosurgery, Neurophotonics, and Optogenetics II; SPIE: Bellingham, WA, USA, 2015; Volume 9305, pp. 164–169. [Google Scholar]
  17. Zhao, H.; Tanikawa, Y.; Gao, F.; Onodera, Y.; Sassaroli, A.; Tanaka, K.; Yamada, Y. Maps of optical differential pathlength factor of human adult forehead, somatosensory motor and occipital regions at multi-wavelengths in NIR. Phys. Med. Biol. 2002, 47, 2075–2093. [Google Scholar] [CrossRef]
  18. Strangman, G.E.; Li, Z.; Zhang, Q. Depth Sensitivity and Source-Detector Separations for Near Infrared Spectroscopy Based on the Colin27 Brain Template. PLoS ONE 2013, 8, e66319. [Google Scholar] [CrossRef]
  19. Scholkmann, F.; Wolf, M. General equation for the differential pathlength factor of the frontal human head depending on wavelength and age. J. Biomed. Opt. 2013, 18, 105004. [Google Scholar] [CrossRef]
  20. Yeganeh, H.Z.; Toronov, V.; Elliott, J.T.; Diop, M.; Lee, T.-Y.; Lawrence, K.S. Broadband continuous-wave technique to measure baseline values and changes in the tissue chromophore concentrations. Biomed. Opt. Express 2012, 3, 2761–2770. [Google Scholar] [CrossRef]
  21. Sassaroli, A.; Kainerstorfer, J.M.; Fantini, S. Nonlinear extension of a hemodynamic linear model for coherent hemodynamics spectroscopy. J. Theor. Biol. 2016, 389, 132–145. [Google Scholar] [CrossRef]
  22. Khalifehsoltani, N.; Rennie, O.; Mohindra, R.; Lin, S.; Toronov, V. Tracking Cerebral Microvascular and Metabolic Parameters during Cardiac Arrest and Cardiopulmonary Resuscitation. Appl. Sci. 2023, 13, 12303. [Google Scholar] [CrossRef]
  23. Erdener, Ş.E.; Dalkara, T. Small vessels are a big problem in neurodegeneration and neuroprotection. Front. Neurol. 2019, 10, 889. [Google Scholar] [CrossRef] [PubMed]
  24. Wong, A.D.; Ye, M.; Levy, A.F.; Rothstein, J.D.; Bergles, D.E.; Searson, P.C. The blood-brain barrier: An engineering perspective. Front. Neuroeng. 2013, 6, 7. [Google Scholar] [CrossRef] [PubMed]
  25. Barber, T.W.; Brockway, J.A.; Higgins, L.S. The density of tissues in and about the head. Acta Neurol. Scand. 1970, 46, 85–92. [Google Scholar] [CrossRef]
  26. Cottrell, J.E.; Young, W.L. Cottrell and Young’s Neuroanesthesia; Mosby/Elsevier: Amsterdam, The Netherlands, 2010. [Google Scholar]
  27. Hashem, M.; Zhang, Q.; Wu, Y.; Johnson, T.W.; Dunn, J.F. Using a multimodal near-infrared spectroscopy and MRI to quantify gray matter metabolic rate for oxygen: A hypothermia validation study. Neuroimage 2020, 206, 116315. [Google Scholar] [CrossRef] [PubMed] [PubMed Central]
  28. Fantini, S. Dynamic model for the tissue concentration and oxygen saturation of hemoglobin in relation to blood volume, flow velocity, and oxygen consumption: Implications for functional neuroimaging and coherent hemodynamics spectroscopy (CHS). NeuroImage 2014, 85 Pt 1, 202–221. [Google Scholar] [CrossRef]
  29. Faul, F.; Erdfelder, E.; Lang, A.G.; Buchner, A. G*Power 3: A flexible statistical power analysis program for the social, behavioral, and biomedical sciences. Behav. Res. Methods. 2007, 39, 175–191. [Google Scholar] [CrossRef] [PubMed]
  30. Cohen, J. Statistical Power Analysis for the Behavioral Sciences, 2nd ed.; Routledge: Oxfordshire, UK, 1988. [Google Scholar] [CrossRef]
  31. Cohen, J. A power primer. Psychol. Bull. 1992, 112, 155–159. [Google Scholar] [CrossRef] [PubMed]
  32. Raschdorf, K.; Mohseni, A.; Hogle, K.; Cheung, A.; So, K.; Manouchehri, N.; Khalili, M.; Lingawi, S.; Grunau, B.; Kuo, C.; et al. Evaluation of transcutaneous near-infrared spectroscopy for early detection of cardiac arrest in an animal model. Sci. Rep. 2023, 13, 4537. [Google Scholar] [CrossRef]
  33. Ayaz, H.; Baker, W.B.; Blaney, G.; Boas, D.A.; Bortfeld, H.; Brady, K.; Brake, J.; Brigadoi, S.; Buckley, E.M.; Carp, S.A.; et al. Optical imaging and spectroscopy for the study of the human brain: Status report. Neurophotonics 2022, 9 (Suppl. S2), S24001. [Google Scholar] [CrossRef] [PubMed] [PubMed Central]
  34. Banaji, M.; Mallet, A.; Elwell, C.E.; Nicholls, P.; Cooper, C.E. A model of brain circulation and metabolism: NIRS signal changes during physiological challenges. PLoS Comput. Biol. 2008, 4, e1000212. [Google Scholar] [CrossRef] [PubMed] [PubMed Central]
  35. Ichim, C.; Pavel, V.; Mester, P.; Schmid, S.; Todor, S.B.; Stoia, O.; Anderco, P.; Kandulski, A.; Müller, M.; Heumann, P.; et al. Assessing Key Factors Influencing Successful Resuscitation Outcomes in Out-of-Hospital Cardiac Arrest (OHCA). J. Clin. Med. 2024, 13, 7399. [Google Scholar] [CrossRef]
Figure 1. (a) Experiment setup and (b) hNIRS system.
Applsci 15 01542 g001
Figure 2. Overview of the experimental workflow.
Applsci 15 01542 g002
Figure 3. Time traces of [tHB], rCCO, CMRO2, and CBF for one pig are shown in pairs: (a) [tHB] vs. CBF and (b) rCCO vs. CMRO2; [tHB] and rCCO values are in μM, CBF values are in m l   b l o o d 100   g   t i s s u e . m i n , and CMRO2 values are in m l   O 2 100   g   t i s s u e . m i n .
Applsci 15 01542 g003
Figure 4. Scatter plots for all the pigs (each color represents one pig) during cardiac arrest for the correlations between (a) rCCO and CMRO2, (b) CBF and rCCO, and (c) CBF and CMRO2.
Applsci 15 01542 g004
Figure 5. Correlation plots for all pigs (each color represents one relationship) during cardiac arrest, divided into two zones. Zone I represents the period from baseline to ≈70% CBF drop relative to baseline, while zone II corresponds to 60% to 100% drop (complete cessation of blood flow): (red) CMRO2 vs. rCCO during cardiac arrest; (blue) CBF vs. rCCO; (green) CBF vs. CMRO2.
Applsci 15 01542 g005
Figure 6. Scatter plot for 6 pigs (each color represents one pig) from the correlations between CMRO2 and rCCO during CPR.
Applsci 15 01542 g006
Figure 7. Scatter plots for two pigs (each color represents one pig) during ROSC from the correlations between (a) CMRO2 and rCCO, (b) CBF and rCCO, and (c) CBF and CMRO2. The mean R2 values for CBF vs. CMRO2, CBF vs. rCCO, and CMRO2 vs. rCCO were 0.996, 0.962, and 0.915, respectively. The mean γ values for these relationships were 0.739, 3.197 and 3.661, respectively.
Applsci 15 01542 g007
Table 1. Power law fit R2, power law γ means ± standard deviations, t-test p-Values, and statistical power for relationships between rCCO and CMRO2, CBF and CMRO2, and rCCO and CBF during CA. Bold font indicates statistically significant results (p < 0.05).
Relationship/ParameterR2γp-Value (γ ≠ 1)Power
CMRO2 vs. rCCO0.981 ± 0.0570.497 ± 0.1690.000100%
CBF vs. rCCO0.980 ± 0.0380.429 ± 0.1570.000100%
CBF vs. CMRO20.998 ± 0.0030.939 ± 0.2220.42817.6%
Table 2. Mean and standard deviation values of power law exponent γ for CMRO2 vs. rCCO, CBF vs. rCCO, and CBF vs. CMRO2 across two ischemic zones during cardiac arrest. Zone I represents ≈70% reduction in blood flow relative to baseline, while zone II corresponds to 60% to 100% reduction. Bold font indicates statistically significant results (p < 0.05).
Relationship/ParameterR2γp-Value (γ ≠ 1)
Zone ICMRO2 vs. rCCO0.986 ± 0.1580.618 ± 0.2770.070
CBF vs. rCCO0.989 ± 0.2530.569 ± 0.3560.031
CBF vs. CMRO20.996 ± 0.0050.975 ± 0.3390.813
Zone IICMRO2 vs. rCCO0.974 ± 0.1470.787 ± 0.3880.135
CBF vs. rCCO0.961 ± 0.1120.681 ± 0.3500.023
CBF vs. CMRO20.998 ± 0.0111.000 ± 0.3140.999
Table 3. Power law fit R2 and power law γ means ± standard deviations for relationships between rCCO and CMRO2, CBF and CMRO2, and rCCO and CBF during CPR.
Relationship/ParameterR2γp-Value (γ ≠ 1)p-Value (γ ≠ 0)
CMRO2 vs. rCCO0.681± 0.1372.573 ± 1.6080.0800.016
CBF vs. rCCO0.694 ± 0.2042.562 ± 1.6280.0840.017
CBF vs. CMRO20.996 ± 0.0280.984 ± 0.1540.8310.000
Disclaimer/Publisher’s Note: The statements, opinions and data contained in all publications are solely those of the individual author(s) and contributor(s) and not of MDPI and/or the editor(s). MDPI and/or the editor(s) disclaim responsibility for any injury to people or property resulting from any ideas, methods, instructions or products referred to in the content.

