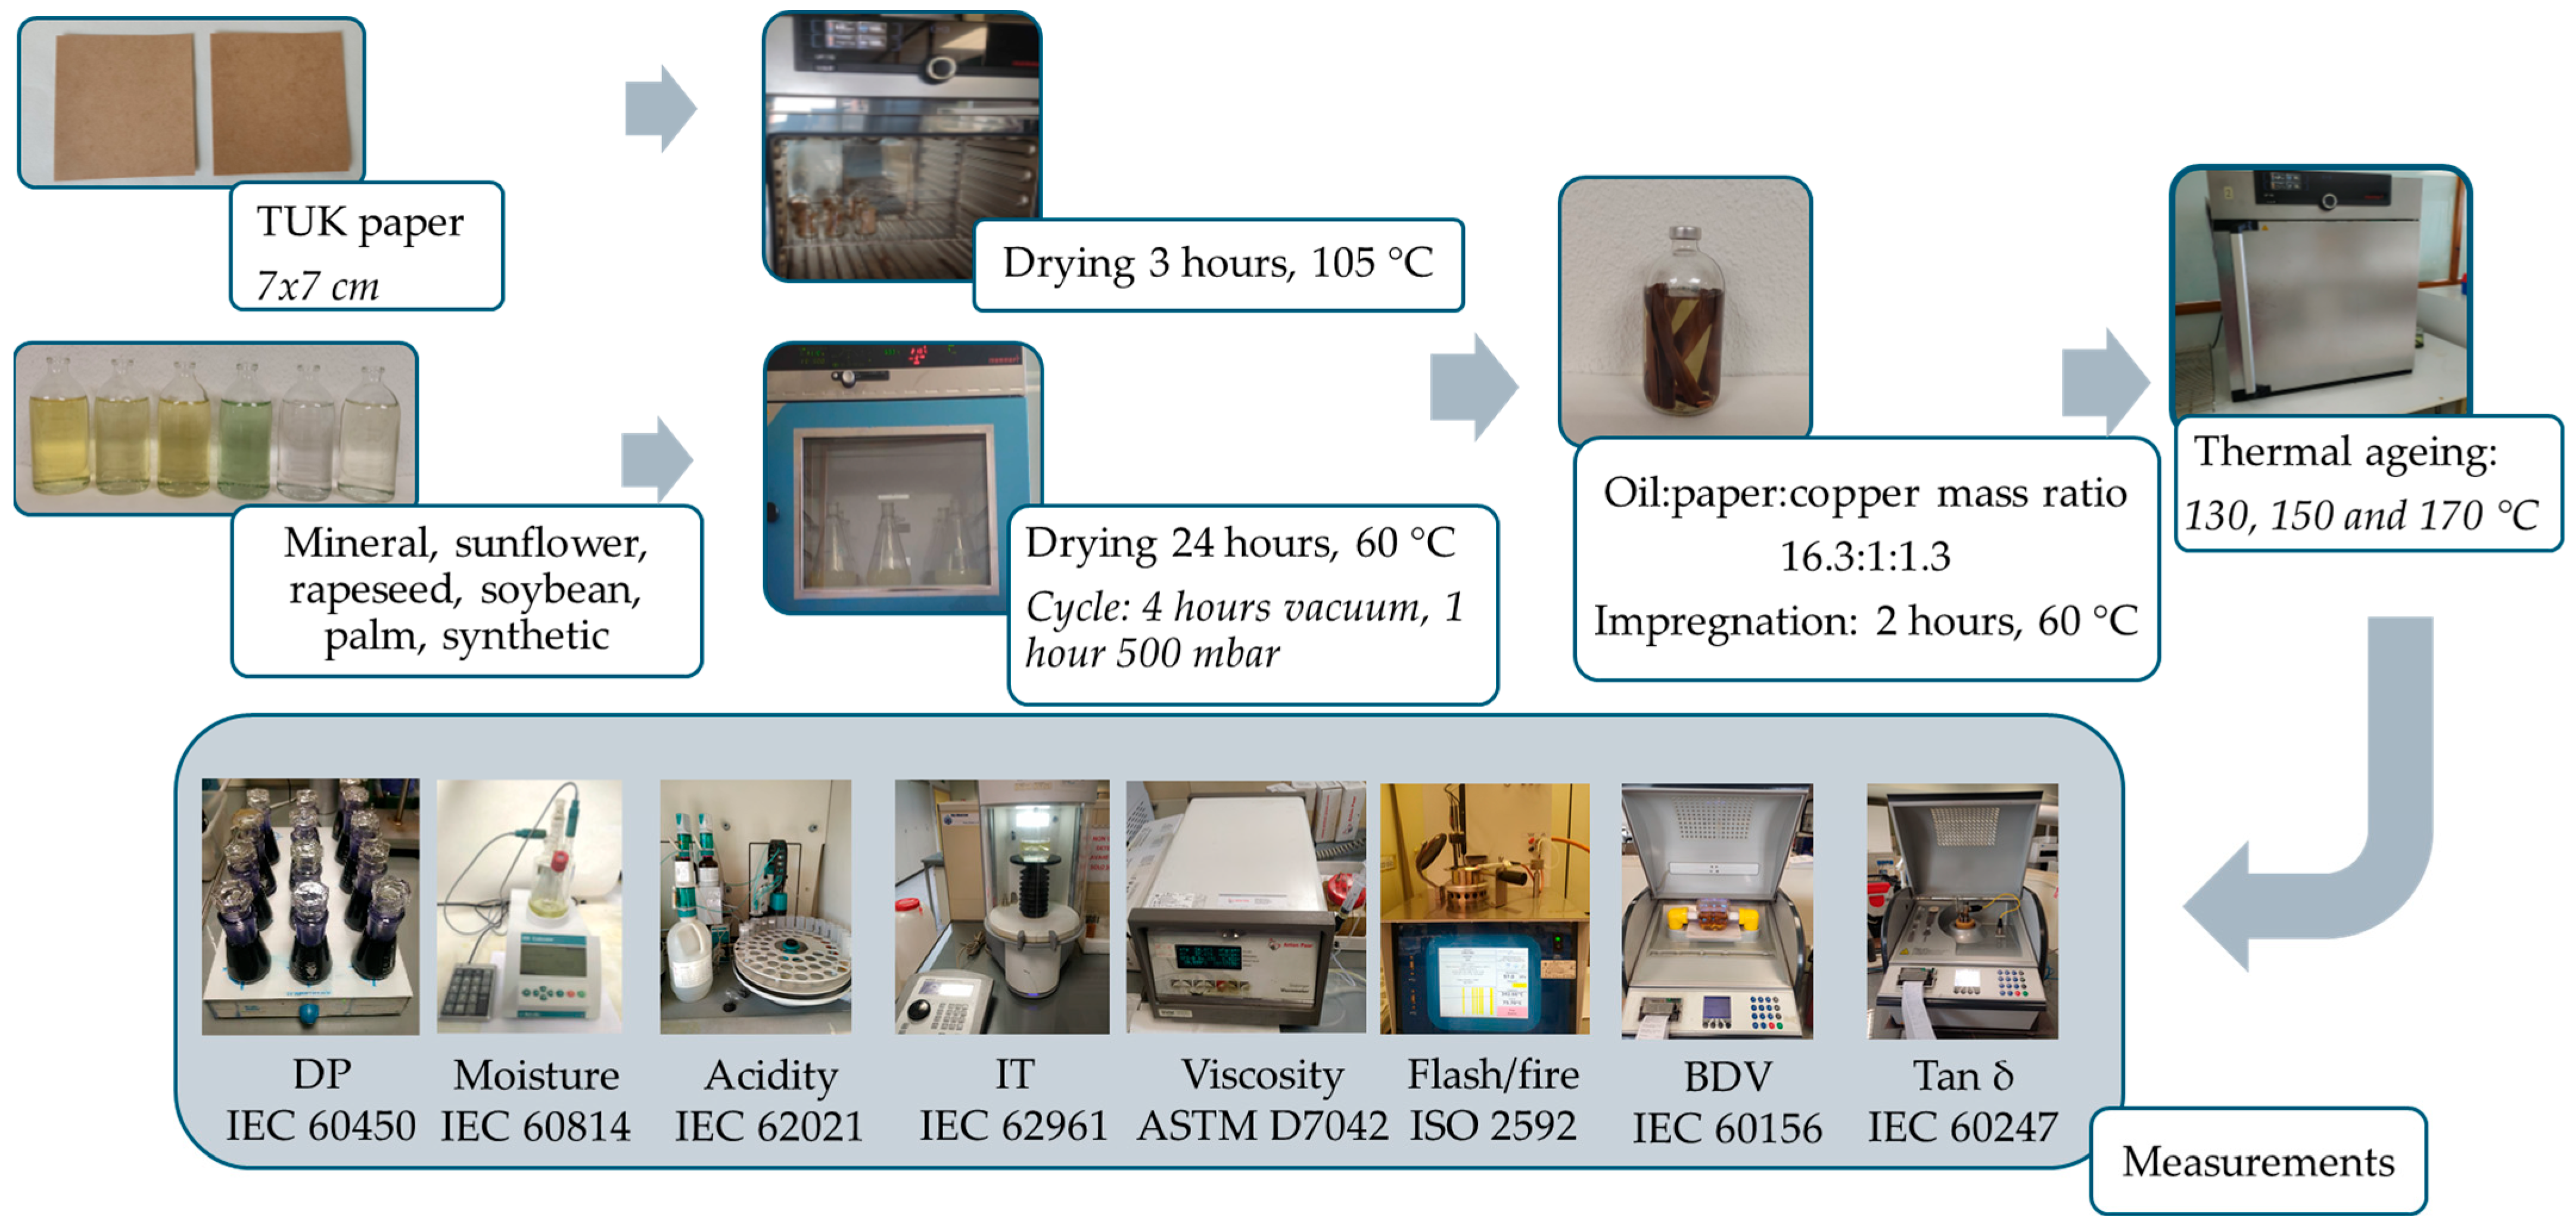
1. Introduction
The growing demand for electricity and the push toward decarbonisation are driving major changes in power system infrastructure [
1,
2], including a transition toward more sustainable materials in transformer design [
3,
4]. Cellulosic materials play a central role in transformer insulation systems, where they are employed both to insulate the windings and to create channels that facilitate cooling [
5]. Different types of papers are used depending on the functional requirements: kraft paper, the most widely applied, is generally used for standard insulation [
6]; thermally upgraded kraft (TUK) paper is employed in specific applications or hot-spot areas due to its enhanced thermal stability [
7]; crepe paper is selected where greater elasticity and flexibility are needed [
8]; and presspaper is applied in regions subject to higher mechanical stress [
9].
Moreover, liquid-immersed transformers, which are widely used in medium and high voltage applications, rely on insulating fluids to perform both cooling and electrical insulation functions [
10]. Traditionally, mineral oils (MO) have been the standard choice due to their availability, low cost, and satisfactory dielectric performance [
11,
12]. However, their low biodegradability and relatively low fire points pose significant environmental and safety risks, especially in the event of leaks or failures [
13]. This has prompted increasing interest in alternative insulating ester fluids (EF)—particularly natural and synthetic—which offer improved fire safety and environmental performance [
14].
Natural esters (NE), derived from vegetable oils, are composed primarily of triglycerides [
15], and are highly biodegradable. They exhibit high fire points [
16,
17], and can absorb more moisture than MO without compromising their dielectric strength [
18]. Synthetic esters (SE), on the other hand, are obtained from specific combinations of fatty acids and alcohols [
19], offering improved oxidation stability and long-term performance in controlled environments [
3,
18]. Both types of EF present an attractive alternative for use in distribution and power transformers, and their application has been growing over the past two decades [
20,
21].
Despite their advantages, the adoption of EF is still limited by uncertainties regarding their long-term ageing behaviour [
22], and their interaction with other materials in the insulation system [
23,
24], particularly the solid insulation. This component ultimately determines the unit’s lifetime, since it cannot be replaced once the transformer is built [
6]. Therefore, understanding how EF influence the degradation rate of paper under thermal stress is critical. Additionally, many operational and diagnostic criteria used for condition assessment and maintenance planning are based on the analysis of a set of properties, regarding the experience with MO [
25], with the application of interpretation and limit values that are not necessarily suitable for EF-filled systems. For these, any criteria, even the representative properties themselves, should be reconsidered, to avoid misleading interpretations.
A significant body of research has been conducted to understand the ageing of EF under thermal and oxidative stress [
3,
14,
26]. Studies have evaluated their chemical stability, dielectric behaviour, and compatibility with cellulose, but they have been carried out under varying experimental conditions in terms of temperature, humidity, presence of oxygen or metal catalysts, and types of paper used [
23,
27,
28,
29,
30]. This lack of standardisation makes it difficult to compare results across studies and to draw general conclusions about the relative performance of different EF.
Furthermore, another limitation in the existing literature is the lack of comparative studies involving several EF under identical and well-controlled ageing conditions. In fact, more than 90% of the available literature focuses on one or two fluids at a time [
31]. However, while EF are often grouped together in discussions [
32], they can differ significantly depending on their origin, composition, and processing. NE, for instance, may vary in their content of unsaturated fatty acids depending on the feedstock (e.g., sunflower, rapeseed, soybean, or palm) [
10,
18], leading to differences in oxidation stability and fluid behaviour [
33]. SE also show variation depending on their molecular structure and formulation [
19]. Without side-by-side comparisons, it is difficult for transformer designers and asset managers to make informed decisions on fluid selection and maintenance strategies.
In this sense, although some studies have explored the degradation of cellulose in EF environments, the correlation between fluid ageing indicators (such as acidity or moisture content) and actual degradation of the paper is not always clear. Some EF show increases in acidity or moisture over time that would be considered critical, yet without significant negative effects on the paper’s degree of polymerisation (DP) or mechanical integrity [
34]. This disconnect raises questions about the validity of applying MO-based maintenance standards—such as those defined in IEC 60422 [
25] or IEEE C57.106 [
35]—to EF-filled transformers. However, little attention has been paid in previous work to how the fluids’ composition affects its classification under current diagnostic frameworks. Properties such as acidity, dielectric dissipation factor, and breakdown voltage are often used to assess fluid health, but their thresholds may not be appropriate for all the EF [
33]. Current standards treat all EF as a single group and recommend very conservative limit values, those set in IEC 62975 [
36] and IEC 61203 [
37], that may lead to premature interventions or incorrect diagnoses.
In light of these limitations, there is a clear need for comparative studies of EF that address the degradation of both the solid and the liquid insulation, using consistent methodologies and including an assessment of how current standards apply. While a previous study [
38] focused on the comparison of kraft and TUK papers impregnated with different dielectric fluids aged at 150 °C, the present work further investigates the behaviour of TUK paper impregnated with various fluids aged at three constant temperatures and includes analysis in accordance with current standards providing a more comprehensive assessment of its performance. The novelty of this study lies in the simultaneous analysis of TUK paper aged with five EF—four NE of different origins, including a palm ester modified to a monoester to improve its properties, and one SE—while using MO as a benchmark, at three representative temperatures (130 °C, 150 °C, and 170 °C). The degradation of the solid and liquid insulation was assessed through the DP of the TUK paper and the measurement of the main chemical (moisture, acidity), physical (interfacial tension (IT), viscosity, and flash and fire points), and dielectric (breakdown voltage (BDV), dissipation factor (tan δ)) properties of the fluids, all interpreted with respect to the maintenance standards—IEC 60422 for MO, IEC 62975 for NE, and IEC 61203 for SE. This experimental design not only enables a rigorous evaluation of how fluid origin influences both paper degradation and fluid behaviour under well-controlled conditions but also provides critical evidence to determine whether current diagnostic criteria adequately reflect the actual ageing state of EF-filled systems.
3. Results and Discussion
This section presents the outcomes of the accelerated ageing tests, focusing on both the degradation of the paper and the evolution of the fluid properties. The results are analysed in terms of chemical, physical, and dielectric changes, and are discussed with reference to relevant standards and the implications for transformer insulation performance.
3.1. Polymerisation Degree
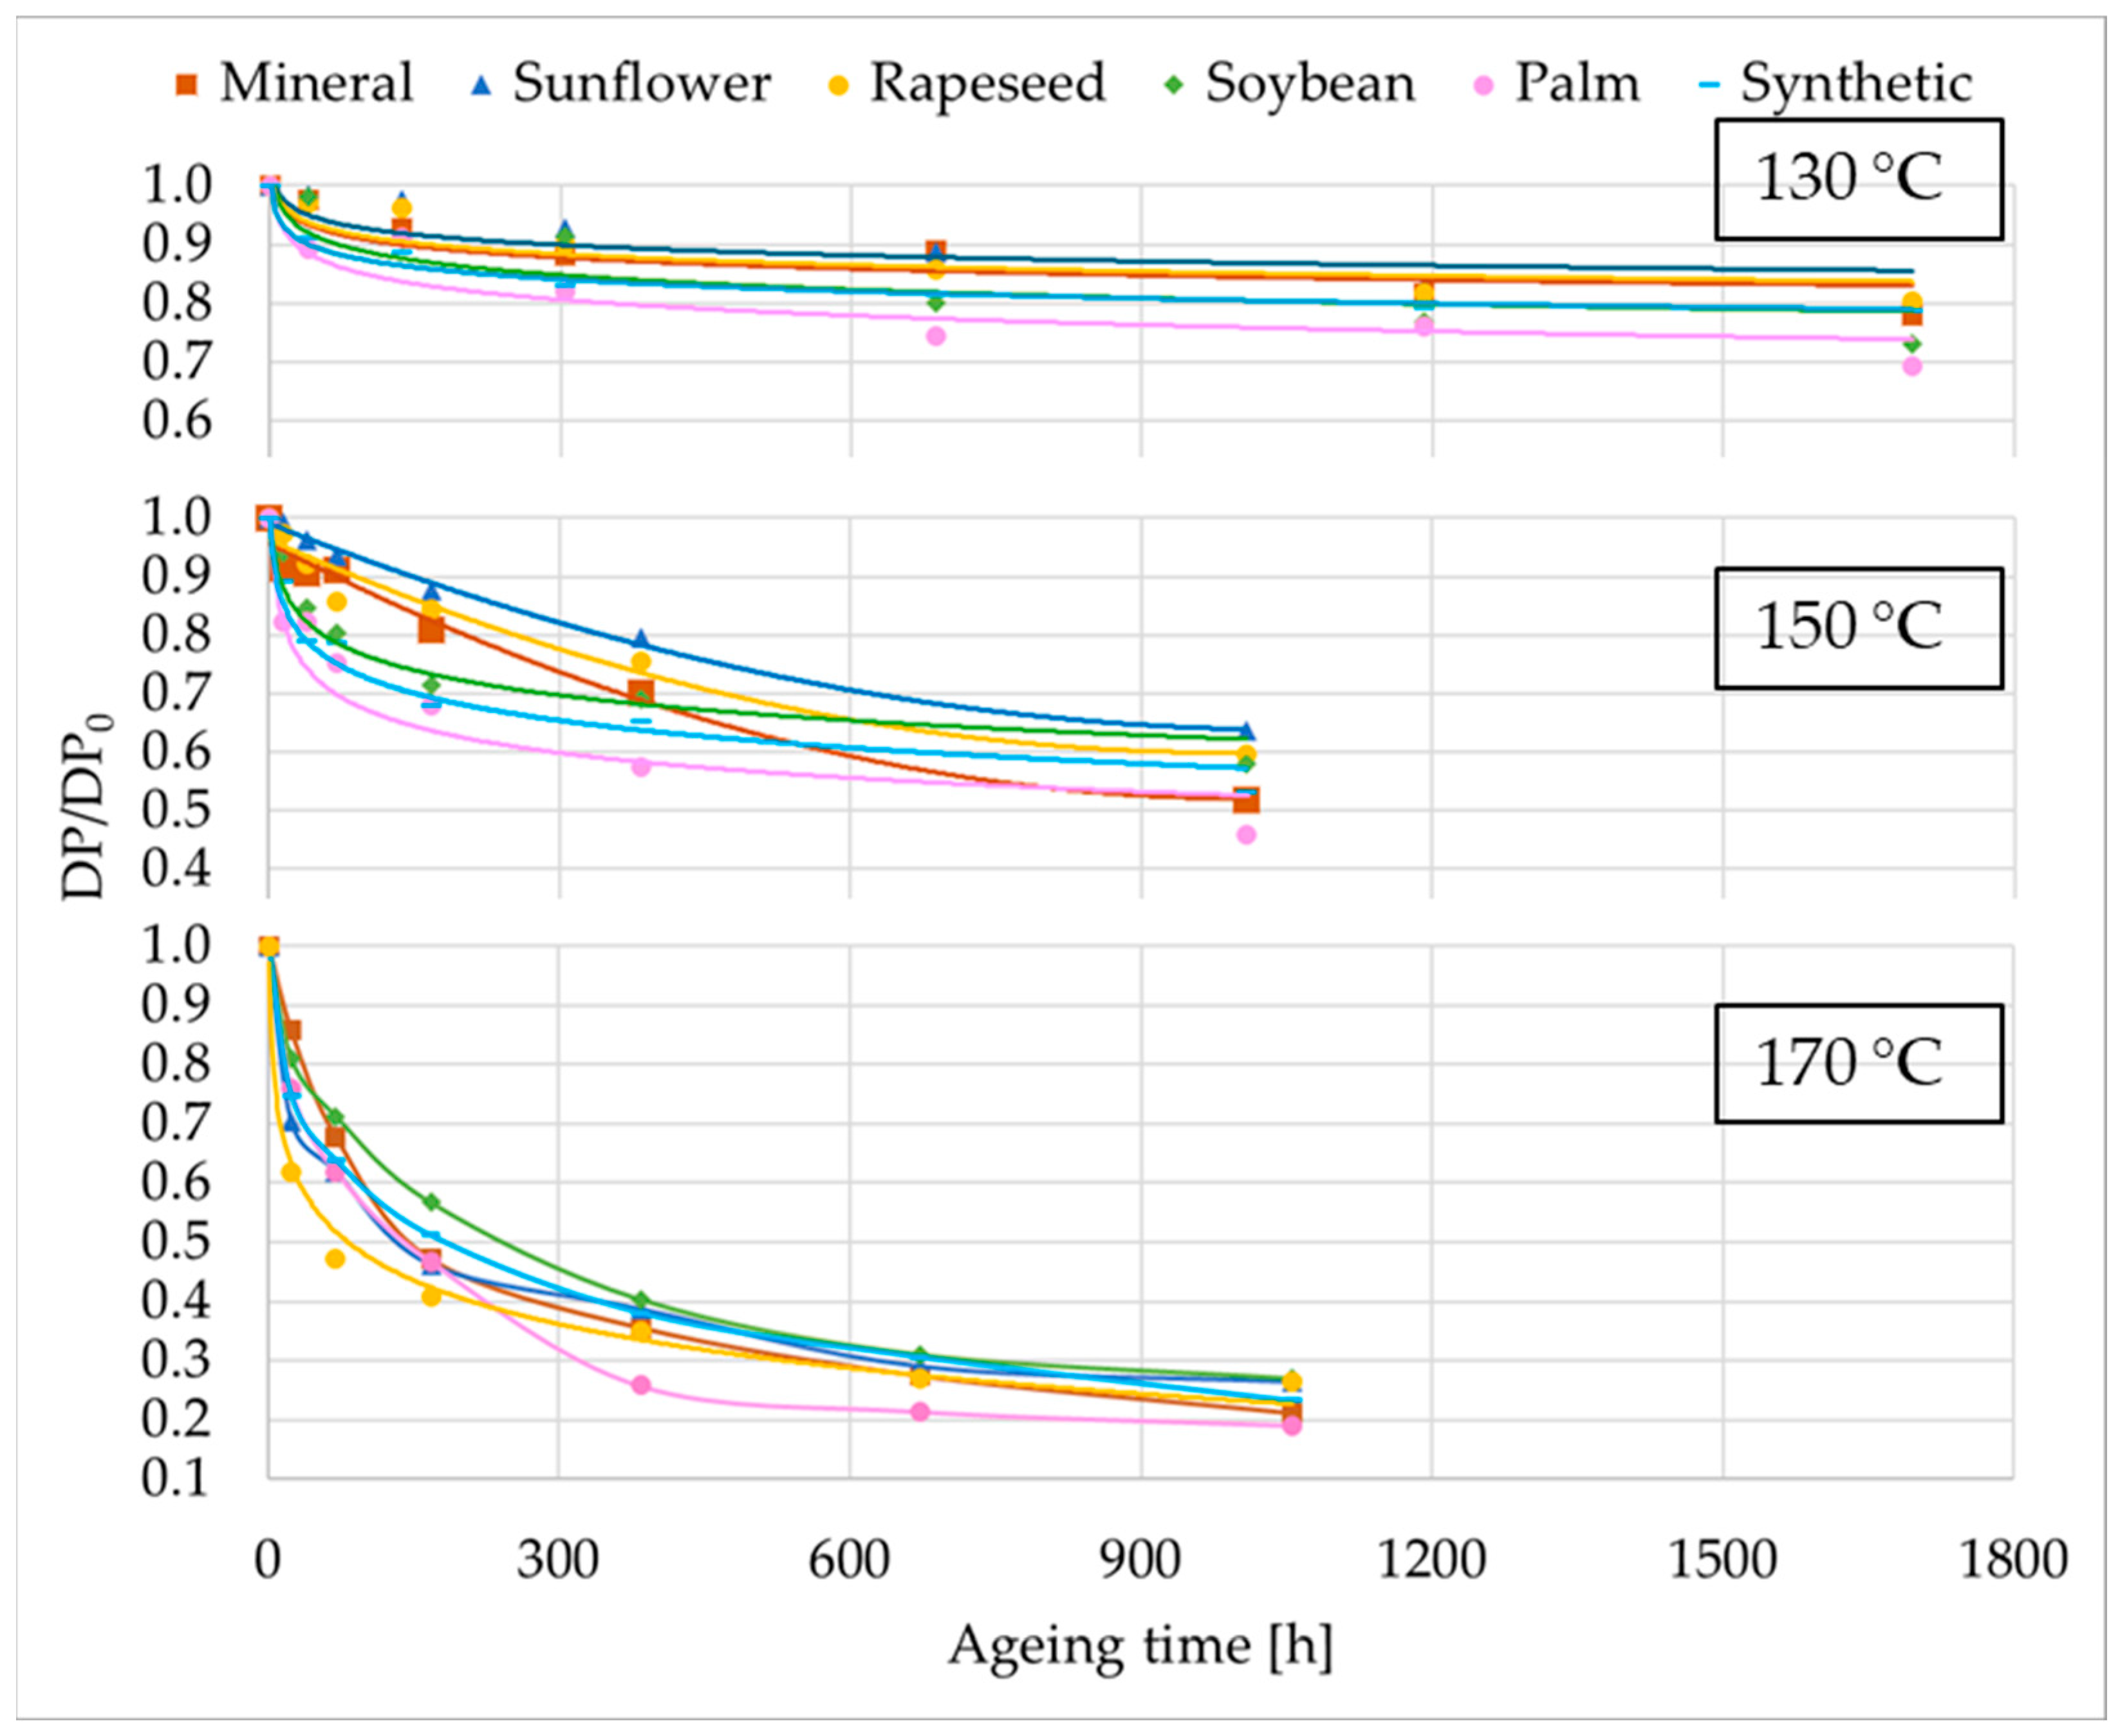
The evolution of the relative DP of the TUK paper impregnated with different dielectric fluids is shown in
Figure 2 (and see
Appendix A). The initial DP (DP
0) of the TUK paper was 1100. Its ageing behaviour was characterised by an initial rapid decrease in the DP, followed by a slower degradation rate, following a logarithmic trend observed at all temperatures, although at 130 °C stabilization occurs very early. Thermal stress played a decisive role: for a given duration, the degradation rate tripled for every 20 °C increase in temperature.
In the EF samples, TUK paper degradation was lower than in MO, except for palm NE. The three unmodified NE showed nearly identical ageing profiles for the TUK paper, providing consistent protection to this insulating material and resulting in comparable final DP values. This uniform behaviour supports their suitability for preserving the paper under thermal stress, in line with previous research [
30,
58]. Conversely, the most severe degradation was observed in TUK samples impregnated with palm ester, where DP values were the lowest across all conditions. The SE also demonstrated good compatibility with this cellulosic material, though with slightly lower DP values than the unmodified NE. Still, it outperformed both palm ester and MO in maintaining paper integrity, as was also observed in [
59].
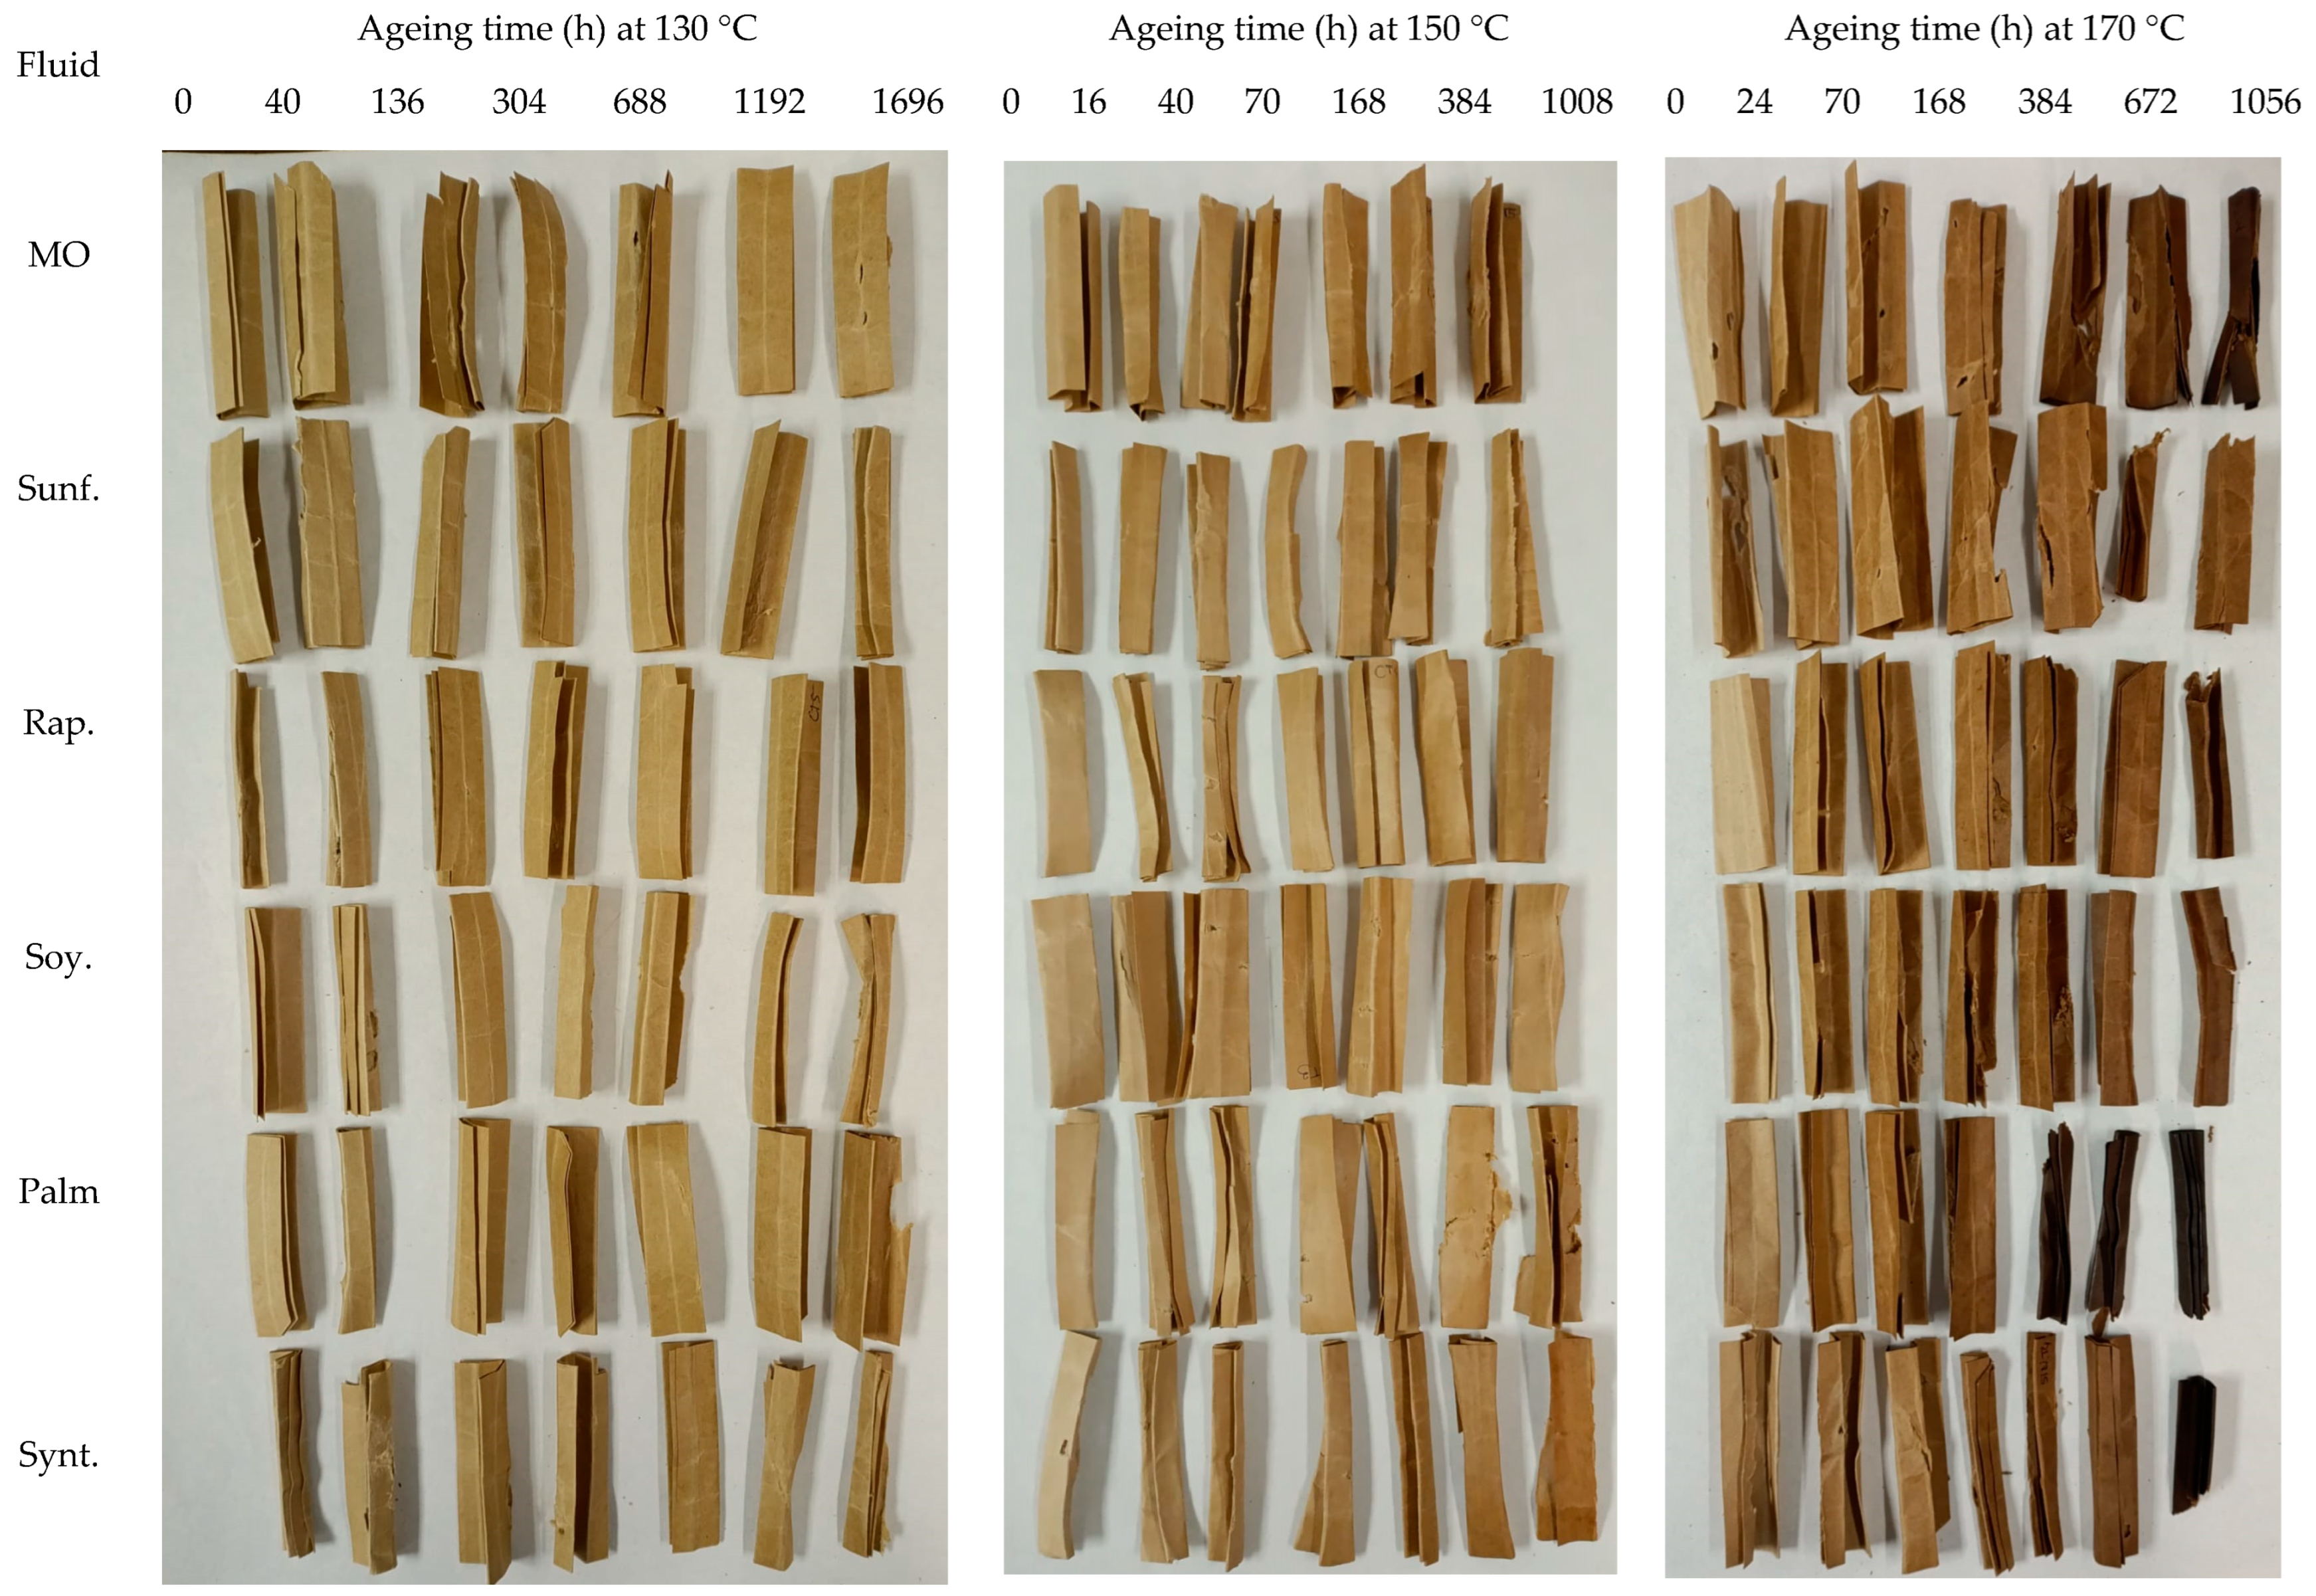
In the TUK paper samples aged with palm ester, a white residue appeared in the fluid after prolonged ageing (e.g., 1008 h at 150 °C), indicating excessive hydrolysis. This residue, only observed in this materials’ combination at 150 °C and 170 °C, points to a temperature-dependent degradation mechanism.
These results highlight that while the unmodified NE and SE generally preserve the structural integrity of TUK paper, the combination of palm ester with TUK may lead to accelerated degradation and unwanted by-products under elevated thermal stress.
3.2. Moisture Content
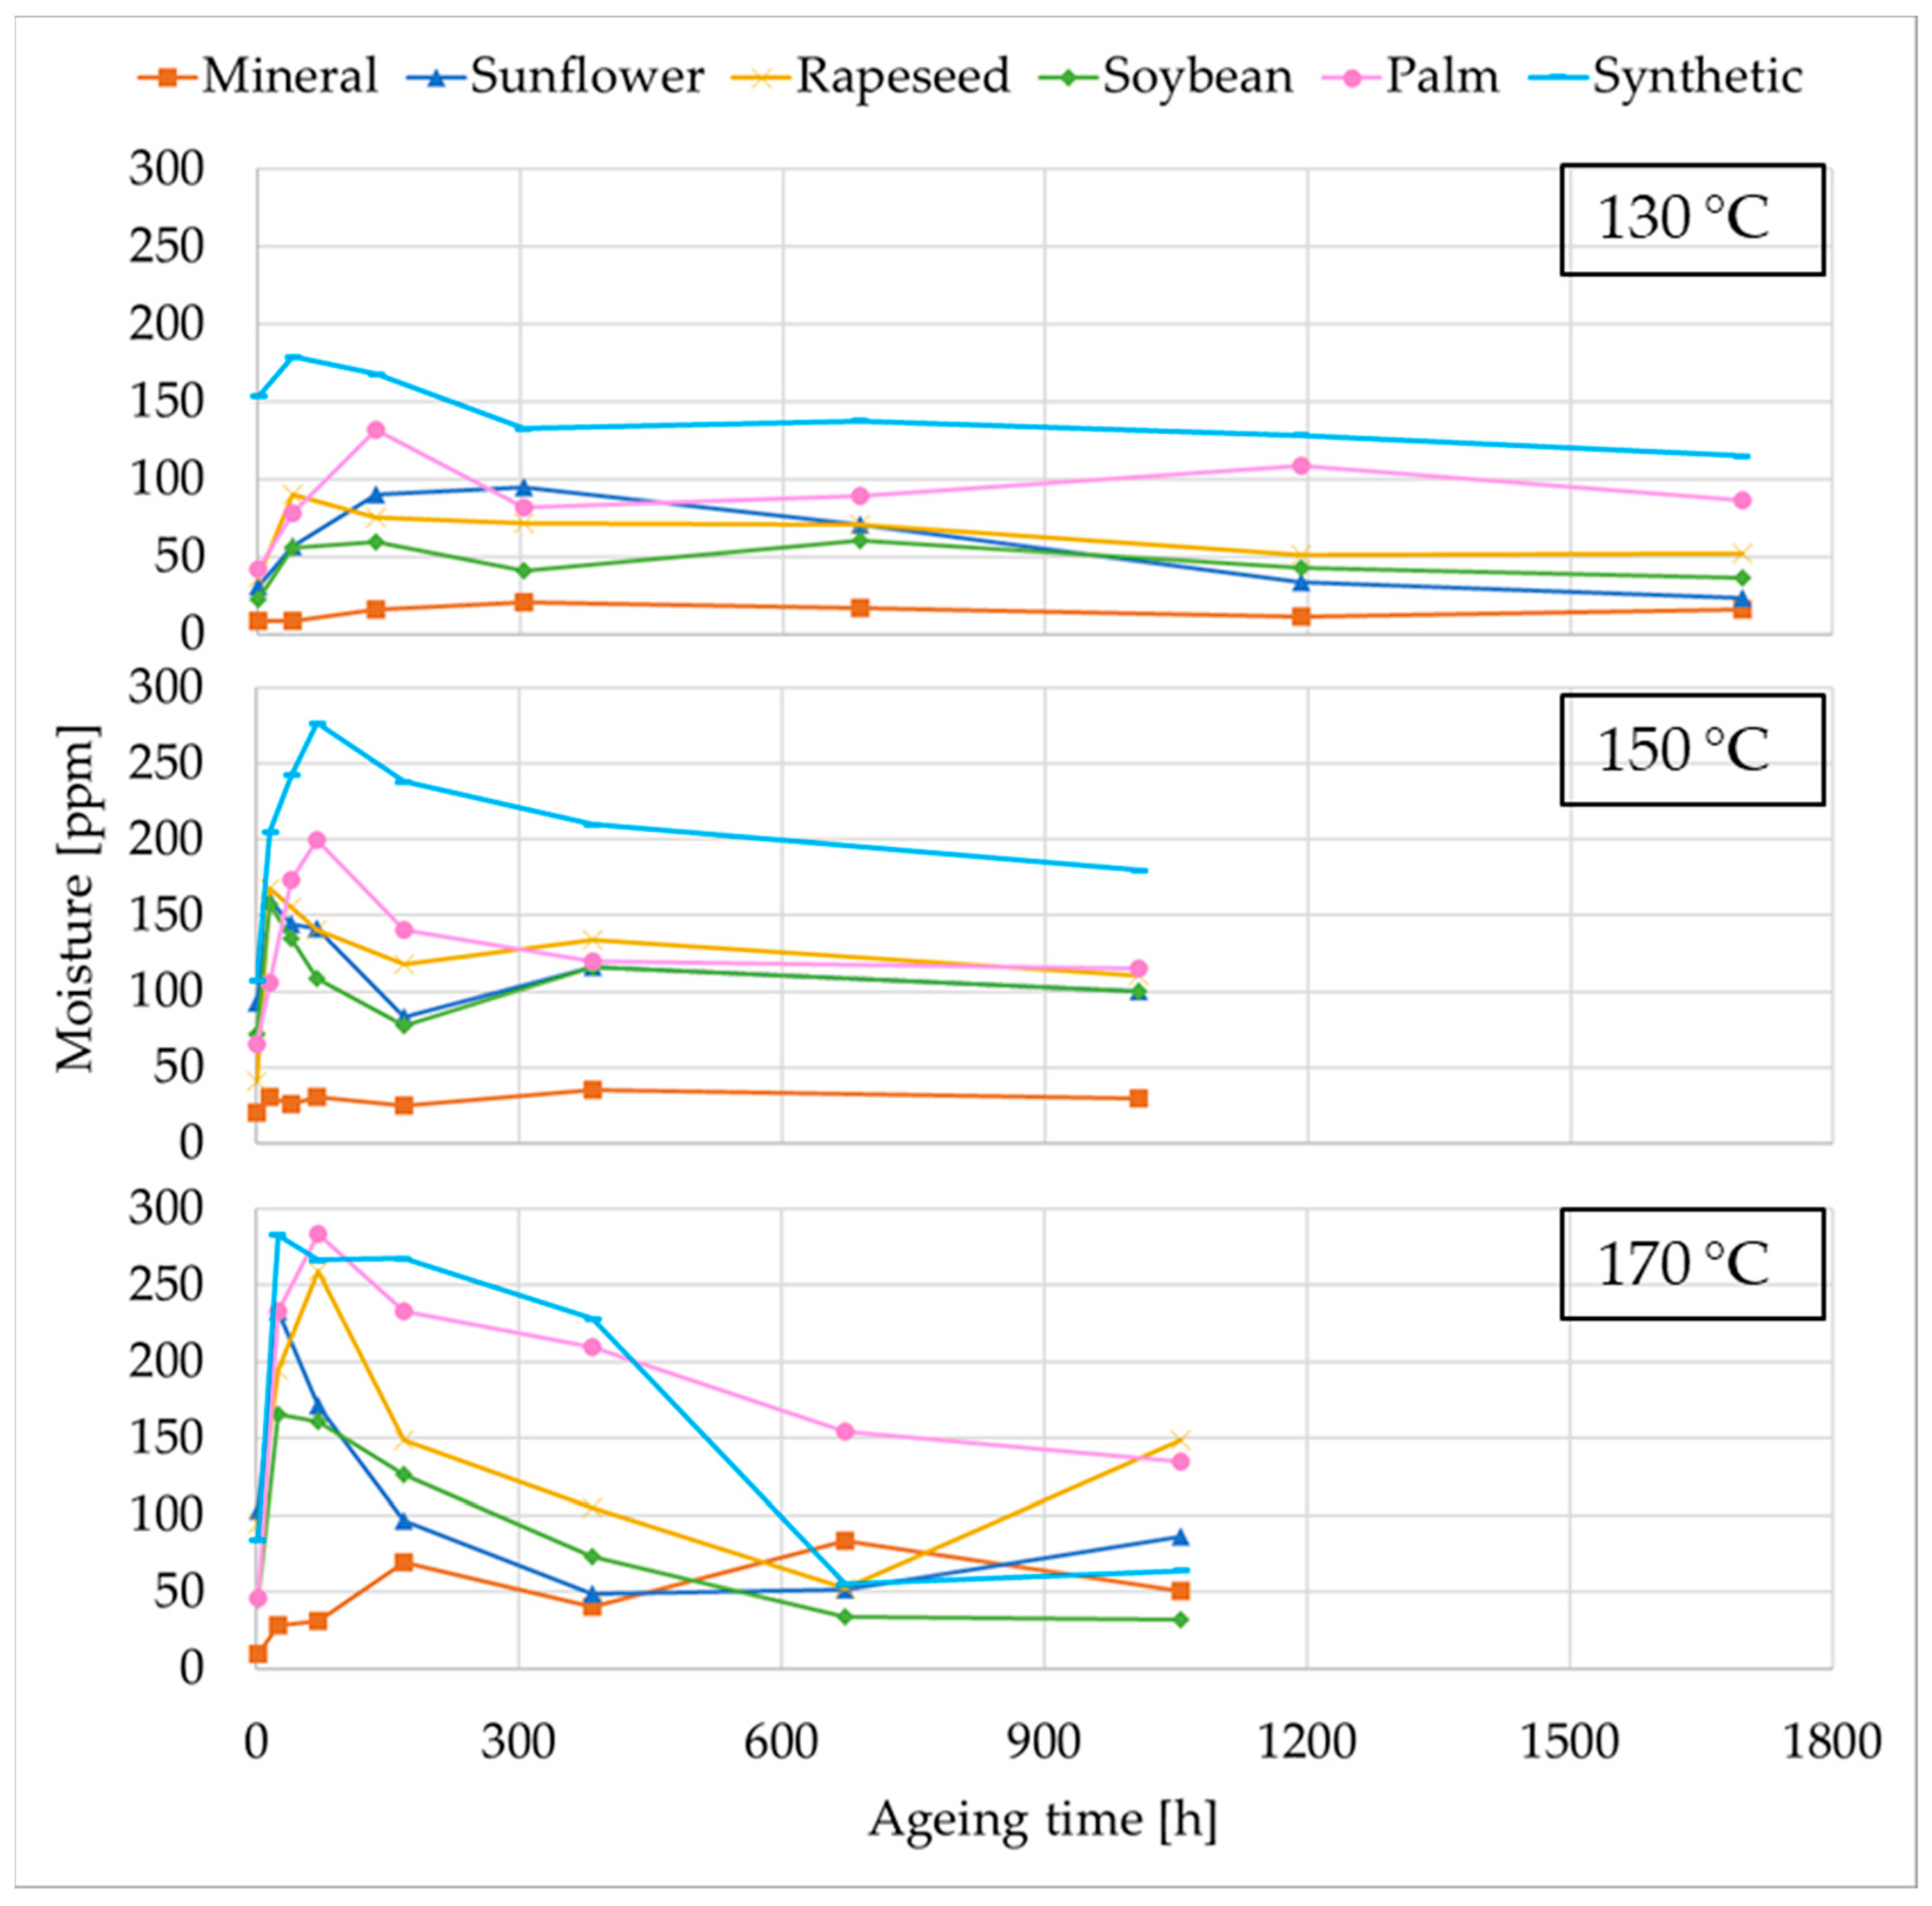
Figure 3 represents the evolution of moisture content in the insulating fluids during ageing. As can be observed, it showed distinct trends depending on the type of fluid and it was closely linked to the degradation of the TUK paper. The initial moisture contents of the dielectric fluids were as follows (in ppm): MO—20, sunflower—53.3, rapeseed—54.2, soybean—50.2, palm—56.9, and SE—107.2. In the EF, moisture levels increased significantly at the beginning of the ageing process. As this moisture was contained within the paper, the EF have a drying effect on this cellulosic material that helps mitigate its degradation. In contrast, in the MO the moisture content exhibits only a slight rise throughout the experiments. The initial rise in the EF, observed across all temperatures tested but to different extents—being larger at higher temperatures—reflects the early stage of intense TUK degradation. The initial rise in the EF, observed across all temperatures tested but at different extents, being larger at higher temperatures, reflects the early stage of intense TUK paper degradation, during which water is generated as a by-product of thermal and hydrolytic breakdown [
9,
29]. For example, in the sunflower ester, moisture increased from around 30 ppm to 100 ppm at 130 °C and up to 230 ppm at 170 °C; similar patterns were observed for the rapeseed and soybean esters, with initial values between 40–50 ppm rising to over 260 ppm at the highest temperature.
The three unmodified NE showed a clear decline in moisture content after the initial peak, returning to values close to or below the initial levels by the end of ageing. This reduction coincided with the stabilisation of TUK paper degradation, indicating a shift in the water balance of the system due to lower water generation and ongoing water consumption through hydrolysis reactions [
60,
61]. In contrast, the palm-based modified NE and the SE did not exhibit the same reduction, as their water content continued to increase or remained high for most of the ageing period, with only a slight decrease observed at the end of the test at 170 °C. This behaviour may be attributed to their higher chemical stability, which limits participation in hydrolysis reactions that consume water and generate high-molecular-weight acids [
19,
62]. In the unmodified NE, hydrolysis of triglycerides into glycerol and fatty acids likely contributed to water removal from the system.
The differences in moisture evolution are further explained by the distinct hydrophilic properties of the fluids. EF tend to draw water from the paper into the fluid phase, whereas MO retains more moisture within the cellulose matrix [
63,
64]. In EF, this migration facilitates the monitoring of moisture in the fluid as an indicator of early TUK paper degradation. As ageing progresses, a reduction in water generation—combined with its consumption through ongoing hydrolytic reactions in both fluid and paper—leads to stabilisation or reduction of system moisture, particularly in the unmodified NE. The reduction of free water availability could explain the superior performance of most of the EF in terms of paper degradation [
28].
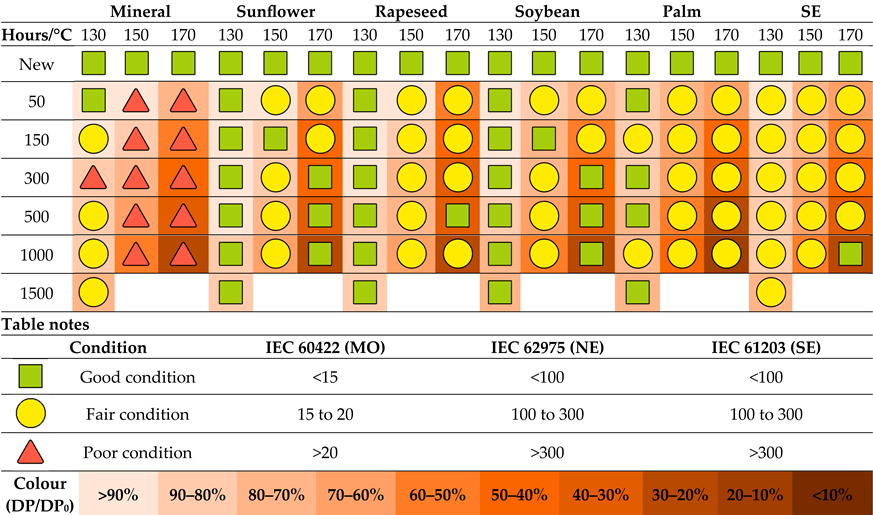
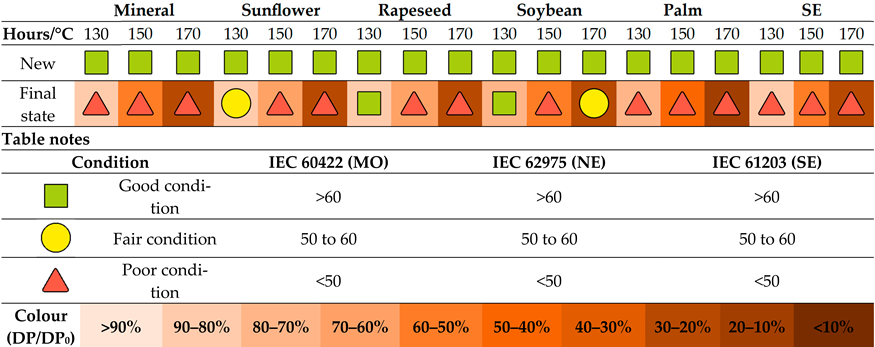
The interpretation according to the maintenance standards—IEC 62975 for NE, IEC 61203 for SE, and IEC 60422 for MO—is summarized in
Table 3. In this and in the following tables, the marker indicates the condition of each fluid property based on the threshold limits established in the corresponding standard: a green square represents
good, a yellow circle
fair, and a red triangle
poor. The limit values [ppm] defining these conditions are provided in the table notes. The background colour of the cells reflects the condition of the TUK paper, following the scale shown in the table notes.
It is important to highlight that
Table 3 and following report values at predetermined ageing times (50, 150, 300 h, etc.) obtained by linear interpolation of the experimental data, while the figures show the actual measurement points. This allows comparison between fluids at consistent time intervals, even when sampling times did not exactly coincide.
The table shows a clear influence of the test temperature on moisture content, which remained at adequate levels in the unmodified NE at 130 °C and at intermediate levels in the other fluids, worsening at higher temperatures. Furthermore, the EF standards exhibit a higher tolerance to moisture compared with the MO one, as they never reach poor levels.
As can be observed, the moisture content of the unmodified NE is considered regular from the beginning of the tests at 150 °C and 170 °C, as the water generated does not accumulate in the paper. Indeed, hydrolysis can be observed in the evaluation of the state of these fluids. At the start of ageing, a regular value is reached due to water generation, with part of it being accumulated and consumed by the fluid, without these being related to abnormal changes in other properties. Toward the end of the ageing process, a good state is recovered, since the rate of water generation is lower than that of consumption. In contrast, the severe degradation of the paper aged in MO and the lack of hydrolysis produced an increase in the moisture content that led to poor values in this fluid. In the case of the unmodified NE, the increase in moisture content is not associated with a loss of the fluid’s dielectric capabilities, and conversely, having good moisture levels is not indicative of a good overall condition of the liquid, as these appear when degradation is already very advanced. However, it is noticeable that, although all the fluids behaved similarly in terms of paper degradation and dielectric strength, the interpretation of the state based on moisture content differs considerably between them, suggesting that the standard is not equally appropriate for all fluids. Finally, in the palm NE and the SE, the moisture content level was considered as fair even at early stages of the degradation, but this did not have any effect on the paper degradation or on its dielectric capacity, so the standard could be too restrictive.
3.3. Acidity
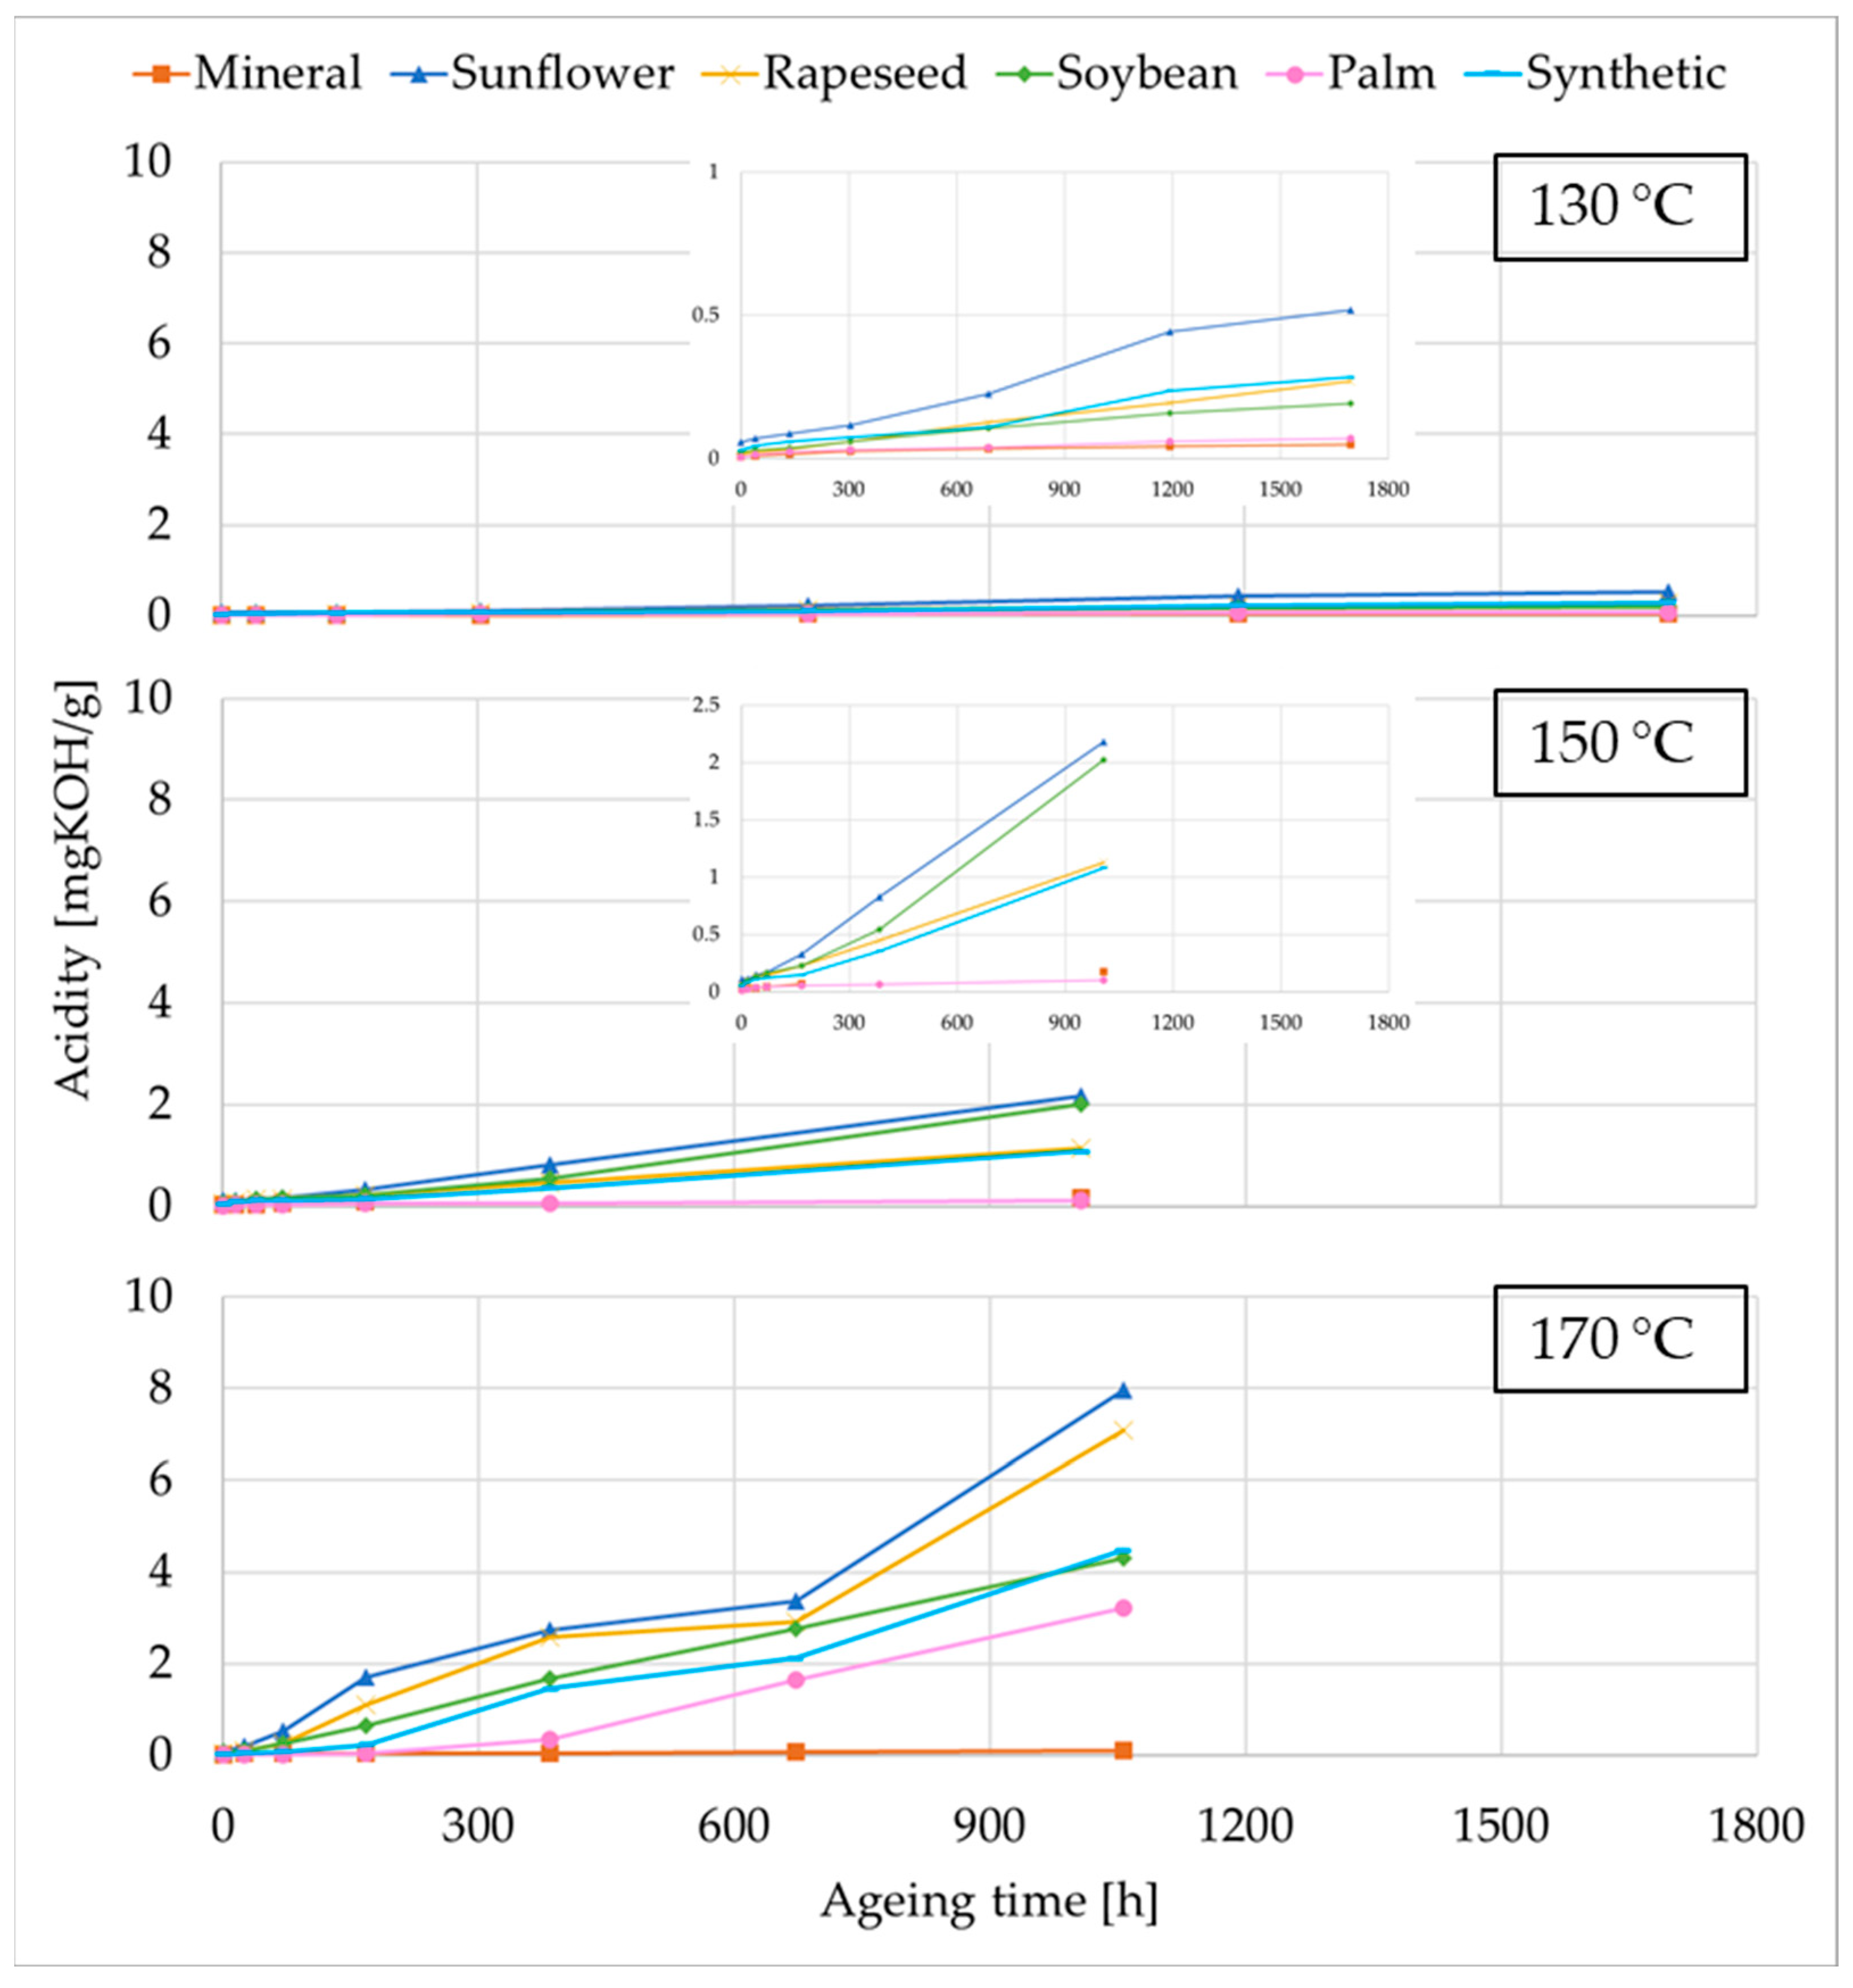
The acidity of all insulating fluids at different degradation states is shown in
Figure 4. This parameter increased during thermal ageing, although the magnitude and rate of this increase varied considerably between fluid types. In their unused state, all fluids exhibited very low acidity values (mg KOH/g), specifically 0.0107 for MO, 0.078 for sunflower NE, 0.0387 for rapeseed NE, 0.0477 for soybean NE, 0.0060 for palm NE, and 0.036 for SE.
As ageing progressed, acidity increased in all systems as a result of both fluid and TUK paper degradation. Acids are produced through oxidation and hydrolysis reactions affecting both the fluid and the cellulose [
8], and their presence may accelerate further degradation of the paper through acid-catalysed hydrolysis [
65].
Among all fluids tested, the unmodified NE had the highest initial acidity levels, ranging from 0.05 to 0.08 mg KOH/g. These elevated values are attributed to the presence of dissociable triglycerides in their molecular structure [
58,
66]. Moreover, they showed a significantly higher increase in acidity, especially in comparison with the MO, which showed the smallest increase in acidity, consistent with its inertness toward water and low susceptibility to oxidation. In contrast, the palm-based NE exhibited the lowest initial acidity value, similar to that of the MO, almost negligible (<0.02 mg KOH/g), due to their chemical stability, as explained in [
62]. Furthermore, it exhibited significantly lower increases than the other EF, indicating a limited contribution from fluid hydrolysis or oxidation [
62], except for the 170 °C test. The acidity of the SE, initially slightly lower than that of the unmodified NE, also increased during the tests, although to a lesser extent than in the NE.
The lower acidity of the palm-based NE and the SE agrees with the moisture content evolution, since they showed less hydrolysis than the unmodified NE. The high increase of the acidity in the unmodified NE is consistent with their dual contribution to acid formation: both fluid hydrolysis—due to their triglyceride-based structure—and oxidation processes actively generate acids [
67]. However, despite having similar moisture contents and paper degradation, the acid value differs from one ester to another, being lower in the soybean fluid.
Overall, the results show that while all fluids develop acidity during ageing, the source and impact vary. In the EF, acids mainly originate from fluid reactions and are typically long-chain fatty acids, which do not catalyse the hydrolysis and can even stabilise cellulose via transesterification reactions, as reported in [
8,
66], which agrees with the DP results. Based on this, the low acidity of the palm ester could explain the reduced protection of the paper showed in the DP. In contrast, the acidity in MO is largely due to cellulose hydrolysis, producing low-molecular-weight acids that can accelerate paper degradation. This distinction is key when interpreting acidity as a diagnostic indicator in ester-filled transformers.
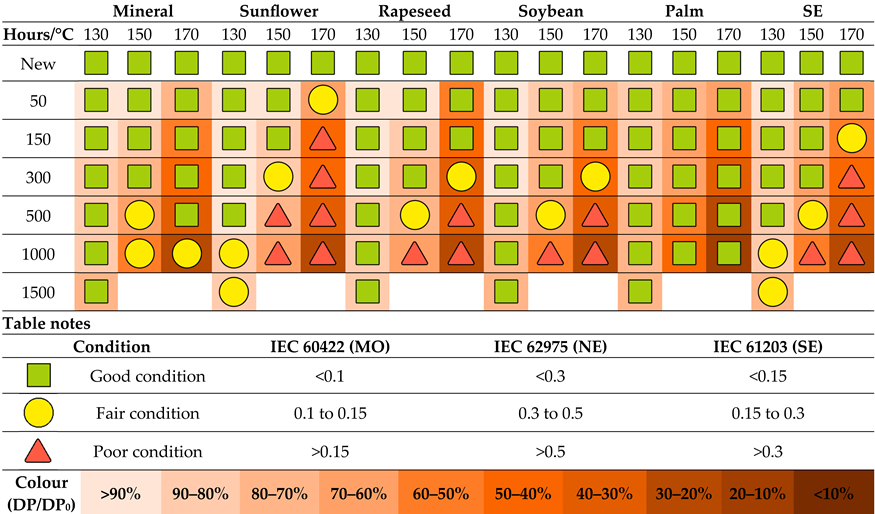
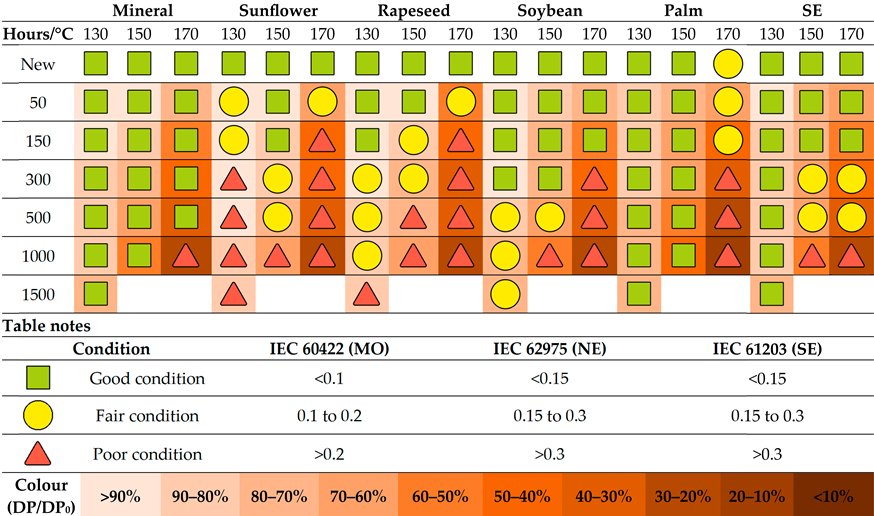
The interpretation of the acid number results according to the standard limits is summarized in
Table 4, with the corresponding threshold values [mg KOH/g] provided in the table notes. In this case, it is noteworthy that the acidity values are less restrictive than those for moisture. The unmodified NE showed a particularly poor performance, similar to the SE, and significantly worse than the MO. In contrast, the palm NE stands out, as its naturally low acidity always results in a good rating. In the case of the EF, in which the presence of acids is associated with hydrolysis and some TUK paper degradation, the state is generally considered good until the end of the ageing process, except for the 170 °C test. However, it is striking that the limits do not seem to be very well suited to sunflower NE, as its behaviour in all other properties is similar to that of soybean and rapeseed NE, yet its acidity reaches levels considered poor even at early stages of ageing. This highlights the potential need to take the specific characteristics of each ester into account in the standard. This also contrasts with the interpretation of mineral oil, in which the acids mainly originate from paper degradation. Considering that acidity does not affect the other fluid properties, its monitoring should serve to identify paper degradation and help protect it. However, even when the paper was significantly deteriorated, the MO standard’s interpretation failed to reflect this condition, with the limits being too permissive. In the case of the palm NE, its naturally low acidity leads to an interpretation under the standard as being in good condition. However, in this fluid, the acids largely originate from paper degradation, and at advanced ageing states, the standard-based interpretation does not allow the problem to be identified. Finally, in the SE, the standard limits appear to be more consistent with the extent of paper degradation.
3.4. Interfacial Tension
The IT of the insulating fluids is represented in
Figure 5 for each ageing temperature. As can be observed, this property decreased with the degradation, particularly in the early stages, reflecting the accumulation of polar degradation by-products in the system. Moreover, the reduction becomes more pronounced as the temperature increases. This parameter is strongly influenced by fluid polarity and the presence of polar contaminants [
68]. Due to their inherently higher polarity, all EF exhibited lower initial IT values compared to MO. The initial IT values [mN·m] were 34.2, 24.0, 24.1, 23.1, 33.5, and 20.8 for MO, sunflower, rapeseed, soybean, palm, and SE, respectively.
During the tests, all fluids experienced a decrease in the IT. The unmodified NE showed a decline—around 20%—highly consistent across all of them. The palm ester displayed similar behaviour to the unmodified NE at moderate temperatures. The SE showed remarkable stability, with only a minor decrease of around 5% throughout the ageing process with TUK, suggesting low generation of polar degradation compounds.
In any case, the reduction of IT was less pronounced in the EF than in MO, which reached up to a 45% decrease, particularly at higher temperatures, consistent with more rapid degradation.
The relatively lower IT reduction in NE can be attributed to the nature of the acids formed during ageing. While MO produces low-molecular-weight polar acids that strongly affect interfacial properties, NE generate mainly high-molecular-weight fatty acids, which are less polar and have a smaller impact on the IT [
9].
These results confirm that IT, although affected by ageing in all systems, evolves differently depending on the fluid’s chemical composition and degradation behaviour. In EF-filled systems, IT may therefore be less sensitive as a condition-monitoring indicator than in MO systems.
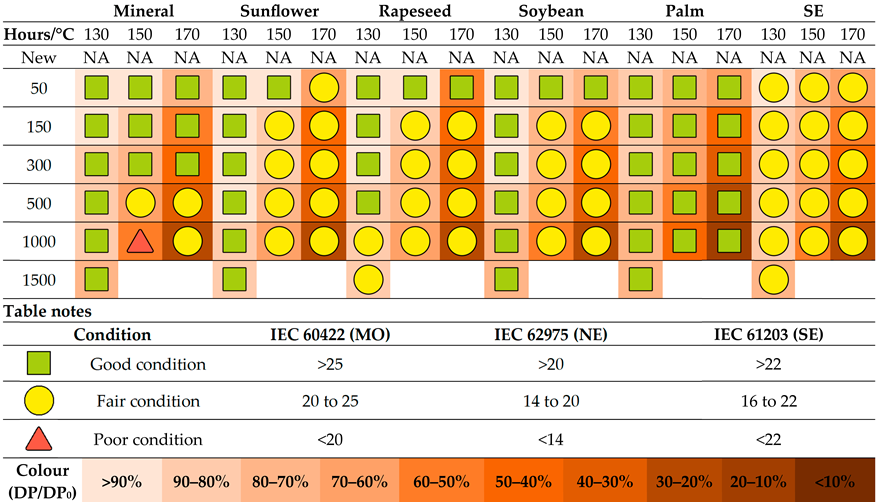
The evaluation of this property according to the maintenance standard is presented in
Table 5, including the limit values [mN·m] in the table notes. It is clearly observed that the unmodified NE, and particularly the SE, struggle to comply with the standard, whereas the palm ester consistently shows good levels. In contrast, for MO, the IT interpretation evolves in parallel with the degradation. The unmodified NE experienced a relatively significant change in IT, consistent with the standard limits and attributable to alterations in polarity, as it is also indicated by the tan δ (see
Section 3.8). The palm NE, due to its high IT, is considered as good during all the experiments, despite the increment of the loss factor. Finally, the SE stands out, as it is classified as fair in all tests and states, regardless of its actual degradation or dielectric strength. The limits established by the standard do not appear to be appropriate for assessing the condition of this particular fluid. All these results contrast with those obtained for MO, which, despite the high reduction of IT, is considered to be in good condition according to the standard. Moreover, a correspondence between acidity and IT would be expected, but this is not observed—either because the acidity limits are too permissive or the IT limits are too restrictive.
3.5. Viscosity
Viscosity is a critical property affecting the cooling performance of insulating fluids, as it directly influences fluid flow within the transformer tank. Since the viscosity did not change in the ageing tests carried out in this study,
Figure 6 only shows the viscosity of the fluids at the beginning and at the end of each experiment. It is noticeable that EF have higher viscosity than MO (9.8 mm
2/s), which is considered one of their main disadvantages. Among them, sunflower and rapeseed esters showed the highest viscosities–39.5 and 37.5 mm
2/s, respectively, while soybean ester exhibited a notably lower value, more precisely 33.3 mm
2/s. The palm-based ester, which is chemically modified to reduce viscosity, presented the lowest value, specifically 5 mm
2/s, making it particularly advantageous in terms of flow performance. The SE exhibits a relatively high viscosity—28.8 mm
2/s, closer to that of the unmodified NE.
During ageing, viscosity remained largely unchanged. Since the tests were conducted in sealed vials with limited oxygen availability, oxidative effects—which are known to influence viscosity—were minimal. Across all fluids, the variation in viscosity was below 1%, and no consistent effect of ageing temperature was observed, as it was also found in [
69,
70]. These results confirm that, under limited-oxidation conditions, viscosity is a stable property and does not serve as a reliable indicator of fluid degradation over time.
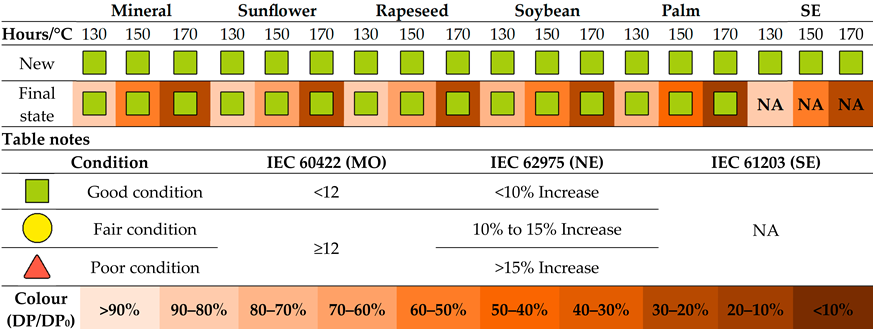
The analysis of viscosity in relation to the standards is summarised in
Table 6. The limit values at 40 °C [mm
2/s] are included in the table notes. In the case of NE, viscosity remained generally good throughout most of the tests, indicating low levels of oxidation, as it also occurred in the MO. It was only classified as fair in the final state of the 170 °C samples, due to some degradation of the sealing. For the SE, as fluid oxidation is limited, the standard does not consider viscosity a useful parameter for transformer monitoring.
3.6. Flash and Fire Points
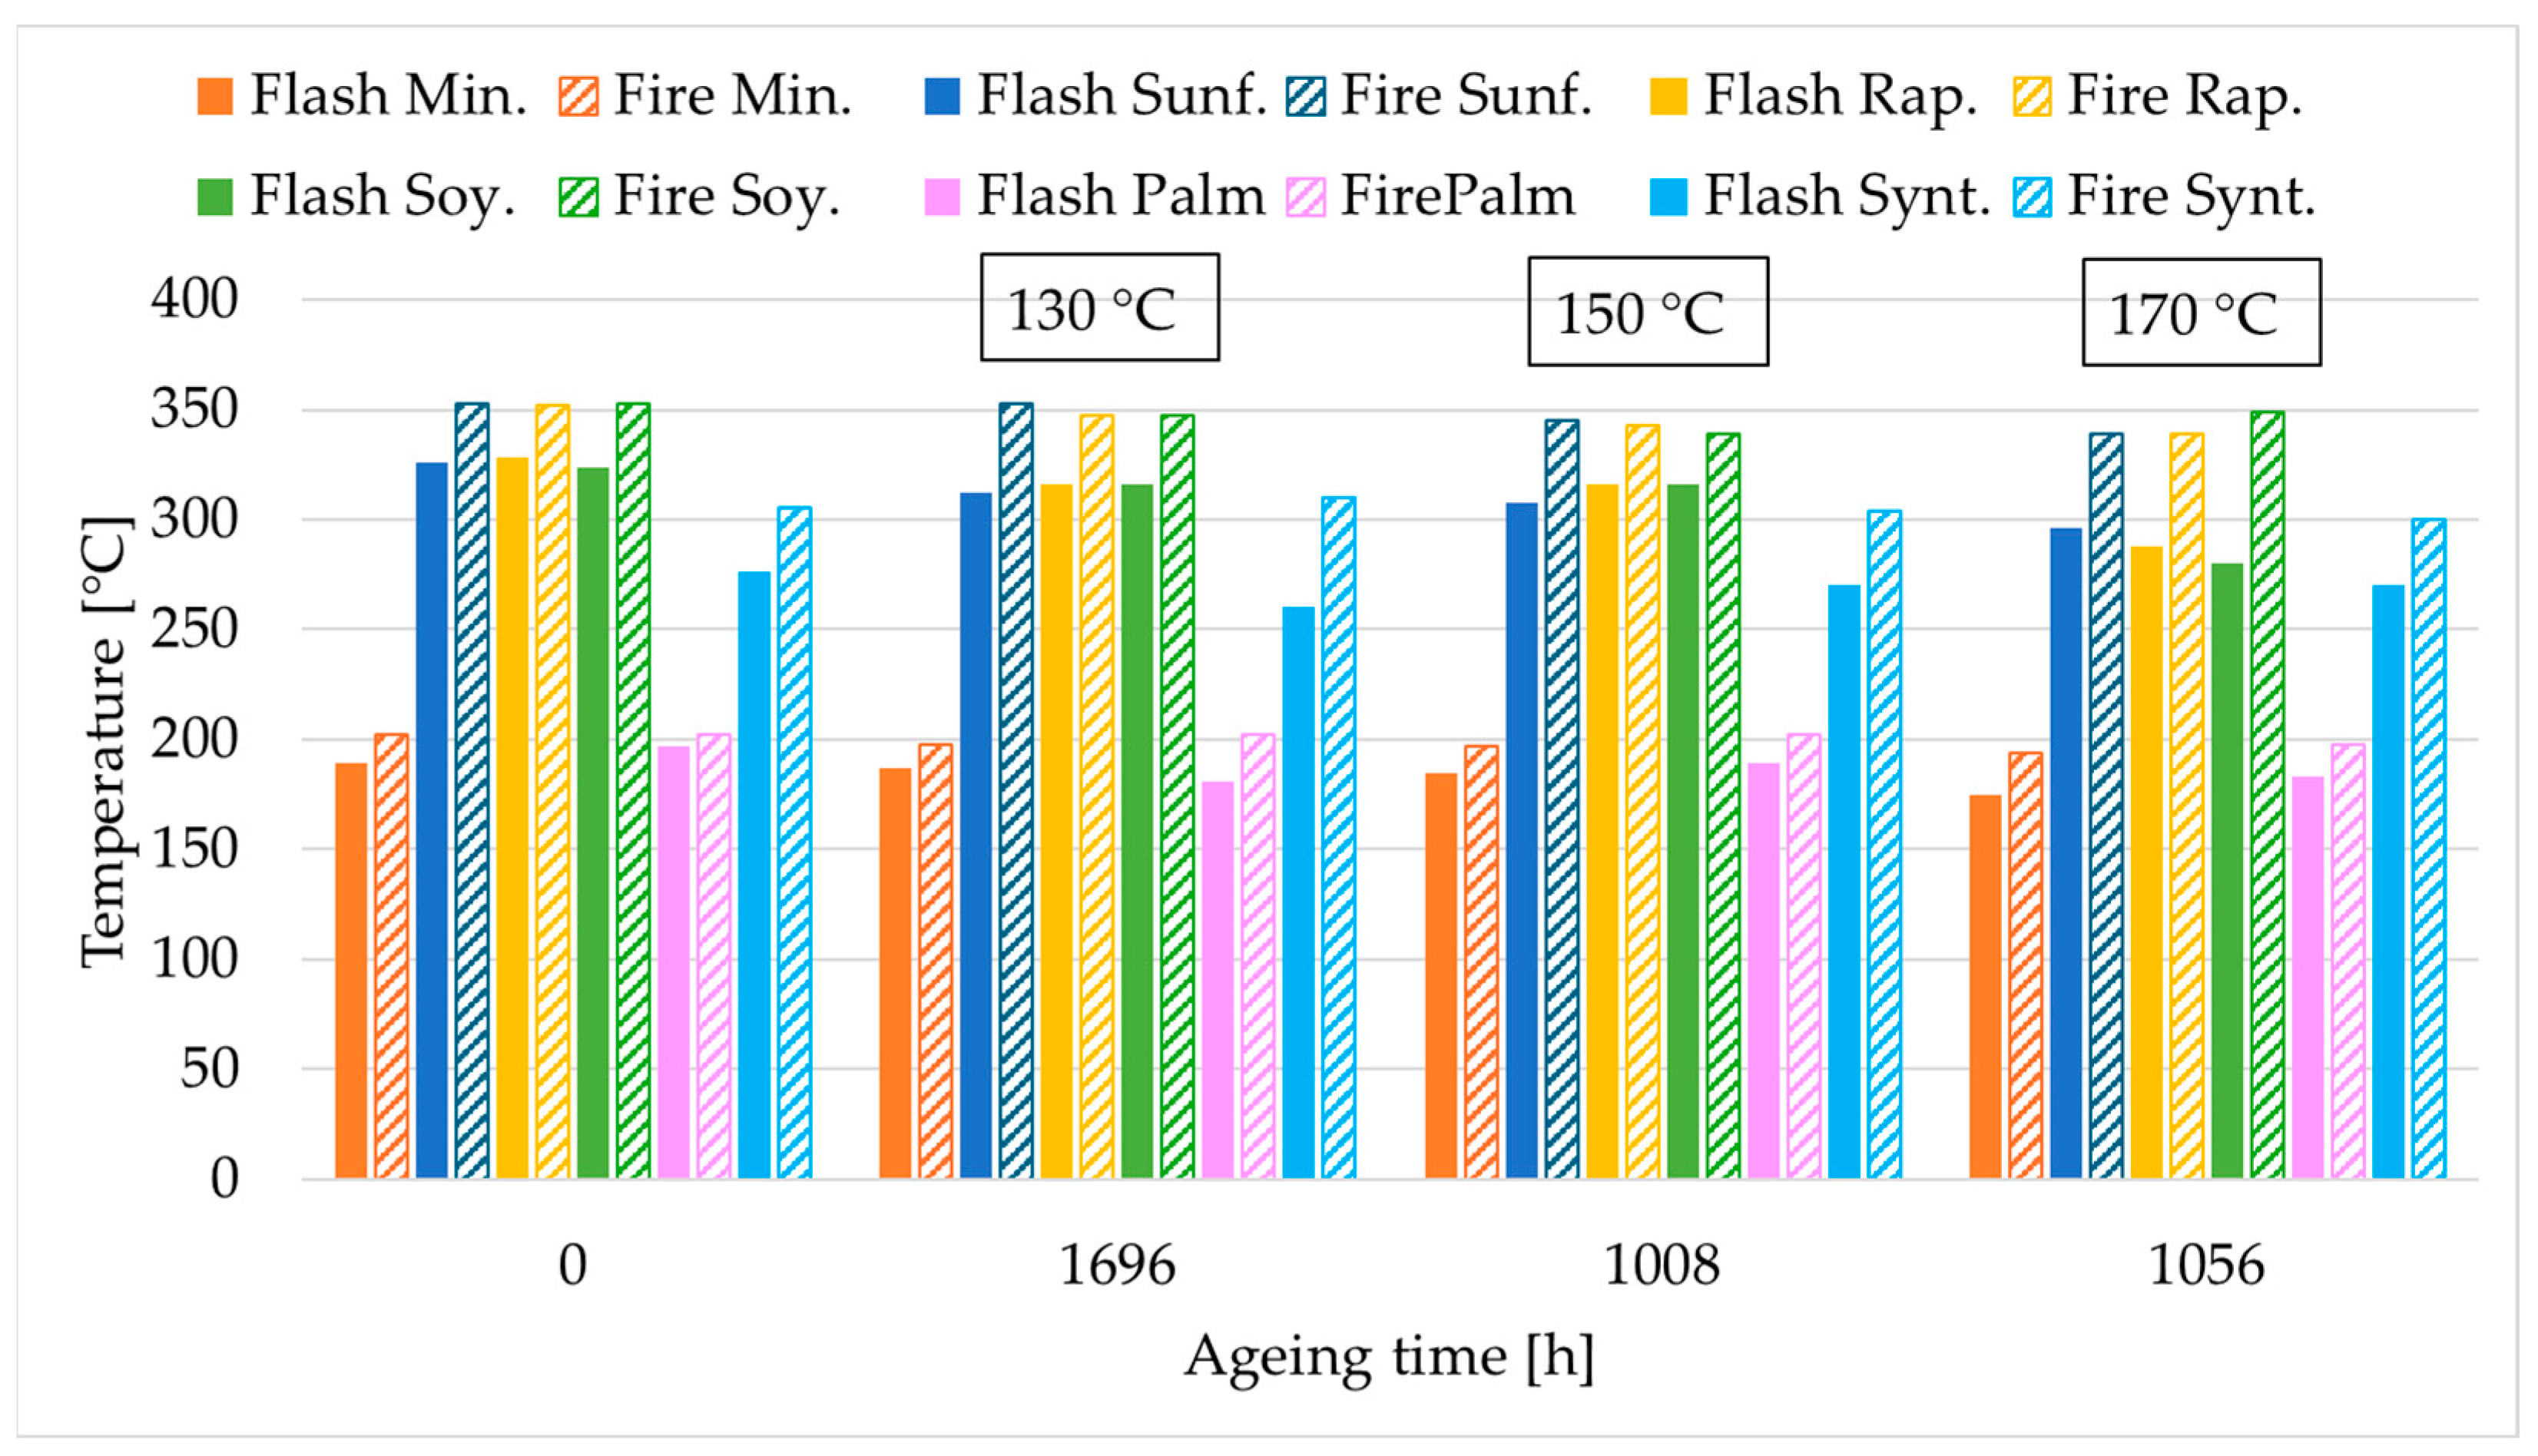
Similarly to the viscosity of the fluids, the flash and fire points did not change during ageing. Therefore, only the initial and final values of these parameters for each fluid are shown in
Figure 7. Both parameters remained relatively stable throughout the ageing process, showing only minor variations at the highest temperature.
Initially, all unmodified NE exhibited very similar flash points—326, 328, and 324 °C for sunflower, rapeseed, and soybean NE, respectively, a value much higher than that of MO (185 °C), with no significant differences between them. The palm-based NE performed significantly worse than the unmodified NE, with a flash point of 197 °C. The SE also demonstrated a good flash point, specifically 276 °C, slightly lower than that of the NE but substantially higher than that of MO.
Regarding the fire point, for the unmodified NE and the SE they were approximately 30 °C higher than their respective flash points, indicating strong thermal stability. In contrast, the palm-based NE exhibited fire points only about 10 °C above their flash points, similar to that of the MO.
As observed in previous studies [
16,
17], no consistent trend was identified over time. For EF, the slight reduction observed in some cases is more likely linked to external contamination—particularly with MO—rather than intrinsic degradation of the fluid [
36], whereas in the MO, a decrease in flash point may be attributed to the formation of low-molecular-weight hydrocarbons resulting from prolonged thermal exposure [
25].
Nevertheless, the minor variations observed in isolated samples remained within the margin of error of the measurement equipment and were not indicative of meaningful chemical degradation.
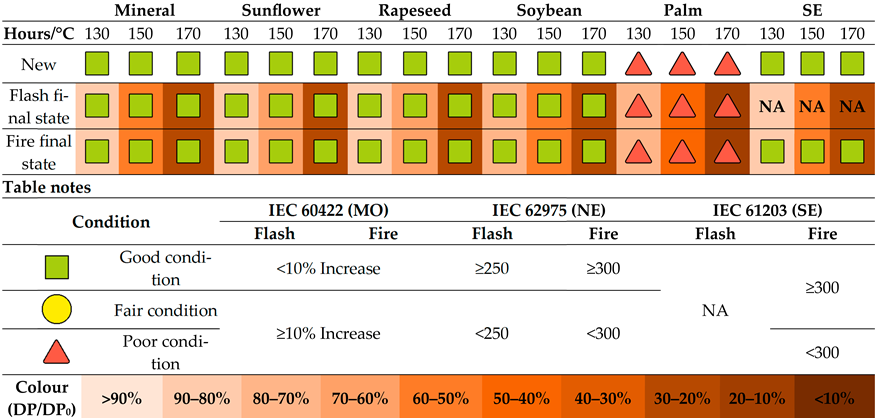
The evaluation of flash and fire points according to the standards is collected in
Table 7, with the corresponding threshold values [°C] provided in the table notes. They remained good in all cases in which they are evaluated for the unmodified NE and SE, indicating the high stability of this property and the appropriateness of the standard’s limits. For the SE, the flash point is not considered in the standards. A similar trend is observed in the case of MO. However, when the palm NE is assessed using the only available standard for NE, its flash and fire point values prove unsuitable, as they do not align with the characteristics of this fluid.
3.7. Breakdown Voltage
BDV is a key parameter for assessing the insulating quality of dielectric fluids and is sensitive to the presence of moisture and solid contaminants, which tend to migrate toward regions of high electrical stress and reduce dielectric strength [
71].
The
Figure 8 collects the BDV results obtained in this study for the new samples and at the last state of each ageing temperature. Initially, all EF exhibited higher BDV than MO, with the palm NE showing the highest value followed by the sunflower NE and the SE. In detail, the initial values of the BDV [kV] were 56.8, 73.0, 66.9, 67.9, 77.3, and 72.9 for MO, sunflower, rapeseed, soybean, palm, and SE, respectively.
Throughout ageing all fluids showed a decrease in BDV, which was generally independent of the ageing temperature for most of the liquids tested. For the palm ester, a higher BDV was observed at 150 °C compared to the other temperatures. However, BDV is a property with inherently high measurement variability, and this observed difference does not, by itself, indicate a change in the material’s behaviour. Therefore, the overall trend of BDV reduction with ageing remains consistent across all tested temperatures.
The reduction of the BDV in the EF was significantly pronounced likely due to moisture uptake, which suggests that moisture content has a stronger influence on dielectric strength than fluid degradation itself, as also noted in previous studies [
72,
73]. Thus, the BDV of EF should be assessed in conjunction with their moisture content, as water has a strong influence on dielectric strength. In systems filled with EF, it may be advisable to evaluate whether fluid drying is necessary when abnormal moisture levels are detected.
In contrast, MO showed a moderate reduction in BDV across the ageing. Since moisture levels remained nearly constant in MO samples, the reduction in dielectric strength is attributed mainly to fluid degradation and the accumulation of by-products rather than water content. For this liquid dielectric strength should also be interpreted alongside moisture measurements. However, in such systems, a significant increase in water content is typically associated with a system failure rather than normal ageing behaviour. Under standard operating conditions, changes in BDV in MO are more likely to reflect the chemical ageing of the fluid itself.
At the conclusion of the ageing experiment, all fluids exhibited
poor BDV values, as reported in
Table 8. The threshold values [kV] defining the classification of the results are indicated in the table notes. Although this decrease does not appear to be directly related to moisture content, it remains significant, as it may necessitate either oil replacement or modifications to the equipment to mitigate potential adverse effects.
3.8. Dielectric Dissipation Factor
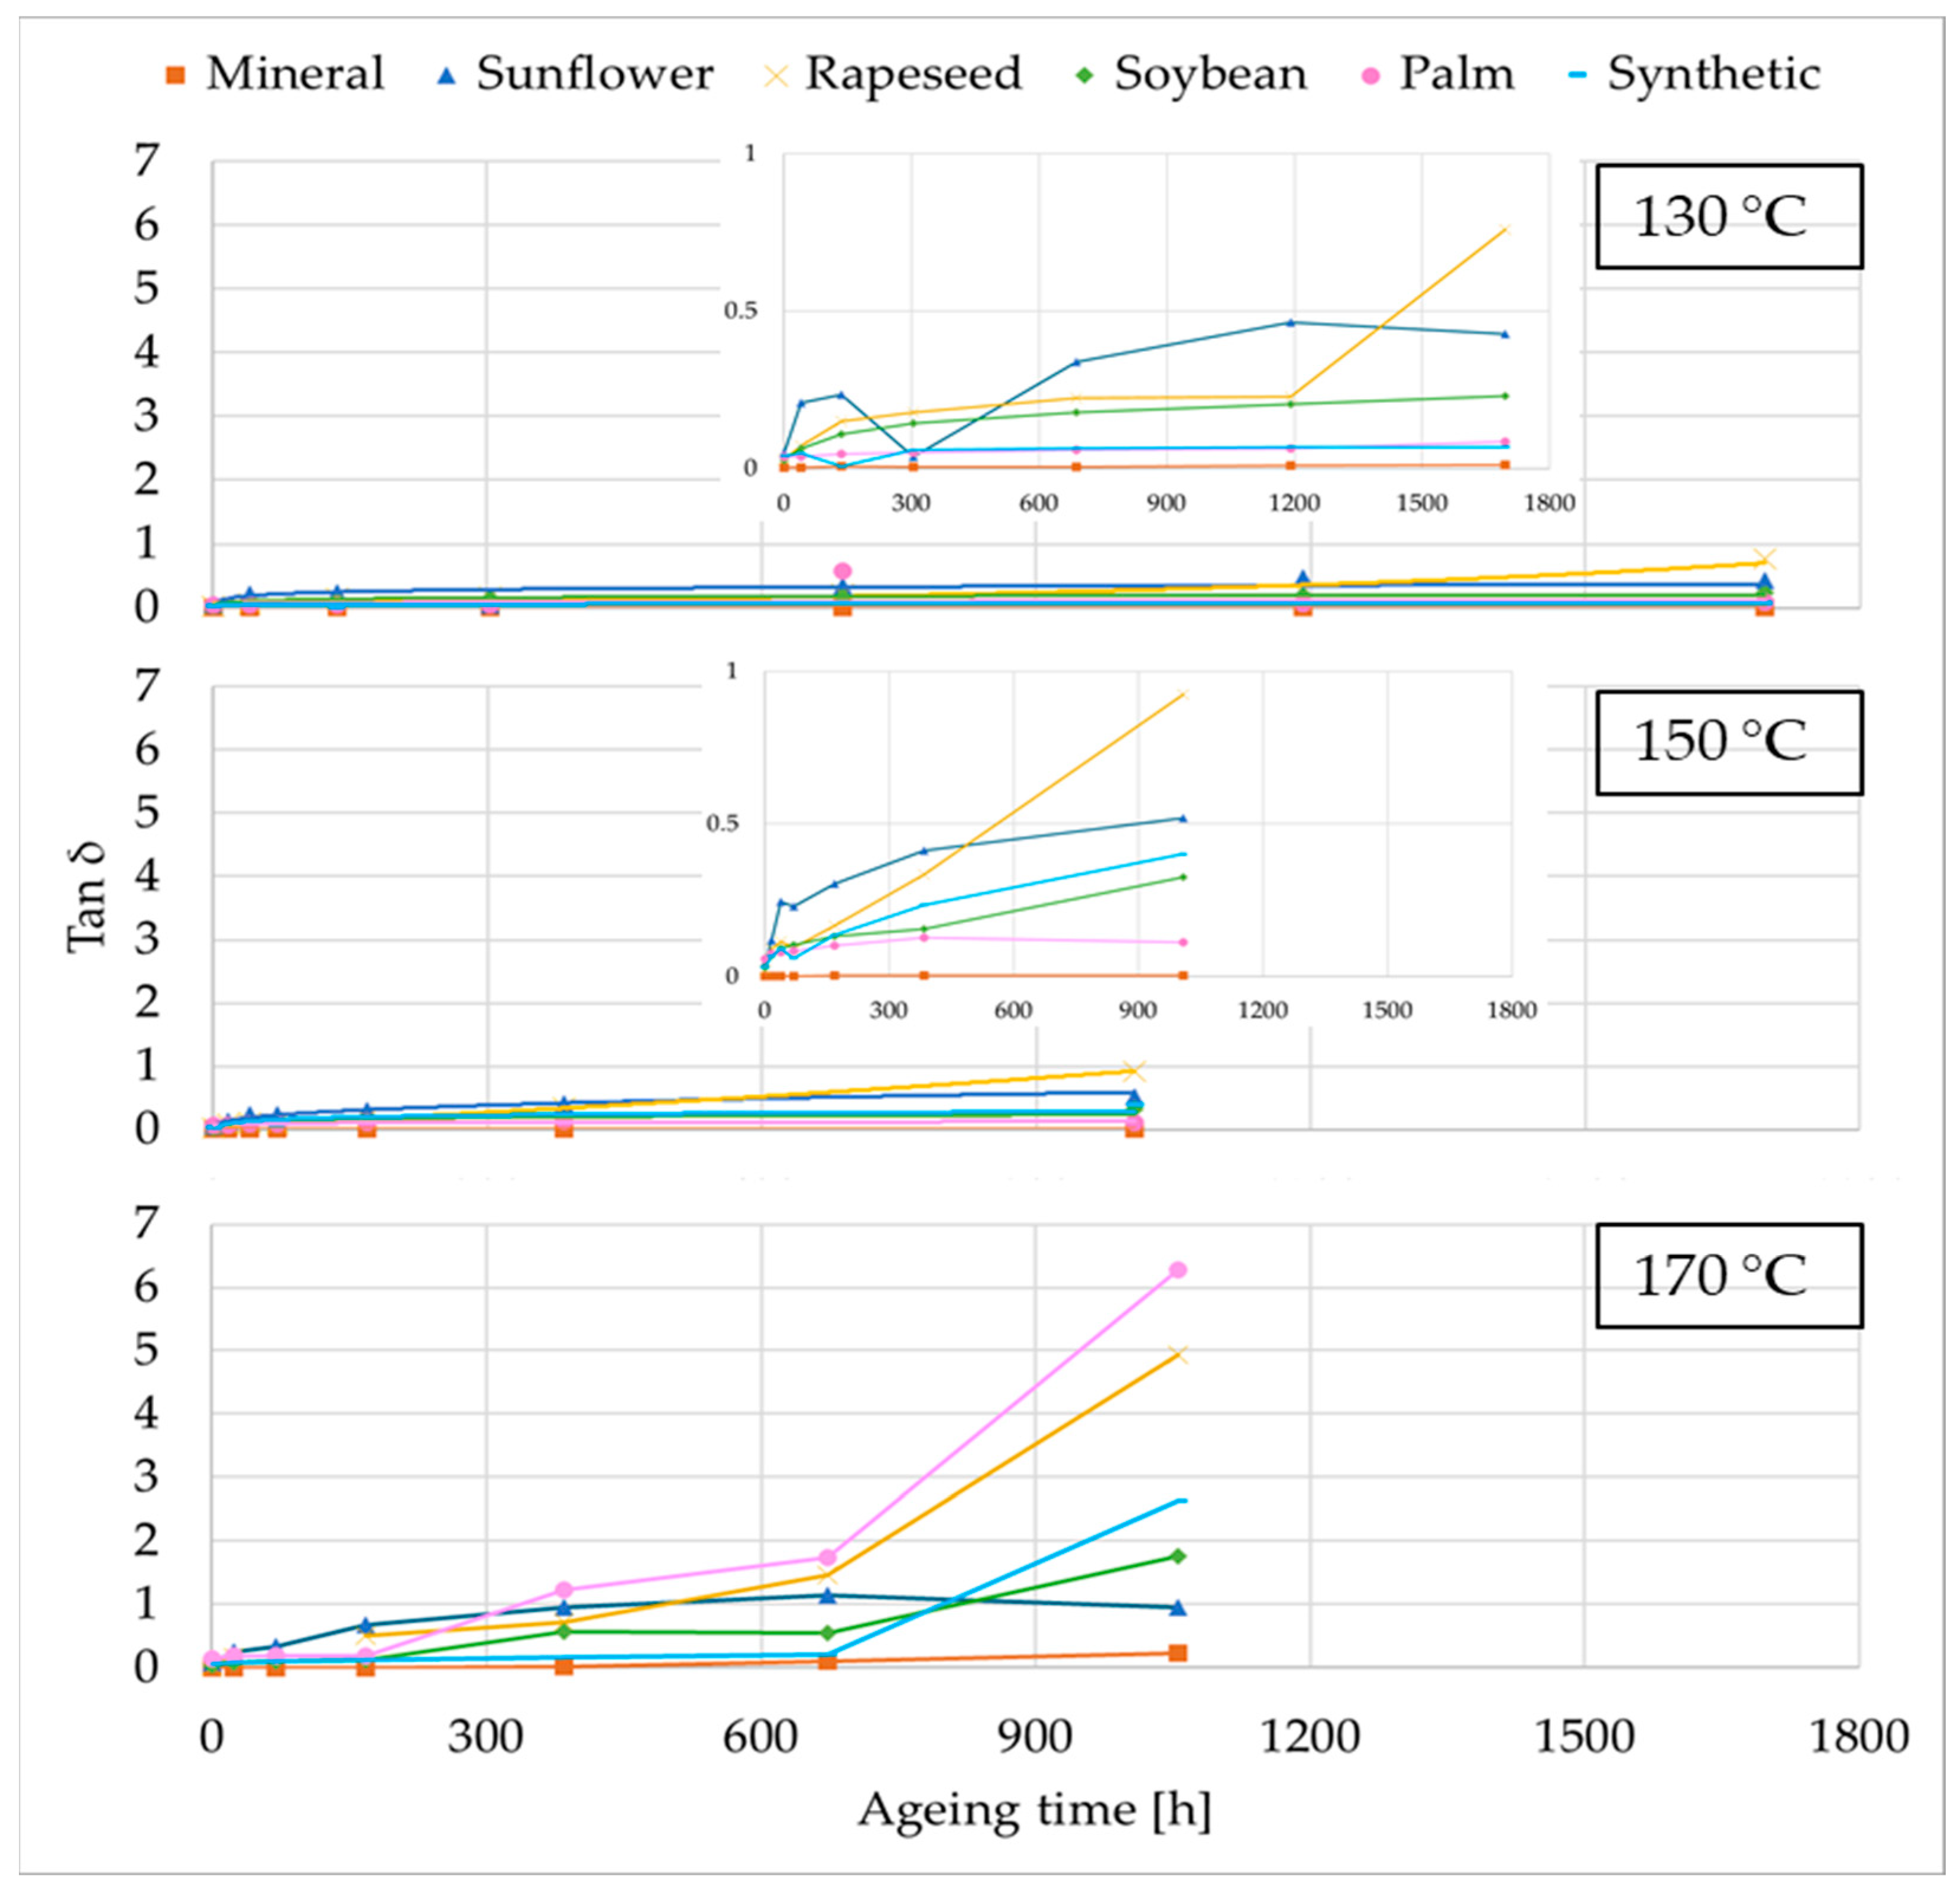
Figure 9 shows the tan δ evolution with the ageing. This parameter is a key indicator of fluid insulation condition, influenced primarily by the polarity and conductivity of the liquid. EF, due to their higher polarity compared to MO, exhibited higher initial tan δ values, as it was also reported in previous studies [
74,
75]. Among them, the SE showed the highest initial losses, while the NE, including the palm-based fluid, started with similar values. Specifically, the tan δ of the new fluids was 0.0016 for MO, 0.0606 for sunflower, 0.0240 for rapeseed, 0.0296 for soybean, 0.0792 for palm, and 0.0438 for SE.
During the dielectric liquids ageing tan δ generally increased in all fluids, following an exponential trend in the early stages and becoming more linear as ageing progressed, except for the tests carried out at 170 °C, where the increase was continuous and remained pronounced even at the end of the experiment, most notably for the palm ester. This rise could be associated with increased moisture content, the formation of polar degradation compounds and acid accumulation [
71]. In the EF, the increase of the tan δ is due to the effect of both the moisture content and the presence of polar compounds.
The unmodified NE showed the higher increased, but with significant differences among them. The palm one showed temperature-dependent behaviour. While its tan δ remained comparable to other esters at lower temperatures, at 150 °C and especially at 170 °C, it increased significantly. In contrast, the SE, despite its higher initial tan δ, remained relatively stable throughout the ageing process. This behaviour is consistent with its better oxidation resistance and lower acid formation.
In any case, the tan δ of the EF was always higher than that of the MO, but in the last fluids the increment can only be attributed to the presence of polar acids or contaminants.
The evolution of tan δ is reported in
Table 9, with the corresponding standard threshold values provided in the table notes to indicate the classification of the results. It is observed that the unmodified NE, particularly sunflower and rapeseed, fail to meet the standard from the very beginning of the ageing, which may suggest that the established limits are not entirely appropriate. In the case of palm ester, a clear change in behaviour is evident at 170 °C. In contrast, the limits for SE appear to be appropriately set within the standard, as in the MO. In the case of NE, however, almost identical percentage changes relative to the initial values lead to different interpretations under the standard. This variation is not necessarily a problem of the fluid itself, but rather a reflection of its characteristic properties depending on its origin. Consequently, this may represent a consideration for equipment design rather than a justification for fluid replacement.
4. Conclusions
The main objective of this study was to evaluate the degradation of TUK paper impregnated with different alternative fluids and the applicability of the current standard for assessing the condition of the liquids, including MO, four NE, one of them a modified palm ester, and a SE, based on multiple properties such as DP, moisture content, acidity, IT, viscosity, flash and fire points, BDV, and tan δ.
Regarding the degradation of the TUK paper, the unmodified NEs provide better protection than the other fluids. The palm ester showed the worst protection of the TUK paper, whereas the ageing of paper with SE is slightly faster than with unmodified NE, but still better than with MO and palm ester. No significant differences were observed among the EF that would indicate a clear superiority of any of them, except for the use of palm ester with the paper studied, which showed a more pronounced degradation.
Some properties, such as viscosity and flash and fire points, did not exhibit significant variations under the ageing conditions tested.
In the case of the properties that are affected by ageing, the overall trend in the evolution of fluid properties is consistent across different ageing temperatures, with the exception of palm ester, which exhibits a change in behaviour at 170 °C. This temperature can therefore be considered as the operational limit for this fluid. The behaviour of unmodified NE is similar: although their properties differ slightly, their evolution during ageing is comparable, with no fluid showing significantly greater degradation. Nevertheless, these property differences should be taken into account.
Moreover, the results indicate that the standards’ limits for certain parameters are not equally suitable for all insulating fluids. In the unmodified NE, acidity thresholds are overly restrictive, leading to a poor classification in early service stages despite no negative impact on paper degradation or dielectric strength. For example, at the end of ageing, the acid number of sunflower, rapeseed, and soybean esters exceeded the IEC 62975 limit of 0.3 mg KOH/g (0.80, 0.45, and 0.54 mg KOH/g, respectively), while the DP of the paper remained high (620, 640, and 643, respectively); therefore, this level of acidity in esters fluids does not imply poor condition of the TUK paper. Moisture limits should also account for operating time, as high initial values may be harmless, while very low values after prolonged use can indicate severe degradation. Moreover, NE exhibit characteristic differences depending on their origin, which does not make them unsuitable for use, but must be considered in transformer design. This highlights the need to adapt the standard for each ester to accurately reflect its condition. This is particularly critical in the case of the palm NE, whose values differ substantially from those of others NE, making the standard unable to accurately reflect the fluid condition. For instance, IT values will always be rated as good, regardless of contamination by polar compounds, whereas flash and fire points will always be rated as poor, since their modification results in values much lower than those of unmodified NE. In the SE, some parameters, such as IT, are consistently rated as fair regardless of actual condition. Conversely, for MO, acidity limits appear too permissive, failing to reflect insulation deterioration, whereas interfacial tension limits may be overly strict. These findings highlight the need to adapt standards to the specific properties and ageing behaviour of each fluid type to ensure accurate condition assessment.
Finally, it is important to note that, in practical transformer operation, the condition of the insulating paper determines the equipment’s lifetime, and oil analysis provides only an indirect indication of paper degradation. Individual oil properties may yield inconsistent or non-definitive results; therefore, a comprehensive evaluation considering multiple parameters—such as acidity, interfacial tension, moisture content, viscosity, breakdown voltage, and dissipation factor—is essential to reliably estimate the overall condition of the solid–liquid insulation system.
