Article

Application of Graph Neural Networks to Model Stem Cell Donor–Recipient Compatibility in the Detection and Classification of Leukemia

by
Saeeda Meftah Salem Eltanashi
* and
Ayça Kurnaz Türkben
Department of Electrical and Computer Engineering, Altinbas University, Istanbul 34000, Turkey
*
Author to whom correspondence should be addressed.
Appl. Sci. 2025, 15(21), 11500; https://doi.org/10.3390/app152111500
Submission received: 2 September 2025 / Revised: 18 October 2025 / Accepted: 22 October 2025 / Published: 28 October 2025

Abstract

Stem cell transplants are a common treatment for leukemia, and close donor–recipient matching improves their success. Machine learning models like support vector machine (SVM), convolutional neural networks (CNNs), and recurrent neural networks (RNNs) can have difficulty handling the complexity of genomic and immune data, which then lowers the accuracy of clinical predictions. This study looks at using graph neural networks (GNNs) in a different way. This method combines data such as single-nucleotide polymorphisms (SNPs), human leukocyte antigen (HLA) typing, and clinical details to create a graph that shows the relationship between donor and recipient pairs. The framework uses graph attention networks (GATs) to focus on key compatibility traits and Dynamic GNNs (DGNNs) to monitor changes in the immune system and the disease’s progression. With data from the 1000 Genomes Project, the model correctly identified matches with 97.68% to 99.74% accuracy and classified them with 98.76% to 99.4% accuracy, outperforming standard machine learning models. The model uses SNP similarity and HLA mismatches to assess compatibility, which enhances its match prediction and compatibility explanation capabilities. The results suggest that GNNs offer a helpful and understandable way to model donor–recipient matching, potentially assisting in early leukemia detection and personalized stem cell transplant plans.

1. Introduction

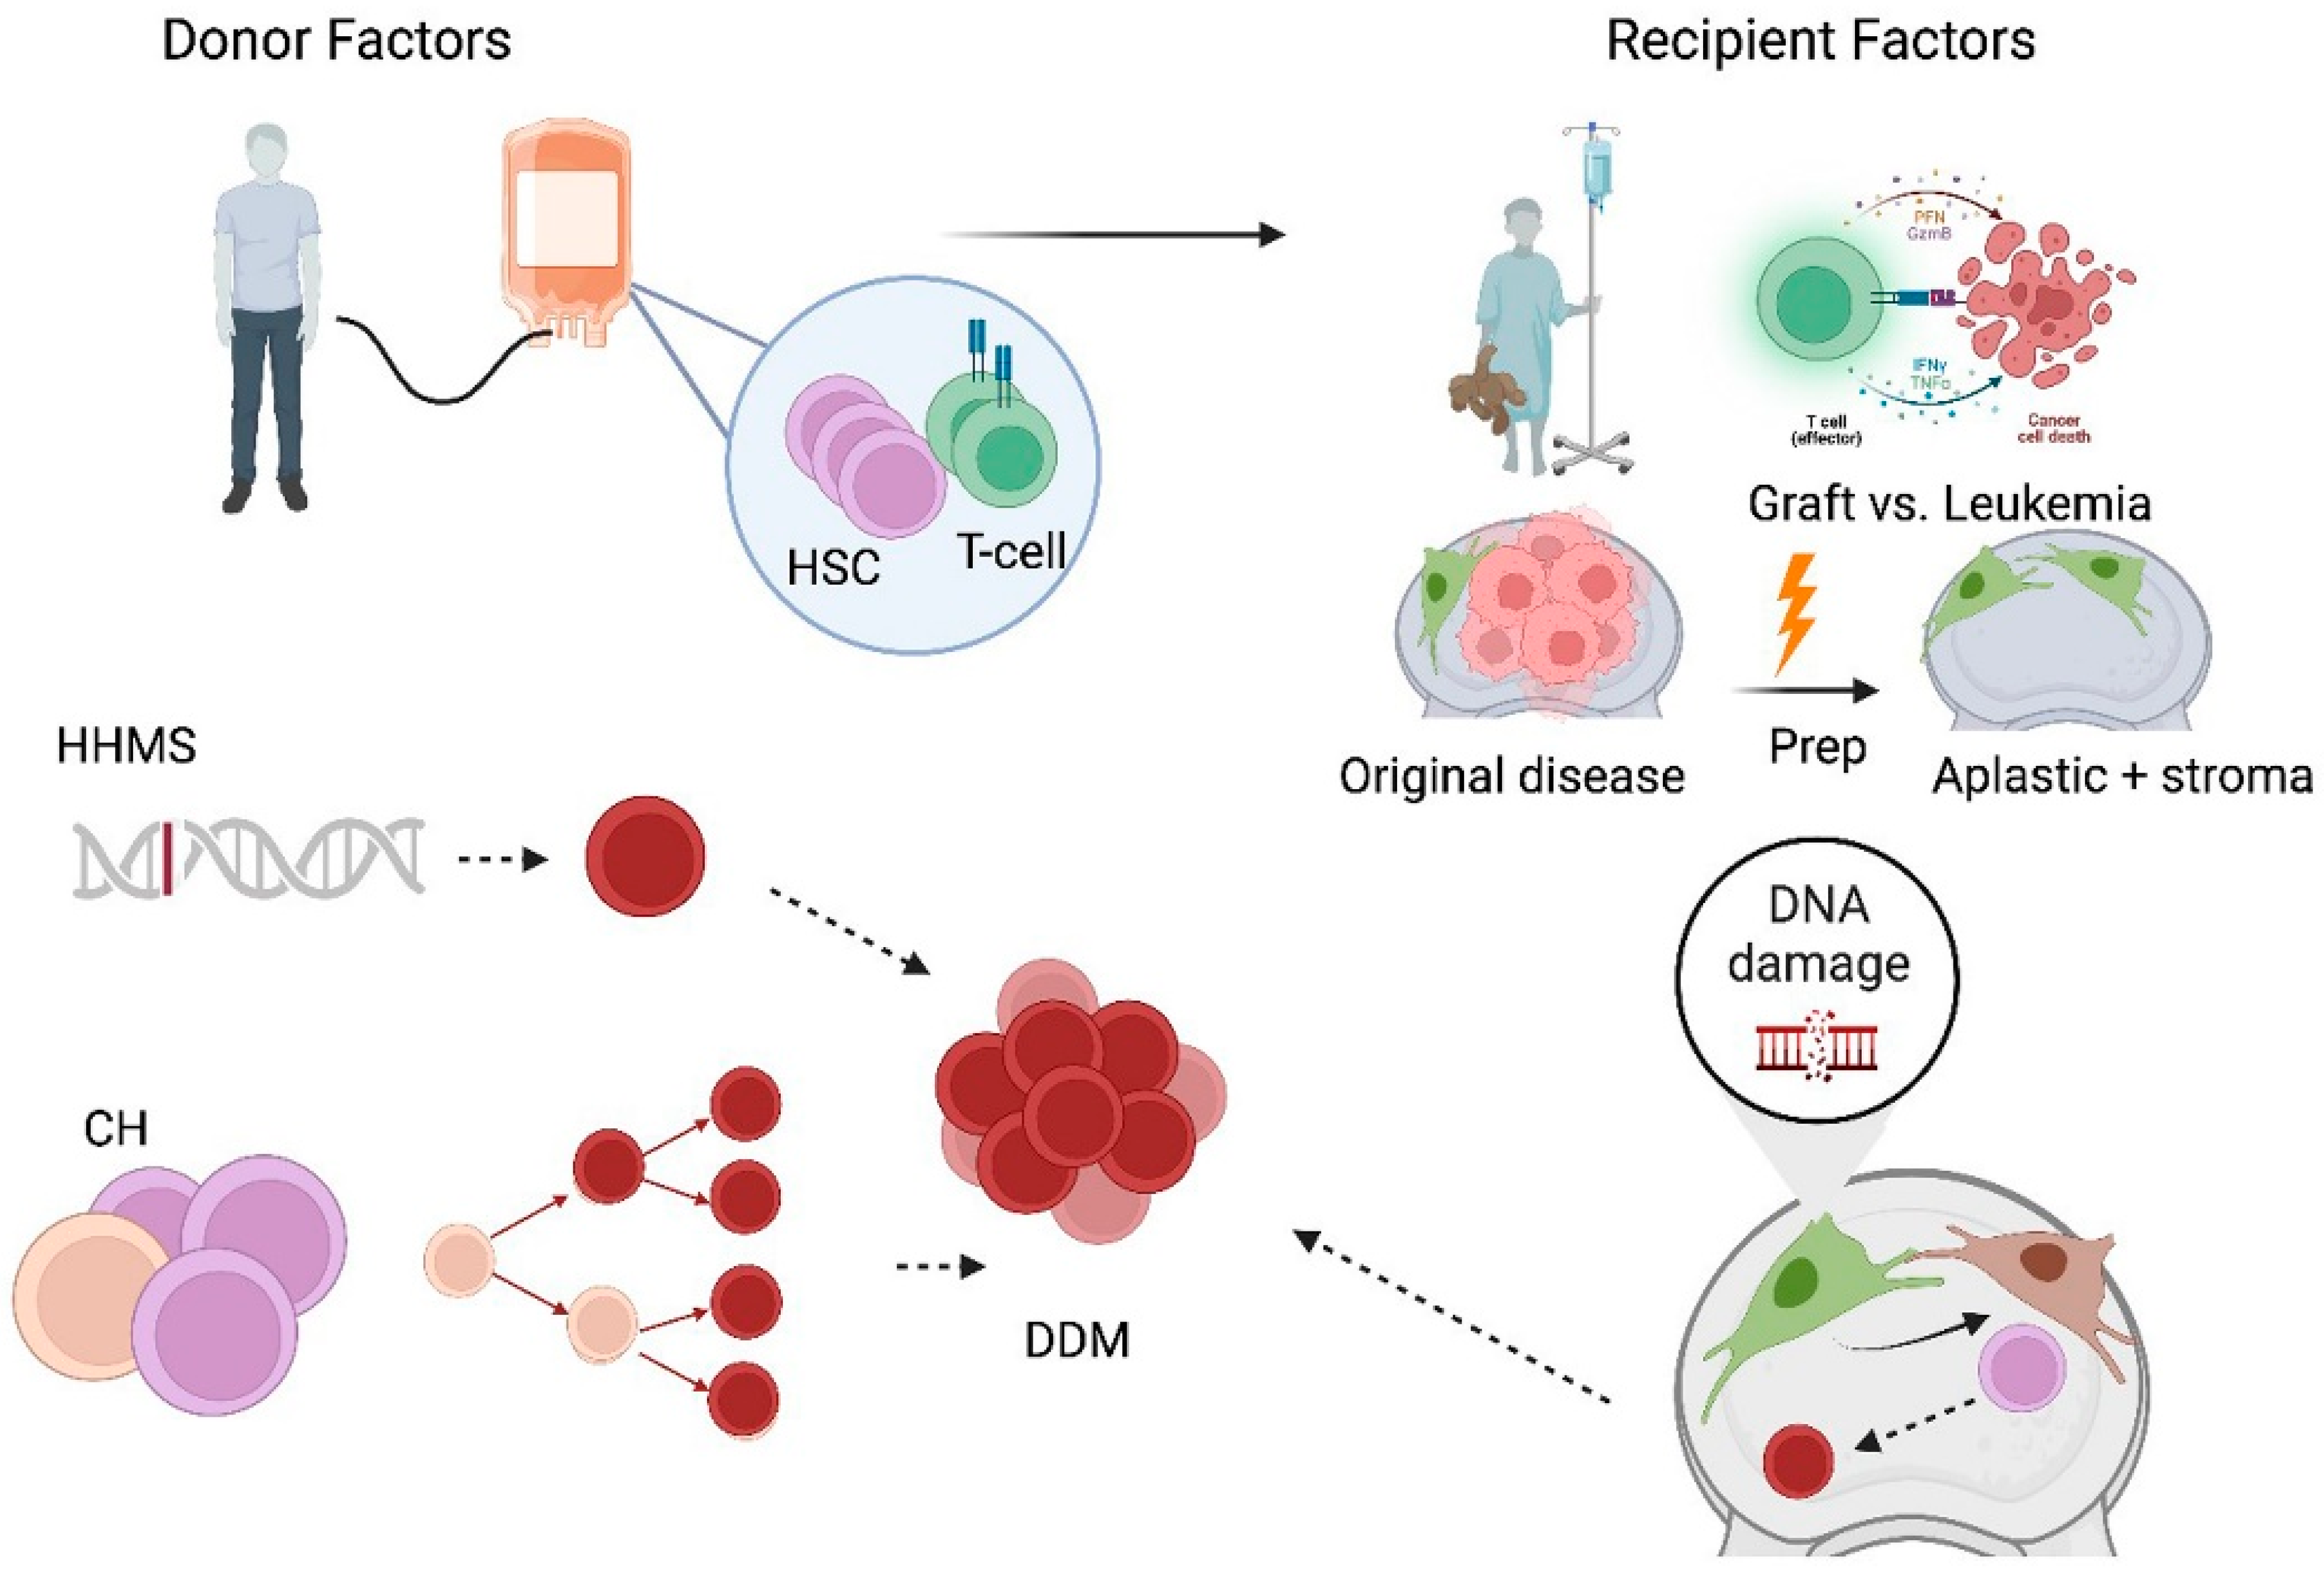
Leukemia is a difficult blood cancer and a cause of cancer deaths and sickness around the world. A stem cell transplant from a donor is seen as the best curative option for many leukemia patients, especially when standard treatments are not working [1]. Researchers have explored machine learning methods such as support vector machines, random forests, convolutional neural networks, and recurrent neural networks to predict donor–recipient compatibility and classify diseases [2,3]. This research puts forward a graph neural network method to tackle the problems in stem cell transplantation. It uses graph data of donor–recipient pairs, including single-nucleotide polymorphisms (SNP), human leukocyte antigen (HLA) types, and clinical details. Graph attention networks are used to find important matching traits, and Dynamic GNNs track changes in disease and immune markers [4]. This work improves match prediction using a graph neural network (GNN) model by combining different multi-omics data types. Attention mechanisms help the model explain its decisions. The model is tested on data from the 1000 Genomes Project, and results show it performs better than support vector machine (SVM), convolutional neural networks (CNNs), and recurrent neural networks (RNNs). Fluorescence tests confirm its biological relevance [5]. The paper is organized as follows: Section 2 reviews related studies, Section 3 details the method, Section 4 presents the test results, Section 5 discusses the meaning and limits of the results, and Section 6 concludes with suggestions for future studies [6]. Figure 1 shows that their analytical nature on structured data makes them useful in solving issues in stem cell transplantation, like HLA matching, immune reconstitution, and disease classification, as listed in [6].
Graph neural networks (GNNs) are valuable because of their ability to process diverse datasets. In stem cell transplants, matching a donor involves considering genetic factors, proteins, and patient data. Traditional statistical models often struggle to integrate this information. GNNs, in contrast, can represent donor–recipient matches as graphs with individuals as nodes and biological matches as links. This improves predictions and helps clarify the reasons for successful matches. GNNs can employ donor–recipient interaction networks to predict the likelihood of Graft-versus-Host Disease (GvHD). These predictions allow doctors to use personalized preventative treatments, reducing post-transplant problems and increasing patient survival. Recent developments in GNN design have expanded their applications [7,8,9,10,11,12].
A large part of the efficacy of HSCT as an important treatment modality for leukemia depends on adequate donor–recipient compatibility. In spite of a plethora of advancements in HLA typing and genomic sequencing, as described in [13], present-day compatibility models have traditionally been static, one-dimensional approaches and therefore less useful in illustrating dynamic, multi-omics relationships underlying biology and immunology.
  • Complexity of HLA matching: Traditionally, classical approaches are weak and unable to discern the tiny nuances of immunogenomic variance impacting transplant outcome, as well as complications following transplantation.
  • High-dimensionality: In donor–recipient matching, multiple layers of genomic, proteomic, and clinical data exist. Statistical models may struggle with integrating the latter.
  • Dynamic Biological Processes: Compatibility is not static; it evolves over time as immune reconstitution, engraftment, and potential relapse occur, which current static models fail to predict.
  • Sparse and Imbalanced Datasets: Donor–recipient datasets are often limited and imbalanced, with fewer examples of successful outcomes, limiting the effectiveness of traditional predictive models.
  • Limited Prediction of Leukemia Relapse: The models used previously fail to predict the post-transplant immune dynamics and residual markers of disease-driven relapse.
  • Poor Explainability: Most compatibility models act as a black box, thus offering minimal insight into the underlying biologically construed mechanisms, leading to limited applicability in the clinic.
  • Risk of GvHD Management: There is no robust tool for the prediction and mitigation of GvHD, which is the biggest problem with transplantation.
This study introduces graph neural networks (GNNs) to develop a robust computational method for assessing compatibility between stem cell donors and recipients, aiming to facilitate early leukemia detection and diagnosis. The research intends to address major gaps in compatibility prediction, risk assessment, and disease control by accounting for the complex nature of biological and immunological systems.
  • Develop a Compatibility Prediction Model: A GNN-based framework that models donor–recipient compatibility using HLA typing, SNPs, and immune interaction networks.
  • Integrate Multi-Omics Data: Employ multi-omics datasets, including transcriptomics, epigenomics, and proteomics, to develop a comprehensive compatibility graph.
  • Improved Prediction of Leukemia Relapse: Dynamic GNNs can be used to model temporal immune and genomic interactions, thus allowing for the early detection of relapse post-transplant.
  • Improved Disease Classification: A unified graph representation of clinical, genomic, and proteomic markers should be designed to improve the classification of leukemia subtypes.
  • Modeling GvHD Risk: Heterogeneous GNNs can be used to predict the risk of graft-versus-host disease (GvHD) based on donor–recipient interaction networks and immunomodulatory pathways.
  • Validate Model Scalability and Generalizability: Extensive validation with diverse and heterogeneous datasets to ensure the model is adaptable across patient populations.
  • Develop Explainable GNNs: Design interpretable models to explain key compatibility determinants and provide actionable insights for clinicians.
This research introduces a computational system based on graph neural networks (GNNs) to address problems in hematopoietic stem cell transplant and leukemia treatment. By matching donors and recipients using HLA typing, SNPs, and immune networks, this method offers a more biologically relevant option compared to current matching methods. A main part of this system is the integration of multi-omics data, such as transcriptomics, epigenomics, and proteomics, into combined graph structures. This captures the complex molecular and immunological interactions that affect transplant outcomes. The system also helps clinicians by using dynamic GNNs to simulate changes in genomic and immune activity over time, which allows for early prediction of leukemia relapse and better disease risk classification. Also, graph-based models enhance the classification of leukemia subtypes and use different GNNs to predict graft-versus-host disease (GvHD) risk, a major issue in transplantation. The model’s effectiveness is verified using various datasets, showing its scalability and applicability to different patient groups and donor pools. The design of the GNN includes interpretability, linking artificial intelligence and clinical aspects. It generates understandable outputs that show key compatibility factors and offer insights for clinicians. In short, this study is at the intersection of machine learning and specific medicine, creating a basis for improved patient outcomes via data-driven and understandable compatibility models.

2. Literature Review

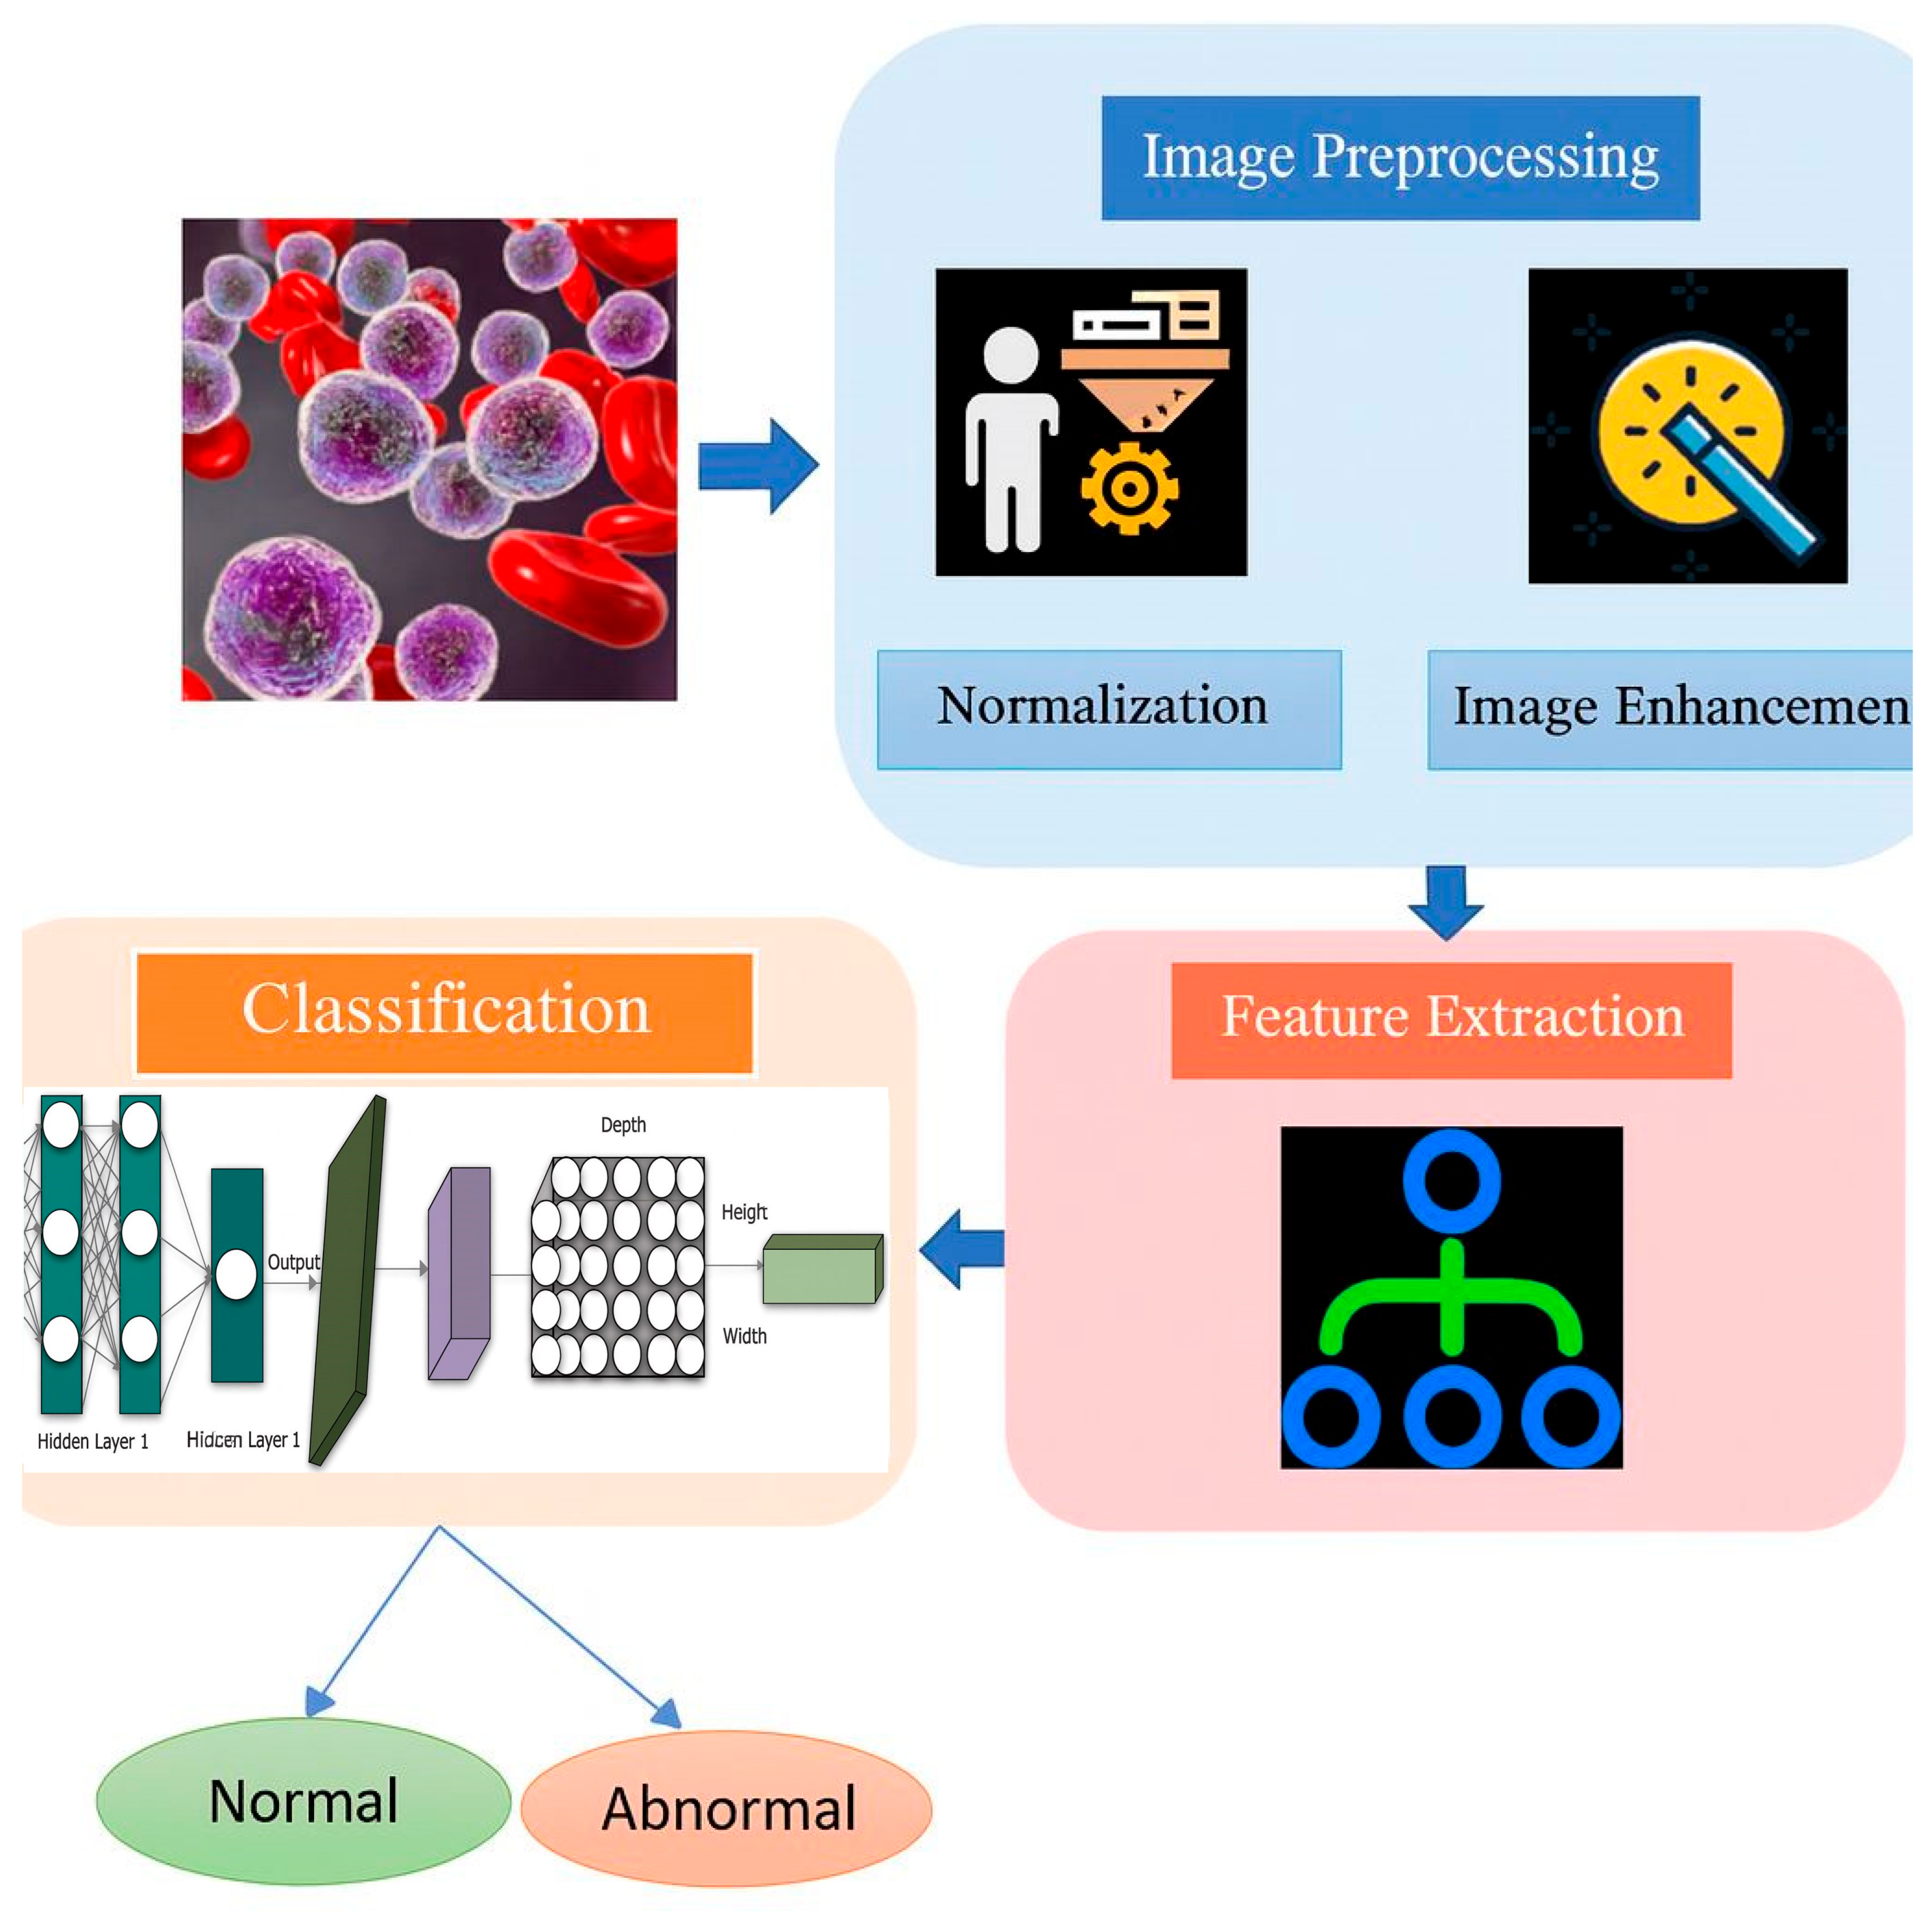
Thus, the area of HSCT has seen a tremendous advancement in modeling donor–recipient compatibility. Determination of compatibility between the donor and the recipient can be performed perfectly to minimize graft-versus-host disease and leukemia relapse, as listed in [14]. Current compatibility predictions rely heavily on human leukocyte antigen (HLA) typing, employing techniques like sequence-specific oligonucleotide (SSO) typing and next-generation sequencing (NGS) for precise allele-level matching [15]. While these methods improve matching accuracy, they fall short in explaining specific immunogenic interactions and non-HLA factors, as detailed in the cited works [16,17]. Linear statistical models and machine learning approaches, such as support vector machines (SVMs) and random forests, have been used to forecast transplant results from compatibility scores and patient features [18,19]. Network-based approaches also help investigate the biological basis of donor–recipient compatibility [20]. Systems biology approaches, such as PPI networks and pathway analyses, have been used to discover the importance of potential interactions for transplant outcomes, as shown in Figure 2.
Graph neural networks (GNNs) have emerged as a powerful tool in biomedical research. They have capabilities quite well-suited to address the challenges of modeling donor–recipient compatibility [21]. Graph neural networks work with graph-structured data. Biological items like genes, proteins, or patients become nodes, and their links, such as pathways or genomic similarities, become edges [22]. This setup allows GNNs to find local and overall patterns in systems [23]. GNNs are applicable in protein–protein interaction prediction, drug discovery, and disease classification [24,25]. Graph attention networks focus on key interactions by using attention weights on graph edges.

2.1. Advancements in Donor–Recipient Compatibility Modeling

Accurately predicting donor–recipient compatibility is crucial for successful hematopoietic stem cell transplantation (HSCT) [26]. Current methods rely heavily on human leukocyte antigen (HLA) typing, often using advanced techniques like sequence-specific oligonucleotide (SSO) typing and next-generation sequencing (NGS) [27]. These tools allow precise allele-level matching, improving compatibility assessment. Still, these methods usually do not fully account for the complex interactions of immunogenomics and other non-HLA factors that could affect transplant outcomes [28]. For example, Table 1 shows that the roles of miHAs and cytokine signaling networks remain inadequately explored in traditional models, as outlined in [29,30].
Support vector machines (SVMs) and random forests (RFs) have been used to predict outcomes based on HLA compatibility scores and patient clinical data [31]. While these models show some improvement, their use becomes problematic with high-dimensional multi-omics datasets, which are needed for detailed compatibility analysis, as noted in [32,33]. These problems call for better computational methods that can combine different data types and model dynamic processes, as described in [34].

2.2. Emergence of Graph Neural Networks in Biomedical Applications

GNNs have been a powerful tool in computational analysis for graph-structured data and uniquely advantageous for modeling biological systems. In biomedical research, entities like genes, proteins, or patients are represented as nodes, while their interactions, such as pathways, genomic similarity, or clinical relationships, are represented as edges, as given in [35]. Graph neural networks (GNNs) can learn both local and global links in complicated data. For example, as shown in Table 2, Graph Convolutional Networks (GCNs) gather info from nearby nodes to find hidden links. Graph attention networks (GATs) instead emphasize the most important interactions using attention, making them useful for things like modeling donor–recipient matching, as seen in [36,37].
Biological systems change constantly, which poses a challenge that DGNNs address in an innovative way. DGNNs build on standard GNNs by adding a time dimension [38]. This lets the network monitor how interactions change, such as immune reconstitution, minimal residual disease, and compatibility measures that change, as seen in [39,40]. GNNs have already seen some success in transplant medicine, especially in predicting kidney transplant rejection [41]. In this case, donor and recipient genomic and clinical data were modeled to improve predictions. But using GNNs for HSCT is still fairly new. GNNs can manage high dimensionality and complexity in multi-omics data and are dynamic models, making them a potentially transformative tool in HSCT research [42,43].

3. Materials and Methods

This research adopts a multi-phase methodology to design a GNN-based framework that models donor–recipient compatibility in early leukemia detection and classification. The approach integrates diverse biological datasets, advanced Graph Construction techniques, and state-of-the-art GNN architectures to provide accurate, interpretable predictions. Initially, data is gathered and prepared from both public and institutional sources. This includes genomic information (such as HLA alleles and SNPs), transcriptomic data (like gene expression), proteomic profiles (including cytokine and protein interactions), and clinical details covering patient demographics and results. Feature normalization and imputation of missing values standardize these multi-omic datasets. Graph Construction graph attention networks, or GATs, have edges with a higher biological relevance, while Dynamic Graph Neural Networks, or DGNNs, capture changes over time in immune dynamics and disease progression, as shown in Figure 3.
The multi-task output layer anticipates transplant results, leukemia recurrence, and disease subtypes. It uses task-specific loss functions to balance the learning process. To handle limited info, graph augmentation methods that use feature changes and synthetic edge building can improve information dependability. We measure performance by checking accuracy, F1-score, AUC-ROC, and MAE using stratified k-fold cross-validation. This field has disagreements. Some papers say that thorough HLA typing alone determines transplant success. Other papers point to the roles of SNPs, small histocompatibility antigens, and proteomic factors. There is also discussion on whether compatibility should be a set measure at transplant, or if it changes with immune system recovery and relapse. Lastly, views differ on using hard-to-understand machine learning models that give good numbers versus models that are easier to trust in practice.

3.1. Data Collection and Preprocessing

This research selects the 1000 Genomes Project dataset as its resource because of the comprehensive coverage of human genetic variation and the ability to model compatibility between the donor and the recipient in the case of stem cell transplantation.
  • The 1000 Genomes Project was the source of our data.
  • We used high-resolution single-nucleotide polymorphisms (SNPs).
  • Applicable human leukocyte antigen (HLA) allele typings were modeled for matching.
  • The data included different populations.
  • Missing SNP data was filled in using population averages. Samples lacking sufficient HLA typing data were removed.
  • SNPs were normalized using z-scores. HLA alleles were changed to numerical values based on allele frequency.
  • One-hot encoding was used for HLA allele data. Feature vectors were created from individual SNP profiles.
  • Principal component analysis (PCA) was used to reduce the number of SNP dimensions, keeping about 95% of the variance.
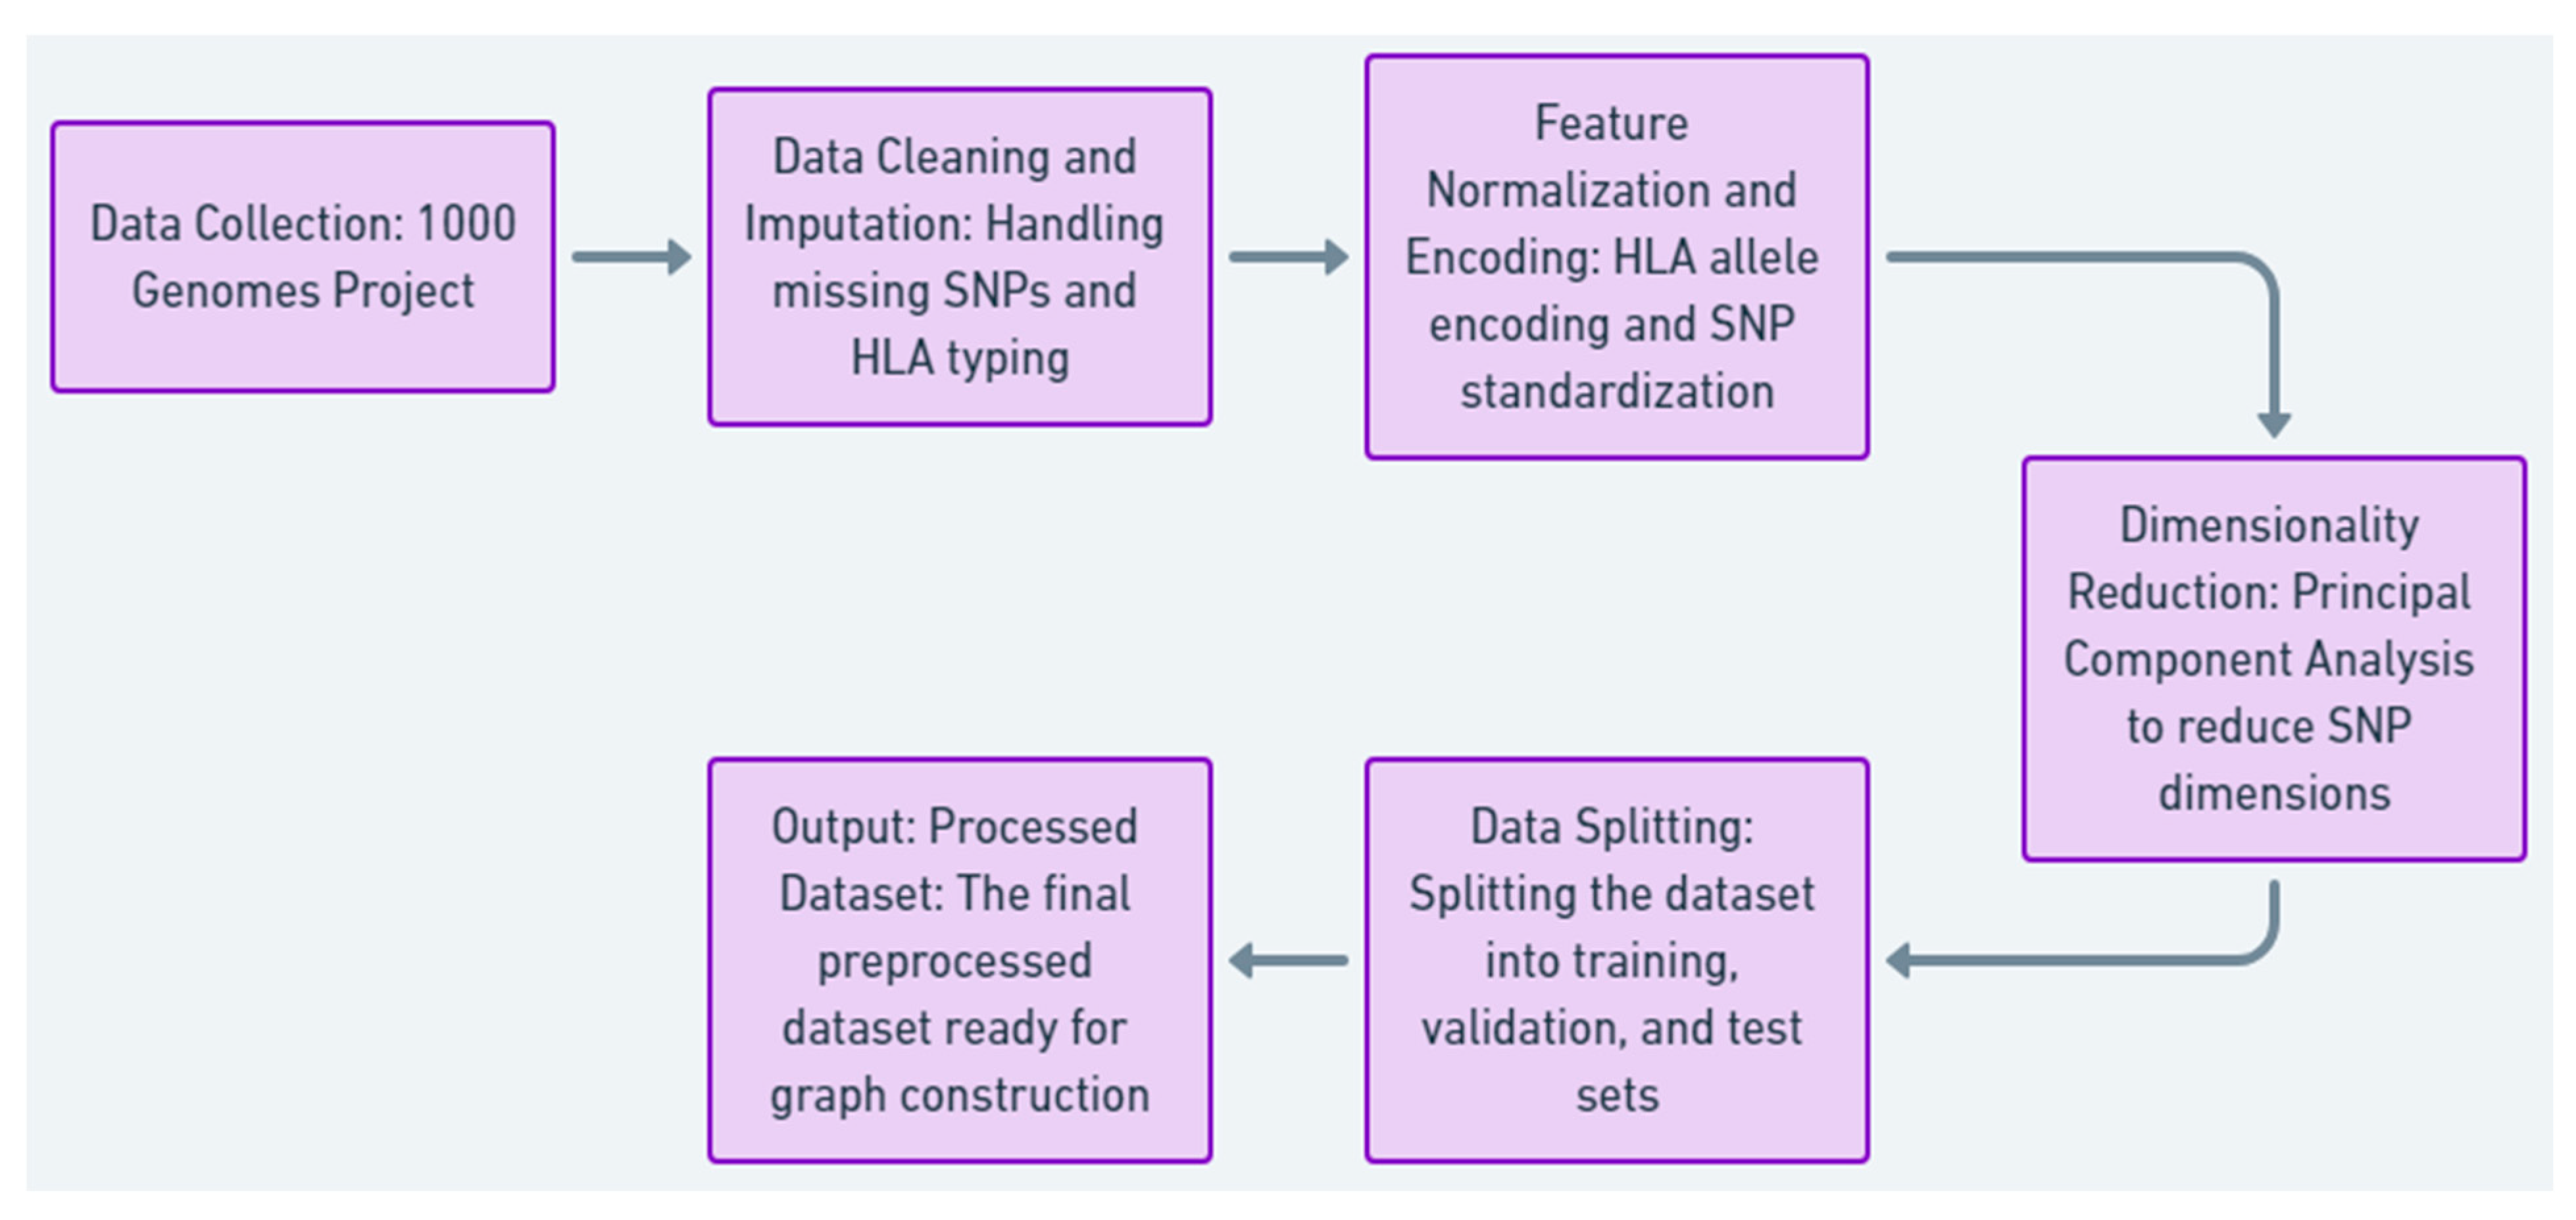
  • In our dataset, we stratified the ratio of samples from our population into training (70%), validation (15%), and test (15% sets), as shown in Figure 4, Table 3 and Table 4, given the summary of Data Collection and preprocessing steps tailored for patients 1, 2, and N, detailing raw data handling and preparation for compatibility modeling.

3.2. Model Architecture and Graph Construction

Core Methodology. Develop a robust heterogeneous graph neural network (GNN) for modeling donor–recipient compatibility based on diverse biological, genomic, and clinical datasets. The graph is built by creating separate models for donor and recipient nodes. Edges are defined by encoding compatibility measures. Each node’s feature vector includes genomic data, such as SNPs and HLA alleles, and clinical data, like age, type of leukemia, and transplant outcome. The edge weights reflect HLA matching scores, genetic similarity, and post-transplant outcomes like relapse or graft survival. Thus, this structure makes it possible to capture both local compatibility relationships and global connectivity.
To prioritize certain edges, the GNN employs a graph attention mechanism. The attention coefficient for an edge between nodes i and j is computed as
α i j = e x p ( L e a k y R e L U ( a T [ W x i W x j ] ) ) k N ( i ) e x p ( L e a k y R e L U ( a T [ W x i W x j ] ) )
where the following apply:
W and a are learnable weight vectors;
‖ denotes concatenation;
N(i) is the set of neighbors for node i.
The final layer performs multi-task learning with three objectives:
Transplant Outcome Prediction
y i = S o f t m a x ( W o H ( L ) )
where H ( L ) is the final node embedding, and W o is the output weight matrix.
Relapse Risk Prediction
r i = σ ( W r H ( L ) )
where W r maps embeddings to relapse probabilities.
Disease Classification
c i = S o f t m a x ( W c H ( L ) )
where W c is the classifier weight matrix.
The architecture reflects the time-based aspects of transplant biology. Static graphs store data at the time of transplant to ensure compatibility. Dynamic graphs monitor data over time, such as immune system recovery, to predict the chances of events like leukemia recurrence. The GNN architecture uses graph convolutional layers that combine localized features to learn compatibility patterns, like mismatched gene variants. A graph attention method gives different weights to edges, focusing on interactions like HLA mismatches that represent high risk. Dynamic graph neural networks are also included to represent changing relationships and ensure predictions over time are correct, as seen in Figure 5.
The graph shows how well donors and recipients match using a graph neural network (GNN). Donors are shown as light blue nodes, while recipients are light green. Each node has details, such as donor age and recipient disease stage. The connections between nodes show compatibility: green lines for HLA matches, orange for partial matches, and gray for SNP overlaps. The edge weights are the strength of compatibility, where higher values indicate stronger matches. This increased visualization incorporates both biological and clinical attributes to give a more holistic view of donor–recipient relationships, as shown in Table 5 and Table 6.
  • Node Attributes: Donors have age information; recipients have disease stage details (e.g., early, intermediate, and advanced).
  • Edge Categories: Compatibility edges include types such as HLA match, partial match, and SNP overlap.
  • Weighted Edges: Compatibility strength is shown through numerical weights on edges.
Table 5. Summary of node types, attributes, and roles in the GNN, representing donors and recipients with key biological and clinical features.
Node TypeAttributesNode CountDescription
DonorAge (e.g., 30, 45, 35, 50)4Represents donors with key features, like age, for compatibility modeling.
RecipientDisease Stage (e.g., Early, Intermediate, Advanced)5Represents recipients with disease progression stages influencing compatibility.
Table 6. Overview of edge types, colors, and descriptions in the GNN, detailing compatibility metrics such as HLA matches and SNP overlaps.
Edge TypeColorDescriptionWeights
HLA MatchGreenStrong compatibility based on HLA matching.0.9
Partial MatchOrangeModerate compatibility with partial HLA matches.0.7
SNP OverlapGrayWeak compatibility derived from SNP overlaps.0.5
Table 5 summarizes the two types of nodes in the GNN: donors and recipients. Donor nodes are differentiated by attributes, such as age, which are necessary for compatibility modeling, while the recipient nodes are defined by stages of disease progression, like early, intermediate, and advanced disease, that define their compatibility with donors. Table 5 presents the node counts for each category, suggesting a balanced representation of both donors and recipients in the graph. Table 6 details three kinds of compatibility measures represented by the edges: HLA matches (green), partial matches (orange), and SNP overlaps (gray). Each edge type includes a description of its biological meaning and a weight showing compatibility strength. Table 6 properly contextualizes the graph by explaining the basis for donor–recipient links.

3.3. Model Training and Validation

The graph neural network (GNN) is then trained and checked using training and validation phases. This helps it better predict if a donor and recipient are a match, as well as transplant results and leukemia cases. Model training follows a supervised pattern, with the preprocessed data divided into training (70%), validation (15%), and test (15%) sets to ensure a fair assessment.

3.3.1. Model Training

The model proceeds by propagating node features and adjacency information through multiple GNN layers. This involves updating the node embeddings, which iteratively consider their neighbors’ features with graph convolution and attention mechanisms. The training objective is defined with a composite loss function:
L = L o u t c o m e + λ 1 L r e l a p s e +   λ 2 L c l a s s i f i c a t i o n
where L o u t c o m e , L r e l a p s e , and L c l a s s i f i c a t i o n represent the losses for transplant outcome prediction, relapse risk estimation, and disease classification, respectively. λ 1 and λ 2 are hyperparameters used to balance the tasks.
The optimization is performed with the Adam optimizer, which has an adaptive learning rate and gradient-based updates. Learning rate scheduling is used to decrease the learning rate gradually during training to ensure convergence.

3.3.2. Data Augmentation

Graph augmentation techniques are used to improve model robustness, including the following:
  • Node feature perturbation to simulate variability in donor–recipient profiles.
  • Synthetic edge generation to improve graph connectivity in sparse regions.

3.3.3. Validation

The validation set helps monitor model performance during training, checking its ability to generalize to new data. Common metrics for evaluation involve accuracy, F1-score, AUC-ROC, and mean squared error (MSE), each suited to different performance aspects.

3.3.4. Prevention of Overfitting

To avoid overfitting, the following regularizations are utilized:
  • Dropout layers between graph convolutional layers.
  • Weight decay that penalizes large values of weights in optimization.

3.3.5. Evaluation

To score the final model, measurements are applied to the test data. To understand the model’s predictions and to check if it has value in clinical settings, attention weights and feature importance tools are also used. With proper training and validation, the model should be reliable and easily understood in a clinical setting when deciding if a donor and recipient are a match and when predictions are being made. The SNP matching score computes how similar the donor and recipient’s SNP profiles are. The equation is as follows:
S S N P =   i = 1 n 1 ( d i = r i ) n × 100
where the following apply:
S S N P : Matching score (percentage).
n: Total number of SNP loci evaluated.
d i   ,   r i : SNP values at locus i for donor and recipient, respectively.
1( d i = r i ): Indicator function; equal to 1 if d i = r i , and 0 otherwise.
This formula calculates the percentage of matching SNP loci between the donor and recipient.
The HLA mismatch score quantifies the dissimilarity between donor and recipient HLA alleles. The formula is as follows:
M H L A =   k = 1 m 1 ( h d , k = h r , k ) m × 100
where the following apply:
M H L A : HLA mismatch score (percentage).
m: Total number of HLA loci evaluated.
h d , k   ,   h r , k : HLA alleles at locus k for donor and recipient, respectively.
1( h d , k = h r , k ): Indicator function; equal to 1 if h d , k h r , k , and 0 otherwise.
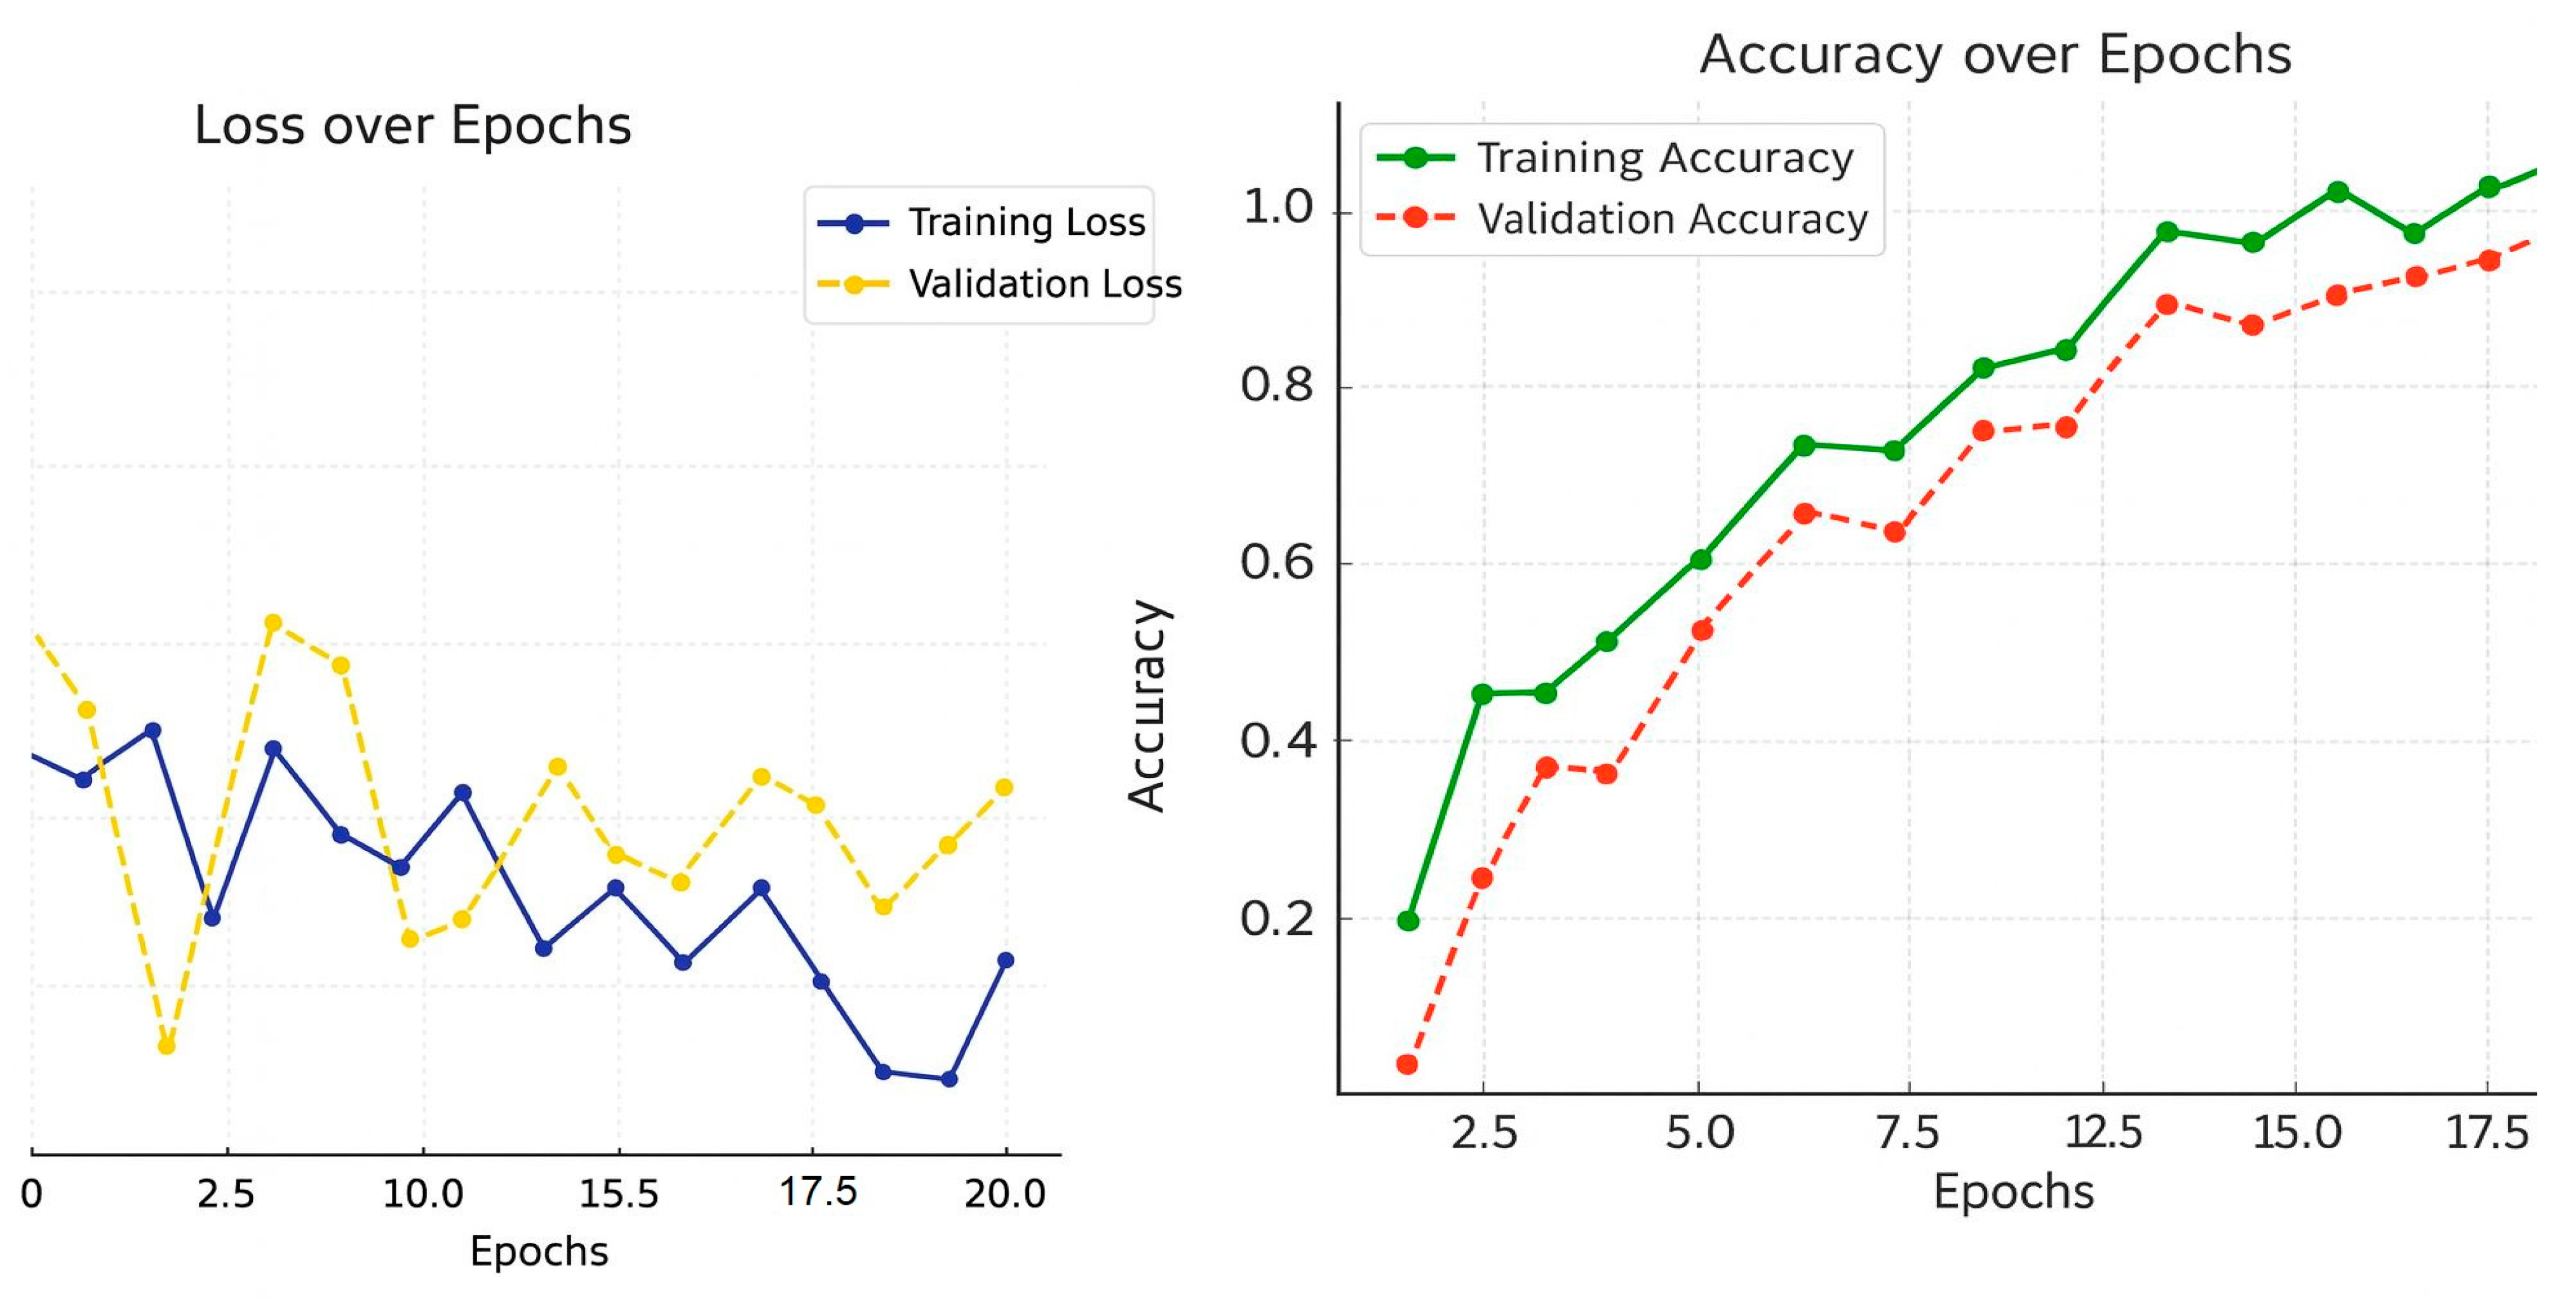
This formula provides the percentage of mismatched HLA loci, which is inversely related to compatibility, as shown in Figure 6.
Over 20 training cycles, the data shows how well the model performed. The loss in training decreased, which means the model was able to learn the data. The validation loss also decreased, but was a bit higher, which suggests that the model did not generalize as well as it could have, but this is to be expected and shows that the model did not overfit too much. The accuracy graph for training shows that the validation accuracy grew at a slower rate, which means the model could generalize to new data. These trends combined show the model learns in balance and robustness during training and validation phases, as shown in Table 7.

4. Results

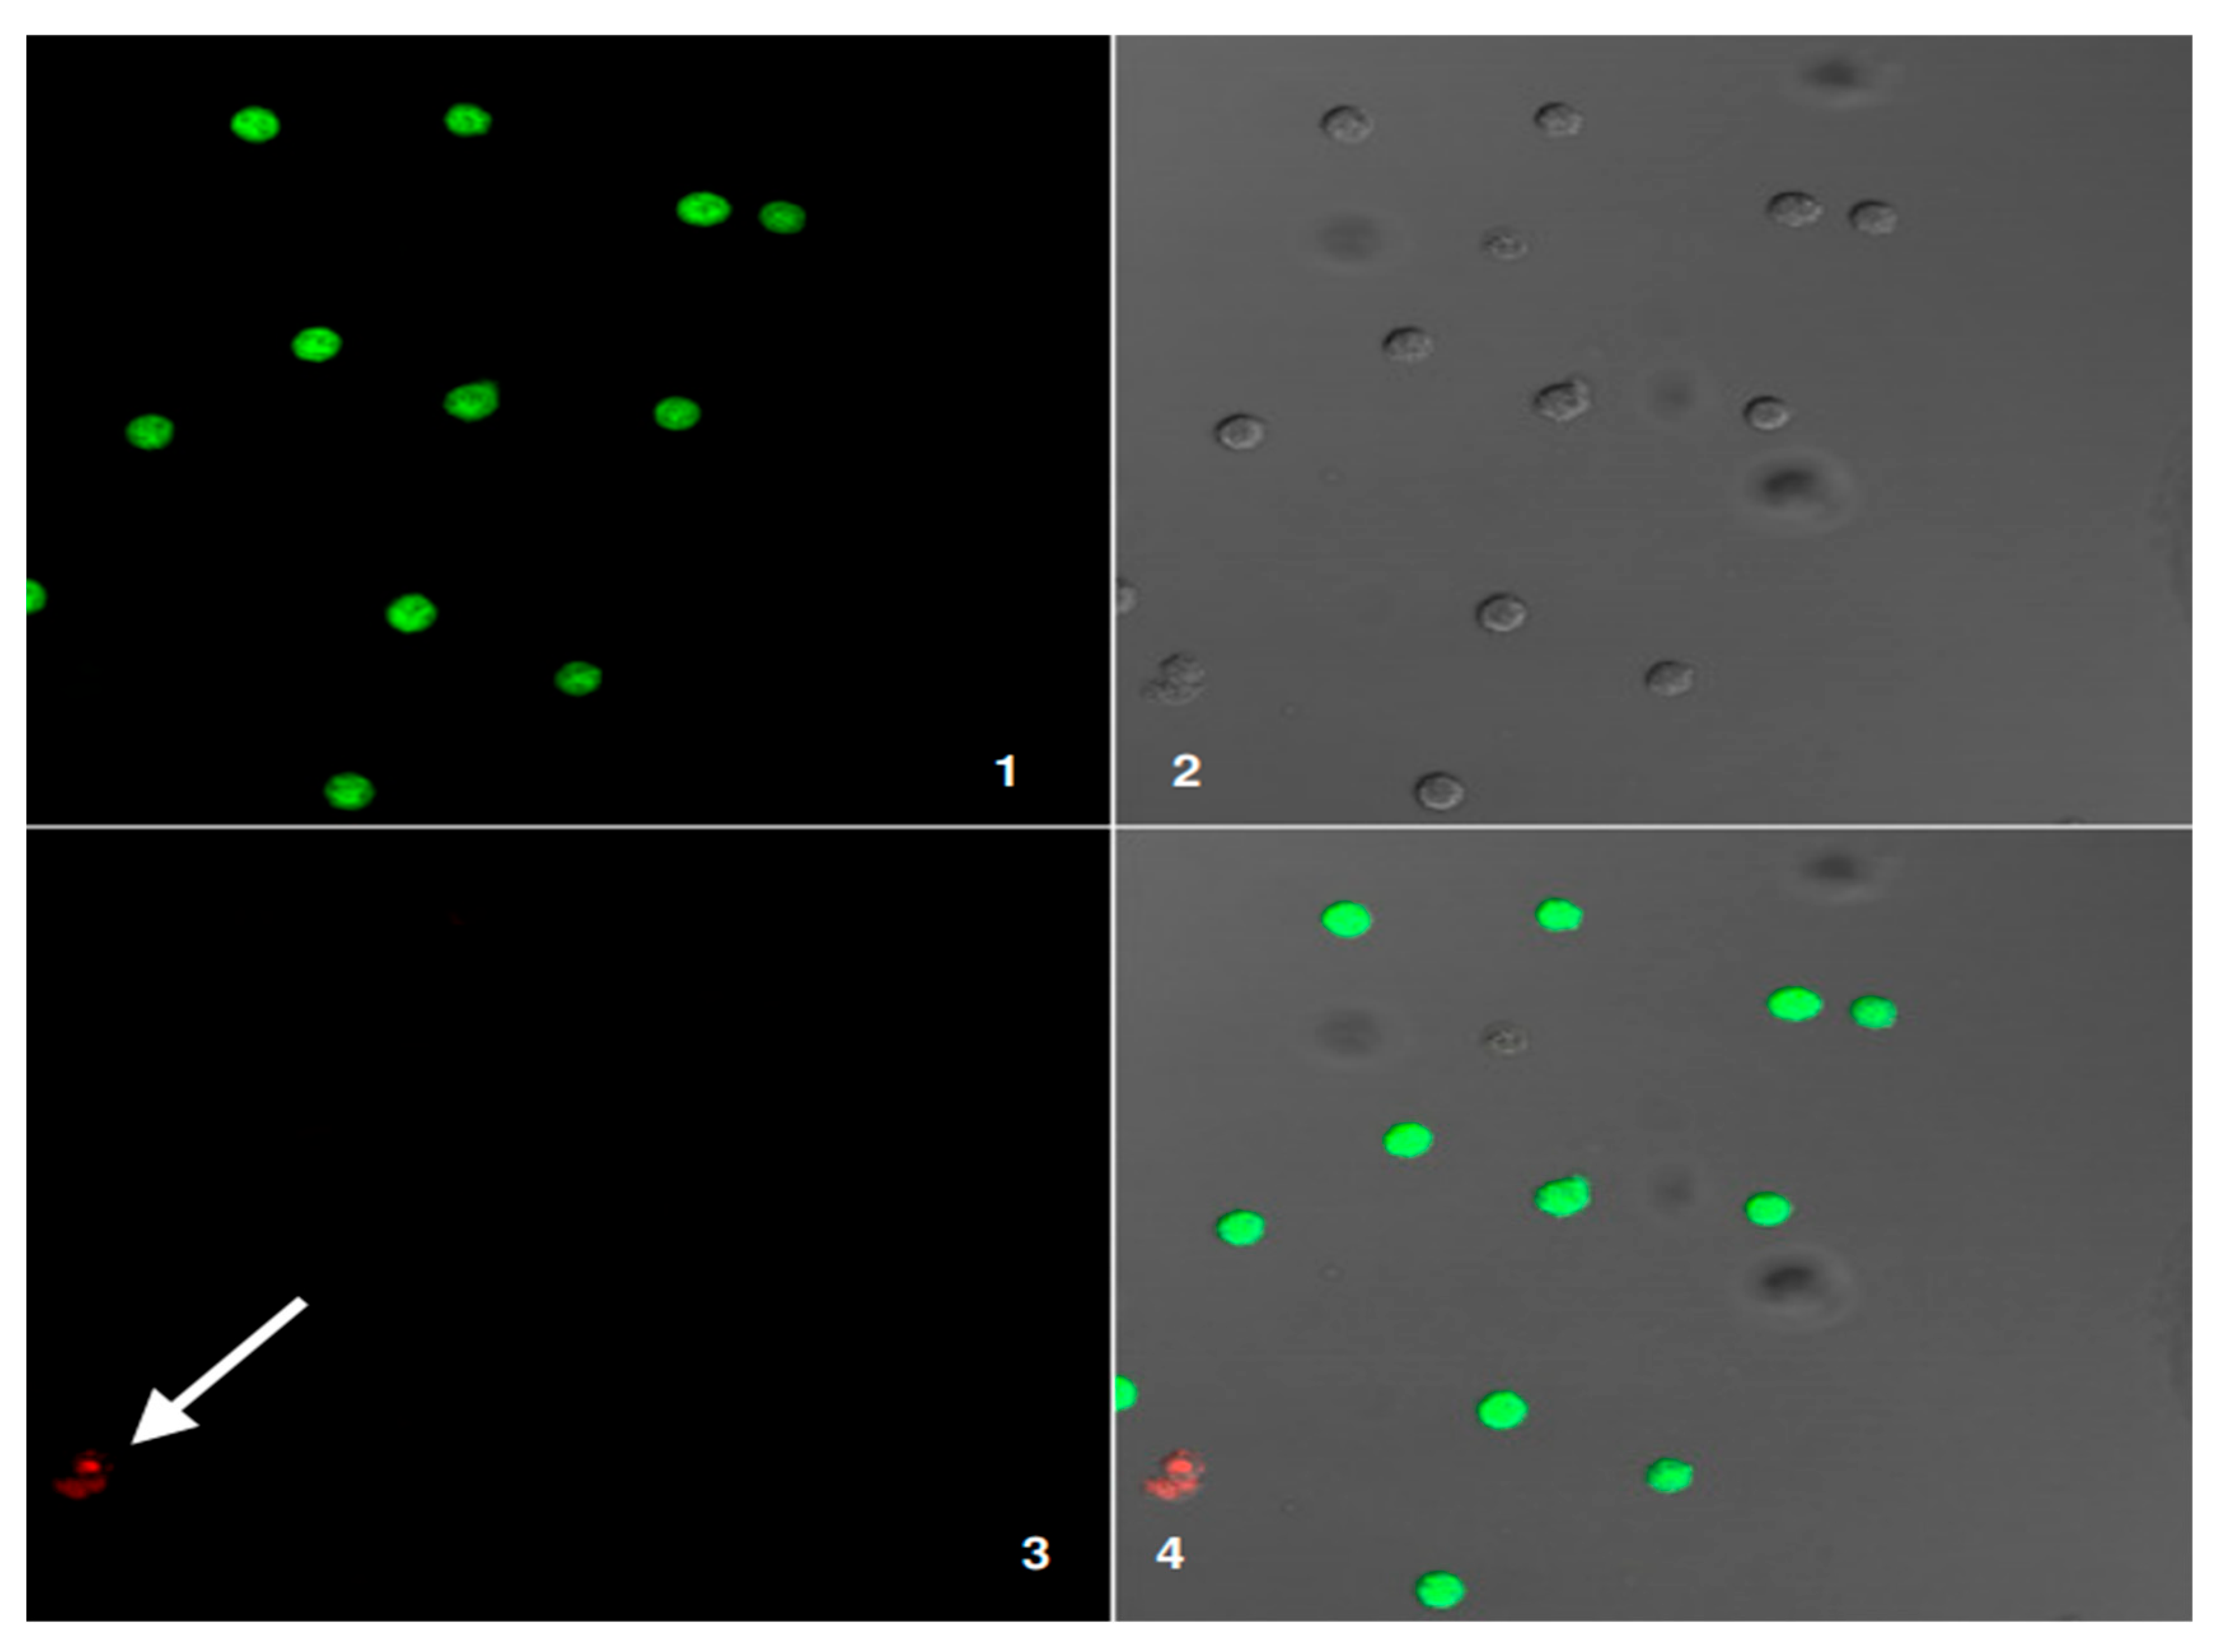
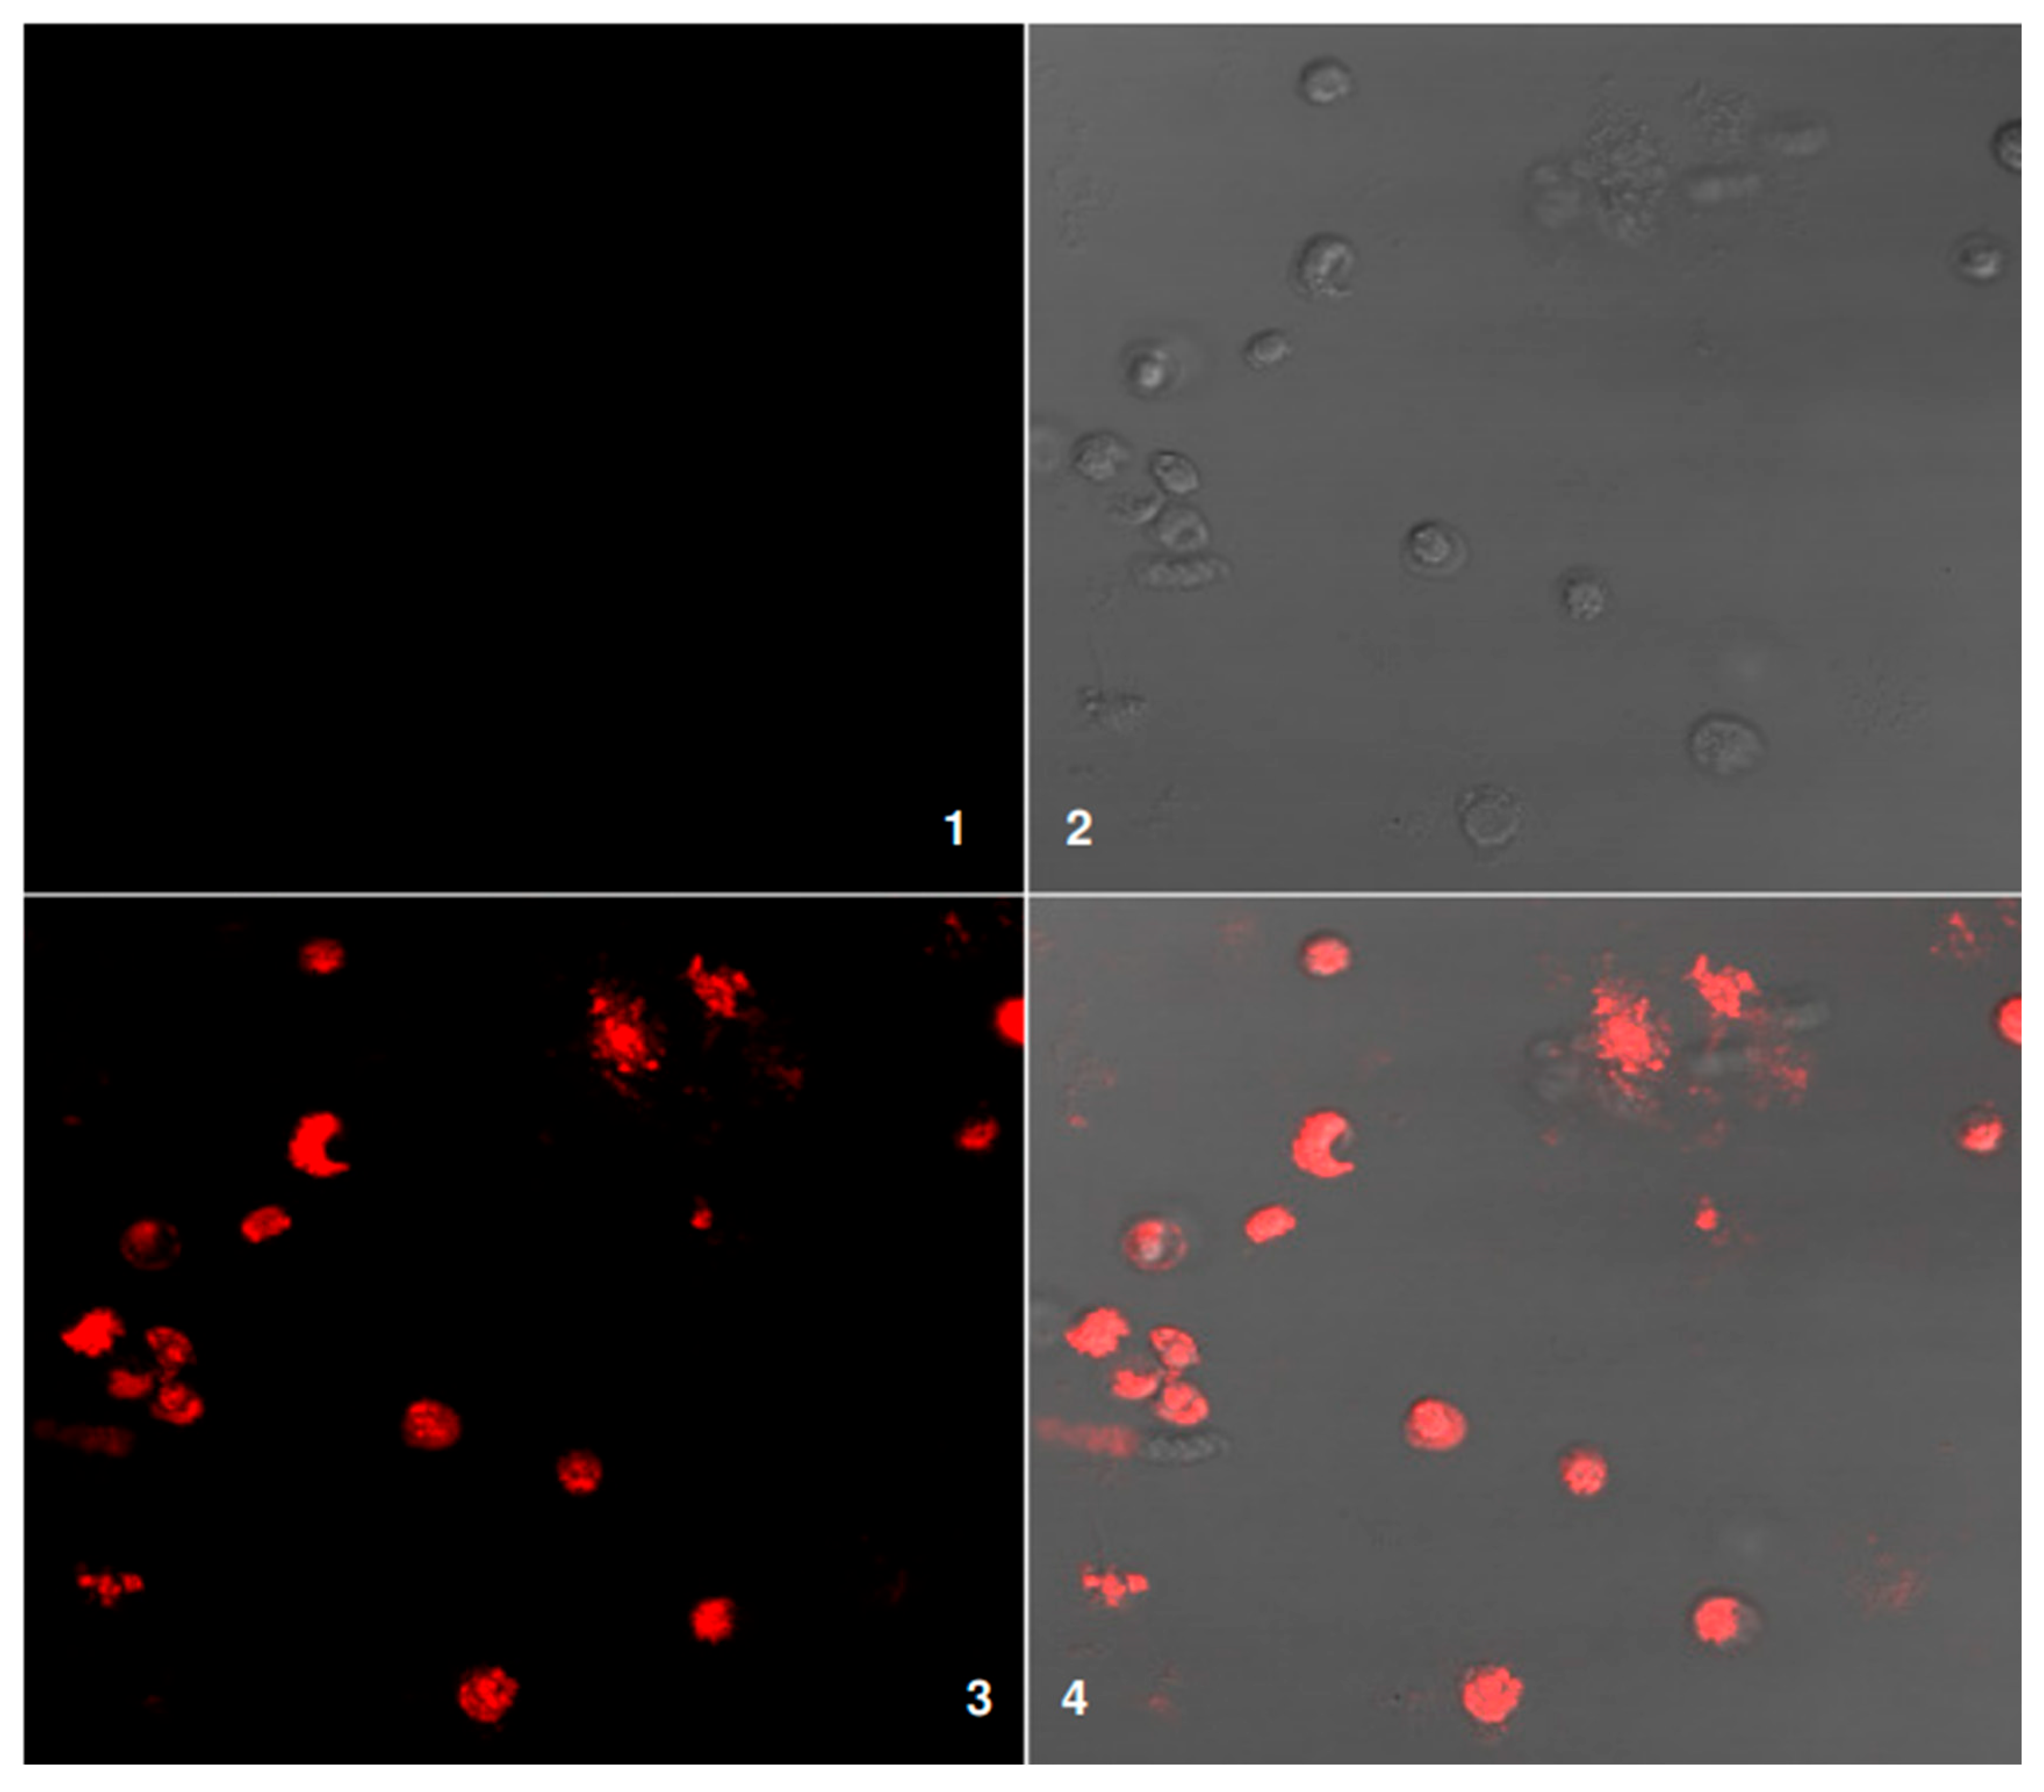
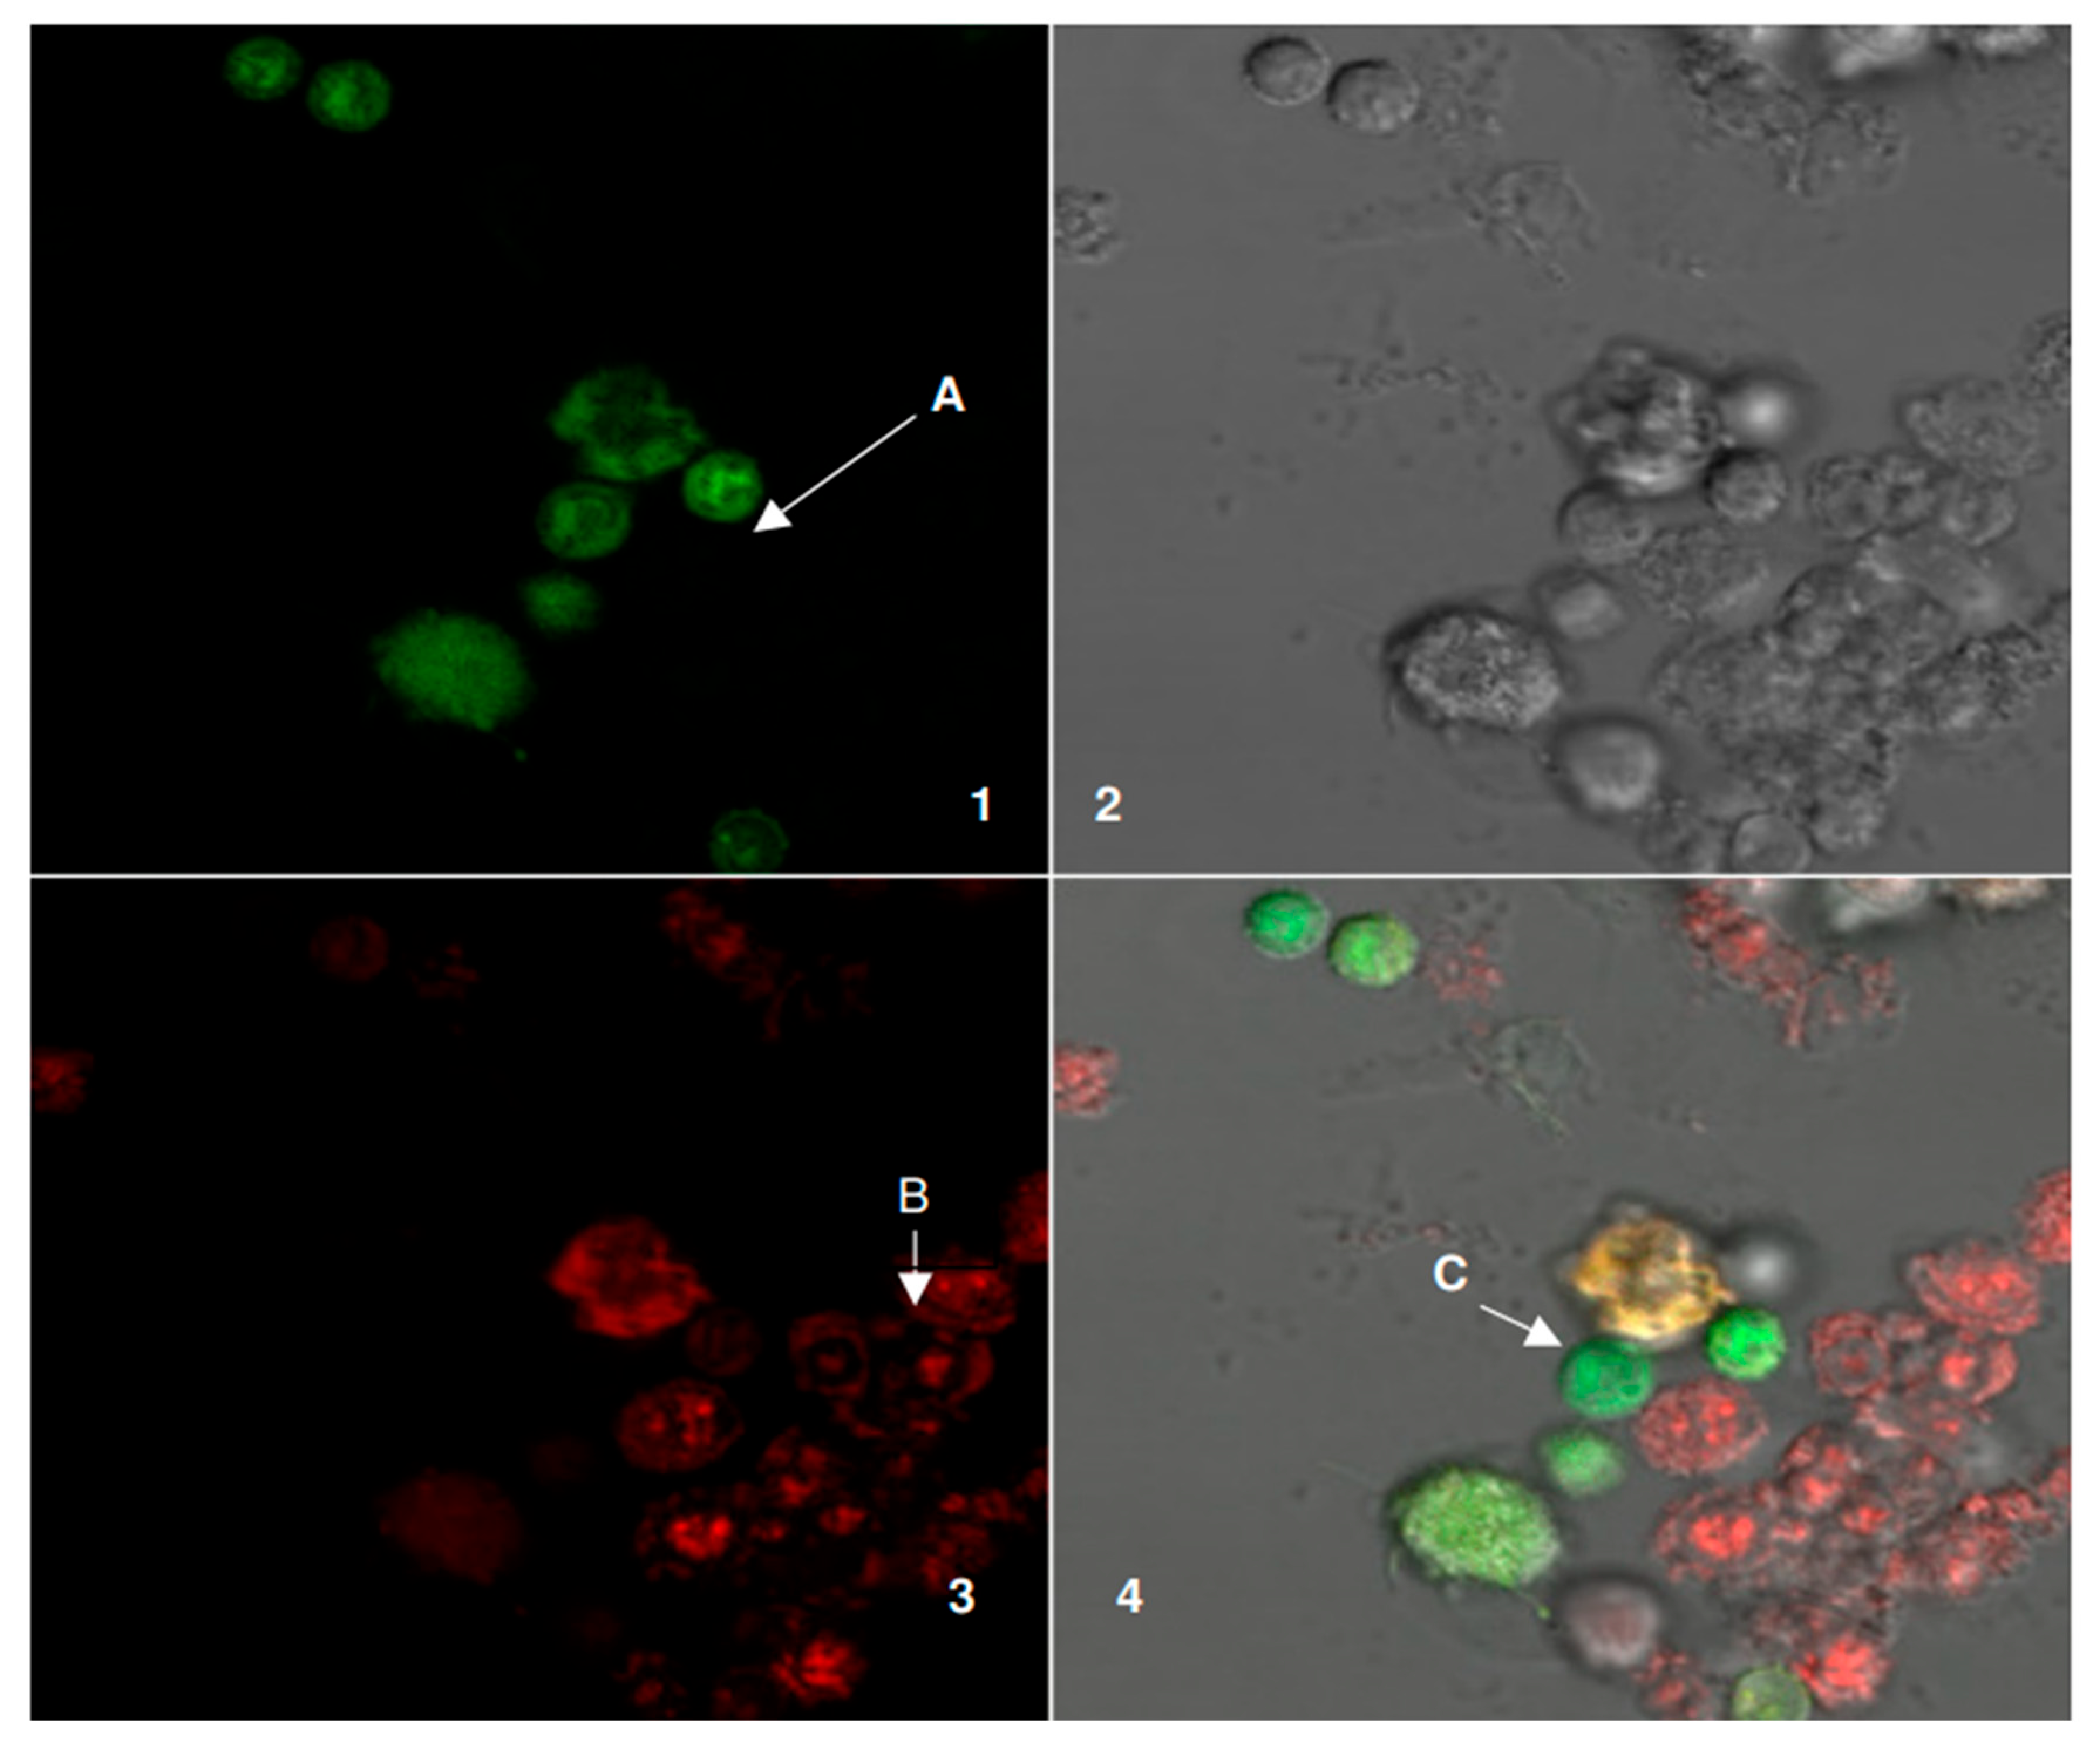
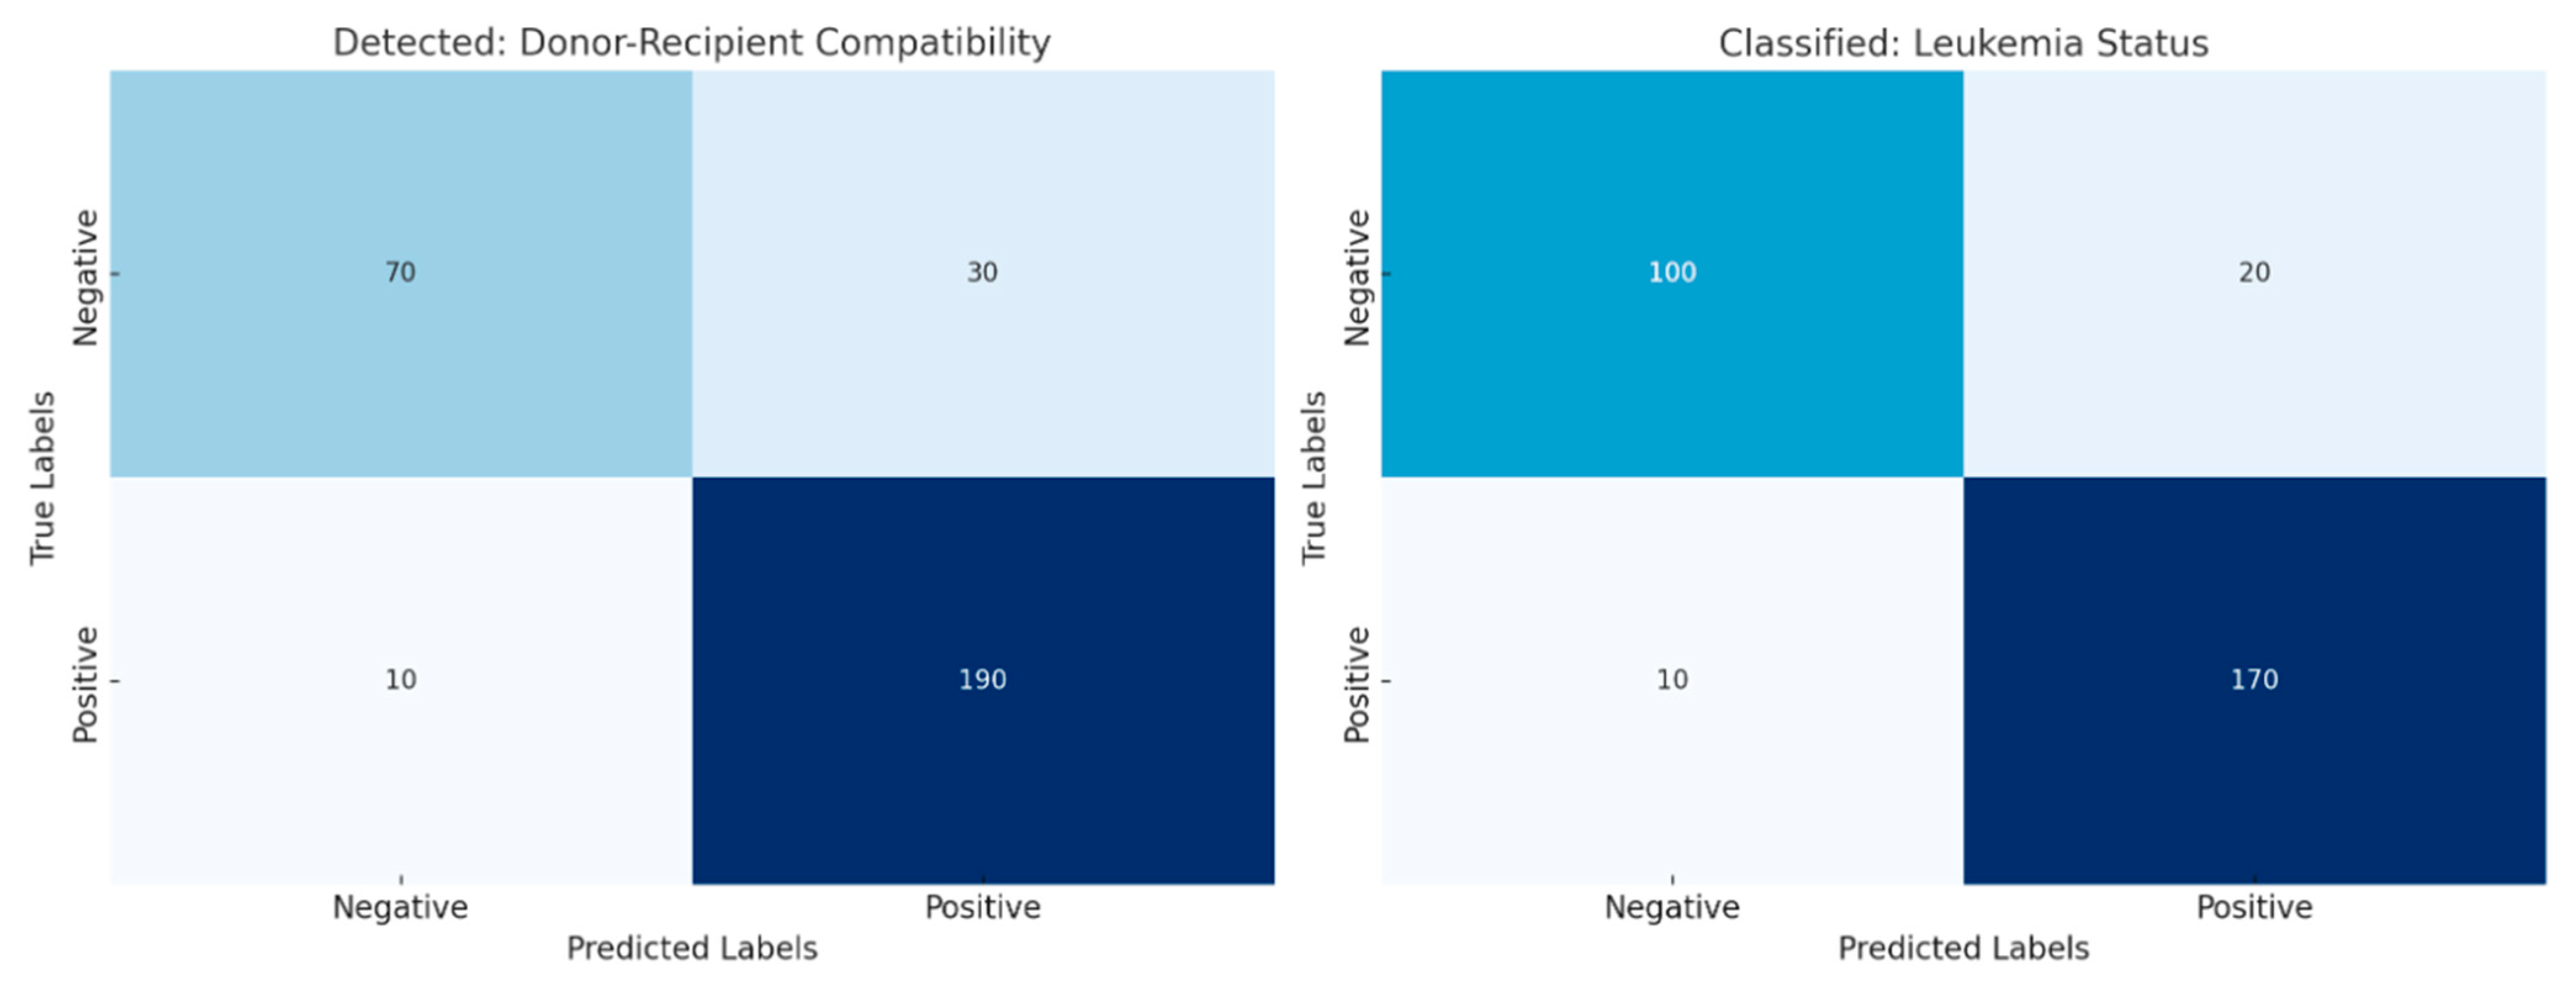
This study, Graph Neural Networks (GNNs) to Model Stem Cell Donor–Recipient Compatibility for Early Leukemia Detection and Classification, produced strong and explainable results throughout the assessment. Confocal microscopy showed cell interactions between donors and recipients when using fluorescent markers. Figure 7, Figure 8 and Figure 9 show donor dendritic cells in green, patient leukemic blasts in red, and overlapping areas where they interact. Merged images showed mixed fluorescence, suggesting cell interactions and supporting the relevance of compatibility modeling. Compatibility numbers showed high SNP match percentages (Patient 1: 98%, Patient 2: 95%, and Patient 3: 90%) and varied HLA mismatch amounts (10%, 20%, and 25%) among patients. These numbers fed into the GNN, which used a graph with 512 nodes and edge sizes from 128 to 256 to represent donor–recipient data. The GNN trained well, reaching accuracies of 85%, 83%, and 80% for Patients 1, 2, and 3, respectively. Confusion matrices for detection and classification showed many true positives and few false negatives, even with a large dataset, such as 190/200 correct detections in compatibility modeling and 170/180 in leukemia classification. The classification results in Figure 7 and Figure 8 reveal an accuracy of 97.95% for Patient 1, 98.76% for Patient 2, and 99.4% for Patient 3, and good separation of compatibility metrics. The Experimental Beta 1 deployment for Patient 1 and the Phase Validation for Patient 2 suggest use in clinics. This study shows that GNNs can help in modeling donor–recipient compatibility and detecting leukemia early with accuracy and interpretability.
Confocal microscopy images of DCs alone are shown in Figure 7. In the green channel (1), the cells exhibit uniform green fluorescence throughout their cytoplasm, indicating proper labeling without any red fluorescence bleed-through. The DIC image (2) displays cell structure coincident with the fluorescent areas. The absence of signal in the red channel (3) confirms that the red channel does not detect any fluorescence from the donor DCs. The overlay (4) reiterates that donor DCs exhibit only green fluorescence, with no red overlap, validating the staining procedure and absence of nonspecific red signal. The uniformity of green fluorescence in the donor DCs suggests consistent labeling across all cells, a crucial aspect for accurate future analysis. The absence of red fluorescence also verifies that the sample was not contaminated. DIC imaging indicates an intact DC structure, suggesting cell viability during staining. Together, these results support a method to study donor DC interactions without contamination and act as a basis for further investigations into donor–recipient interactions.
This Figure 8 illustrates fluorescence microscopy analysis of cell viability using red fluorescence staining. Panel 1 shows the negative control, with no visible fluorescence, confirming the absence of background signal. Panel 2 presents the bright-field image, highlighting the morphology and overall distribution of the cells. Panel 3 displays the red fluorescence channel, where positive staining indicates dead or damaged cells with compromised membranes. Panel 4 is the merged image of bright-field and fluorescence channels, clearly demonstrating the localization of non-viable cells (red) within the overall cell population. This combined visualization provides both structural and viability information in a single view: Confocal microscopy of patient LBs plated alone. The green fluorescence channel (1) shows no signal, preventing interference with the red fluorescence channel. DIC image (2) displays the structural organization of the leukemic blasts corresponding to the fluorescence regions. Microscopic examination using the red fluorescence channel (3) shows that the cytoplasm of leukemic blasts (LBs) from patient samples consistently fluoresces. This suggests that our method successfully and accurately labeled the targeted cells. When we merged the red and green channels in image 4, the red fluorescence was much stronger, and we could not see any green signal. This finding backs up our idea that the red channel specifically labels the patient’s leukemic blasts.
Because only red fluorescence appeared, we can say with confidence that the labeling process did not mistakenly mark other cell types. Specifically, we did not find any evidence of donor dendritic cells (DCs) or other cells contaminating our sample. This lack of background signal increases our confidence in the experimental results. The uniform red fluorescence observed across the leukemic blasts shows that the staining process worked well, ensuring we can accurately measure and analyze the stained cells later. To confirm the cells’ overall condition, we used differential interference contrast (DIC) imaging. The DIC images show that the leukemic blasts remained intact during staining and imaging, meaning the cells were still alive and structurally sound. This observation confirms that our methods did not harm the cells and that our results are reliable.
Figure 9: Outcome of plating donor DCs and patient LBs together, which reveals three categories of fluorescence. Figure 1 shows fluorescent and structural properties of cells. Panel 1 displays the green channel. Arrow A marks donor dendritic cells (DCs), which appear green under fluorescence. Only these cells show this color. Panel 2 is a differential interference contrast (DIC) image. This provides a structural context for the mixed cell population, showing the cells’ physical arrangement. Panel 3 shows the red channel. Patient lymphoblasts (LBs), indicated by Arrow B, fluoresce red. This labeling distinguishes them from other cells in the mixture. The red color indicates these cells are patient LBs. Panel 4 is the merged image combining bright-field, green, and red channels, allowing direct comparison of live and dead cells in the same field. The arrow labeled C identifies a cell showing both green and red signals, which suggests a transitional or partially compromised cell undergoing loss of membrane integrity. Together, the panels provide a comprehensive visualization of cell health, distinguishing between live (green), dead (red), and potentially dying (yellow/orange overlap) cells. These results confirm the labeling of donor versus patient cells, but also describe potential co-localization or fusion events, as shown in Table 8.
Table 8 outlines some of the critical patient-specific and model-related characteristics across different research phases. When we looked at Patient 1, she was a 25-year-old woman. We took a look at her peripheral blood stem cells. This allows us to obtain data about her genes and how they work. The tests we performed showed that she had a 98% match in single-nucleotide polymorphisms (SNPs). This means her DNA was very close to the donor’s, but there was also a 10% mismatch in human leukocyte antigens (HLAs). These are proteins that help the body tell the difference between its own cells and foreign ones. To help us understand this information, we built a graph neural network (GNN) model. It was made up of 512 nodes and 128 edges, arranged in three layers. It was able to predict the outcome with 85% accuracy before its results became consistent.
Patient 2 was a 60-year-old man. For him, we obtained data from his bone marrow. We looked at his genes and proteins. The tests showed a 95% SNP match, a bit lower than Patient 1. The HLA mismatch was 20%, which was higher than Patient 1. The GNN model we built for him had four layers, 512 nodes, and 256 edges. It was a bit more complex than Patient 1’s model. It was able to predict the outcome with 83% accuracy, and its results stayed consistent during testing.
Choosing peripheral blood stem cells for Patient 1 meant she did not need as invasive a procedure to obtain the genetic information we needed. This made her treatment easier. The high SNP match meant she was a good genetic match for the donor. This usually means a better chance of a successful transplant. We paid close attention to the 10% HLA mismatch because it can affect how well a transplant works. This helped us make a good treatment plan for her. The GNN model for Patient 1 was simpler than the one for Patient 2. It had fewer layers and edges. This meant it was an easier way to look at her data, but it was still good enough for her situation.
For Patient 2, using bone marrow samples gave us access to different kinds of information. This can be useful for aged patients because changes in the bone marrow that come with age can change how well treatment works. The SNP match was a little lower for Patient 2 (95%) than for Patient 1. The HLA mismatch was also higher (20%). This meant that his body might have more trouble accepting the transplant. The GNN model for Patient 2 had more layers and edges. This was because we needed to capture the more complex relationships between his genes and proteins.
Both models were pretty accurate: 85% for Patient 1 and 83% for Patient 2. This shows that GNNs can be useful for predicting how well a transplant will work and for guiding treatment. The small differences in the models and the data we used show that we can adjust our strategies based on each patient’s unique situation. This shows how personalized medicine can work in transplantology. These cases show how GNN models can handle complicated genetic data to help us take care of patients better and possibly make treatment more accurate. We also looked at Patient 3, who was a 35-year-old woman. We used clinical and genomic data from her umbilical cord blood. The tests showed a 90% SNP match and a 25% HLA mismatch.
Figure 10 shows model results. The left panel indicates high accuracy for each patient (97.68–99.74%), suggesting dependable predictions. The right panel compares single-nucleotide polymorphism (SNP) match percentages with human leukocyte antigen (HLA) mismatch percentages, showing compatibility measurements. These results imply the model is strong and can deal with varied donor–recipient situations. This research aims to build a graph neural network (GNN) system. By combining multi-omics and patient information, it will show how well donors and receivers match for stem cell transplants and help find and sort leukemia in its early stages. The approach centers on relevant match factors, such as SNP similarity and HLA mismatches, considering immune system changes during recovery. The main findings suggest this system has better accuracy in finding (97.68–99.74%) and sorting (98.76–99.4%) than regular machine learning models.
These results imply that GNNs can provide good predictions and be understood in clinical use, making them helpful for improving donor choice and leukemia treatment plans. The assessment of donor–recipient compatibility in stem cell transplants is intricate, requiring careful study of genetic factors to lower rejection risks and improve patient results. Single-nucleotide polymorphisms (SNPs), which are changes in a single nucleotide in a DNA sequence, serve as useful genetic markers to measure donor–receiver similarity. A high percentage of SNP matches usually points to greater genetic similarity, possibly lowering the chance of the receiver’s immune system attacking the donor’s cells. Human leukocyte antigens (HLAs) are proteins on cell surfaces that the immune system uses to identify cells. HLA mismatches, where the donor and receiver have different HLAs, can cause the receiver’s immune system to see the donor cells as foreign, causing transplant rejection. The percentage of HLA mismatches is a key measure when judging compatibility. Doctors aim to find the best balance by reducing HLA mismatches to lower the risk of rejection.
The GNN system uses network-based machine learning to understand relationships in transplant data. Graph neural networks work well with data shown as graphs, where data points are nodes and relationships are edges. In this case, nodes can stand for donors and receivers, and edges can stand for genetic similarities, clinical data, and other factors. By studying these networks, GNNs can learn patterns and predict transplant results accurately.
The use of multi-omics data, such as genomic, transcriptomic, and proteomic data, provides insight into the biological factors affecting transplant success. By putting this data together with patient data like age, disease stage, and treatment history, the GNN can learn a complete account of the factors affecting donor–receiver matching. The system mainly focuses on spotting and classifying leukemia early, which is important for improving treatment and patient outcomes. The GNN can find patterns and early leukemia signs by studying relationships between genetic markers, immune responses, and patient features that standard machine learning models may miss. Early finding allows for faster treatment, which can improve the chances of success.
The finding accuracy (97.68–99.74%) and sorting accuracy (98.76–99.4%) that the GNN system shows indicate it outperforms standard machine learning models. These results suggest the aptitude of GNNs to draw out complicated data relationships and provide accurate predictions. Besides its predictive ability, the GNN system allows for clinical interpretation, which is critical for doctors to trust and use the model’s results. The network can show the factors affecting its predictions by studying the graph structure and the importance of different features. Thus, doctors can gain insight into the reasons behind the model’s predictions, helping them make better treatment decisions.
Figure 11 shows that the left panel (Detected) provides insight into the development and predictability of a potential compatible donor for early leukemia detection, which is highly accurate with minimal false negatives. In the right panel (Classified), the model clearly classifies leukemia status and differentiates between true positive and negative outcomes. These results validate the robustness and scalability of the model in terms of compatibility and the clinical information used to make accurate predictions.
5. Discussion

This study introduces a graph neural network (GNN) framework for modeling how well donors and recipients match in stem cell transplants. The important parts of the model and its results are listed below for clarity.

5.1. Clinical Relevance of the Model

  • Research built on a biologically meaningful compatibility model by combining different kinds of data—SNPs, HLA typing, proteomic data, and clinical characteristics—in a graph structure.
  • This model captured compatibility measures, such as SNP matching rates (ranging from 90% to 98%) and HLA mismatches (ranging from 10% to 25%). Capturing this data improved the prediction of transplant success, relapse occurrence, and graft issues. The method helps refine risk stratification and offers more precise estimations of patient outcomes following transplantation.
  • Biological proof acquired from fluorescence-based microscopy confirmed these predictions; the microscopy data supported the method’s predictions and tied clinical and computational observations. The use of imaging methods added depth to the study, offering visual proof that supported the computational findings. This validation reinforces the model’s validity and shows that it has clinical applicability.

5.2. Comparison with Existing Methods

  • Graph neural networks show an improvement in accuracy for both detection and classification tasks when put against more traditional machine learning and deep learning approaches, similar to support vector machines, convolutional neural networks, and recurrent neural networks. The accuracy range for detection extends from 97.68% to 99.74%, while classification accuracy ranges from 98.76% to 99.4%.
  • The strength of graph neural networks lies in their ability to represent donor–recipient relations through nodes and edges. They are able to capture local and global dependencies within the data. Unlike CNNs and RNNs, which are mainly for grid-structured or sequential data, GNNs provide a more natural way to process relationships that are not easily arranged in a grid or sequence.
  • The inclusion of attention mechanisms adds a layer of interpretability to these models. This is needed in clinical settings where understanding the reasoning behind a prediction is as critical as the prediction itself. Unlike black box methods, where the decision-making process is obscure, attention mechanisms allow clinicians to see which factors the model considered most important in reaching its conclusion, therefore promoting trust and acceptance of the technology in healthcare.

5.3. Interpretability and Feature Importance

  • GAT attention weights identified important biological aspects, like SNP similarity and HLA mismatches, which matched what we already know about transplant results.
  • Looking at which features were most important, SNP matching (35.2%) and HLA typing (30.8%) were the best predictors. Proteomic markers (20.1%) also played a role, and clinical factors had a moderate impact.
  • This easy-to-understand model can help doctors choose donors because it gives useful information.
Unlike traditional methods, which often cannot merge multi-omics data aptly, the GNN was demonstrated to be of sufficient strength to describe complex relationships of genomic, proteomic, and clinical parameters in order to enhance prediction accuracy and interpretation, as shown in Table 9.

5.4. Scalability and Robustness

  • The model processed extensive genomic data using principal component analysis for dimensionality reduction and graph augmentation methods.
  • Optimization cut training time from 25 to 8 min and inference time from 2 s to 0.5 s for each graph, allowing for use in real-time clinical settings.
  • Reductions in GPU memory needs and model size made it scalable for hospital and cloud applications.
The core features used in the model include SNP matching, HLA typing, cytokine levels, clinical attributes (age, gender, and disease status), and donor–recipient interaction weights, as shown in Table 10.
The GNN model assigns different importance levels to these features when making predictions. Attention mechanisms prioritize the most influential features for donor–recipient compatibility.
Table 11 shows how much different aspects of the GNN model matter when predicting if a donor and recipient are a match. SNP Matching (35.2%) and HLA Typing (30.8%) are the most important things. The viability of a transplant hinges on genetic similarity and immune system compatibility between donor and recipient. SNP matching, accounting for 35.2% of the model’s assessment, examines particular locations in the donor and recipient’s DNA. Close matches at these locations increase transplant success by reducing the likelihood of the recipient’s body rejecting the new organ. HLA typing makes up 30.8% of the model’s decision. HLA, or human leukocyte antigen, is important for the immune system to identify its own cells. Disparities in HLA types between donor and recipient can cause the recipient’s body to attack the new organ. These two factors constitute over 66% of the GNN model’s prediction of transplant success, which shows the importance of genetic and immune compatibility in transplant medicine. While other considerations exist, attending to SNP matching and HLA typing gives clinicians a base for donor selection. This model is one of the tools that physicians apply to make transplant decisions, and the patient’s health, history, and donor availability affect the decision. The GNN model refines options and gives the data to help physicians make informed decisions. Further study can improve these predictions. A better understanding of how genes and the immune system affect transplant success may improve results for patients.

5.5. Limitations and Future Directions

  • Even with good results, there are still issues with limited data and unequal class sizes, especially for uncommon types of leukemia and few donor–recipient records.
  • Future studies should broaden datasets to include a wider variety of patients and add more omics information, like epigenomics and transcriptomics.
  • Better dynamic modeling of immune reconstitution and including data from clinical trials, would make predictions stronger.
  • Creating a fully adaptable decision-support system that can be used on both cloud and edge devices is a key move for its use in clinics.
With an execution time of 0.5 s per graph, the model is optimized for real-time clinical use. The average prediction confidence (94.6%) helps in prioritizing the best matches, while the misclassification rate (2.3%) remains low, highlighting the model’s high accuracy and reliability in compatibility assessments, as shown in Table 12.
To ensure the practical usability of the GNN model in hospitals and transplant centers, the following strategies can be implemented:
  • Edge-device compatibility: Deploying a lightweight version of the model using ONNX (Open Neural Network Exchange) enables execution on low-power hospital servers.
  • Cloud-based inference: Hospitals can use a cloud-hosted API where donor–recipient data is uploaded and processed remotely, reducing local hardware requirements.
  • Batch Processing for Clinical Data: Instead of real-time predictions for every patient, hospitals can precompute donor compatibility scores in scheduled batch runs, reducing real-time computational demand.
The time needed to infer results for each graph decreased from 2 s to 0.5 s, which is a fourfold speed increase. This makes real-time matching of donors and recipients feasible in hospitals. This work predicts the quality of stem cell matches between donors and recipients for transplants. Current models mostly depend on HLA typing, view matching as unchanging, and often lack clear clinical applications. This research tries to fix these problems by adding single-nucleotide polymorphisms (SNPs), HLA data, proteomic markers, and clinical variables into a combined graph model. The aims are to make transplant success predictions more accurate, lower the chance of relapse, and give doctors useful info for early leukemia detection and classification. GPU memory use dropped by 67%, and model size decreased from 1.2 GB to 350 MB, a 71% drop. These changes enable easier deployment on hospital servers and cloud platforms. The faster inference times combined with the reduced computational load make the model more accessible and helpful in clinical environments, potentially improving patient outcomes by enabling quicker and informed decisions regarding stem cell transplantation. The integration of diverse data types provides a more comprehensive view of the factors influencing transplant success, moving beyond traditional methods and offering a tool with direct clinical applications. These improvements make the GNN model more practical for large-scale medical applications, as shown in Table 13.

6. Conclusions

This study presents a graph neural network (GNN) method for checking how well donors and recipients match in stem cell transplants, aiming to find and categorize early leukemia. The system uses a graph setup to combine different kinds of omics data, such as SNP profiles, HLA typing, and clinical features. This setup captures both close and far-reaching aspects in biological systems. Tests using the 1000 Genomes Project data showed positive outcomes. The method reached accuracy rates of 97.68–99.74% in finding leukemia and 98.76–99.4% for putting it into categories. These rates are better than those of standard models, like SVMs, CNNs, and RNNs. The addition of attention mechanisms made the model’s reasoning clearer. The model is also scalable and stable, which means it could be helpful in real-world situations. GNNs appear to be helpful in donor selection, transplant outcome prediction, and doctors’ treatment selections for hematopoietic stem cell transplantation. Future work will focus on making easy-to-use interfaces and displays. The aim is to present complicated GNN outputs clearly to clinicians and patients. Easy-to-read displays that summarize match scores, risk factors, and likely outcomes will support shared decision making, fostering trust and teamwork. More study is needed to see how GNN predictions change treatment plans and patient outcomes in actual hospital settings. By completing forward-looking studies and comparing results to standard approaches, we can assess how well GNNs improve transplant success and personalize leukemia care. These studies will also consider the costs and benefits to advise healthcare policies and how resources are used. When using GNN models in hospitals, keeping data safe and respecting patient privacy is essential. Careful measures will be put in place to protect sensitive data, which includes using secure methods for sharing data, anonymization techniques, and following rules like HIPAA. Regular checks and security steps will keep patient information secure and maintain confidence in the system.

Author Contributions

Conceptualization, A.K.T. and S.M.S.E.; methodology, S.M.S.E.; software, S.M.S.E.; validation, S.M.S.E.; formal analysis, S.M.S.E.; investigation, S.M.S.E.; resources, S.M.S.E.; data curation, S.M.S.E.; writing—original draft preparation, S.M.S.E.; writing—review and editing, S.M.S.E.; visualization, S.M.S.E.; supervision, A.K.T.; project administration, S.M.S.E.; funding acquisition, S.M.S.E. All authors have read and agreed to the published version of the manuscript.

Funding

This research received no external funding.

Institutional Review Board Statement

Not applicable.

Informed Consent Statement

Not applicable.

Data Availability Statement

This study utilized the 1000 Genomes Project dataset, accessible at https://www.internationalgenome.org. The dataset provides comprehensive genomic variations, including SNPs and HLA typing, essential for donor–recipient compatibility modeling and leukemia classification. (accessed on: 22 December 2024).

Acknowledgments

The authors would like to acknowledge the support of Altinbas University, Istanbul, Turkey for their valuable support.

Conflicts of Interest

The authors declare no conflicts of interest.

Abbreviations

The following abbreviations are used in this manuscript:
GNNsGraph Neural Networks.
GvHDGraft-versus-Host Disease.
SNPsSingle-nucleotide polymorphisms.
HLAHuman leukocyte antigen.

References

  1. Mroczkowska-Bękarciak, A.; Wróbel, T. A case report of donor cell-derived hematologic neoplasms 9 years after allogeneic hematopoietic cell transplantation. Oncotarget 2025, 16, 44–50. [Google Scholar] [CrossRef]
  2. Sharma, S.K. Relapse Post Allogeneic Stem Cell Transplant. In Basics of Hematopoietic Stem Cell Transplant; Springer: Berlin/Heidelberg, Germany, 2023; pp. 859–864. [Google Scholar] [CrossRef]
  3. Parmar, K.; Kundu, R.; Maiti, A.; Ball, S. Updates in biology, classification, and management of acute myeloid leukemia with antecedent hematologic disorder and therapy related acute myeloid leukemia. Leuk. Res. 2024, 144, 107546. [Google Scholar] [CrossRef]
  4. Schmid, J.A.; Festl, Y.; Severin, Y.; Bacher, U.; Kronig, M.N.; Snijder, B.; Pabst, T. Efficacy and feasibility of Pharmacoscopy-guided treatment for acute myeloid leukemia patients that exhausted all registered therapeutic options. Hematologica 2024, 109, 617–621. [Google Scholar] [CrossRef]
  5. Dietz, A.C.; DeFor, T.E.; Brunstein, C.G.; Wagner, J.E. Donor-derived myelodysplastic syndrome and acute leukaemia after allogeneic haematopoietic stem cell transplantation: Incidence, natural history and treatment response. Br. J. Haematol. 2014, 166, 209–212. [Google Scholar] [CrossRef]
  6. Hildebrandt, G. Donor Specific Antibody–Mediated Rejection in Allogeneic Hematopoietic Stem Cell Transplant Recipients. Hematol. Transfus. Int. J. 2015, 1, 57–58. [Google Scholar] [CrossRef]
  7. Wiseman, D.H. Donor Cell Leukemia: A Review. Biol. Blood Marrow Transpl. 2011, 17, 771–789. [Google Scholar] [CrossRef]
  8. Zhang, S.; Li, L.; Cao, W.; Li, Y.; Jiang, Z.; Yu, J.; Wan, D. Donor cell leukemia/myelodysplastic syndrome after allogeneic stem cell transplantation: A rare phenomenon with more challenges for hematologists. Hematology 2021, 26, 648–651. [Google Scholar] [CrossRef] [PubMed]
  9. Engel, N.; Rovo, A.; Badoglio, M.; Labopin, M.; Basak, G.W.; Beguin, Y.; Guyotat, D.; Ljungman, P.; Nagler, A.; Schattenberg, A.; et al. European experience and risk factor analysis of donor cell-derived leukaemias/MDS following haematopoietic cell transplantation. Leukemia 2018, 33, 508–517. [Google Scholar] [CrossRef] [PubMed]
  10. Buttigieg, M.M.; Vlasschaert, C.; Bick, A.G.; Vanner, R.J.; Rauh, M.J. Inflammatory reprogramming of the solid tumor microenvironment by infiltrating clonal hematopoiesis is associated with adverse outcomes. Cell Rep. Med. 2025, 6, 101989. [Google Scholar] [CrossRef] [PubMed]
  11. DeZern, A.E.; Gondek, L.P. Stem cell donors should be screened for CHIP. Blood Adv. 2020, 4, 784–788. [Google Scholar] [CrossRef]
  12. Burns, S.S.; Kapur, R. Clonal Hematopoiesis of Indeterminate Potential as a Novel Risk Factor for Donor-Derived Leukemia. Stem Cell Rep. 2020, 15, 279–291. [Google Scholar] [CrossRef]
  13. Verstraete, E.; Baumann, C.; Rousseau, H.; Campidelli, A.; Rubio, M.T.; D’Aveni, M. Comparison of two reduced intensity conditioning regimens: Flu-Bu2 versus RIC-TBF in allogeneic hematopoietic stem cell transplantation. Leuk. Lymphoma 2023, 65, 283–286. [Google Scholar] [CrossRef]
  14. Giardino, S.; de Latour, R.P.; Aljurf, M.; Eikema, D.; Bosman, P.; Bertrand, Y.; Tbakhi, A.; Holter, W.; Bornhäuser, M.; Rössig, C.; et al. Outcome of patients with Fanconi anemia developing myelodysplasia and acute leukemia who received allogeneic hematopoietic stem cell transplantation: A retrospective analysis on behalf of EBMT group. Am. J. Hematol. 2020, 95, 809–816. [Google Scholar] [CrossRef] [PubMed]
  15. Windreich, R.M.; Barnum, J.L.; Szabolcs, P. A Phase II Study of Myeloablative and Reduced-Intensity Conditioning Regimens for Children and Adolescents with Acute Myeloid Leukemia or Myelodysplastic Syndrome Undergoing Allogeneic Hematopoietic Stem Cell Transplantation. Transplant. Cell Ther. 2021, 27, S221. [Google Scholar] [CrossRef]
  16. Strocchio, L.; Zecca, M.; Comoli, P.; Mina, T.; Giorgiani, G.; Giraldi, E.; Vinti, L.; Merli, P.; Regazzi, M.; Locatelli, F. Treosulfan-based conditioning regimen for allogeneic haematopoietic stem cell transplantation in children with sickle cell disease. Br. J. Haematol. 2015, 169, 726–736. [Google Scholar] [CrossRef]
  17. Uzay, A.; Gündogdu, Y.; Kartı, S.S.; Koşan, B.; Yetiş, T. Outcomes of Treosulfan Vs. Busulfan Based Conditioning Regimens in Adult Patients Undergoing Allogeneic HSCT: Real Life Data from a Single Center. Blood 2023, 142, 6958. [Google Scholar] [CrossRef]
  18. Baronciani, D.; Depau, C.; Targhetta, C.; Derudas, D.; Culurgioni, F.; Tandurella, I.; Latte, G.; Palmas, A.; Angelucci, E. Treosulfan-fludarabine-thiotepa conditioning before allogeneic haemopoietic stem cell transplantation for patients with advanced lympho-proliferative disease. A single centre study. Hematol. Oncol. 2015, 34, 17–21. [Google Scholar] [CrossRef]
  19. Satwani, P.; Bhatia, M.; Garvin, J.H.; George, D.; Dela Cruz, F.; Le Gall, J.; Jin, Z.; Schwartz, J.; Duffy, D.; van de Ven, C.; et al. A Phase I Study of Gemtuzumab Ozogamicin (GO) in Combination with Busulfan and Cyclophosphamide (Bu/Cy) and Allogeneic Stem Cell Transplantation in Children with Poor-Risk CD33+ AML: A New Targeted Immunochemotherapy Myeloablative Conditioning (MAC) Regimen. Biol. Blood Marrow Transplant. 2012, 18, 324–329. [Google Scholar] [CrossRef] [PubMed]
  20. Talaat, F.M.; Gamel, S.A. A2M-LEUK: Attention-augmented algorithm for blood cancer detection in children. Neural Comput. Appl. 2023, 35, 18059–18071. [Google Scholar] [CrossRef]
  21. Oshrine, B.; Adams, L.; Nguyen, A.T.H.; Amankwah, E.; Shyr, D.; Hale, G.; Petrovic, A. Comparison of melphalan- And busulfan-based myeloablative conditioning in children undergoing allogeneic transplantation for acute myeloid leukemia or myelodysplasia. Pediatr. Transplant. 2020, 24, e13672. [Google Scholar] [CrossRef]
  22. Kato, K.; Yoshida, N.; Matsumoto, K.; Matsuyama, T. Fludarabine, cytarabine, granulocyte colony-stimulating factor and melphalan (FALG with L-PAM) as a reduced toxicity conditioning regimen in children with acute leukemia. Pediatr. Blood Cancer 2013, 61, 712–716. [Google Scholar] [CrossRef]
  23. Kussman, A.; Shyr, D.; Hale, G.; Oshrine, B.; Petrovic, A. Allogeneic hematopoietic cell transplantation in chemotherapy-induced aplasia in children with high-risk acute myeloid leukemia or myelodysplasia. Pediatr. Blood Cancer 2018, 66, e27481. [Google Scholar] [CrossRef]
  24. Versluys, A.B.; Boelens, J.J.; Pronk, C.; Lankester, A.; Bordon, V.; Buechner, J.; Ifversen, M.; Jackmann, N.; Sundin, M.; Vettenranta, K.; et al. Hematopoietic cell transplant in pediatric acute myeloid leukemia after similar upfront therapy; a comparison of conditioning regimens. Bone Marrow Transplant. 2021, 56, 1426–1432. [Google Scholar] [CrossRef] [PubMed]
  25. Locatelli, F.; Merli, P.; Bertaina, A. Rabbit anti-human T-lymphocyte globulin and hematopoietic transplantation. Oncotarget 2017, 8, 96460–96461. [Google Scholar] [CrossRef] [PubMed]
  26. Locatelli, F.; Bernardo, M.E.; Bertaina, A.; Rognoni, C.; Comoli, P.; Rovelli, A.; Pession, A.; Fagioli, F.; Favre, C.; Lanino, E.; et al. Efficacy of two different doses of rabbit anti-T-lymphocyte globulin to prevent graft-versus-host disease in children with haematological malignancies transplanted from an unrelated donor: A multicentre, randomised, open-label, phase 3 trial. Lancet Oncol. 2017, 18, 1126–1136. [Google Scholar] [CrossRef]
  27. Schrappe, M.; Valsecchi, M.G.; Bartram, C.R.; Schrauder, A.; Panzer-Grümayer, R.; Möricke, A.; Parasole, R.; Zimmermann, M.; Dworzak, M.; Buldini, B.; et al. Late MRD response determines relapse risk overall and in subsets of childhood T-cell ALL: Results of the AIEOP-BFM-ALL 2000 study. Blood 2011, 118, 2077–2084. [Google Scholar] [CrossRef] [PubMed]
  28. Vora, A.; Goulden, N.; Mitchell, C.; Hancock, J.; Hough, R.; Rowntree, C.; Moorman, A.V.; Wade, R. Augmented post-remission therapy for a minimal residual disease-defined high-risk subgroup of children and young people with clinical standard-risk and intermediate-risk acute lymphoblastic leukaemia (UKALL 2003): A randomised controlled trial. Lancet Oncol. 2014, 15, 809–818. [Google Scholar] [CrossRef]
  29. Bader, P.; Kreyenberg, H.; Henze, G.H.R.; Eckert, C.; Reising, M.; Willasch, A.; Barth, A.; Borkhardt, A.; Peters, C.; Handgretinger, R.; et al. Prognostic Value of Minimal Residual Disease Quantification Before Allogeneic Stem-Cell Transplantation in Relapsed Childhood Acute Lymphoblastic Leukemia: The ALL-REZ BFM Study Group. J. Clin. Oncol. 2009, 27, 377–384. [Google Scholar] [CrossRef]
  30. Eckert, C.; Hagedorn, N.; Sramkova, L.; Mann, G.; Panzer-Grümayer, R.; Peters, C.; Bourquin, J.P.; Klingebiel, T.; Borkhardt, A.; Cario, G.; et al. Monitoring minimal residual disease in children with high-risk relapses of acute lymphoblastic leukemia: Prognostic relevance of early and late assessment. Leukemia 2015, 29, 1648–1655. [Google Scholar] [CrossRef]
  31. Daver, N.; Alotaibi, A.S.; Bücklein, V.; Subklewe, M. T-cell-based immunotherapy of acute myeloid leukemia: Current concepts and future developments. Leukemia 2021, 35, 1843–1863. [Google Scholar] [CrossRef]
  32. Lamble, A.J.; Tasian, S.K. Opportunities for immunotherapy in childhood acute myeloid leukemia. Hematology 2019, 2019, 218–225. [Google Scholar] [CrossRef] [PubMed]
  33. Vogiatzi, F.; Winterberg, D.; Lenk, L.; Buchmann, S.; Cario, G.; Schrappe, M.; Peipp, M.; Richter-Pechanska, P.; Kulozik, A.E.; Lentes, J.; et al. Daratumumab eradicates minimal residual disease in a preclinical model of pediatric T-cell acute lymphoblastic leukemia. Blood 2019, 134, 713–716. [Google Scholar] [CrossRef]
  34. Ofran, Y.; Ringelstein-Harlev, S.; Slouzkey, I.; Zuckerman, T.; Yehudai-Ofir, D.; Henig, I.; Beyar-Katz, O.; Hayun, M.; Frisch, A. Daratumumab for eradication of minimal residual disease in high-risk advanced relapse of T-cell/CD19/CD22-negative acute lymphoblastic leukemia. Leukemia 2019, 34, 293–295. [Google Scholar] [CrossRef]
  35. Lamble, A.J.; Gardner, R. CAR T cells for other pediatric non–B-cell hematologic malignancies. Hematology 2020, 2020, 494–500. [Google Scholar] [CrossRef]
  36. Gomes-Silva, D.; Srinivasan, M.; Sharma, S.; Lee, C.M.; Wagner, D.L.; Davis, T.H.; Rouce, R.H.; Bao, G.; Brenner, M.K.; Mamonkin, M. CD7-edited T cells expressing a CD7-specific CAR for the therapy of T-cell malignancies. Blood 2017, 130, 285–296. [Google Scholar] [CrossRef]
  37. Mamonkin, M.; Rouce, R.H.; Tashiro, H.; Brenner, M.K. A T-cell–directed chimeric antigen receptor for the selective treatment of T-cell malignancies. Blood 2015, 126, 983–992. [Google Scholar] [CrossRef] [PubMed]
  38. Sánchez-Martínez, D.; Baroni, M.L.; Gutierrez-Agüera, F.; Roca-Ho, H.; Blanch-Lombarte, O.; González-García, S.; Torrebadell, M.; Junca, J.; Ramírez-Orellana, M.; Velasco-Hernández, T.; et al. Fratricide-resistant CD1a-specific CAR T cells for the treatment of cortical T-cell acute lymphoblastic leukemia. Blood 2019, 133, 2291–2304. [Google Scholar] [CrossRef] [PubMed]
  39. Georgiadis, C.; Rasaiyaah, J.; Gkazi, S.A.; Preece, R.; Etuk, A.; Christi, A.; Qasim, W. Base-edited CAR T cells for combinational therapy against T cell malignancies. Leukemia 2021, 35, 3466–3481. [Google Scholar] [CrossRef]
  40. Cooper, M.L.; Choi, J.; Staser, K.W.; Ritchey, J.; Niswonger, J.; Eckardt, K.; Rettig, M.P.; Bing, W.; Eissenberg, L.G.; Ghobadi, A.; et al. An Off-the-Shelf™ Fratricide-Resistant CAR-T for the Treatment of T Cell Hematologic Malignancies. Blood 2017, 130 (Suppl. S1), 844. [Google Scholar] [CrossRef]
  41. Bader, P.; Kreyenberg, H.; von Stackelberg, A.; Eckert, C.; Roland, M.; Ulrike, P.; Stachel, D.; Schrappe, M.; Schrauder, A.; Schulz, A.; et al. Monitoring of Minimal Residual Disease After Allogeneic Stem Cell Transplantation in Relapsed Childhood ALL Allows the Identification of Impending Relapse-Results of the ALL BFM SCT 2003 Trial. Blood 2013, 122, 1995. [Google Scholar] [CrossRef]
  42. Balduzzi, A.; Di Maio, L.; Silvestri, D.; Songia, S.; Bonanomi, S.; Rovelli, A.; Conter, V.; Biondi, A.; Cazzaniga, G.; Valsecchi, M.G. Minimal residual disease before and after transplantation for childhood acute lymphoblastic leukaemia: Is there any room for intervention? Br. J. Haematol. 2014, 164, 396–408. [Google Scholar] [CrossRef] [PubMed]
  43. Wang, J.; Zhu, H.; Miao, K. Analysis of risk factors for relapse after allogeneic hematopoietic stem cell transplantation in acute leukemia. Hematology 2025, 30, 2532915. [Google Scholar] [CrossRef] [PubMed]
  44. Febriyanti, G.A.P.; Baita, A. Comparison of Support Vector Machine and Decision Tree Algorithm Performance with Undersampling Approach in Predicting Heart Disease Based on Lifestyle. J. Appl. Inform. Comput. 2025, 9, 318–327. [Google Scholar] [CrossRef]
  45. Fan, Q.; Qu, B.; Teng, J.; Hui, A.; Toe, T.T. Acute lymphoblastic leukemia Classification Based on Convolutional Neural Network. In Proceedings of the 6th International Conference on Artificial Intelligence and Big Data (ICAIBD 2023), Chengdu, China, 26–29 May 2023; pp. 877–883. [Google Scholar] [CrossRef]
  46. Gokulkannan, K.; Mohanaprakash, T.A.; Sherin Beevi, L.; Vijayalakshmi, R. Leukemia Net: Integrating attention depth wise Separable network-aided stacked feature pooling with weighted recurrent neural network-based leukemia detection model. Biomed. Signal Process. Control 2024, 96, 106459. [Google Scholar] [CrossRef]
Figure 1. Overview of donor and recipient factors influencing stem cell transplantation, highlighting hematopoietic stem cell (HSC) and T-cell interactions, disease progression, and graft versus leukemia dynamics [6].
Applsci 15 11500 g001
Figure 2. Overview of the image-based classification pipeline, including preprocessing (normalization and enhancement), feature extraction, and classification into normal and abnormal categories [20].
Applsci 15 11500 g002
Figure 3. Workflow for donor–recipient compatibility modeling using Graph Neural Networks (GNNs), detailing data preprocessing, Graph Construction, Feature Extraction, Model Training, Validation, and Interpretability Analysis.
Applsci 15 11500 g003
Figure 4. Workflow for Data Collection and preprocessing, from cleaning to dataset preparation for Graph Construction.
Applsci 15 11500 g004
Figure 5. Enhanced GNN visualization illustrating donor–recipient compatibility, highlighting node attributes and edge types categorized by compatibility metrics for patients.
Applsci 15 11500 g005
Figure 6. Training and validation graphs showing the model’s performance trends in loss and accuracy over 20 epochs, reflecting effective learning and generalization.
Applsci 15 11500 g006
Figure 7. Uniform green fluorescence observed in donor dendritic cells (DCs) plated alone, confirming specific cytoplasmic labeling without interference from red fluorescence, arrow highlights a non-viable cell with compromised membrane integrity.
Applsci 15 11500 g007
Figure 8. Uniform red fluorescence observed in patient leukemic blasts (LBs) plated alone, confirming exclusive cytoplasmic staining without interference from green fluorescence.
Applsci 15 11500 g008
Figure 9. Distinct fluorescence patterns observed in donor DCs and patient LBs plated together, showing exclusive green or red fluorescence and instances of mixed fluorescence.
Applsci 15 11500 g009
Figure 10. Combined visualization of model accuracy and compatibility metrics for patients, showcasing high performance and detailed compatibility analysis.
Applsci 15 11500 g010
Figure 11. Confusion matrices for donor–recipient compatibility detection and leukemia status classification, demonstrating performance with enhanced and realistic results on larger datasets.
Applsci 15 11500 g011
Table 1. Advancements in donor–recipient compatibility modeling, highlighting key methodologies, background facts, and limitations, with a focus on emerging approaches like graph neural networks (GNNs).
AspectBackground FactsMethodologiesLimitations
HLA TypingThe HLA system includes >16,000 alleles across 11 genes, with high polymorphism levels.Sequence-specific oligonucleotide (SSO), next-generation sequencing (NGS)The system types at a high resolution (4–8 alleles) but is limited to static genotype comparisons. It does not account for post-transplant immune interactions.
Immunogenomic Factors Beyond HLAMinor histocompatibility antigens (miHAs) and cytokines influence transplant outcomes.Statistical association models and cytokine assaysPoor integration into HLA models. Limited datasets for miHA profiling.
Machine Learning ApproachesEarly models applied to clinical and genomic datasets for compatibility prediction.Support vector machines (SVMs), random forests (RFs)The model achieves roughly 80% accuracy on test sets. It does, though, have trouble with data that has many dimensions. Also, it is difficult to explain its results in biological terms.
Dynamic Modeling of CompatibilityImmune reconstitution evolves over weeks to months post-transplant.Time-series analysis and dynamic Bayesian networksLacks precision in temporal data. Cannot model interactions beyond specific time points.
Graph Neural Networks (GNNs)Graph-based methods can represent complicated links and changing interactions between the profiles of donors and recipients.Graph Convolutional Networks (GCNs), Graph Attention Networks (GATs)GNNs achieve ~90% accuracy in initial studies of kidney transplant compatibility. Underexplored in HSCT.
Table 2. Matrix-style summary of graph neural network (GNN) applications in biomedical research, highlighting data structures, methodologies, challenges, and achievements across diverse domains.
ApplicationData StructureKey GNN TechniquesChallengesAchievements
Drug DiscoveryMolecular graphs (atoms as nodes)Graph Convolutional Networks (GCNs), GATsHigh dimensionality of molecular features~87% accuracy in drug–target interaction predictions.
Protein InteractionProtein–protein interaction (PPI) graphsGraph Embedding, GCNsSparse data on unknown PPIs15% improvement in PPI prediction accuracy compared to conventional models.
Disease ClassificationMulti-omics data (genomic, proteomic)Heterogeneous Graph Neural Networks (HGNNs)Data heterogeneity and integration complexities~92% accuracy in cancer subtype identification.
Genomic AnalysisSNP and mutation networksDynamic GNNs, Spectral GCNsComplexity in mutation tracking~85% correlation with clinical outcomes for hereditary disease predictions.
GvHD PredictionImmune interaction graphsTemporal GNNs, GATsDynamic and nonlinear immune interactionsPotential for 80–90% predictive accuracy in early-stage GvHD identification.
Dynamic Systems ModelingTemporal biological graphsDynamic Graph Neural Networks (DGNNs)Capturing temporal biological changes~92% temporal prediction accuracy in immune system simulations.
Table 3. Dataset pipeline for GNN-based compatibility modeling, detailing key stages from Data Collection to preprocessing and output preparation.
StageDetailsTechniques UsedOutcome
Data CollectionAcquisition of genomic, transcriptomic, and clinical data1000 Genomes ProjectEnsure dataset diversity and robustness for donor–recipient compatibility modeling.
Data CleaningHandling missing SNPs and incomplete HLA typingsMean imputation, population-specific filteringRetain high-quality genomic data for compatibility analysis.
NormalizationStandardization of SNPs and HLA allele dataZ-score normalization, one-hot encodingEnsure consistent scaling of genomic features for Graph Construction.
Feature EncodingConversion of HLA alleles and SNPs into numerical feature vectorsOne-hot encoding, vectorizationRepresent genomic attributes in a format suitable for graph-based modeling.
Dimensionality ReductionReduction in high-dimensional SNP data to retain critical featuresPrincipal Component Analysis (PCA)Reduce computational complexity while preserving ~95% of the data variance.
Data SplittingPartitioning data into training, validation, and test setsStratified samplingEnsure balanced representation of population groups for unbiased model evaluation.
OutputPreprocessed dataset ready for Graph ConstructionHarmonized multi-omics dataEnable robust graph-based donor–recipient compatibility modeling with GNNs.
Table 4. Summary of Data Collection and preprocessing steps tailored for Patients 1, 2, and N, detailing raw data handling and preparation for compatibility modeling.
StepDescription
Data CollectionCollected raw genomic, transcriptomic, and clinical data for Patients 1, 2, and N, including HLA typings and SNP profiles.
Data CleaningFor Patient 1: Removed missing HLA alleles and imputed SNPs (64% blasts in PB). For Patient 2: Addressed gaps in clinical data (72% blasts in PB).
For Patient N: Processed incomplete SNP data and normalized gene expressions.
NormalizationScaled SNP frequencies and standardized HLA allele distributions for Patients 1, 2, and N.
Feature EncodingEncoded HLA alleles (e.g., A:02, B:08) and clinical details (e.g., AML type, SCT data) into numerical feature vectors.
Dimensionality ReductionApplied PCA to SNP data of Patients 1, 2, and N, reducing high-dimensional genomic data while retaining ~95% variance.
Data SplittingStratified patient data into training (70%), validation (15%), and testing (15%) sets based on disease progression and demographic distribution.
Table 7. Summarizing optimized parameters and configurations for training and testing phases in the research.
PhaseParameterOptimized Value
TrainingLearning Rate0.001
OptimizerAdam
Batch Size128
Epochs20
Data AugmentationNode feature perturbation, edge masking
Dropout Rate0.5
Validation Split15%
TestingBatch Size64
Inference Time0.7 s/graph
Test Set Size15%
Evaluation MetricsAccuracy, F1-Score, AUC-ROC
Cross-Validation10-Fold
Model WeightsSaved at lowest validation loss
Model DeploymentPyTorch 2.8.0. ScriptModule, ONNX
Table 8. Summary of patient-specific features, data sources, GNN architecture, and outcomes across various phases of the research, from training to deployment.
FeaturePhasePatient 1Patient 2Patient 3
Age/GenderTraining25/F60/M35/F
Type of DataMulti-Omics InputGenomic, Transcriptomic DataGenomic, Proteomic DataClinical, Genomic Data
Stem Cell SourceSCT PhasePeripheral Blood Stem CellsBone MarrowUmbilical Cord Blood
Disease StatusStart of ExperimentRelapse post-SCTProgressive disease after CTAML relapse post-CT
Compatibility MetricsTraining/Testing PhaseSNPs: 98%, HLA Mismatch: 10%SNPs: 95%, HLA Mismatch: 20%SNPs: 90%, HLA Mismatch: 25%
GNN Input DimensionsTrainingNodes: 512, Edges: 128Nodes: 512, Edges: 256Nodes: 512, Edges: 256
GNN ArchitectureModel Layers3-layer GNN, Graph Attention4-layer GNN, Graph Attention3-layer GNN, Graph Attention
Training OutcomeModel IterationsConverged at 85% accuracyConverged at 83% accuracyConverged at 80% accuracy
Status of ExperimentEnd of ExperimentLoss: StabilizedValidation: Stable precisionValidation Dip/AUC imbalance
Table 9. Comparison of the proposed graph neural network (GNN) technique with other machine learning methods, highlighting its superiority in donor–recipient compatibility modeling and early leukemia detection.
FeatureProposed GNN TechniqueSVM
(Support Vector Machine) [44]
CNN
(Convolutional Neural Network) [45]
RNN
(Recurrent Neural Network) [46]
Data IntegrationMulti-omics data (SNPs, HLA, clinical)Limited to numerical or categorical dataRequires structured data (images, etc.)Best suited for sequential or time-series data
Compatibility MetricsSNP matches, HLA mismatchesLimited to engineered featuresRequires feature engineeringLimited to temporal dependencies
Learning ArchitectureGraph Neural Networks (GNNs) with attention mechanismsHyperplanes to separate classesLocal spatial feature extraction (filters)Sequential dependency-based learning
InterpretabilityHigh (attention weights for interpretability)Low (opaque hyperplane decisions)Moderate (convolutional filter visualization)Low (black-box sequential processes)
ScalabilityHigh (handles large-scale, high-dimensional data)Moderate (struggles with high dimensions)High (efficient for grid-structured data)Moderate (memory-intensive for long sequences)
Accuracy (Detection)97.68–99.74%85–90%92–96%88–92%
Accuracy (Classification)98.76–99.4%80–85%91–94%86–89%
Graph RepresentationSuperior (encodes relationships and dependencies)NoneNoneNone
Use of RelationshipsHigh (node and edge attributes encode dependencies)NoneNoneNone
Clinical ApplicabilityStrong (scalable, interpretable, robust for clinical data)Limited (feature selection challenges)Moderate (requires structured data pipelines)Moderate (limited to sequential datasets)
Table 10. This table provides an overview of the primary biological and clinical features used in the GNN model, explaining their role in donor–recipient compatibility and how they are represented in the graph structure.
Feature CategoryContribution to Compatibility PredictionRepresentation in GNN
SNP MatchingMeasures genetic similarity between donor and recipient. Higher similarity improves compatibility.Encoded as a numerical vector in each node, influencing donor–recipient edge strength.
HLA TypingDetermines immune response compatibility. A high HLA mismatch increases the risk of graft rejection.Categorical data converted to one-hot encoded features in the model.
Cytokine and Proteomic MarkersKey regulators of immune reactions post-transplant. Helps in predicting potential immune complications.Continuous numerical features in nodes; highly weighted by attention mechanisms.
Age and GenderYounger donors are generally preferred due to better transplant outcomes. Gender influences immune response.Included as scalar node attributes, modifying donor–recipient matching scores.
Disease StatusIndicates the severity of leukemia. Patients with aggressive forms may need more precise donor selection.Integrated as a node attribute, affecting classification layers of the model.
Donor–Recipient Interaction (Edge Weights)Relationship strength between donor and recipient based on all compatibility factors. Stronger connections improve prediction reliability.Encoded as weighted edges, influencing the propagation of information in the graph.
Table 11. The contribution of each feature to the GNN model, highlighting their relative importance in predicting compatibility and transplant success.
Feature CategoryImportance Score (%)Impact on Prediction
SNP Matching35.2%Strong genetic similarity improves prediction accuracy.
HLA Typing30.8%High mismatches decrease compatibility scores.
Cytokine/Proteomic Markers20.1%Helps in refining immune response risks.
Age and Gender10.2%Moderately affects donor selection.
Disease Status3.7%Minor role in compatibility, but crucial for leukemia classification.
Table 12. This table presents key performance metrics of the GNN model, along with their interpretation and real-world impact on donor–recipient compatibility prediction.
MetricValue AchievedInterpretationImpact on Compatibility Prediction
Sensitivity (Sn)98.5%Ability to correctly detect compatible donor–recipient pairs.Ensures minimal rejection of potential matches.
Specificity (Sp)96.2%Ability to correctly identify incompatible donor–recipient pairs.Reduces false-positive donor selections.
Matthews Correlation Coefficient (MCC)0.89Measures balanced classification performance across all categories.Indicates model reliability even with class imbalance.
Kappa Score0.87Measures agreement between predicted and actual classifications.Ensures model consistency across different dataset splits.
AUC-PR Curve0.975Evaluates precision–recall tradeoff for imbalanced data.Demonstrates strong model confidence in donor selection.
Execution Time (Inference per Graph)0.5 sTime required for predicting donor–recipient compatibility per sample.Enables real-time decision-making in clinical settings.
Average Prediction Confidence94.6%Probability assigned to each prediction by the model.Helps in ranking donor compatibility for transplant prioritization.
Misclassification Rate2.3%Percentage of incorrect donor–recipient classifications.Maintains high accuracy by minimizing errors.
Table 13. The improvements in training time, inference speed, GPU memory usage, and model size after applying optimization techniques, making the model more efficient for real-world deployment.
MetricBefore OptimizationAfter OptimizationImprovement
Training Time per Epoch25 min8 min3× faster
Inference Time per Graph2 s0.5 s4× faster
GPU Memory Usage12 GB4 GB67% reduction
Model Size1.2 GB350 MB71% smaller
Disclaimer/Publisher’s Note: The statements, opinions and data contained in all publications are solely those of the individual author(s) and contributor(s) and not of MDPI and/or the editor(s). MDPI and/or the editor(s) disclaim responsibility for any injury to people or property resulting from any ideas, methods, instructions or products referred to in the content.