Abstract
Cancer exhibits diverse and complex phenotypes driven by multifaceted molecular interactions. Recent biomedical research has emphasized the comprehensive study of such diseases by integrating multi-omics datasets (genome, proteome, transcriptome, epigenome). This approach provides an efficient method for identifying genetic variants associated with cancer and offers a deeper understanding of how the disease develops and spreads. However, it is challenging to comprehend complex interactions among the features of multi-omics datasets compared to single omics. This study investigates multi-omics lung cancer data obtained from The Cancer Genome Atlas (TCGA) repository. Differentially expressed genes were identified using four statistical approaches: LIMMA, T-test, Canonical Correlation Analysis (CCA), and the Wilcoxon test applied across gene expression (GE), DNA methylation, and microRNA (miRNA) datasets. Kernel Machine Regression (KMR) was subsequently employed to perform data fusion across the multi-modal datasets. The empirical results highlight notable interactions among GE, miRNA expression, and DNA methylation in lung cancer. Our analysis identified 38 genes that show significant associations with lung cancer. Among these, 8 genes of highest ranking (PDGFRB, PDGFRA, SNAI1, ID1, FGF11, TNXB, ITGB1, and ZIC1) were highlighted by rigorous statistical analysis. Furthermore, in silico studies identified three top-ranked potential candidate drugs (Selinexor, Orapred, and Capmatinib) that may offer promising therapeutic potential against lung cancer. The effectiveness of these candidate drugs is further reinforced by evidence from independent research studies, which emphasize their potential in lung cancer treatment.
1. Introduction
Recent progress in biomedical technologies has resulted in the generation of large-scale multi-omics datasets, transforming disease diagnosis through a comprehensive perspective. The integration of multivariate data seeks to reveal complex relationships among diverse molecular features, especially in complicated conditions such as lung cancer. Despite the historical focus of the pharmaceutical industry on developing broad-spectrum medicines, personalized treatments tailored to individual patients often yield superior outcomes. Consequently, biomedical researchers are increasingly focused on identifying significant genes linked to complex diseases. However, state-of-the-art methods often fail to optimize the outcomes for these conditions. To address these challenges, the scientific community embraces precision medicine, focusing on personalized treatments driven by comprehensive omics data for diseases such as cancer and schizophrenia [1]. Despite these advancements, integrative omics approaches for pinpointing biomarkers for multifactorial diseases present a formidable challenge. As illustrated in Figure 1, the interaction between GE, miRNA, and DNA methylations within lung tissue demonstrates the complexity of fusing multi-modal datasets and underscores the need for advanced analytical approaches.
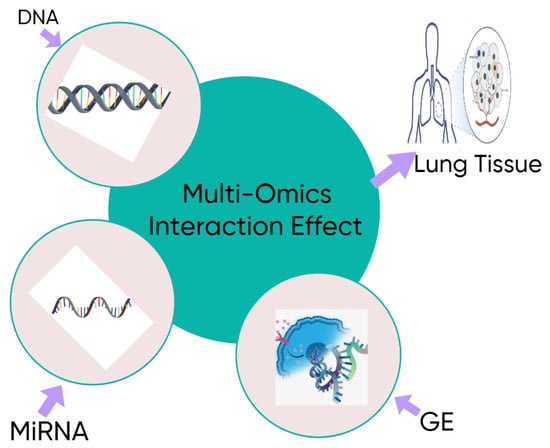
Figure 1.
Impact of multi-omics interactions in human lung tissue, highlighting the potential interactions between GE, miRNA, and DNA methylations layers.
In state-of-the-art work, omics data analysis can be categorized into two approaches: single-view and dual-view datasets. In single-view-based data analysis, modern high-throughput techniques, such as deep sequencing, generate large volumes of molecular data [2]. This study, for example, includes parameters such as DNA genome sequences [3], RNA expression levels [4,5], and DNA methylation patterns [6]. Each type of data is referred to as an “omic”, including genomics, transcriptomics, and methylomics. Single-omic approaches identify exposure-associated biomarkers but capture only a fraction of the broader biomarker landscape in polygenic disease. This limitation hinders their ability to fully elucidate changes in key biological pathways, making them insufficient for a comprehensive understanding of diseases such as lung cancer or prostate cancer [7,8]. Although it is feasible to conduct a single omics study for each conditions like cancer and schizophrenia, this approach may overlook significant insights. In contrast, integrative omics approaches, although more resource-intensive, are widely recognized as valuable tools for acquiring deeper insights into challenging pathologies [7,9]. Examining combined risk factors and deciphering complex relationships across various omics datasets continues to present significant challenges. To gain a thorough understanding of human health and disease, it is important to interpret the complex and diverse molecular information found at multiple levels, including the genome, epigenome, proteome, transcriptome, and metabolome [10]. Therefore, analyzing data from multiple omics sources plays a vital role in both cancer detection and drug development. By integrating these different types of omics data, researchers can conduct a comprehensive analysis that offers a holistic perspective on biological systems and uncovers the interactions between various molecular layers [11,12]. Indeed, such integrative approaches are proving valuable across diverse malignancies, from identifying therapeutic mechanisms in hepatocellular carcinoma [13] to developing novel drug repurposing pipelines for bladder cancer [14].
Lung cancer is the leading cause of cancer-related deaths worldwide, responsible for nearly 25% of all cancer deaths. It ranks as the second most frequently diagnosed cancer globally. Each year, it claims more lives than breast, colon, and prostate cancers combined [15]. Lung cancer presents a wide range of symptoms and indications depending on its anatomical development, as it can occur at several points throughout the bronchial tree. A series of genetic and epigenetic alterations are believed to be responsible for transforming a normal lung phenotype into a malignant one, which then proliferates into invasive cancer through clonal expansion. Identifying and characterizing these molecular changes is essential for effective disease prevention, early diagnosis, and treatment [16]. However, early-stage diagnosis of lung cancer using multi-omics data analysis remains a significant challenge. To address this challenge, the aim of this study is to leverage KMR to explore and identify critical multi-omics interactions relevant to lung cancer drug target discovery. Through the fusion of multi-modal datasets, KMR can capture the complex relationships that single-omics approaches may miss.
Linear data integration methods are widely adopted and well-established techniques that help provide a deeper and more complete understanding of biological processes involved in complex diseases. However, traditional methods for data analysis, such as linear techniques, have limitations in dealing with non-linear data structures and multi-modal distributions, resulting in poor performance [17,18]. To address this issue, non-linear integrated techniques such as kernel-based machines have become essential for analyzing multi-omics datasets [19,20]. Positive-definite kernel-based machine approaches have proven effective in resolving the non-linearity issue [21]. Statistical machine learning approaches, such as kernel-based methods, provide valuable information on the relationship between genetic markers and disease states, allowing for exploration of a wide range of genetic variants associated with complex traits [22]. These integrative omics approaches enable a more efficient and insightful synthesis of the data.
The main focus of this paper is on using KMR to integrate multi-omics lung cancer data and analyze multi-omics interactions for drug repositioning in lung cancer. This study integrates transcriptomic, epigenetic, and miRNA profiles to uncover key interacting genes associated with lung cancer progression. This strategy offers deeper insights into the underlying biological mechanisms and supports the identification of potential drug targets for lung cancer. To verify the results, protein association network analysis, gene–miRNA–methylation interaction analysis, molecular coupling analysis, and two-dimensional (2D) chemical interaction studies were performed.
The primary innovation of our work is a robust methodological framework that applies KMR to uncover higher-order interactions from multi-omics data for lung cancer drug discovery. Our approach makes three key contributions. First, a consensus of four statistical tests (LIMMA, T-test, Wilcoxon, and CCA) was employed for rigorous feature selection to minimize noise. Second, the framework extends beyond pairwise associations to model higher-order composite effects, enabling the identification of significant interaction “triplets” among gene expression, miRNA, and DNA methylation layers. Finally, the comprehensive KMR framework was applied to the specific context of lung cancer drug discovery, effectively bridging complex data analysis with actionable therapeutic insights. This integrated workflow offers a powerful and replicable method for identifying key biological interactions and potential drug candidates.
The remaining part of this paper is organized as follows: Section 2 provides an overview of recent studies related to this work. Section 3 presents the statistical analysis methods, including the real-world datasets, specific procedures, and test statistics used to identify significant interactions in multi-omics data. Section 4 describes the analysis performed on the GE, DNA methylation, and miRNA expression data from lung cancer studies. Section 5 discusses the biological and clinical relevance of these findings and the limitations of the study. Finally, Section 6 summarizes the findings and discusses potential avenues for future research.
2. Preliminaries
In the literature, numerous methods have been introduced to evaluate multi-omics data, and linear techniques are among the most diverse. Popular linear methods for multi-omics following identification analysis include canonical correlation analysis, partial least squares, and multi-omics factor analysis [23,24,25,26,27]. Liu et al. performed an initial study applying a KMR model to evaluate genetic effects using single-modal samples. Later, Li and Cui introduced a kernel-based machine learning method to explore gene-gene interactions. Their approach treated individual genes as testing units and utilized a smoothing spline-ANOVA technique within a kernel machine model to uncover complex factor relationships [28]. However, these strategies mostly use single or coupled datasets, which limits their ability to fully capture the complex interplay between multiple omics data sets.
Kernel-based techniques are useful for studying how a wide range of genetic variations are related to complex phenotypes and disease states [29,30,31]. For investigating gene-gene co-association, linear, kernel, and robust canonical correlation techniques have been employed [32,33]. By fusing diverse omics datasets, nonlinear kernel methods uncover complex relationships and provide broader biological insights. These models are particularly helpful for studying the diverse range of genetic influences connected to intricate phenotypes and disease states [34,35,36]. It is increasingly challenging to identify marginal, interactional, and composite effects in multi-omics datasets.
Furthermore, Ge et al. suggested using kernel machines to identify the effects of relationships between multidimensional data sets [37]. Another more comprehensive model, which accounts for both genetic and non-genetic components as well as their interactions, was introduced by Kung, S. and Ge et al. [32,37]. Zhao et al. and Liu, et al. utilized a semi-parametric KMR framework and introduced the microbiome regression-based kernel association test (MiRKAT) to effectively recover results from single-omics datasets and microbiome profiles. Composite kernel machines and Bayesian variable correlation KMR methods have also been suggested for genome-wide association research [38,39]. Alam et al. developed a kernel machine method to detect complex interactions across three distinct datasets and applied this approach to investigate schizophrenia characterized by continuous traits [1]. In that study, they proposed the Generalized Kernel Machine Approach for Higher-Order Composite Effects (GKMAHCE) to identify composite impacts in multiview biomedical data sources. In research on adolescent brain development and osteoporosis, Alam et al. used the GKMAHCE technique to analyze synthetic and real multiview sets of data [10]. The GKMAHCE method is a generalized semi-parametric method that includes marginal and integrated Hadamard products of characteristics from various points of view of the data using a mixed-effect linear model [1]. In another study, Jie Feng et al. applied kernel-based principal component analysis (PCA) to conduct gene set enrichment analysis, identifying differentially expressed genes across lung cancer subtypes [40].
3. Methodology
The section presents the proposed methodology, summarized in Figure 2. A key innovative aspect of our workflow is the integration of a multi-test, consensus-based feature selection process prior to the application of KMR to model higher-order interactions. The process begins with data acquisition from the Multi-Omics Lung Cancer—TCGA database. The raw data undergo preprocessing, including normalization and feature selection, and are then divided into three categories: GE, miRNA expression, and DNA methylation. Each category is analyzed using statistical methods such as LIMMA, T-test, CCA, and Wilcoxon test to detect genes with significant differential expression. The top common significant genes are selected across these tests from each category. These genes are then integrated using KMR to identify genes significantly interacting with lung cancer. Finally, the results are analyzed through protein association network analysis and, ultimately, drug repurposing. The details of various methods are explained in the following subsections.
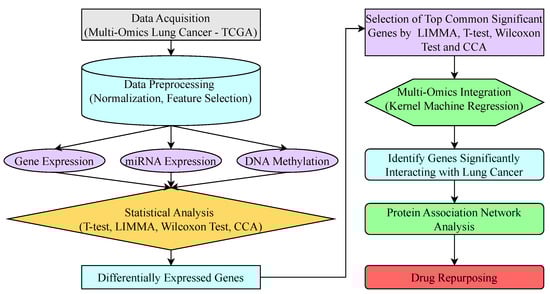
Figure 2.
Framework of the proposed approach.
3.1. Data Sources
The lung cancer dataset examined in this study was obtained from the Multi-Omics Cancer Benchmark TCGA Preprocessed Data repository [41].
Lung Squamous Cell Carcinoma (LUSC): The Cancer Genome Atlas (TCGA), the largest collection of its kind in the USA, gathers and analyzes tumor samples from over 11,000 cancer patients. This study examines multiple molecular features of the samples, including tissue genome sequencing, copy number variation (CNV), GE profiles, miRNA expression levels, and DNA methylation patterns. In addition, it includes biological and medical data such as racial group, tumor grade, recurrence, and therapeutic response. Preprocessed TCGA multi-omics data for lung squamous cell carcinoma (LUSC) were utilized, comprising gene expression (GE), DNA methylation, and microRNA (miRNA) expression datasets. Using R packages such as TCGAbiolinks and EDASeq from Bioconductor (version 3.21 (https://bioconductor.org/), a total of 344 samples were retrieved, encompassing GE data, miRNA sequencing data, DNA methylation profiles, and corresponding clinical information [41].
3.2. Material and Methods
3.2.1. Differential Expression Study
LIMMA: LIMMA is an R/Bioconductor package for the computational analysis of gene expression data from microarray and RNA-Seq studies. It is designed for complex study designs and addresses small sample sizes through information-borrowing techniques. A key feature is its ability to incorporate data from previous studies. The package fits global covariance models to estimate gene-wise correlations and the relatedness of differentially expressed profiles, facilitating robust, large-scale expression analysis [42].
T-test: The t-test is a commonly used statistical technique for detecting genes with elevated expression levels. In experiments with replicates, the error variance for each gene can be derived from log-transformed ratios, allowing for the application of a standard t-test to determine significantly differentially expressed genes. Unlike some other approaches, the t-test evaluates genes individually, which helps avoid issues caused by variance heterogeneity across genes. However, its statistical power may be limited when the number of RNA samples per condition is small [43].
Let represent the difference for individual i, where and are the paired measurements. The paired t-test statistic is calculated as follows:
where
- n number of paired samples,
- mean of the paired differences,
- standard deviation of the paired differences, and
- expected mean difference (often 0 under the null hypothesis).
Wilcoxon Test: The Wilcoxon test is a non-parametric statistical method used to compare two related samples, matched pairs, or repeated measurements on a single sample [44]. It assesses whether the median difference between pairs is zero. This test is particularly useful when normality assumptions are violated, when dealing with ordinal data, or when working with small sample sizes where the distribution of differences cannot be reliably assessed.
Null Hypothesis: The null hypothesis () states that the median of the paired differences is zero, implying that the distribution of differences is symmetric around zero.
Test Procedure:
- Calculate Differences: For each pair i, calculate the difference
- Handle Zero Differences: Exclude pairs where . The adjusted sample size after exclusions is denoted as .
- Rank Absolute Differences: Compute for all remaining pairs and rank these values from smallest to largest. The smallest non-zero absolute difference receives rank , the next , and so on.
- Assign Signed Ranks: Attach the original sign of to its corresponding rank , producing signed ranks.
- Calculate Test Statistic: The Wilcoxon test statistic W is computed as
A very small or very large value of W provides evidence against the null hypothesis, indicating a significant difference between the paired samples [45].
Canonical Correlation Analysis (CCA): Canonical Correlation Analysis is a technique for identifying and measuring the linear relationships between two multi-dimensional variable sets. Intuitively, while correlation measures the relationship between two single variables, CCA finds the “best” directions in each dataset such that the projection of the data onto these directions is maximally correlated. In essence, it reveals the underlying shared patterns between two different views of the same entities.
Let (x, y) be a multivariate random vector. Assume that we have a set of observations, of (x, y) for this vector. The x-coordinates of these observations are represented as and the y-coordinates as . A new spatial representation for x is obtained by selecting a projection vector and projecting x in that direction, denoted as . The function to be maximized is
The overall covariance matrix C is structured as a block matrix that includes two within-set covariance components, and , as well as two between-set covariance matrices, . Therefore, we can express the function as follows:
This equation represents the maximum canonical correlation, which is determined by maximizing the value of in relation to the values of and [46].
3.2.2. Multi-Omics Analysis
After identifying a set of significant features within each individual omics layer, the next step is to integrate them into a unified model to test for higher-order interaction effects. A generalized semi-parametric model based on Kernel Machine Regression (KMR) was employed to achieve this integration.
Suppose that we have n subjects with responses () and covariates . For each subject, we observe m views . We assume follows an exponential-family distribution with density
where and are the natural (location) and scale parameters, is a known weight, and are known functions. The mean and variance satisfy , and . The generalized semi-parametric model links the response to covariates and multi-view data by
where is a known link function and f is an unknown function on the product domain A collection of monotone link functions commonly used in generalized linear models is shown in Table 1. The function f can be decomposed via ANOVA and represented in a reproducing kernel Hilbert space (RKHS). Practically, each omics view is represented through a kernel matrix that encodes pairwise similarity between subjects for that view (for example, a linear kernel or an RBF kernel). Kernel matrices thus capture the structure within each omics modality and allow the model to borrow strength across similar samples.

Table 1.
Generalized linear model families and their link functions.
For a binary outcome (e.g., case/control), Equation (6) becomes
and can be approximated by a linear mixed model:
where each random effect captures main and interaction effects and is modeled as . Here, is the variance component for view ℓ. Variance components are estimated via restricted maximum likelihood (ReML) [47]. ReML is preferred over ordinary maximum likelihood because it provides unbiased estimates of variance components by accounting for the uncertainty introduced by fixed effects. This makes it particularly effective for modeling complex random effects structures in multi-omics data, where correlations across multiple data layers must be accurately captured.
3.2.3. Evaluating Marginal Effects
Within the KMR framework, each omics layer’s contribution to the phenotype is systematically evaluated. The marginal effects of individual data types are first assessed to quantify their independent influence prior to testing higher-order interactions.
The marginal effect of an individual omics data type (e.g., genomics, transcriptomics) represents its independent contribution to the phenotype. Statistically, the significance of including a specific omics view is evaluated to determine its contribution to model improvement. This is formalized by testing the null hypothesis that its associated variance component is zero:
This is similar to measuring the variance components in Equation (8),
The test statistic, which is based on the kernel matrix that encodes sample similarity for that view, is:
which corresponds to the formulation used in the Sequence Kernel Association Test (SKAT) [48].
3.2.4. Testing Interaction Effects
Following the quantification of marginal effects, potential synergistic or interaction effects among combinations of omics layers are examined. Testing for such interactions allows us to identify cross-omics dependencies that may not be apparent when each data type is analyzed independently.
To evaluate interaction effects, including higher-order relationships among data views, all marginal effects are assumed to be zero, i.e., , . Testing for interaction effects involves evaluating the hypothesis
which is equivalent to testing the variance components in Equation (8),
and can be performed using the test statistic
Similarly, the effects of third-order interactions can be tested by assuming that all second-order interactions are zero; that is, for , , and
and use the test statistic
Testing interaction effects allows us to examine whether relationships between different omics layers jointly influence the outcome. For instance, a significant suggests that combining genomic and proteomic data provides more predictive power than either layer alone, highlighting potential cross-omics regulatory mechanisms.
3.2.5. Statistical Testing
Having examined both marginal and interaction effects, the next step is to formalize the statistical testing procedures used to evaluate their overall significance. This ensures that the detected associations within the KMR model are statistically robust and not due to random variation.
We describe the statistical tests used to evaluate both the overall effect and various combined (composite) effects in the model.
Overall Hypothesis Testing: The “overall” or “global” test assesses whether any of the omics data types or their interactions are associated with the phenotype. With the KMR model, it is possible to test the overall effect using
this is the same as assessing the variance component in Equation (8) with
It is important to note that the kernel matrices are not block-diagonal, indicating that the omics layers are interdependent rather than isolated. This structure reflects shared biological variation across data types (e.g., gene–protein co-expression) and influences how variance components are partitioned in the model. Consequently, deviations under the null hypothesis may occur along complex directions at the edge of the model’s parameter space [10,27,37].
Evaluating Composite Effects: When significant lower-order effects are detected, it becomes important to test for higher-order interactions, a process referred to as composite hypothesis testing. For example, to test the fifth-order composite effect, the null hypothesis is formulated as
This is equivalent to testing the corresponding variance component: .
Consider the covariance matrix, , where all , and are model parameters under the null model. The test statistic is then defined as
where is the vector of model parameters and the matrix is a projection matrix under the null hypothesis, given by .
As in the overall effect evaluation, the Satterthwaite approximation can be employed to estimate the distribution of the higher-order composite test statistic [12]. Biologically, testing composite effects helps uncover complex cross-layer interactions—such as transcriptome–proteome–metabolome crosstalk—that may play key roles in disease mechanisms.
3.3. Drug Repurposing via Molecular Docking Analysis
Following the identification of statistically significant genes through our multi-omics interaction analysis, the final step of our framework is to translate these findings into potential therapeutic applications.
To achieve this objective, in silico molecular docking analysis was conducted to identify potential drug candidates for lung cancer treatment, emphasizing top-ranked target proteins and selected compounds. A total of 190 meta-drug agents were collected through an extensive literature review of acute myeloid leukemia (AML)-related studies (see Table S1) to identify potential repositioning candidates. The 3D structures of target proteins were obtained from the Protein Data Bank (PDB) [49] and SWISS-MODEL [50] databases, while the 3D structures of the drug compounds were retrieved from the PubChem database [51]. The “Discovery Studio Visualizer” was used to visualize the 3D structures of protein interfaces [52]. PDB2PQR and H++ servers were utilized to assign the protonation state of target proteins [53]. All the missing hydrogen atoms were also appropriately added. The pKa for target proteins residues were investigated under the physical conditions of salinity = 0.15, internal dielectric = 10, pH = 7, and external dielectric = 80. On the other hand, the drug agents were minimized energy through the Avogadro [54]. The target proteins were solvated with water, and only polar hydrogens were added. The receptor grid boxes (in X, Y, Z dimension) were prepared in the ADT4.2, and the pdbqt files of proteins were generated [55]. Similarly, the drug agents were prepared with default parameters, and only Gasteiger charges were added. Subsequently, molecular docking between receptors and drug agents were performed to calculate their binding affinities (kcal/mol) by using AutoDock Vina (v1.1.2) [56]. Flexible-ligand docking was carried out using the Lamarckian Genetic Algorithm with an exhaustiveness value of 8. The contributions of hydrogen bonding, hydrophobic, ionic, and van der Waals interactions were evaluated to determine the binding free energy (), representing the ligand–protein affinity score. Docking poses were refined and ranked based on calculated binding energies. For the details of the drug screening procedure see our previous published papers [57]. Following docking, the top-ranked protein–ligand complexes were analyzed for their interaction profiles and binding site characterization. Two-dimensional interaction diagrams were generated using Discovery Studio Visualizer [58], highlighting key non-covalent interactions. Compounds exhibiting the highest binding affinities and favorable interaction profiles were prioritized for further ADMET (Absorption, Distribution, Metabolism, Excretion, and Toxicity) evaluation.
3.4. ADMET Analysis
To complement the molecular docking results and assess the pharmacokinetic feasibility of the shortlisted compounds, in silico ADMET (Absorption, Distribution, Metabolism, Excretion, and Toxicity) analysis was performed using the pkCSM online server [59]. The canonical SMILES representations of the top-ranked ligands—Selinexor, Orapred, Capmatinib, Ponatinib, and Regorafenib—were used as inputs. pkCSM predicts pharmacokinetic and toxicity properties based on graph-based signatures, allowing evaluation of key descriptors such as molecular weight, lipophilicity (LogP), hydrogen bond donors and acceptors, topological polar surface area (TPSA), water solubility (log mol/L), Caco-2 cell permeability, intestinal absorption, skin permeability, and P-glycoprotein (P-gp) interactions. All parameters were calculated using default settings provided by the pkCSM web interface.
4. Computational Analysis and Results
This study utilized three omics datasets from lung cancer research to identify significant intersecting genes arising from composite effects across multiple omics layers [41]. KMR with the Identity-By-State (IBS) kernel was applied to analyze genetic data, which measures genetic similarity between individuals by comparing their genotypes [11]. This analysis focuses on detecting genes that harbor disease-associated variants by testing both rare and common genetic variants linked to specific traits, ultimately aiming to uncover potential drug targets. Each method was implemented within a logistic regression framework.
4.1. KMR-Based Analysis of Lung Cancer Omics Data
In applying the KMR method to the LUSC datasets, each gene across GE, DNA methylation, and miRNA expression profiles was considered as a separate evaluation unit. Owing to the high dimensionality of the data, dimensionality reduction was performed by identifying differentially expressed genes through four analytical approaches—LIMMA, T-test, CCA, and Wilcoxon test—thereby enabling a more computationally feasible analysis.
Figure 3, Figure 4 and Figure 5 present the results of the analysis of differential gene expression (DEG), miRNA expression, and DNA methylation data, respectively. The differential GE analysis presented in Figure 3 was performed using four statistical methods: (a) T-test, (b) LIMMA, (c) Wilcoxon test, and (d) CCA. For the T-test, LIMMA, and Wilcoxon test, the null hypothesis () assumes no significant difference between groups. Genes were considered differentially expressed if p-value < 0.05 with sufficient effect size, defined as an absolute difference between group means (dm), log fold change (logFC), or fold change (FC) exceeded 2 for the T-test, LIMMA, and Wilcoxon test, respectively. Likewise, the same four methods were used to analyze miRNA expression in Figure 4 and DNA methylation data in Figure 5. For miRNA data, features were deemed significant if p < 0.05 with , , or , while for DNA methylation data, a smaller threshold of , , or was used due to the typically subtle magnitude of methylation changes. In the volcano plots across three datasets, the x-axis represents the effect size (dm, logFC, or FC, depending on the method), and the y-axis represents statistical significance (), with each point representing a gene, miRNA, or methylation feature. Green points represent significant features where was rejected, while red points indicate non-significant features. In contrast, CCA evaluates linear relationships, with assuming no correlation between feature sets, and showed weak correlation across three datasets.
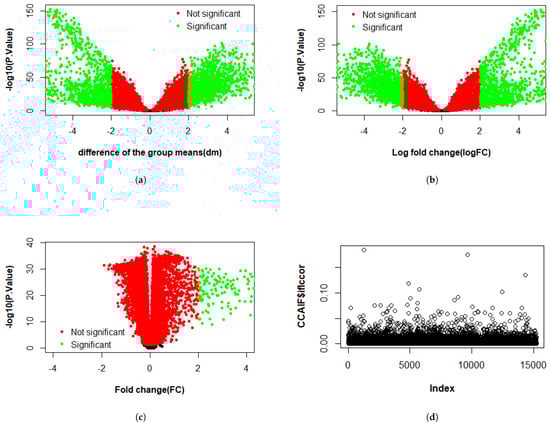
Figure 3.
Differential gene expression analysis using four methods: volcano plots from (a) T-test, (b) LIMMA, and (c) Wilcoxon test, showing differentially expressed genes; and (d) CCA represented as a scatter plot of correlation values.
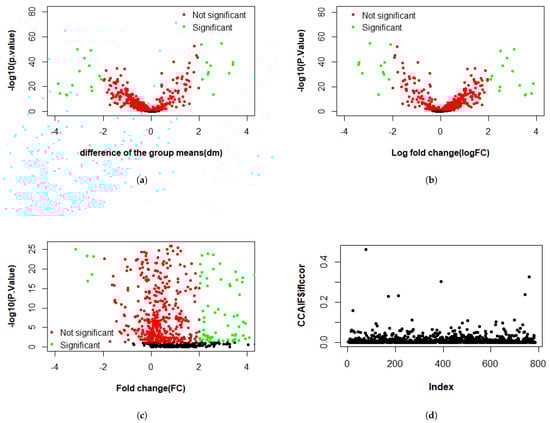
Figure 4.
Differential expression analysis of miRNAs using four methods: volcano plots from (a) T-test, (b) LIMMA, and (c) Wilcoxon test, showing differentially expressed miRNAs; and (d) CCA represented as a scatter plot of correlation values.
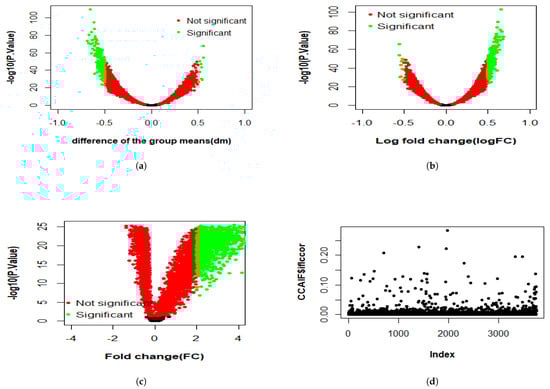
Figure 5.
Differential expression analysis of DNA methylation using four methods: volcano plots from (a) T-test, (b) LIMMA, and (c) Wilcoxon test, showing differentially methylated levels; and (d) CCA represented as a scatter plot of correlation values.
After performing this initial screening on each omics layer, our next critical step was to distill these results into a high-confidence set of features for our main interaction analysis. Consequently, features that were consistently detected as significant across all four statistical methods were identified for further analysis. Figure 6 shows the Venn diagram of the t-test, CCA, Wilcoxon test, and LIMMA methods for three datasets: GE, miRNA expression, and DNA methylation data. The figure shows that, for the GE data, 1000 genes were exclusively selected by all four methods, whereas for the DNA methylation data, 1000 genes were exclusively selected by all four methods except CCA, which selected 260 genes. For miRNA expression data, CCA exclusively selected the least number of genes (50), while the other three methods selected 1000 genes. Interestingly, 38, 50, and 18 genes were commonly selected by all four methods for GE, miRNA expression, and DNA methylation data, respectively. Based on these high-confidence feature sets, the KMR model was applied to the core analysis to evaluate significant three-way interactions among the 34,200 (38 × 50 × 18) possible triplets. The overall results of the KMR analysis are visualized in the Manhattan plot in Figure 7, which reveals 234 significant triplets at a significance level of p < 0.05, and the strong, scattered and double-dotted lines in Figure 7 represent p-values of 0.05, 0.01, and 0.001, respectively.
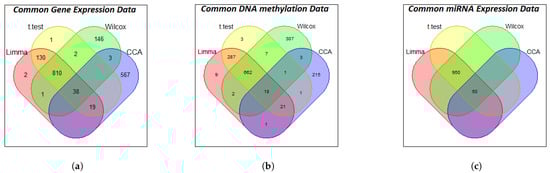
Figure 6.
Venn diagrams illustrating the number of genes selected by T-test, LIMMA, Wilcox, and CCA methods for the different data types: (a) gene expression; (b) DNA methylation; and (c) miRNA expression.
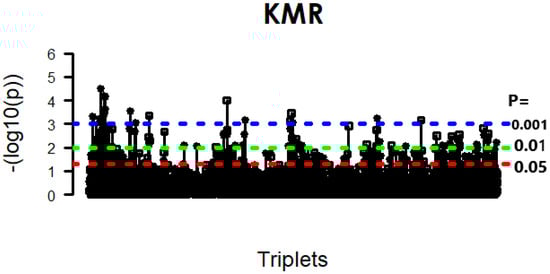
Figure 7.
Manhattan plot of significant associations identified by KMR across multi-omics triplets.
Table 2 presents the ReML estimates of all parameters, including , , , , , , , , together with the corresponding p-values for the KMR method for each of the 9 triplets. The top nine results were selected using a p-value cutoff of 0.00351, based on both overall (OV) and higher-order composite (HOC) effects. These triplets involved a total of five unique genes (ABCA12, F8, HOXC13, PEBP4, and SFTPC), seven transcriptomes (SNAI1, PDGFRA, PDGFRB, ITGB1, MMP15, PTGFRN, and ID1), and three epigenomes (ABCC9, SLCO1A2, and ASCL4) were observed. The number of influential genes identified by the KMR technique at different adjusted p-values is presented in Table 3. Table 4 summarizes the significant genes from gene expression, miRNA expression, and DNA methylation datasets at an adjusted p-value of 0.01, corresponding to those most strongly highlighted by KMR.
Table 2.
Significant gene triplets identified via the KMR approach, with the top nine selected using a p-value cutoff of 0.00351.
Table 3.
Number of genes identified as significant at various p-values using the KMR method.
Table 4.
Significant genes identified by KMR across multi-omics datasets.
To determine whether the 44 unique genes (18 from GE data, 17 from miRNA expression data, and 9 from DNA methylation data) identified by KMR were biologically interconnected or simply a random collection of statistical hits, we next performed a protein–protein interaction (PPI) network analysis. Functional protein association data from the STRING database were utilized to construct gene–gene interaction networks. This approach enabled us to map and visualize the relationships and interactions among proteins encoded by the genes of interest, providing insights into their potential biological functions and connectivity. Figure 8 demonstrates the gene–gene network connections analysis of protein interactions with identified genes. The visual effect of the edges in the illustration corresponds to a functional association’s confidence score.
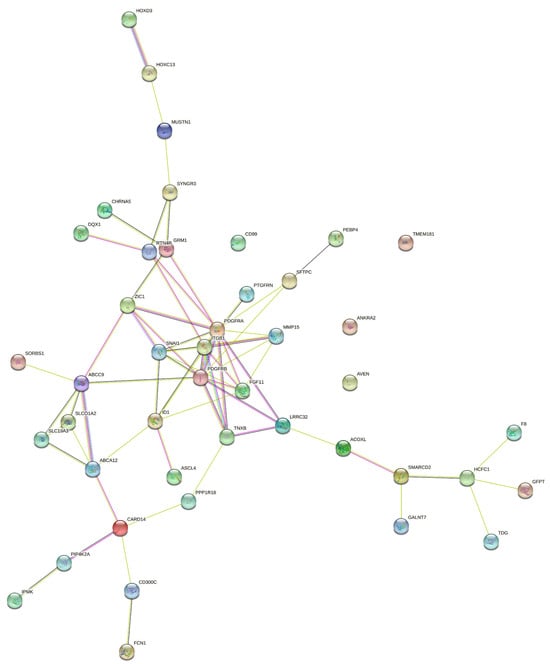
Figure 8.
Protein–protein interaction networks of genes selected through GE, DNA methylation, and miRNA datasets using the KMR method (), generated with STRING-db. Nodes represent proteins, and edges denote interactions: known (green), predicted (purple), and associative (yellow).
In addition, analysis of gene–gene interaction networks using STRING, which is a database of functional protein association networks, revealed essential insights shown in Figure 8. The protein–protein interaction network constructed from the KMR-identified genes yielded key metrics that collectively indicate a highly coherent and biologically relevant functional module. The highly significant interaction enrichment p-value (p = 0.000229) confirms that the observed connections are far greater than expected by chance, suggesting non-random, biologically meaningful associations. Specifically, the network contained 68 interactions compared to 43 expected, indicating strong biological coherence. Furthermore, an average node degree of 3.09 means that each protein interacts with roughly three others on average, reflecting a densely connected system rather than a set of isolated components. Most notably, the clustering coefficient of 0.498 reveals a high degree of modularity, indicating that the neighbors of any given protein are also likely to interact with each other. This “friends-of-friends-are-friends” structure is a hallmark of proteins working together in functional complexes or tightly coupled pathways. Together, these metrics provide strong computational evidence that the 44 genes identified through our multi-omics analysis do not operate in isolation but form a tightly integrated functional community, likely collaborating in specific disease-relevant biological processes.
Given this strong connectivity, identification of the most influential nodes within the network was undertaken using the CytoHubba plugin in Cytoscape. (version 3.10.4, https://cytoscape.org/download.html (accessed on 23 September)) Five complementary topological metrics—Degree, Maximal Clique Centrality (MCC), Maximum Neighborhood Component (MNC), Edge Percolated Component (EPC), and Radiality—were applied to ensure robust hub gene detection. These topological parameters were selected because each captures distinct aspects of network centrality and robustness. The MCC algorithm identifies highly connected subgraphs (cliques), emphasizing dense interaction clusters. MNC focuses on the size of a node’s local neighborhood, reflecting immediate network influence. EPC measures network resilience by assessing how connections persist under edge removal, highlighting stable nodes. Radiality quantifies how close a node is to all others, indicating efficiency in information flow, while the Degree metric directly measures connectivity. Together, these complementary measures provide a comprehensive view of node centrality and ensure that hub gene selection is not biased by a single network property. Integrating these complementary perspectives minimized the bias inherent in any single method and enhanced confidence in identifying the most critical hub genes. The top 8 hub genes consistently identified across these methods were PDGFRA, ITGB1, SNAI1, FGF11, PDGFRB, ID1, TNXB, and ZIC1, as shown in Figure 9. The Venn diagram illustrates the overlap and uniqueness of the genes identified by each method. The numbers inside the overlapping areas indicate the quantity of genes common to multiple algorithms. The bar chart below presents the total count of unique hub genes identified by each method, along with their overlaps. This analysis supports the notion that these genes play crucial roles in the function and interaction of the selected genes. Furthermore, to assess model performance, classification precision was evaluated across the complete GE, miRNA expression, and DNA methylation datasets using the features identified by the KMR method (as shown in Table 4).
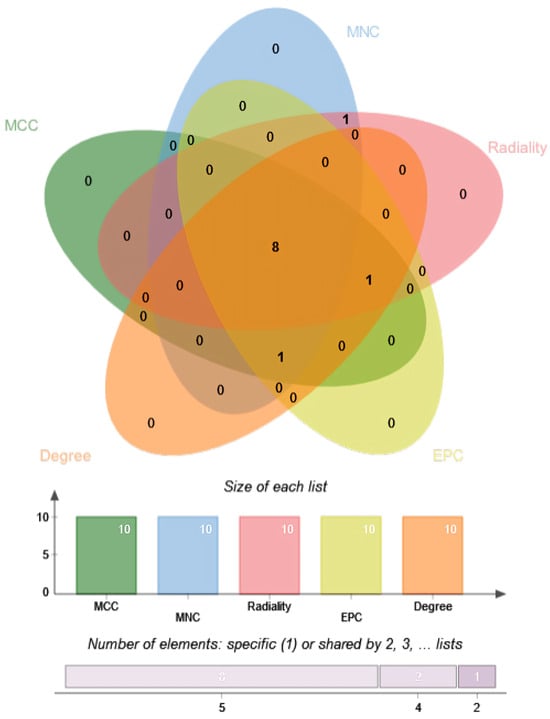
Figure 9.
In the Venn diagram, each colored ellipse represents the set of top genes identified by a specific algorithm (MCC—green, MNC—blue, Radiality—pink, EPC—yellow, Degree—orange). Numbers indicate the count of genes unique to a single algorithm or shared by multiple algorithms in the overlapping regions.
Figure 10 depicts the results obtained using the OmicsNet network analysis tool, which highlights the three omics interactions of the selected genes. We hypothesize that genes identified by the KMR method will exhibit more widespread expression in lung tissue samples, as measured by reads per kilobase per million mapped reads (RPKM).
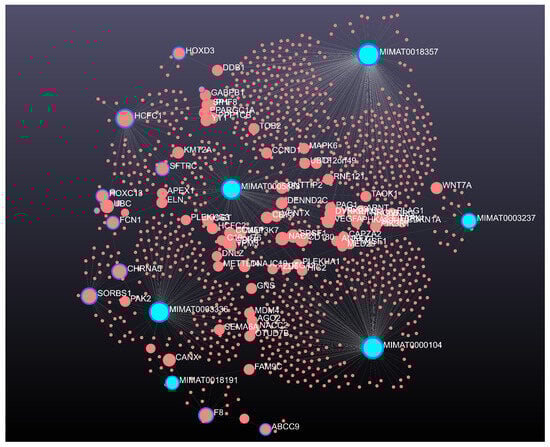
Figure 10.
Gene-miRNA-Methylation Interaction Network visualized using OmicsNet. The network illustrates the complex interactions identified among the 44 significant genes derived from the KMR analysis. Nodes represent genes (large red circles), miRNAs (large blue circles with labels), and potentially interacting methylation sites or other molecular entities inferred by the OmicsNet analysis (small pink dots). Edges (lines) represent experimentally validated or computationally predicted interactions between these entities.
4.2. Drug Repurposing
Drug repurposing, also called drug repositioning, reprofiling, or re-tasking, is a strategic approach aimed at discovering new therapeutic applications for existing or investigational drugs beyond their original approved uses [60]. This method offers several benefits compared to developing entirely new drugs targeted at specific diseases. A key technique in this approach is molecular docking, which evaluates the binding affinities between drugs (ligands) and target proteins [61]. Identifying appropriate target proteins associated with a given disease is critical for this process. In this study, proteins regulated by hub or study genes were selected as prime drug target candidates. The top eight ranked proteins were selected as drug targets for molecular docking with a panel of 190 meta-drug compounds to identify potential candidates for lung cancer treatment. The 3D structures for five receptors (PDGFRB, PDGFRA, SNAI1, TNXB, and ITGB1) were retrieved from the PDB with accession codes 5grn, 1gq5, 3w5k, 2cum, and 3g9w, respectively [49]. For the remaining three proteins (ID1, FGF11, and ZIC1), 3D structural models were obtained from SWISS-MODEL using the UniProt identifiers P41134, Q6LA99, and Q15915 [50]. The 3D structures of all 190 drug compounds were sourced from the PubChem database [51]. Subsequently, molecular docking was performed for all 8 protein targets against the 190 meta-drugs to compute binding affinity scores (reported in kcal/mol) for every protein–drug combination. To select the most promising drug candidates, the target proteins were ranked by the sum of their binding scores across drugs (row sums) and ranked drugs by the sum across targets (column sums) based on the affinity matrix . Figure 11 illustrates this binding affinity matrix, where proteins are grouped on the vertical axis (Y-axis) and the drug compounds are arranged by rank along the horizontal axis (X-axis). From this analysis, top three drugs (Selinexor, Orapred, and Capmatinib) were identified as leading candidates, each showing strong binding affinity values around −7.5 kcal/mol with all 8 protein targets (see Table S1). For detailed protein–drug interaction profiling, the analysis focused on the top three docked complexes exhibiting the highest binding affinities.
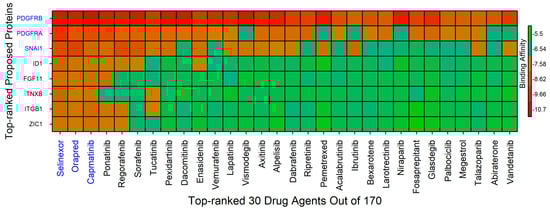
Figure 11.
Binding affinity heatmap displaying the interaction strengths between the top 30 ranked drug agents (out of a total of 190) and the 8 selected protein targets. The proteins are ordered on the vertical axis, and the drug compounds are arranged along the horizontal axis by decreasing binding affinity. The red color gradient highlights stronger binding affinities, indicating a higher likelihood of effective molecular interactions between a drug and a protein target.
For detailed protein–drug interaction analyses, Table 5 summarizes the top three docked complexes. In Figure 12a, the PDGFRB–Selinexor complex is shown to form three hydrogen bonds involving residues Lys627, Asp836, and Gly680, alongside multiple hydrophobic contacts with residues Leu599, Val607, Ala625, Leu825, and Phe837. Figure 12b presents the PDGFRA–Orapred complex, which exhibits two hydrogen bond interactions with Phe26 and Val76, hydrophobic interaction with His27, and electrostatic contacts with His27 and Phe26. Similarly, the SNAI1–Capmatinib complex depicted in Figure 12c has three hydrogen bonds formed with Thr203, Tyr236, and Gln237, hydrophobic interactions involving Arg200, Thr201, Cys210, and Pro211, and a halogen bond with Gln239. Moreover, independent studies corroborate our findings: Selinexor has shown efficacy against both G12C and non-G12C KRAS-mutant lung cancers [62]; Orapred/Prednisolone-phosphate, when delivered via long-circulating liposomes, inhibits tumor angiogenesis resulting in antitumor effects; and Capmatinib acts as a potent and selective MET inhibitor with demonstrated clinical activity in lung cancer [63]. Therefore, these repurposed drugs identified through molecular docking represent promising candidates that may contribute significantly to lung cancer treatment.
Table 5.
Summary of amino acid interactions for the top three protein–drug complexes involving the highest-ranking compounds.
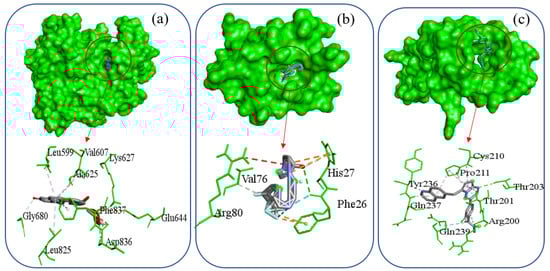
Figure 12.
Molecular docking results showing the top three protein–drug complexes with 2D chemical interaction diagrams.
4.3. ADMET Profiling and Pharmacokinetic Evaluation of Selected Compounds
The ADMET profiles of the selected compounds are summarized in Supplementary Table S2. All compounds exhibited acceptable molecular weights (≤600 Da) and moderate lipophilicity (LogP between 3–5), consistent with good membrane permeability and oral bioavailability. Capmatinib and Ponatinib showed the highest Caco-2 permeability (log Papp = 1.34 and 1.58, respectively) and intestinal absorption rates (95.1% and 85.0%), indicating strong potential for gastrointestinal uptake. Regorafenib also demonstrated favorable absorption (88.7%) and lipophilicity (LogP 5.69).
In contrast, Orapred displayed lower intestinal absorption (24.9%) due to its hydrophilic nature (LogP ), although it exhibited good solubility and acceptable physicochemical properties. Selinexor presented a balanced ADMET profile with moderate solubility and absorption (86.3%).
All tested compounds were predicted to be P-glycoprotein substrates, suggesting potential interaction with efflux transporters, while several (Capmatinib, Ponatinib, and Regorafenib) were also predicted as P-gp inhibitors, indicating possible modulation of drug transport mechanisms. Overall, Ponatinib, Capmatinib, and Regorafenib demonstrated optimal ADMET characteristics with good absorption potential, while Selinexor and Orapred showed favorable solubility and safety-related properties.
These findings support the docking results and indicate that the top-ranked compounds possess acceptable pharmacokinetic and safety profiles suitable for further experimental validation.
5. Discussion
This study presents an integrative multi-omics framework based on Kernel Machine Regression for identifying higher-order molecular interactions in lung squamous cell carcinoma (LUSC). Unlike traditional single-omics or pairwise models, this approach captures complex, non-linear relationships across gene expression, DNA methylation, and miRNA expression layers. By jointly modeling these data types, the framework provides a more comprehensive understanding of molecular mechanisms underlying lung cancer progression.
The combined use of four statistical tests (LIMMA, T-test, Wilcoxon, and Canonical Correlation Analysis) ensured a rigorous and noise-reduced feature selection process before KMR modeling. This consensus strategy enhanced robustness and reproducibility. The subsequent KMR analysis successfully revealed multi-omics triplets with significant composite effects, highlighting 44 key genes, among which PDGFRA, ITGB1, SNAI1, FGF11, PDGFRB, ID1, TNXB, and ZIC1 emerged as central nodes in the protein–protein interaction network. These genes are known to participate in essential biological processes such as epithelial–mesenchymal transition, angiogenesis, and extracellular matrix remodeling, supporting their relevance in lung cancer pathogenesis. The integration of network analysis and molecular docking further strengthened the translational potential of this framework. Docking results demonstrated that Selinexor, Orapred, and Capmatinib exhibit strong binding affinities toward multiple hub proteins, consistent with existing clinical and pharmacological evidence of their antitumor activity. This alignment between computational predictions and reported therapeutic effects supports the validity of the proposed pipeline for drug repurposing applications, a strategy increasingly utilized in cancers such as bladder cancer [14]. The molecular docking analysis successfully identified candidates with high binding affinity, but this alone is insufficient to determine therapeutic potential. The in silico ADMET profiling (Section 4.3) provides a critical second layer of validation. Our findings indicate that top candidates like Capmatinib and Ponatinib are particularly promising, as they demonstrate not only strong target affinity but also high predicted Caco-2 permeability and intestinal absorption. This suggests a high potential for oral bioavailability, a crucial factor for clinical viability. This ADMET analysis, therefore, allows for a more nuanced prioritization of candidates, strengthening the translational relevance of the screening pipeline
Nonetheless, several limitations should be acknowledged. Integrating heterogeneous omics datasets can introduce bias from technical variation, despite careful normalization. The KMR framework also depends on kernel choice and parameter tuning, which may influence interpretability. It is also important to note that kernel regression by itself is not inherently robust to outliers, as standard implementations can be affected by them. Robustness can be improved by incorporating robust loss functions or adopting robust kernel methods designed to mitigate outlier influence, such as robust kernel canonical correlation analysis [34,64,65]. Furthermore, molecular docking represents static protein–ligand interactions and does not fully capture dynamic conformational changes or pharmacokinetic behavior. Similarly, the in silico ADMET profiling, while a valuable screening tool, relies on predictive models and requires experimental validation to confirm the in vivo pharmacokinetic and toxicity profiles of the candidates. Future studies incorporating molecular dynamics simulations and experimental assays are therefore needed to validate these computational findings.
Overall, the findings demonstrate that KMR is a robust and flexible tool for integrative omics research, capable of uncovering biologically meaningful patterns and facilitating the identification of potential therapeutic targets for complex diseases such as lung cancer.
6. Conclusions
This work proposes a unified multi-omics integration framework using Kernel Machine Regression (KMR) to identify higher-order molecular interactions and potential therapeutic targets in lung cancer. The framework effectively detected statistically significant interaction triplets and revealed key genes (PDGFRA, ITGB1, SNAI1, FGF11, PDGFRB, ID1, TNXB, and ZIC1) that form a highly interconnected and biologically coherent network.
Through complementary network and docking analyses, Selinexor, Orapred, and Capmatinib were identified as strong candidate drugs, showing high binding affinity with the hub proteins. Furthermore, in silico ADMET profiling confirmed these candidates possess favorable pharmacokinetic properties, supporting their high potential for repurposing in lung cancer therapy.
The proposed framework underscores the power of combining kernel-based modeling with integrative omics analysis for translational applications. While the reliability of results depends on data quality and kernel parameterization, this study provides a reproducible and adaptable computational foundation for exploring complex diseases. Future work will focus on validating the identified targets experimentally and extending the framework to additional cancer types.
Supplementary Materials
The following supporting information can be downloaded at: https://www.mdpi.com/article/10.3390/app152111506/s1. Table S1: Molecular Docking Results for 190 Screened Compounds. Table S2: Predicted ADMET Properties of Top-Ranked Drug Candidates.
Author Contributions
Conceptualization, M.I.A., and M.A.A.; methodology, M.I.A., M.A.A., and M.D.H.; software, M.M.R. (Md. Mostafizer Rahman), and M.S.M.; validation, M.S.M., Y.W., and M.A.H.; formal analysis, M.I.A., and M.D.H.; investigation, M.M.R. (Md. Mamunur Rashid), and M.S.R.; resources, Y.W., M.A.H., and M.M.R. (Md. Mamunur Rashid); data curation, M.I.A., and M.S.R.; writing—original draft preparation, M.I.A.; writing—review and editing, M.D.H., M.M.R. (Md. Mostafizer Rahman), M.S.M., Y.W., M.A.H., M.M.R. (Md. Mamunur Rashid), M.S.R., and M.A.A.; visualization, M.M.R. (Md. Mostafizer Rahman), and M.S.M.; supervision, M.A.A.; project administration, M.A.A.; funding acquisition, M.A.A., M.M.R. (Md. Mostafizer Rahman), and Y.W. All authors have read and agreed to the published version of the manuscript.
Funding
This research received no external funding.
Institutional Review Board Statement
Not applicable.
Informed Consent Statement
Not applicable.
Data Availability Statement
The data presented in this study are openly available in http://acgt.cs.tau.ac.il/multi_omic_benchmark/download.html, accessed on 23 September 2025.
Conflicts of Interest
The authors declare no conflicts of interest.
Abbreviations
| KMR | Kernel Machine Regression |
| TCGA | The Cancer Genome Atlas |
| GE | Gene Expression |
| DNA | Deoxyribonucleic Acid |
| miRNA | Micro Ribonucleic Acid |
| DEG | Differential Gene Expression |
| LIMMA | Linear Models for Microarray Data |
| MIRKAT | Microbiome Regression-Based Kernel Association Test |
| CCA | Canonical Correlation Analysis |
| LUSC | Lung Squamous Cell Carcinoma |
| CNV | Copy Number Variation |
| ReML | Restricted Maximum Likelihood |
| PDB | Protein Data Bank |
| PCA | Principal Component Analysis |
| RPKM | Reads Per Kilobase per Million mapped reads |
| SKAT | Sequence Kernel Association Test |
| MCC | Maximal Clique Centrality |
| MNC | Maximum Neighborhood Component |
| EPC | Edge Percolated Component |
| PPI | Protein–Protein Interaction |
References
- Alam, M.A.; Lin, H.Y.; Deng, H.W.; Calhoun, V.D.; Wang, Y.P. A kernel machine method for detecting higher order interactions in multimodal datasets: Application to schizophrenia. J. Neurosci. Methods 2018, 309, 161–174. [Google Scholar] [CrossRef]
- Rappoport, N.; Shamir, R. Multi-omic and multi-view clustering algorithms: Review and cancer benchmark. Nucleic Acids Res. 2018, 46, 10546–10562. [Google Scholar] [CrossRef]
- Goodwin, S.; McPherson, J.D.; McCombie, W.R. Coming of age: Ten years of next-generation sequencing technologies. Nat. Rev. Genet. 2016, 17, 333–351. [Google Scholar] [CrossRef]
- Ozsolak, F.; Milos, P.M. RNA sequencing: Advances, challenges and opportunities. Nat. Rev. Genet. 2011, 12, 87–98. [Google Scholar] [CrossRef]
- Allison, D.; Cui, X.; Page, G.; Sabripour, M. Microarray Data Analysis: From Disarray to Consolidation and Consensus. Nat. Reviews. Genet. 2006, 7, 55–65. [Google Scholar] [CrossRef]
- Yong, W.S.; Hsu, F.M.; Chen, P.Y. Profiling genome-wide DNA methylation. Epigenetics Chromatin 2016, 9, 26. [Google Scholar] [CrossRef]
- Canzler, S.; Schor, J.; Busch, W.; Schubert, K.; Rolle-Kampczyk, U.; Seitz, H.; Kamp, H.; Von Bergen, M.; Buesen, R.; Hackermüller, J. Prospects and challenges of multi-omics data integration in toxicology. Arch. Toxicol. 2020, 94, 371–388. [Google Scholar] [CrossRef]
- Nevedomskaya, E.; Haendler, B. From Omics to Multi-Omics Approaches for In-Depth Analysis of the Molecular Mechanisms of Prostate Cancer. Int. J. Mol. Sci. 2022, 23, 6281. [Google Scholar] [CrossRef] [PubMed]
- Ma, T.; Zhang, A. Integrate multi-omics data with biological interaction networks using Multi-view Factorization AutoEncoder (MAE). BMC Genom. 2019, 20, 944. [Google Scholar] [CrossRef] [PubMed]
- Alam, M.A.; Qiu, C.; Shen, H.; Wang, Y.P.; deng, H.W. A generalized kernel machine approach to identify higher-order composite effects in multi-view datasets, with application to adolescent brain development and osteoporosis. J. Biomed. Inform. 2021, 120, 103854. [Google Scholar] [CrossRef] [PubMed]
- Duan, R.; Gao, L.; Gao, Y.; Hu, Y.; Xu, H.; Huang, M.; Song, K.; Wang, H.; Dong, Y.; Jiang, C.; et al. Evaluation and comparison of multi-omics data integration methods for cancer subtyping. PLoS Comput. Biol. 2021, 17, e1009224. [Google Scholar] [CrossRef]
- Menyhart, O.; Györffy, B. Multi-omics approaches in cancer research with applications in tumor subtyping, prognosis, and diagnosis. Comput. Struct. Biotechnol. J. 2021, 19, 949–960. [Google Scholar] [CrossRef]
- Chen, W.; Li, Y.; Zhang, C.; Zhou, H.; Ma, J.; Vaishnani, D.K.; Zeng, B.; Yu, J.; Mao, H.; Zheng, J. Multi-Omics and Experimental Validation Reveal Anti-HCC Mechanisms of Tibetan Liuwei Muxiang Pill and Quercetin. Pharmaceuticals 2025, 18, 900. [Google Scholar] [CrossRef]
- Mokou, M.; Lygirou, V.; Angelioudaki, I.; Paschalidis, N.; Stroggilos, R.; Frantzi, M.; Latosinska, A.; Bamias, A.; Hoffmann, M.J.; Mischak, H.; et al. A Novel Pipeline for Drug Repurposing for Bladder Cancer Based on Patients’ Omics Signatures. Cancers 2020, 12, 3519. [Google Scholar] [CrossRef]
- www.cancer.org. American Cancer Society, Key Statistics for Lung Cancer. 2022. Available online: https://www.cancer.org/cancer/lung-cancer/about/key-statistics.html (accessed on 23 September 2025).
- Lemjabbar-Alaoui, H.; Hassan, O.U.; Yang, Y.W.; Buchanan, P. Lung cancer: Biology and treatment options. Biochim. et Biophys. Acta (BBA)-Rev. Cancer 2015, 1856, 189–210. [Google Scholar] [CrossRef] [PubMed]
- Sathyanarayanan, A.; Gupta, R.; Thompson, E.; Nyholt, D.; Bauer, D.; Nagaraj, S. A comparative study of multi-omics integration tools for cancer driver gene identification and tumour subtyping. Briefings Bioinform. 2019, 21, 1920–1936. [Google Scholar] [CrossRef] [PubMed]
- Hofmann, T.; Schölkopf, B.; Smola, A. Kernel methods in machine learning. Ann. Stat. 2007, 36, 1171–1220. [Google Scholar] [CrossRef]
- Baião, A.; Cai, Z.S.; Poulos, R.; Robinson, P.; Reddel, R.; Zhong, Q.; Vinga, S.; Gonçalves, E. A technical review of multi-omics data integration methods: From classical statistical to deep generative approaches. Briefings Bioinform. 2025, 26, bbaf355. [Google Scholar] [CrossRef] [PubMed]
- Briscik, M.; Tazza, G.; Vidacs, L.; Dillies, M.A.; Déjean, S. Supervised multiple kernel learning approaches for multi-omics data integration. BioData Min. 2024, 17, 53. [Google Scholar] [CrossRef] [PubMed]
- Yan, K.K.; Zhao, H.; Pang, H. A comparison of graph- and kernel-based –omics data integration algorithms for classifying complex traits. BMC Bioinform. 2017, 18, 539. [Google Scholar] [CrossRef]
- Yu, S.; Tranchevent, L.C.; De Moor, B.; Moreau, Y. Kernel-Based Data Fusion for Machine Learning-Methods and Applications in Bioinformatics and Text Mining; Springer: Berlin/Heidelberg, Germany, 2011; Volume 345. [Google Scholar] [CrossRef]
- Richfield, O.; Alam, M.A.; Calhoun, V.; Wang, Y.P. Learning Schizophrenia Imaging Genetics Data Via Multiple Kernel Canonical Correlation Analysis. In Proceedings of the IEEE International Conference on Bioinformatics and Biomedicine, Shenzhen, China, 15–18 December 2016. [Google Scholar] [CrossRef]
- Rupnik, J.; Shawe-Taylor, J. Multi-View Canonical Correlation Analysis. In Proceedings of the Conference on Data Mining and Data Warehouses (SiKDD 2010), Ljubljana, Slovenia, 12 October 2010. [Google Scholar]
- Brandolini, M.; Pétéra, M.; Gaudreau, P.; Comte, B.; Bougeard, S.; Pujos-Guillot, E. Multi-block PLS discriminant analysis for the joint analysis of metabolomic and epidemiological data. Metabolomics 2019, 15, 134. [Google Scholar] [CrossRef]
- Csala, A.; Zwinderman, A.; Hof, M. Multiset sparse partial least squares path modeling for high dimensional omics data analysis. BMC Bioinform. 2020, 21, 9. [Google Scholar] [CrossRef]
- Dugourd, A.; Saez-Rodriguez, J. Footprint-based functional analysis of multiomic data. Curr. Opin. Syst. Biol. 2019, 15, 82–90. [Google Scholar] [CrossRef]
- Liu, D.; Lin, X.; Ghosh, D. Semiparametric Regression of Multidimensional Genetic Pathway Data: Least-Squares Kernel Machines and Linear Mixed Models. Biometrics 2008, 63, 1079–1088. [Google Scholar] [CrossRef]
- Alam, M.A.; Fukumizu, K. Higher-Order Regularized Kernel Canonical Correlation Analysis. Int. J. Pattern Recognit. Artif. Intell. 2015, 29, 150302192043004. [Google Scholar] [CrossRef]
- Cai, Z.S.; Poulos, R.; Liu, J.; Zhong, Q. Machine learning for multi-omics data integration in cancer. iScience 2022, 25, 103798. [Google Scholar] [CrossRef] [PubMed]
- Alam, M.A. Kernel Choice for Unsupervised Kernel Methods. Ph.D. Thesis, The Graduate University of Advanced Studies, Hayama, Japan, 2014. [Google Scholar]
- Kung, S. Kernel Methods and Machine Learning; Cambridge University Press: Singapore, 2014. [Google Scholar] [CrossRef]
- Peng, Q.; Zhao, J.; Fuzhong, X. A gene-based method for detecting gene-gene co-association in a case-control association study. Eur. J. Hum. Genet. 2009, 18, 582–587. [Google Scholar] [CrossRef]
- Alam, M.A.; Komori, O.; deng, H.W.; Calhoun, V.; Wang, Y.P. Robust Kernel Canonical Correlation Analysis to Detect Gene-Gene Co-associations: A Case Study in Genetics. J. Bioinform. Comput. Biol. 2019, 17, 1950028. [Google Scholar] [CrossRef]
- Mariette, J.; Villa-Vialaneix, N. Unsupervised multiple kernel learning for heterogeneous data integration. Bioinformatics 2017, 34, 1009–1015. [Google Scholar] [CrossRef] [PubMed]
- Rattray, N.; Deziel, N.; Wallach, J.; Khan, S.; Vasiliou, V.; Ioannidis, J.; Johnson, C. Beyond genomics: Understanding exposotypes through metabolomics. Hum. Genom. 2018, 12, 4. [Google Scholar] [CrossRef] [PubMed]
- Ge, T.; Nichols, T.E.; Ghosh, D.; Mormino, E.C.; Smoller, J.W.; Sabuncu, M.R. A kernel machine method for detecting effects of interaction between multidimensional variable sets: An imaging genetics application. NeuroImage 2015, 109, 505–514. [Google Scholar] [CrossRef][Green Version]
- Zhao, N.; Zhang, H.; Clark, J.J.; Maity, A.; Wu, M.C. Composite kernel machine regression based on likelihood ratio test for joint testing of genetic and gene-environment interaction effect. Biometrics 2019, 75, 625–637. [Google Scholar] [CrossRef]
- Liu, S.; Bobb, J.; Claus Henn, B.; Gennings, C.; Schnaas, L.; Tellez Rojo Solis, M.M.; Bellinger, D.; Arora, M.; Wright, R.; Coull, B. Bayesian varying coefficient kernel machine regression to assess neurodevelopmental trajectories associated with exposure to complex mixtures. Stat. Med. 2018, 37, 4680–4694. [Google Scholar] [CrossRef]
- Feng, J.; Jiang, L.; Li, S.; Tang, J.; Wen, L. Multi-Omics Data Fusion via a Joint Kernel Learning Model for Cancer Subtype Discovery and Essential Gene Identification. Front. Genet. 2021, 12, 647141. [Google Scholar] [CrossRef] [PubMed]
- TCGA. Multi-Omics Cancer Benchmark TCGA Preprocessed Data. 2021. Available online: http://acgt.cs.tau.ac.il/multi_omic_benchmark/download.html (accessed on 23 September 2025).
- Ritchie, M.; Phipson, B.; Wu, D.; Hu, Y.; Law, C.; Shi, W.; Smyth, G. LIMMA powers differential expression analyses for RNA-sequencing and microarray studies. Nucleic Acids Res. 2015, 43, e47. [Google Scholar] [CrossRef] [PubMed]
- Cui, X.; Churchill, G. Statistical tests for differential expression in cDNA microarray experiments. Genome Biol. 2003, 4, 210. [Google Scholar] [CrossRef] [PubMed]
- Wilcoxon, F. Individual Comparisons by Ranking Methods. In Breakthroughs in Statistics: Methodology and Distribution; Springer: New York, NY, USA, 1992; pp. 196–202. [Google Scholar] [CrossRef]
- Nazari, H.; Rezaeipanah, A. A Gene Expression Clustering Method to Extraction of Cell-to-Cell Biological Communication. Intel. Artif. 2022, 25, 1–12. [Google Scholar] [CrossRef]
- Hardoon, D.R.; Szedmak, S.; Shawe-Taylor, J. Canonical Correlation Analysis: An Overview with Application to Learning Methods. Neural Comput. 2004, 16, 2639–2664. [Google Scholar] [CrossRef]
- HARVILLE, D.A. Bayesian inference for variance components using only error contrasts. Biometrika 1974, 61, 383–385. [Google Scholar] [CrossRef]
- Wu, M.; Seunggeun, L.; Cai, T.; Li, Y.; Boehnke, M.; Lin, X. Rare-Variant Association Testing for Sequencing Data with the Sequence Kernel Association Test. Am. J. Hum. Genet. 2011, 89, 82–93. [Google Scholar] [CrossRef]
- Berman, H.; Battistuz, T.; Bhat, T.; Bluhm, W.; Bourne, P.; Burkhardt, K.; Feng, Z.; Gilliland, G.; Iype, L.; Jain, S.; et al. The Protein Data Bank. Acta Crystallogr. Sect. D 2002, 58, 899–907. [Google Scholar] [CrossRef]
- Waterhouse, A.; Bertoni, M.; Bienert, S.; Studer, G.; Tauriello, G.; Gumienny, R.; Heer, F.; Beer, T.; Rempfer, C.; Bordoli, L.; et al. SWISS-MODEL: Homology modelling of protein structures and complexes. Nucleic Acids Res. 2018, 46, W296–W303. [Google Scholar] [CrossRef]
- Kim, S.; Chen, J.; Cheng, T.; Gindulyte, A.; He, J.; He, S.; Li, Q.; Shoemaker, B.A.; Thiessen, P.A.; Yu, B.; et al. PubChem 2019 update: Improved access to chemical data. Nucleic Acids Res. 2018, 47, D1102–D1109. [Google Scholar] [CrossRef] [PubMed]
- Dassault Systèmes. Discovery Studio Visualizer, v21.1.0.20298. 2021. Available online: https://discover.3ds.com/discovery-studio-visualizer-download (accessed on 23 September 2025).
- UCSF Chimera. PDB2PQR Server Documentation. Available online: https://www.cgl.ucsf.edu/chimera/docs/ContributedSoftware/apbs/pdb2pqr.html (accessed on 23 September 2025).
- Hanwell, M.; Curtis, D.; Lonie, D.; Vandermeersch, T.; Zurek, E.; Hutchison, G. Avogadro: An advanced semantic chemical editor, visualization, and analysis platform. J Chem Inf 4. J. Cheminform. 2012, 4, 17. [Google Scholar] [CrossRef]
- Morris, G.; Huey, R.; Lindstrom, W.; Sanner, M.; Belew, R.; Goodsell, D.; Olson, A. AutoDock4 and AutoDockTools4: Automated Docking with Selective Receptor Flexibility. J. Comput. Chem. 2009, 30, 2785–2791. [Google Scholar] [CrossRef]
- Trott, O.; Olson, A. Software News and Update AutoDock Vina: Improving the speed and accuracy of docking with a new scoring function, efficient optimization, and multithreading. J. Comput. Chem. 2010, 31, 455–461. [Google Scholar] [CrossRef] [PubMed]
- Reza, M.S.; Qiu, C.; Lin, X.; Su, K.; Liu, A.; Zhang, X.; Gong, Y.; Luo, Z.; Tian, Q.; Nwadiugwu, M.; et al. An Attention-Aware Multi-Task Learning Framework Identifies Candidate Targets for Drug Repurposing in Sarcopenia. J. Cachexia Sarcopenia Muscle 2025, 16, e13661. [Google Scholar] [CrossRef]
- Visualizer, D.S. v4. 0.100. 13345; Accelrys Softw. Inc.: San Diego, CA, USA, 2005. [Google Scholar]
- Pires, D.; Blundell, T.; Ascher, D. pkCSM: Predicting Small-Molecule Pharmacokinetic and Toxicity Properties Using Graph-Based Signatures. J. Med. Chem. 2015, 58, 4066–4072. [Google Scholar] [CrossRef] [PubMed]
- Ashburn, T.; Thor, K. Drug repositioning: Identifying and developing new uses for existing drugs. Nat. Reviews. Drug Discov. 2004, 3, 673–683. [Google Scholar] [CrossRef]
- Afroz, S.; Islam, N.; Habib, M.A.; Reza, M.S.; Alam, M.A. Multi-omics data integration and drug screening of AML cancer using generative adversarial network. Methods 2024, 226, 138–150. [Google Scholar] [CrossRef]
- Rosen, J.; Weiss, J.; Pham, N.A.; Li, Q.; N. Martins-Filho, S.; Wang, Y.; Tsao, M.S.; Moghal, N. Antitumor efficacy of XPO1 inhibitor Selinexor in KRAS-mutant lung adenocarcinoma patient-derived xenografts. Transl. Oncol. 2021, 14, 101179. [Google Scholar] [CrossRef] [PubMed]
- Brazel, D.; Zhang, S.; Nagasaka, M. Spotlight on Tepotinib and Capmatinib for Non-Small Cell Lung Cancer with MET Exon 14 Skipping Mutation. Lung Cancer Targets Ther. 2022, 13, 33–45. [Google Scholar] [CrossRef] [PubMed]
- Alam, M.A.; Calhoun, V.D.; Wang, Y.P. Identifying outliers using multiple kernel canonical correlation analysis with application to imaging genetics. Comput. Stat. Data Anal. 2018, 125, 70–85. [Google Scholar] [CrossRef]
- Alam, M.A.; Fukumizu, K.; Wang, Y.P. Influence function and robust variant of kernel canonical correlation analysis. Neurocomputing 2018, 304, 12–29. [Google Scholar] [CrossRef]


Disclaimer/Publisher’s Note: The statements, opinions and data contained in all publications are solely those of the individual author(s) and contributor(s) and not of MDPI and/or the editor(s). MDPI and/or the editor(s) disclaim responsibility for any injury to people or property resulting from any ideas, methods, instructions or products referred to in the content. |
© 2025 by the authors. Licensee MDPI, Basel, Switzerland. This article is an open access article distributed under the terms and conditions of the Creative Commons Attribution (CC BY) license (https://creativecommons.org/licenses/by/4.0/).