1. Introduction
Leukemia is a difficult blood cancer and a cause of cancer deaths and sickness around the world. A stem cell transplant from a donor is seen as the best curative option for many leukemia patients, especially when standard treatments are not working [
1]. Researchers have explored machine learning methods such as support vector machines, random forests, convolutional neural networks, and recurrent neural networks to predict donor–recipient compatibility and classify diseases [
2,
3]. This research puts forward a graph neural network method to tackle the problems in stem cell transplantation. It uses graph data of donor–recipient pairs, including single-nucleotide polymorphisms (SNP), human leukocyte antigen (HLA) types, and clinical details. Graph attention networks are used to find important matching traits, and Dynamic GNNs track changes in disease and immune markers [
4]. This work improves match prediction using a graph neural network (GNN) model by combining different multi-omics data types. Attention mechanisms help the model explain its decisions. The model is tested on data from the 1000 Genomes Project, and results show it performs better than support vector machine (SVM), convolutional neural networks (CNNs), and recurrent neural networks (RNNs). Fluorescence tests confirm its biological relevance [
5]. The paper is organized as follows:
Section 2 reviews related studies,
Section 3 details the method,
Section 4 presents the test results,
Section 5 discusses the meaning and limits of the results, and
Section 6 concludes with suggestions for future studies [
6].
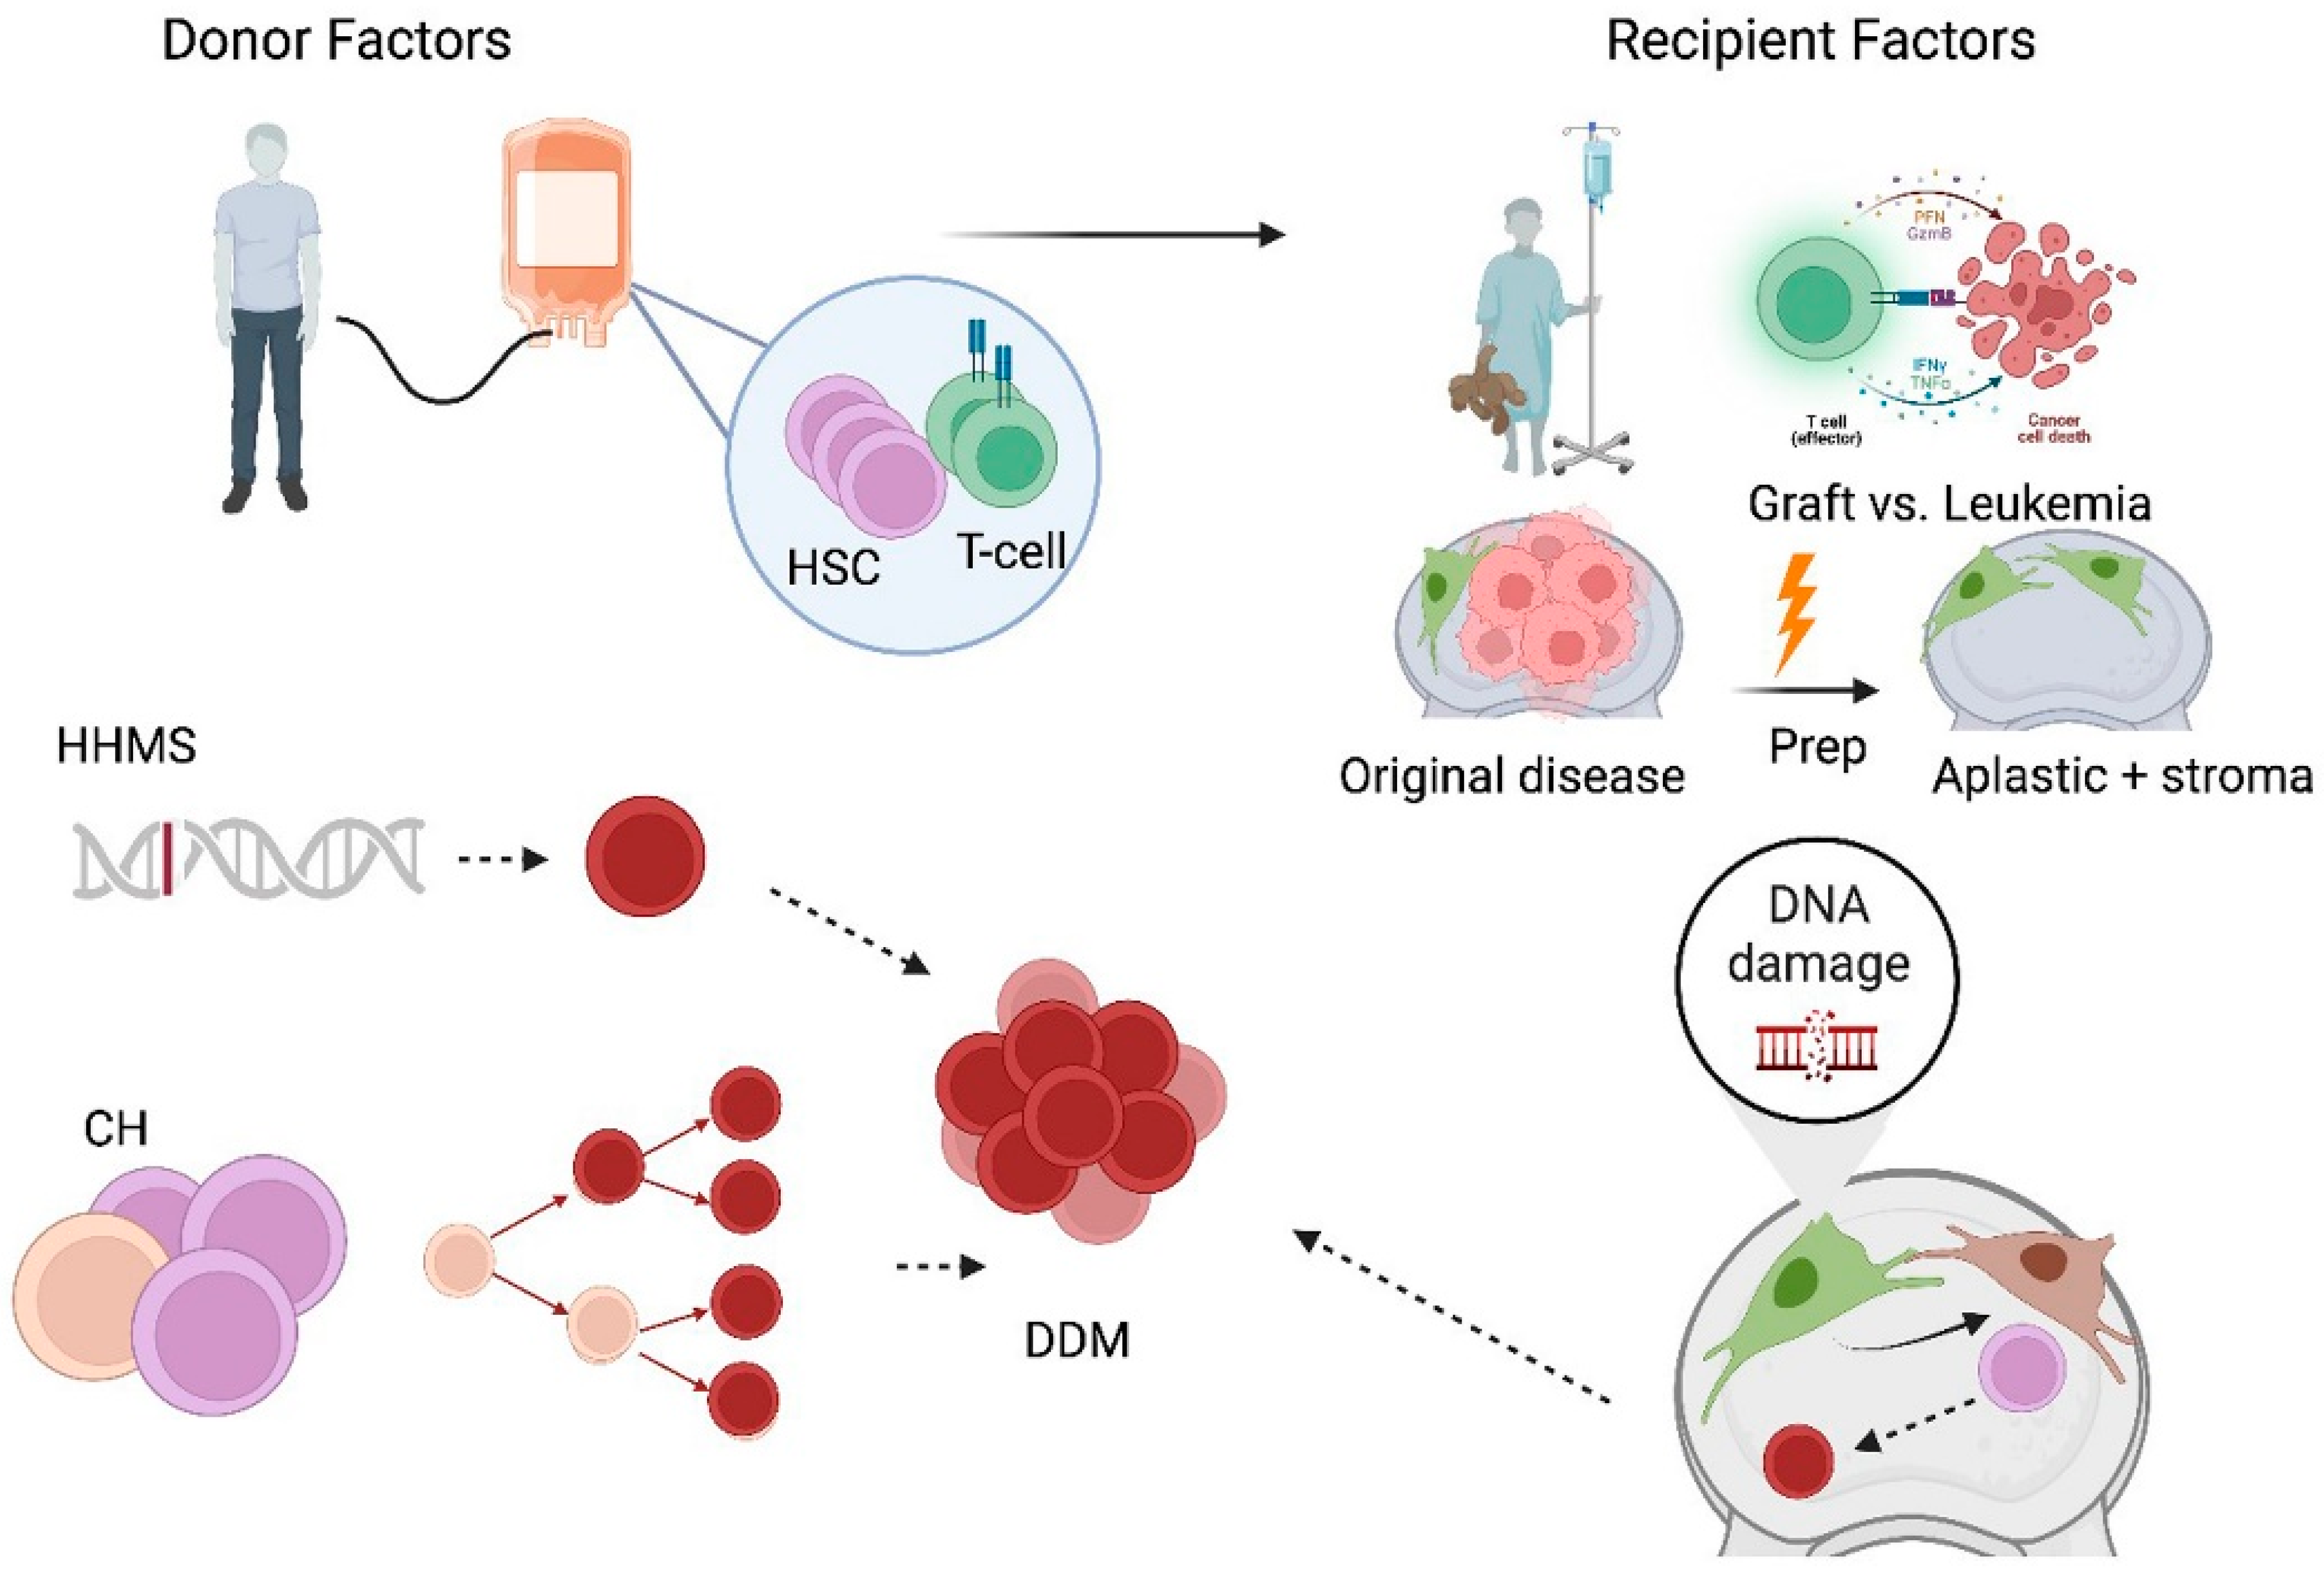
Figure 1 shows that their analytical nature on structured data makes them useful in solving issues in stem cell transplantation, like HLA matching, immune reconstitution, and disease classification, as listed in [
6].
Graph neural networks (GNNs) are valuable because of their ability to process diverse datasets. In stem cell transplants, matching a donor involves considering genetic factors, proteins, and patient data. Traditional statistical models often struggle to integrate this information. GNNs, in contrast, can represent donor–recipient matches as graphs with individuals as nodes and biological matches as links. This improves predictions and helps clarify the reasons for successful matches. GNNs can employ donor–recipient interaction networks to predict the likelihood of Graft-versus-Host Disease (GvHD). These predictions allow doctors to use personalized preventative treatments, reducing post-transplant problems and increasing patient survival. Recent developments in GNN design have expanded their applications [
7,
8,
9,
10,
11,
12].
A large part of the efficacy of HSCT as an important treatment modality for leukemia depends on adequate donor–recipient compatibility. In spite of a plethora of advancements in HLA typing and genomic sequencing, as described in [
13], present-day compatibility models have traditionally been static, one-dimensional approaches and therefore less useful in illustrating dynamic, multi-omics relationships underlying biology and immunology.
Complexity of HLA matching: Traditionally, classical approaches are weak and unable to discern the tiny nuances of immunogenomic variance impacting transplant outcome, as well as complications following transplantation.
High-dimensionality: In donor–recipient matching, multiple layers of genomic, proteomic, and clinical data exist. Statistical models may struggle with integrating the latter.
Dynamic Biological Processes: Compatibility is not static; it evolves over time as immune reconstitution, engraftment, and potential relapse occur, which current static models fail to predict.
Sparse and Imbalanced Datasets: Donor–recipient datasets are often limited and imbalanced, with fewer examples of successful outcomes, limiting the effectiveness of traditional predictive models.
Limited Prediction of Leukemia Relapse: The models used previously fail to predict the post-transplant immune dynamics and residual markers of disease-driven relapse.
Poor Explainability: Most compatibility models act as a black box, thus offering minimal insight into the underlying biologically construed mechanisms, leading to limited applicability in the clinic.
Risk of GvHD Management: There is no robust tool for the prediction and mitigation of GvHD, which is the biggest problem with transplantation.
This study introduces graph neural networks (GNNs) to develop a robust computational method for assessing compatibility between stem cell donors and recipients, aiming to facilitate early leukemia detection and diagnosis. The research intends to address major gaps in compatibility prediction, risk assessment, and disease control by accounting for the complex nature of biological and immunological systems.
Develop a Compatibility Prediction Model: A GNN-based framework that models donor–recipient compatibility using HLA typing, SNPs, and immune interaction networks.
Integrate Multi-Omics Data: Employ multi-omics datasets, including transcriptomics, epigenomics, and proteomics, to develop a comprehensive compatibility graph.
Improved Prediction of Leukemia Relapse: Dynamic GNNs can be used to model temporal immune and genomic interactions, thus allowing for the early detection of relapse post-transplant.
Improved Disease Classification: A unified graph representation of clinical, genomic, and proteomic markers should be designed to improve the classification of leukemia subtypes.
Modeling GvHD Risk: Heterogeneous GNNs can be used to predict the risk of graft-versus-host disease (GvHD) based on donor–recipient interaction networks and immunomodulatory pathways.
Validate Model Scalability and Generalizability: Extensive validation with diverse and heterogeneous datasets to ensure the model is adaptable across patient populations.
Develop Explainable GNNs: Design interpretable models to explain key compatibility determinants and provide actionable insights for clinicians.
This research introduces a computational system based on graph neural networks (GNNs) to address problems in hematopoietic stem cell transplant and leukemia treatment. By matching donors and recipients using HLA typing, SNPs, and immune networks, this method offers a more biologically relevant option compared to current matching methods. A main part of this system is the integration of multi-omics data, such as transcriptomics, epigenomics, and proteomics, into combined graph structures. This captures the complex molecular and immunological interactions that affect transplant outcomes. The system also helps clinicians by using dynamic GNNs to simulate changes in genomic and immune activity over time, which allows for early prediction of leukemia relapse and better disease risk classification. Also, graph-based models enhance the classification of leukemia subtypes and use different GNNs to predict graft-versus-host disease (GvHD) risk, a major issue in transplantation. The model’s effectiveness is verified using various datasets, showing its scalability and applicability to different patient groups and donor pools. The design of the GNN includes interpretability, linking artificial intelligence and clinical aspects. It generates understandable outputs that show key compatibility factors and offer insights for clinicians. In short, this study is at the intersection of machine learning and specific medicine, creating a basis for improved patient outcomes via data-driven and understandable compatibility models.
3. Materials and Methods
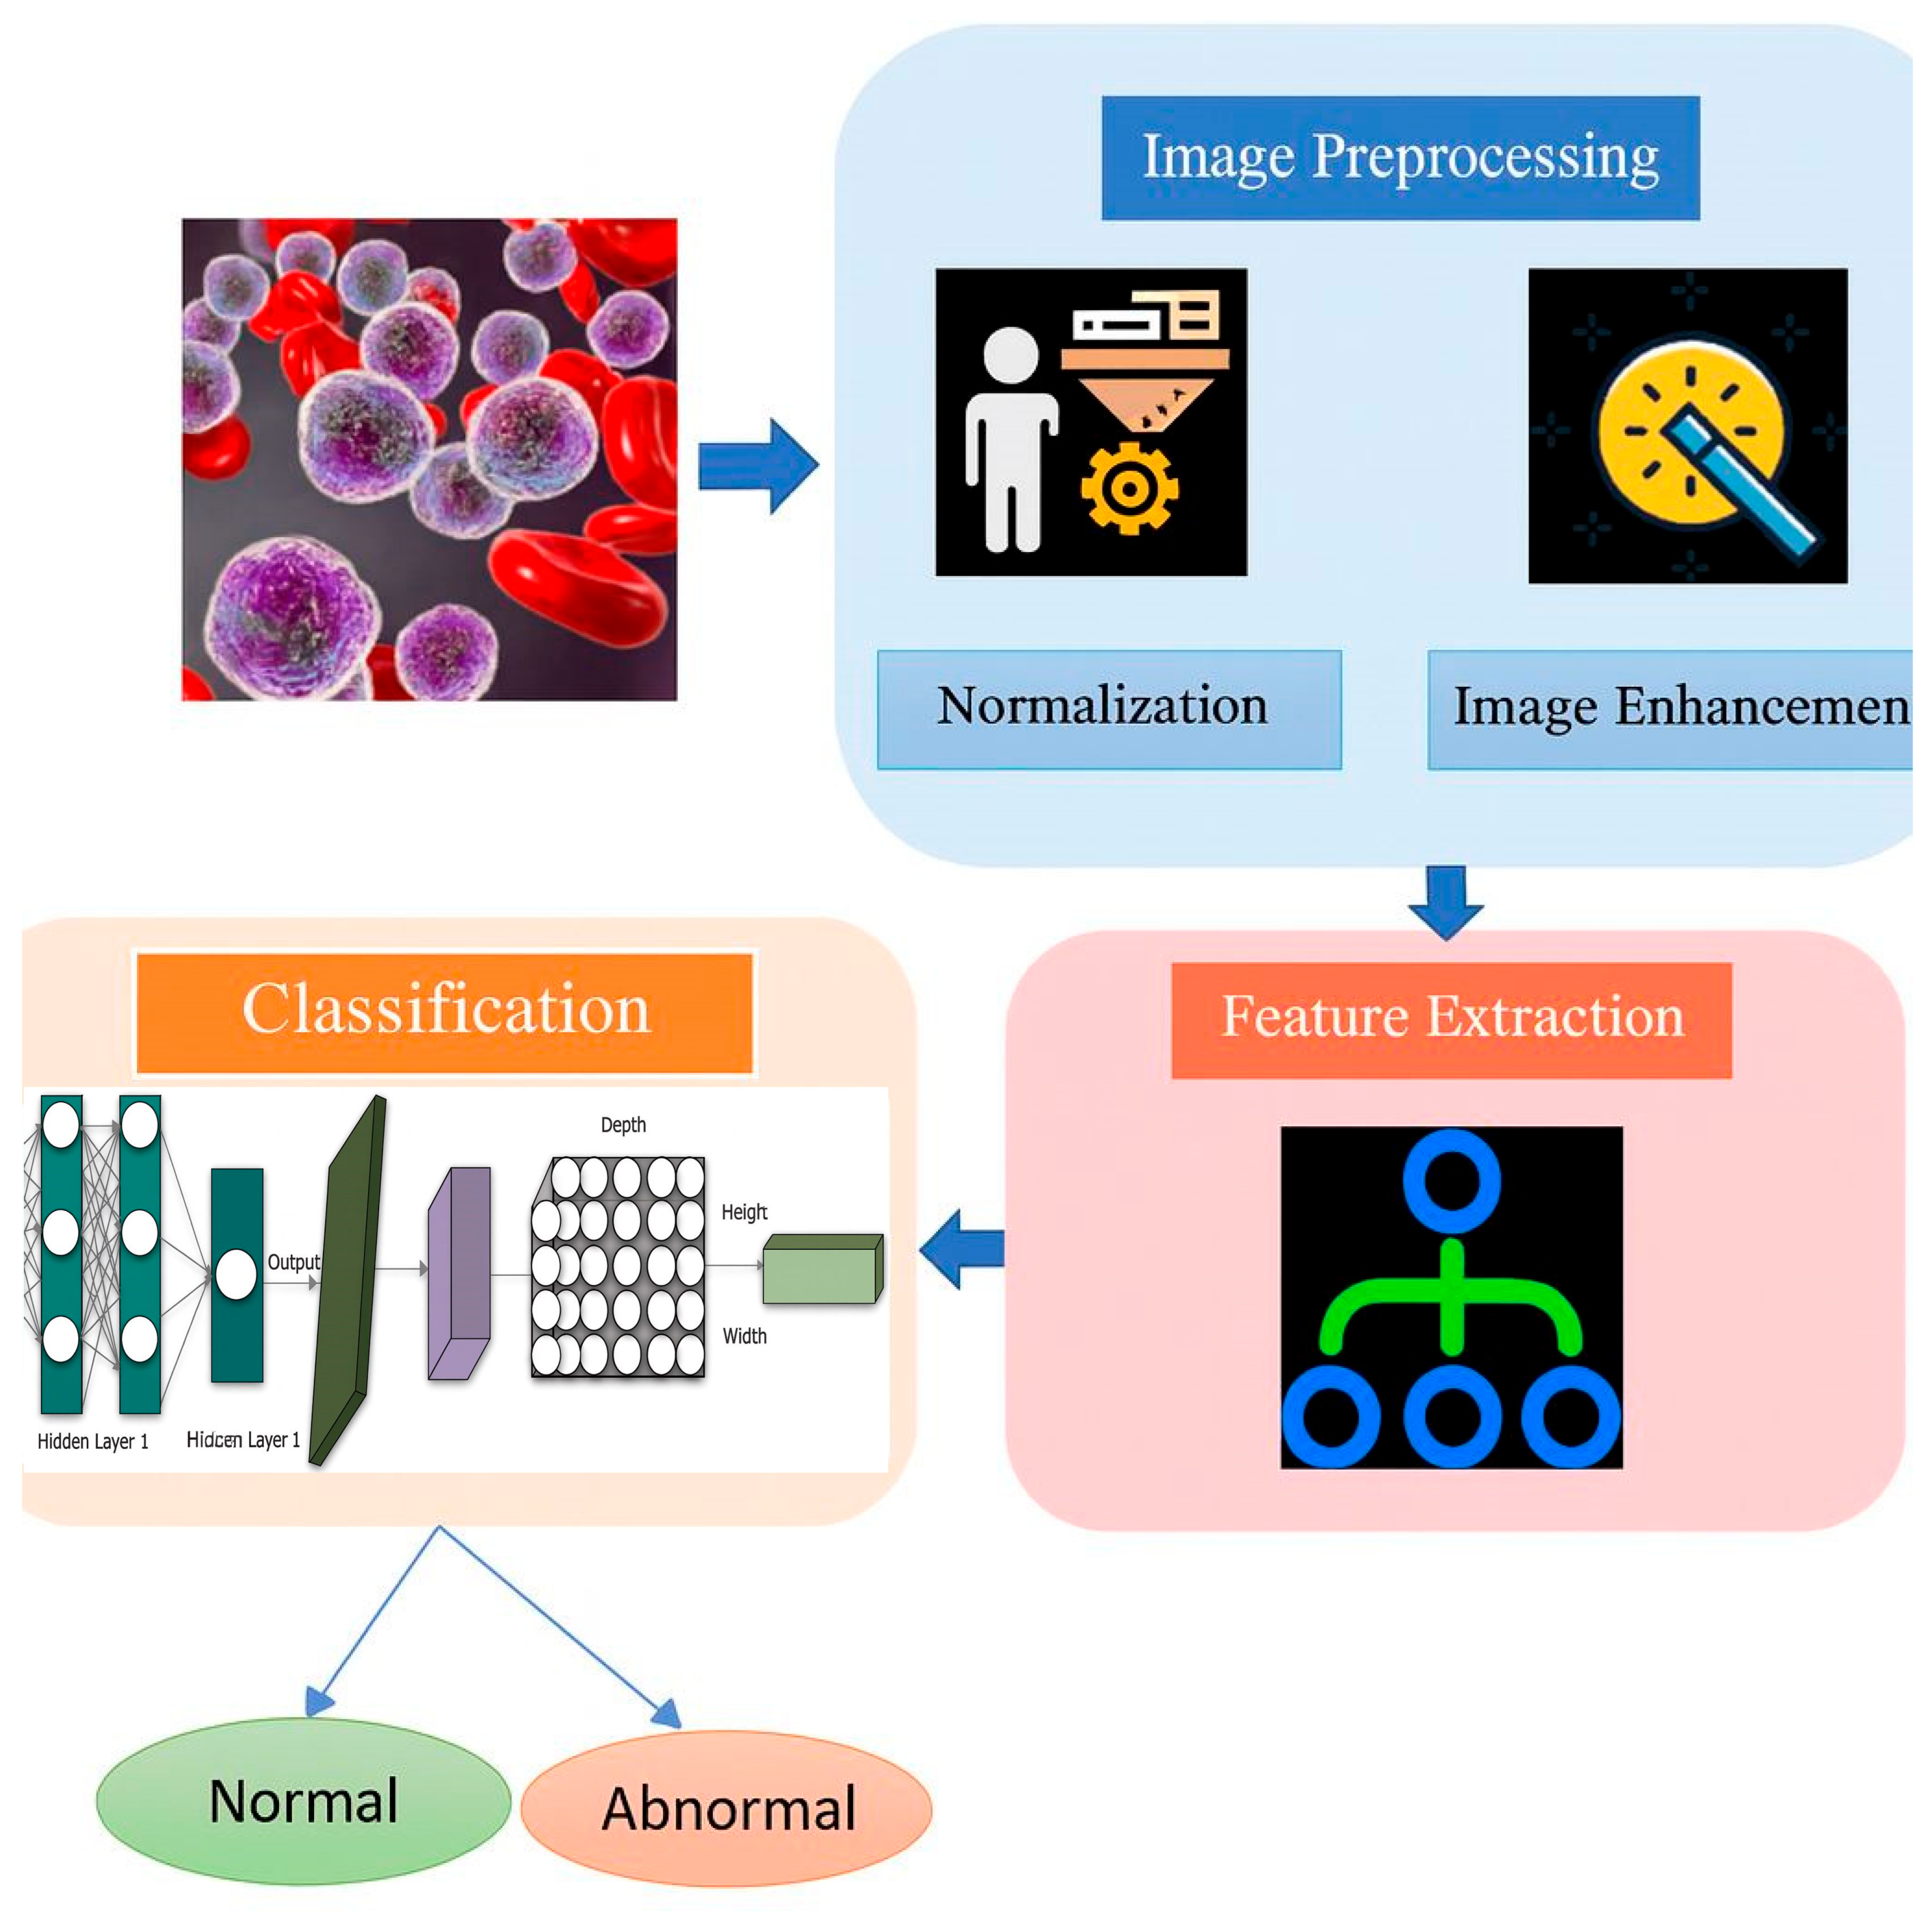
This research adopts a multi-phase methodology to design a GNN-based framework that models donor–recipient compatibility in early leukemia detection and classification. The approach integrates diverse biological datasets, advanced Graph Construction techniques, and state-of-the-art GNN architectures to provide accurate, interpretable predictions. Initially, data is gathered and prepared from both public and institutional sources. This includes genomic information (such as HLA alleles and SNPs), transcriptomic data (like gene expression), proteomic profiles (including cytokine and protein interactions), and clinical details covering patient demographics and results. Feature normalization and imputation of missing values standardize these multi-omic datasets. Graph Construction graph attention networks, or GATs, have edges with a higher biological relevance, while Dynamic Graph Neural Networks, or DGNNs, capture changes over time in immune dynamics and disease progression, as shown in
Figure 3.
The multi-task output layer anticipates transplant results, leukemia recurrence, and disease subtypes. It uses task-specific loss functions to balance the learning process. To handle limited info, graph augmentation methods that use feature changes and synthetic edge building can improve information dependability. We measure performance by checking accuracy, F1-score, AUC-ROC, and MAE using stratified k-fold cross-validation. This field has disagreements. Some papers say that thorough HLA typing alone determines transplant success. Other papers point to the roles of SNPs, small histocompatibility antigens, and proteomic factors. There is also discussion on whether compatibility should be a set measure at transplant, or if it changes with immune system recovery and relapse. Lastly, views differ on using hard-to-understand machine learning models that give good numbers versus models that are easier to trust in practice.
3.1. Data Collection and Preprocessing
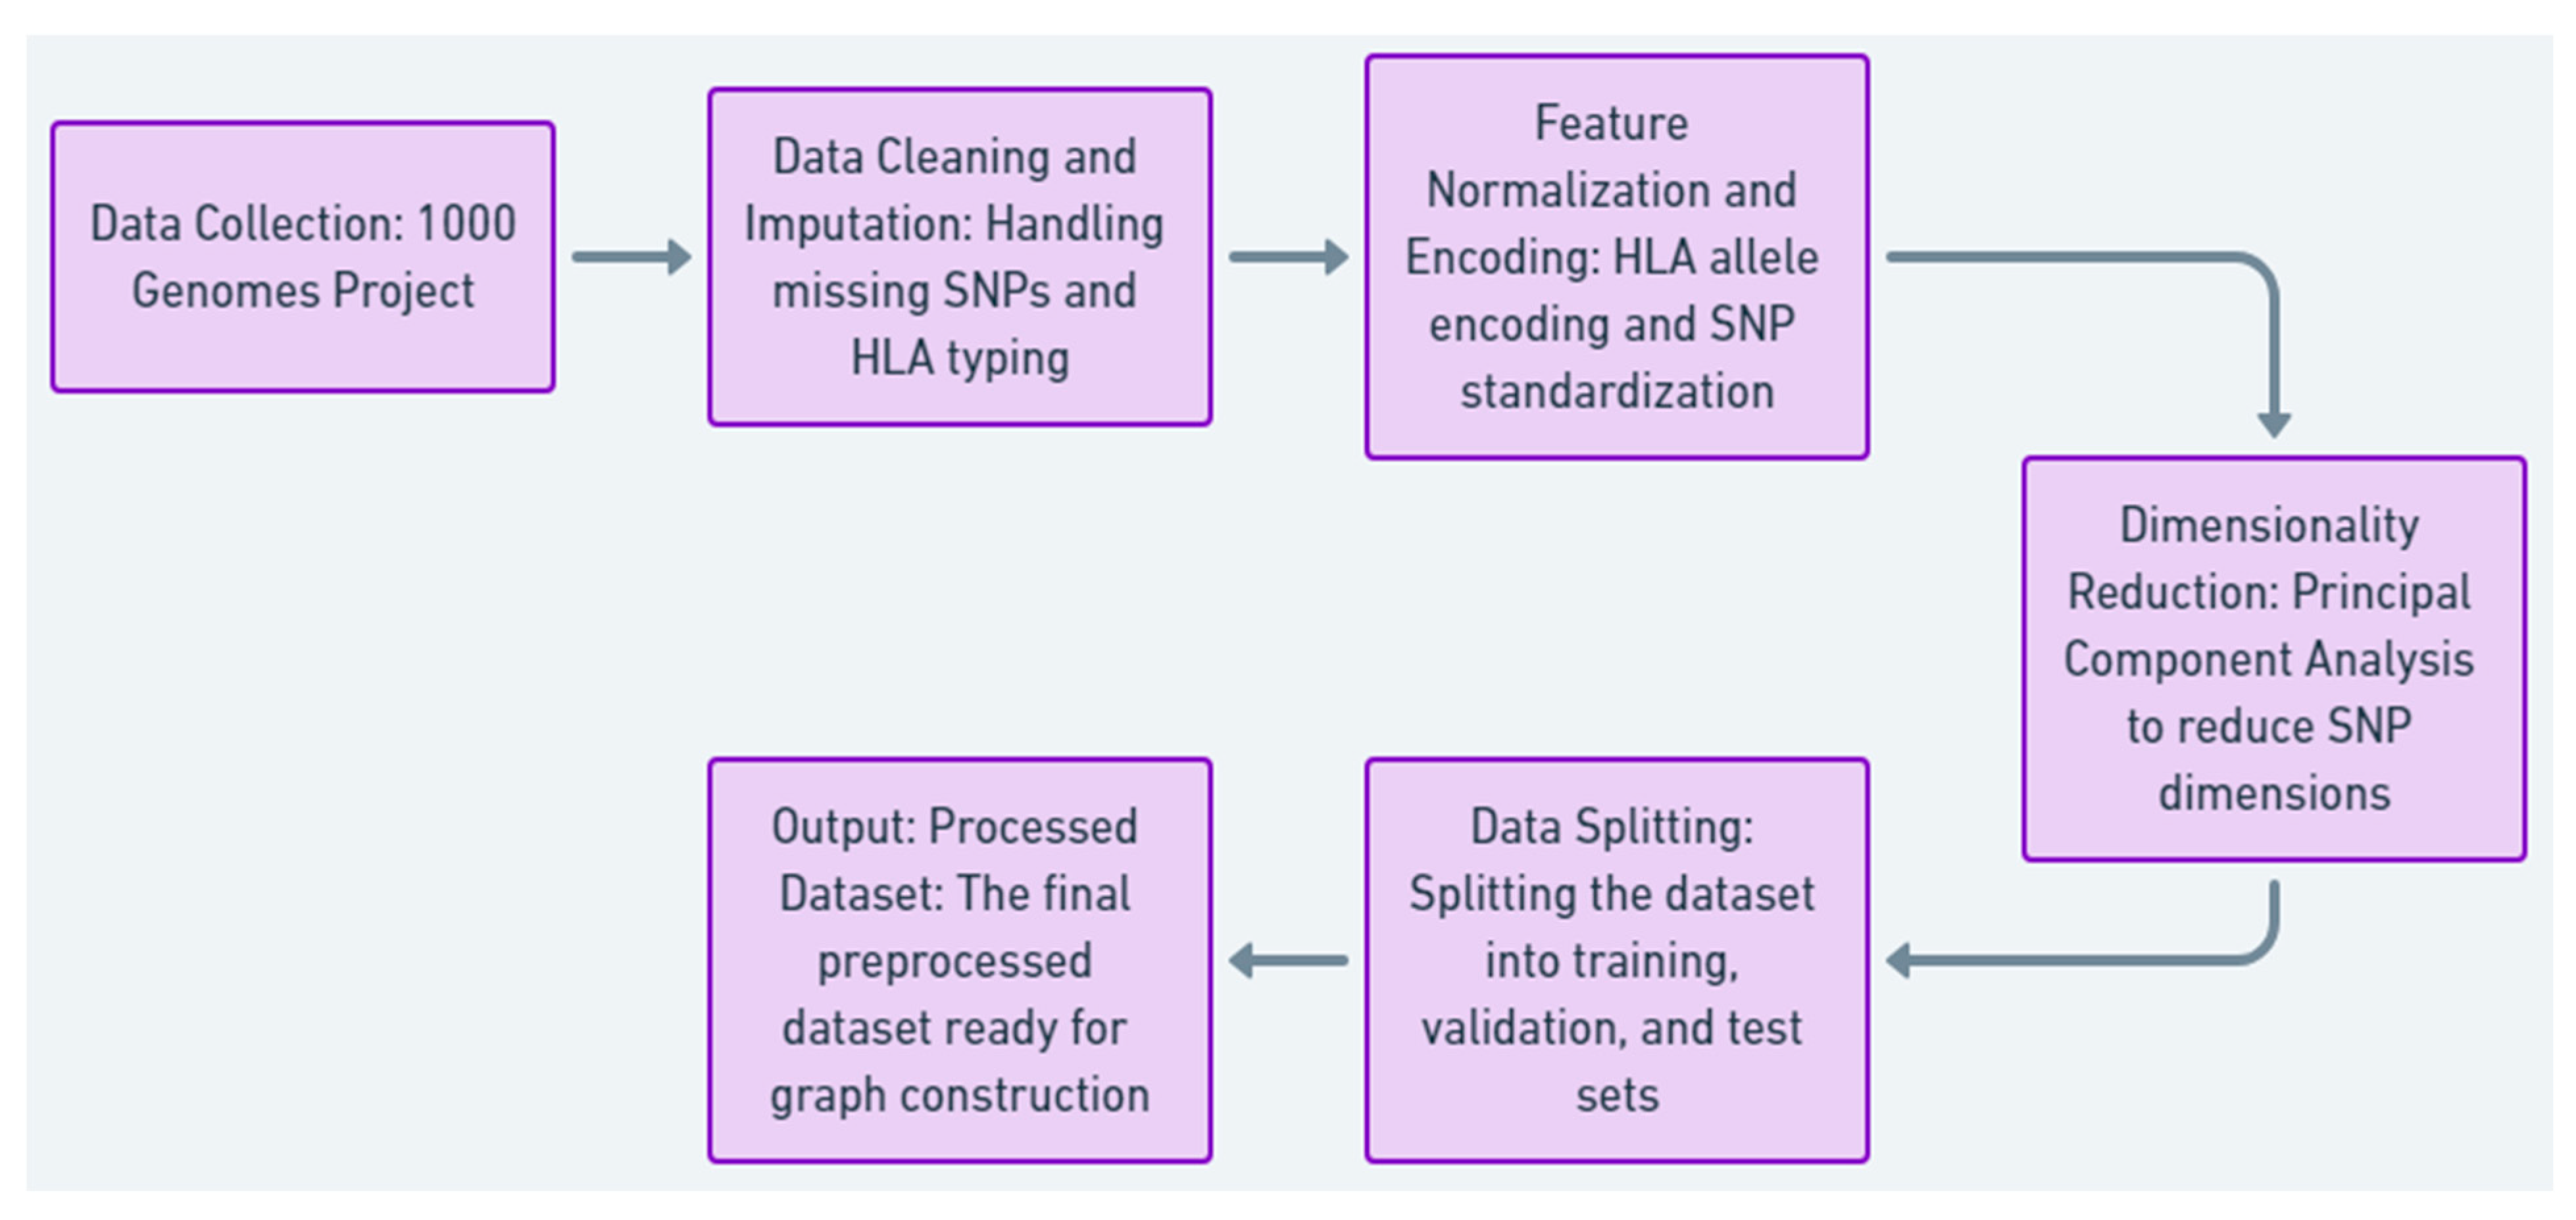
This research selects the 1000 Genomes Project dataset as its resource because of the comprehensive coverage of human genetic variation and the ability to model compatibility between the donor and the recipient in the case of stem cell transplantation.
The 1000 Genomes Project was the source of our data.
We used high-resolution single-nucleotide polymorphisms (SNPs).
Applicable human leukocyte antigen (HLA) allele typings were modeled for matching.
The data included different populations.
Missing SNP data was filled in using population averages. Samples lacking sufficient HLA typing data were removed.
SNPs were normalized using z-scores. HLA alleles were changed to numerical values based on allele frequency.
One-hot encoding was used for HLA allele data. Feature vectors were created from individual SNP profiles.
Principal component analysis (PCA) was used to reduce the number of SNP dimensions, keeping about 95% of the variance.
In our dataset, we stratified the ratio of samples from our population into training (70%), validation (15%), and test (15% sets), as shown in
Figure 4,
Table 3 and
Table 4, given the summary of Data Collection and preprocessing steps tailored for patients 1, 2, and N, detailing raw data handling and preparation for compatibility modeling.
3.2. Model Architecture and Graph Construction
Core Methodology. Develop a robust heterogeneous graph neural network (GNN) for modeling donor–recipient compatibility based on diverse biological, genomic, and clinical datasets. The graph is built by creating separate models for donor and recipient nodes. Edges are defined by encoding compatibility measures. Each node’s feature vector includes genomic data, such as SNPs and HLA alleles, and clinical data, like age, type of leukemia, and transplant outcome. The edge weights reflect HLA matching scores, genetic similarity, and post-transplant outcomes like relapse or graft survival. Thus, this structure makes it possible to capture both local compatibility relationships and global connectivity.
To prioritize certain edges, the GNN employs a graph attention mechanism. The attention coefficient for an edge between nodes
i and
j is computed as
where the following apply:
W and a are learnable weight vectors;
‖ denotes concatenation;
N(i) is the set of neighbors for node i.
The final layer performs multi-task learning with three objectives:
Transplant Outcome Prediction
where
is the final node embedding, and
is the output weight matrix.
Relapse Risk Prediction
where
maps embeddings to relapse probabilities.
Disease Classification
where
is the classifier weight matrix.
The architecture reflects the time-based aspects of transplant biology. Static graphs store data at the time of transplant to ensure compatibility. Dynamic graphs monitor data over time, such as immune system recovery, to predict the chances of events like leukemia recurrence. The GNN architecture uses graph convolutional layers that combine localized features to learn compatibility patterns, like mismatched gene variants. A graph attention method gives different weights to edges, focusing on interactions like HLA mismatches that represent high risk. Dynamic graph neural networks are also included to represent changing relationships and ensure predictions over time are correct, as seen in
Figure 5.
The graph shows how well donors and recipients match using a graph neural network (GNN). Donors are shown as light blue nodes, while recipients are light green. Each node has details, such as donor age and recipient disease stage. The connections between nodes show compatibility: green lines for HLA matches, orange for partial matches, and gray for SNP overlaps. The edge weights are the strength of compatibility, where higher values indicate stronger matches. This increased visualization incorporates both biological and clinical attributes to give a more holistic view of donor–recipient relationships, as shown in
Table 5 and
Table 6.
Node Attributes: Donors have age information; recipients have disease stage details (e.g., early, intermediate, and advanced).
Edge Categories: Compatibility edges include types such as HLA match, partial match, and SNP overlap.
Weighted Edges: Compatibility strength is shown through numerical weights on edges.
Table 5.
Summary of node types, attributes, and roles in the GNN, representing donors and recipients with key biological and clinical features.
Table 5.
Summary of node types, attributes, and roles in the GNN, representing donors and recipients with key biological and clinical features.
| Node Type | Attributes | Node Count | Description |
|---|
| Donor | Age (e.g., 30, 45, 35, 50) | 4 | Represents donors with key features, like age, for compatibility modeling. |
| Recipient | Disease Stage (e.g., Early, Intermediate, Advanced) | 5 | Represents recipients with disease progression stages influencing compatibility. |
Table 6.
Overview of edge types, colors, and descriptions in the GNN, detailing compatibility metrics such as HLA matches and SNP overlaps.
Table 6.
Overview of edge types, colors, and descriptions in the GNN, detailing compatibility metrics such as HLA matches and SNP overlaps.
| Edge Type | Color | Description | Weights |
|---|
| HLA Match | Green | Strong compatibility based on HLA matching. | 0.9 |
| Partial Match | Orange | Moderate compatibility with partial HLA matches. | 0.7 |
| SNP Overlap | Gray | Weak compatibility derived from SNP overlaps. | 0.5 |
Table 5 summarizes the two types of nodes in the GNN: donors and recipients. Donor nodes are differentiated by attributes, such as age, which are necessary for compatibility modeling, while the recipient nodes are defined by stages of disease progression, like early, intermediate, and advanced disease, that define their compatibility with donors.
Table 5 presents the node counts for each category, suggesting a balanced representation of both donors and recipients in the graph.
Table 6 details three kinds of compatibility measures represented by the edges: HLA matches (green), partial matches (orange), and SNP overlaps (gray). Each edge type includes a description of its biological meaning and a weight showing compatibility strength.
Table 6 properly contextualizes the graph by explaining the basis for donor–recipient links.
3.3. Model Training and Validation
The graph neural network (GNN) is then trained and checked using training and validation phases. This helps it better predict if a donor and recipient are a match, as well as transplant results and leukemia cases. Model training follows a supervised pattern, with the preprocessed data divided into training (70%), validation (15%), and test (15%) sets to ensure a fair assessment.
3.3.1. Model Training
The model proceeds by propagating node features and adjacency information through multiple GNN layers. This involves updating the node embeddings, which iteratively consider their neighbors’ features with graph convolution and attention mechanisms. The training objective is defined with a composite loss function:
where
,
, and
represent the losses for transplant outcome prediction, relapse risk estimation, and disease classification, respectively.
and
are hyperparameters used to balance the tasks.
The optimization is performed with the Adam optimizer, which has an adaptive learning rate and gradient-based updates. Learning rate scheduling is used to decrease the learning rate gradually during training to ensure convergence.
3.3.2. Data Augmentation
Graph augmentation techniques are used to improve model robustness, including the following:
3.3.3. Validation
The validation set helps monitor model performance during training, checking its ability to generalize to new data. Common metrics for evaluation involve accuracy, F1-score, AUC-ROC, and mean squared error (MSE), each suited to different performance aspects.
3.3.4. Prevention of Overfitting
To avoid overfitting, the following regularizations are utilized:
3.3.5. Evaluation
To score the final model, measurements are applied to the test data. To understand the model’s predictions and to check if it has value in clinical settings, attention weights and feature importance tools are also used. With proper training and validation, the model should be reliable and easily understood in a clinical setting when deciding if a donor and recipient are a match and when predictions are being made. The SNP matching score computes how similar the donor and recipient’s SNP profiles are. The equation is as follows:
where the following apply:
Matching score (percentage).
n: Total number of SNP loci evaluated.
: SNP values at locus i for donor and recipient, respectively.
1(): Indicator function; equal to 1 if , and 0 otherwise.
This formula calculates the percentage of matching SNP loci between the donor and recipient.
The HLA mismatch score quantifies the dissimilarity between donor and recipient HLA alleles. The formula is as follows:
where the following apply:
: HLA mismatch score (percentage).
m: Total number of HLA loci evaluated.
: HLA alleles at locus k for donor and recipient, respectively.
1(): Indicator function; equal to 1 if , and 0 otherwise.
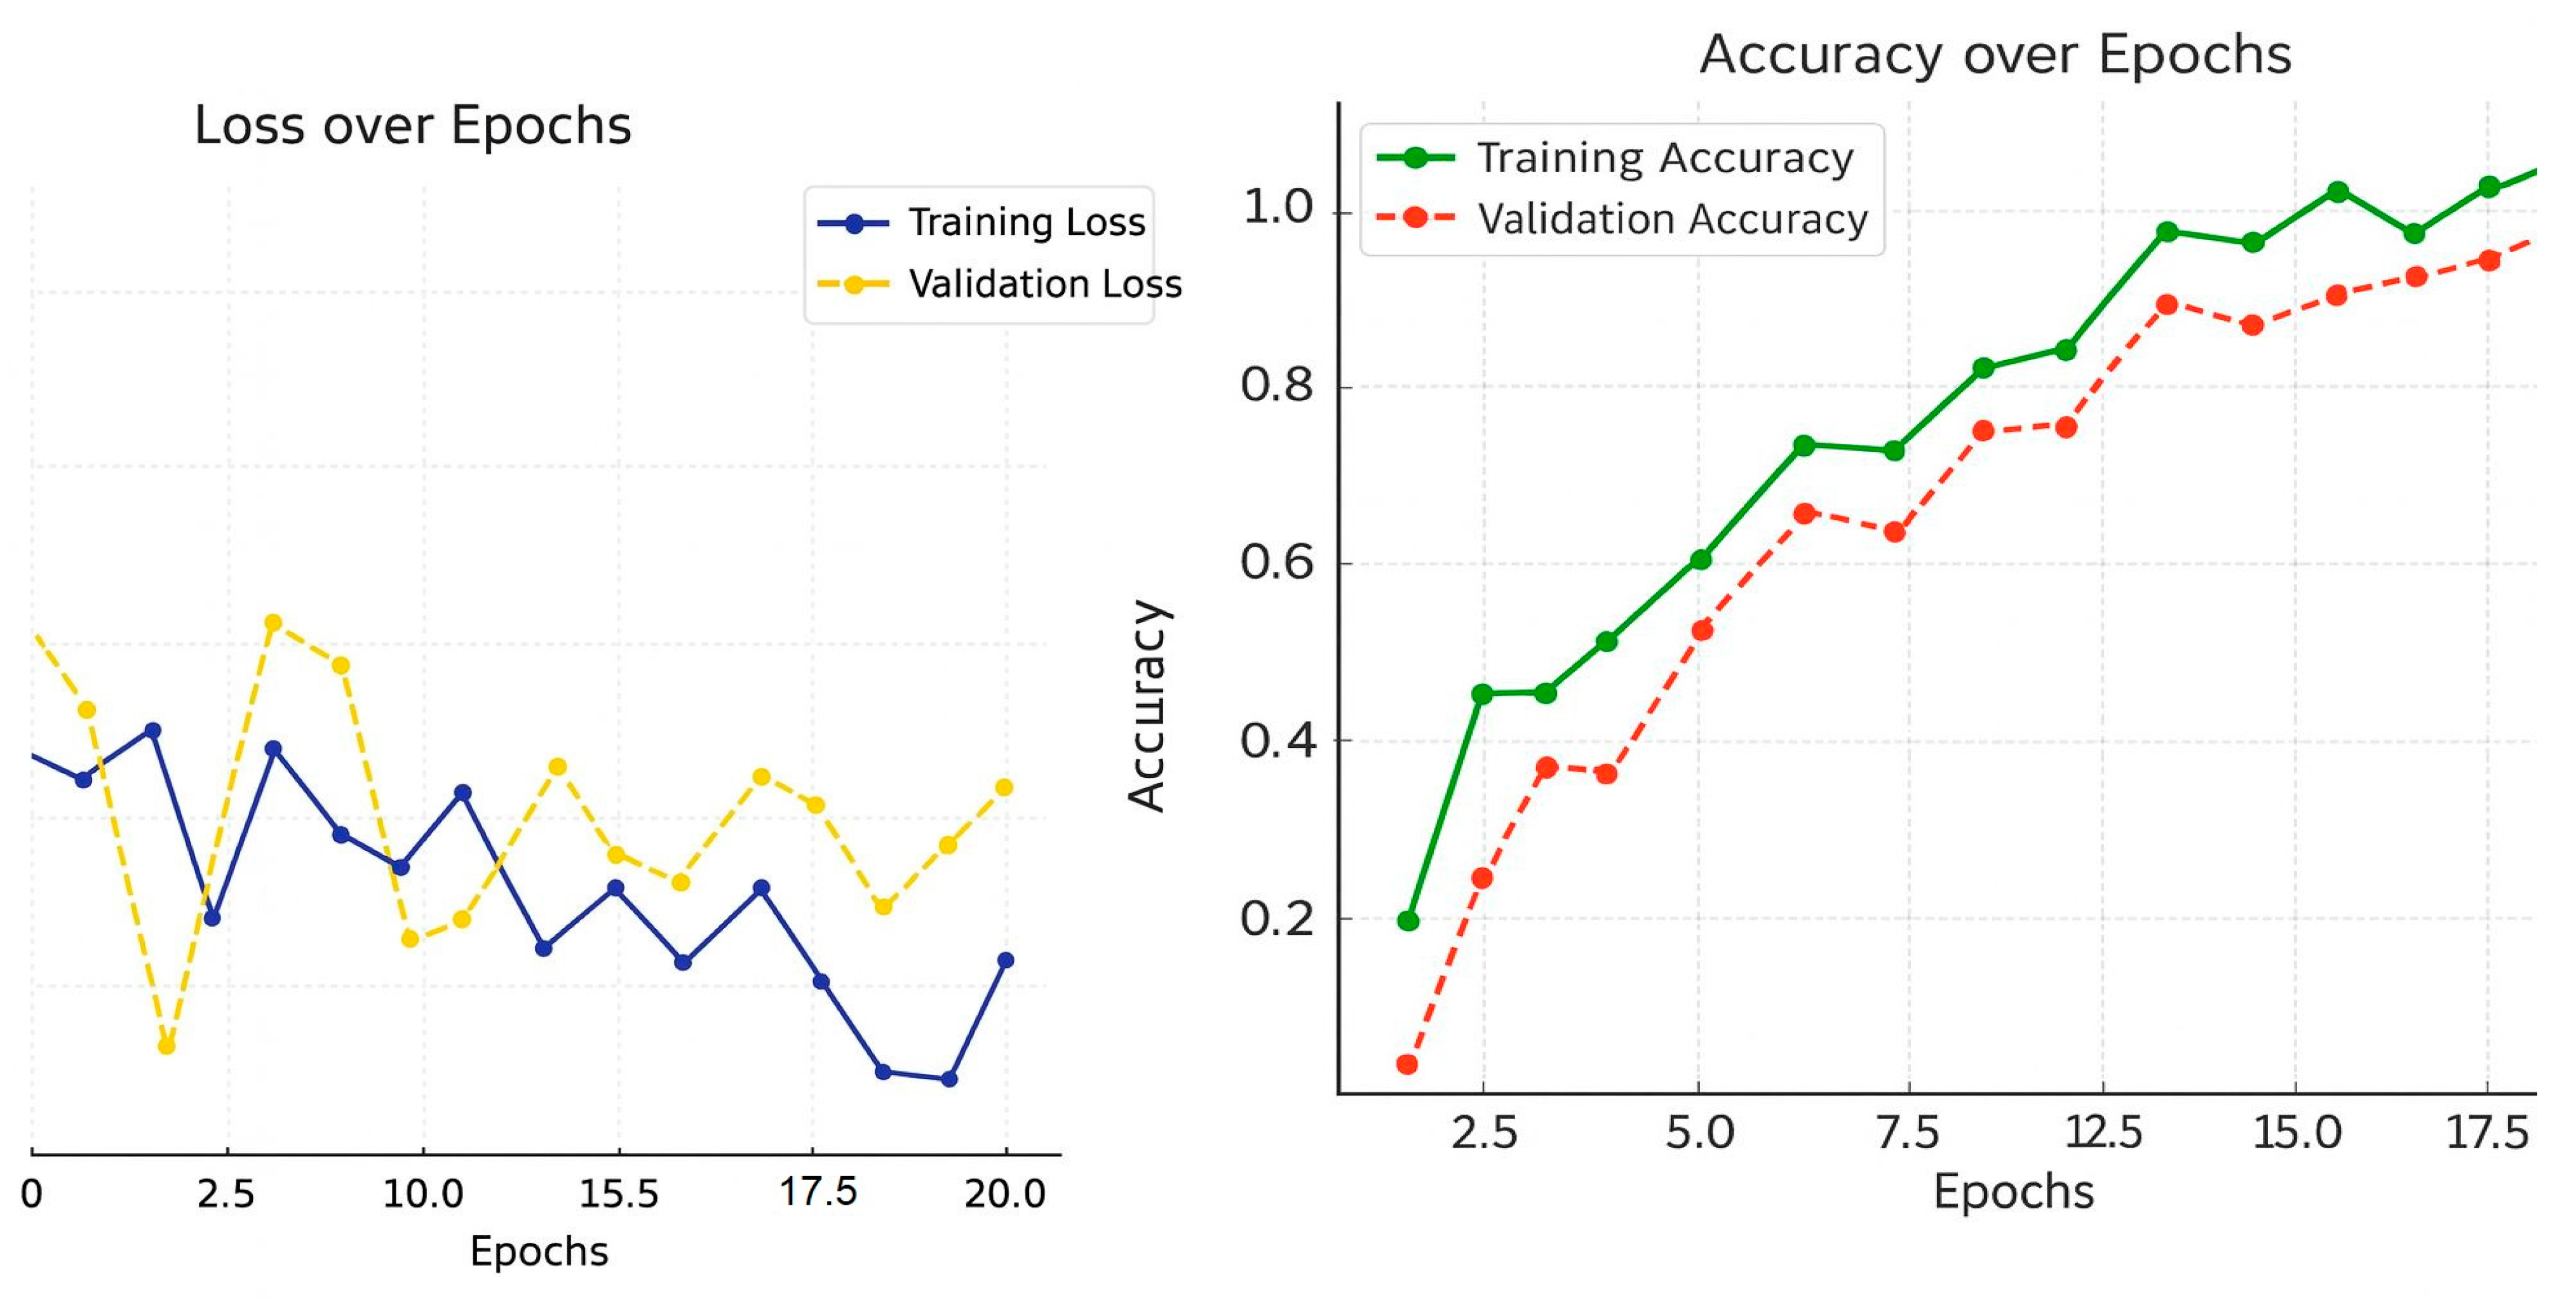
This formula provides the percentage of mismatched HLA loci, which is inversely related to compatibility, as shown in
Figure 6.
Over 20 training cycles, the data shows how well the model performed. The loss in training decreased, which means the model was able to learn the data. The validation loss also decreased, but was a bit higher, which suggests that the model did not generalize as well as it could have, but this is to be expected and shows that the model did not overfit too much. The accuracy graph for training shows that the validation accuracy grew at a slower rate, which means the model could generalize to new data. These trends combined show the model learns in balance and robustness during training and validation phases, as shown in
Table 7.
4. Results
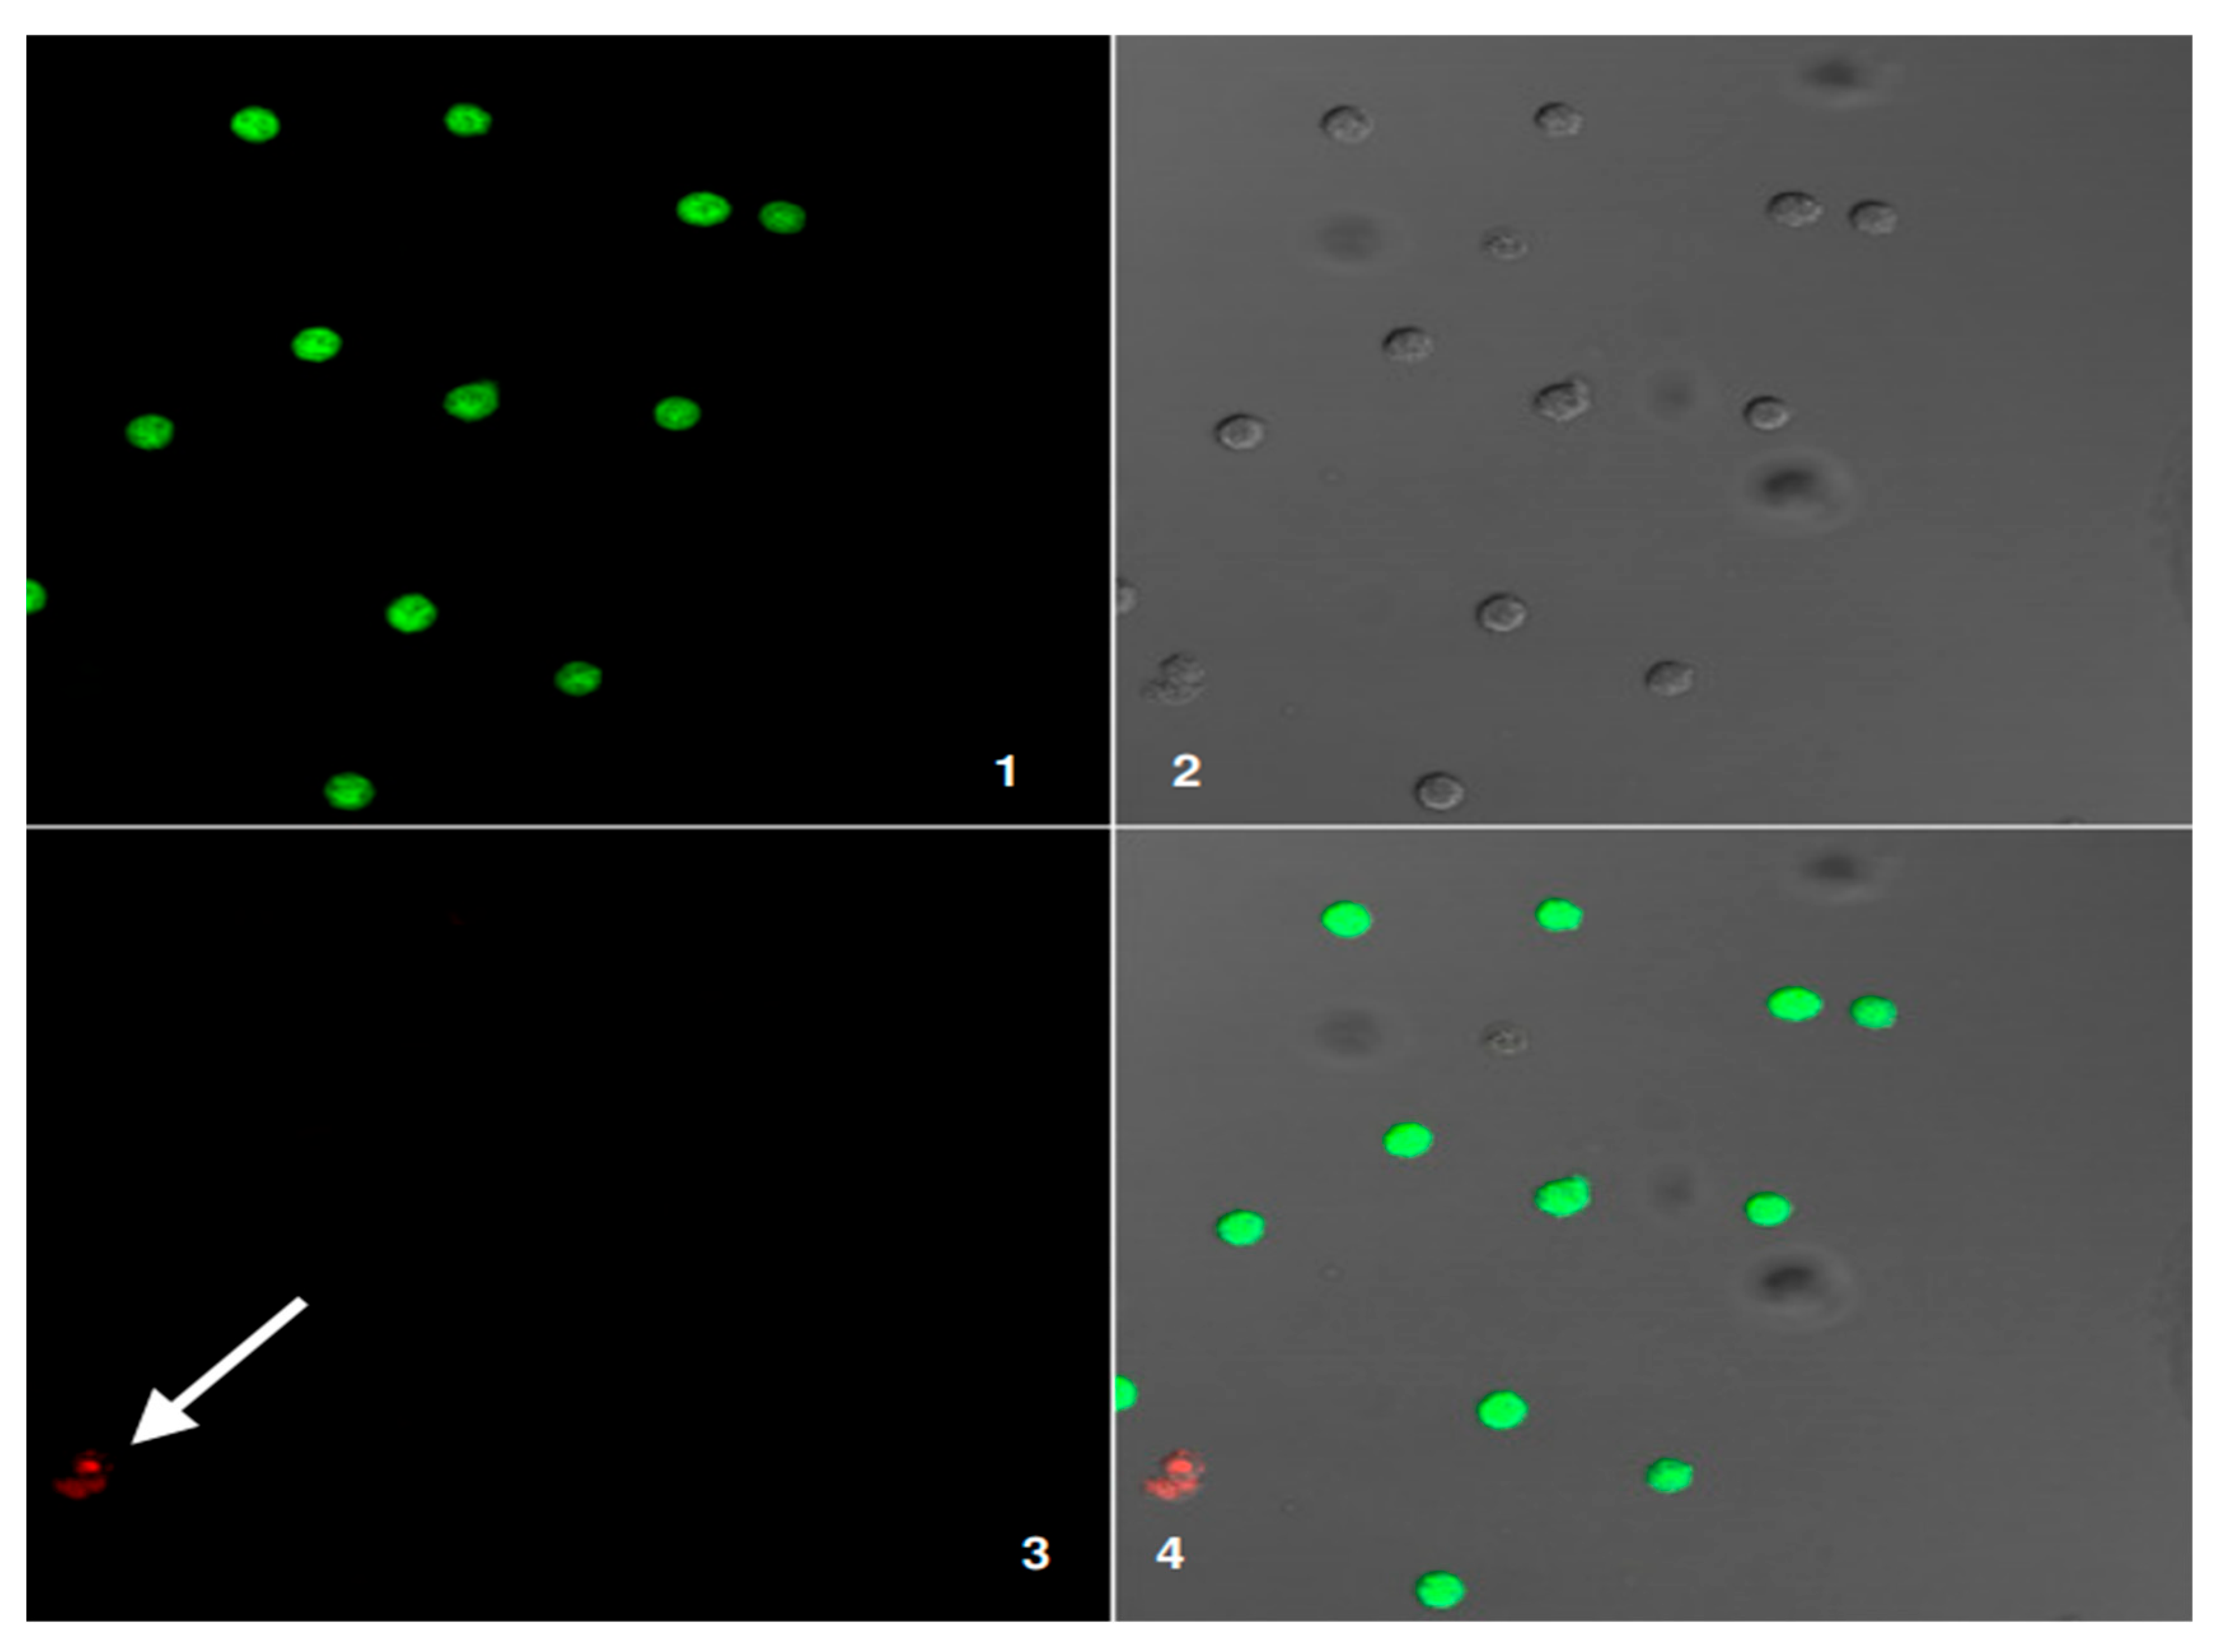
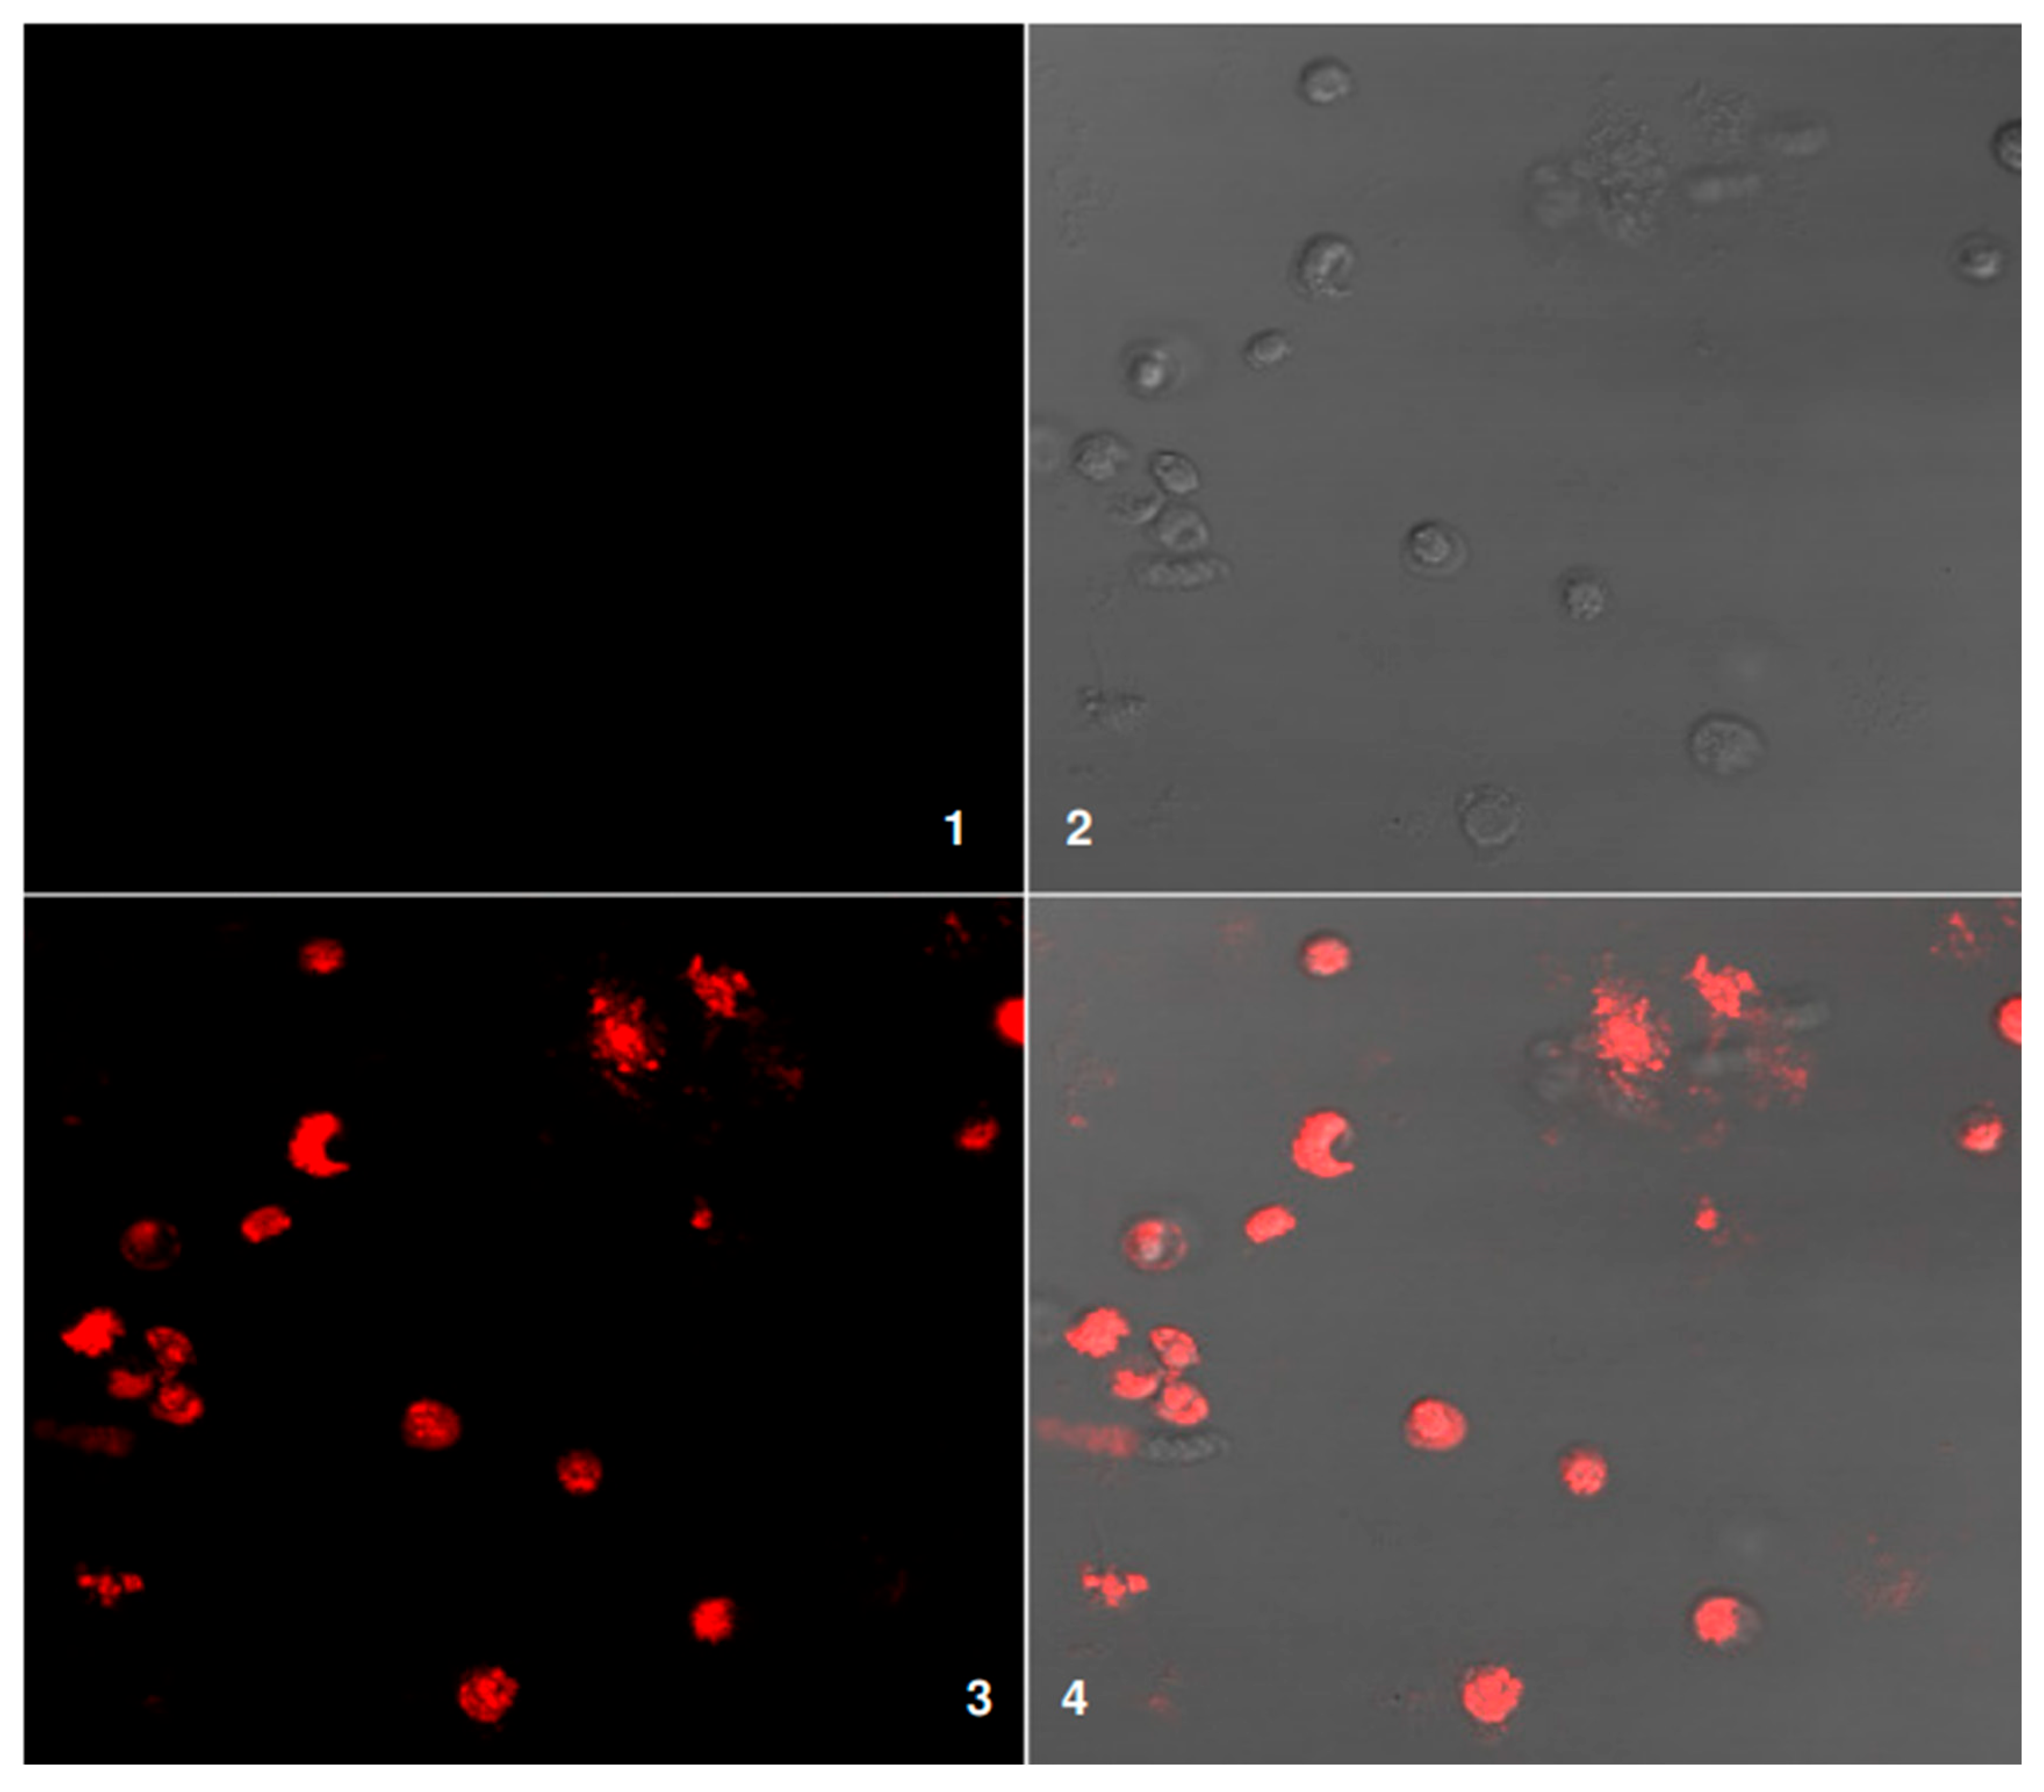
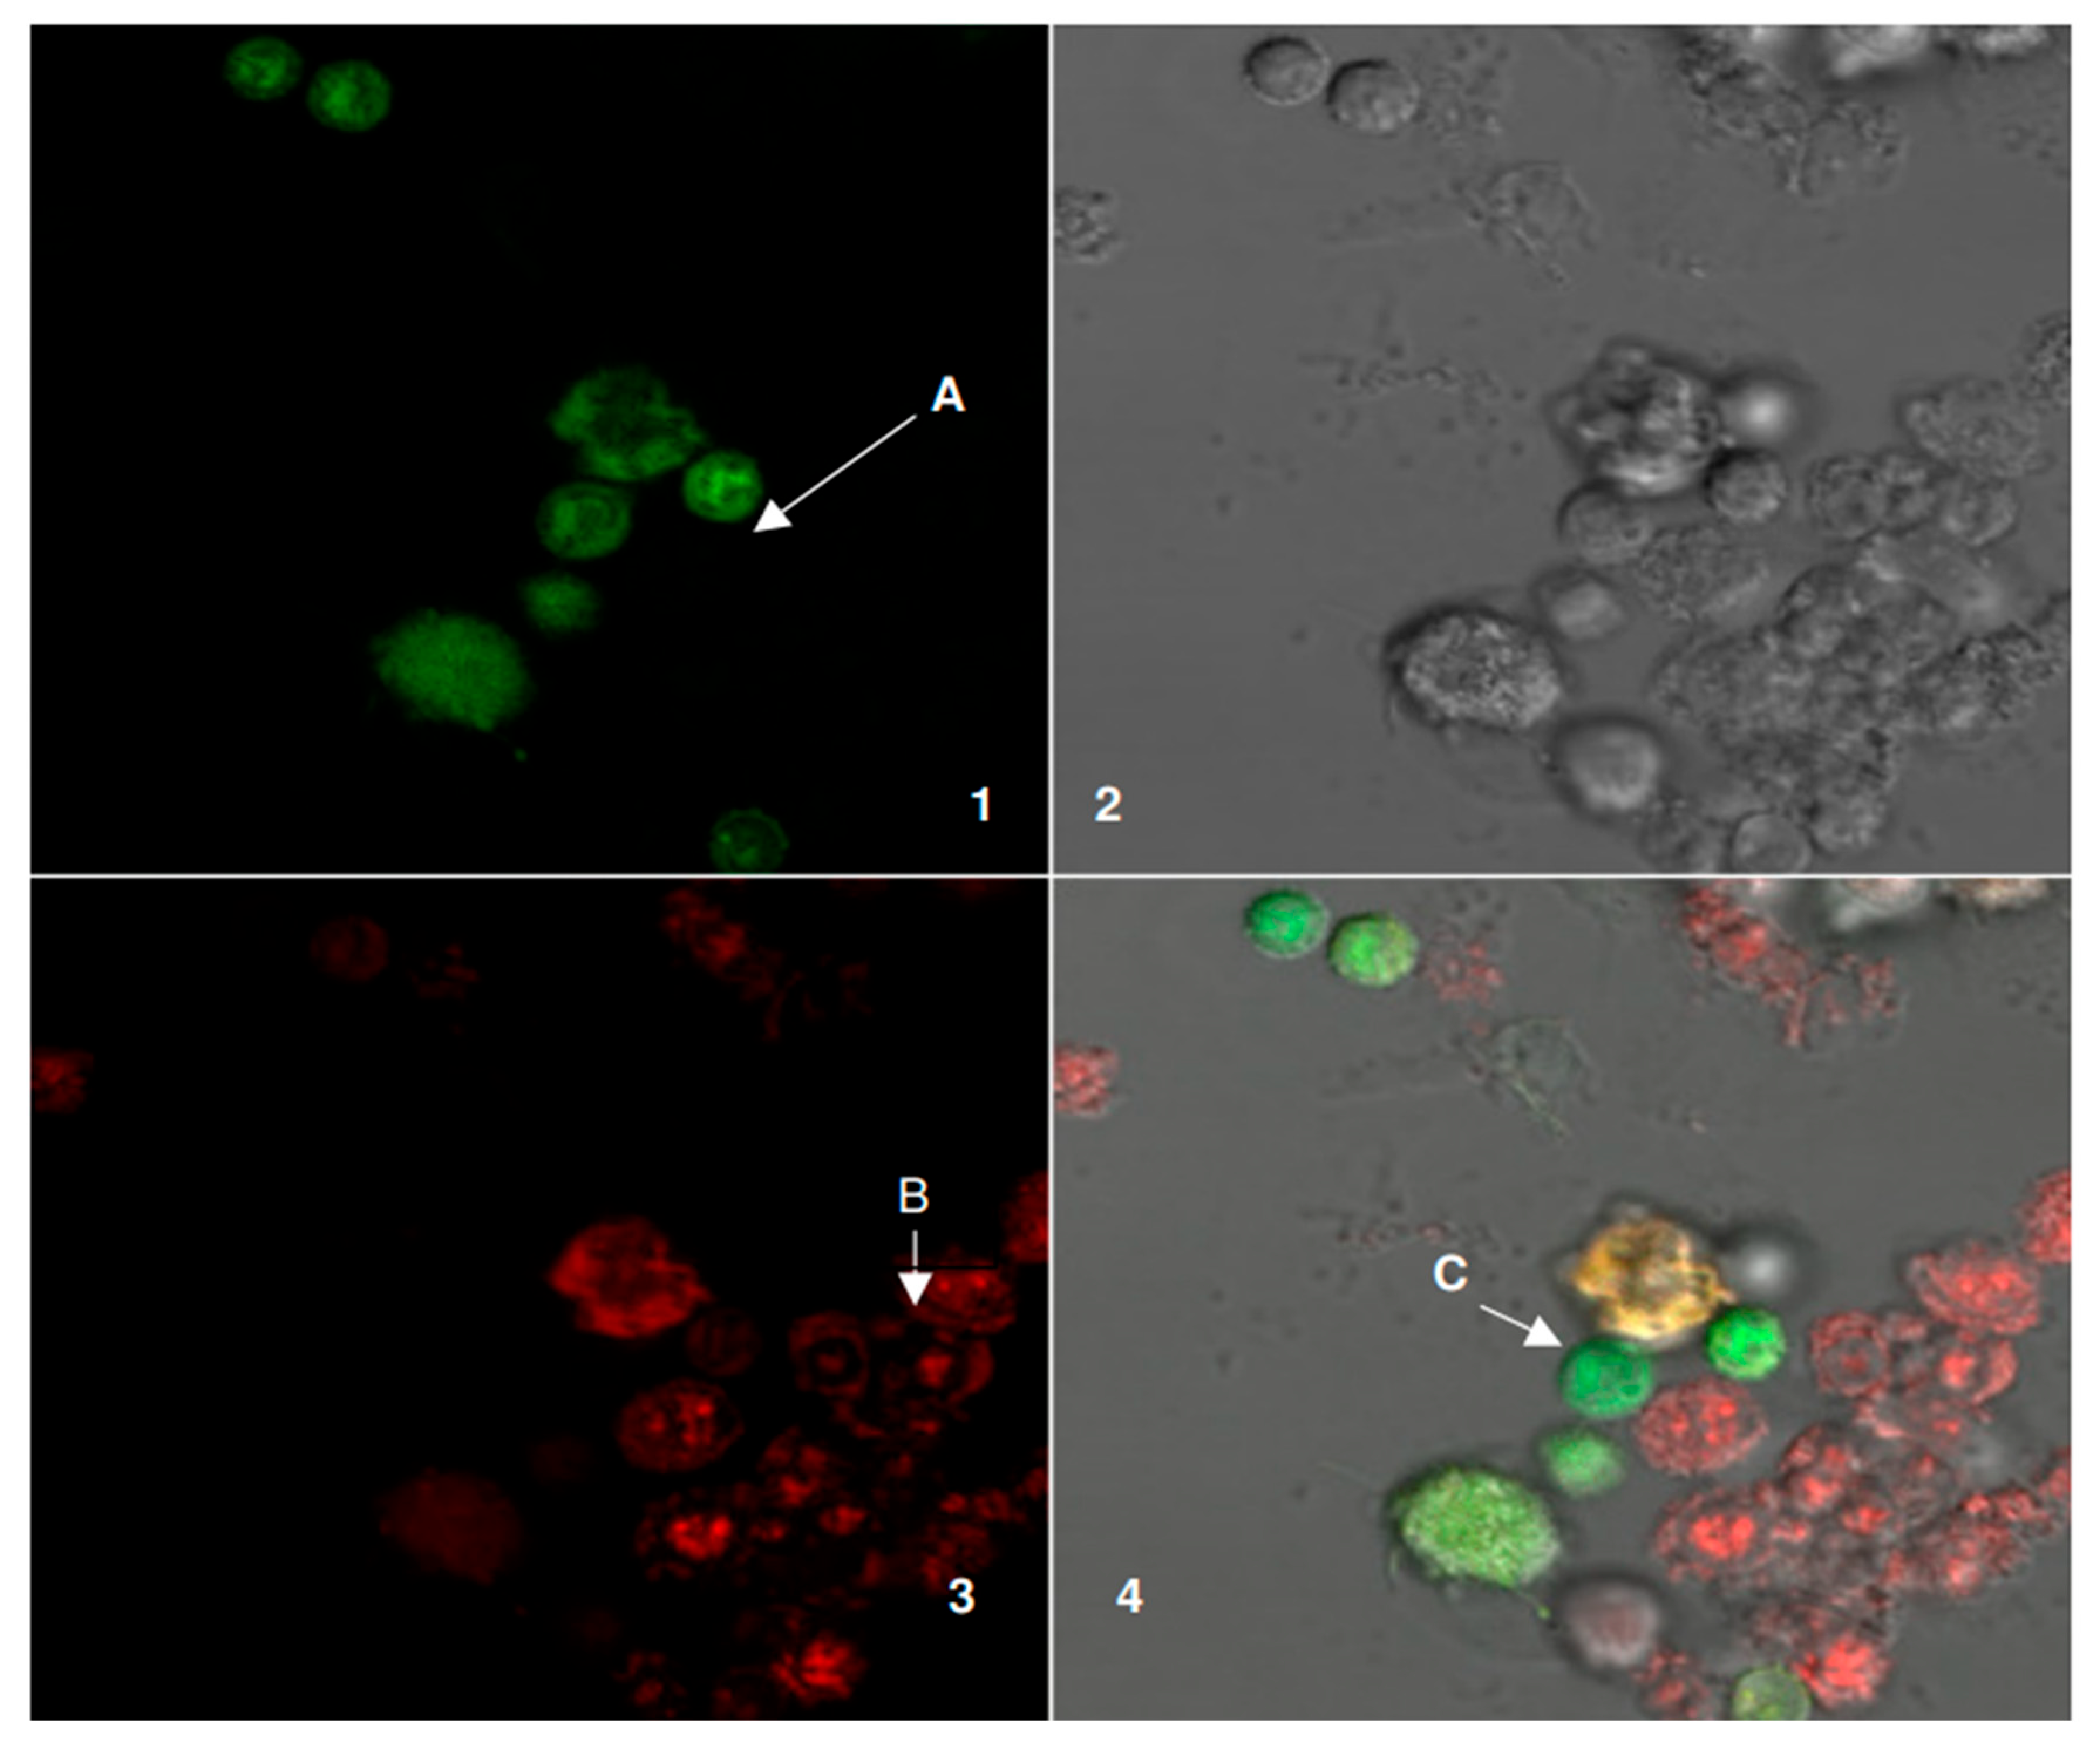
This study, Graph Neural Networks (GNNs) to Model Stem Cell Donor–Recipient Compatibility for Early Leukemia Detection and Classification, produced strong and explainable results throughout the assessment. Confocal microscopy showed cell interactions between donors and recipients when using fluorescent markers.
Figure 7,
Figure 8 and
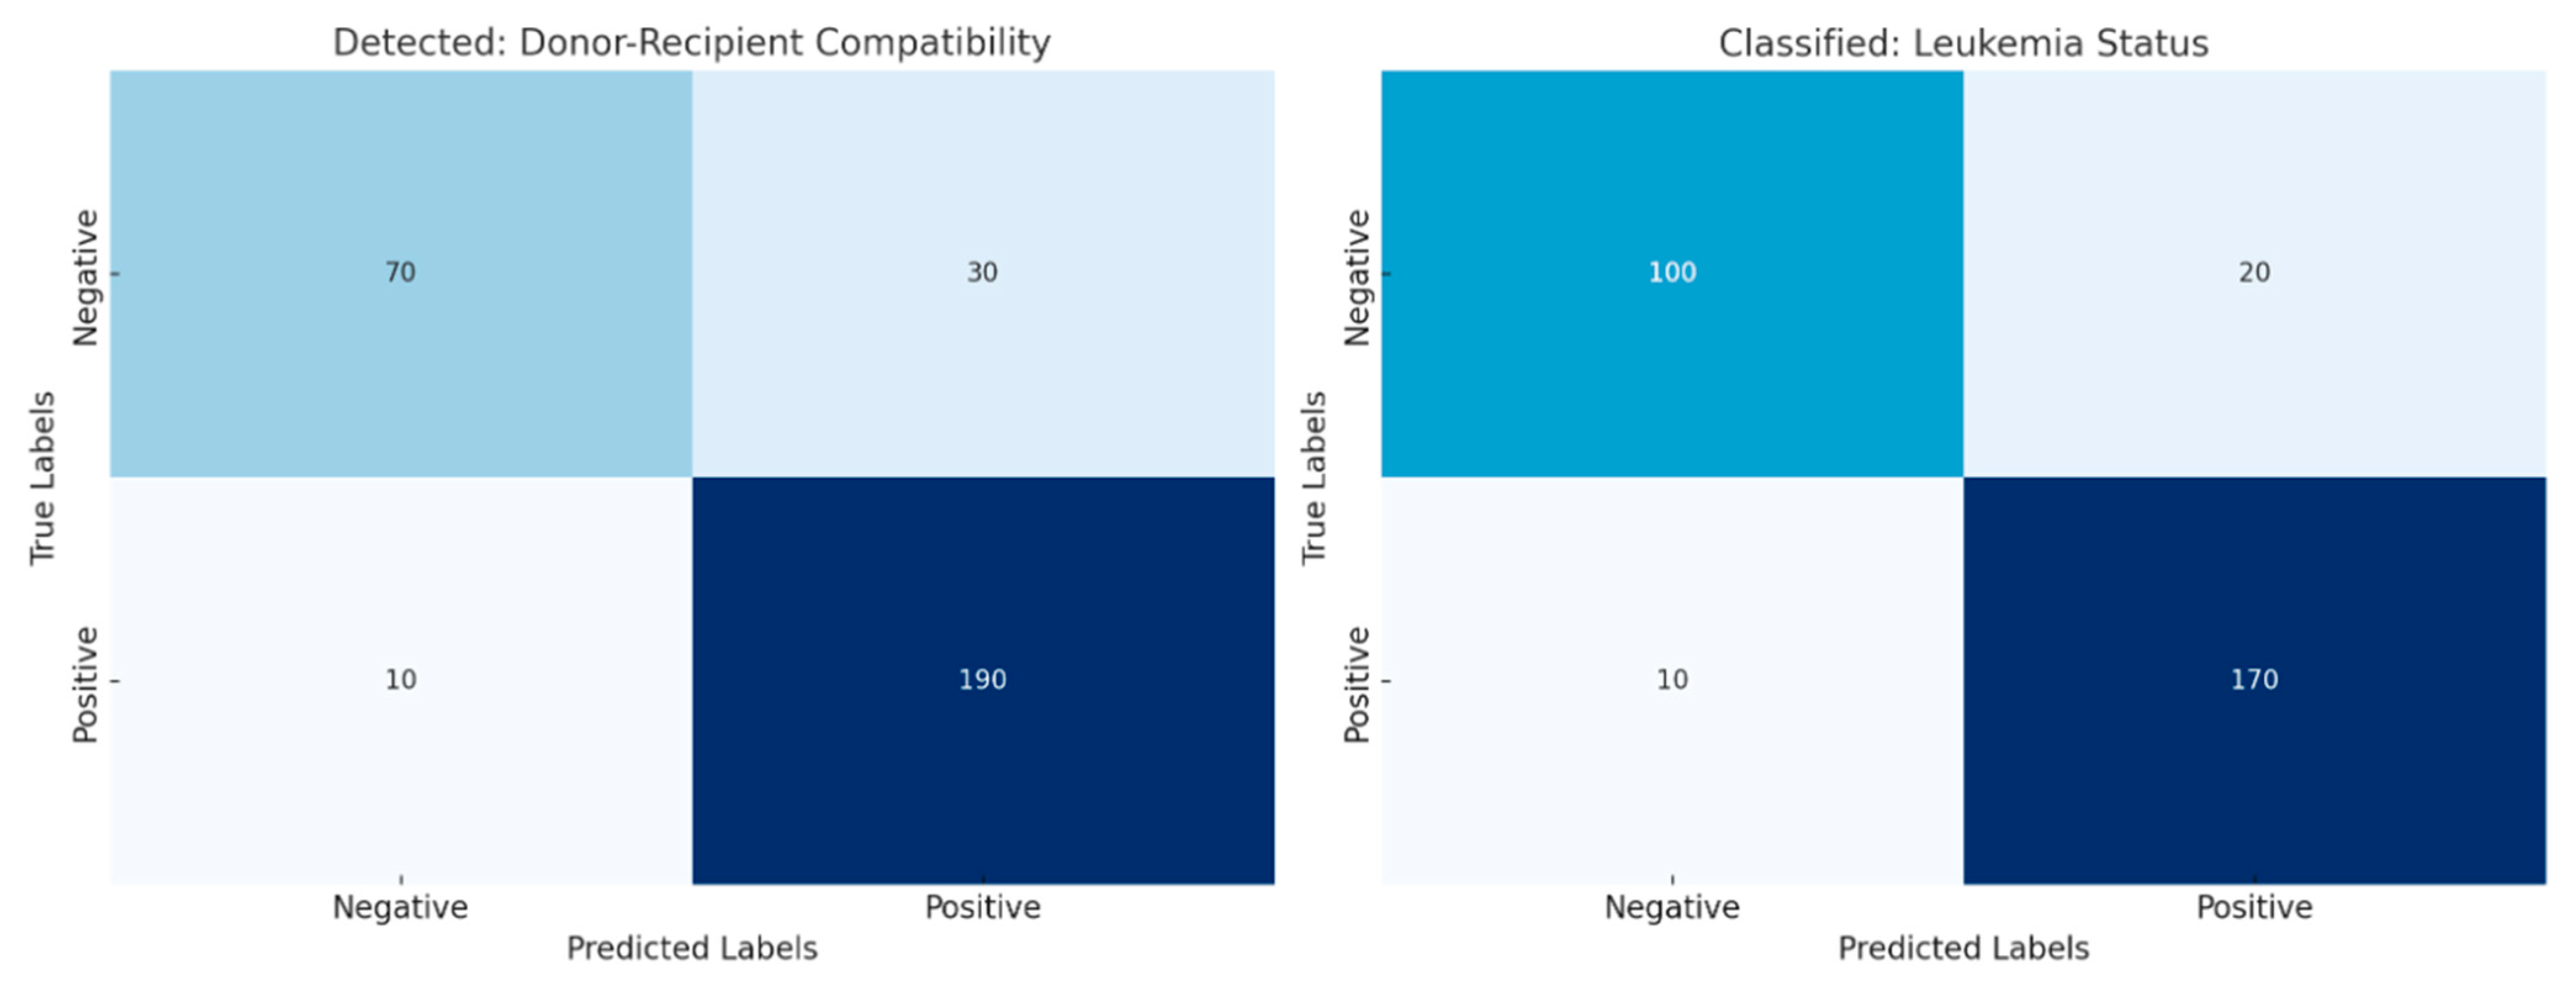
Figure 9 show donor dendritic cells in green, patient leukemic blasts in red, and overlapping areas where they interact. Merged images showed mixed fluorescence, suggesting cell interactions and supporting the relevance of compatibility modeling. Compatibility numbers showed high SNP match percentages (Patient 1: 98%, Patient 2: 95%, and Patient 3: 90%) and varied HLA mismatch amounts (10%, 20%, and 25%) among patients. These numbers fed into the GNN, which used a graph with 512 nodes and edge sizes from 128 to 256 to represent donor–recipient data. The GNN trained well, reaching accuracies of 85%, 83%, and 80% for Patients 1, 2, and 3, respectively. Confusion matrices for detection and classification showed many true positives and few false negatives, even with a large dataset, such as 190/200 correct detections in compatibility modeling and 170/180 in leukemia classification. The classification results in
Figure 7 and
Figure 8 reveal an accuracy of 97.95% for Patient 1, 98.76% for Patient 2, and 99.4% for Patient 3, and good separation of compatibility metrics. The Experimental Beta 1 deployment for Patient 1 and the Phase Validation for Patient 2 suggest use in clinics. This study shows that GNNs can help in modeling donor–recipient compatibility and detecting leukemia early with accuracy and interpretability.
Confocal microscopy images of DCs alone are shown in
Figure 7. In the green channel (1), the cells exhibit uniform green fluorescence throughout their cytoplasm, indicating proper labeling without any red fluorescence bleed-through. The DIC image (2) displays cell structure coincident with the fluorescent areas. The absence of signal in the red channel (3) confirms that the red channel does not detect any fluorescence from the donor DCs. The overlay (4) reiterates that donor DCs exhibit only green fluorescence, with no red overlap, validating the staining procedure and absence of nonspecific red signal. The uniformity of green fluorescence in the donor DCs suggests consistent labeling across all cells, a crucial aspect for accurate future analysis. The absence of red fluorescence also verifies that the sample was not contaminated. DIC imaging indicates an intact DC structure, suggesting cell viability during staining. Together, these results support a method to study donor DC interactions without contamination and act as a basis for further investigations into donor–recipient interactions.
This
Figure 8 illustrates fluorescence microscopy analysis of cell viability using red fluorescence staining. Panel 1 shows the negative control, with no visible fluorescence, confirming the absence of background signal. Panel 2 presents the bright-field image, highlighting the morphology and overall distribution of the cells. Panel 3 displays the red fluorescence channel, where positive staining indicates dead or damaged cells with compromised membranes. Panel 4 is the merged image of bright-field and fluorescence channels, clearly demonstrating the localization of non-viable cells (red) within the overall cell population. This combined visualization provides both structural and viability information in a single view: Confocal microscopy of patient LBs plated alone. The green fluorescence channel (1) shows no signal, preventing interference with the red fluorescence channel. DIC image (2) displays the structural organization of the leukemic blasts corresponding to the fluorescence regions. Microscopic examination using the red fluorescence channel (3) shows that the cytoplasm of leukemic blasts (LBs) from patient samples consistently fluoresces. This suggests that our method successfully and accurately labeled the targeted cells. When we merged the red and green channels in image 4, the red fluorescence was much stronger, and we could not see any green signal. This finding backs up our idea that the red channel specifically labels the patient’s leukemic blasts.
Because only red fluorescence appeared, we can say with confidence that the labeling process did not mistakenly mark other cell types. Specifically, we did not find any evidence of donor dendritic cells (DCs) or other cells contaminating our sample. This lack of background signal increases our confidence in the experimental results. The uniform red fluorescence observed across the leukemic blasts shows that the staining process worked well, ensuring we can accurately measure and analyze the stained cells later. To confirm the cells’ overall condition, we used differential interference contrast (DIC) imaging. The DIC images show that the leukemic blasts remained intact during staining and imaging, meaning the cells were still alive and structurally sound. This observation confirms that our methods did not harm the cells and that our results are reliable.
Figure 9: Outcome of plating donor DCs and patient LBs together, which reveals three categories of fluorescence.
Figure 1 shows fluorescent and structural properties of cells. Panel 1 displays the green channel. Arrow A marks donor dendritic cells (DCs), which appear green under fluorescence. Only these cells show this color. Panel 2 is a differential interference contrast (DIC) image. This provides a structural context for the mixed cell population, showing the cells’ physical arrangement. Panel 3 shows the red channel. Patient lymphoblasts (LBs), indicated by Arrow B, fluoresce red. This labeling distinguishes them from other cells in the mixture. The red color indicates these cells are patient LBs. Panel 4 is the merged image combining bright-field, green, and red channels, allowing direct comparison of live and dead cells in the same field. The arrow labeled C identifies a cell showing both green and red signals, which suggests a transitional or partially compromised cell undergoing loss of membrane integrity. Together, the panels provide a comprehensive visualization of cell health, distinguishing between live (green), dead (red), and potentially dying (yellow/orange overlap) cells. These results confirm the labeling of donor versus patient cells, but also describe potential co-localization or fusion events, as shown in
Table 8.
Table 8 outlines some of the critical patient-specific and model-related characteristics across different research phases. When we looked at Patient 1, she was a 25-year-old woman. We took a look at her peripheral blood stem cells. This allows us to obtain data about her genes and how they work. The tests we performed showed that she had a 98% match in single-nucleotide polymorphisms (SNPs). This means her DNA was very close to the donor’s, but there was also a 10% mismatch in human leukocyte antigens (HLAs). These are proteins that help the body tell the difference between its own cells and foreign ones. To help us understand this information, we built a graph neural network (GNN) model. It was made up of 512 nodes and 128 edges, arranged in three layers. It was able to predict the outcome with 85% accuracy before its results became consistent.
Patient 2 was a 60-year-old man. For him, we obtained data from his bone marrow. We looked at his genes and proteins. The tests showed a 95% SNP match, a bit lower than Patient 1. The HLA mismatch was 20%, which was higher than Patient 1. The GNN model we built for him had four layers, 512 nodes, and 256 edges. It was a bit more complex than Patient 1’s model. It was able to predict the outcome with 83% accuracy, and its results stayed consistent during testing.
Choosing peripheral blood stem cells for Patient 1 meant she did not need as invasive a procedure to obtain the genetic information we needed. This made her treatment easier. The high SNP match meant she was a good genetic match for the donor. This usually means a better chance of a successful transplant. We paid close attention to the 10% HLA mismatch because it can affect how well a transplant works. This helped us make a good treatment plan for her. The GNN model for Patient 1 was simpler than the one for Patient 2. It had fewer layers and edges. This meant it was an easier way to look at her data, but it was still good enough for her situation.
For Patient 2, using bone marrow samples gave us access to different kinds of information. This can be useful for aged patients because changes in the bone marrow that come with age can change how well treatment works. The SNP match was a little lower for Patient 2 (95%) than for Patient 1. The HLA mismatch was also higher (20%). This meant that his body might have more trouble accepting the transplant. The GNN model for Patient 2 had more layers and edges. This was because we needed to capture the more complex relationships between his genes and proteins.
Both models were pretty accurate: 85% for Patient 1 and 83% for Patient 2. This shows that GNNs can be useful for predicting how well a transplant will work and for guiding treatment. The small differences in the models and the data we used show that we can adjust our strategies based on each patient’s unique situation. This shows how personalized medicine can work in transplantology. These cases show how GNN models can handle complicated genetic data to help us take care of patients better and possibly make treatment more accurate. We also looked at Patient 3, who was a 35-year-old woman. We used clinical and genomic data from her umbilical cord blood. The tests showed a 90% SNP match and a 25% HLA mismatch.
Figure 10 shows model results. The left panel indicates high accuracy for each patient (97.68–99.74%), suggesting dependable predictions. The right panel compares single-nucleotide polymorphism (SNP) match percentages with human leukocyte antigen (HLA) mismatch percentages, showing compatibility measurements. These results imply the model is strong and can deal with varied donor–recipient situations. This research aims to build a graph neural network (GNN) system. By combining multi-omics and patient information, it will show how well donors and receivers match for stem cell transplants and help find and sort leukemia in its early stages. The approach centers on relevant match factors, such as SNP similarity and HLA mismatches, considering immune system changes during recovery. The main findings suggest this system has better accuracy in finding (97.68–99.74%) and sorting (98.76–99.4%) than regular machine learning models.
These results imply that GNNs can provide good predictions and be understood in clinical use, making them helpful for improving donor choice and leukemia treatment plans. The assessment of donor–recipient compatibility in stem cell transplants is intricate, requiring careful study of genetic factors to lower rejection risks and improve patient results. Single-nucleotide polymorphisms (SNPs), which are changes in a single nucleotide in a DNA sequence, serve as useful genetic markers to measure donor–receiver similarity. A high percentage of SNP matches usually points to greater genetic similarity, possibly lowering the chance of the receiver’s immune system attacking the donor’s cells. Human leukocyte antigens (HLAs) are proteins on cell surfaces that the immune system uses to identify cells. HLA mismatches, where the donor and receiver have different HLAs, can cause the receiver’s immune system to see the donor cells as foreign, causing transplant rejection. The percentage of HLA mismatches is a key measure when judging compatibility. Doctors aim to find the best balance by reducing HLA mismatches to lower the risk of rejection.
The GNN system uses network-based machine learning to understand relationships in transplant data. Graph neural networks work well with data shown as graphs, where data points are nodes and relationships are edges. In this case, nodes can stand for donors and receivers, and edges can stand for genetic similarities, clinical data, and other factors. By studying these networks, GNNs can learn patterns and predict transplant results accurately.
The use of multi-omics data, such as genomic, transcriptomic, and proteomic data, provides insight into the biological factors affecting transplant success. By putting this data together with patient data like age, disease stage, and treatment history, the GNN can learn a complete account of the factors affecting donor–receiver matching. The system mainly focuses on spotting and classifying leukemia early, which is important for improving treatment and patient outcomes. The GNN can find patterns and early leukemia signs by studying relationships between genetic markers, immune responses, and patient features that standard machine learning models may miss. Early finding allows for faster treatment, which can improve the chances of success.
The finding accuracy (97.68–99.74%) and sorting accuracy (98.76–99.4%) that the GNN system shows indicate it outperforms standard machine learning models. These results suggest the aptitude of GNNs to draw out complicated data relationships and provide accurate predictions. Besides its predictive ability, the GNN system allows for clinical interpretation, which is critical for doctors to trust and use the model’s results. The network can show the factors affecting its predictions by studying the graph structure and the importance of different features. Thus, doctors can gain insight into the reasons behind the model’s predictions, helping them make better treatment decisions.
Figure 11 shows that the left panel (Detected) provides insight into the development and predictability of a potential compatible donor for early leukemia detection, which is highly accurate with minimal false negatives. In the right panel (Classified), the model clearly classifies leukemia status and differentiates between true positive and negative outcomes. These results validate the robustness and scalability of the model in terms of compatibility and the clinical information used to make accurate predictions.
