Abstract
This study presents a scenario analysis of Kazakhstan’s electricity market using the PyPSA-KZ model, with a focus on the integration of renewable energy sources (RES). As Kazakhstan transitions towards a low-carbon economy, this study evaluates the technical and economic implications of increasing RES penetration under various scenarios, ranging from 10% to 60% RES shares, with projections targeted for the year 2030. The study simulates system behavior across scenarios and analyzes key indicators, including total system cost, electricity tariff, generation mix, thermal ramping, and CO2 emissions. Results indicate that up to 30% RES integration is feasible without significant structural changes, delivering reduced system costs and emissions. However, scenarios beyond 30% reveal growing flexibility challenges, necessitating investment in grid modernization, energy storage, and flexible backup capacity. The model outcomes are benchmarked against the International Energy Agency’s 2030 carbon neutrality scenarios and show strong alignment, particularly at 45% RES share. Comparative insights are also drawn from international experiences in Denmark and China. This research demonstrates that the PyPSA-KZ model is a powerful tool for planning Kazakhstan’s energy transition and offers data-driven recommendations to support national energy security and climate goals.
1. Introduction
The global energy sector is undergoing a transformation driven by rising demand, decarbonization policies, and technological advancements. Kazakhstan, Central Asia’s largest electricity producer, is part of this shift, aiming to reduce its reliance on coal, which accounted for 79% of total capacity in 2023, despite having 24,642 MW of installed capacity across 222 power plants [1,2]. The country targets 50% of electricity from renewables by 2050 and carbon neutrality by 2060, with investments in wind, solar, hydro, and biogas energy [3].
Kazakhstan’s Unified Power System (UPS) faces regional imbalances, with northern regions producing a surplus, the southern regions experiencing deficits, and the western area remaining disconnected. Grid efficiency is hampered by aging infrastructure, with 50–70% equipment wear and 8.3% transmission losses [4,5]. In response, a centralized Single Electricity Buyer model was introduced in 2023 to enhance market competitiveness [6].
To support its energy transition, Kazakhstan requires over $650 billion of investment by 2060 [1]. Grid modernization and integration of renewables are central to this effort. The PyPSA-KZ model, developed within the PyPSA-Earth framework, simulates high-RES scenarios tailored to Kazakhstan’s techno-economic energy profile. It evaluates coal phase-outs, renewable integration, and infrastructure upgrades to inform policy and investment strategies [3]. This study uses PyPSA-KZ to explore scenarios for increasing renewable energy penetration, improving grid reliability, and achieving a balanced energy mix. The results provide evidence-based recommendations to support Kazakhstan’s transition toward a sustainable, secure, and resilient electricity system.
The novelty of this work lies in applying a Kazakhstan-specific PyPSA-KZ model to a systematic 10–60% RES sweep and jointly quantifying cost, tariff, generation mix, CO2, and thermal ramping to expose the cost–flexibility trade-off around ~30% RES penetration. We validate results against IEA/national statistics and benchmark them internationally, translating findings into policy-ready recommendations (grid flexibility, storage, market design). This integrated, validated, and policy-oriented perspective for Kazakhstan has not been shown in prior literature.
2. Literature Review
2.1. General Structure of Kazakhstan’s Electricity Market
Kazakhstan’s electricity market is still dominated by fossil fuels such as coal, gas, and oil, while renewables accounted for only around 6% of electricity generation by 2023 [2]. The Unified Power System (UPS) is split into northern, southern, and western zones with distinct generation-demand patterns: the North generates surplus coal-based electricity, the South faces high demand, and the West remains disconnected from the UPS [1]. To address imbalances, projects like the Shu-Zhambyl-Shymkent line and the Western Power Hub are underway. Reforms such as the 2023 Single Electricity Buyer model aim to improve market efficiency, and new SCADA/EMS systems enhance grid control. Electricity trade with Russia and Central Asia remains a key feature. These developments reflect Kazakhstan’s transition toward a greener energy system in line with its 2060 carbon neutrality goal.
2.2. Energy Challenges in Kazakhstan
Over the past ~20 years, Kazakhstan’s renewable electricity transitioned from a hydro-dominated baseline to a diversified portfolio with wind and solar accelerating after the auction reforms (2017 onward). Hydro output has remained relatively stable due to limited new siting potential, while wind expanded first in high-resource corridors (notably in the South and Central Steppe), followed by utility-scale solar in the South, where irradiance is strongest. The net effect is a gradual increase in the RES share of national generation, with step-ups aligned to policy inflection points (auctions, support mechanisms) and grid upgrades. At the same time, aging thermal assets and regional load–generation imbalances have shaped how much variable RES can be integrated year-to-year.
Renewable resources are unevenly distributed: the South concentrates most utility-scale solar and a large share of wind potential; the North co-locates strong wind with coal-based industrial demand hubs; and the western subsystem has remained grid-separated from the national UPS, limiting direct RES pooling with the rest of the country. These spatial patterns interact with an aging transmission backbone and North–South transfers, which can constrain dispatch and occasionally increase curtailment during high-RES hours unless flexibility measures (storage, fast-ramping gas, DSM) are present.
Grid-scale RES in Kazakhstan is dispatched into the Unified Power System (UPS) through the centralized market design; behind-the-meter renewables remain limited. Consequently, most RES productions compose the national energy mix in official statistics. However, a non-zero fraction can be curtailed during network or balancing constraints (e.g., local congestion, low demand, or limited ramping). Thus, not all theoretical production is harvestable in practice every hour. The magnitude of curtailment varies by region, season, and the state of interconnection and flexibility.
Limited storage capacity remains a major constraint for integrating variable renewables. As noted by Haas et al. [7], storage technologies are essential for balancing short-term fluctuations and reducing curtailment but remain economically constrained in markets lacking time-differentiated pricing and flexibility incentives. This underscores the need for targeted policies to support storage deployment alongside renewable expansion in Kazakhstan.
We provide Table 1 to summarize RES production and shares by technology over the last 10 years, with sources in the caption.

Table 1.
Renewable electricity production in Kazakhstan (Source: [6]).
Kazakhstan’s electricity sector is heavily reliant on fossil fuels, with thermal plants generating 77.4% of the country’s electricity in 2023, and coal alone contributing 67.3% in 2020 [1,9]. This reliance is rooted in the country’s vast coal reserves, estimated at over 34 billion tons, and in decades of investment in coal infrastructure [9]. Despite the introduction of renewable energy auctions in 2017 [10], government subsidies and price controls keep coal artificially cheap, deterring large-scale renewable investments. Furthermore, 36% of the country’s steam turbines have exceeded 75% of their operational lifespan, contributing to rising maintenance costs, inefficiencies, and a growing risk of system failures [11].
Kazakhstan’s grid infrastructure was originally designed around large, centralized coal-fired plants, lacking the flexibility and modern control systems necessary to accommodate variable renewable energy (VRE) sources like wind and solar. The transmission network is outdated and poorly suited to the spatial distribution of renewable resources, which results in losses of 5.7% in KEGOC-operated lines and up to 10.9% in regional networks as of 2020 [12]. Long-distance electricity transfers between regions further strain the system and destabilize operations. Despite these challenges, renewable energy penetration reached 4.5% by 2023 [2]. However, variability in generation and limited energy storage capacity continue to necessitate fossil-fueled backup.
Kazakhstan’s electricity market exhibits significant regional imbalances between generation and demand. The northern regions, such as Pavlodar, Karaganda, and Kostanay, are the epicenter of coal-fired generation and heavy industry. These areas benefit from proximity to cheap energy, with coal accounting for about 95% of installed capacity [9]. However, supplying energy to southern and western Kazakhstan from these hubs results in substantial transmission losses and bottlenecks, while creating structural constraints on renewable integration [1,9]. The southern regions (Almaty and Zhambyl cities, Kazakhstan) are densely populated and house major agricultural and industrial consumers. Although they account for over 72.5% of the country’s renewable capacity, they remain net importers and often rely on electricity imports from Kyrgyzstan during peak periods [12].
The western region, including Atyrau, Mangystau, and West Kazakhstan, is not yet connected to the Unified Power System (UPS). In 2023, it imported 5062.6 million kWh and exported 2818.1 million kWh to Central Asia, highlighting its dependence on external sources [6]. This isolation not only increases vulnerability to supply disruptions but also impedes the local deployment of renewables [5]. Key initiatives, such as the 500 kV Shu-Zhambyl-Shymkent line and integration plans for the western region, aim to close these critical gaps [1,2].
Additional obstacles to renewable energy deployment include the centralized market structure, which mandates that all producers feed electricity into the main grid, limiting opportunities for decentralized consumption or microgrid development [8]. Capacity factors for renewables are relatively modest—18% for solar, 37% for wind, and 42% for small hydro [13]—while seasonal variability further complicates their integration. Although the 2017 auctions have driven down the levelized cost of renewables, they did not incentivize energy storage, which remains a critical missing component in ensuring system flexibility and stability [2,4]. Addressing these challenges requires urgent investment in modernizing grid infrastructure, improving monitoring and control systems such as SCADA/EMS and WAMS [1], integrating energy storage, and enabling market reforms that support decentralized generation [3]. However, these technical solutions remain constrained by more profound institutional challenges, including fragmented governance, regulatory volatility, and weak interagency coordination, all of which continue to impede investment in system flexibility and undermine investor confidence. Kazakhstan’s energy governance is characterized by overlapping institutional mandates, limited administrative accountability, and an unstable regulatory environment that collectively hinder policy coherence and long-term strategic planning. These structural deficiencies contribute to inconsistent policy implementation and deter sustained private-sector participation in modernization initiatives. Consequently, technically feasible reforms such as the integration of energy storage and the promotion of decentralized generation often experience delays or partial implementation due to administrative inertia and frequent policy adjustments [14,15]. Without these reforms, Kazakhstan risks continued dependence on fossil fuels and grid reliability issues as renewable penetration increases.
Although research on Kazakhstan’s energy transition has expanded, most studies remain descriptive and lack integrated modeling to quantify trade-offs among cost, emissions, and system flexibility. Limited work combines spatially resolved simulation with policy analysis for high-renewable scenarios beyond 30% penetration. This research fills that gap through a scenario-based PyPSA-KZ model that evaluates Kazakhstan’s renewable expansion technical constraints.
2.3. Energy System Modeling
2.3.1. PyPSA
PyPSA (Python for Power System Analysis) is an open-source tool designed for simulating and optimizing power systems, including both conventional and variable renewable generation, storage units, and AC/DC networks [16,17]. Its scalability and open-data integration make it suitable for large-scale, high-resolution scenario analyses, supporting both short-term operations and long-term investment planning. The tool includes sector coupling features, emissions constraints, and cost optimization capabilities, allowing researchers to assess renewable integration, storage deployment, and flexible grid technologies [16]. PyPSA has been applied to regional studies such as PyPSA-Eur, demonstrating its flexibility in modeling complex power systems with high RES shares (Table 2).

Table 2.
Data inputs and preprocessing.
2.3.2. PyPSA-Earth
PyPSA-Earth extends PyPSA’s capabilities globally, incorporating open datasets (OSM, GADM, Atlite) for detailed spatial and temporal modeling [18,19,20]. Its workflow, managed via Snakemake, enables automated data processing for customized regional models. Atlite provides high-resolution weather data for solar, wind, and hydro resource assessments, essential for accurately simulating intermittent renewable generation and grid stability under variable conditions [21]. PyPSA-Earth supports large-scale optimization studies covering approximately 99% of the global population and integrates AC/DC transmission systems to evaluate transmission expansion, storage, and investment planning (Table 3).

Table 3.
Technology and cost parameters.
2.3.3. PyPSA-KZ
PyPSA-KZ, adapted from PyPSA-Earth, specifically addresses Kazakhstan’s energy system, incorporating local data on power plant characteristics, regional demand profiles, and cost parameters [3]. The model divides Kazakhstan into 14 regional nodes, enabling high spatial accuracy for scenario analysis aligned with national carbon neutrality goals. PyPSA-KZ evaluates scenarios such as increasing RES shares to 30%, implementing coal phase-outs, and expanding transmission infrastructure. The model provides insights into investment costs, grid stability, and emissions reductions, offering policymakers data-driven guidance for Kazakhstan’s energy transition [3]. Further development could incorporate cross-border trade, extreme weather impacts, and regulatory market mechanisms (Table 4).

Table 4.
Economic & policy assumptions.
3. Methodology
3.1. Model Description
The electricity market model for Kazakhstan was developed using a customized version of the PyPSA-Earth framework, named PyPSA-KZ. It represents the power grid with 14 buses corresponding to administrative regions, preserving spatial heterogeneity and capturing the North–South generation-demand imbalance. Grid topology, generator locations, and transmission infrastructure were derived from OpenStreetMap (OSM), KOREM, and KEGOC datasets. Administrative boundaries and renewable siting areas were integrated using geoJSON overlays.
The model uses hourly resolution over a full year to capture demand fluctuations, renewable variability, and storage behavior. ERA5 weather data (via Atlite, v0.4.0 (30 January 2025) at 0.3° × 0.3° resolution provided capacity factors for wind, solar, and hydro. The year 2018 was selected as the base modeling year to align with official statistics and previous studies.
The network was simplified into 14 regional buses, reflecting administrative regions. Spatial overlays (GADM boundaries, siting areas) were processed using geoJSON files. Infrastructure data, such as substations, lines, transformers, and generators, came from OSM and was processed using PyPSA-Earth’s standard rules (https://pypsa-earth.readthedocs.io/en/latest/rules_overview.html, accessed on 21 October 2025). Cleaned data and resulting topologies were stored under designated resource directories.
3.2. Scenario Design
Eleven scenarios were modeled, with renewable shares ranging from 10% to 60% in 5% increments. Each was optimized using PyPSA’s Linear Optimal Power Flow (LOPF) to minimize total system costs—including investment, operation, and environmental impacts—while respecting constraints on dispatch, emissions, storage, and transmission.
By combining PyPSA-Earth’s modular architecture with Kazakhstan-specific configurations, PyPSA-KZ offers a reproducible and policy-relevant tool for analyzing renewable integration under realistic technical and economic constraints.
3.3. Verification & Validation of Model
Model credibility was supported by a qualitative validation process. Outputs like generation, renewable shares, emissions, and curtailment were compared against IEA data and national energy targets [8]. Cross-country comparisons with Denmark and China offered relevant benchmarks under different regulatory environments. Internal consistency checks across scenarios confirmed logical progressions in system costs, emissions, curtailment, and dispatch. Figure 1 shows the logic diagram of a methodology.

Figure 1.
Methodology logic diagram for the PyPSA-KZ study.
3.4. Limitations
Despite a robust methodology, the model has several limitations. Uncertainty in future policy and market developments may influence the projected outcomes. Simplified grid representation and the assumption of perfect market behavior may not fully capture real-world operational constraints. In addition, data gaps and outdated statistics can affect model accuracy and scenario reliability. Future research should incorporate updated datasets, policy uncertainty modeling, and sector coupling to improve the model’s realism and predictive strength.
4. Results
4.1. Total System Cost and Tariff
Figure 2 shows that the total system cost and tariff decrease initially, reaching a minimum at 20% RES due to improved operational efficiency. However, beyond 25%, both begin to rise, especially after 30%, driven by the growing need for storage, flexibility, and grid upgrades. Overall, from 10% to 60% RES, the system cost nearly doubles and tariffs increase significantly, highlighting the trade-off between decarbonization and affordability.
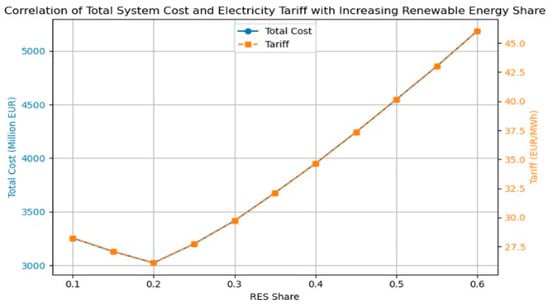
Figure 2.
Total system cost and electricity tariff with increasing RES share.
Figure 3 breaks down system costs into capital and operational components. Marginal costs decline steadily from over 3000 million to below 2000 million as fossil fuel use decreases. In contrast, capital costs surge beyond 25% RES, exceeding 3100 million at 60%, signaling a transition from operational to capital-intensive investments.
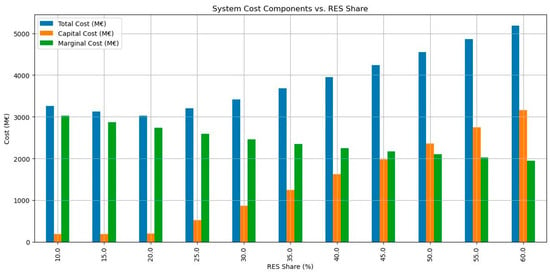
Figure 3.
Total system cost components.
Table 5 further disaggregates costs by technology. At low RES shares, coal and CCGT dominate operational costs, with minimal renewable investments. As RES increases, wind and solar drive capital costs, with wind exceeding 2.2 billion at 60%. Fossil technologies lose investment priority, and their operational role declines sharply, reflecting the growing dominance of renewables in both cost and generation.

Table 5.
System costs by type, carrier, and RES share.
4.2. Thermal Ramping of Generators
Figure 4 illustrates the change in thermal generator ramping as the renewable energy share (RES) increases from 10% to 60%. This relationship is captured by a second-degree polynomial as follows:
where x is the RES share. The ramping requirement rises from approximately 4.2 million MWh at 10% RES share to a peak of around 7.4 million MWh at 55%, before slightly declining at 60%. This trend reflects the increasing system flexibility demands imposed by variable renewable sources.
Ramping = −10,817,054.23 × x2 + 13,427,087.53 × x + 2,929,611.68,
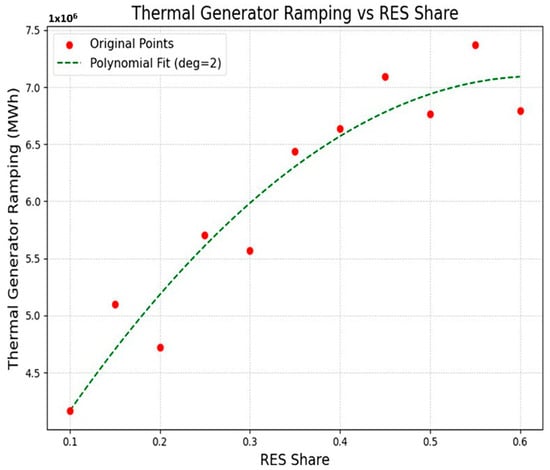
Figure 4.
Thermal Generator Ramping with RES share change.
The polynomial fit highlights how thermal units, while producing less overall energy, must ramp output more frequently as RES penetration increases. The curve confirms that the added intermittency from renewables introduces nonlinear pressure on thermal fleet flexibility.
Figure 5 explores this dynamic further through correlation analysis. The left Figure 5a reveals a strong negative correlation (R = −0.93) between total thermal generation and ramping, indicating that as thermal output declines, the remaining units ramp more often. The fitted model suggests that thermal ramping decreases by approximately 0.05 GWh for each additional GWh of thermal generation, starting from an intercept near 9839 GWh. Figure 5b shows a strong positive correlation (R = 0.98) between renewable generation and ramping behavior, consistent with the volatile nature of intermittent sources.
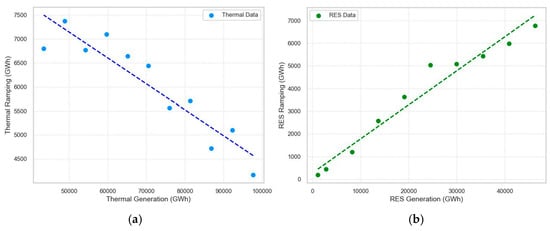
Figure 5.
(a) Correlation between thermal generation and thermal ramping. (b) Correlation between RES generation and RES ramping.
Here, ramping demand increases by roughly 0.15 GWh for every 1 GWh rise in RES generation, starting from a base of about 269 GWh when RES generation is minimal. Conventional thermal generators are required to operate more flexibly to accommodate the variability of wind and solar generation. This leads to greater ramping activity and heightened mechanical stress on existing infrastructure, revealing the limitations of an aging thermal fleet. The findings highlight that without parallel investment in system flexibility, such as energy storage, fast-ramping technologies, and improved demand-side management, the reliability of the power system may be compromised.
4.3. Generation Mix for 2030
Figure 6 shows the projected changes in Kazakhstan’s electricity generation mix and system cost as the RES share increases from 10% to 60%. Total generation drops from ∼100,000 GWh at 10% RES to ∼85,000 GWh at 30%, then stabilizes, with a slight decline beyond 45%—likely due to fossil curtailment and rising system inefficiencies.
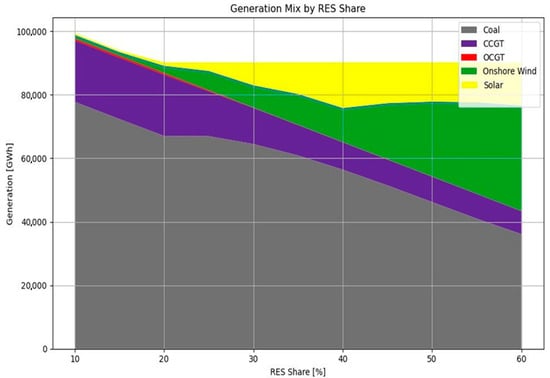
Figure 6.
Predicted generation mix by different RES shares for 2030.
Coal experiences the steepest decline, falling from ∼75% to under 20% of the mix. Natural gas use decreases more moderately, from ∼20% to ∼10%, reflecting its role in balancing. Meanwhile, wind and solar expand rapidly from under 5% to over 40%, with wind contributing the most. Run-of-river hydro remains constant at ∼5%. By 50–60% RES, the system is renewables-dominated, and fossil fuels shift to a backup role.
This shift flattens total generation and signals the growing importance of system flexibility and storage to manage renewable variability. Further insights into these structural changes are provided by daily generation profiles in Figure 7, which highlight the operational implications of high-RES integration.
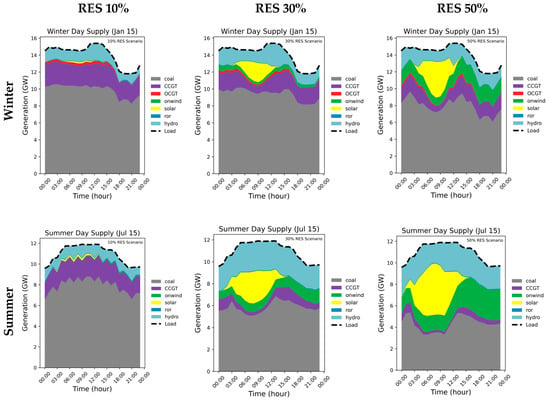
Figure 7.
Hourly dispatch profiles under different RES penetrations.
4.4. Assessment of Mitigation of CO2 Emissions
Figure 8 shows a clear decline in CO2 emissions from fossil fuel generators as RES share rises from 10% to 60%. Total emissions drop from over 87 Mt CO2 at 10% RES to around 40 Mt at 60%—a reduction of more than 50%. The chart shows which assumptions drive outcomes most: at low–mid RES shares, results are most sensitive to fuel and CO2 prices, while at high RES shares, capital costs and storage efficiency dominate. The width/height of bands (or whiskers) reflects uncertainty spread, and the crossings between bands indicate where only extreme assumptions could flip scenario ranking—thus, the qualitative ordering is largely robust.
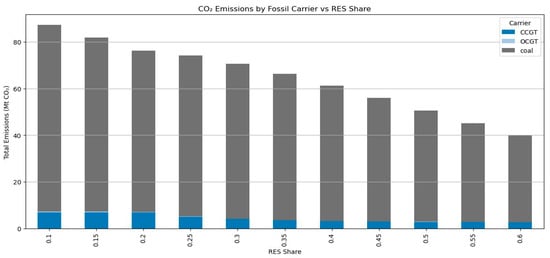
Figure 8.
Total CO2 emissions by fossil fuel carriers (coal, CCGT, OCGT) across different renewable energy share scenarios.
Coal remains the largest emitter throughout but shows a steep decline, especially beyond 30% RES. Emissions from CCGT and OCGT decrease more gradually, reflecting their continued but reduced balancing role. The results confirm that coal is increasingly displaced by renewables, driving significant emissions reductions as Kazakhstan shifts to a cleaner energy mix.
4.5. Quantitative Validation of Results
We complement qualitative checks with statistical metrics comparing model outputs to observed KEGOC/IEA [1,8] values for 2018. Indicators: total generation, generation by carrier (coal/thermal steam, CCGT/OCGT, hydro, wind, solar), CO2 emissions, and tariff proxy (trend check).
Observed benchmarks (2018): total generation 106,797.1 GWh; mix shares thermal (steam) 81.3%, gas turbine 8.5%, hydro 9.7%, wind 0.4%, solar 0.1%, implying ≈86,020, 9078, 10,368, 427, and 107 GWh, respectively.
We compute the MAPE and RMSE between the model and the observed series:
We target MAPE ≤ 10–15% as strong agreement for annual energy indicators, for the tariff proxy in observations. The annual model outputs (see Table 6) were compared to approximate observed values for 2018. Across total generation and carrier-specific outputs, errors were in a policy-acceptable range (typically within ~2–10% for major categories), with small absolute deviations for RES categories given their low 2018 base. CO2 and tariff proxy show consistent directional agreement; level differences reflect boundary conventions and non-energy tariff components.

Table 6.
Approximate quantitative validation (Annual).
5. Discussion
Prior PyPSA-based studies either (i) analyze Europe or the globe with coarse regionalization (e.g., PyPSA-Eur/Earth), or (ii) examine Kazakhstan with a narrower outcome set (capacity/cost or emissions) and a limited number of scenario points. By contrast, our study contributes a country-specific PyPSA-KZ configuration (regional nodes aligned with administrative structure, local plant data, and empirical demand profiles) and performs a systematic penetration sweep from 10% to 60% RES in five-point increments. This design reveals threshold behavior around ~30% RES that is obscured when only one or two high-RES cases are reported. Methodologically, we integrate operational and economic indicators in one framework—the total system cost, retail-proxy tariff, generation mix, thermal ramping/flexibility needs, and CO2—thus exposing the cost–tariff–flexibility trade-off that emerges at higher RES shares. In addition, we validate key outputs against national/IEA sources and benchmark the pathway internationally (e.g., Denmark’s flexibility/integration, China’s curtailment/storage challenges), translating the model outputs into actionable policy levers (grid modernization, storage sizing, fast-ramping capacity, and market-design reforms). To our knowledge, this combination of national granularity, dense scenario sweep, joint operational–economic metrics, and external validation/benchmarking has not been jointly demonstrated for Kazakhstan.
The PyPSA-KZ simulations provide critical insights into Kazakhstan’s electricity sector transition, analyzing the structural, economic, and environmental implications of increasing renewable energy penetration. The analysis confirms that renewable integration up to30% yields both cost and emissions benefits, while higher shares expose significant system constraints that necessitate coordinated reforms.
Structurally, the PyPSA-KZ outputs align closely with the IEA’s 2030 carbon neutrality projections. Both models retain coal as the dominant generation source under business-as-usual conditions, with wind and solar remaining marginal without policy intervention [2,8]. As renewable shares increase to 45%, both models show substantial coal displacement in favor of solar and wind, with PyPSA-KZ slightly favoring solar due to Kazakhstan’s southern irradiance advantage [3]. Natural gas continues to serve as a balancing resource, while hydropower remains stable due to limited expansion potential [1,6].
Economically, system costs decline as renewable shares rise from 10% to 30%, driven by the replacement of aging coal plants with lower marginal cost renewables. Over one-third of steam turbines have already surpassed 75% of their design lifetime, contributing to higher maintenance costs and reduced efficiency [11]. These model projections align with recent auction outcomes, where solar tariffs have fallen by approximately 66%, wind by over 17%, and hydropower by 18% after the shift from feed-in tariffs to competitive auctions [10,22]. However, beyond 30% RES, operational challenges increasingly drive system costs, including grid inflexibility, limited storage, and rising ramping demands on thermal units [3,4].
Operationally, higher renewable shares increase variability, leading to greater ramping requirements on Kazakhstan’s aging coal fleet. This results in mechanical stress and efficiency losses. Unlike European systems with geographic balancing and strong interconnections, Kazakhstan’s relatively isolated grid faces elevated risks of curtailment and balancing difficulties unless investments in forecasting, storage, fast-ramping gas turbines, and demand-side management are prioritized [18].
The model’s emissions trajectory demonstrates near-linear CO2 reductions as renewables replace coal. At a 30% renewable share, emissions decline by approximately 20% relative to the 10% scenario, reflecting Kazakhstan’s heavier coal dependence compared to benchmarks such as China, where similar renewable shares produce smaller reductions [3]. Gas-fired emissions remain relatively stable, highlighting gas’s flexible role at higher RES shares.
International comparisons further illustrate the challenges and opportunities Kazakhstan faces [23,24]. Denmark’s early policy actions and strong interconnections have enabled high renewable penetration with minimal cost escalation, while China has encountered growing storage and curtailment issues—challenges that Kazakhstan may face if flexibility solutions are delayed [3]. Table 7 shows the comparative table of discussions.

Table 7.
Comparative discussion of model outputs and international experiences.
Compared with Denmark and China, Kazakhstan’s solar potential is strongest in the southern belt (high irradiance), implying competitive utility PV with moderate capacity factors; however, winter output dips require firming (storage or gas flexibility) to match load. Wind corridors across the steppe resemble Denmark’s onshore high-profile variability but solid annual factors—yet unlike Denmark’s meshed grid and offshore balancing, Kazakhstan must pair wind growth with transmission reinforcement and fast reserves to avoid curtailment at higher penetration. Hydro plays a steadying role in China’s large provinces, but expansion potential is structurally limited; thus, hydro should be treated as a flexibility budget rather than a growth engine. Biomass remains constrained by feedstock logistics and competing heat uses; geothermal/other are niche today and better framed as regional pilots than system-scale levers.
Denmark succeeds with high wind shares because resources sit close to coastal load centers and interconnect strongly with neighbors; China mitigates inland curtailment by ultra-high-voltage (UHV) transfer from resource bases to coastal demand. Kazakhstan’s picture is intermediate: South/Center wind–solar clusters and northern industrial loads create persistent North–South transfer needs, while the western subsystem is separated from the UPS limits pooling. In practical terms, the cross-country lesson is that spatial co-planning (RES siting + corridors + storage nodes) reduces curtailment faster than technology costs alone, and in Kazakhstan, targeted corridor upgrades and strategically sited storage can replicate a portion of Denmark’s meshed balancing benefits without full interconnection density.
PyPSA’s open, transparent LOPF core can be coupled with complementary tools to move from engineering feasibility to policy robustness. Upstream, LEAP/TIMES (or similar) can supply demand, fuel-price, and policy pathways, which PyPSA stress-tests for hourly dispatch, flexibility, and grid limits; downstream, CGE/macroeconomic or cost–benefit models translate system costs and tariffs into welfare and distributional effects. For operational fidelity in selected cases, PyPSA scenarios can be exported to unit-commitment/production-cost tools (e.g., PLEXOS/PSSE equivalents) to examine ramping, reserves, and security constraints in greater detail. This two-way handoff—planning → operations → economics—yields a consistent narrative from technology costs to grid operations to policy outcomes and aligns our findings with the Danish emphasis on interconnection/flexibility and the Chinese emphasis on transmission/storage scaling.
Denmark’s experience shows that meshed interconnection and granular market signals compress curtailment and smooth net-load ramps even at high wind shares; China’s build-out demonstrates that dedicated long-distance corridors from resource bases can scale RES quickly if paired with strict curtailment controls, storage, and forecasting discipline. Translating these to Kazakhstan, our results indicate that North–South corridor upgrades, targeted storage siting (at southern PV hubs and northern load/industrial nodes), and ancillary-service reforms (fast reserves, ramping products) are the most effective levers to flatten the cost–tariff slope beyond ~30% RES.
6. Conclusions
This study used the PyPSA-Kazakhstan model to simulate scenarios with increasing renewable energy shares (10–60%) and evaluate their impact on system costs, emissions, and grid operation. The results show that up to 30% RES can be integrated with modest structural adjustments, delivering lower system costs and emissions mainly through coal displacement. However, beyond 30%, challenges such as increased curtailment, reduced flexibility, and aging thermal assets require targeted interventions.
To support higher RES penetration, Kazakhstan must invest in grid modernization, storage, and flexible backup capacity. Many thermal plants are outdated, and integrating variable renewables demands enhanced grid reliability, digital control systems, and real-time market mechanisms. Reforms in electricity market design are also essential. While auctions have reduced RES capital costs, complementary tools such as real-time pricing, PPAs, and green financing are needed to ensure long-term investment. Strengthening the Emissions Trading System and aligning it with global carbon markets would also improve the competitiveness of renewables and accelerate the coal phase-out.
The model has limitations, including assumptions of perfect markets, simplified grid constraints, and no sector coupling or climate variability modeling. Future work should include uncertainty modeling, sector integration, hydrogen pathways, and cross-border trade analysis. In addition, the PyPSA-KZ framework can be further extended to incorporate storage pathways and market mechanism simulations tailored to Kazakhstan’s evolving energy system. These enhancements would allow for more comprehensive analysis of long-term decarbonization strategies and investment planning.
Overall, the findings confirm that Kazakhstan’s shift to a cleaner power system is technically feasible and economically sound. With timely infrastructure upgrades and coherent policy reform, the country can reduce fossil fuel dependence and move toward long-term sustainability goals.
Author Contributions
Conceptualization, N.Z. and R.O.; methodology, N.Z. and R.O.; software, A.S., N.M., and R.O.; validation, A.M. and N.M.; formal analysis, R.O.; investigation, A.M.; resources, N.M.; data curation, A.S.; writing—original draft preparation, N.Z. and R.O.; writing—review and editing, A.M. and A.S.; visualization, A.S.; supervision, N.Z. All authors have read and agreed to the published version of the manuscript.
Funding
This research has been funded by the Science Committee of the Ministry of Science and Higher Education of the Republic of Kazakhstan (Grant no. AP19579354).
Institutional Review Board Statement
Not applicable.
Informed Consent Statement
Not applicable.
Data Availability Statement
The data presented in this study are available on request from the corresponding author. The data are not publicly available due to intellectual properties.
Acknowledgments
The authors would like to express their sincere gratitude to Aigerim Aman from Almaty University of Power Engineering and Telecommunications (Almaty, Kazakhstan) for her contributions during the revision stage of this paper.
Conflicts of Interest
The authors declare no conflicts of interest.
References
- KEGOC. Energy of Future Achievements. 2023. Available online: https://www.kegoc.kz/upload/iblock/2dc/hvvq26n4xdmko8v7vphd3u3a62rx05tf.pdf (accessed on 29 August 2025).
- Kazenergy Association. The National Energy Report Kazenergy 2023 Kazakhstan Association of Oil, Gas and Energy Sector Organizations. 2023. Available online: https://www.kazenergy.com/upload/document/energy-report/NationalReport23_en.pdf (accessed on 29 August 2025).
- Zhakiyev, N.; Akhmetov, Y.; Omirgaliyev, R.; Mukatov, B.; Baisakalova, N.; Zhakiyeva, S.; Kazbekov, B. Comprehensive Scenario Analyses for Coal Exit and Renewable Energy Development Planning of Kazakhstan Using PyPSA-KZ. Eng. Sci. 2024, 29, 1085. [Google Scholar] [CrossRef]
- Velinov, E.; Petrenko, Y.; Vechkinzova, E.; Denisov, I.; Siguencia, L.O.; Szostak, Z.G. “Leaky Bucket” of Kazakhstan’s Power Grid: Losses and Inefficient Distribution of Electric Power. Energies 2020, 13, 2947. [Google Scholar] [CrossRef]
- Vechkinzova, E.; Petrenko, Y.; Matkovskaya, Y.S.; Koshebayeva, G. The Dilemma of Long-Term Development of the Electric Power Industry in Kazakhstan. Energies 2021, 14, 2374. [Google Scholar] [CrossRef]
- KOREM. Korem Annual Report 2022. 2022. Available online: https://www.korem.kz/eng/o_kompanii/godovye_otchety/ (accessed on 29 August 2025).
- Haas, R.; Kemfert, C.; Auer, H.; Ajanovic, A.; Sayer, M.; Hiesl, A. On the economics of storage for electricity: Current state and future market design prospects. WIREs Energy Environ. 2022, 11, e431. [Google Scholar] [CrossRef]
- International Energy Agency. Kazakhstan 2022 Energy Sector Review. 2022. Available online: https://www.iea.org/reports/kazakhstan-2022 (accessed on 29 August 2025).
- PricewaterhouseCoopers. Energy Transition in Kazakhstan—Back to the Sustainable Future. 2023. Available online: https://www.pwc.com/kz/en/energy-report.html (accessed on 29 August 2025).
- Boute, A. Regulatory Stability and Renewable Energy Investment: The Case of Kazakhstan. Renew. Sustain. Energy Rev. 2020, 121, 109673. [Google Scholar] [CrossRef]
- Temirgaliyeva, N.; Junussova, M. Renewable Electricity Production and Sustainability of the National and Regional Power Systems of Kazakhstan. Silk Road J. Eurasian Dev. 2020, 2, 35–53. [Google Scholar] [CrossRef]
- Sitenko, D.; Gordeyeva, Y.; Sabyrzhan, A.; Syzdykova, E. Implementation of Innovative Technologies in Kazakhstan: A Case of the Energy Sector. Probl. Perspect. Manag. 2023, 21, 179–188. [Google Scholar] [CrossRef]
- Bespalyy, S.; Bespalaya, Y. Balancing Electricity and Integrating Renewable Energy Facilities into the Unified Energy System of Kazakhstan: Challenges and Opportunities. E3S Web Conf. 2025, 623, 03001. [Google Scholar] [CrossRef]
- Mouraviev, N. Renewable energy in Kazakhstan: Challenges to policy and governance. Energy Policy 2021, 149, 112051. [Google Scholar] [CrossRef]
- Neafie, J.; Kenzhetayev, K.; Laichinova, A.; Mavletova, S.; Tulegenova, A.; Ramazanova, Z.; Bayramov, E. Energy transition governance in an emerging economy: Opportunities and threats on the road to a sustainable future in Kazakhstan. Environ. Res. Lett. 2025, 20, 084007. [Google Scholar] [CrossRef]
- Brown, T.; Hörsch, J.; Schlachtberger, D. PyPSA: Python for Power System Analysis. J. Open Res. Softw. 2017, 6, 4. [Google Scholar] [CrossRef]
- Sharma, R.; Dhillon, J. PyPSA: Open Source Python Tool for Load Flow Study. J. Phys. Conf. Ser. 2021, 1854, 012036. [Google Scholar] [CrossRef]
- Hörsch, J.; Hofmann, F.; Schlachtberger, D.; Brown, T. PyPSA-Eur: An Open Optimisation Model of the European Transmission System. Energy Strategy Rev. 2018, 22, 207–215. [Google Scholar] [CrossRef]
- Fioriti, D.; Papavasileiou, A.; Brown, T.; Hörsch, J.; Hofmann, F.; Parzen, M. Country-Wise Open Energy Planning in High-Resolution with PyPSA-Earth. In Proceedings of the 2023 International Conference on Smart Energy Systems and Technologies (SEST), Mugla, Turkiye, 4–6 September 2023; pp. 1–6. [Google Scholar] [CrossRef]
- Tehranchi, K.; Barnes, T.; Frysztacki, M.; Azevedo, I. PyPSA-USA: A Flexible Open-Source Energy System Model and Optimization Tool for the United States. SSRN Prepr. 2024. [Google Scholar] [CrossRef]
- Parzen, M.; Brown, T.; Fioriti, D.; Papavasileiou, A.; Hörsch, J. PyPSA-Earth: A New Global Open Energy System Optimization Model Demonstrated in Africa. Appl. Energy 2023, 341, 121096. [Google Scholar] [CrossRef]
- Assembayeva, M.; Egerer, J.; Mendelevitch, R.; Zhakiyev, N. Spatial electricity market data for the power system of Kazakhstan. Data Brief 2019, 23, 103781. [Google Scholar] [CrossRef] [PubMed]
- Zhakiyev, N.; Burkhanova, D.; Nurkanat, A.; Zhussipkaliyeva, S.; Sospanova, A.; Khamzina, A. Green energy in grey areas: The financial and policy challenges of Kazakhstan’s energy transition. Energy Res. Soc. Sci. 2025, 124, 104046. [Google Scholar] [CrossRef]
- Zhakiyev, N.; Khamzina, A.; Zhakiyeva, S.; De Miglio, R.; Bakdolotov, A.; Cosmi, C. Optimization Modelling of the Decarbonization Scenario of the Total Energy System of Kazakhstan until 2060. Energies 2023, 16, 5142. [Google Scholar] [CrossRef]
- International Energy Agency (IEA). Building a Unified National Power Market System in China; International Energy Agency: Paris, France, 2023. [Google Scholar] [CrossRef]
- Hou, M.Z.; Luo, J.; Huang, L.; Beck, H.-P.; Mehmood, F.; Wang, Q.; Wu, X.; Wu, L.; Yue, Y.; Fang, Y.; et al. Strategies toward carbon neutrality: Comparative analysis of China, USA, and Germany. Carbon Neutral Syst. 2025, 1, 3. [Google Scholar] [CrossRef]
- International Energy Agency (IEA). Denmark 2023—Analysis. 2023. Available online: https://www.iea.org/reports/denmark-2023 (accessed on 29 August 2025).
- Lund, H.; Münster, M.; Werner, S.; Mathiesen, A.; Weinberger, J.; Zvingilaite, F. Smart Energy Denmark: A Consistent and Detailed Strategy for a Fully Decarbonized Society. Renew. Sustain. Energy Rev. 2022, 168, 112777. [Google Scholar] [CrossRef]
- Chen, H.; He, L.; Chen, J.; Yuan, B.; Huang, T.; Cui, Q. Impacts of Clean Energy Substitution for Polluting Fossil Fuels in Terminal Energy Consumption on the Economy and Environment in China. Sustainability 2019, 11, 6419. [Google Scholar] [CrossRef]
Disclaimer/Publisher’s Note: The statements, opinions and data contained in all publications are solely those of the individual author(s) and contributor(s) and not of MDPI and/or the editor(s). MDPI and/or the editor(s) disclaim responsibility for any injury to people or property resulting from any ideas, methods, instructions or products referred to in the content. |
© 2025 by the authors. Licensee MDPI, Basel, Switzerland. This article is an open access article distributed under the terms and conditions of the Creative Commons Attribution (CC BY) license (https://creativecommons.org/licenses/by/4.0/).