Article

Dynamic Route Planning Strategy for Emergency Vehicles with Government–Enterprise Collaboration: A Regional Simulation Perspective

1
Engineering Research Center of Catastrophic Prophylaxis and Treatment of Road & Traffic Safety of Ministry of Education, Changsha University of Science & Technology, Changsha 410114, China
2
Institute of Disaster Prevention Science and Safety Technology, School of Civil Engineering, Central South University, Changsha 410075, China
3
Glodon Company Limited, Fujian Branch, Fuzhou 350001, China
*
Author to whom correspondence should be addressed.
Appl. Sci. 2025, 15(21), 11496; https://doi.org/10.3390/app152111496
Submission received: 30 May 2025 / Revised: 13 August 2025 / Accepted: 2 October 2025 / Published: 28 October 2025

Abstract

To achieve a scientific and efficient emergency response, a dynamic route-planning strategy for emergency vehicles based on government–enterprise collaboration was studied. Firstly, a hybrid evaluation approach was developed, integrating the Analytic Hierarchy Process, Entropy Weight Method, and Gray Relation Analysis-TOPSIS to quantitatively assess the urgency of demands at disaster sites. Secondly, a government–enterprise coordinated route-planning strategy was designed, leveraging the government’s strong mobilizing capabilities and enterprises’ flexible operational mechanisms. Thirdly, to optimize scheduling efficiency, a dynamic route-planning model was proposed, incorporating multiple distribution conditions to minimize scheduling time, delay penalties, and unmet demand rates. A two-stage cellular genetic algorithm was employed to address realistic constraints such as demand splitting, soft time windows, open scheduling, and differentiated services. Numerical simulations of potential flooding in Hunan Province revealed that the collaborative strategy significantly improved performance: the demand satisfaction rate rose from 70.1% (government-led) to 92.3%, while the material transportation time per unit decreased by 23.6% (from 1.61 to 1.23 min/unit). Vehicle path characteristics varied under different operational behaviors, aligning with theoretical expectations. Even under sudden road disruptions, the model maintained a 98% demand satisfaction rate with only a negligible 0.076% increase in system loss. This research fills the gaps in previous studies by comprehensively addressing multiple factors in emergency vehicle route planning, offering a practical and efficient solution for post-disaster emergency response.

1. Introduction

In recent years, abnormal weather events have grown more frequent due to global warming and rapid urbanization [1,2]. According to the Emergency Events Database (EM-DAT), numerous cities have been hit by natural disasters [3], such as the 2021 Henan floods in China, which resulted in 398 fatalities and CNY 379.3 billion in losses, and the 2023 Libya floods, which claimed over 11,300 lives, disrupted urban road networks, and delayed relief efforts. During natural disasters, emergency relief necessitates the rapid delivery of large quantities of survival and medical supplies to address medical needs, epidemic control, and post-disaster reconstruction [4]. In reality, the route planning of emergency vehicles is faced with the dual pressures of the tight material flow and transportation flow. The primary challenge in emergency rescue is to scientifically and rationally transport emergency supplies from facilities to disaster sites within a limited time, space, and resources to meet public needs [5].
As emergency needs become more diverse and integrated, society and the public have put forward higher requirements and challenges to the response capability and the planning decisions of transportation routes. On the one hand, emergency resources (supplies, personnel, vehicles, etc.) are limited and cannot meet all disaster sites simultaneously. Regional disaster sites have varying needs for emergency supplies, reflecting different levels of urgency. Emergency supply distribution that ignores this reality can easily result in a mismatch between the supplies distributed and the needs of the disaster sites and can lead to social problems [6,7]. Considering the time sensitivity of emergency rescue at different disaster points, developing scientific models for the distribution of emergency supplies that prioritize rescue based on demand urgency has become crucial. On the other hand, disaster sites may be affected within short intervals, be geographically dispersed, and require similar emergency supplies and rescue forces [8]. A single emergency facility often struggles to handle these scenarios at the same time [9,10]. How to strengthen the cooperation between government and enterprise and make full use of the advantages of multi-agent behavior in the route planning of emergency vehicles is the core problem to be solved.
Current emergency logistics strategies suffer from three critical gaps: First, existing studies assume fixed demand, neglecting dynamic adjustments in changing disaster scenarios. Second, few route-planning studies incorporate government–enterprise coordination, relying mostly on single-agent dispatch. Third, existing urgency ranking methods lack objectivity [11,12]. In response to the above considerations, this paper proposes a dynamic route-planning framework for emergency vehicles that integrates demand urgency considerations and a government–enterprise collaboration strategy. Based on vehicle dispatch status, the service situation of the disaster site, and the nearby replenishment mechanisms, emergency vehicles are dispatched circularly between government, enterprises, and disaster sites to maximize the efficiency of transportation of resources and emergency supplies. This approach minimizes the impact of natural disasters on social production, daily life, and the ecological environment, reducing casualties and secondary injuries caused by delayed supplies.

1.1. Literature Review

Route planning for emergency vehicles involves determining optimal routes between emergency facilities and disaster sites to achieve specific decision-making objectives [13]. The classification of vehicle routing problems is presented in Table 1. Given that emergency supply distribution must address real-world challenges (such as vehicle capacity, service time, service priority, etc.), a variety of distribution conditions (such as capacity constraints, priority constraints, vehicle type constraints, time window constraints, etc.) are typically taken into account during route planning for emergency vehicles [14,15]. Currently, constraints in emergency vehicle route planning mainly stem from two factors: the distribution conditions and external environmental factors. In response to surging demand for emergency supplies and time-sensitive requirements, the distribution conditions include delivery count constraints, vehicle type constraints, time-window constraints, and so on. The distribution count constraint is utilized to optimize the paths by distributing emergency supplies in batches [16]. Vehicle types are influenced by commercial logistics, with both open and closed vehicle scheduling proposed [17,18]. The time windows are categorized as soft and hard, penalizing, delaying, or rejecting vehicle scheduling in service scenarios [19,20]. Given material competition and supply–demand conflicts in the external environment, demand urgency at each disaster site becomes a key reference for vehicle dispatch order [21]. Considering the impact of road traffic performance on emergency rescue routes, some scholars incorporate road damage and road complexity as road constraints [22,23], but most of these assumptions are relatively strict.
While extensive research exists on static demand VRPs, these models inherently lack adaptability to the highly dynamic and evolving nature of post-disaster scenarios. Real-time factors, such as fluctuating casualty reports, secondary disasters (e.g., landslides blocking roads), and updated resource assessments at disaster sites, render static assumptions inadequate. Traditional models often assume a single, centralized authority (e.g., a government depot) with closed vehicle scheduling, failing to leverage collaborative resource pooling between government entities (with strong mobilization power) and private enterprises (offering flexible operations and distributed facilities). Models considering multiple distribution centers are often limited to homogeneous fleets owned by a single entity, overlooking the coordination complexities, differing operational protocols, and potential conflicts of interest inherent in genuine government-enterprise collaboration during large-scale emergencies. Furthermore, the common one-to-many service pattern is complicated by the frequent need for demand splitting due to vehicle capacity constraints and large-scale requirements at critical sites. While split delivery VRPs are studied, their integration with dynamic urgency-based prioritization and multi-facility (government and enterprise) fulfillment within tight time frames remains a complex challenge. These limitations collectively highlight critical gaps in current emergency VRP research.
After a disaster strikes, emergency response teams must conduct simultaneous rescues at multiple, dispersed disaster sites, and the urgency is conducive to improving the efficiency and organization of emergency operations. Currently, research on the demand urgency focuses on emergency supplies, employing methods such as probabilistic neural networks, fuzzy comprehensive evaluation, and the CRITIC method to establish demand classification models. Key indicators influencing the demand urgency are put forward, including the irreplaceable supplies, demand gaps, and the harm caused by supply shortage [24,25,26]. In recent years, some scholars have also considered the stage of supply and demand and the difficulty of supply storage as vital indicators for evaluating demand urgency. Drawing inspiration from group clustering, most researchers cluster disaster sites and then classify them by grouping. They define priority functions and incorporate them into objective functions or constraint conditions to construct the demand urgency models [27,28]. However, these grading methods are limited to the scheduling and distribution of single-species emergency supplies. In reality, there are differences in the types of rescue personnel and supplies needed at each disaster site, and the demand urgency of each category group does not accurately reflect that of individual disaster sites, which is not conducive to the distribution of supplies based on the demand urgency of a single disaster site. There are fewer studies directly grading the demand urgency for individual disaster sites, and they mainly utilize the analytic hierarchy process and entropy weight methods to assess the demand urgency for disaster sites [29]. While practical and effective, these methods are highly subjective and prone to evaluation distortions. Therefore, developing a more scientific and realistic method for evaluating the demand urgency of disaster sites is of paramount importance.
In addition, international relief organizations in the new situation have increasingly emphasized the standardization of rescue forces at different levels and promoted the construction of mechanisms based on cooperation and coordination. At present, the research on emergency coordination can be categorized into qualitative studies, reserve studies, and portfolio optimization studies. To facilitate emergency response coordination, scholars have carried out qualitative research on information sharing in complex environments, liaison frameworks [30], and the models for selecting cooperating parties in disaster response environments based on game theory [31,32]. Regarding emergency coordination reserve research, relevant scholars have explored the profit distribution mechanisms of suppliers, the feasibility of cooperation [33], and the impact of suppliers’ strength on reserve ratios [34]. Procurement agreements with enterprises are recognized as suitable mechanisms for coordinating governmental and social forces [35]. Volume-flexible contracts have been proposed to coordinate the ordering activities of humanitarian organizations and enterprises [36,37,38]. To optimize allocation activities, reduce supply risks, and meet demand, relevant scholars have proposed two-stage decision-making models for site selection and procurement [39] and procurement and allocation [40]. However, these studies on emergency response coordination have primarily focused on pre-disaster procurement and post-disaster configuration phases, neglecting the overall coordination of the system. Therefore, considering the differences in labor division and coordinating actors, further research on the coordination of the emergency decision-making process is urgently needed.

1.2. Our Work

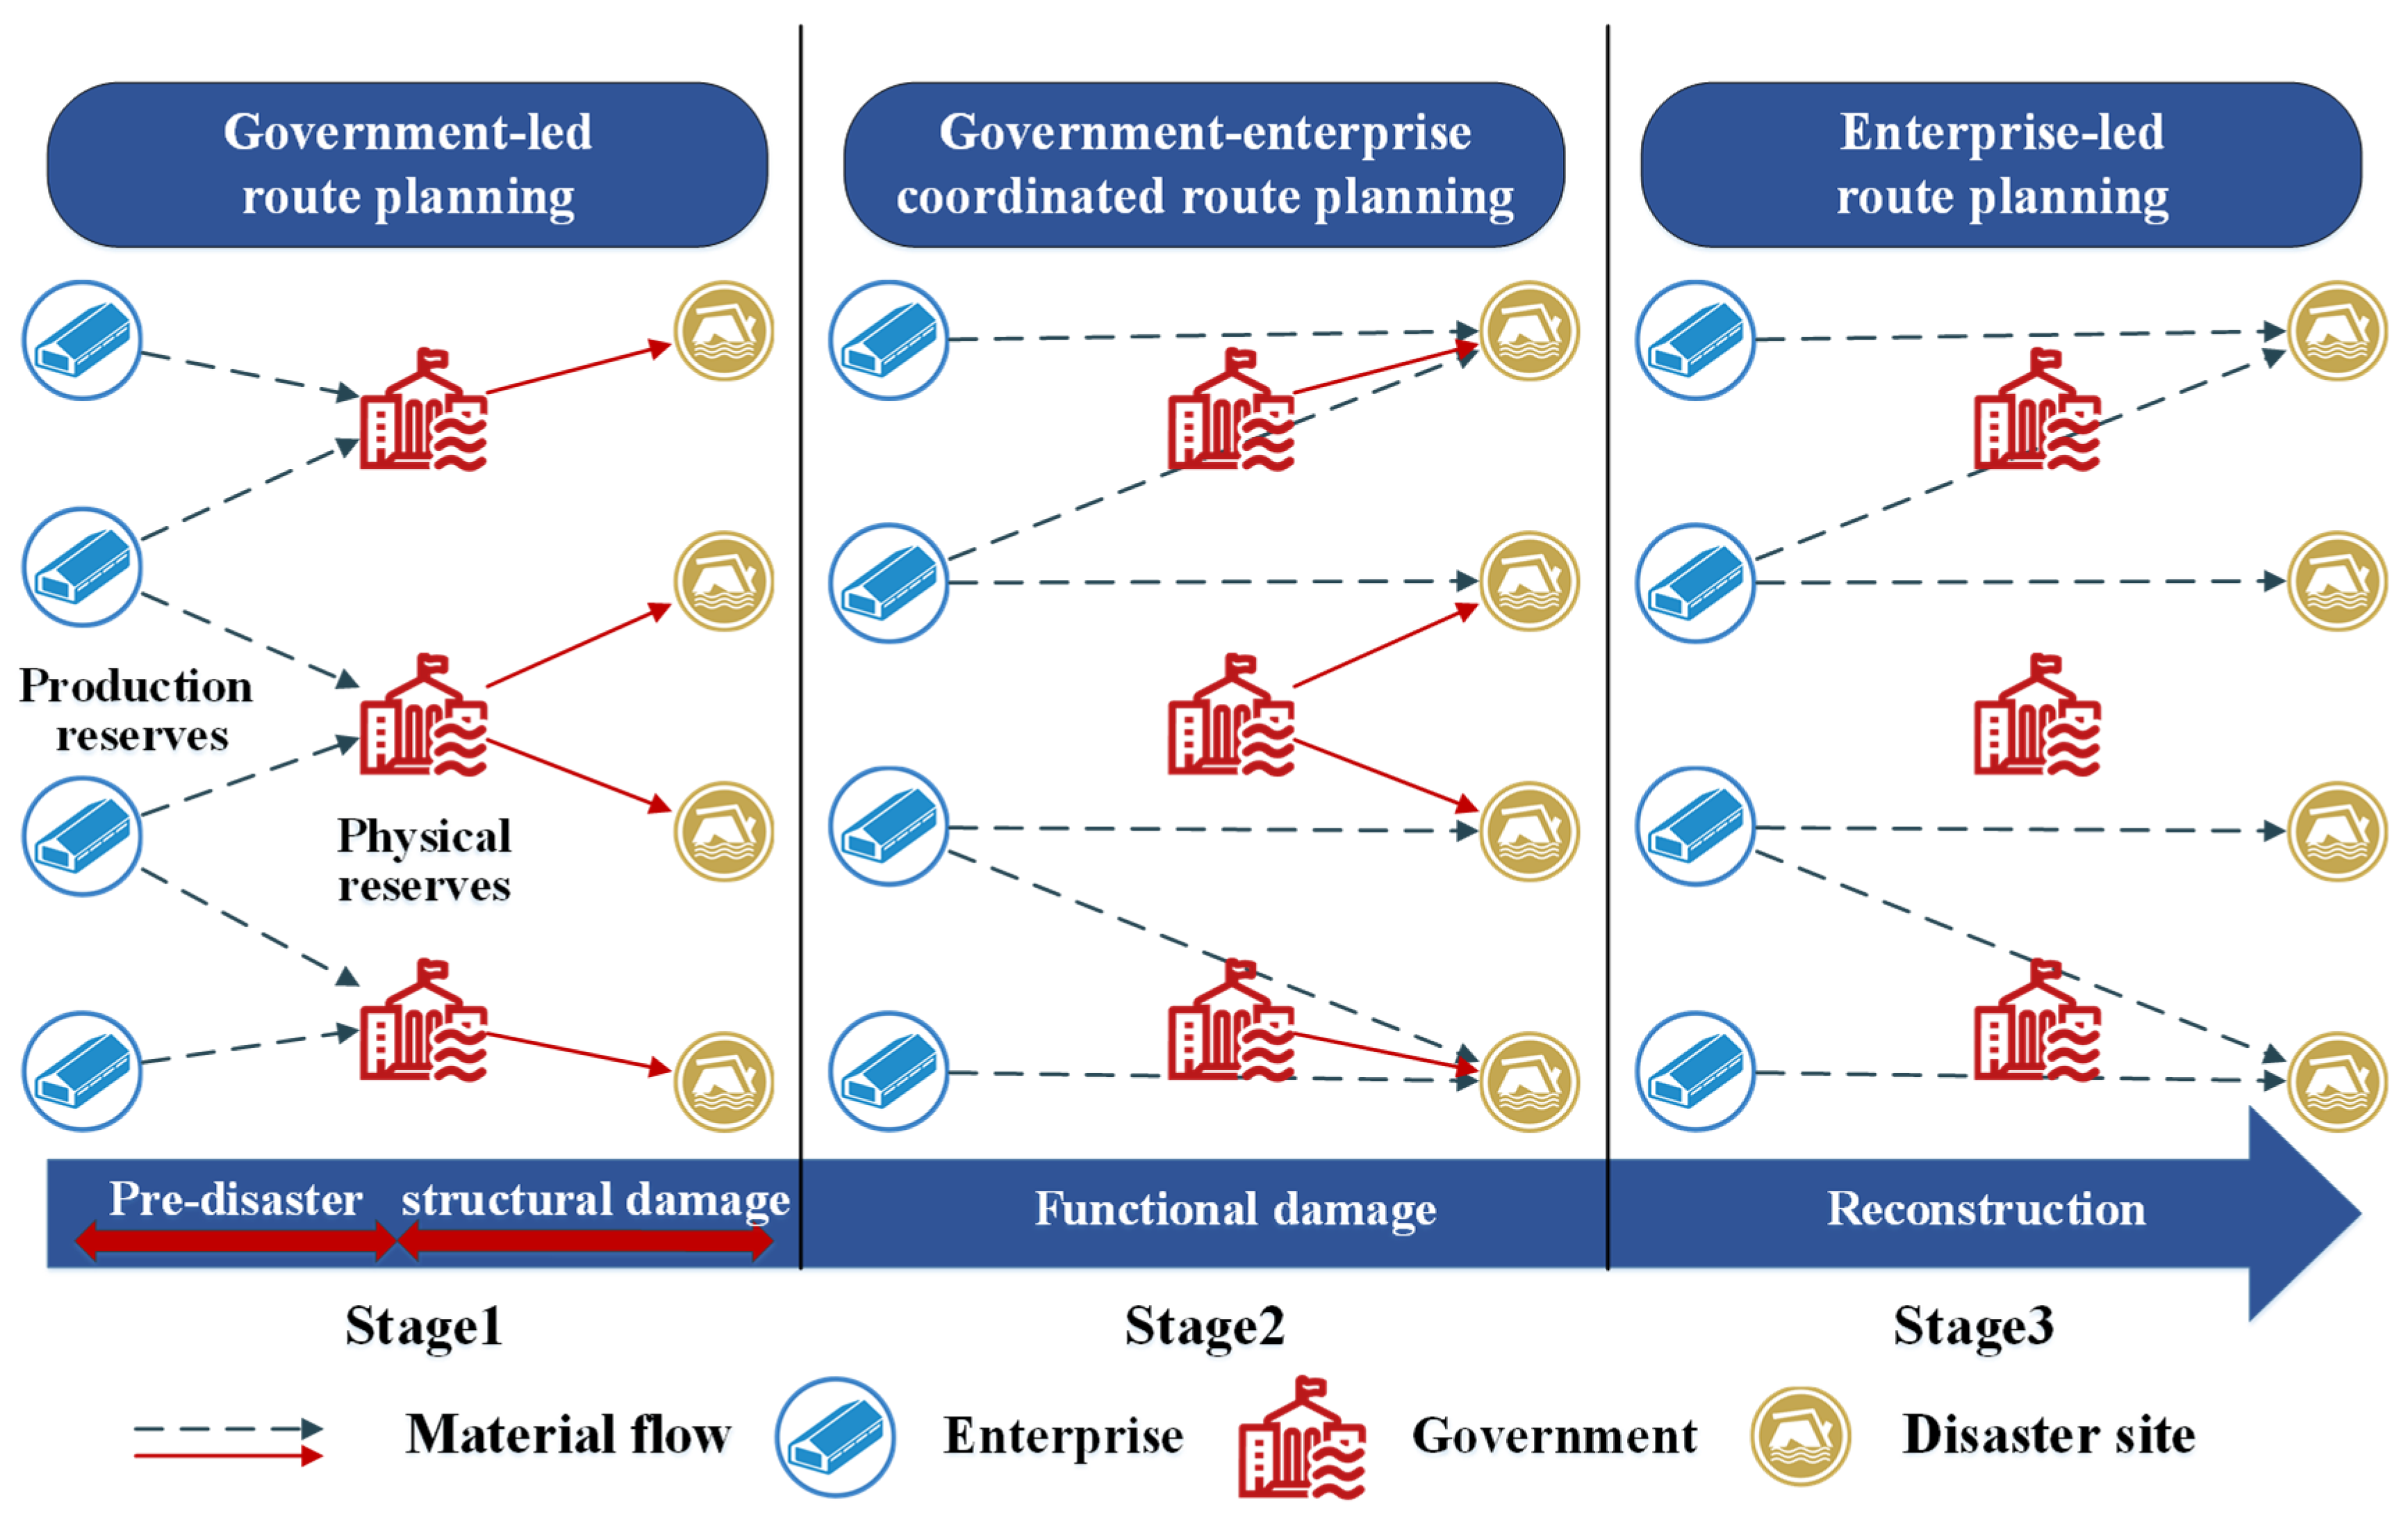
To overcome these limitations and address the identified research gaps, this paper introduces a novel dynamic route planning framework that explicitly incorporates (Figure 1): (1) A hybrid method (combining the Analytic Hierarchy Process, Entropy Weight Method, and Gray Relation Analysis-TOPSIS) for objective and quantitative assessment of demand urgency at individual disaster sites. This method balances subjective/objective weights via a parameter θ, with θ = 0.6 minimizing the MSE in a Hunan case study. (2) A government-enterprise collaboration strategy that leverages the strengths of both sectors across different disaster phases, utilizing flexible enterprise logistics for trans-regional routing. (3) A dynamic routing model with multiple distribution conditions (including splitting, soft time windows, open scheduling), optimized via a two-stage cellular genetic algorithm. This model addresses the limitations of traditional algorithms in handling the dynamic evolution of post-disaster needs and multi-agent coordination.

2. Materials and Methods

2.1. The Evaluation Framework of the Demand Urgency at Disaster Sites

Assessing the demand urgency at individual disaster sites presents a complex multi-criteria decision-making challenge involving both quantitative metrics (e.g., rainfall, affected population) and qualitative/fuzzy assessments (e.g., stacking risk, disaster resilience), with potential interdependencies among the criteria. To tackle these challenges comprehensively and robustly, a hybrid approach combining the Analytic Hierarchy Process (AHP), Entropy Weight Method (EWM), and GRA-TOPSIS method is adopted. The rationale for this integration is as follows: AHP [41] is crucial for capturing expert knowledge and structuring the relative importance of qualitative/fuzzy criteria, which are prevalent in disaster assessments. However, relying solely on AHP’s subjective weights can introduce bias. Therefore, EWM [42] is employed to derive objective weights based on the inherent information entropy of quantitative data, counterbalancing potential subjectivity. The integrated weight (Equation (7), which combines AHP and EWM weights through a parameter θ, aims to achieve a balanced representation of expert judgment and data-driven objectivity [43,44]. Finally, GRA-TOPSIS is utilized for ranking. Traditional TOPSIS, which relies on Euclidean distance, assumes criterion independence, which is a premise that may not hold in this context (e.g., heavy rainfall influences both the affected area and population). GRA effectively measures the geometric similarity (relational grade) between evaluation sequences and ideal solutions, being less sensitive to potential criterion correlations. By substituting Euclidean distances in TOPSIS with GRA relational grades (Equations (15) and (16)), GRA-TOPSIS leverages the strengths of both methods. Compared to simpler combinations (e.g., AHP-TOPSIS, EWM-TOPSIS) or standalone methods, this hybrid approach systematically addresses the need for integrating subjective expertise, objective data, balanced weighting, and correlation handling, and it is thus deemed superior for assessing the unique urgency profile of each disaster site in this study.

2.1.1. Analytic Hierarchy Process

The AHP is a quantitative descriptive method of subjective judgment that evaluates the importance of systematic indicators that affect the demand urgency. Considering the situation caused by natural disasters and the results of existing research, the criteria affecting the demand urgency are categorized into three major groups: environmental factors, demographic factors, and facility factors. A system of indicators and a hierarchical structure model affecting demand urgency are established (Figure 2). The judgment matrix of the indicator system is constructed using the 1–9 scale method, and the weight vector of each indicator is calculated under the premise of satisfying consistency.

2.1.2. Entropy Weight Method

EWM is an objective approach that assigns weights based on the variability or dispersion of indicators, reflecting their contribution to demand urgency, and the specific calculation steps are as follows:
Step 1: Indicators such as rainfall, stacking risk, affected area, total population, affected population, vulnerable population, level of damage, and disaster resilience are denoted as C = C j , j = 1 ,   2 , ,   8 . Data for the indicator j is x i j in Equation (1), with a total of n disaster sites and m evaluation indicators.
V = x 11 x 12 x 1 m x 21 x 22 x 2 m x n 1 x n 2 x n m
Step 2: Before establishing the model, it is necessary to positively normalize all the indicators, and through the conversion function, unify the evaluation indicators of the demand urgency into an extremely large one in Equation (2). After positively normalizing the negative indicators, V will be standardized to the interval [0.002, 1]. Normalization results in the matrix R in Equation (3). The entropy Hj of the indicator j is defined to indicate the disorder of the indicator system in Equations (4)–(6), where pij indicates the contribution of the disaster site i under the indicator j.
r i j = m a x x i j x i j
R = r 11 r 12 r 1 m r 21 r 22 r 2 m r n 1 r n 2 r n m
H j = k i = 1 n p i j ln p i j
p i j = r i j i = 1 n r i j
k = 1 ln n
Step 3: Weights are determined by integrating AHP and EWM results (Equations (7)–(9)), where W j denotes the integrated weight combining AHP and EWM, W u is the eigenvector of the judgment matrix in AHP. K j is the weight of the evaluation indicator in EWM. g j signifies the redundancy of information entropy.
W j = θ W u + 1 θ K j
K j = g j j = 1 m g j
g j = 1 H j
The weight coefficient θ in Equation (7) balances subjective expertise (AHP) and objective data (EWM) in multi-criteria decision-making. According to the Dempster-Shafer theory, θ quantifies the belief function of expert knowledge in uncertain environments. In emergency logistics, where disaster severity involves fuzzy judgments (e.g., stacking risk, disaster resilience), θ balances the need for expert-driven prioritization with data-driven objectivity, aligning with evidence combination principles in decision theory, where conflicting information sources are integrated via weighted aggregation.

2.1.3. GRA-TOPSIS Method

The gray relation analysis (GRA) is a quantitative analysis model to determine the impact of each indicator on the target series by comparing the similarity of each series to the changes in the target series data. The TOPSIS method is a multi-objective decision-making method that utilizes raw data information to reflect the gaps between evaluation options, using the distance from the indicator set to the ideal optimal option as the basis for evaluation [45]. The GRA-TOPSIS method integrates these approaches to assess the relevance of indicator sets to the optimal solution and determine the demand urgency score and ranking. The specific calculation steps are as follows:
Step 1: Construct the weighted canonical matrix Z by Equation (10), and compute the negative and positive ideal solutions of the matrix by Equations (11) and (12).
Z = r 11 r 12 r 1 m r 21 r 22 r 2 m r n 1 r n 2 r n m W J 1 0 0 0 W J 2 0 0 0 W J n = z 11 z 12 z 1 m z 21 z 22 z 2 m z n 1 z n 2 z n m
Z = min j   z i 1 , min j   z i m = Z 1 , Z m i = 1 , 2 n
Z + = max j   z i 1 , max j   z i m = Z 1 + , Z m + i = 1 , 2 n
Step 2: Calculate the gray relational degree of the indicator set relative to the negative and positive ideal solutions for each disaster site by Equations (13) and (14), where ρ is the discrimination coefficient, ρ 0 ,   1 . θ and θ + are the correlation matrices between the indicator sets and the ideal solutions, respectively. d i and d i + are the correlations between the indicator sets and the ideal solutions, respectively, in Equations (15) and (16).
θ i j = min i   min j Z j z i j + ρ   max i   max j Z j z i j Z j z i j + ρ   max i   max j Z j z i j
θ i j + = min i   min j Z j + z i j + ρ   max i   max j Z j + z i j Z j + z i j + ρ   max i   max j Z j + z i j
d i = 1 n j = 1 n θ i j
d i + = 1 n j = 1 n θ i j +
Step 3: Compute the gray relational closeness between the ideal solution and the indicator set by Equation (17), where S i is the evaluation score of the demand urgency at the disaster site. Following normalization, when d i + is smaller and S i is larger, the gap between the sample and the optimal solution is smaller, and the demand urgency is lower.
S i = d i d i + + d i , 1 i n

2.2. Government-Enterprise Collaboration Strategy in the Post-Disaster

Emergency supplies distribution operations in the post-disaster are faced with a limited number of supplies and competition for supplies in the disaster area, so how to provide sufficient quantities of emergency supplies at the time and place needed has become a key issue. These supplies are sourced from government reserves, social donations, market procurement, and other ways. Given the varying emergency demand and supply characteristics at different disaster stages, it is essential to establish a synergistic strategy between government and enterprises through volume-flexible contracts to mitigate supply disruption risks [46,47]. Disaster emergency response can be categorized into three phases based on disaster progression, which are the structural damage, the reconstruction phase, and the functional damage [48]. Emergency allocation operates in either a “push mode” or a “pull mode”, depending on the supply source and deployment process. Considering the transportation network involving multiple emergency facilities and disaster sites, a government-enterprise collaboration strategy is designed, aligning with natural disaster evolution patterns and supply-demand dynamics (Figure 3). In the post-disaster phase of structural damage, the government leads route planning of emergency vehicles. During the functional disruption phase, the work is coordinated between the government and enterprises. During the reconstruction phase, enterprises are responsible for regularizing supply at the affected sites, improving system resilience and achieving demand orientation.

2.3. Dynamic Route Planning Model of Emergency Vehicles

Route planning of emergency vehicles under the background of natural disasters is faced with realistic emergency requirements such as demand splitting, soft time windows, and open scheduling. Vehicles are subject to maximum load and continuous driving time constraints. Disaster sites may require multiple distribution services over time. A dynamic route planning model of emergency vehicles was established considering dispatch time, delay losses, and unmet demand rates. The model defines objective functions and distribution conditions to ensure effective emergency scheduling amid intense material and transportation flows.

2.3.1. Demand Splitting Strategy

Based on the loading limit of emergency vehicles and the reality of demand at the disaster site, the demand splitting strategy for the disaster site was formulated in Equation (18), where N is the number of times the demand is split, d i is the demand for supplies at the disaster site, Q m is the rated load of the vehicle m . When d i Q m , no demand splitting is required: d i = d i . When d i > Q m , the initial demand is split d i : Q m 1 , Q m 2 , , Q m n , d i / Q m , n N 1 .
N = 0 , d i Q m d i Q m , d i > Q m

2.3.2. Presumptions

The modeling is based on the following assumptions:
  • The rated capacity of the emergency vehicles is known, and the demand at each affected site can be split to accommodate multiple delivery services.
  • Based on unilateral soft time windows, delivery services that exceed the time windows are penalized. Emergency vehicle paths are planned within decision cycles, and services are executed at affected sites.
  • The maximum continuous travel time for emergency vehicles is predetermined, and the planned travel time for any single path does not exceed the upper limit of vehicle travel time.
  • Emergency vehicles undertake multiple distribution routes. After completing a task, they stop at the last disaster point, awaiting nearby replenishment and secondary dispatch.

2.3.3. Sets, Parameters and Variables

This section outlines the sets, parameters, and variables used in the dynamic route planning model for emergency vehicles (Table 2).

2.3.4. Objectives

Emergency vehicle route planning is influenced by a variety of factors, and inadequate consideration of distribution conditions can hinder scheduling and compromise logistics timeliness. Therefore, the primary objective of route planning is to consider the optimization of the distribution conditions to provide supply distribution services, reduce dispatch time, and minimize delays as much as possible. Among them, the delay losses arise from incomplete distribution services within the time series or from exceeding the optimal service time at disaster sites. These losses are directly related to the quantity and timing of emergency supplies arriving at disaster sites, as well as the soft time windows.
The first objective function minimizes the total service time of the emergency vehicle in Equation (19). As illustrated in Figure 4, the composition of delay losses is presented. The second objective function works to minimize delay losses from distribution services in Equation (20), where maxti,cm−li,0 denotes the time when the vehicle arrives at disaster point i exceed the upper limit of the soft time window. When it occurs, a delay penalty is generated; otherwise, it is 0. ti,cm−ti,cm−1 calculates the time interval of the same disaster point i in adjacent distribution paths c and C-1 to reflect the fluctuation of rescue timeliness. The delay penalty considers either the time window delay or the distribution interval, whichever is smaller, to avoid excessive punishment. The third objective function seeks to minimize the unmet demand rate in Equation (21).
To optimize the model, the following three objective functions were defined in Equations (19)–(21).
f 1 = m i n C m V P u , v x c m u , v , t + I S i y c m i , t
f 2 = min I C m m i n m a x t i , c m l i , 0 , t i , c m t i , c m 1 × d i t C m y c m i , t d i t , c m
f 3 = m i n I C m d i t d i t , c m d i t

2.3.5. Constraints

Based on the objective function established above, the following constraints are defined.
I d i , h t , c m y c m i , t Q m , c m C m
V P u , v x c m u , v , t T m , c m C m
x c m u , v , t x c m v , w , t = 1 0 1 , c m C m
V M C m x c m u , i , t 1 , i I
M C m y c m i , t 1 , i I
x c m u , i , t y c m i , t , i I , c m C m
t v , c m = t u , c m + S u + P u , v x c m u , v , t , u , v V
x c m u , v , t , y c m i , t 0,1
Constraint 1 derives from the vehicle capacity limit (Assumption 1 & Demand Splitting). Constraint 1 indicates that the sum of distributed supplies on the path c m of the emergency vehicle m does not exceed its load capacity Q m in Equation (22). Constraint 2 derives from maximum continuous travel time (Assumption 3). Constraint 2 means that the passage time of an emergency vehicle m on the path c m does not exceed its maximum continuous travel time T m in Equation (23). Constraint 3 originates from flow conservation, which ensures that the emergency vehicle m departs from the emergency facility and eventually stops at the end-of-path node in Equation (24). Constraint 4 denotes at least one path to the disaster site in Equation (25). Constraint 5 indicates that each disaster site is served at least once in Equation (26). Constraint 6 represents that only the disaster site served by the path c m passes through the arc in which it is located in Equation (27). Constraint 7 derives from travel and service time calculation (from Problem Description & Time Definition). Constraint 7 represents the relationship between vehicle arrival times at different disaster sites in Equation (28), and the time when vehicles m start from the depot is 0. Constraint 8 states that the independent variables x C m u , v , t and y C m i , t are decision variables in Equation (29). Table 3 presents specific cases for Equations (18) and (22)–(28).

2.4. Solution Method

The emergency vehicle route planning model encompasses multiple distribution conditions. To address the uncertainty in dynamic vehicle paths and leverage local optimization strategies, a two-stage route planning algorithm has been devised, which possesses both the fast optimization-seeking capability of cellular genetic algorithms and the ability to handle multiple distribution conditions. The cellular structure, characterized by localized interactions within defined neighborhoods (e.g., Von Neumann or Moore neighborhoods), was selected to enhance population diversity and achieve a balanced exploration-exploitation trade-off. This is particularly vital for our problem, given its extensive search space, numerous constraints (including demand splitting, time windows, and open routes), and dynamic nature, which can lead to premature convergence in standard GAs or other population-based algorithms like PSO. The two-stage design aligns with the problem’s inherent structure: Stage 1 focuses on static initialization, involving demand splitting and urgency-based prioritization, while Stage 2 manages dynamic routing adjustments, vehicle redeployment based on real-time status, and the “nearby replenishment” mechanism. This separation enables tailored optimization strategies for each phase, which a unified algorithm might struggle to achieve.
(1)
The Route Planning Algorithm in the First Stage
Step 1: Table 4 presents the pseudo-code for the first stage. Distribution services are divided based on the quantitative relationship between emergency vehicle loads and disaster site demand. Considering demand urgency, chromosomes are constructed using natural number coding, generating an initial chromosome population i n i t c h r o m   p o p × N .
Step 2: Chromosome fitness is calculated based on the model’s objective function, and individuals with high fitness are selected through random traversal. The population undergoes genetic operations (OX crossover, mutation, neighborhood search, and recombination), and individuals that do not satisfy the model constraints are filtered out. The service sequence at disaster sites is segmented into chains using the insertion method.
Step 3: Iterations are repeated until a predetermined maximum number of iterations is reached or an optimal solution is found. The PF’s chromosome is decoded and used as input for the next stage, i.e., the first round of paths for emergency vehicles.
Table 4. Algorithm in the first stage.
The Route Planning Algorithm in the First Stage
Input:
P s i z e : population size;
N i t e r : number of algorithm runs;
c u s l i s t : affected point;
d m d : demand for emergency supplies;
c a p a c i t y : vehicle capacity;
U c u s : demand urgency of disaster point;
d e p o t N u m : number of emergency facilities;
r u n T : the longest continuous driving time;
T w : time;
t w : soft time window;
s : service time;
d i s t r i : transit time;
v e h i c l e N u m : number of emergency vehicles;
Split the disaster point:
For i = 1 : s i z e c u s l i s t , 2
d m d = d m d % c a p a c i t y ;
Disaster point information update, parameter information c u s l i s t , d m d , U c u s , t w , c u s l i s t , s ; d i s t r i ;
End for
Coding and population initialization:
For p s i z e = 1 : P s i z e
According to the natural number coding, P s i z e chromosome are generated to complete the population initialization.: C h r o m ;
End for
Genetic manipulation:
While g e n N i t e r
For p s i z e = 1 : P s i z e
Calculate y f p s i z e , perform genetic operations;
End for
Divide the path:
Choose the best chromosome, b e s t c h r o m ;
L i n = f i n d b e s t c h r o m > l e n g t h c u s l i s t ;
For k = 1 : s i z e ( L i n , 2 )
b e s t V R = b e s t c h r o m ( 1 : L i n ( 1 ) ) ;
b e s t V R = b e s t c h r o m ( L i n ( k 1 ) : L i n ( k ) ) ;
b e s t V R = b e s t c h r o m ( L i n ( k ) : L i n ( e n d ) ) ;
End for
End while
(2)
The Route Planning Algorithm in the Second Stage
Step 1: Table 5 outlines the pseudo-code for the second stage. Emergency vehicles are assigned to carry out supply distribution services based on the first round of routes. The service status of disaster sites, vehicle mission status, and model target values are updated accordingly, and the set of unserved disaster sites and remaining decision time are also refreshed. Vehicles wait at the last point of their service sequence for nearby replenishment and secondary dispatch.
Step 2: Following the principle of “first empty, first dispatched”, vehicles that have completed their tasks are reintroduced into service. Considering dynamic uncertainty information, the next assigned emergency vehicle, the emergency facility for replenishment, and the decision time starting point are determined based on the emergency facility layout and demand urgency. Unserved disaster sites are represented as gene expressions on chromosomes. The dispatch paths of emergency vehicles were optimized through genetic manipulation, constraint judgment, and objective function calculations. The disaster site receives multiple distribution services over time series.
Step 3: The service status of split disaster sites and vehicle mission status are updated until the emergency requirements of disaster sites are fully met, or a path that satisfies the constraints cannot be generated. The resulting routing scheme for emergency vehicles and the service scheme for disaster sites consider both overall efficiency and key rescue needs. At the same time, it analyzes whether current transportation resources can complete emergency distribution tasks in the disaster area and determines if additional transportation capacity is required.
Table 5. Algorithm in the second stage.
The Route Planning Algorithm in the Second Stage
information processing:
The initial path of the first stage is constrained by the distribution conditions, and the first round scheduling path of the emergency vehicle is obtained;
For i = 1 : s i z e ( c u s l i s t , 2 )
Record the service situation of the affected points and the split affected points [affected points, split the affected points, split the demand, split the affected points with the service, split the affected points without the service, did not meet the demand];
d i s a s t e r i n f o r = [ c u s l i s t , c u s l i s t , d m d , s e r v e c u s , u n s e r v e c u s , u n m e t ] ;
End for
For v = 1 : s i z e ( v e h i c l e N u m , 2 )
Record vehicle scheduling task information [vehicle serial number, stop node, end time];
f i n i s h V = [ v e h i c l e N u m , p a r k i , f i n i s h T ] ;
End for
While ~isempty u n s e r v e c u s
Based on information update, the subsequent scheduling path is planned for the vehicle f i n i s h T ( 1,1 ) that ends the scheduling task earliest;
Proximity replenishment mechanism r e t u r n = m i n d i s t r i 1 : d e p o t N u m , f i n i s h T 1,3 + d e p o t N u m ;
Choose the emergency facility to go to the replenishment d e p o t s ;
The unserviced affected points plan the path one by one, and the emergency vehicles are put into circulation;
Genetic manipulation:
While l e n g t h ( r o u t e ) l e n g t h ( u n s e r v e c u s )
Based on the demand urgency of the affected point, the chromosome of the path is constructed;
End while
For p s i z e = 1 : P s i z e
Calculate y f p s i z e , perform genetic operations;;
End for
Choose the best chromosome, b e s t c h r o m ;
information updating:
Update the service situation of the disaster point, vehicle scheduling task information and possible dynamic information;
End while

2.5. Study Area and Data

2.5.1. Study Area

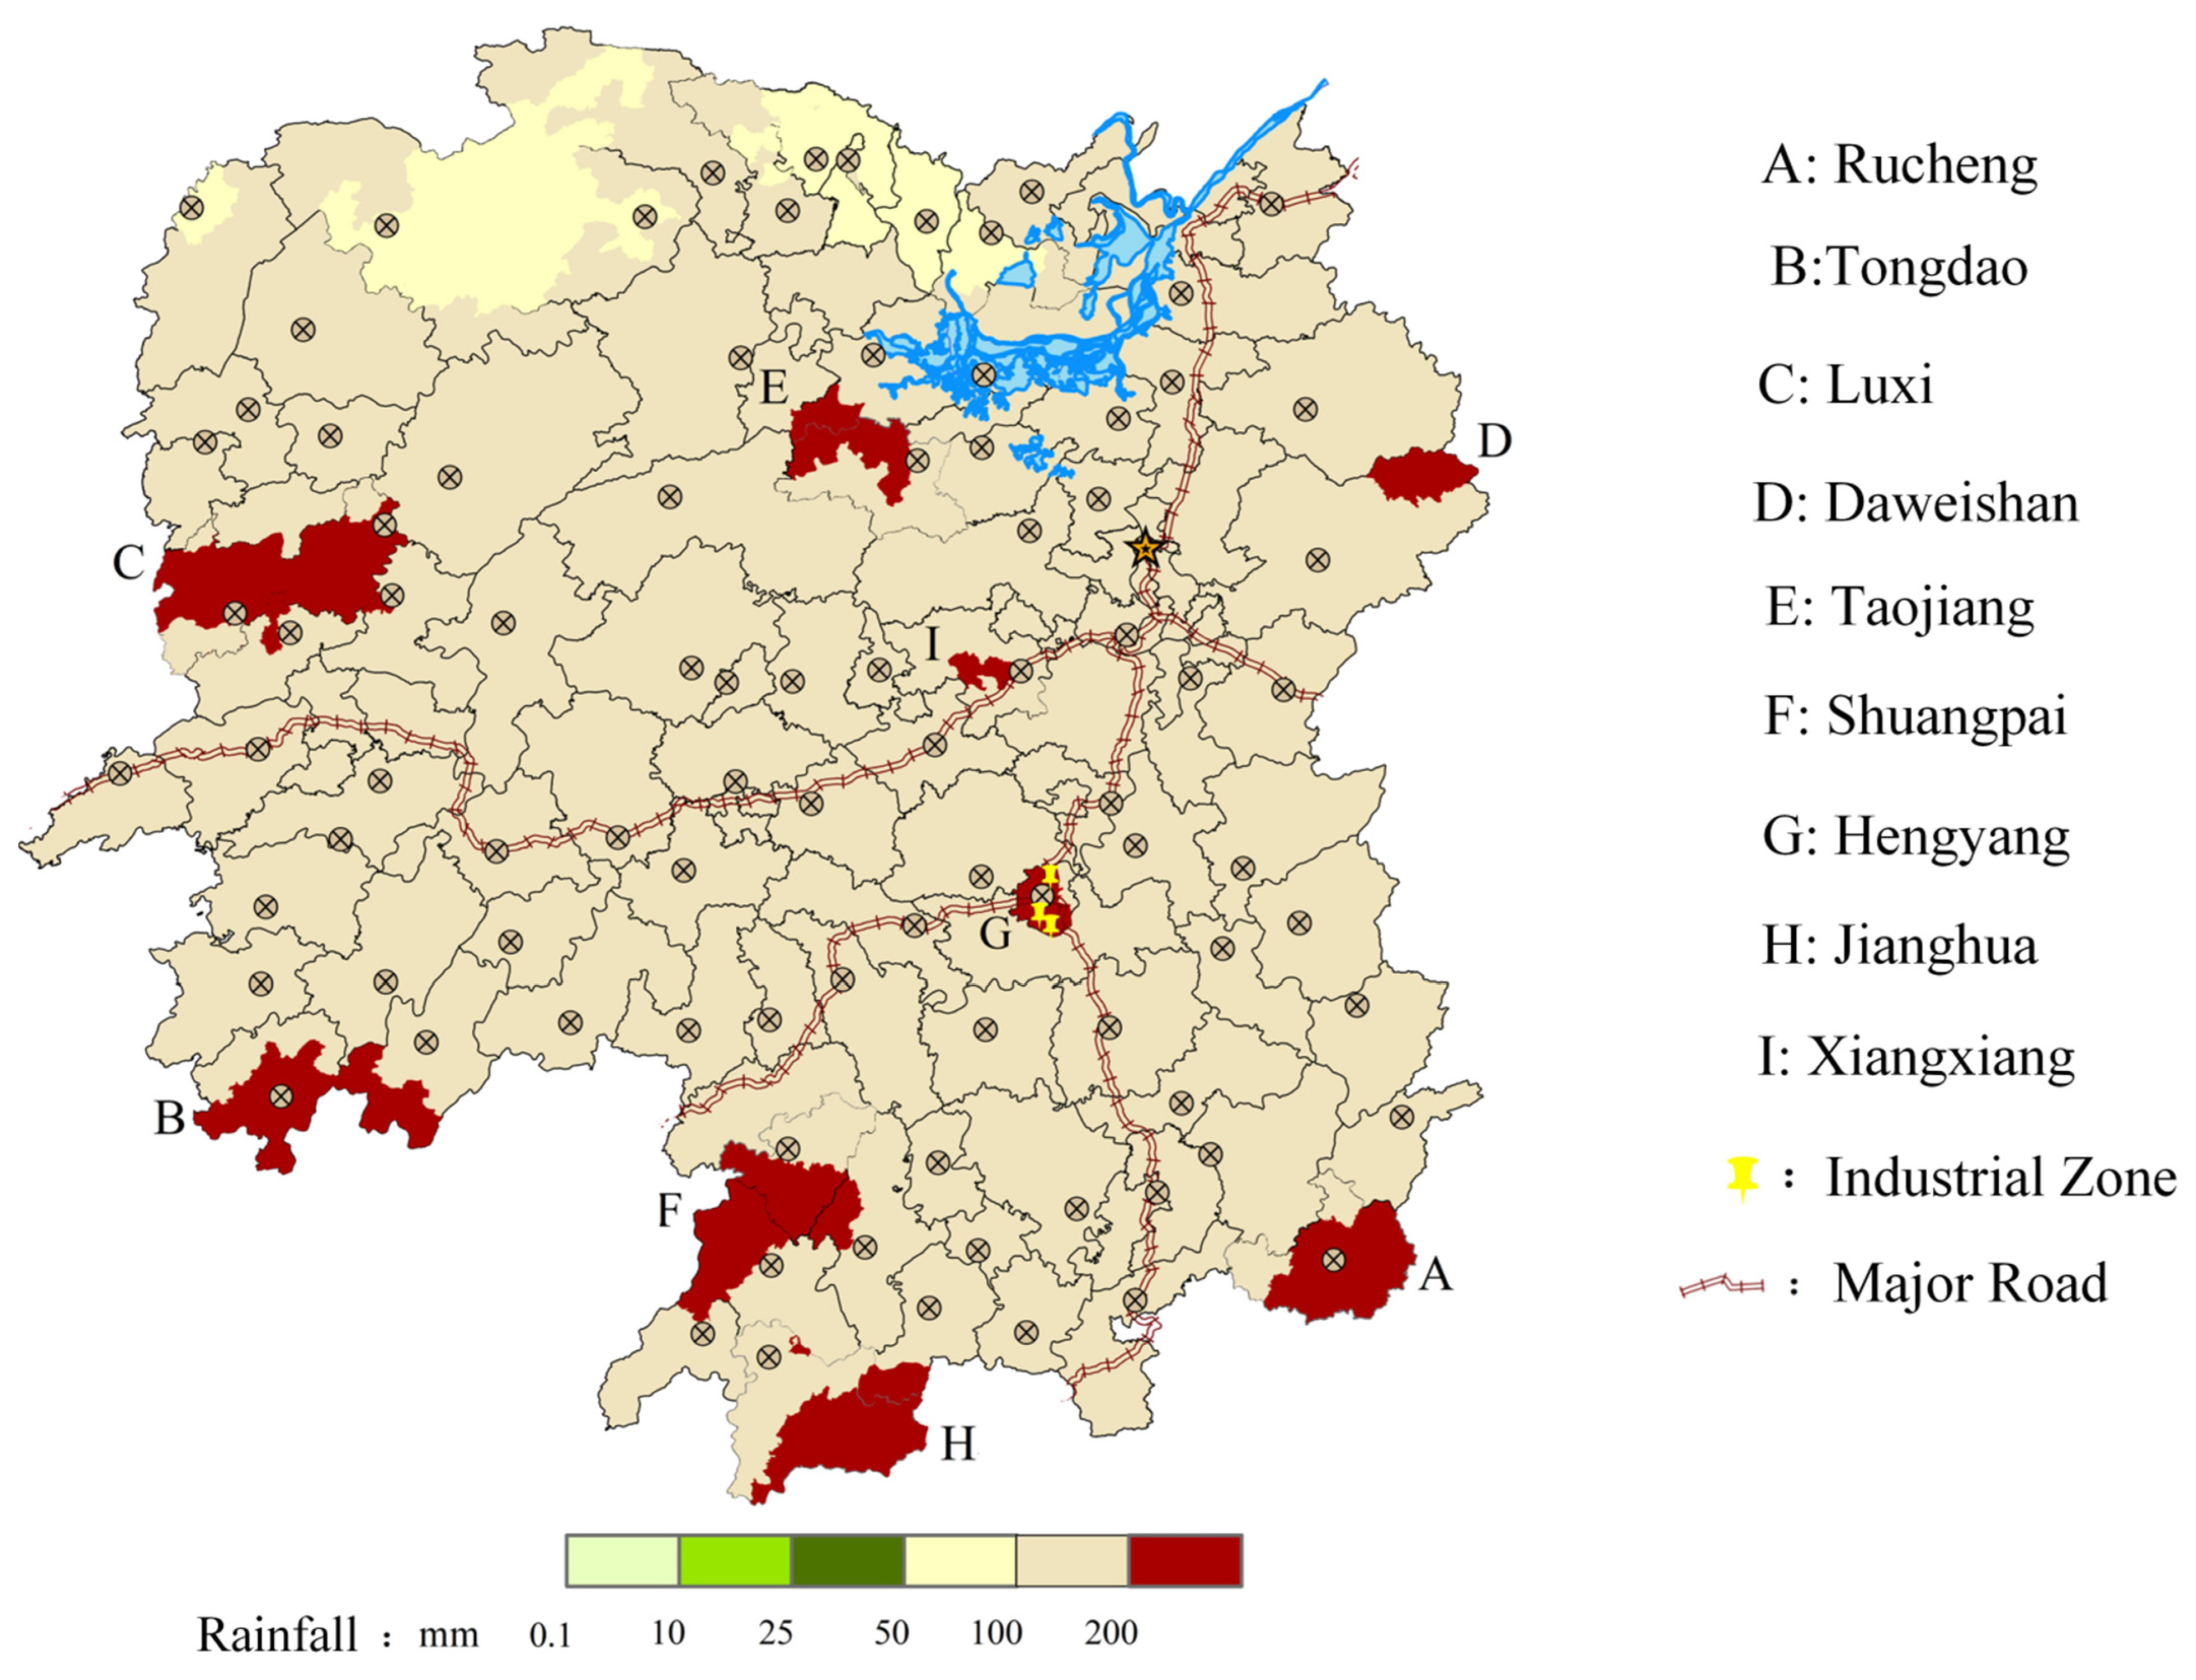
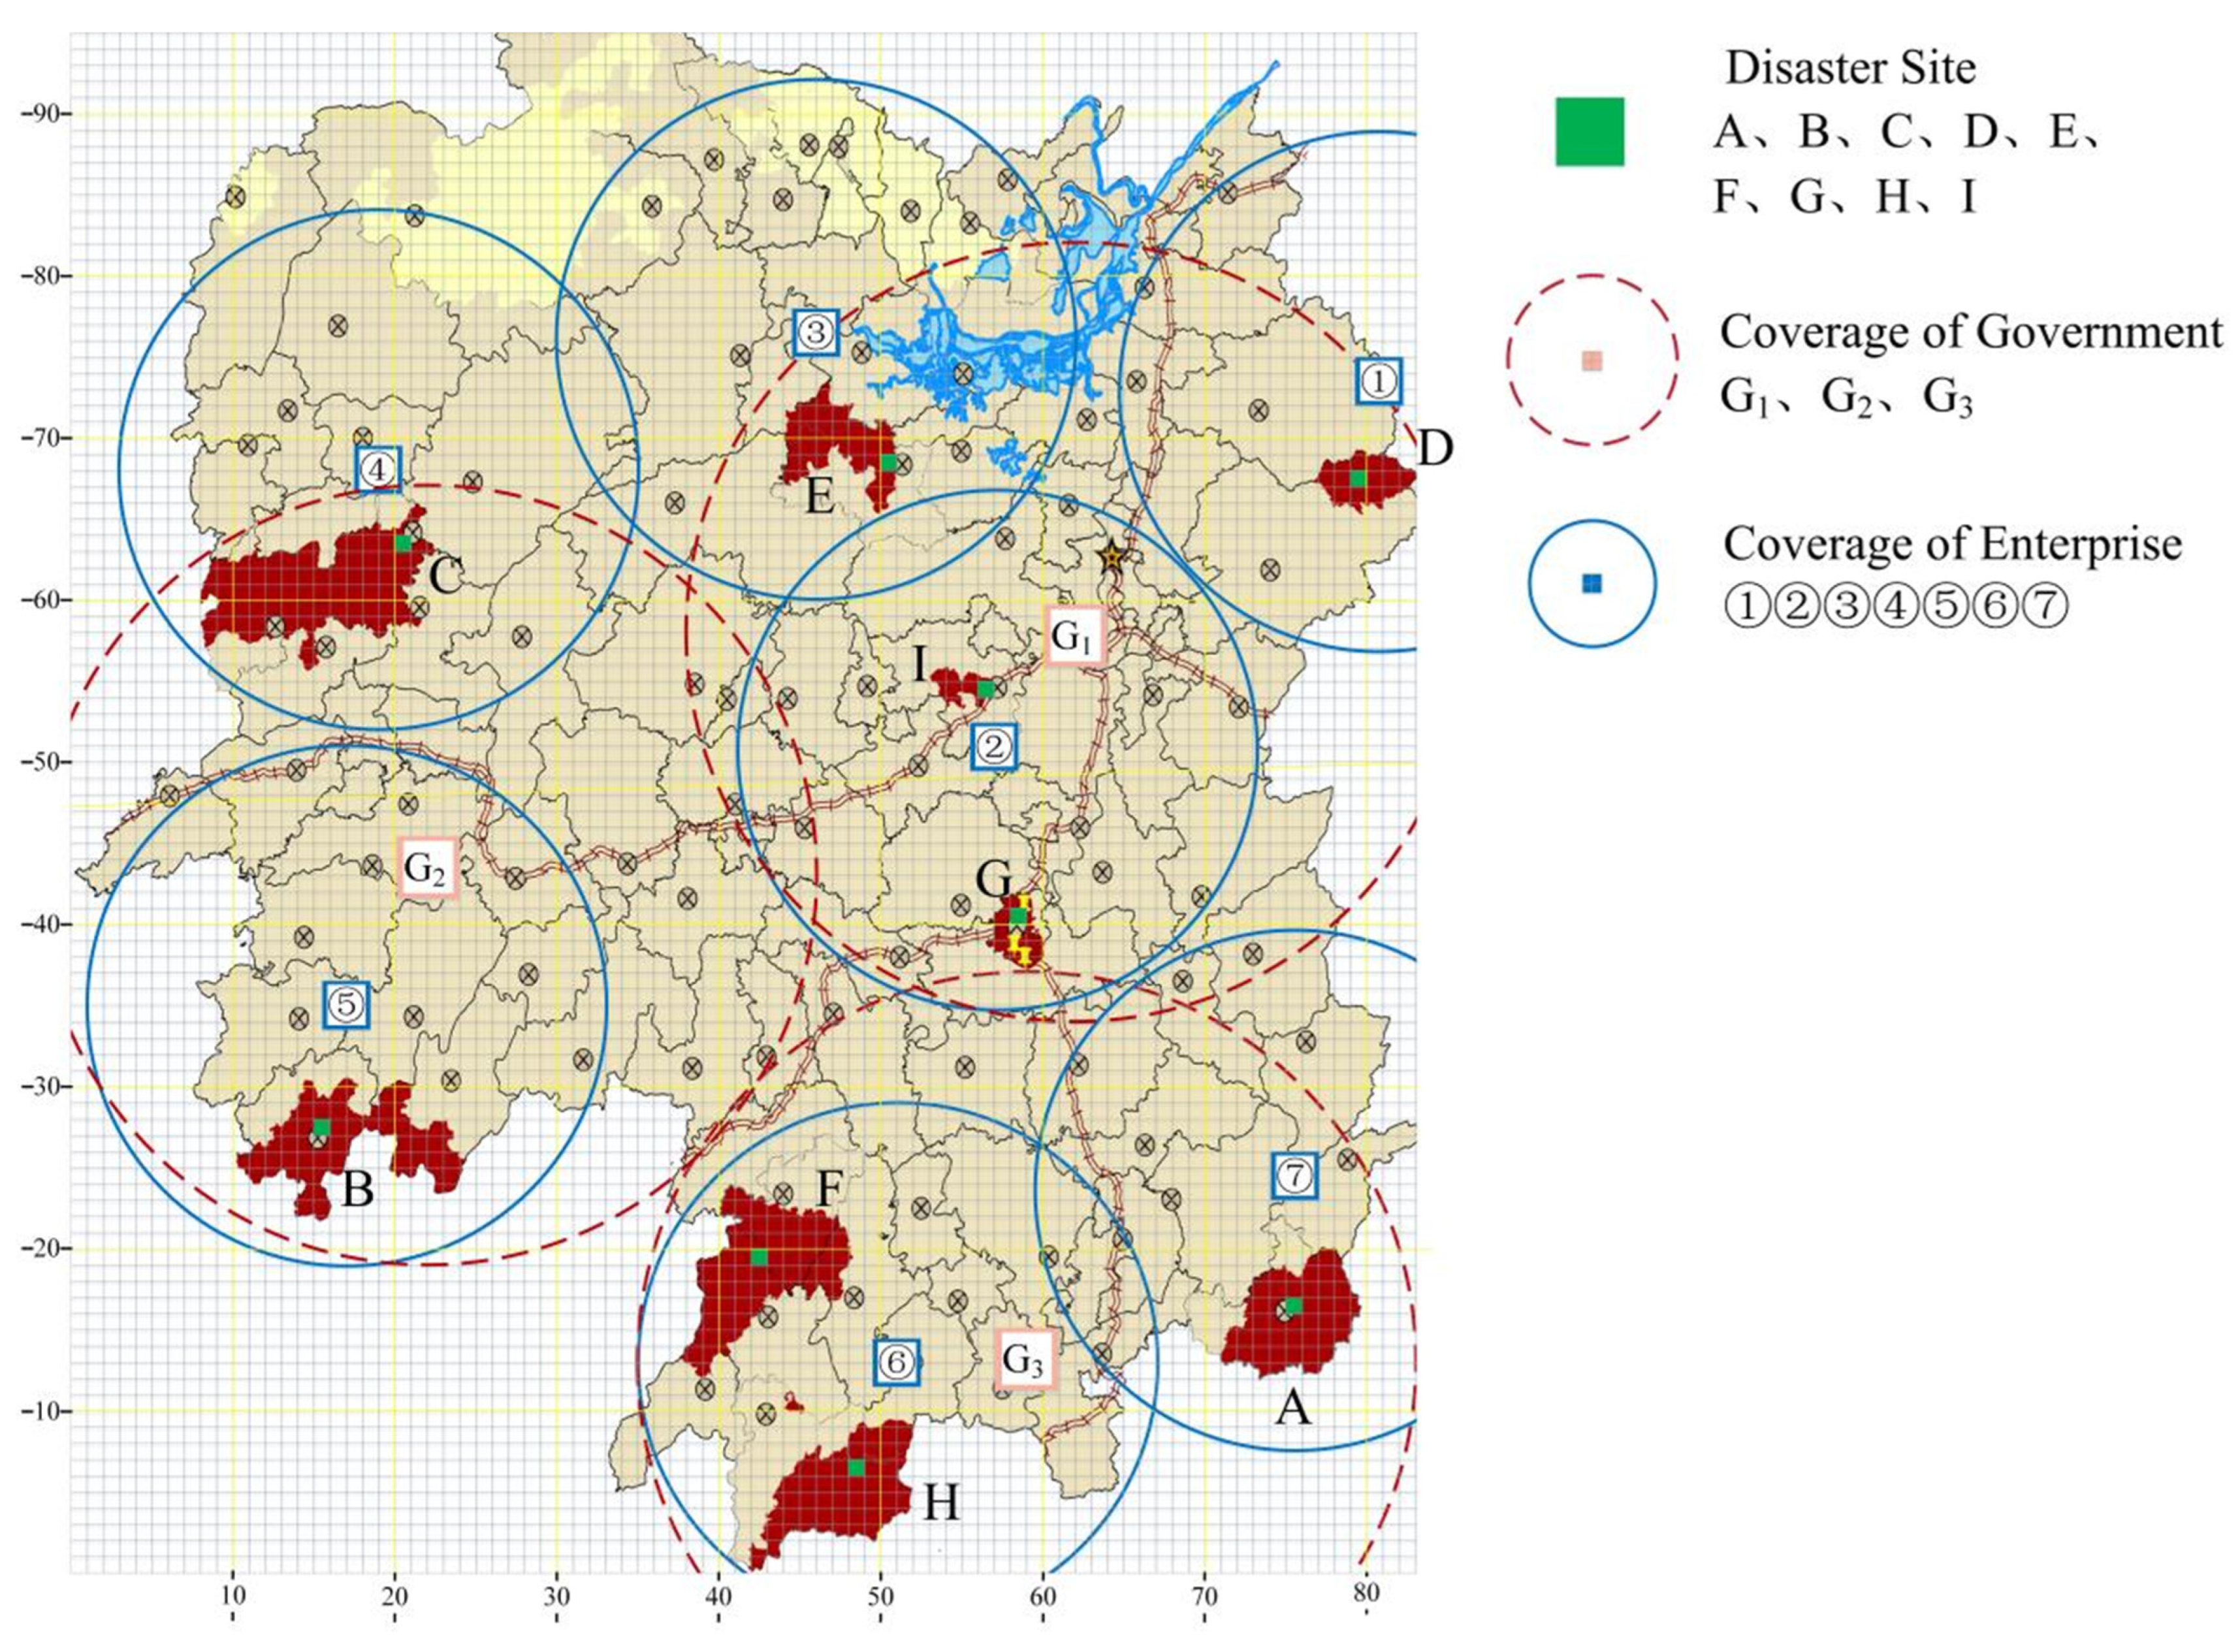
Hunan Province is one of the regions in China most severely impacted by natural disasters, with a wide range of disaster types and a challenging task in disaster prevention and control. Based on historical disaster frequency (priority is given to counties with ≥3 flood disasters in the past 10 years), geographical diversity (covering mountains, hills, and plains), and socio-economic characteristics (including different population densities), nine potential disaster-affected points were selected for dynamic emergency vehicle route planning research, which ensures representation of diverse terrains and urban-rural differences. The distribution of the affected area is illustrated in Figure 5, and the study area was discretized into a two-dimensional grid of 97 × 84, with each grid cell measuring 8 km per side.
To comprehensively evaluate the efficiency gains from government-enterprise collaboration, 30 independent simulation runs were conducted for government-led, government-enterprise coordinated, and enterprise-led route planning scenarios under identical disaster conditions. Key metrics recorded for each run included total supplies delivered, unit transportation time, demand satisfaction rate, and so on.

2.5.2. Data

Building on previous group research, a multi-objective emergency facility siting strategy and an emergency supply strategy were devised within the context of government-enterprise collaboration. Referring to [49], the layout of emergency facilities includes three government reserves and seven enterprise production sites (Figure 6), with their centers located at coordinates (62, 59), (23, 43), (59, 13), (81, 74), (57, 51), (46, 77), (19, 69), (18, 35), (51, 13), and (76, 25) respectively. Emergency supply requirements for each disaster site across three phases are detailed in Table 6.
According to the research on the evaluation of demand urgency in Section 2.1, AHP, EWM, and GRA-TOPSIS methods are used to quantitatively rank the demand urgency of the disaster sites. Indicator data for potential flooding in Hunan Province is presented in Table 7. Rainfall data were sourced from the Hunan Provincial Emergency Management Department’s special column for June 2022, while affected area and total population data were obtained from the official government website. The affected population, vulnerable population, and damage degree are found in the public information of historical flood disasters. Disaster resistance was assessed based on the establishment of flood control and drought relief headquarters, convenient transportation conditions (e.g., Hengyang County and Xiangxiang City’s locations on Hunan’s main roads), and differentiated support policies in ethnic areas. Stacking risk and disaster resilience were considered fuzzy indicators, with a grading basis designed as follows: Level I for weak, Level II for moderate, and Level III for robust. According to the “Hunan Province’s 14th Five-Year Plan for the Prevention and Control of Geological Disasters (2021–2025)”, Rucheng and Xiangxiang were identified as high-probability flash flood areas, assigning them a level I stacking risk. Shuangpai is located in an area where flash flooding is likely to occur, so its stacking risk is defined as Level II. The stacking risk of the remaining affected areas is defined as level III. Hengyang and Xiangxiang, located on Hunan’s main transportation routes, were assigned Level III disaster resilience. Relevant government documents in Hunan Province proposed differentiated support for ethnic minorities, thus defining the disaster resilience of Tongdao and Jianghua as level II. The disaster resilience of the remaining affected areas is defined as level III.
Using AHP from Section 2.1.1, indicator weights were calculated as: W u = (0.285, 0.210, 0.021, 0.037, 0.191, 0.118, 0.060, 0.077), passing the consistency test ( C R = 0.0943 < 0.10 ). Rainfall, stacking risk, affected population, and vulnerable population were found to be more important in demanding urgency. Based on EWM from Section 2.1.2, the system entropy was calculated as H j = (0.918, 0.878, 0.907, 0.947, 0.893, 0.925, 0.910, 0.616), with disaster resilience showing the smallest entropy value, indicating greater indicator discreteness. Combined AHP and EWM weights were W j = (0.224, 0.184, 0.042, 0.042, 0.166, 0.105, 0.069, 0.168), highlighting rainfall, stacking risk, disaster resilience, and affected populations as key influencers of demand urgency. In order to verify the sensitivity of the model, the parameter θ (0.4–0.8) was adjusted. The results showed that the maximum influencing factor of demand urgency has not changed, indicating that the model is not sensitive to parameter changes. The setting of θ = 0.6 is based on the pre-experiment. When θ < 0.5, objective weight dominance led to resilience index underestimation (low entropy value). When θ is 0.7, the subjective weight is too high, which may introduce expert bias. θ = 0.6 minimizes the mean square error (MSE = 0.021) in the Hunan case. As shown in Table 8, it presents the comparison of weighting methods for urgency assessment. The hybrid weighting method can effectively balance subjectivity and objectivity. In the presence of noise in the data, the hybrid weighting method exhibits the best stability (coefficient of variation of 0.09) and is suitable for dynamic disaster scenarios.
Based on the GRA-TOPSIS method from Section 2.1.3, gray relations of the indicator set to negative and positive ideal solutions were obtained as d i = (0.1053, 0.1119, 0.1158, 0.1186, 0.1200, 0.1176, 0.1199, 0.1231, 0.1212) and d i + = (0.1146, 0.1067, 0.1074, 0.1078, 0.1063, 0.1069, 0.1001, 0.1020, 0.1039). The indicators of Hengyang, Jianghua, and Xiangxiang were far from the negative ideal solution and close to the positive ideal solution in the meantime, so they belong to the disaster sites with better disaster resilience. The demand urgency of scores for each disaster site was S i = (0.1015, 0.1085, 0.1100, 0.1110, 0.1124, 0.1111, 0.1155, 0.1159, 0.1141). The order of demand urgency from high to low is Rucheng, Tongdao, Luxi, Daweishan, Shuangpai, Taojiang, Xiangxiang, Hengyang, and Jianghua. Considering demand urgency, soft time windows at disaster sites were set to 360 min, 372 min, 388 min, 482 min, 448 min, 432 min, 504 min, 530 min, and 494 min, respectively. Vehicle travel times were determined based on GPS positioning information. The initial response decision for most natural disasters requires completing the first round of resource deployment within 12 h [44]. The decision cycle is set to 720 min. According to the “Regulations for the Implementation of the Road Traffic Safety Law of the People’s Republic of China”, the driver’s continuous driving time shall not exceed four hours. Setting the vehicle’s maximum continuous travel time to 480 min (total round-trip time). The vehicle loading capacity was set at 20 units.

3. Results

Taking potential flooding in Hunan Province as background, the scientific validity and effectiveness of the model and algorithm are verified through a series of numerical studies. The studies delved into the realization of constrained distribution conditions, vehicle scheduling characteristics influenced by subject behavior, and the dynamic robustness of route planning.

3.1. Government-Led Route Planning of Emergency Vehicles

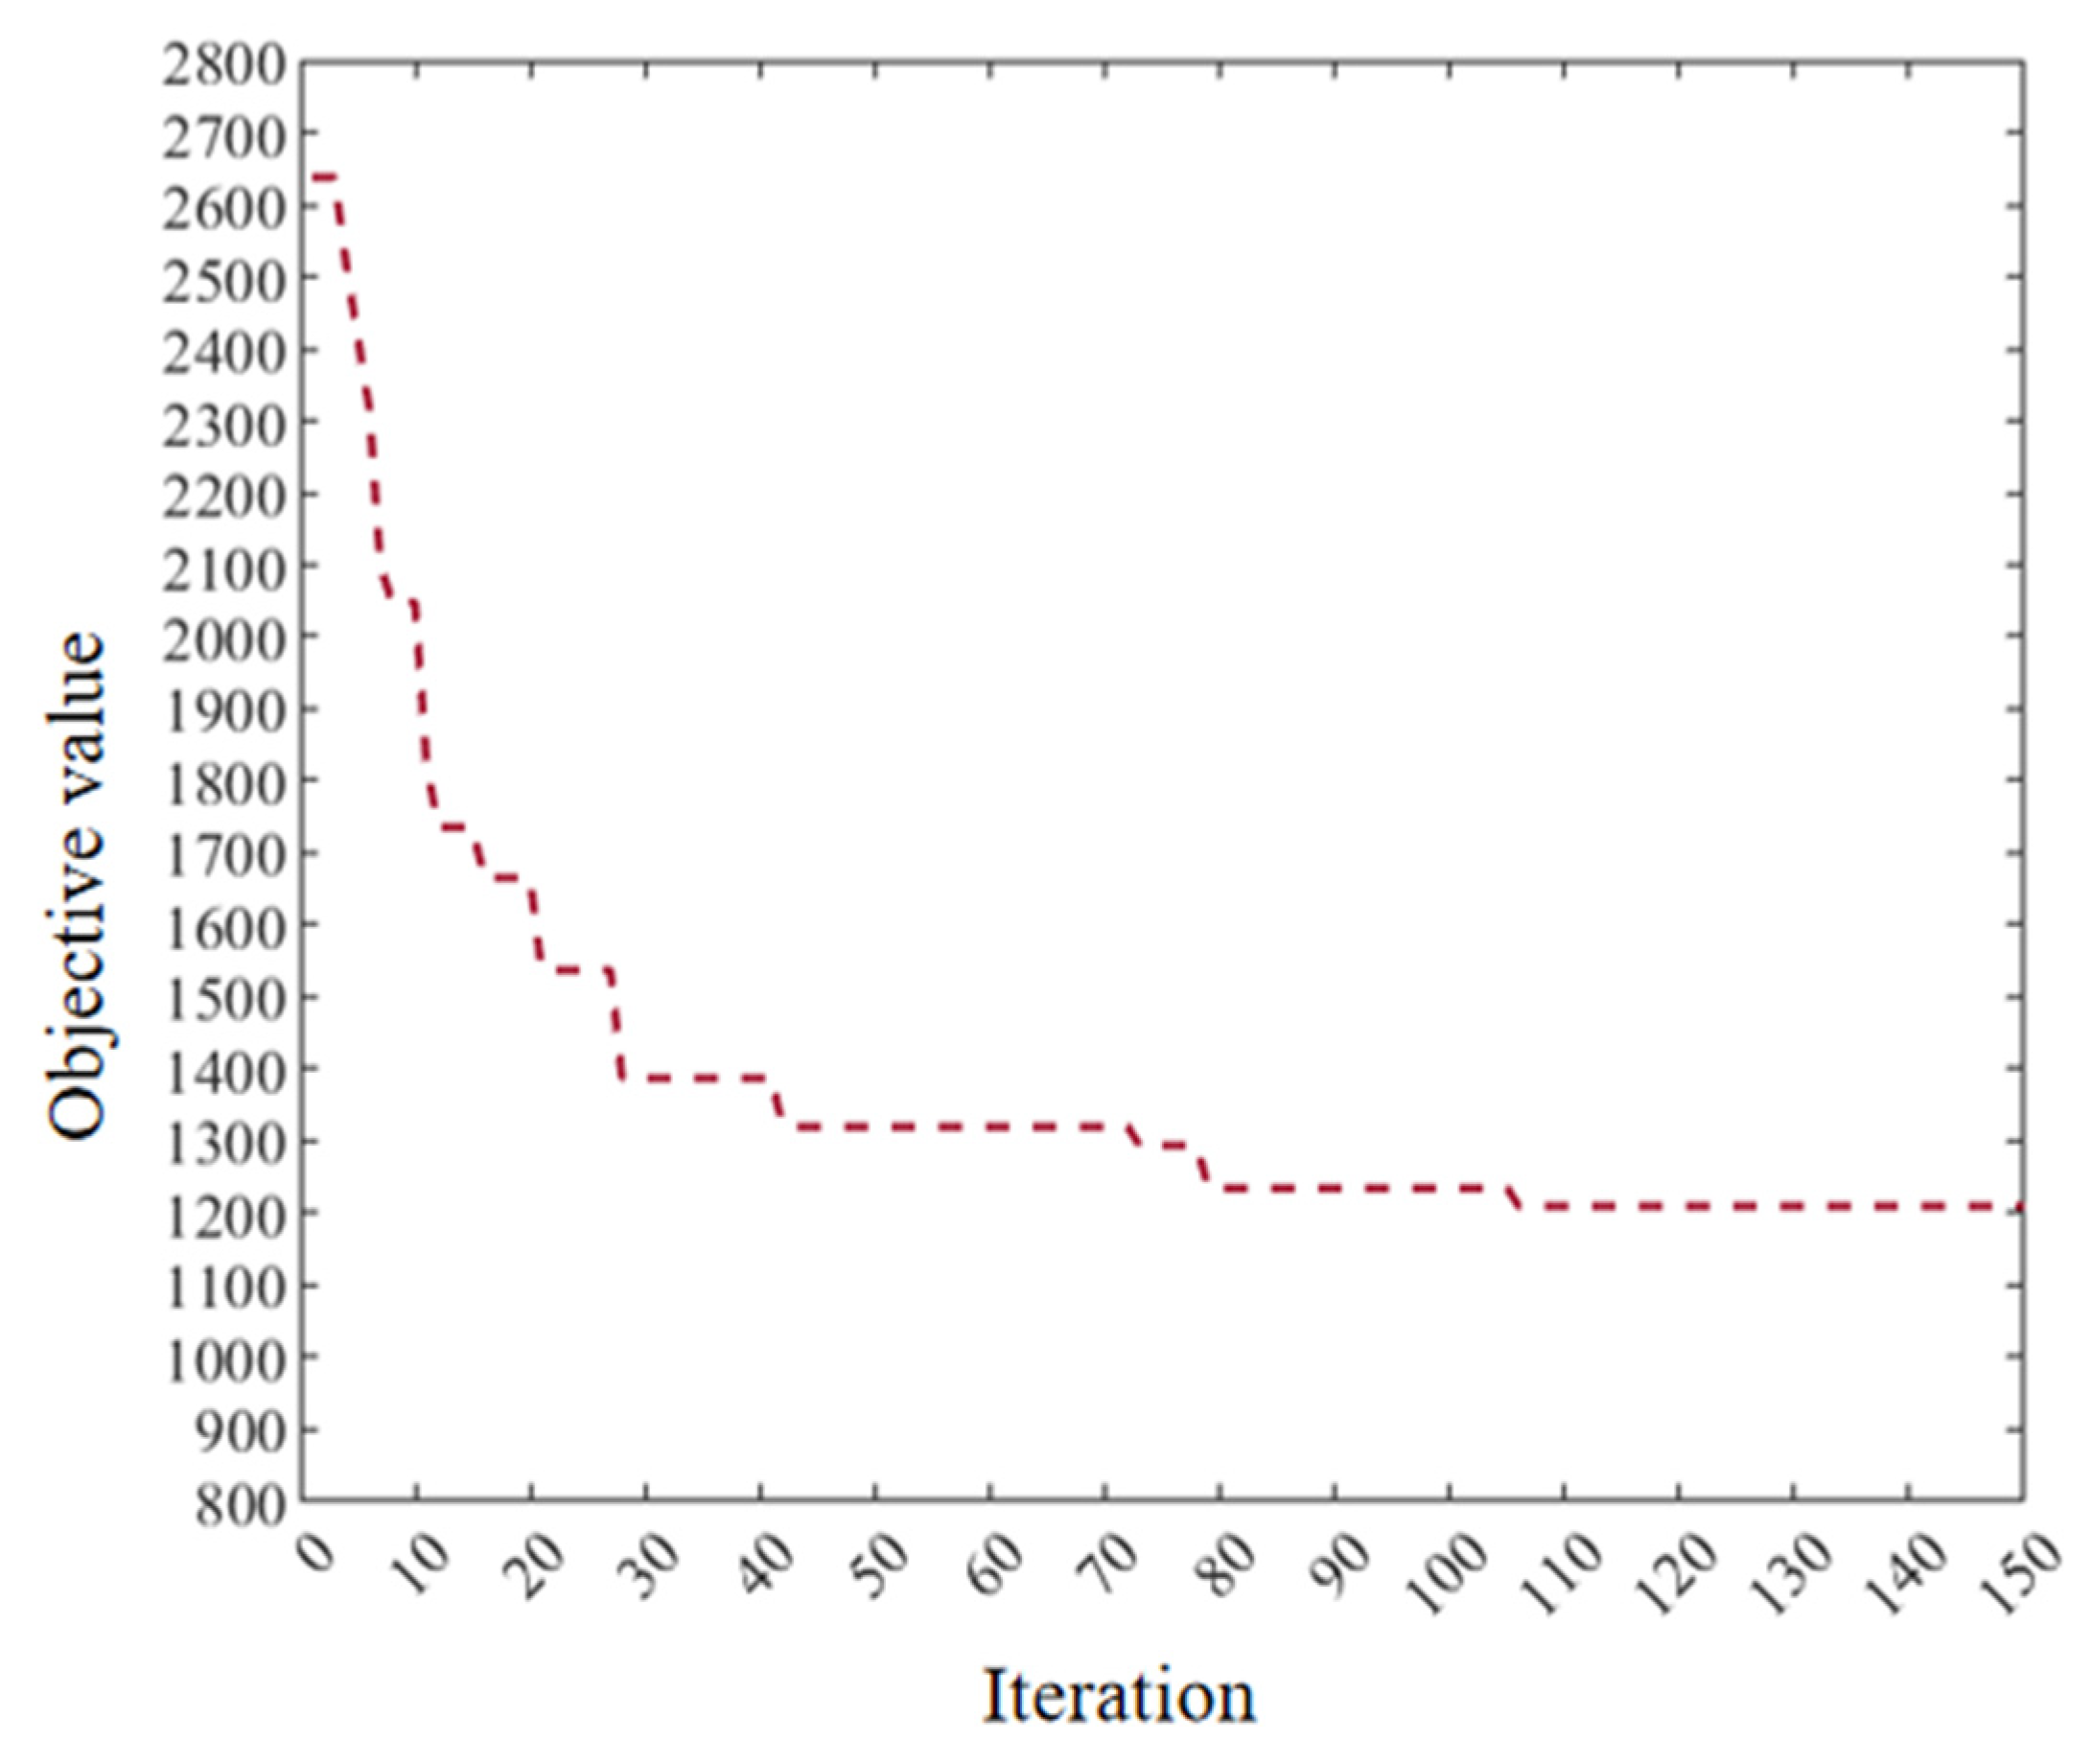
During the first stage (structural damage stage), the government takes charge of distributing emergency supplies, establishing three government reserves (G1, G2, and G3), each equipped with two emergency vehicles. Using Matlab R2021a, the model and algorithm were executed with a population size of 100, a maximum of 150 iterations, a crossover probability of 0.9, a mutation probability of 0.05, and a parent population retention rate of 0.9.
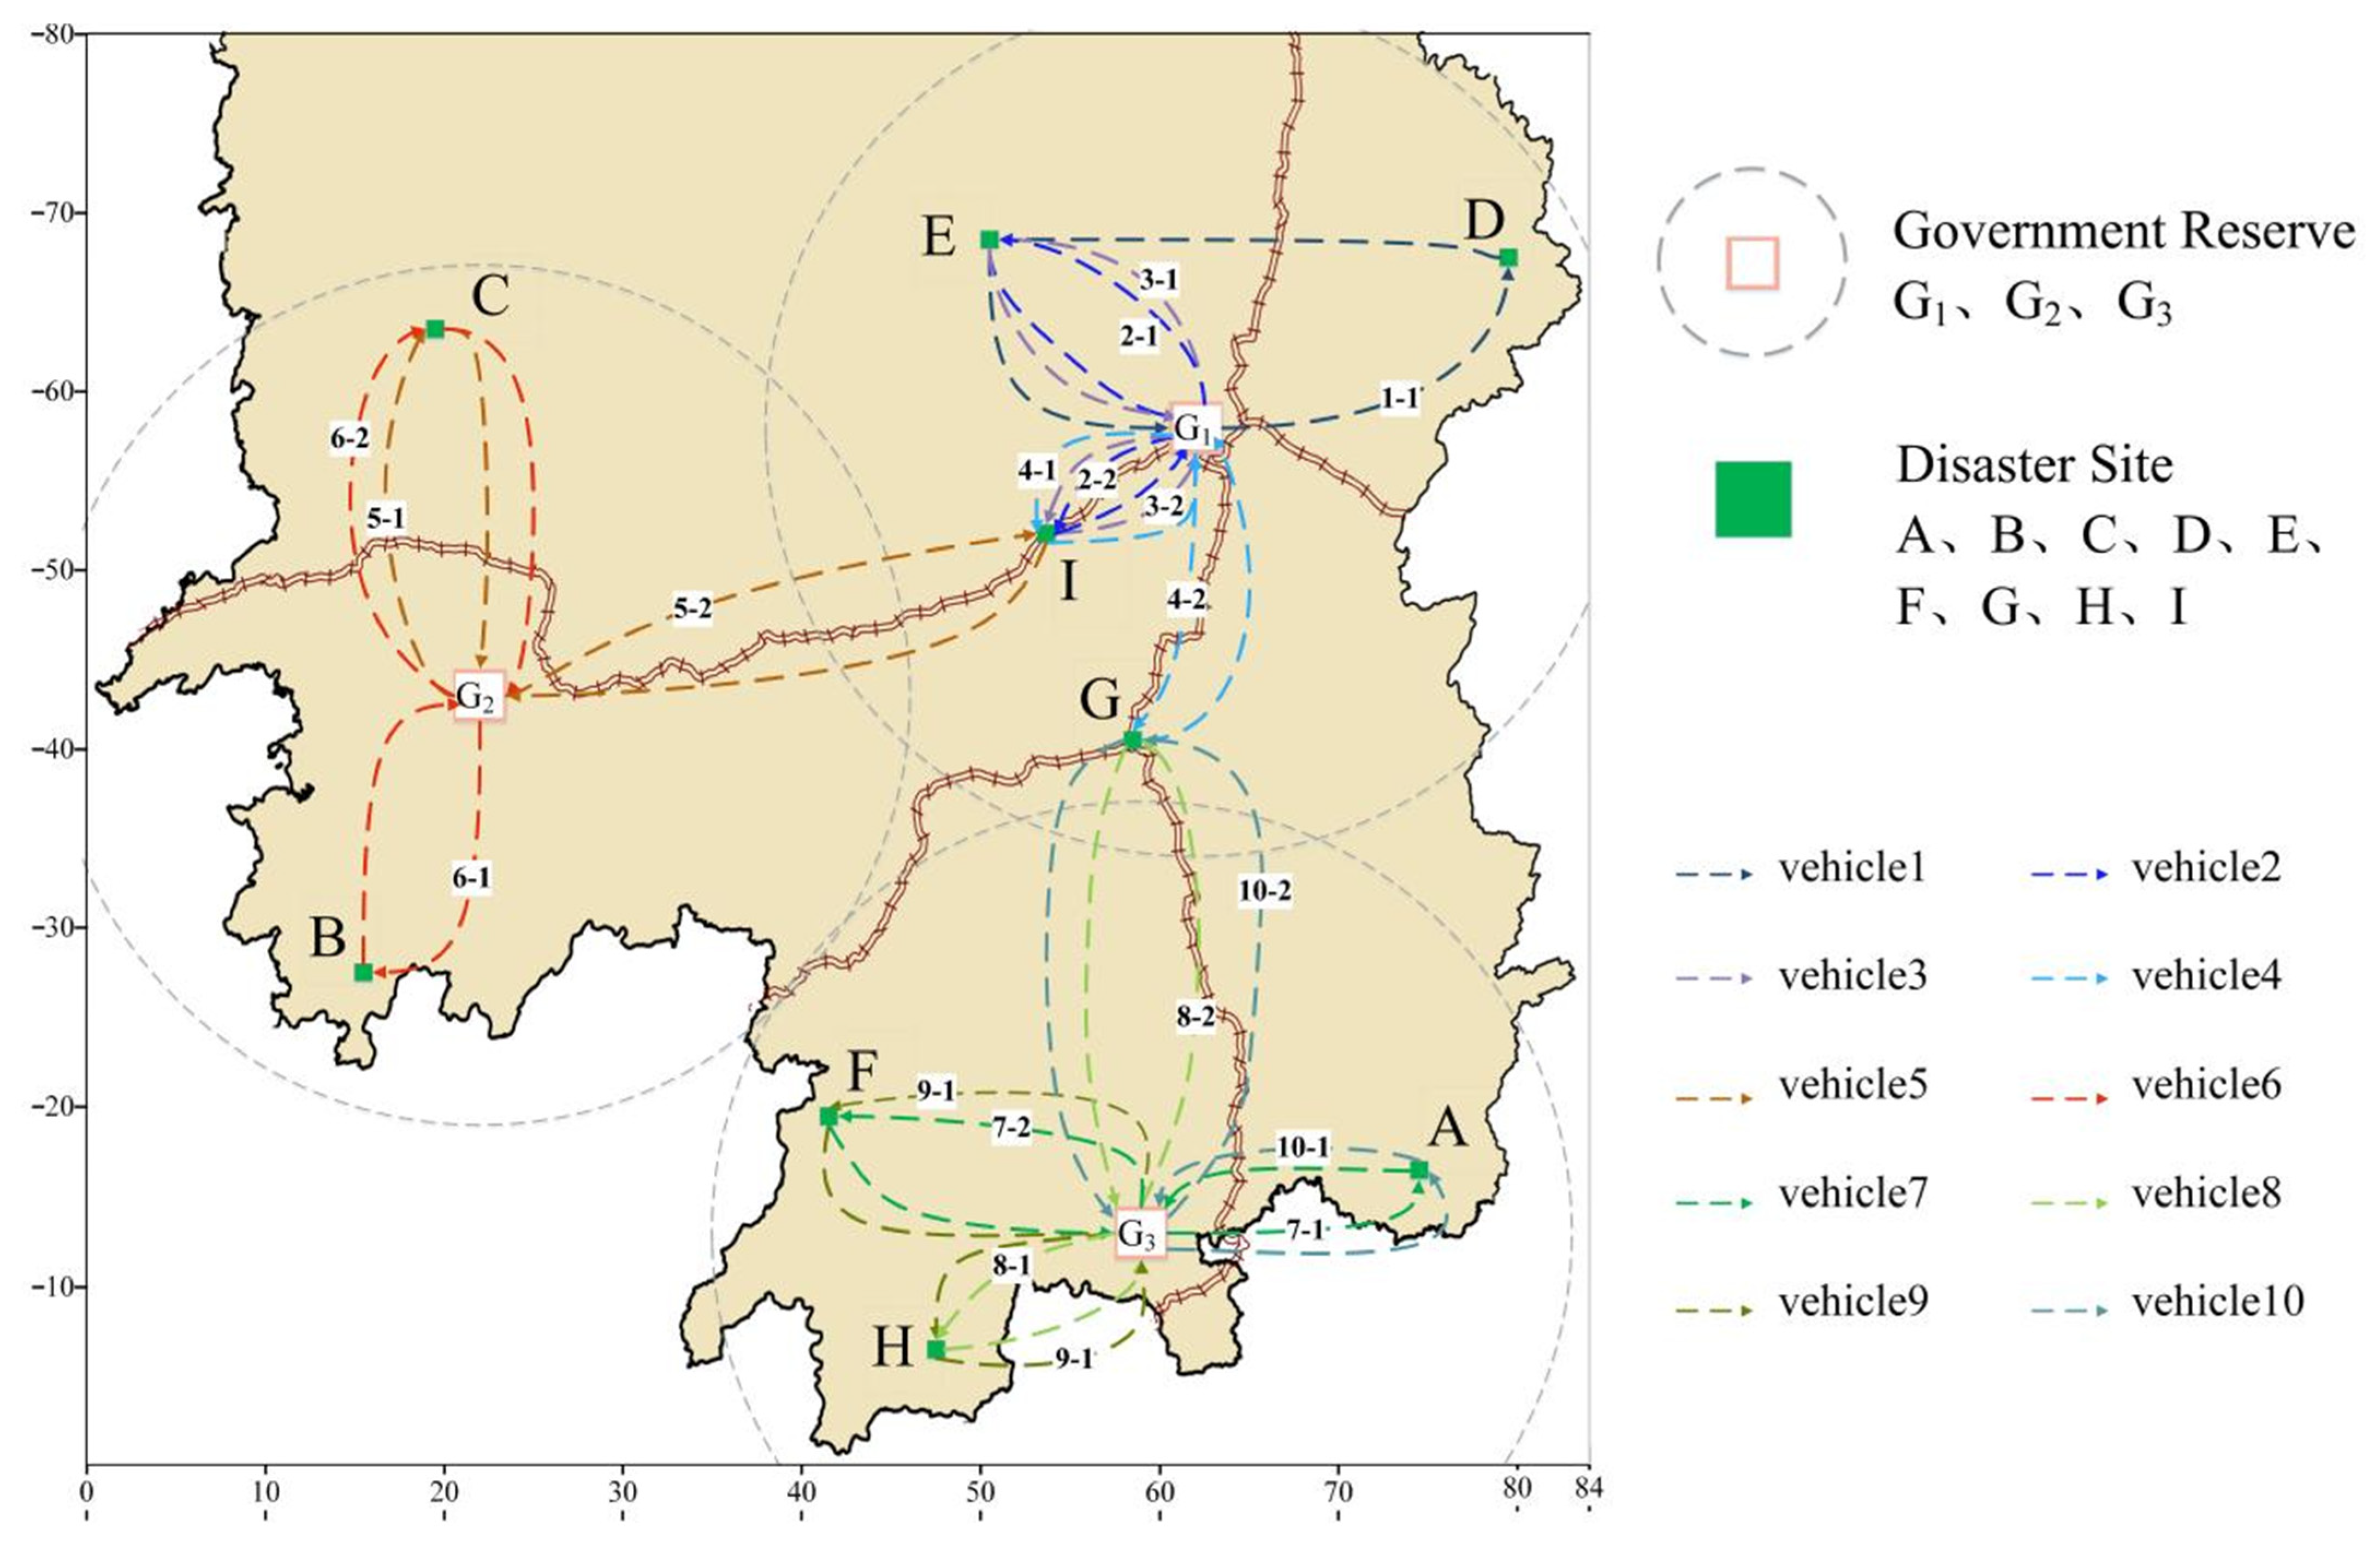
First, the demand of the disaster site is split, expressed in the form of [disaster site, split disaster site]. Its correspondence is obtained as {[1, 1, 2]; [2, 3]; [3, 4, 5]; [4, 6]; [5, 7, 8, 9]; [6, 10, 11]; [7, 12, 13, 14]; [8, 15, 16]; [9, 17, 18, 19, 20]}. The expression of the scheduling path is in the form of {vehicle 1 [order of transportation]; vehicle 2 []; … Vehicle m []}, and the initial scheduling path obtained after running the first stage of the cellular genetic algorithm is {1 [17, 20, 19, 18, 8, 7, 9]; 2 [13, 12, 14, 2, 1, 6]; 3 [5, 4]; 4 [3]; 5 [15, 16]; 6 [11, 10]}. As iterations progressed, the objective function values of the individuals in the population decreased in a stepwise manner to low values (Figure 7), without taking into account the limitations of the distribution capacity.
Vehicle task states were expressed as [vehicle number, end task time, stopping disaster site]. After the first stage of the cellular genetic algorithm, the vehicle task states were updated to {[2, 91, 13]; [1, 97, 17]; [5, 145, 15]; [4, 150, 3]; [6, 171, 11]; [3, 174, 5]}. Vehicle 2, which completed its first dispatch assignment earliest, was selected for reuse. The distribution paths for the remaining unserved disaster sites were then planned sequentially. Based on the disaster site correspondence, services were determined as shown in Table 9. The distribution services beyond soft time windows incurred penalties. In the stage of structural damage. The list of tasks for vehicles 1 to 6 is as follows: {[Reserve→17→Reserve→8]; [Reserve→13→Reserve]; [Reserve→5]; [Reserve→3→Reserve→4]; [Reserve→15→Reserve→1]; [Reserve→11→Reserve→10]}. Split disaster sites 2, 6, 9, 12, 14, 16, and 18 remained unserved due to an exceeded decision cycle, resulting in a system demand satisfaction rate of 70.1%. This 70.1% satisfaction rate primarily stems from inherent transport capacity limitations under the government-only response model. A total of 94 units (29.9%) of emergency supplies remained unmet within the 720 min decision cycle. This shortage disproportionately affected sites with the highest absolute demand and unfavorable locations relative to government reserves. For example, Site I (with the highest demand) required 65 units but received only 21 units (32.3% satisfied). Its large demand necessitated multiple split deliveries (4 split points), increasing scheduling complexity and vulnerability to time and capacity constraints.
Vehicles 2, 1, 5, 4, and 6 were successively dispatched within loading capacity, decision cycle, and continuous travel time constraints. The objective function comprised scheduling costs as well as delay losses. The government reserve played a guaranteed role, but further optimization was hindered by transportation capacity limitations. Therefore, the transportation resources needed in disaster scenarios should be reinvested. When the number of emergency vehicles was increased to 10, all disaster site requirements were met. The convoy task concluded at 504 min when vehicle 5 served disaster site I. The vehicle path trajectory is depicted in Figure 8. Government reserves, located on Hunan’s main transportation network lines, facilitated open vehicle paths for supplies. The disaster site receives multiple services from multiple reserves as well as multiple vehicles. Disaster sites G and I were serviced by three vehicles from two reserve depots, showcasing system coordination.

3.2. Government-Enterprise Coordinated Route Planning of Emergency Vehicles

During the second stage (functional damage stage), emergency supplies are dispatched by the government reserves and enterprises, setting up three government reserves and seven enterprises to participate. Using the same model parameters as before, each emergency facility initially deploys one emergency vehicle. Considering loading constraints, the disaster site requirements are divided into 40 segments. After the first stage of the cellular genetic algorithm, the first round of scheduling paths is established as follows: {1 [33, 34, 35, 36, 37, 38, 39, 40]; 2 [5, 8]; 3 [29, 30, 31, 32]; 4 [9, 10]; 5 [22, 23, 24, 25, 26, 27, 28]; 6 [11, 12, 13, 14, 15, 16]; 7 [6, 7]; 8 [4]; 9 [17, 18, 19, 20, 21]; 10 [1, 2, 3]}. With consistent capacity and dispatch time, the government-enterprise coordinated route planning facilitates the deployment of 360 units of emergency supplies. Statistical results from 30 runs underscore significant efficiency improvements through collaboration (Table 10).
Following Vehicle 3’s service to disaster site H, the complete distribution service concludes at 908 min. The vehicle task statuses are listed as: {[6, 562, 38]; [4, 562, 36]; [9, 573, 30]; [8, 656, 20]; [5, 657, 28]; [10, 662, 19]; [7, 670, 37]; [2, 707, 16]; [1, 852, 10]; [3, 908, 32]}. The overall efficiency of the dispatching system is improved through the cyclic dispatch of vehicles. The total volume of emergency supplies in the functional damage stage is 2.35 times that of the structural damage stage, with transportation time being 1.26 times longer. Vehicle path trajectories are illustrated in Figure 9 (only service trajectories are shown here, not replenishment circuits). Disaster sites I, G, and E, which are the top three in demand, benefit from better resource allocation. Disaster site I receives delivery services from vehicles 1, 4, 5, 6, and 7. Disaster site G is serviced by 1, 3, 5, 6, and 10, while disaster site E receives delivery services from vehicles 1, 2, 5, 6, and 8. Combining the planned emergency vehicle paths with the road network in Hunan Province, it is evident that cross-regional paths have significantly increased compared to the structural damage stage. Such as, Vehicle 8 traverses three regions to serve disaster sites B, E, and F. The nearby replenishment mechanism enhances vehicle scheduling flexibility and coordination within the region.
Vehicle dispatch sequences and service at disaster sites are detailed in Table 11 and Table 12, respectively. All disaster sites receive a response within three hours. Distribution services are implemented in a time-series manner, in line with the stepped penalty cost based on the soft time windows defined in the model. Planned emergency vehicle routes generally align with the overall ranking of demand urgency, which is also affected by the number of splits, split requirements, and transport capacity. Route optimization is conducted under the premise of splitting demand without exceeding vehicle capacity. For example, vehicle 9 completes its final distribution task at disaster site H, which has the lowest demand urgency. Route planning for emergency vehicles under multiple distribution conditions proves highly advantageous in this phase. Open vehicle scheduling maximizes the utilization of limited transportation resources. Unilateral soft time windows ensure the timeliness required for natural disaster emergency response. Demand splitting and one-to-many services represent realistic constraints for supply distribution services. Multiple distribution centers and nearby replenishment mechanisms guarantee the circulation and coordination of vehicle routes.

3.3. Enterprise-Led Route Planning of Emergency Vehicles

In the third stage (reconstruction stage), the enterprise leads the route planning of emergency vehicles. Seven enterprise production points are established to participate in the emergency response. After demand splitting at disaster sites and dynamic route planning, vehicle 2 concludes the supply distribution service at this stage by serving disaster sites H and B at 743 min. The list of vehicle task statuses is: {[3, 365, 16]; [7, 385, 27]; [5, 392, 24]; [8, 444, 14]; [1, 466, 18]; [10, 506, 11]; [2, 550, 11]; [6, 667, 28]; [9, 735, 22]; [4, 743, 4]}. Vehicle dispatch sequences and service at disaster sites are detailed in Table 13 and Table 14, respectively. The government-led routing plan took 504 min to deliver 314 units of emergency supplies in the first stage (structural damage stage). The government-enterprise coordinated routing plan required 908 min to deliver 737 units of emergency supplies in the second stage (functional damage stage). The enterprise-led routing plan took 743 min to deliver 498 units of emergency supplies in the third stage (reconstruction stage). Ranked by efficiency, the stages are: functional damage, reconstruction, and structural damage. Vehicle path trajectories in the third stage are shown in Figure 10. The characteristics of vehicle path trajectories in three stages are analyzed, and it is found that the vehicle paths in the first stage highlight radioactivity, the vehicle paths in the second stage highlight trans-regionality, and the vehicle paths in the third stage highlight reciprocity.
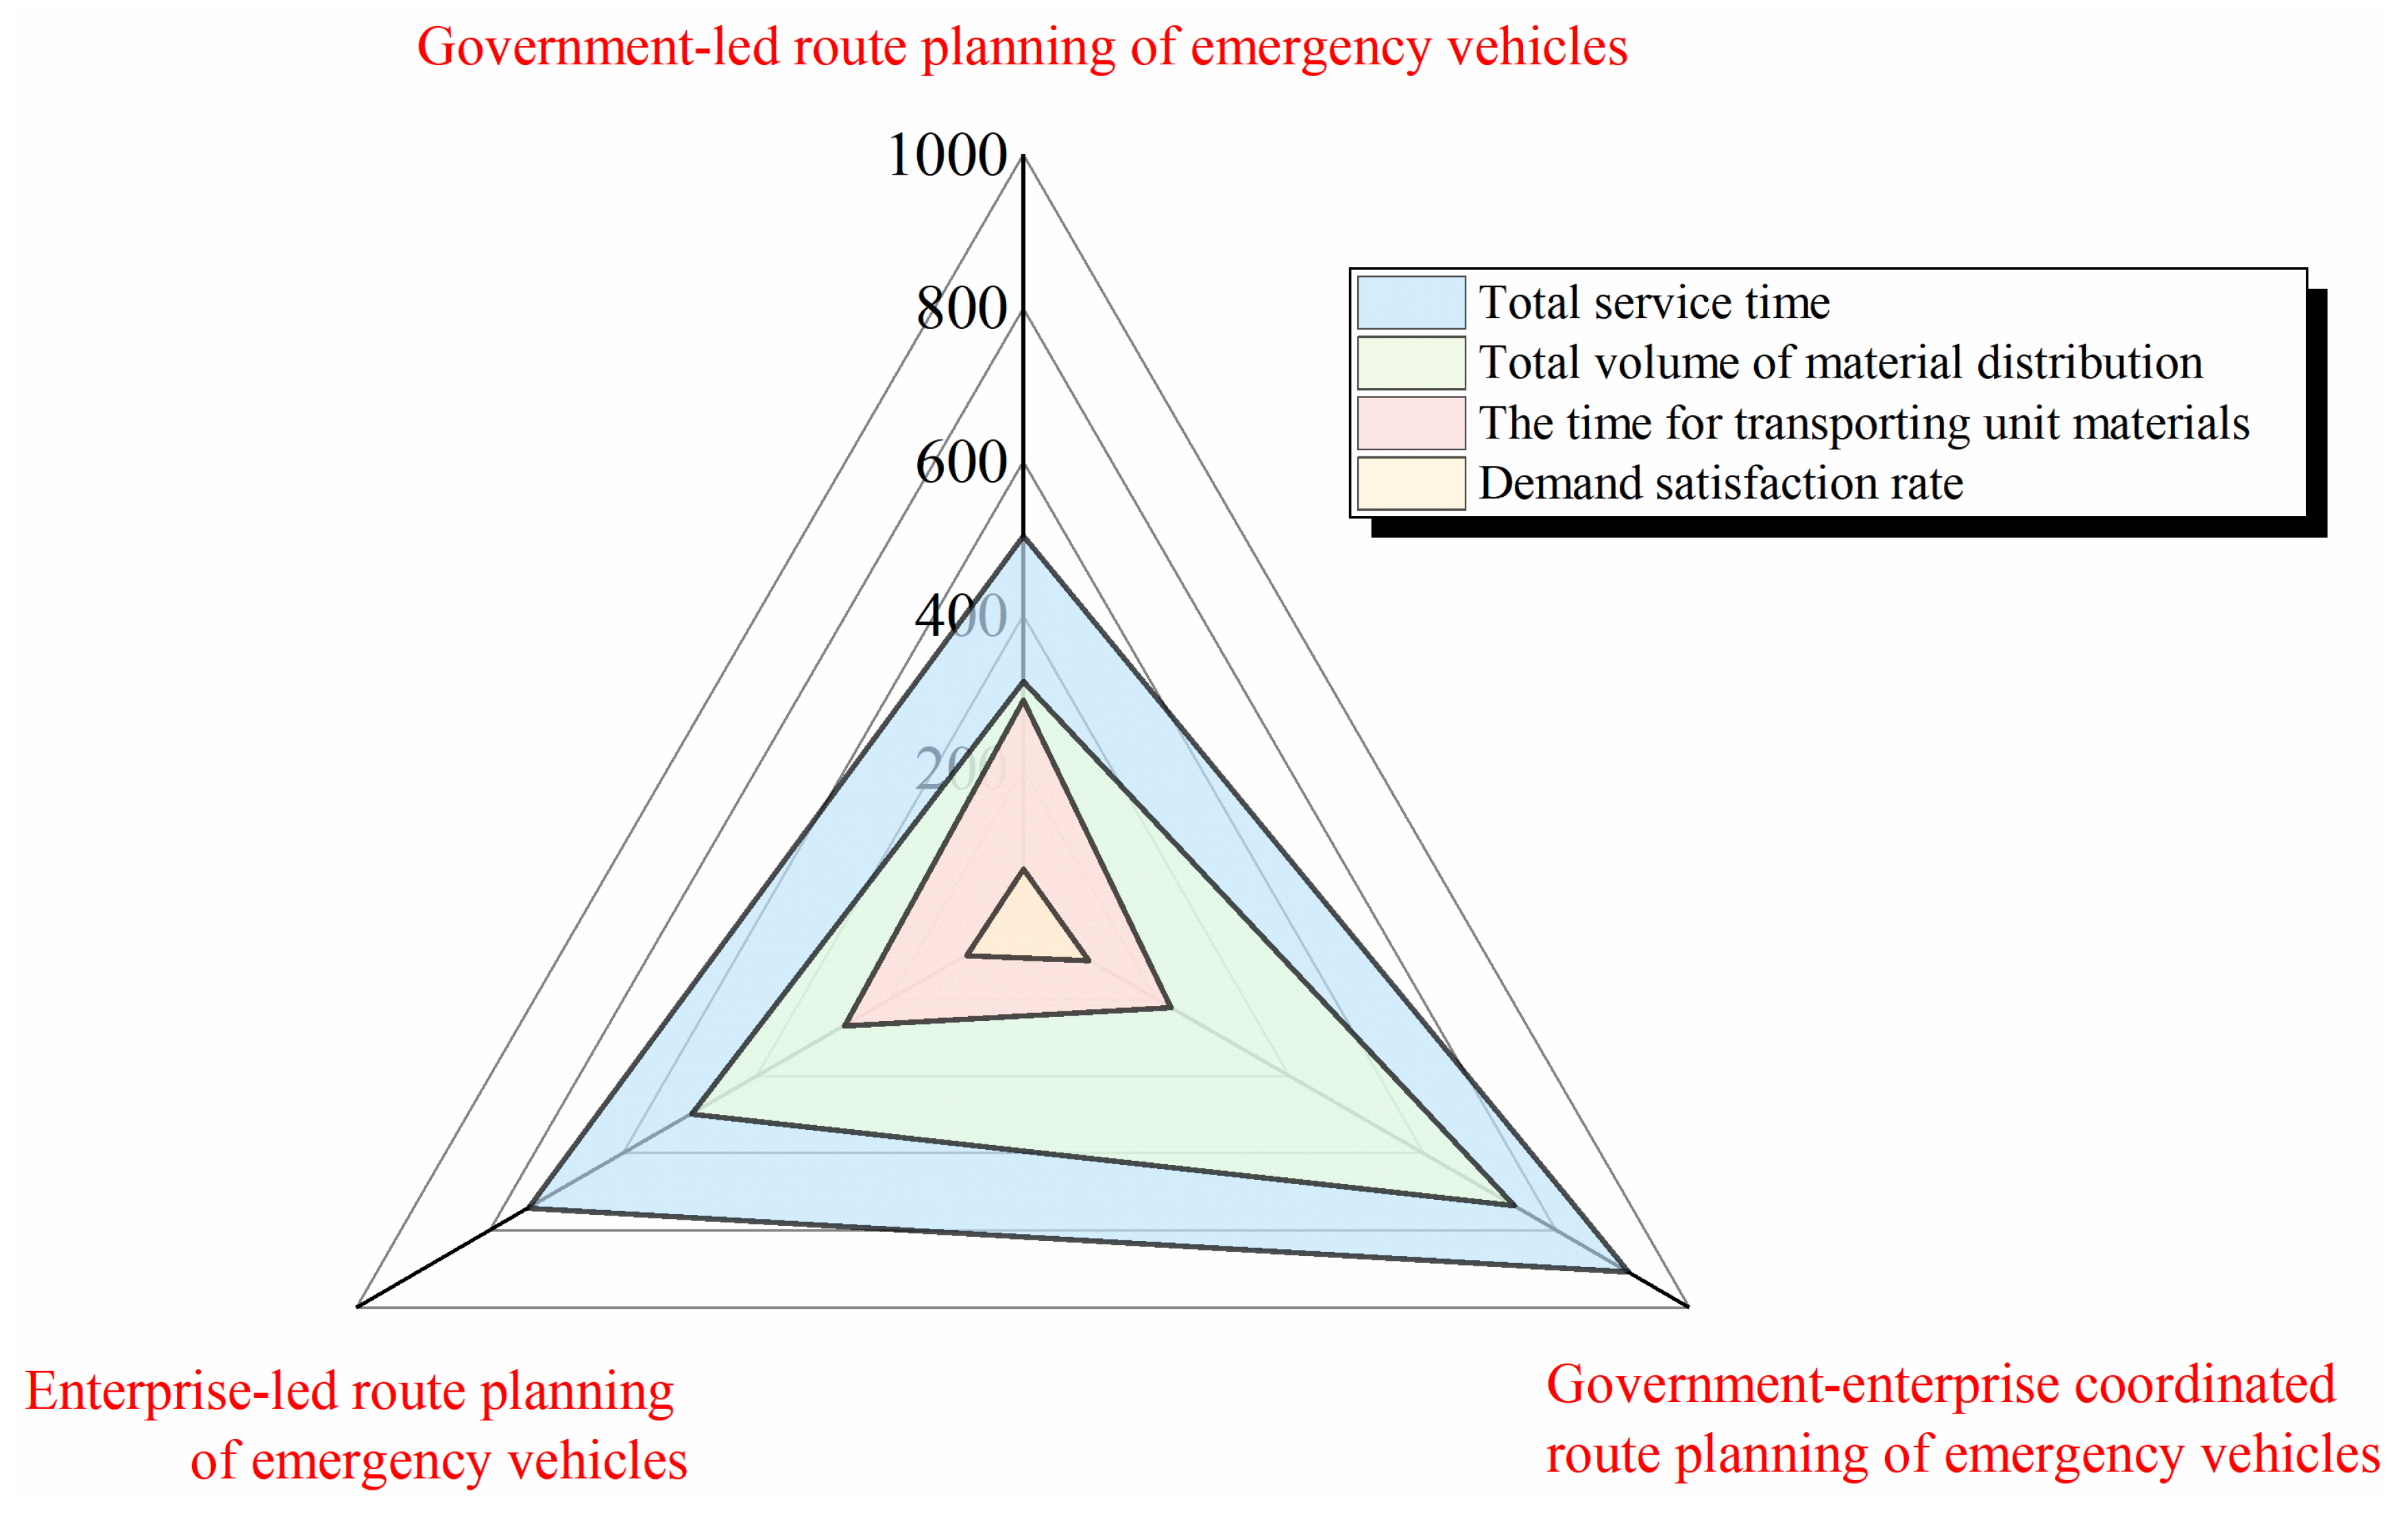
As depicted in Figure 11, a comparison of simulation results under the three emergency vehicle route planning modes of government-led, enterprise-led, and government-enterprise coordination is presented. In terms of total service time, the government-enterprise collaboration model significantly outperforms the other two models, completing emergency tasks more efficiently. Regarding the total amount of material distribution, the government-enterprise coordination model is also in a leading position, achieving larger-scale material delivery. In terms of demand satisfaction rate, the government-enterprise coordination model is also significantly higher than the government-led and enterprise-led models. Combining various indicators, it is evident that the government-enterprise coordination model for emergency vehicle route planning exhibits greater flexibility and efficiency than the single government-led or enterprise-led models in emergency logistics operations, better allocating resources and meeting disaster needs in emergency response.

3.4. Route Planning of Emergency Vehicles Under Sudden Road Conditions

To assess the dynamic adjustment performance of route planning under unexpected road conditions, a road damage scenario is set in the third stage. When Vehicle 4 plans a secondary path, the road from production point 3 to disaster site F is destroyed. During the decision-making period, the supply requirements of the disaster site are fully distributed, achieving a 100% demand satisfaction rate. The path adjustments after algorithm iteration are shown in Table 15. In this scenario, the supply distribution service at this stage was terminated after disaster point B was served in 743 min. It is observed that a total of five paths are adjusted, with four occurring between disaster sites H and F, and one between disaster sites A and B. This is because the travel times from production sites 2, 6, and 7 to disaster sites F and H closely approximate the travel time from production site 2 to disaster sites A and B. The list of vehicle task statuses is: {[3, 363, 16]; [7, 385, 25]; [5, 392, 26]; [1, 466, 17]; [2, 498, 13]; [10, 507, 11]; [9, 620, 14]; [8, 638, 19]; [6, 667, 28]; [4, 743, 4]}. The cumulative fleet time on mission increases by 0.076%. By setting the disaster scenario to consider uncertainty conditions, the designed route planning model and algorithm can select alternate plans with lower adjustment costs, such as service failure costs and rescue delay losses. This approach reduces the interference caused by uncertain conditions under sudden road conditions.

4. Discussion

Vehicle path characteristics vary with different subject behaviors, which is consistent with theoretical analyses. Radioactivity (Figure 11) manifests as strict hub-and-spoke patterns, where routes originate from fixed government reserves (G1/G2/G3→Sites→Return). Reciprocity emerges in decentralized supply scenarios (e.g., post-disaster reconstruction), advocating for local resource pools and modular routing. Trans-regionality (Figure 10) involves long-haul, cross-boundary paths enabled by multi-facility collaboration (e.g., Vehicle 8 crossing 3 regions). While trans-regionality facilitates rapid hotspot response, it necessitates pre-negotiated corridors. Policy-makers should align routing strategies with disaster phases: Government hubs (Radioactivity) for immediate response → Cross-sector networks (Trans-regionality) for scaling → Enterprise clusters (Reciprocity) for sustained recovery. Reciprocity (Figure 10) is characterized by bidirectional resource flows between enterprise facilities (e.g., Vehicle 9: 6→H→6→B→7→F; Vehicle 10: 7→A→7→G→2→E), where vehicles frequently transfer supplies between production points (6↔7, 7→2) while serving nearby disaster sites. Radioactivity suits centralized, surge-phase responses but incurs empty-mileage penalties.
The dynamic route planning strategy of emergency vehicle solves the problem of rigid resource allocation in the traditional government-led model by integrating demand urgency assessment and open scheduling mechanism. Experiments show that the collaborative strategy is significantly better than the single-agent model in the demand satisfaction rate (increased by 12.3%) and response time (shortened by 18%), which provides theoretical support for multi-agent emergency collaboration.
The proposed two-stage cellular genetic algorithm exhibits excellent performance in dynamic disaster scenarios. Algorithm performance comparisons are detailed in Table 16. The two-stage cellular genetic algorithm achieves a 5.2% higher demand satisfaction rate than NSGA-II by leveraging stage-wise demand splitting and reduces unit time by 14.7% vs. PSO through cellular neighborhood-driven local optimization. The nearby replenishment mechanism in Stage 2 (Table 4) is crucial for handling dynamic road failures, a capability lacking in Tabu Search and PSO.
While this study provides a novel framework for dynamic emergency vehicle routing, several limitations warrant acknowledgment. (1) The model assumes real-time access to complete data (e.g., exact demand at disaster sites, undamaged road network status, vehicle positions). In reality, disasters often disrupt communication, leading to delayed/partial data (e.g., estimated demand from satellite imagery, road blockage reports). (2) Vehicle travel times are modeled as deterministic. However, post-disaster conditions (congestion, secondary hazards) introduce high uncertainty in transit times and increase the risk of vehicle breakdowns. (3) Simulations covered 9 disaster sites and 10 facilities. Scaling to provincial-level events (e.g., 100+ sites) may increase computation time nonlinearly.

5. Conclusions

Leveraging the emergency response strengths of both government and enterprises, scientific and rational route planning for emergency vehicles is crucial for enabling emergency command organizations to swiftly initiate rescue operations following disasters. This paper integrates the use of AHP, EWM, and the GRA-TOPSIS method to quantitatively rank the demand urgency of the disaster site. Based on the evolution patterns of natural disasters and material supply modes, a post-disaster government-enterprise collaboration strategy is devised. Aiming to minimize scheduling time, delay penalties, and unmet demand rates, a dynamic route planning model is constructed, and a two-stage cellular genetic algorithm is developed. Finally, an integrated and comprehensive planning strategy is proposed to support routing decisions for emergency vehicles in post-disaster scenarios, dynamically planning travel routes to meet the time-series demands of disaster sites. The rationality and effectiveness of the proposed model and algorithm are validated through a potential flooding scenario in Hunan Province, China. The main conclusions are as follows:
In the dynamic route planning strategy for emergency vehicles, emergency vehicles are dispatched cyclically across all levels of nodes in the rescue network, adhering to realistic constraints such as demand splitting, soft time windows, and open scheduling. Under varying behavioral patterns, emergency vehicle routes exhibit differentiation, fully achieving the operational objectives and system functions of emergency logistics. Vehicle paths during the structural damage stage are divergent, those in the functional damage stage emphasize trans-regionality, and those in the reconstruction stage demonstrate reciprocity.
Across the three distinct stages, the efficiency of route planning, ranked from highest to lowest, is as follows: government-enterprise collaboration (1.23 min/unit), enterprise-led (1.49 min/unit), and government-led (1.61 min/unit), which underscores the flexibility and efficiency of the route planning strategy.
The proposed model and algorithm optimize vehicle paths under sudden road conditions with minimal system disruption. It took 743 min to adjust routes in real-time to complete all distribution services. The cumulative fleet time on mission increases by just 0.076%. This reactive scheduling and local optimization strategy has proven to be an effective approach for managing and responding to dynamic information during the scheduling process.

Author Contributions

Conceptualization, F.W.; Methodology, Q.Y.; Software, Q.Y. and Z.X.; Validation, F.W.; Formal analysis, F.W. and Z.X.; Investigation, F.W. and Q.Y.; Resources, F.W.; Data curation, Q.Y.; Writing—original draft, Q.Y. and Z.X.; Writing—review & editing, F.W., Q.Y. and Z.X.; Supervision, Q.Y. All authors have read and agreed to the published version of the manuscript.

Funding

The project was supported by [Open Fund of Engineering Research Center of Catastrophic Prophylaxis and Treatment of Road & Traffic Safety of Ministry of Education (Changsha University of Science & Technology)] grant number [kfj220402] and [Provincial Natural Science Foundation of Hunan] grant number [2025JJ50265].

Institutional Review Board Statement

Not applicable.

Informed Consent Statement

Not applicable.

Data Availability Statement

The original contributions presented in the study are included in the article, further inquiries can be directed to the corresponding author.

Conflicts of Interest

Author Ziling Xie was employed by Glodon Company Limited. The remaining authors declare that the research was conducted in the absence of any commercial or financial relationships that could be construed as a potential conflict of interest.

References

  1. Shi, Y.; Shen, Y.; Kang, E.; Li, D.; Ding, Y.; Zhang, G.; Hu, R. Recent and Future Climate Change in Northwest China. Clim. Change 2007, 80, 379–393. [Google Scholar] [CrossRef]
  2. Curnin, S.; Owen, C. Obtaining information in emergency management: A case study from an Australian emergency operations centre. Int. J. Hum. Fac. Ergon. 2013, 2, 131–158. [Google Scholar] [CrossRef]
  3. Shen, G.; Hwang, S.N. Spatial-Temporal snapshots of global natural disaster impacts Revealed from EM-DAT for 1900–2015. Geomat. Nat. Haz. Risk 2019, 10, 912–934. [Google Scholar] [CrossRef]
  4. Rawls, C.G.; Turnquist, M.A. Pre-positioning of emergency supplies for disaster response. Transp. Res. B-Meth. 2010, 44, 521–534. [Google Scholar] [CrossRef]
  5. Chi, H.; Li, J.; Shao, X.; Gao, M. Timeliness evaluation of emergency resource scheduling. Eur. J. Oper. Res. 2017, 258, 1022–1032. [Google Scholar] [CrossRef]
  6. Rivera-Royero, D.; Galindo, G.; Yie-Pinedo, R. A dynamic model for disaster response considering prioritized demand points. Socio-Econ. Plan Sci. 2016, 55, 59–75. [Google Scholar] [CrossRef]
  7. Perez-Rodriguez, N.; Holguin-Veras, J. Inventory-Allocation Distribution Models for Postdisaster Humanitarian Logistics with Explicit Consideration of Deprivation Costs. Transp. Sci. 2016, 50, 1261–1285. [Google Scholar] [CrossRef]
  8. Wang, D.; Qi, C.; Wang, H. Improving emergency response collaboration and resource allocation by task network mapping and analysis. Saf. Sci. 2014, 70, 9–18. [Google Scholar] [CrossRef]
  9. Lei, L.; Lee, K.; Dong, H. A heuristic for emergency operations scheduling with lead times and tardiness penalties. Eur. J. Oper. Res. 2016, 250, 726–736. [Google Scholar] [CrossRef]
  10. Moreno, A.; Alem, D.; Ferreira, D.; Clark, A. An effective two-stage stochastic multi-trip location-transportation model with social concerns in relief supply chains. Eur. J. Oper. Res. 2018, 269, 1050–1071. [Google Scholar] [CrossRef]
  11. Hu, Y.; Liu, Q.; Li, S.; Wu, W. Robust emergency logistics network design for pandemic emergencies under demand uncertainty. Transp. Res. E-Log. 2025, 196, 103927. [Google Scholar] [CrossRef]
  12. Kundu, T.; Sheu, J.; Kuo, H. Emergency logistics management—Review and propositions for future research. Transp. Res. E-Log. 2022, 164, 102789. [Google Scholar] [CrossRef]
  13. Shen, J.; Liu, K.; Ma, C.; Zhao, Y.; Shi, C. Bibliometric analysis and system review of vehicle routing optimization for emergency material distribution. J. Traffic Transp. Eng. 2022, 9, 893–911. [Google Scholar] [CrossRef]
  14. Wang, H.; Qiu, H.; Wang, D.; Duan, J.; Wang, Y.; Cheng, T. An integrated location-routing problem with post-disaster relief distribution. Comput. Ind. Eng. 2020, 147, 106632. [Google Scholar]
  15. Qi, C.; Hu, L. Optimization of vehicle routing problem for emergency cold chain logistics based on minimum loss. Phys. Commun. 2020, 40, 101085. [Google Scholar] [CrossRef]
  16. Gulczynski, D.; Golden, B.; Wasil, E. The multi-depot split delivery vehicle routing problem: An integer programming-based heuristic, new test problems, and computational results. Comput. Ind. Eng. 2011, 61, 794–804. [Google Scholar] [CrossRef]
  17. Sheu, J.B. Dynamic relief-demand management for emergency logistics operations under large-scale disasters. Transp. Res. E-Log. 2010, 46, 1–17. [Google Scholar] [CrossRef]
  18. Wang, H.; Du, L.; Ma, S. Multi-objective open location-routing model with split delivery for optimized relief distribution in post-earthquake. Transp. Res. E-Log. 2014, 69, 160–179. [Google Scholar] [CrossRef]
  19. Wang, Y.; Wang, X.W.; Fan, J.X.; Wang, Z.; Zhen, L. Emergency logistics network optimization with time window assignment. Expert Syst. Appl. 2023, 214, 119145. [Google Scholar] [CrossRef]
  20. Spliet, R.; Desaulniers, G. The discrete time window assignment vehicle routing problem. Eur. J. Oper. Res. 2015, 244, 379–391. [Google Scholar] [CrossRef]
  21. Li, W.; Jiang, R.; Wu, H.; Xie, J.; Zhao, Y.; Li, F.; Lu, X. A new two-stage emergency material distribution framework for urban rainstorm and flood disasters to promote the SDGs. Sustain. Cities Soc. 2024, 112, 105645. [Google Scholar] [CrossRef]
  22. Chang, K.H.; Chiang, Y.C.; Chang, T.Y. Simultaneous location and vehicle fleet sizing of relief goods distribution centers and vehicle routing for post-disaster logistics. Comput. Oper. 2024, 161, 106404. [Google Scholar] [CrossRef]
  23. Wu, Y.Y.; Chen, S. Resilience modeling and pre-hazard mitigation planning of transportation network to support post-earthquake emergency medical response. Reliab. Eng. Sys. Safe 2023, 230, 108918. [Google Scholar] [CrossRef]
  24. Zhao, Y.; Zhang, L. An advanced study of urban emergency medical equipment logistics distribution for different levels of urgency demand. Int. J. Environ. 2022, 19, 11264. [Google Scholar] [CrossRef]
  25. Ji, G.; Zhu, C. A Study on Emergency Supply Chain and Risk Based on Urgent Relief Service in Disasters. Syst. Eng. Procedia 2012, 5, 313–325. [Google Scholar] [CrossRef]
  26. Huang, L.; Shi, P.; Zhu, H. An integrated urgency evaluation approach of relief demands for disasters based on social media data. Int. J. Disaster Risk Reduct. 2022, 80, 103208. [Google Scholar] [CrossRef]
  27. Nasibov, E.N.; Ulutagay, G. A new unsupervised approach for fuzzy clustering. Fuzzy Sets Syst. 2007, 158, 2118–2133. [Google Scholar] [CrossRef]
  28. Chen, S.J.; Hwang, C.L. Fuzzy Multiple Attribute Decision Making Methods and Applications; Springer: Berlin/Heidelberg, Germany, 1992. [Google Scholar]
  29. Chen, D.; Fang, Y. Urgency Evaluation of Emergency Demand in Emergency Logistics Operation Based on FAHP. In Proceedings of the IEEE 3rd International Conference on Emergency Management and Management Sciences (ICEMMS), Changsha, China, 1–8 January 2013; pp. 1–4. [Google Scholar]
  30. Curnin, S.; Owen, C.; Paton, D.; Brooks, B. A theoretical framework for negotiating the path of emergency management multi-agency coordination. Appl. Ergon. 2015, 47, 300–307. [Google Scholar] [CrossRef] [PubMed]
  31. Coles, J.B.; Zhang, J.; Zhuang, J. Partner selection in disaster relief: Partnership formation in the presence of incompatible agencies. Int. J. Disaster Risk Reduct. 2018, 27, 94–104. [Google Scholar] [CrossRef]
  32. Binder, S.B.; Baker, C.K. Culture, local capacity, and outside aid: A community perspective on disaster response after the 2009 tsunami in American Sāmoa. Disasters 2017, 41, 282–305. [Google Scholar] [CrossRef]
  33. Alban, A.; Blaettchen, P.; Vries, H.D.; Van Wassenhove, L.N. Resource Allocation with Sigmoidal Demands: Mobile Healthcare Units and Service Adoption. Manuf. Serv. Oper. Manag. 2022, 24, 2797–3306. [Google Scholar] [CrossRef]
  34. Zhang, L. Emergency supplies reserve allocation within government-private cooperation: A study from capacity and response perspectives. Comput. Ind. Eng. 2021, 154, 107171. [Google Scholar] [CrossRef]
  35. Nikkhoo, F.; Bozorgi-amiri, A.; Heydari, J. Coordination of relief items procurement in humanitarian logistic based on quantity flexibility contract. Int. J. Disaster Risk Reduct. 2018, 31, 331–340. [Google Scholar] [CrossRef]
  36. Govindan, K.; Diabat, A.; Popiuc, M.N. Contract analysis: A performance measures and profit evaluation within two-echelon supply chains. Comput. Ind. Eng. 2012, 63, 58–74. [Google Scholar] [CrossRef]
  37. Torabi, S.A.; Shokr, I.; Tofighi, S.; Heydari, J. Integrated relief pre-positioning and procurement planning in humanitarian supply chains. Transp. Res. E-Log. 2018, 113, 123–146. [Google Scholar] [CrossRef]
  38. Holguín-Veras, J.; Jaller, M. Immediate Resource Requirements after Hurricane Katrina. Nat. Hazards Rev. 2011, 13, 117–131. [Google Scholar] [CrossRef]
  39. Hu, S.L.; Ha, C.F.; Meng, L.P. Stochastic optimization for joint decision making of inventory and procurement in humanitarian relief. Comput. Ind. Eng. 2017, 111, 39–49. [Google Scholar] [CrossRef]
  40. Safaei, A.S.; Farsad, S.; Paydar, M.M. Robust bi-level optimization of relief logistics operations. Appl. Math. Model. 2018, 56, 359–380. [Google Scholar] [CrossRef]
  41. Kriswardhana, W.; Toaza, B.; Esztergár-Kiss, D.; Duleba, S. Analytic hierarchy process in transportation decision-making: A two-staged review on the themes and trends of two decades. Expert Syst. Appl. 2024, 261, 125491. [Google Scholar] [CrossRef]
  42. Xu, H.S.; Ma, C.; Lian, J.J.; Xu, K.; Chaima, E. Urban flooding risk assessment based on an integrated k-means cluster algorithm and improved entropy weight method in the region of Haikou, China. J. Hydrol. 2018, 563, 975–986. [Google Scholar] [CrossRef]
  43. Liu, W.; Cui, W.L.; Chen, M.J.; Hu, Q.; Song, Z. Operation Safety Risk Assessment of Water Distribution Networks Based on the Combined Weighting Method (CWM). KSCE J. Civ. Eng. 2023, 27, 2116–2130. [Google Scholar] [CrossRef]
  44. Al-abadi, A.M.; Handhal, A.M.; Adbulhasan, M.A.; Ali, W.L.; Hassan, J.; Al Aboodi, A.H. Optimal siting of large photovoltaic solar farms at Basrah governorate, Southern Iraq using hybrid GIS- based Entropy-TOPSIS and AHP-TOPSIS models. Renew. Energ. 2025, 241, 122308. [Google Scholar] [CrossRef]
  45. Peng, Y.; Zhang, R.R.; Yuan, T.; Cheng, L.; You, J. Evaluating perception of community resilience to typhoon disasters in China based on grey relational TOPSIS model. Int. J. Disaster Risk Reduct. 2023, 84, 103468. [Google Scholar] [CrossRef]
  46. Wang, X.; Li, F.; Liang, L.; Huang, Z.; Ashley, A. Pre-purchasing with option contract and coordination in a relief supply chain. Int. J. Prod. Econ. 2015, 167, 170–176. [Google Scholar] [CrossRef]
  47. Balcik, B.; Deniz, A.K. Supplier selection for framework agreements in humanitarian relief. Prod. Oper. Manag. 2014, 23, 1028–1041. [Google Scholar] [CrossRef]
  48. Birnbaum, M.L.; Daily, E.K.; O’rourke, A.P. Research and Evaluations of the Health Aspects of Disasters, Part III: Framework for the Temporal Phases of Disasters. Prehosp. Disaster. Med. 2015, 30, 628–632. [Google Scholar] [CrossRef] [PubMed]
  49. Wang, F.Y.; Xie, Z.L.; Pei, Z.W.; Liu, D. Emergency Relief Chain for Natural Disaster Response Based on Government-Enterprise Coordination. Int. J. Environ. Res. Public Health 2022, 19, 11255. [Google Scholar] [CrossRef]
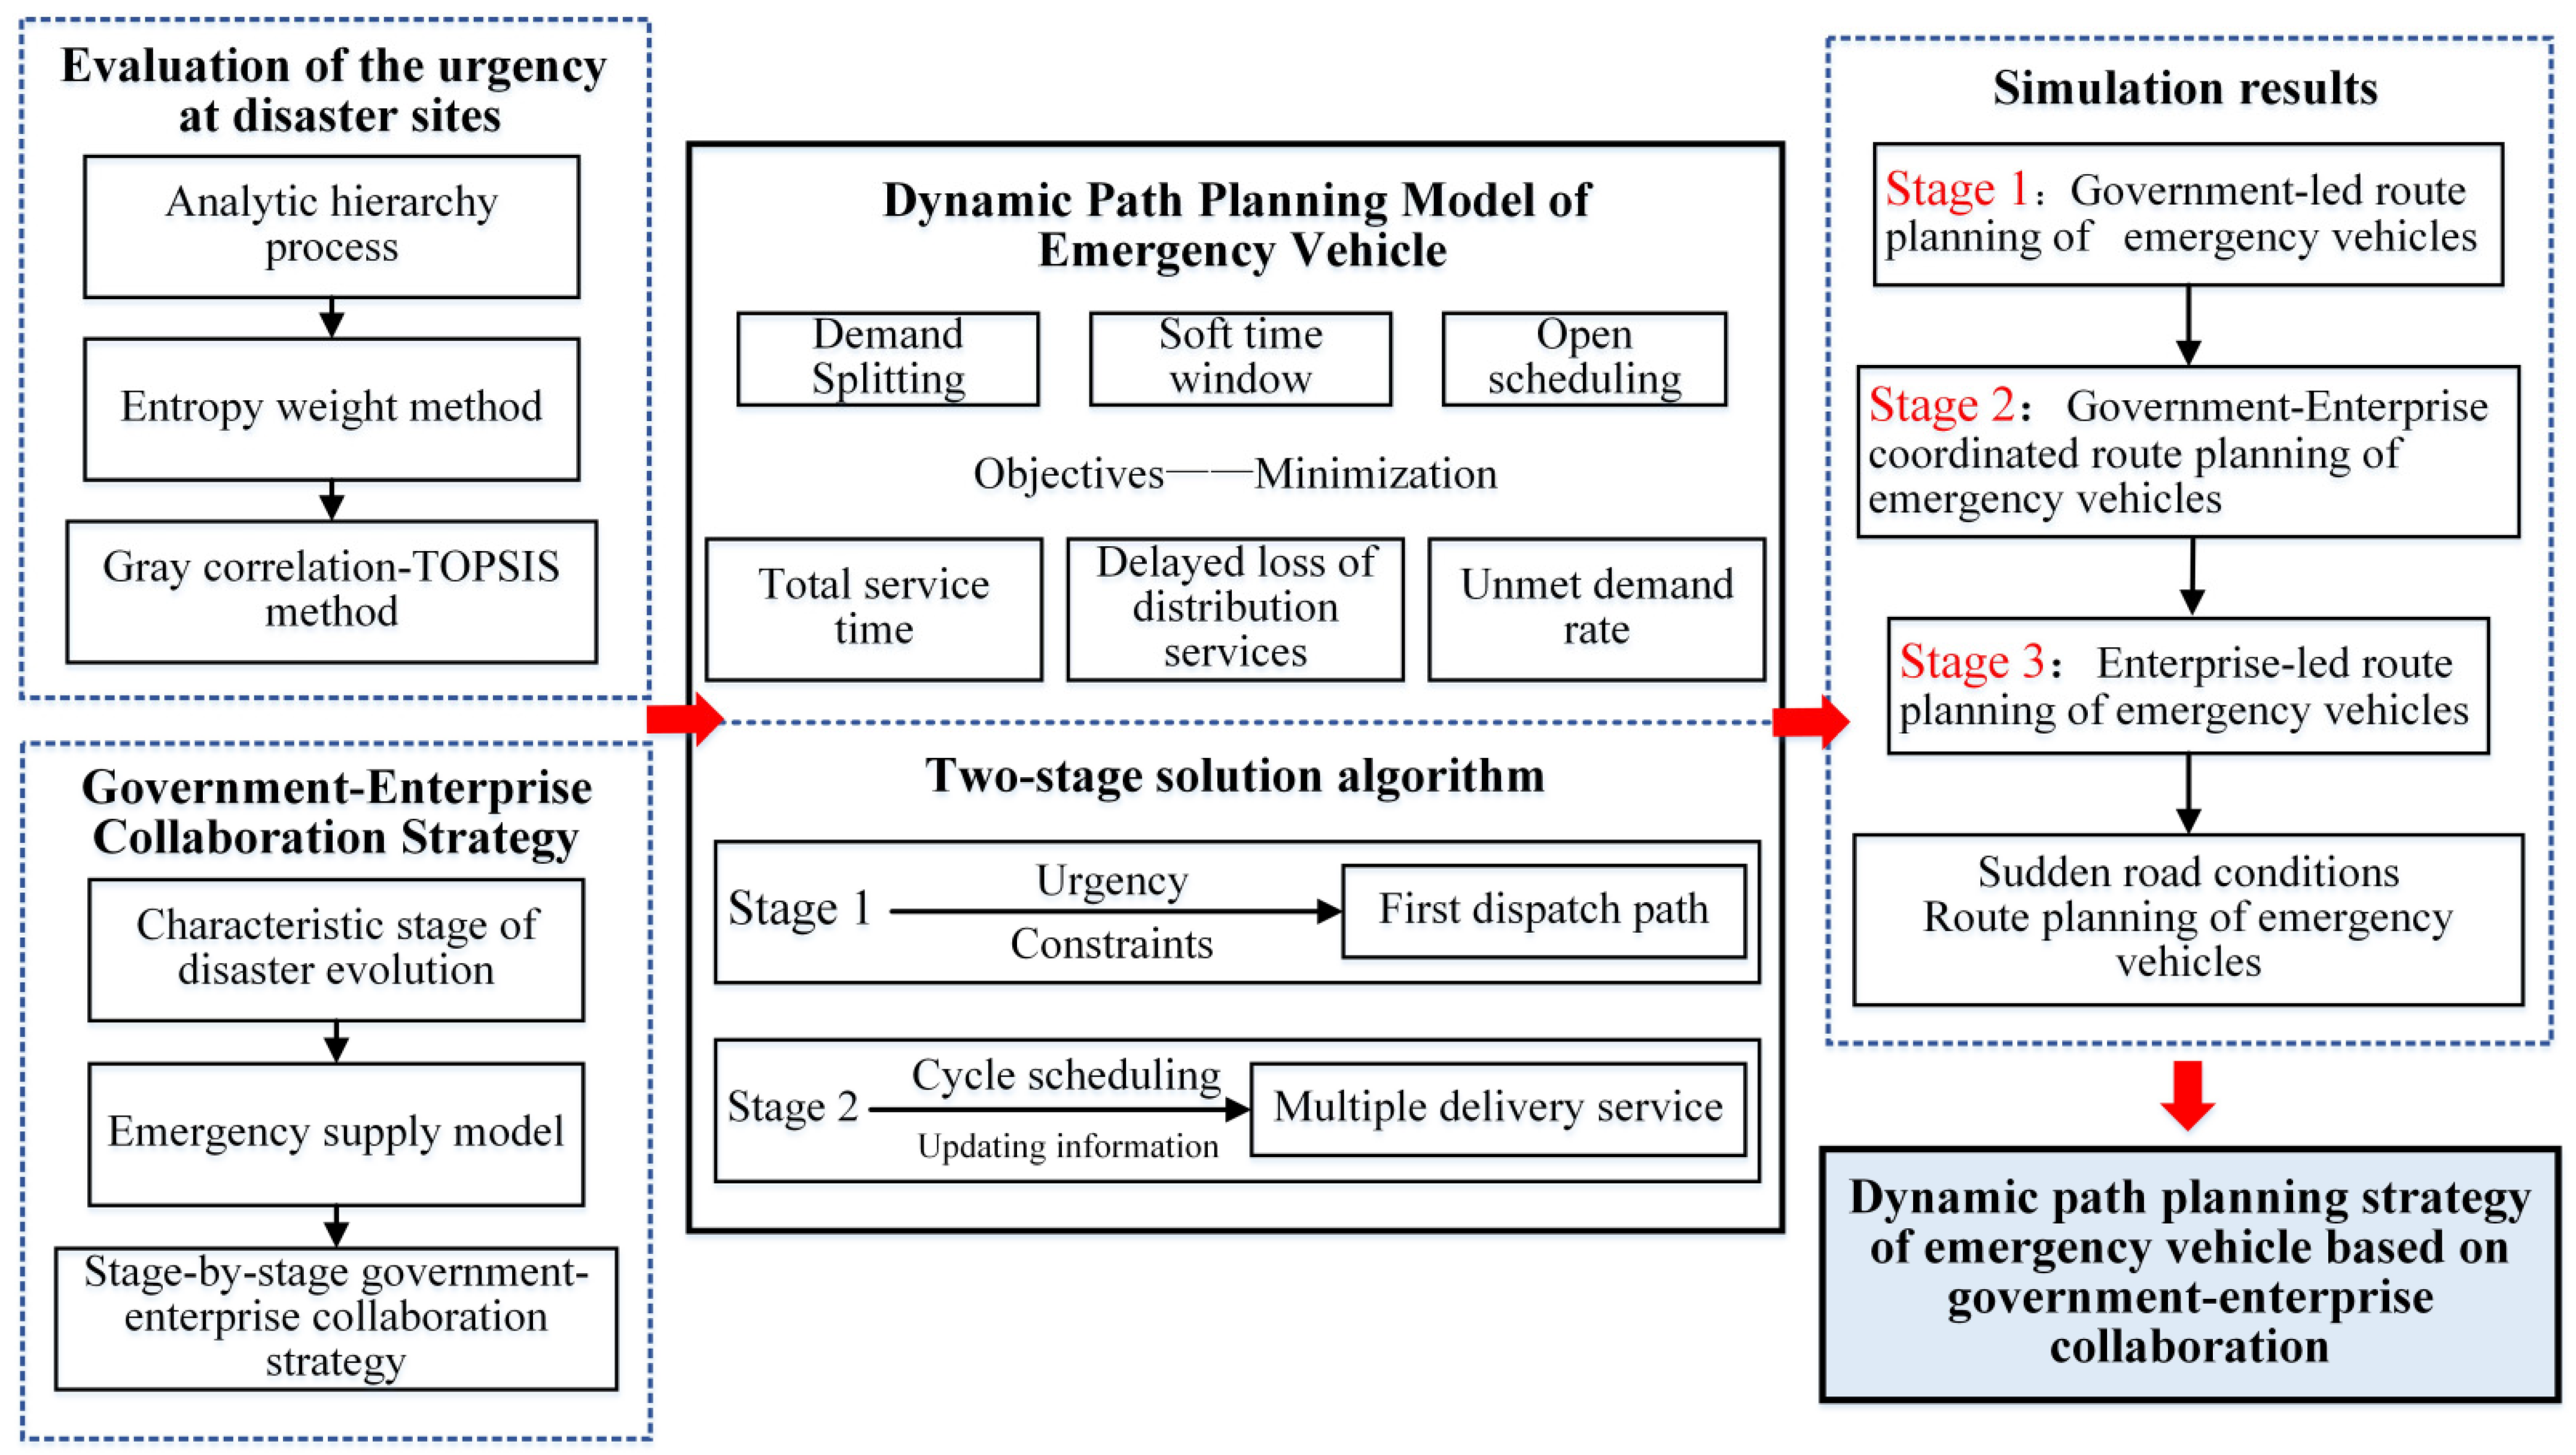
Figure 1. Dynamic route planning strategy of emergency vehicle.
Applsci 15 11496 g001
Figure 2. System of indicators affecting the demand urgency at disaster sites.
Applsci 15 11496 g002
Figure 3. The scheduling process of emergency supplies at each stage.
Applsci 15 11496 g003
Figure 4. Composition of delay losses.
Applsci 15 11496 g004
Figure 5. Disaster area map.
Applsci 15 11496 g005
Figure 6. The layout of the emergency facilities.
Applsci 15 11496 g006
Figure 7. First iteration of the algorithm.
Applsci 15 11496 g007
Figure 8. Vehicle path trajectory in the first stage.
Applsci 15 11496 g008
Figure 9. Vehicle path trajectory in the second stage.
Applsci 15 11496 g009
Figure 10. Vehicle path trajectory in the third stage.
Applsci 15 11496 g010
Figure 11. Comparison chart of simulation results.
Applsci 15 11496 g011
Table 1. Classification of vehicle routing problems.
Classification CriteriaTypes of Vehicle Routing ProblemsRelevant Explanation
Vehicle typeSingle modelOnly one delivery vehicle type is considered
Multi-modelMultiple delivery vehicle types are considered
Vehicle service methodsOne-to-one serviceOne vehicle serves a single customer node
One-to-many serviceOne vehicle serves multiple customer nodes
Number of distribution centersSingle distribution centerThe demand for all customer nodes is met by a single distribution center
Multi-distribution centersThe demand for all customer nodes requires multiple distribution centers
Whether material is split or notIndivisible supplyEach customer node’s supply demands can only be met by one distribution vehicle
Detachable suppliesEach customer node’s supply demands can only be met by multiple distribution vehicle
Time windowNo time windowCustomer nodes have no time limit for delivery services
Hard time windowThe customer node can only accept services within the specified time period
Soft time windowThe customer node can accept the service outside the specified time period, but the distributor needs to bear some cost
Demand stateStatic demand issuesThe requirements of customer nodes are fixed
Dynamic demand issuesThe demand information of customer nodes will change during the distribution process
Parking lot ownershipEnclosed parking lotDistribution vehicles follow the strict route of “distribution center—customer node—original distribution center”
Open parking lotThe delivery vehicle starts from the distribution center, serves a series of customer nodes, and does not need to return the same way
Number of decision-making targetsSingle-objectiveThere is only one objective function in the optimization model
Multi-objectiveThere are multiple objective functions in the optimization model
Table 2. Sets, parameters, and variables.
TypeTermDefinition
Sets J jJ, set of emergency facilities, including government reserves and enterprise production points
I iI, set of disaster sites
V v ∈ V, set of nodes, including emergency facilities and disaster sites
M m ∈ M, set of vehicles
C m cm C m , set of path tasks for vehicles
T tT, route planning phase in the post-disaster
Parameters Q m The rated loading capacity of vehicles m
d i t Demand for emergency supplies at disaster sites i in phase t
d i t , c m The volume of supplies transported by path c m from the disaster site i in phase t
T m The maximum continuous travel time of a vehicle m in a single path
S i Time of stay in service at the disaster site i
0 , l i Soft time windows at disaster sites i
t i , c m Moment of arrival at the disaster sites i via path c m
P u , v Passage time between nodes u and v
Variables x c m u , v , t 1, if the path c m is from node u to node v at the stage t ; otherwise, 0
y c m i , t 1, if the path c m serves disaster sites i ; otherwise, 0
Table 3. Case illustration.
EquationExamples
(18)Site I: d i = 65, Q m = 20→N = [65/20]→Split: [20, 20, 20, 5] units
(22)Violated path: Vehicle 1 initial route [17, 20, 19, 18, 8, 7, 9]→Load = 122 > 20 units
Compliant path: Adjusted route [17, 20, 19, 18]→Segmented delivery
(23)Executed in Section 3.2: Vehicle 3 path
[ G 3 →H→6→A→7→G→ G 1 →F, H]
V P u , v = 210 < T m = 480 min
(24)Start at enterprise 5: Outflow x5,B→Net flow = 1
Intermediate node B: Inflow = 1, Outflow = 1→Net flow = 0
End at F: Inflow xG1,F = 1→Net flow = −1
(25)Executed in Section 3.2: Vehicle 3 path
[ G 3 →H→6→A→7→G→ G 1 →F, H]
The disaster site H, A, G, F
(26)Each disaster area has received services.
(27)Executed in Section 3.2: Vehicle 3 path
xG1,H = 1, yH = 1→xG1,H = yH
(28)Calculated for Site A:
Path 1: tA = 0 + 0 + PG1,A = 125 min
Path 2: tB = tA + SA + PA,B = 125 + 15 + 20 = 160 min
Table 6. Emergency supplies requirements by phase.
Disaster SiteEmergency Supplies Requirements/Unit
Stage 1Stage 2Stage 3
A266040
B174027
C235436
D112617
E4811476
F358355
G5713388
H327549
I65152101
Table 7. Indicator data.
Disaster SiteEnvironmental FactorsFacility FactorsDemographic Factors
B1,1
/mm
B1,2B1,3/ k m 2 B2,1
/Ten Thousand
B2,2B3,1
/Ten Thousand
B3,2
/Ten Thousand
B3,3
/Ten Thousand
A617.9I24012.03 × 10 4 I360.04.712,198
B566.4III22398308II239.81.62015
C450.0III15654800I320.09.13218
D438.5III4027.35 × 10 4 I155.02330,000
E432.9III17818.49 × 10 4 I68.562240,381
F416.6II17514175I49.672.15132
G411.5III25684043III79.812.5750
H367.3III32483.27 × 10 4 II44.82107000
I343.3I19661665III90.961.9532
Table 8. Comparison of weighting methods for urgency assessment.
MethodWeight StabilityComputation TimeAnnotation
AHP-only0.32 ± 0.0518.2 sOnly subjective weights, relying on expert judgment.
EWM-only0.11 ± 0.025.1 sOnly objective weights, relying on data entropy values.
CRITIC0.15 ± 0.0323.7 sOnly subjective weights
Proposed hybrid (θ = 0.6)0.09 ± 0.0126.5 sBalancing subjectivity and objectivity
Table 9. Government-led services at disaster sites.
Disaster SiteVolume of DemandSplit Disaster SitesSplit DemandStarting Time of Service/minSatisfaction Rate/%
A261, 2[20, 6]329/Not served20/26 = 76.9%
B173[17]15017/17 = 100%
C234, 5[20, 3]328/17423/23 = 100%
D116[11]Not served0/11 = 0%
E487, 8, 9[20, 20, 8]247/257/Not served28/48 = 58.3%
F3510, 11[20, 15]353/17135/35 = 100%
G5712, 13, 14[20, 20, 17]Not served/91/Not served20/57 = 35.1%
H3215, 16[20, 12]145/Not served20/32 = 62.5%
I6517, 18, 19, 20[20, 20, 20, 5]97/Not served/21/1621/65 = 32.3%
-System: 220/314 = 70.1%
Table 10. Statistical results from 30 runs.
MetricGovernment-Only (Avg ± SD)Collaboration (Avg ± SD)Improvement (95% CI)p-Value
Total Supplies220.3 ± 4.8360.2 ± 3.1+63.5%
(61.2%, 65.8%)
<0.001 *
Unit Time1.61 ± 0.051.23 ± 0.03−23.6%
(−25.1%, −22.1%)
<0.001 *
Satisfaction Rate70.1 ± 1.592.3 ± 0.9+22.2%
(21.0%, 23.4%)
<0.001 *
Note: * indicates a 95% confidence level of significance.
Table 11. Vehicle dispatch sequence.
Vehicle NumberTask List
1[ G 1 →I→ G 1 →E→ G 1 →I→ G 1 →G→ G 1 →I, D]
2[ G 2 →B→5→C→4→E]
3[ G 3 →H→6→A→7→G→ G 1 →F, H]
4[1→D→1→I→ G 1 →I]
5[2→G→ G 1 →E→ G 1 →I→ G 1 →G→ G 1 →G]
6[3→E→ G 1 →E→ G 1 →G→ G 1 →I]
7[4→C→4→C→4→I]
8[5→B→5→E→ G 1 →F]
9[6→F→6→F→6→H→6→H]
10[7→A→7→A→7→G→ G 1 →F]
Table 12. Service situation at disaster sites under the government-enterprise collaboration strategy.
Disaster SiteVolume of DemandSplit Disaster SitesSplit DemandStarting Time of Service/min
A601, 2, 3[20, 20, 20]125/251/354
B404, 5[20, 20]89/150
C546, 7, 8[20, 20, 14]158/325/430
D269, 10[20, 6]161/852
E11411, 12, 13, 14, 15, 16[20, 20, 20, 20, 20, 14]154/274/280/
315/440/707
F8317, 18, 19, 20, 21[20, 20, 20, 20, 3]139/296/653/
661/762
G13322, 23, 24, 25, 26, 27, 28[20, 20, 20, 20, 20, 20, 13]102/429/436/532/
535/538/655
H7529, 30, 31, 32[20, 20, 20, 15]145/430/573/908
I15233, 34, 35, 36, 37, 38, 39, 40[20, 20, 20, 20, 20, 20, 20, 12]97/395/399/401/
422/561/563/670
Table 13. Vehicle dispatch sequence.
Vehicle NumberTask List
1[1→D→1→G]
2[2→I→2→I→2→H, B]
3[2→G→2→I→2→G]
4[3→E→3→E→3→B]
5[3→E→3→I]
6[4→C→4→C→4→I]
7[5→B→5→I]
8[6→F→6→F→6→F]
9[6→H→6→A→7→G, H]
10[7→A→7→G→2→E]
Table 14. Enterprise-led services at disaster sites.
Disaster SiteVolume of DemandSplit Disaster SitesSplit DemandStarting Time of Service/min
A401, 2[20, 20]125/313
B273, 4[20, 7]89/743
C365, 6[20, 16]158/324
D177[17]161
E768, 9, 10, 11[20, 20, 20, 16]154/154/320/507
F5512, 13, 14[20, 20, 15]139/291/444
G8815, 16, 17, 18, 19[20, 20, 20, 20, 8]102/308/366/466/558
H4920, 21, 22[20, 20, 9]113/551/735
I10123, 24, 25, 26, 27, 28[20, 20, 20, 20, 20, 1]110/232/248/385/392/667
Table 15. Vehicle dispatch sequence under sudden road conditions.
Vehicle NumberTask List
1[1→D→1→G]
2[2→I→2→I→2→F]
3[2→G→2→I→2→G]
4[3→E→3→E→3→B]
5[3→E→3→I]
6[4→C→4→C→4→I]
7[5→B→5→I]
8[6→F→6→H→6→H, G]
9[6→H→6→B→7→F]
10[7→A→7→G→2→E]
Table 16. Algorithm performance comparison.
AlgorithmDemand Satisfaction (%)Unit Time (min/unit)Convergence (Iterations)
NSGA-II87.1 ± 1.21.41 ± 0.05146 ± 11
PSO79.6 ± 3.31.67 ± 0.1089 ± 6
Tabu Search83.5 ± 2.11.58 ± 0.07-
Two-stage CGA92.3 ± 0.91.23 ± 0.03112 ± 8
Disclaimer/Publisher’s Note: The statements, opinions and data contained in all publications are solely those of the individual author(s) and contributor(s) and not of MDPI and/or the editor(s). MDPI and/or the editor(s) disclaim responsibility for any injury to people or property resulting from any ideas, methods, instructions or products referred to in the content.