Dynamic Route Planning Strategy for Emergency Vehicles with Government–Enterprise Collaboration: A Regional Simulation Perspective
Abstract
1. Introduction
1.1. Literature Review
1.2. Our Work
2. Materials and Methods
2.1. The Evaluation Framework of the Demand Urgency at Disaster Sites
2.1.1. Analytic Hierarchy Process
2.1.2. Entropy Weight Method
2.1.3. GRA-TOPSIS Method
2.2. Government-Enterprise Collaboration Strategy in the Post-Disaster
2.3. Dynamic Route Planning Model of Emergency Vehicles
2.3.1. Demand Splitting Strategy
2.3.2. Presumptions
- The rated capacity of the emergency vehicles is known, and the demand at each affected site can be split to accommodate multiple delivery services.
- Based on unilateral soft time windows, delivery services that exceed the time windows are penalized. Emergency vehicle paths are planned within decision cycles, and services are executed at affected sites.
- The maximum continuous travel time for emergency vehicles is predetermined, and the planned travel time for any single path does not exceed the upper limit of vehicle travel time.
- Emergency vehicles undertake multiple distribution routes. After completing a task, they stop at the last disaster point, awaiting nearby replenishment and secondary dispatch.
2.3.3. Sets, Parameters and Variables
2.3.4. Objectives
2.3.5. Constraints
2.4. Solution Method
- (1)
- The Route Planning Algorithm in the First Stage
| The Route Planning Algorithm in the First Stage |
|---|
| Input: |
| : population size; |
| : number of algorithm runs; |
| : affected point; |
| : demand for emergency supplies; |
| : vehicle capacity; |
| : demand urgency of disaster point; |
| : number of emergency facilities; |
| : the longest continuous driving time; |
| : time; |
| : soft time window; |
| : service time; |
| : transit time; |
| : number of emergency vehicles; |
| Split the disaster point: |
| For |
| = ; |
| Disaster point information update, parameter information , , , , , ; ; |
| End for |
| Coding and population initialization: |
| For |
| According to the natural number coding, chromosome are generated to complete the population initialization.: ; |
| End for |
| Genetic manipulation: |
| While |
| For |
| Calculate , perform genetic operations; |
| End for |
| Divide the path: |
| Choose the best chromosome, ; |
| ; |
| For |
| ; ; ; |
| End for |
| End while |
- (2)
- The Route Planning Algorithm in the Second Stage
| The Route Planning Algorithm in the Second Stage |
|---|
| information processing: |
| The initial path of the first stage is constrained by the distribution conditions, and the first round scheduling path of the emergency vehicle is obtained; |
| For |
| Record the service situation of the affected points and the split affected points [affected points, split the affected points, split the demand, split the affected points with the service, split the affected points without the service, did not meet the demand]; ; |
| End for |
| For |
| Record vehicle scheduling task information [vehicle serial number, stop node, end time]; ; |
| End for |
| While ~isempty |
| Based on information update, the subsequent scheduling path is planned for the vehicle that ends the scheduling task earliest; |
| Proximity replenishment mechanism ; Choose the emergency facility to go to the replenishment ; |
| The unserviced affected points plan the path one by one, and the emergency vehicles are put into circulation; |
| Genetic manipulation: |
| While |
| Based on the demand urgency of the affected point, the chromosome of the path is constructed; |
| End while |
| For |
| Calculate , perform genetic operations;; |
| End for |
| Choose the best chromosome, ; |
| information updating: |
| Update the service situation of the disaster point, vehicle scheduling task information and possible dynamic information; |
| End while |
2.5. Study Area and Data
2.5.1. Study Area
2.5.2. Data
3. Results
3.1. Government-Led Route Planning of Emergency Vehicles
3.2. Government-Enterprise Coordinated Route Planning of Emergency Vehicles
3.3. Enterprise-Led Route Planning of Emergency Vehicles
3.4. Route Planning of Emergency Vehicles Under Sudden Road Conditions
4. Discussion
5. Conclusions
Author Contributions
Funding
Institutional Review Board Statement
Informed Consent Statement
Data Availability Statement
Conflicts of Interest
References
- Shi, Y.; Shen, Y.; Kang, E.; Li, D.; Ding, Y.; Zhang, G.; Hu, R. Recent and Future Climate Change in Northwest China. Clim. Change 2007, 80, 379–393. [Google Scholar] [CrossRef]
- Curnin, S.; Owen, C. Obtaining information in emergency management: A case study from an Australian emergency operations centre. Int. J. Hum. Fac. Ergon. 2013, 2, 131–158. [Google Scholar] [CrossRef]
- Shen, G.; Hwang, S.N. Spatial-Temporal snapshots of global natural disaster impacts Revealed from EM-DAT for 1900–2015. Geomat. Nat. Haz. Risk 2019, 10, 912–934. [Google Scholar] [CrossRef]
- Rawls, C.G.; Turnquist, M.A. Pre-positioning of emergency supplies for disaster response. Transp. Res. B-Meth. 2010, 44, 521–534. [Google Scholar] [CrossRef]
- Chi, H.; Li, J.; Shao, X.; Gao, M. Timeliness evaluation of emergency resource scheduling. Eur. J. Oper. Res. 2017, 258, 1022–1032. [Google Scholar] [CrossRef]
- Rivera-Royero, D.; Galindo, G.; Yie-Pinedo, R. A dynamic model for disaster response considering prioritized demand points. Socio-Econ. Plan Sci. 2016, 55, 59–75. [Google Scholar] [CrossRef]
- Perez-Rodriguez, N.; Holguin-Veras, J. Inventory-Allocation Distribution Models for Postdisaster Humanitarian Logistics with Explicit Consideration of Deprivation Costs. Transp. Sci. 2016, 50, 1261–1285. [Google Scholar] [CrossRef]
- Wang, D.; Qi, C.; Wang, H. Improving emergency response collaboration and resource allocation by task network mapping and analysis. Saf. Sci. 2014, 70, 9–18. [Google Scholar] [CrossRef]
- Lei, L.; Lee, K.; Dong, H. A heuristic for emergency operations scheduling with lead times and tardiness penalties. Eur. J. Oper. Res. 2016, 250, 726–736. [Google Scholar] [CrossRef]
- Moreno, A.; Alem, D.; Ferreira, D.; Clark, A. An effective two-stage stochastic multi-trip location-transportation model with social concerns in relief supply chains. Eur. J. Oper. Res. 2018, 269, 1050–1071. [Google Scholar] [CrossRef]
- Hu, Y.; Liu, Q.; Li, S.; Wu, W. Robust emergency logistics network design for pandemic emergencies under demand uncertainty. Transp. Res. E-Log. 2025, 196, 103927. [Google Scholar] [CrossRef]
- Kundu, T.; Sheu, J.; Kuo, H. Emergency logistics management—Review and propositions for future research. Transp. Res. E-Log. 2022, 164, 102789. [Google Scholar] [CrossRef]
- Shen, J.; Liu, K.; Ma, C.; Zhao, Y.; Shi, C. Bibliometric analysis and system review of vehicle routing optimization for emergency material distribution. J. Traffic Transp. Eng. 2022, 9, 893–911. [Google Scholar] [CrossRef]
- Wang, H.; Qiu, H.; Wang, D.; Duan, J.; Wang, Y.; Cheng, T. An integrated location-routing problem with post-disaster relief distribution. Comput. Ind. Eng. 2020, 147, 106632. [Google Scholar]
- Qi, C.; Hu, L. Optimization of vehicle routing problem for emergency cold chain logistics based on minimum loss. Phys. Commun. 2020, 40, 101085. [Google Scholar] [CrossRef]
- Gulczynski, D.; Golden, B.; Wasil, E. The multi-depot split delivery vehicle routing problem: An integer programming-based heuristic, new test problems, and computational results. Comput. Ind. Eng. 2011, 61, 794–804. [Google Scholar] [CrossRef]
- Sheu, J.B. Dynamic relief-demand management for emergency logistics operations under large-scale disasters. Transp. Res. E-Log. 2010, 46, 1–17. [Google Scholar] [CrossRef]
- Wang, H.; Du, L.; Ma, S. Multi-objective open location-routing model with split delivery for optimized relief distribution in post-earthquake. Transp. Res. E-Log. 2014, 69, 160–179. [Google Scholar] [CrossRef]
- Wang, Y.; Wang, X.W.; Fan, J.X.; Wang, Z.; Zhen, L. Emergency logistics network optimization with time window assignment. Expert Syst. Appl. 2023, 214, 119145. [Google Scholar] [CrossRef]
- Spliet, R.; Desaulniers, G. The discrete time window assignment vehicle routing problem. Eur. J. Oper. Res. 2015, 244, 379–391. [Google Scholar] [CrossRef]
- Li, W.; Jiang, R.; Wu, H.; Xie, J.; Zhao, Y.; Li, F.; Lu, X. A new two-stage emergency material distribution framework for urban rainstorm and flood disasters to promote the SDGs. Sustain. Cities Soc. 2024, 112, 105645. [Google Scholar] [CrossRef]
- Chang, K.H.; Chiang, Y.C.; Chang, T.Y. Simultaneous location and vehicle fleet sizing of relief goods distribution centers and vehicle routing for post-disaster logistics. Comput. Oper. 2024, 161, 106404. [Google Scholar] [CrossRef]
- Wu, Y.Y.; Chen, S. Resilience modeling and pre-hazard mitigation planning of transportation network to support post-earthquake emergency medical response. Reliab. Eng. Sys. Safe 2023, 230, 108918. [Google Scholar] [CrossRef]
- Zhao, Y.; Zhang, L. An advanced study of urban emergency medical equipment logistics distribution for different levels of urgency demand. Int. J. Environ. 2022, 19, 11264. [Google Scholar] [CrossRef]
- Ji, G.; Zhu, C. A Study on Emergency Supply Chain and Risk Based on Urgent Relief Service in Disasters. Syst. Eng. Procedia 2012, 5, 313–325. [Google Scholar] [CrossRef]
- Huang, L.; Shi, P.; Zhu, H. An integrated urgency evaluation approach of relief demands for disasters based on social media data. Int. J. Disaster Risk Reduct. 2022, 80, 103208. [Google Scholar] [CrossRef]
- Nasibov, E.N.; Ulutagay, G. A new unsupervised approach for fuzzy clustering. Fuzzy Sets Syst. 2007, 158, 2118–2133. [Google Scholar] [CrossRef]
- Chen, S.J.; Hwang, C.L. Fuzzy Multiple Attribute Decision Making Methods and Applications; Springer: Berlin/Heidelberg, Germany, 1992. [Google Scholar]
- Chen, D.; Fang, Y. Urgency Evaluation of Emergency Demand in Emergency Logistics Operation Based on FAHP. In Proceedings of the IEEE 3rd International Conference on Emergency Management and Management Sciences (ICEMMS), Changsha, China, 1–8 January 2013; pp. 1–4. [Google Scholar]
- Curnin, S.; Owen, C.; Paton, D.; Brooks, B. A theoretical framework for negotiating the path of emergency management multi-agency coordination. Appl. Ergon. 2015, 47, 300–307. [Google Scholar] [CrossRef] [PubMed]
- Coles, J.B.; Zhang, J.; Zhuang, J. Partner selection in disaster relief: Partnership formation in the presence of incompatible agencies. Int. J. Disaster Risk Reduct. 2018, 27, 94–104. [Google Scholar] [CrossRef]
- Binder, S.B.; Baker, C.K. Culture, local capacity, and outside aid: A community perspective on disaster response after the 2009 tsunami in American Sāmoa. Disasters 2017, 41, 282–305. [Google Scholar] [CrossRef]
- Alban, A.; Blaettchen, P.; Vries, H.D.; Van Wassenhove, L.N. Resource Allocation with Sigmoidal Demands: Mobile Healthcare Units and Service Adoption. Manuf. Serv. Oper. Manag. 2022, 24, 2797–3306. [Google Scholar] [CrossRef]
- Zhang, L. Emergency supplies reserve allocation within government-private cooperation: A study from capacity and response perspectives. Comput. Ind. Eng. 2021, 154, 107171. [Google Scholar] [CrossRef]
- Nikkhoo, F.; Bozorgi-amiri, A.; Heydari, J. Coordination of relief items procurement in humanitarian logistic based on quantity flexibility contract. Int. J. Disaster Risk Reduct. 2018, 31, 331–340. [Google Scholar] [CrossRef]
- Govindan, K.; Diabat, A.; Popiuc, M.N. Contract analysis: A performance measures and profit evaluation within two-echelon supply chains. Comput. Ind. Eng. 2012, 63, 58–74. [Google Scholar] [CrossRef]
- Torabi, S.A.; Shokr, I.; Tofighi, S.; Heydari, J. Integrated relief pre-positioning and procurement planning in humanitarian supply chains. Transp. Res. E-Log. 2018, 113, 123–146. [Google Scholar] [CrossRef]
- Holguín-Veras, J.; Jaller, M. Immediate Resource Requirements after Hurricane Katrina. Nat. Hazards Rev. 2011, 13, 117–131. [Google Scholar] [CrossRef]
- Hu, S.L.; Ha, C.F.; Meng, L.P. Stochastic optimization for joint decision making of inventory and procurement in humanitarian relief. Comput. Ind. Eng. 2017, 111, 39–49. [Google Scholar] [CrossRef]
- Safaei, A.S.; Farsad, S.; Paydar, M.M. Robust bi-level optimization of relief logistics operations. Appl. Math. Model. 2018, 56, 359–380. [Google Scholar] [CrossRef]
- Kriswardhana, W.; Toaza, B.; Esztergár-Kiss, D.; Duleba, S. Analytic hierarchy process in transportation decision-making: A two-staged review on the themes and trends of two decades. Expert Syst. Appl. 2024, 261, 125491. [Google Scholar] [CrossRef]
- Xu, H.S.; Ma, C.; Lian, J.J.; Xu, K.; Chaima, E. Urban flooding risk assessment based on an integrated k-means cluster algorithm and improved entropy weight method in the region of Haikou, China. J. Hydrol. 2018, 563, 975–986. [Google Scholar] [CrossRef]
- Liu, W.; Cui, W.L.; Chen, M.J.; Hu, Q.; Song, Z. Operation Safety Risk Assessment of Water Distribution Networks Based on the Combined Weighting Method (CWM). KSCE J. Civ. Eng. 2023, 27, 2116–2130. [Google Scholar] [CrossRef]
- Al-abadi, A.M.; Handhal, A.M.; Adbulhasan, M.A.; Ali, W.L.; Hassan, J.; Al Aboodi, A.H. Optimal siting of large photovoltaic solar farms at Basrah governorate, Southern Iraq using hybrid GIS- based Entropy-TOPSIS and AHP-TOPSIS models. Renew. Energ. 2025, 241, 122308. [Google Scholar] [CrossRef]
- Peng, Y.; Zhang, R.R.; Yuan, T.; Cheng, L.; You, J. Evaluating perception of community resilience to typhoon disasters in China based on grey relational TOPSIS model. Int. J. Disaster Risk Reduct. 2023, 84, 103468. [Google Scholar] [CrossRef]
- Wang, X.; Li, F.; Liang, L.; Huang, Z.; Ashley, A. Pre-purchasing with option contract and coordination in a relief supply chain. Int. J. Prod. Econ. 2015, 167, 170–176. [Google Scholar] [CrossRef]
- Balcik, B.; Deniz, A.K. Supplier selection for framework agreements in humanitarian relief. Prod. Oper. Manag. 2014, 23, 1028–1041. [Google Scholar] [CrossRef]
- Birnbaum, M.L.; Daily, E.K.; O’rourke, A.P. Research and Evaluations of the Health Aspects of Disasters, Part III: Framework for the Temporal Phases of Disasters. Prehosp. Disaster. Med. 2015, 30, 628–632. [Google Scholar] [CrossRef] [PubMed]
- Wang, F.Y.; Xie, Z.L.; Pei, Z.W.; Liu, D. Emergency Relief Chain for Natural Disaster Response Based on Government-Enterprise Coordination. Int. J. Environ. Res. Public Health 2022, 19, 11255. [Google Scholar] [CrossRef]
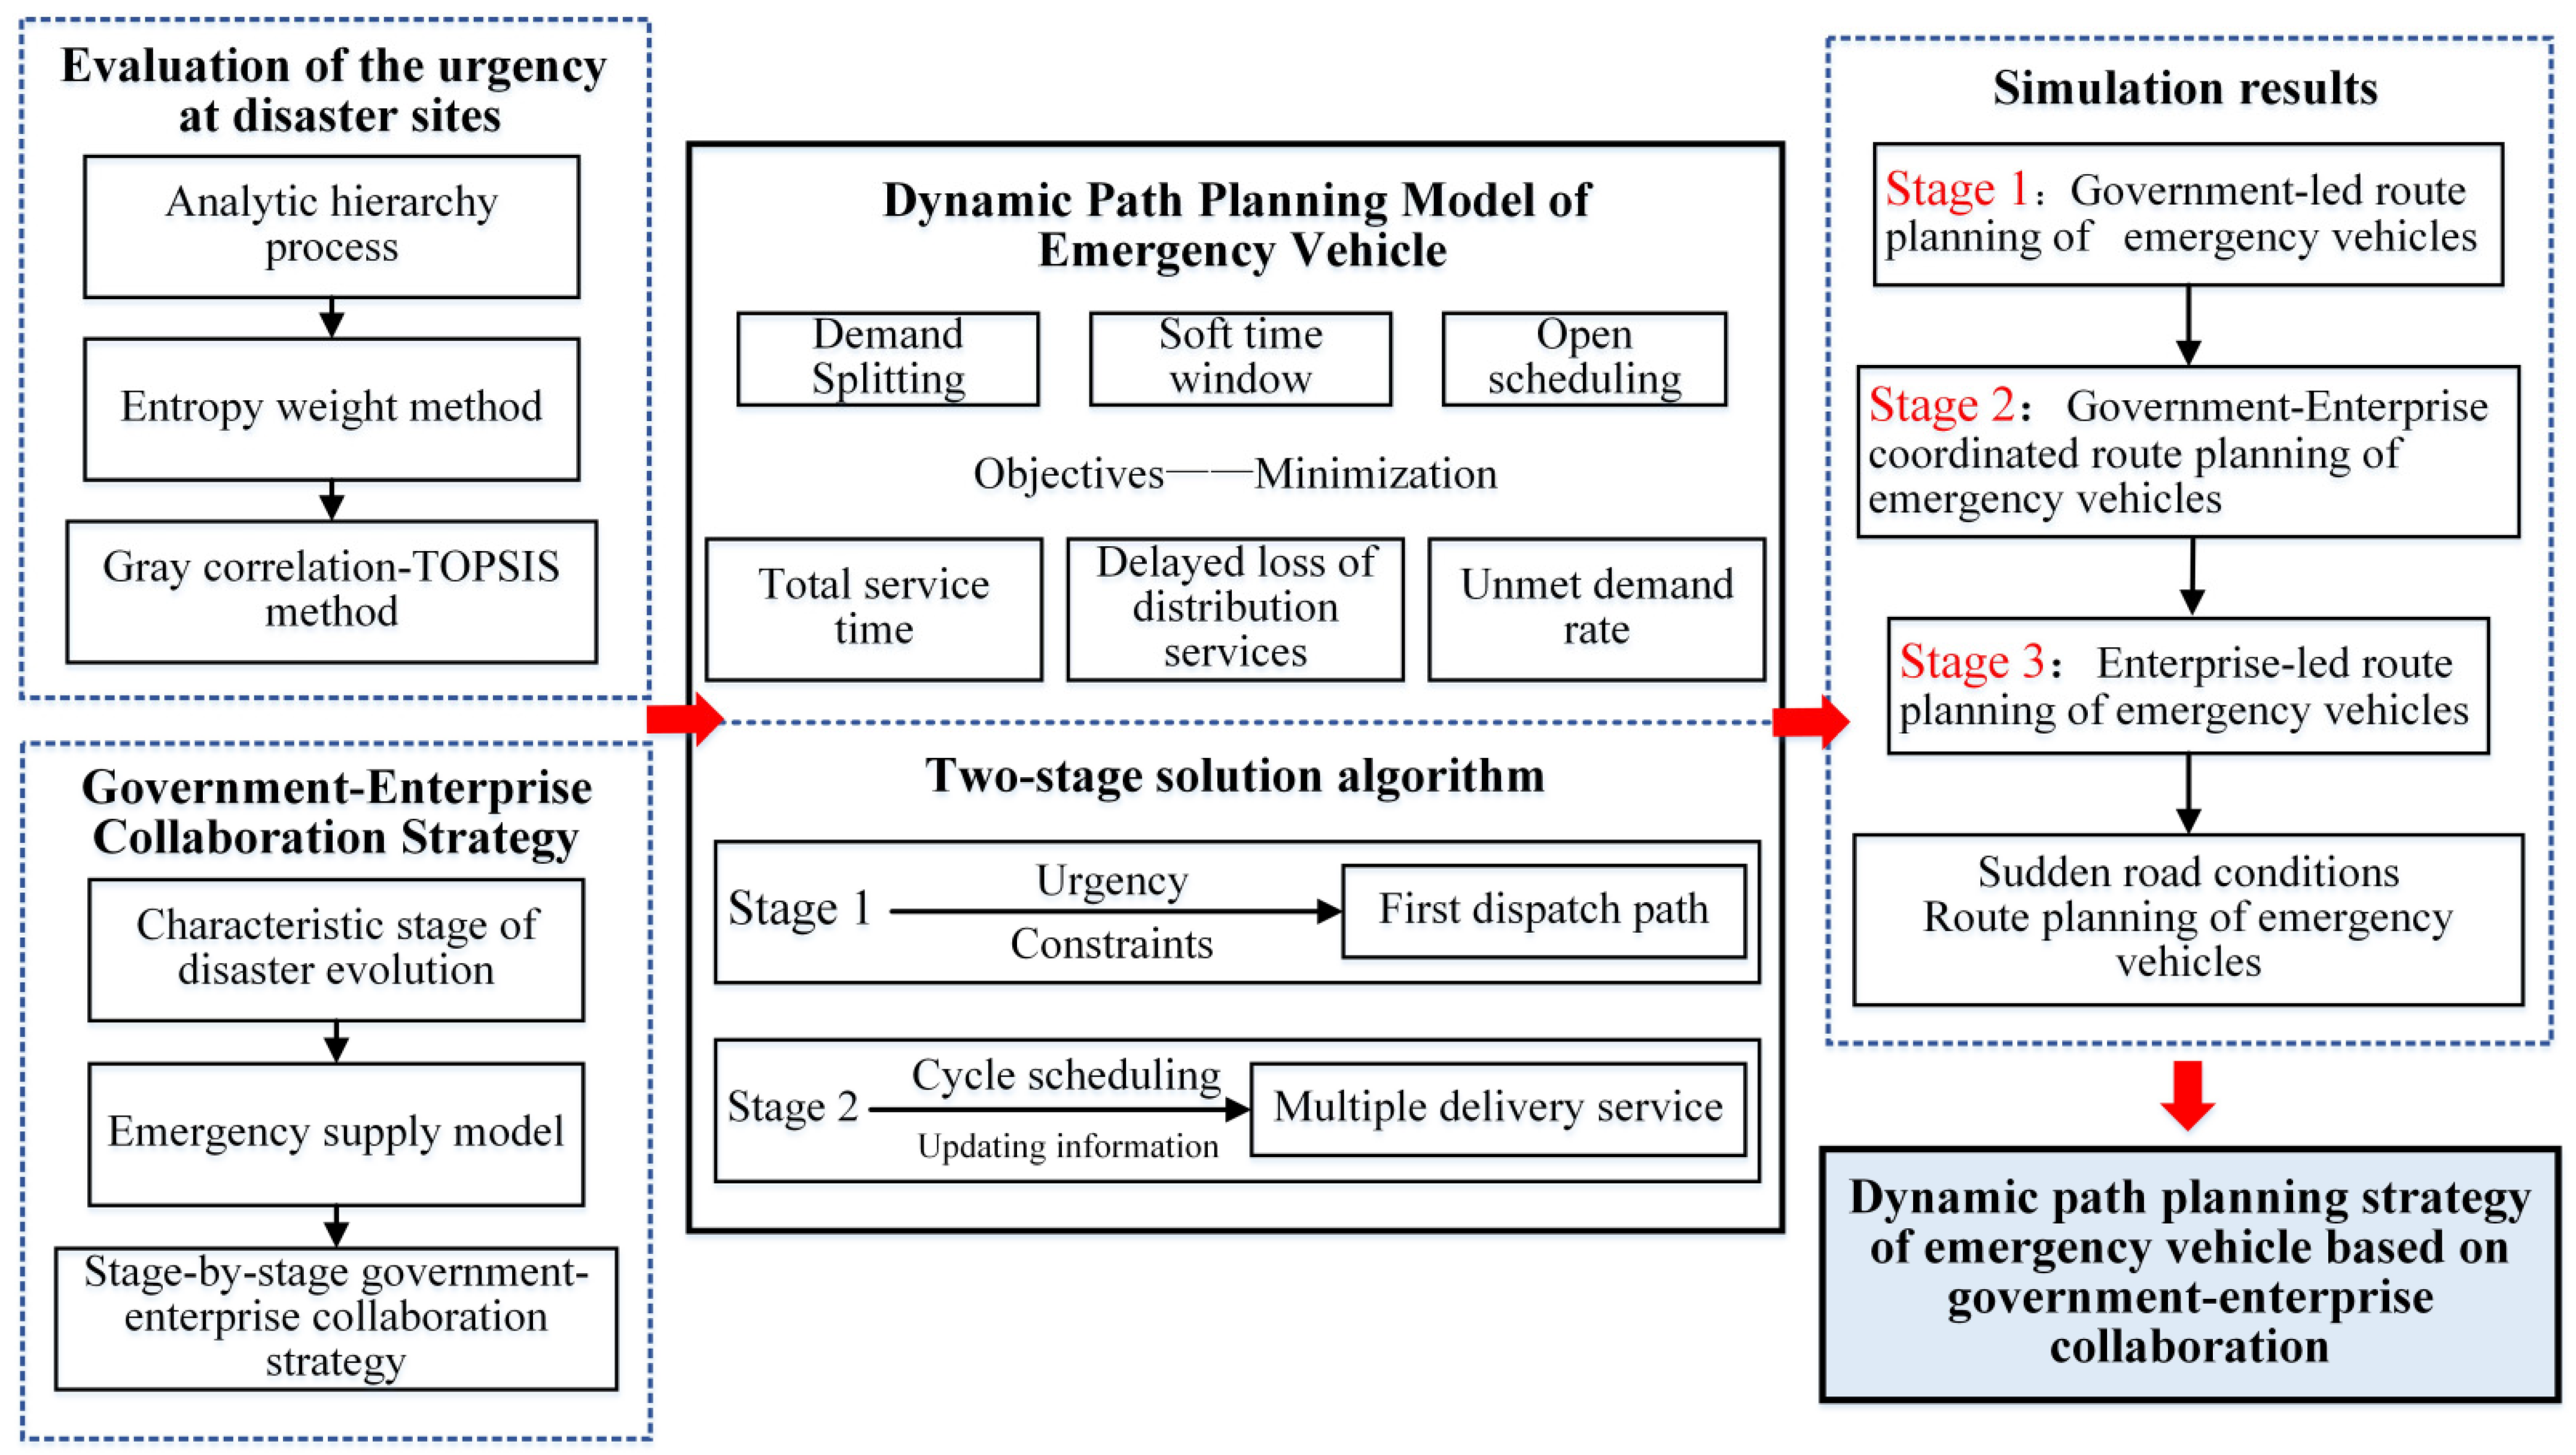

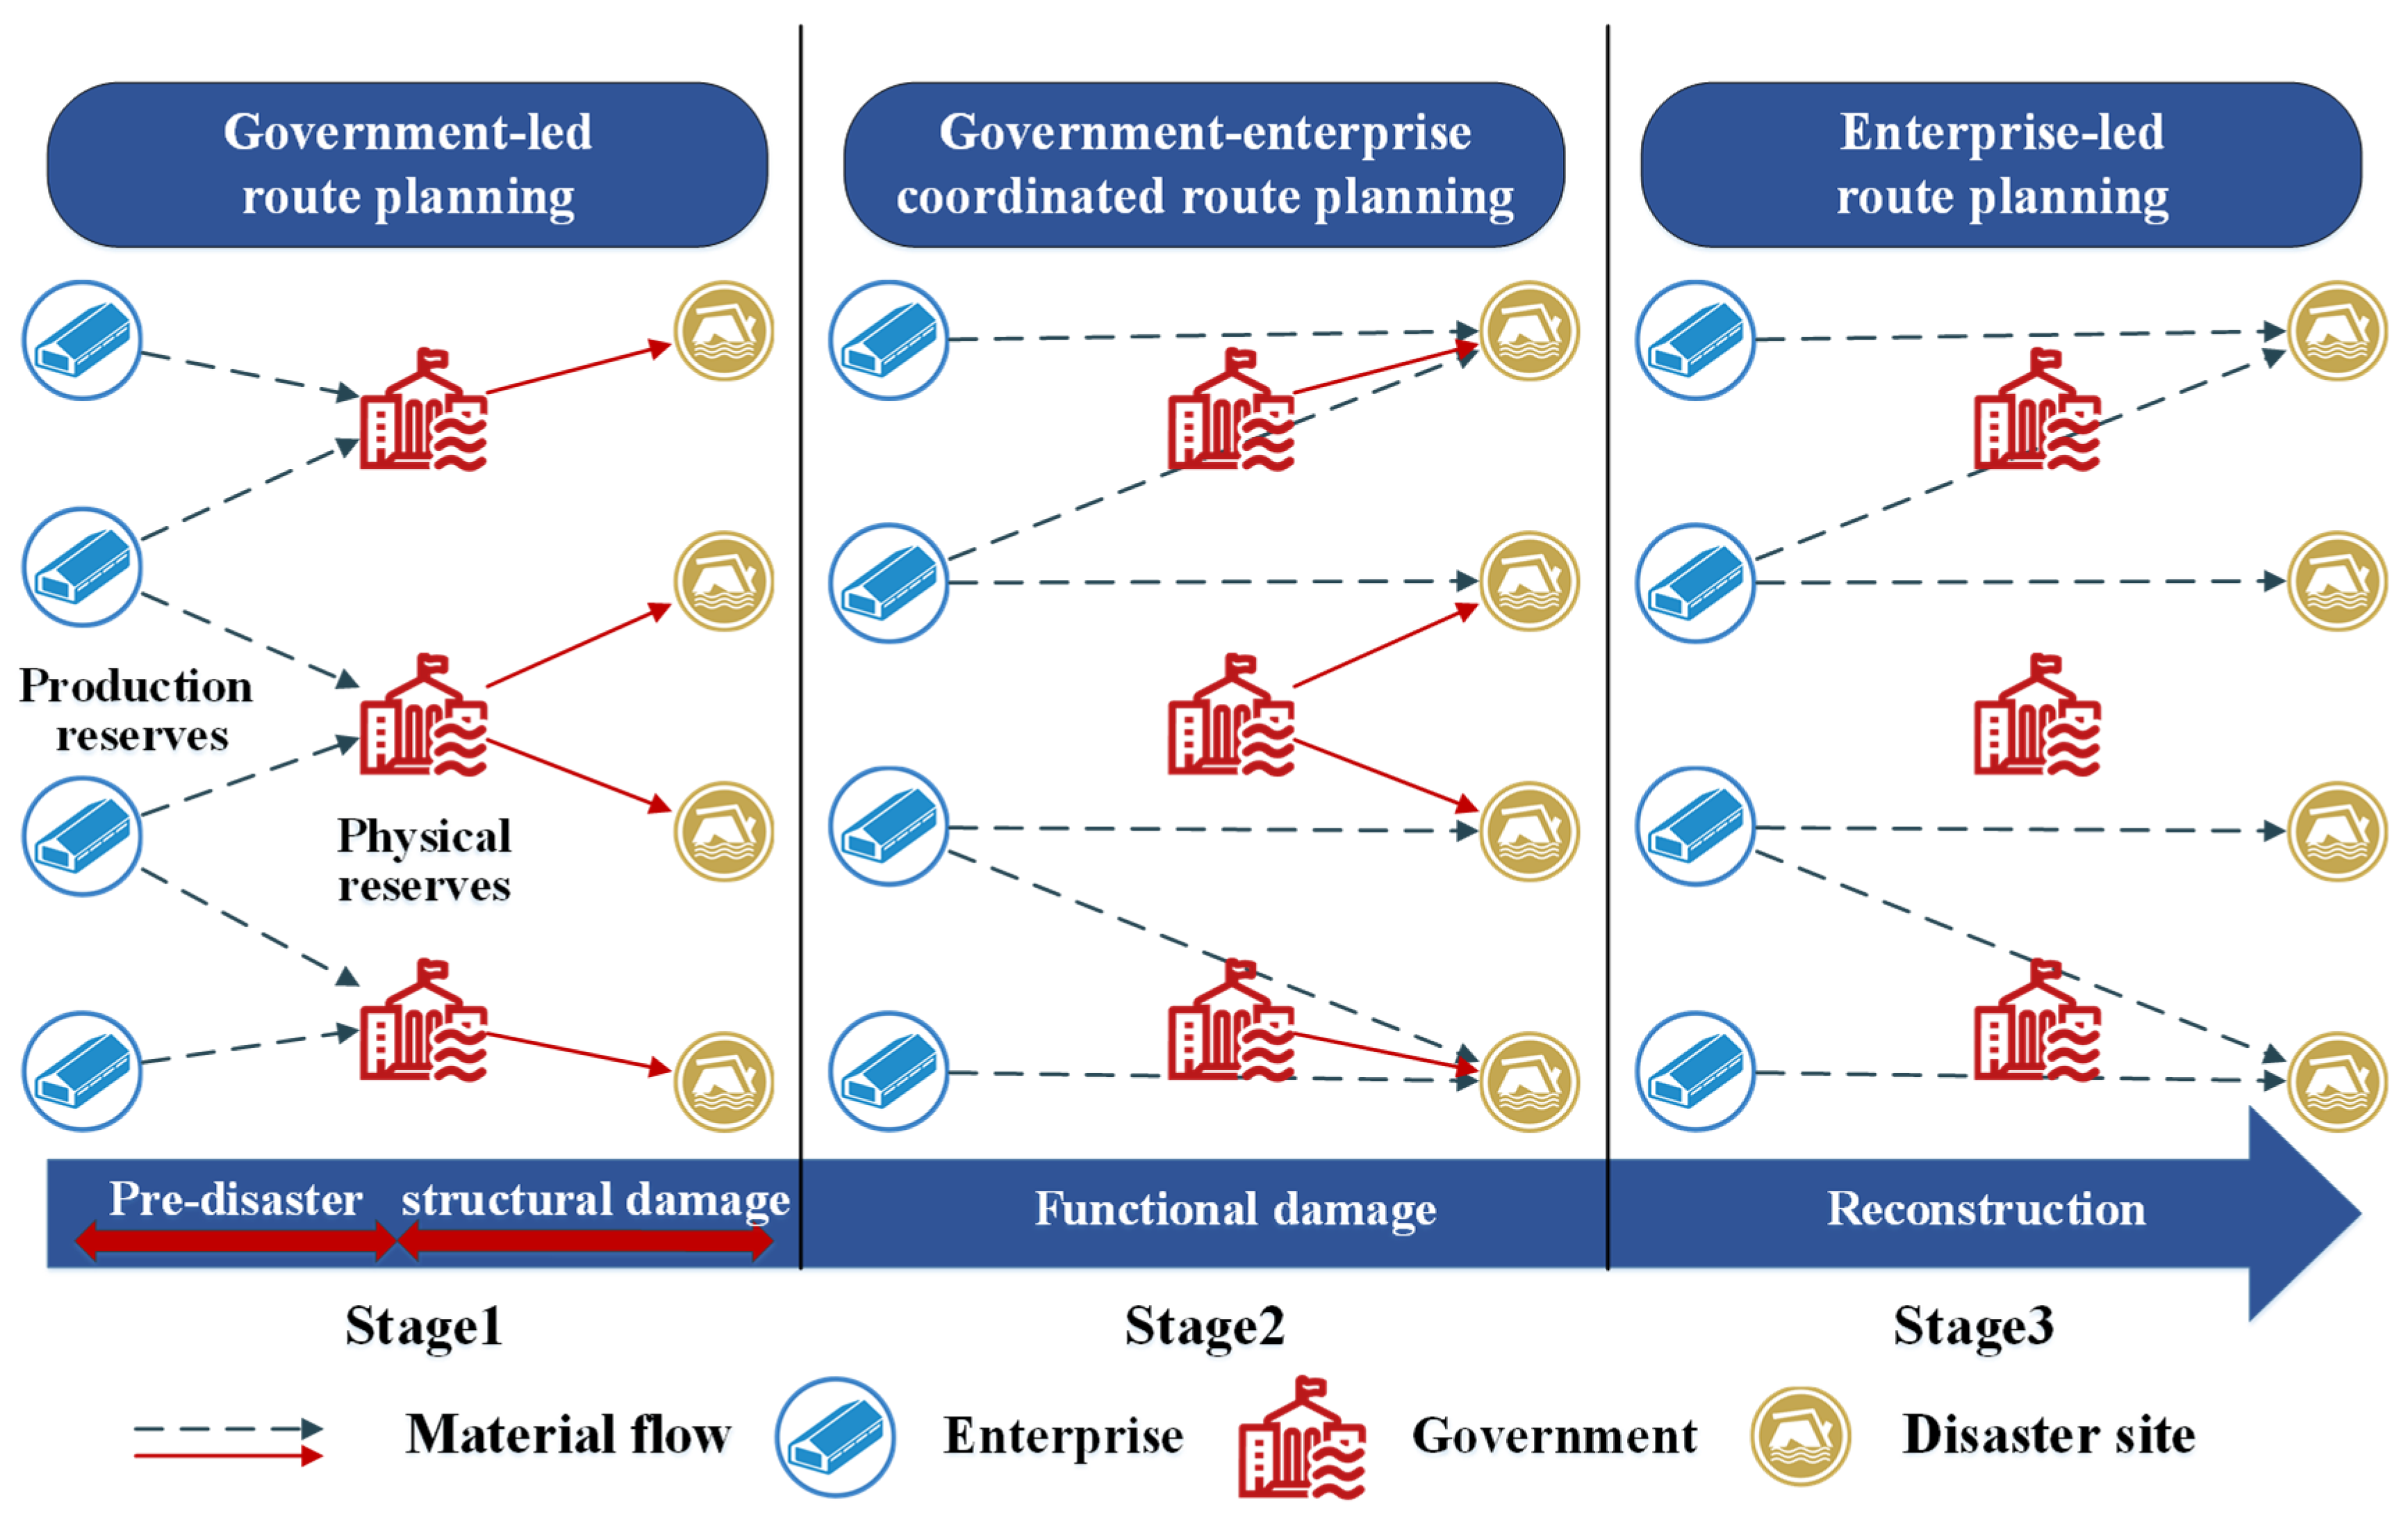

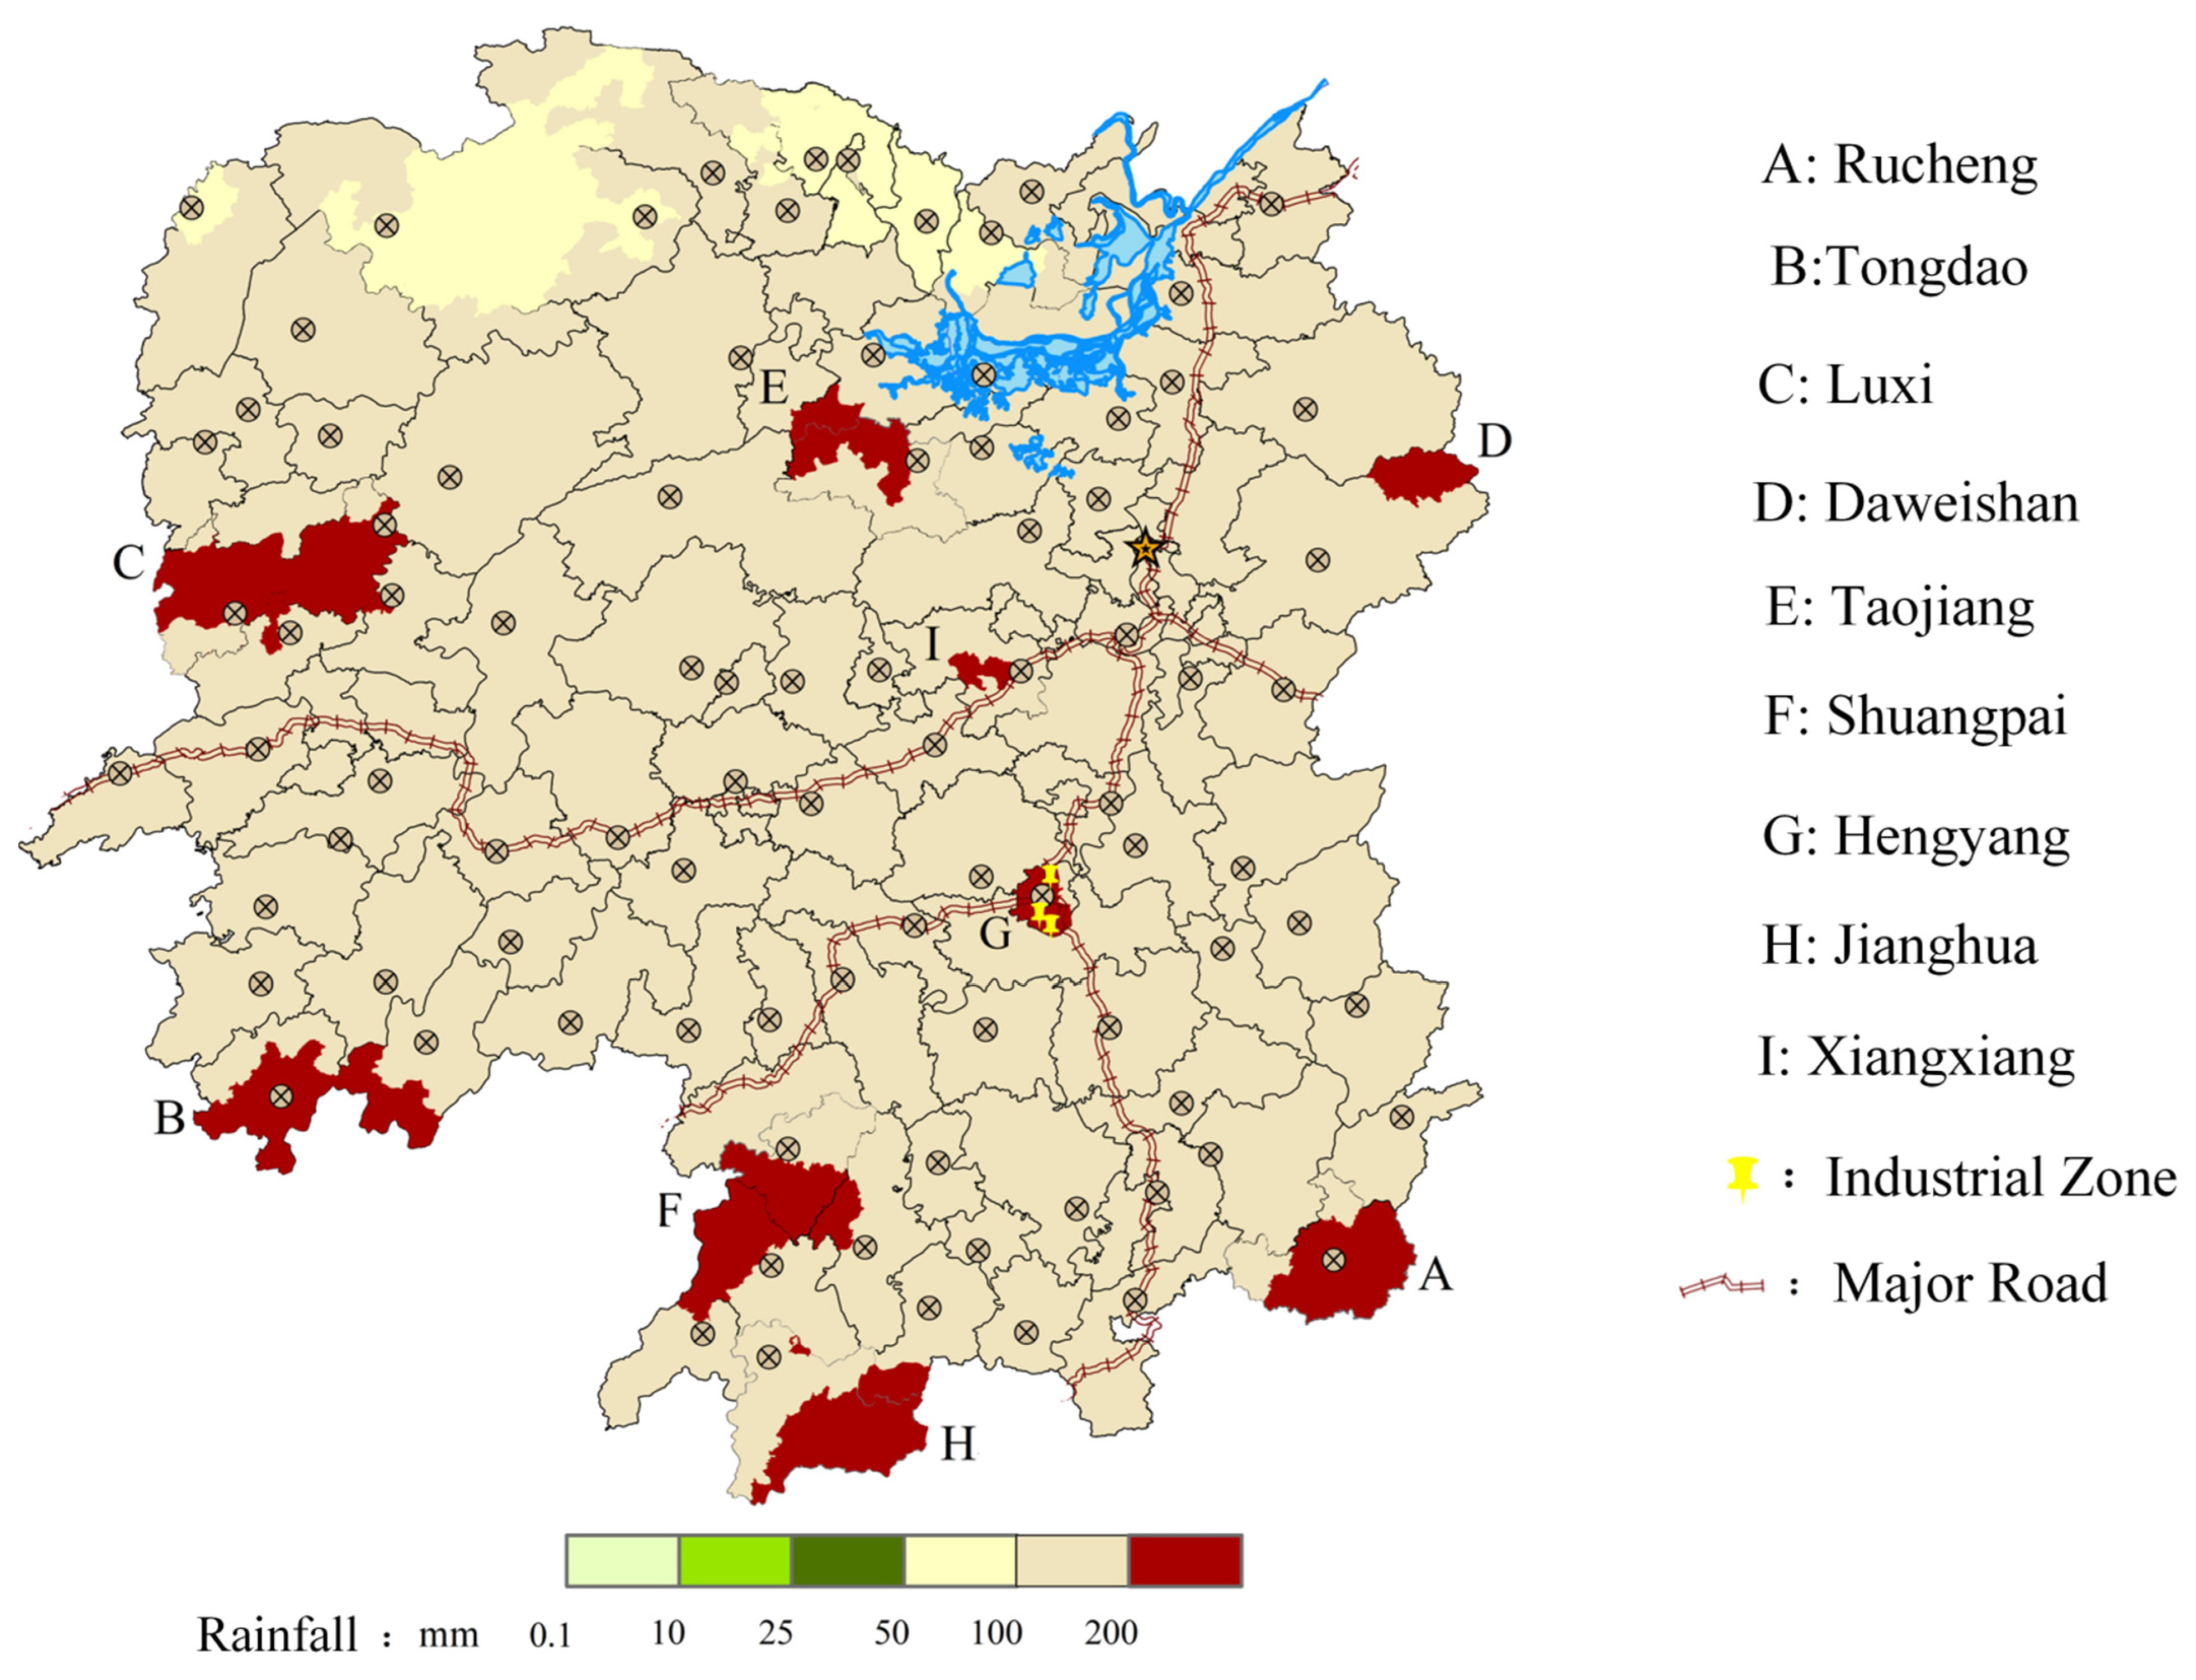
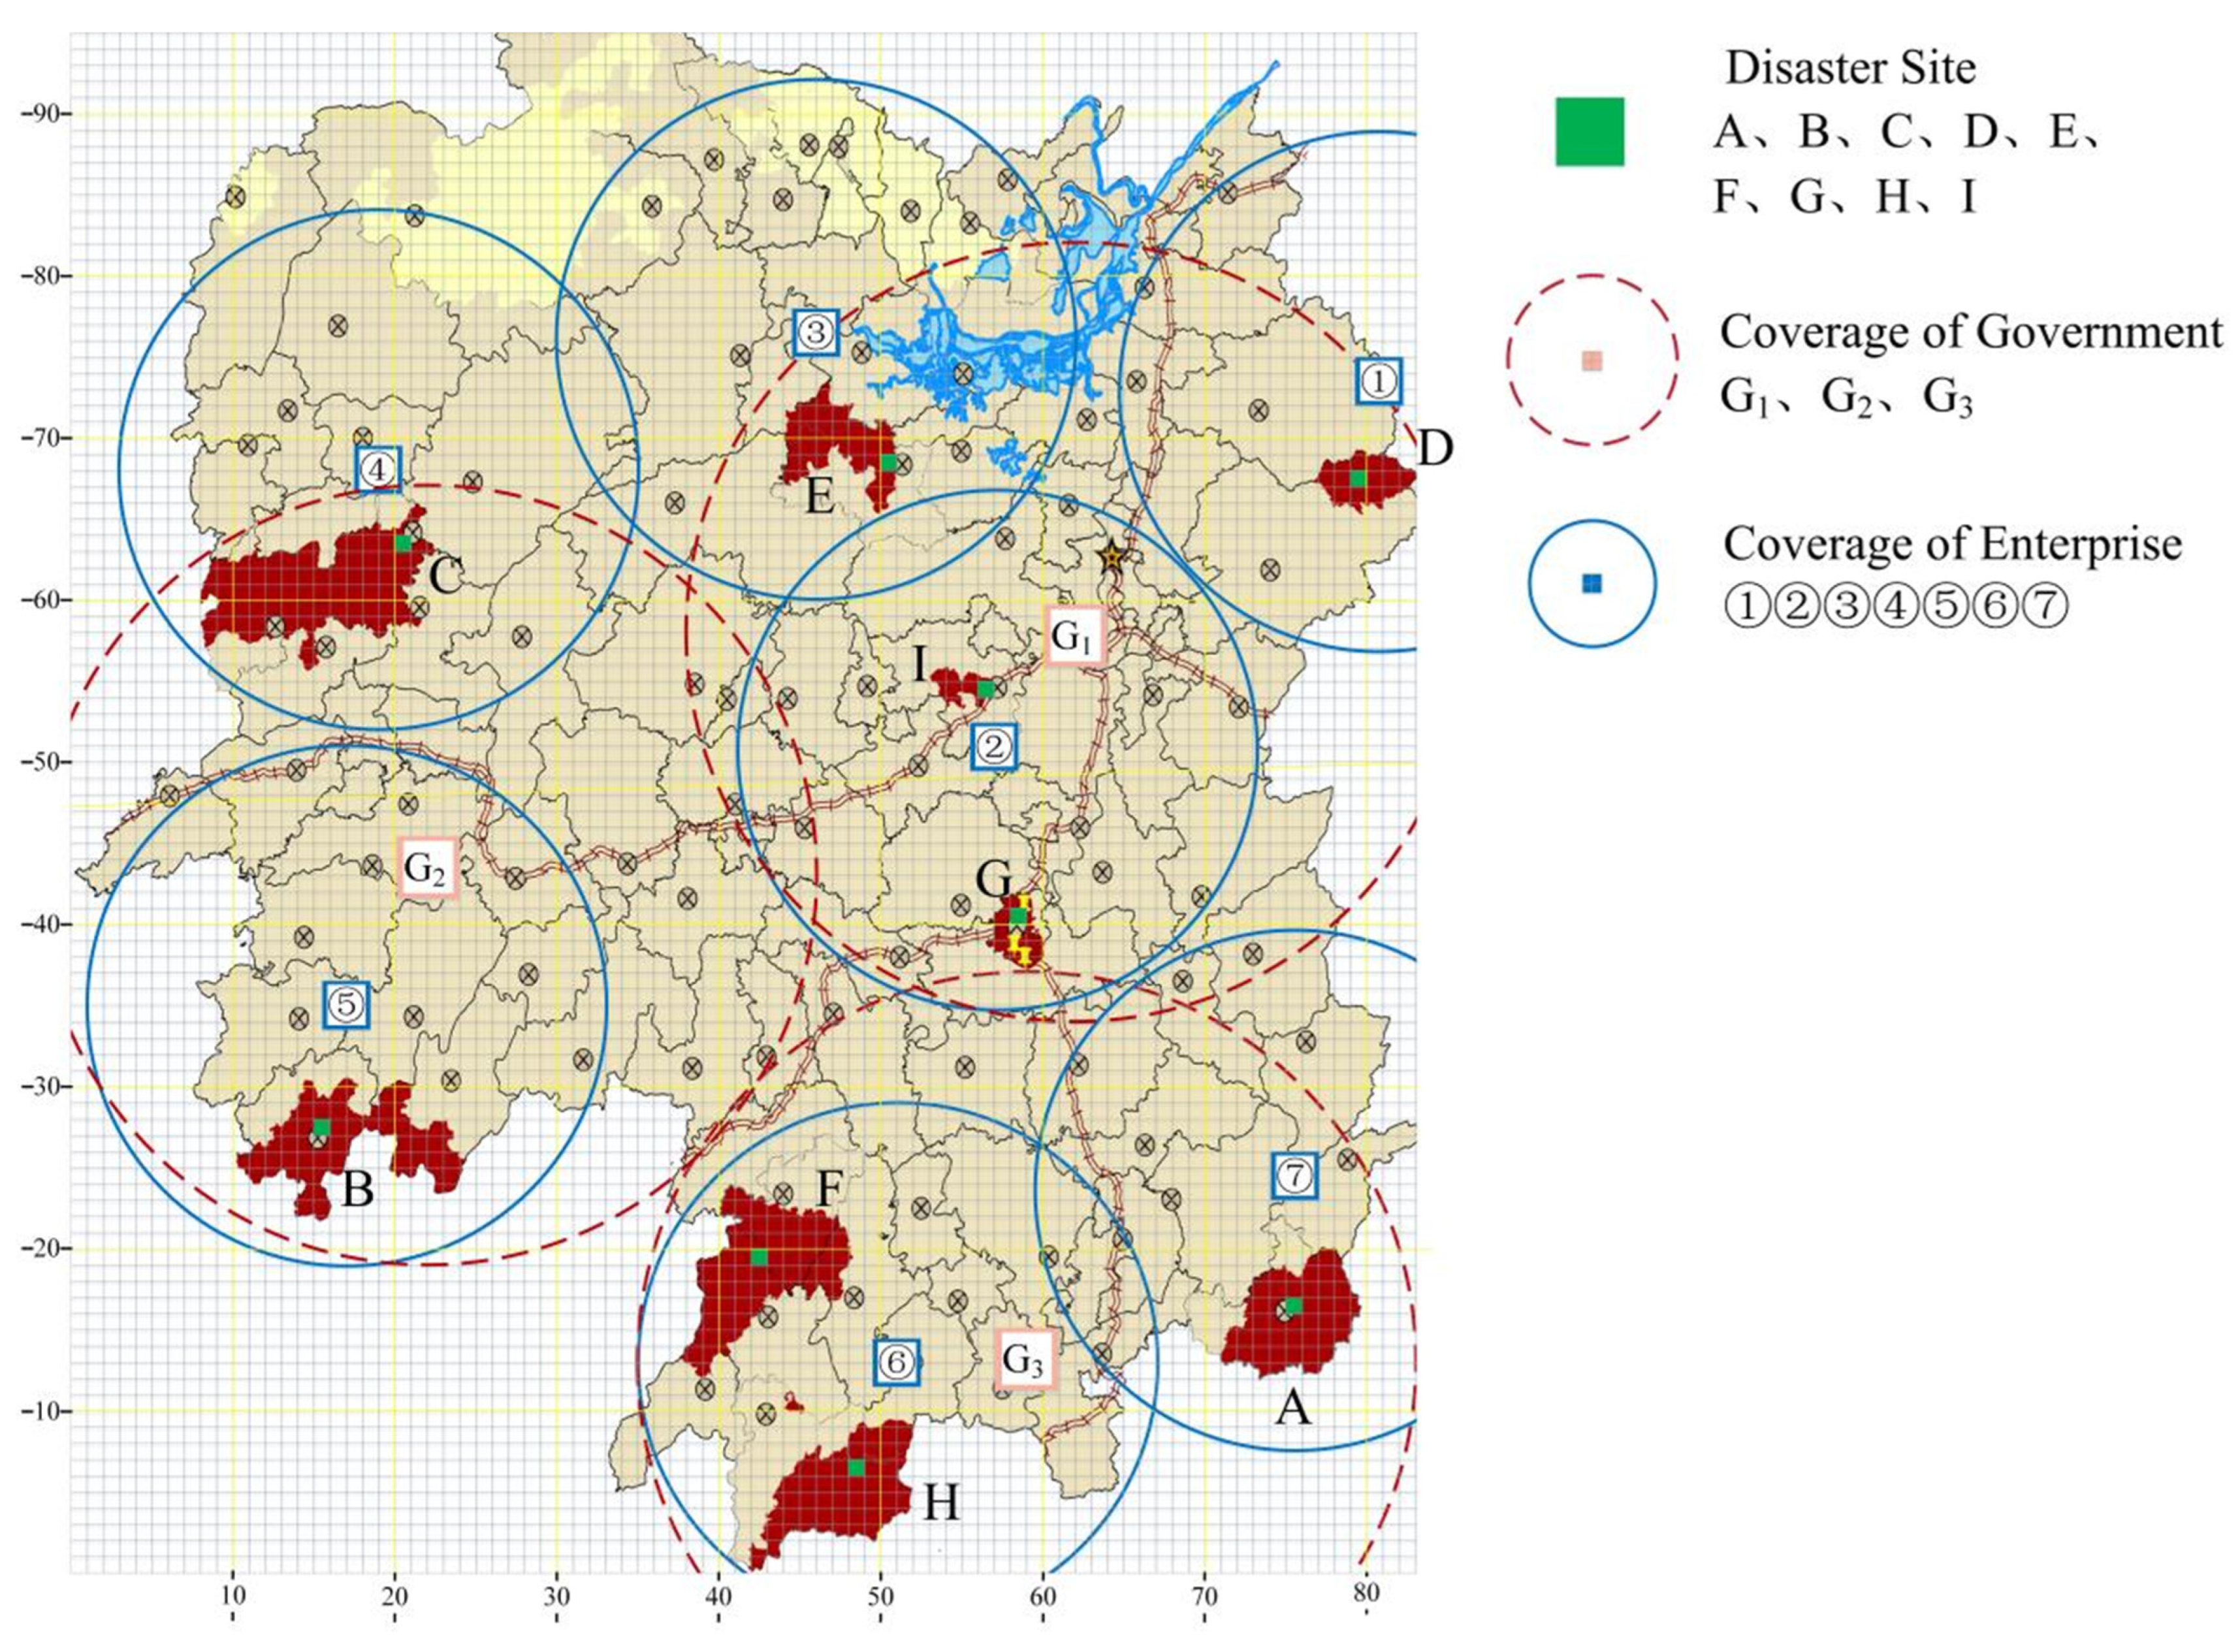


| Classification Criteria | Types of Vehicle Routing Problems | Relevant Explanation |
|---|---|---|
| Vehicle type | Single model | Only one delivery vehicle type is considered |
| Multi-model | Multiple delivery vehicle types are considered | |
| Vehicle service methods | One-to-one service | One vehicle serves a single customer node |
| One-to-many service | One vehicle serves multiple customer nodes | |
| Number of distribution centers | Single distribution center | The demand for all customer nodes is met by a single distribution center |
| Multi-distribution centers | The demand for all customer nodes requires multiple distribution centers | |
| Whether material is split or not | Indivisible supply | Each customer node’s supply demands can only be met by one distribution vehicle |
| Detachable supplies | Each customer node’s supply demands can only be met by multiple distribution vehicle | |
| Time window | No time window | Customer nodes have no time limit for delivery services |
| Hard time window | The customer node can only accept services within the specified time period | |
| Soft time window | The customer node can accept the service outside the specified time period, but the distributor needs to bear some cost | |
| Demand state | Static demand issues | The requirements of customer nodes are fixed |
| Dynamic demand issues | The demand information of customer nodes will change during the distribution process | |
| Parking lot ownership | Enclosed parking lot | Distribution vehicles follow the strict route of “distribution center—customer node—original distribution center” |
| Open parking lot | The delivery vehicle starts from the distribution center, serves a series of customer nodes, and does not need to return the same way | |
| Number of decision-making targets | Single-objective | There is only one objective function in the optimization model |
| Multi-objective | There are multiple objective functions in the optimization model |
| Type | Term | Definition |
|---|---|---|
| Sets | j ∈ J, set of emergency facilities, including government reserves and enterprise production points | |
| i ∈ I, set of disaster sites | ||
| v ∈ V, set of nodes, including emergency facilities and disaster sites | ||
| m ∈ M, set of vehicles | ||
| cm ∈ , set of path tasks for vehicles | ||
| t ∈ T, route planning phase in the post-disaster | ||
| Parameters | The rated loading capacity of vehicles | |
| Demand for emergency supplies at disaster sites in phase | ||
| The volume of supplies transported by path from the disaster site in phase | ||
| The maximum continuous travel time of a vehicle in a single path | ||
| Time of stay in service at the disaster site | ||
| Soft time windows at disaster sites | ||
| Moment of arrival at the disaster sites via path | ||
| Passage time between nodes and | ||
| Variables | 1, if the path is from node to node at the stage ; otherwise, 0 | |
| 1, if the path serves disaster sites ; otherwise, 0 |
| Equation | Examples |
|---|---|
| (18) | Site I: = 65, = 20→N = [65/20]→Split: [20, 20, 20, 5] units |
| (22) | Violated path: Vehicle 1 initial route [17, 20, 19, 18, 8, 7, 9]→Load = 122 > 20 units Compliant path: Adjusted route [17, 20, 19, 18]→Segmented delivery |
| (23) | Executed in Section 3.2: Vehicle 3 path [→H→6→A→7→G→→F, H] = 210 < = 480 min |
| (24) | Start at enterprise 5: Outflow x5,B→Net flow = 1 Intermediate node B: Inflow = 1, Outflow = 1→Net flow = 0 End at F: Inflow xG1,F = 1→Net flow = −1 |
| (25) | Executed in Section 3.2: Vehicle 3 path [→H→6→A→7→G→→F, H] The disaster site H, A, G, F |
| (26) | Each disaster area has received services. |
| (27) | Executed in Section 3.2: Vehicle 3 path xG1,H = 1, yH = 1→xG1,H = yH |
| (28) | Calculated for Site A: Path 1: tA = 0 + 0 + PG1,A = 125 min Path 2: tB = tA + SA + PA,B = 125 + 15 + 20 = 160 min |
| Disaster Site | Emergency Supplies Requirements/Unit | ||
|---|---|---|---|
| Stage 1 | Stage 2 | Stage 3 | |
| A | 26 | 60 | 40 |
| B | 17 | 40 | 27 |
| C | 23 | 54 | 36 |
| D | 11 | 26 | 17 |
| E | 48 | 114 | 76 |
| F | 35 | 83 | 55 |
| G | 57 | 133 | 88 |
| H | 32 | 75 | 49 |
| I | 65 | 152 | 101 |
| Disaster Site | Environmental Factors | Facility Factors | Demographic Factors | |||||
|---|---|---|---|---|---|---|---|---|
| B1,1 /mm | B1,2 | B1,3/ | B2,1 /Ten Thousand | B2,2 | B3,1 /Ten Thousand | B3,2 /Ten Thousand | B3,3 /Ten Thousand | |
| A | 617.9 | I | 2401 | 2.03 × | I | 360.0 | 4.7 | 12,198 |
| B | 566.4 | III | 2239 | 8308 | II | 239.8 | 1.6 | 2015 |
| C | 450.0 | III | 1565 | 4800 | I | 320.0 | 9.1 | 3218 |
| D | 438.5 | III | 402 | 7.35 × | I | 155.0 | 23 | 30,000 |
| E | 432.9 | III | 1781 | 8.49 × | I | 68.56 | 22 | 40,381 |
| F | 416.6 | II | 1751 | 4175 | I | 49.67 | 2.1 | 5132 |
| G | 411.5 | III | 2568 | 4043 | III | 79.81 | 2.5 | 750 |
| H | 367.3 | III | 3248 | 3.27 × | II | 44.82 | 10 | 7000 |
| I | 343.3 | I | 1966 | 1665 | III | 90.96 | 1.9 | 532 |
| Method | Weight Stability | Computation Time | Annotation |
|---|---|---|---|
| AHP-only | 0.32 ± 0.05 | 18.2 s | Only subjective weights, relying on expert judgment. |
| EWM-only | 0.11 ± 0.02 | 5.1 s | Only objective weights, relying on data entropy values. |
| CRITIC | 0.15 ± 0.03 | 23.7 s | Only subjective weights |
| Proposed hybrid (θ = 0.6) | 0.09 ± 0.01 | 26.5 s | Balancing subjectivity and objectivity |
| Disaster Site | Volume of Demand | Split Disaster Sites | Split Demand | Starting Time of Service/min | Satisfaction Rate/% |
|---|---|---|---|---|---|
| A | 26 | 1, 2 | [20, 6] | 329/Not served | 20/26 = 76.9% |
| B | 17 | 3 | [17] | 150 | 17/17 = 100% |
| C | 23 | 4, 5 | [20, 3] | 328/174 | 23/23 = 100% |
| D | 11 | 6 | [11] | Not served | 0/11 = 0% |
| E | 48 | 7, 8, 9 | [20, 20, 8] | 247/257/Not served | 28/48 = 58.3% |
| F | 35 | 10, 11 | [20, 15] | 353/171 | 35/35 = 100% |
| G | 57 | 12, 13, 14 | [20, 20, 17] | Not served/91/Not served | 20/57 = 35.1% |
| H | 32 | 15, 16 | [20, 12] | 145/Not served | 20/32 = 62.5% |
| I | 65 | 17, 18, 19, 20 | [20, 20, 20, 5] | 97/Not served/21/16 | 21/65 = 32.3% |
| - | System: 220/314 = 70.1% | ||||
| Metric | Government-Only (Avg ± SD) | Collaboration (Avg ± SD) | Improvement (95% CI) | p-Value |
|---|---|---|---|---|
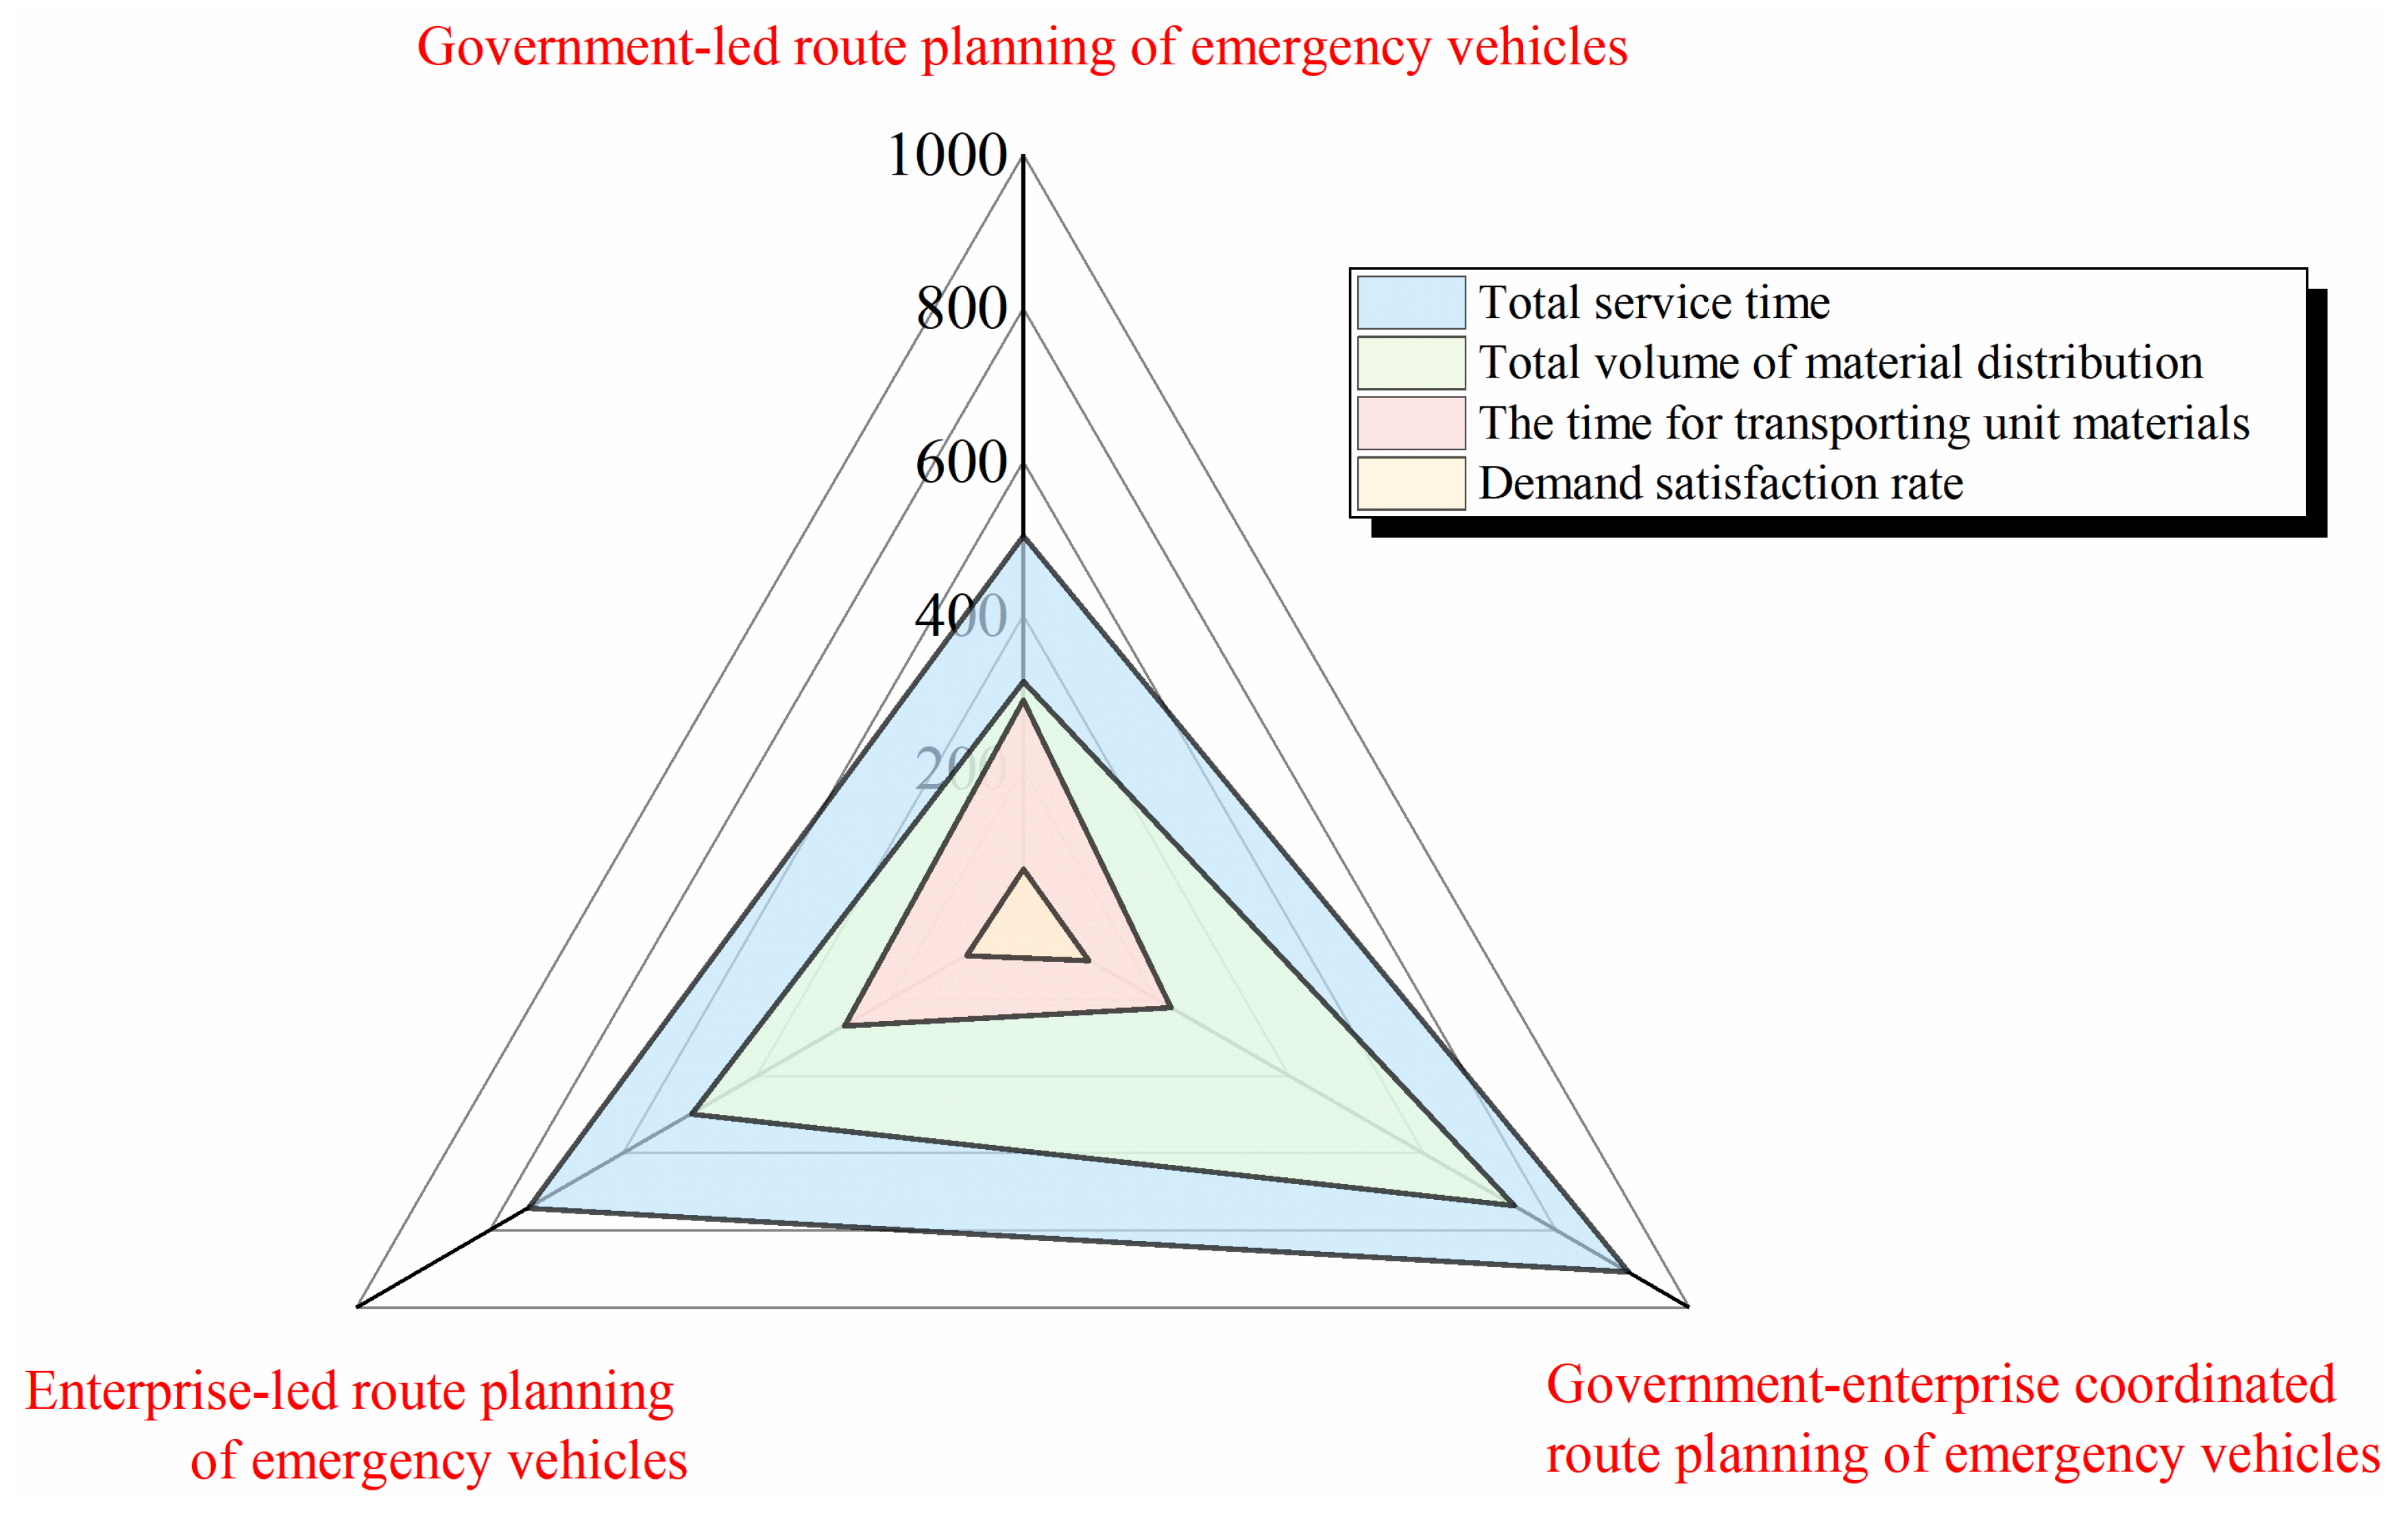
| Total Supplies | 220.3 ± 4.8 | 360.2 ± 3.1 | +63.5% (61.2%, 65.8%) | <0.001 * |
| Unit Time | 1.61 ± 0.05 | 1.23 ± 0.03 | −23.6% (−25.1%, −22.1%) | <0.001 * |
| Satisfaction Rate | 70.1 ± 1.5 | 92.3 ± 0.9 | +22.2% (21.0%, 23.4%) | <0.001 * |
| Vehicle Number | Task List |
|---|---|
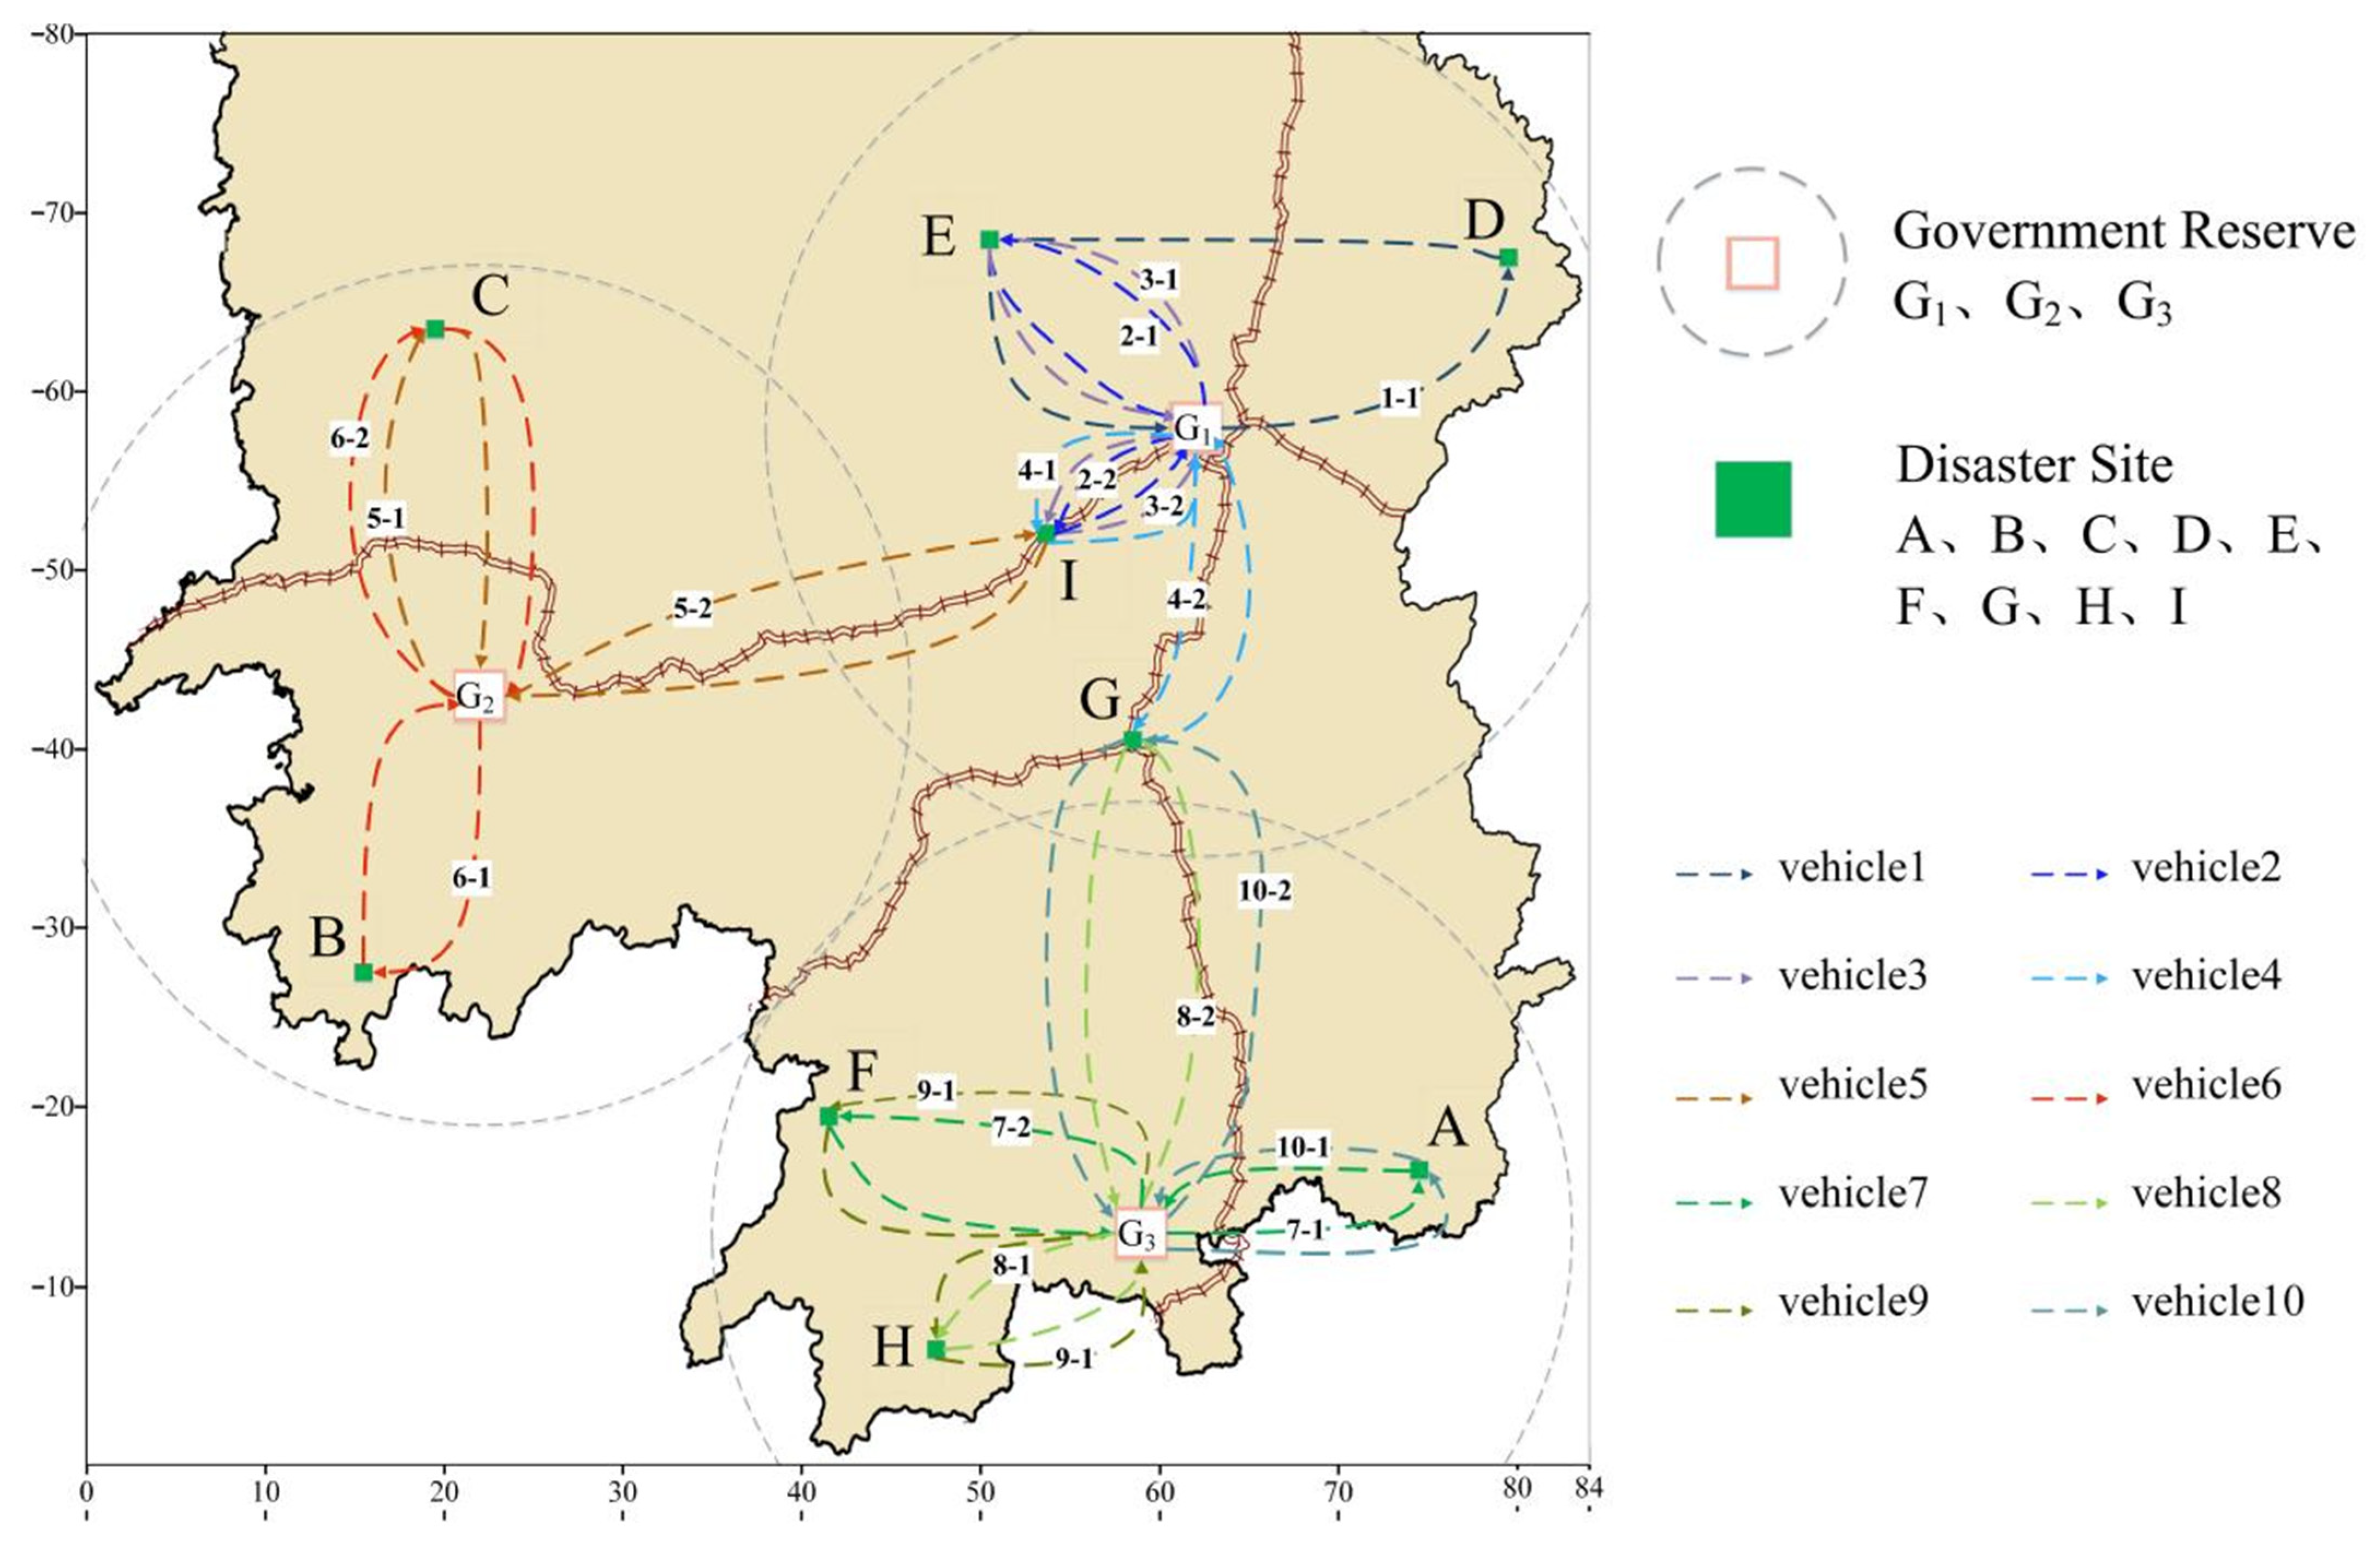
| 1 | [→I→→E→→I→→G→→I, D] |
| 2 | [→B→5→C→4→E] |
| 3 | [→H→6→A→7→G→→F, H] |
| 4 | [1→D→1→I→→I] |
| 5 | [2→G→→E→→I→→G→→G] |
| 6 | [3→E→→E→→G→→I] |
| 7 | [4→C→4→C→4→I] |
| 8 | [5→B→5→E→→F] |
| 9 | [6→F→6→F→6→H→6→H] |
| 10 | [7→A→7→A→7→G→→F] |
| Disaster Site | Volume of Demand | Split Disaster Sites | Split Demand | Starting Time of Service/min |
|---|---|---|---|---|
| A | 60 | 1, 2, 3 | [20, 20, 20] | 125/251/354 |
| B | 40 | 4, 5 | [20, 20] | 89/150 |
| C | 54 | 6, 7, 8 | [20, 20, 14] | 158/325/430 |
| D | 26 | 9, 10 | [20, 6] | 161/852 |
| E | 114 | 11, 12, 13, 14, 15, 16 | [20, 20, 20, 20, 20, 14] | 154/274/280/ 315/440/707 |
| F | 83 | 17, 18, 19, 20, 21 | [20, 20, 20, 20, 3] | 139/296/653/ 661/762 |
| G | 133 | 22, 23, 24, 25, 26, 27, 28 | [20, 20, 20, 20, 20, 20, 13] | 102/429/436/532/ 535/538/655 |
| H | 75 | 29, 30, 31, 32 | [20, 20, 20, 15] | 145/430/573/908 |
| I | 152 | 33, 34, 35, 36, 37, 38, 39, 40 | [20, 20, 20, 20, 20, 20, 20, 12] | 97/395/399/401/ 422/561/563/670 |
| Vehicle Number | Task List |
|---|---|
| 1 | [1→D→1→G] |
| 2 | [2→I→2→I→2→H, B] |
| 3 | [2→G→2→I→2→G] |
| 4 | [3→E→3→E→3→B] |
| 5 | [3→E→3→I] |
| 6 | [4→C→4→C→4→I] |
| 7 | [5→B→5→I] |
| 8 | [6→F→6→F→6→F] |
| 9 | [6→H→6→A→7→G, H] |
| 10 | [7→A→7→G→2→E] |
| Disaster Site | Volume of Demand | Split Disaster Sites | Split Demand | Starting Time of Service/min |
|---|---|---|---|---|
| A | 40 | 1, 2 | [20, 20] | 125/313 |
| B | 27 | 3, 4 | [20, 7] | 89/743 |
| C | 36 | 5, 6 | [20, 16] | 158/324 |
| D | 17 | 7 | [17] | 161 |
| E | 76 | 8, 9, 10, 11 | [20, 20, 20, 16] | 154/154/320/507 |
| F | 55 | 12, 13, 14 | [20, 20, 15] | 139/291/444 |
| G | 88 | 15, 16, 17, 18, 19 | [20, 20, 20, 20, 8] | 102/308/366/466/558 |
| H | 49 | 20, 21, 22 | [20, 20, 9] | 113/551/735 |
| I | 101 | 23, 24, 25, 26, 27, 28 | [20, 20, 20, 20, 20, 1] | 110/232/248/385/392/667 |
| Vehicle Number | Task List |
|---|---|
| 1 | [1→D→1→G] |
| 2 | [2→I→2→I→2→F] |
| 3 | [2→G→2→I→2→G] |
| 4 | [3→E→3→E→3→B] |
| 5 | [3→E→3→I] |
| 6 | [4→C→4→C→4→I] |
| 7 | [5→B→5→I] |
| 8 | [6→F→6→H→6→H, G] |
| 9 | [6→H→6→B→7→F] |
| 10 | [7→A→7→G→2→E] |
| Algorithm | Demand Satisfaction (%) | Unit Time (min/unit) | Convergence (Iterations) |
|---|---|---|---|
| NSGA-II | 87.1 ± 1.2 | 1.41 ± 0.05 | 146 ± 11 |
| PSO | 79.6 ± 3.3 | 1.67 ± 0.10 | 89 ± 6 |
| Tabu Search | 83.5 ± 2.1 | 1.58 ± 0.07 | - |
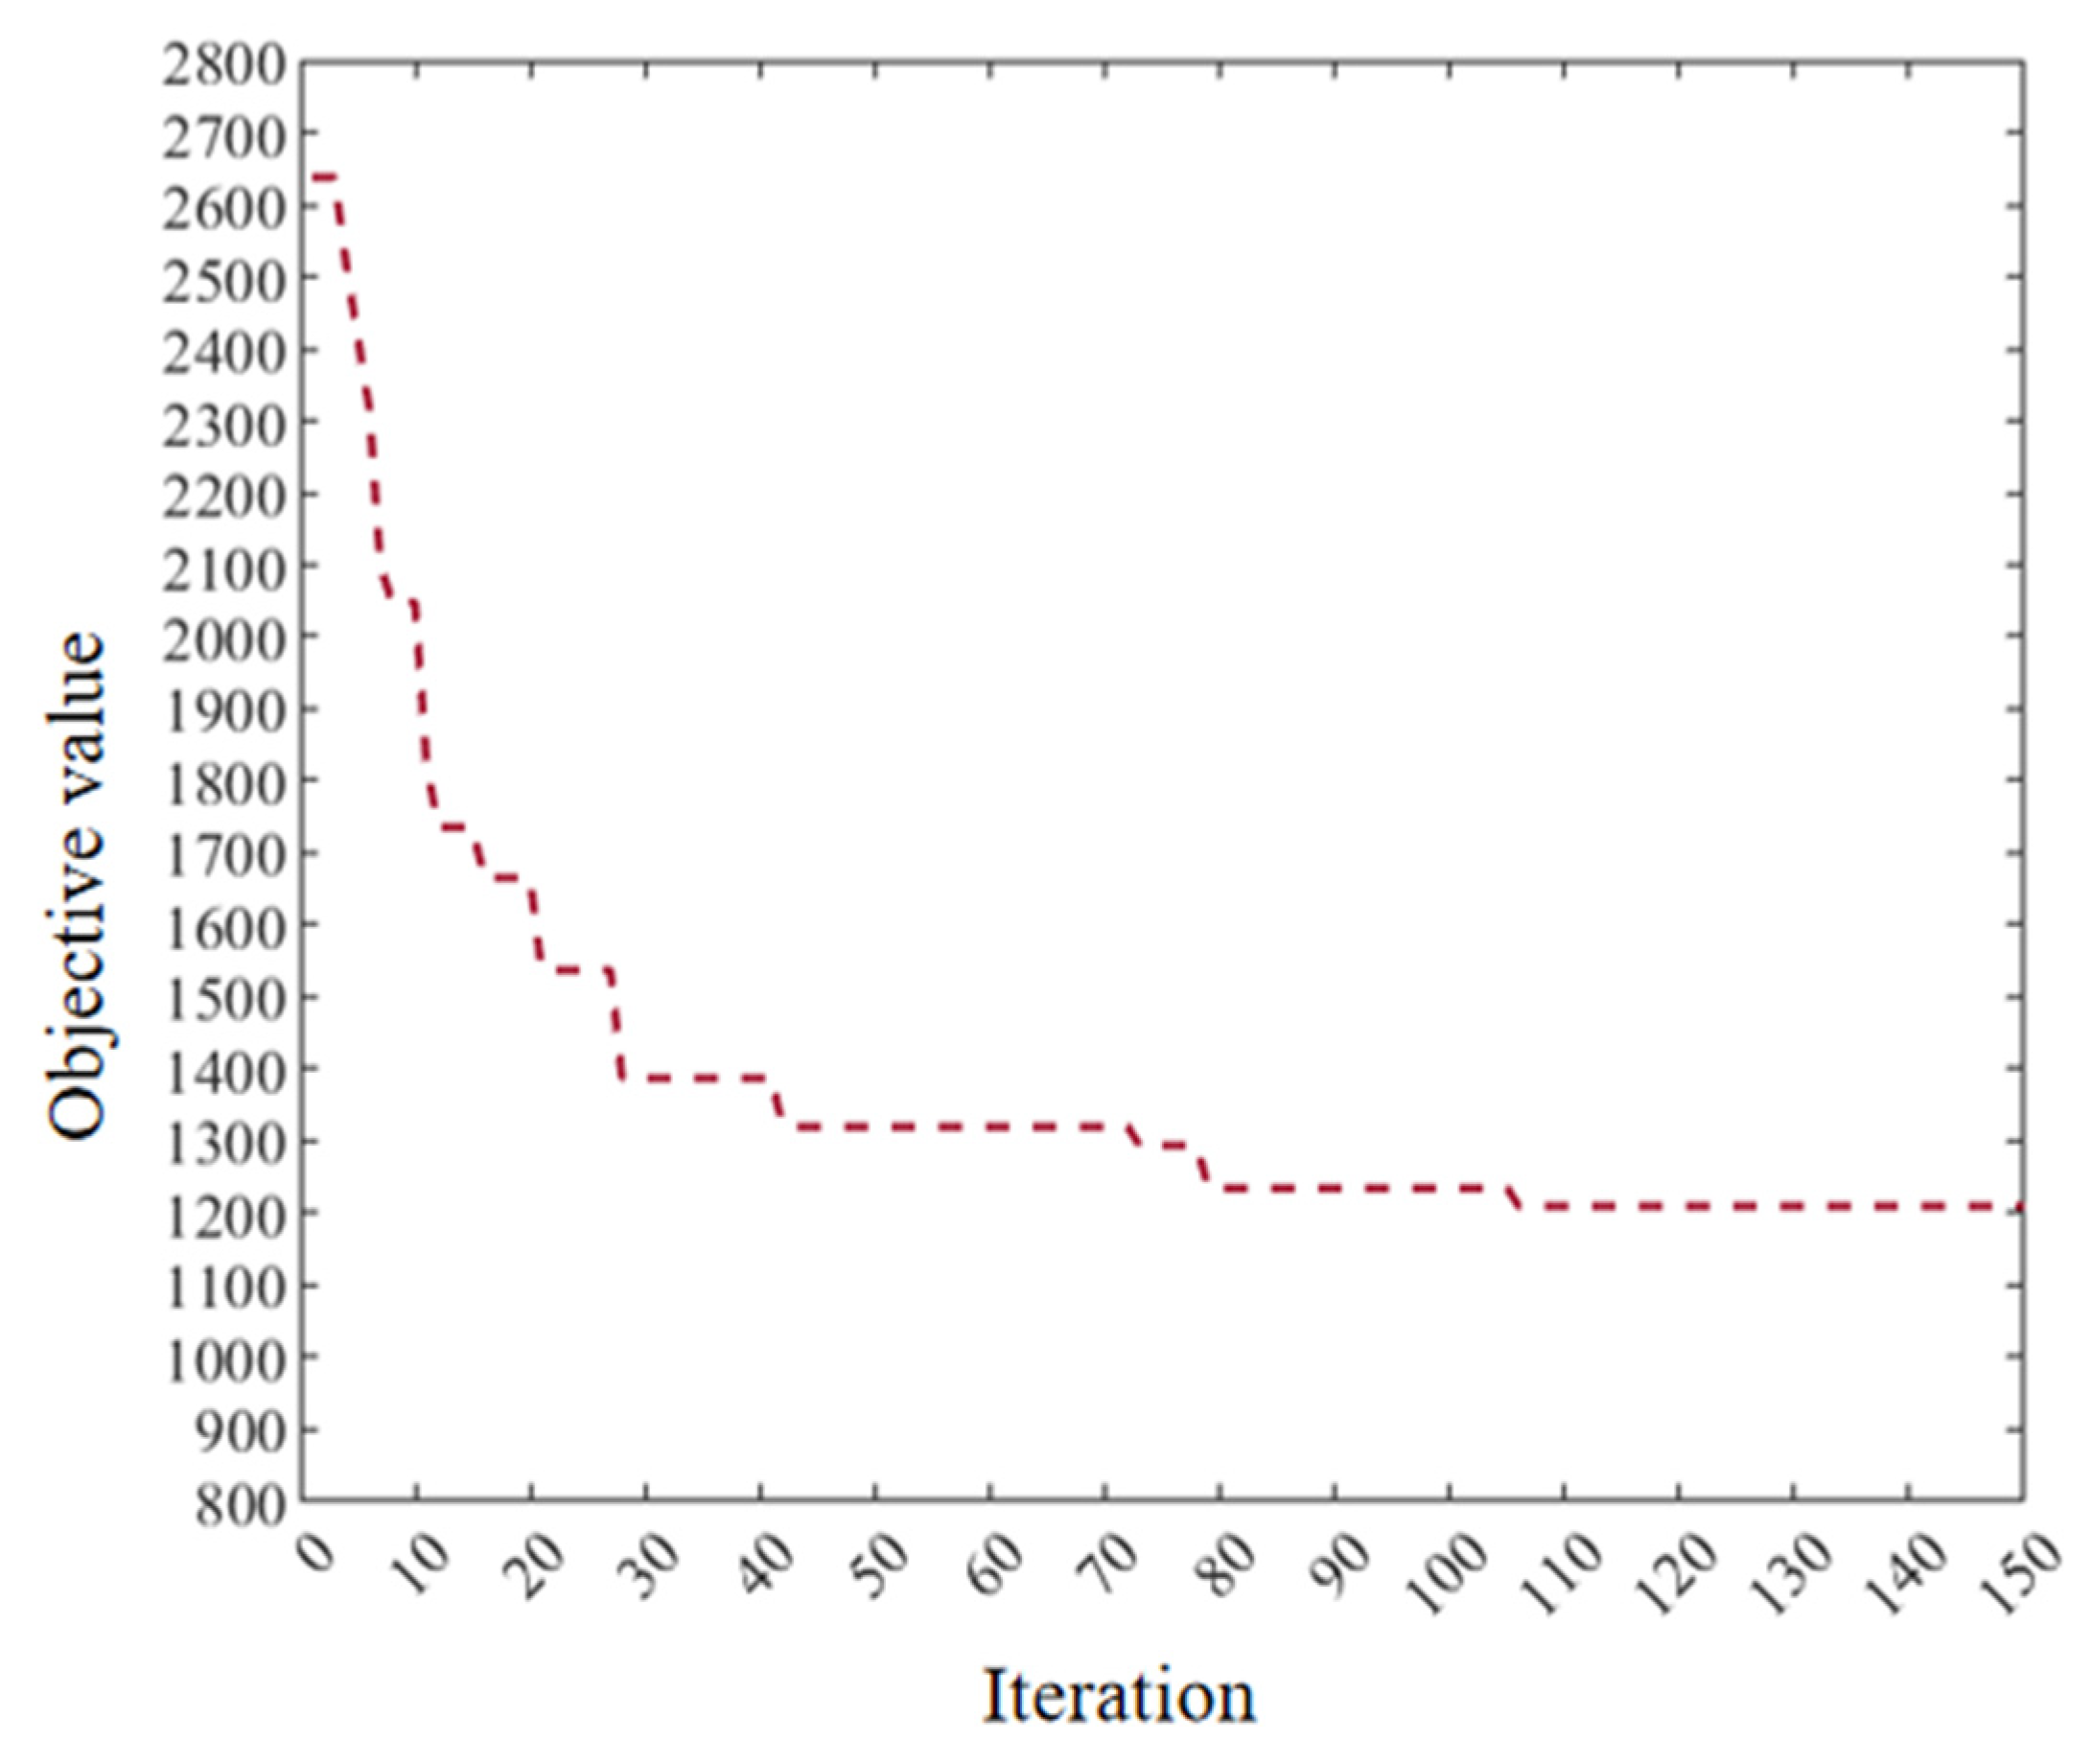
| Two-stage CGA | 92.3 ± 0.9 | 1.23 ± 0.03 | 112 ± 8 |
Disclaimer/Publisher’s Note: The statements, opinions and data contained in all publications are solely those of the individual author(s) and contributor(s) and not of MDPI and/or the editor(s). MDPI and/or the editor(s) disclaim responsibility for any injury to people or property resulting from any ideas, methods, instructions or products referred to in the content. |
© 2025 by the authors. Licensee MDPI, Basel, Switzerland. This article is an open access article distributed under the terms and conditions of the Creative Commons Attribution (CC BY) license (https://creativecommons.org/licenses/by/4.0/).
Share and Cite
Wang, F.; Yang, Q.; Xie, Z. Dynamic Route Planning Strategy for Emergency Vehicles with Government–Enterprise Collaboration: A Regional Simulation Perspective. Appl. Sci. 2025, 15, 11496. https://doi.org/10.3390/app152111496
Wang F, Yang Q, Xie Z. Dynamic Route Planning Strategy for Emergency Vehicles with Government–Enterprise Collaboration: A Regional Simulation Perspective. Applied Sciences. 2025; 15(21):11496. https://doi.org/10.3390/app152111496
Chicago/Turabian StyleWang, Feiyue, Qian Yang, and Ziling Xie. 2025. "Dynamic Route Planning Strategy for Emergency Vehicles with Government–Enterprise Collaboration: A Regional Simulation Perspective" Applied Sciences 15, no. 21: 11496. https://doi.org/10.3390/app152111496
APA StyleWang, F., Yang, Q., & Xie, Z. (2025). Dynamic Route Planning Strategy for Emergency Vehicles with Government–Enterprise Collaboration: A Regional Simulation Perspective. Applied Sciences, 15(21), 11496. https://doi.org/10.3390/app152111496


