Abstract
Microseismic monitoring technology serves as a vital tool for assessing the stability of coal and rock masses. The precision of energy calculations and the ability to integrate data across different systems have a direct impact on the effectiveness of early warning systems for hazards such as rockburst. This study utilized the 6306 working face of Shandong Energy Group’s Dongtan Coal Mine as its experimental site to address data inconsistencies caused by variations in sensor responses, localization algorithms, and energy calculation methods among microseismic monitoring systems. Two microseismic monitoring platforms, designated as System A and System B, were deployed to conduct a comparative and integrative study of cross-system energy calculations. The optimization of sensor layout facilitated a comprehensive analysis of the differences between the two systems in terms of P-wave arrival times, amplitude–frequency characteristics, and localization accuracy. Results indicated that System A achieved significantly lower localization errors, with an average of 49 m, compared to System B’s average of 70 m. Substantial differences were also found in waveform amplitude and dominant frequency, with a correlation coefficient of only 0.59 between the two systems. To bridge these disparities, an energy calculation method based on the displacement gauge function was developed. By fitting a localized gauge function R(Δ) and incorporating empirical coefficients, the energy calculation outputs of both systems were harmonized. Validation experiments demonstrated that the linear correlation coefficient of energy calculations between Systems A and B increased to 0.977 under the new method, confirming its effectiveness for data unification. This research provides critical theoretical and technical guidance for integrating microseismic data across systems and establishing unified early warning standards, thus advancing the monitoring and prediction of dynamic hazards in mining environments.
1. Introduction
Microseismic monitoring is a geophysical technique that analyzes microseismic signals generated by coal and rock mass loading and fracturing to assess stability [1,2]. By capturing waveform signals, it provides critical information on source location and energy release. This makes it a powerful tool for investigating internal stress distribution, fracture propagation and its spatial patterns, strata activity laws, failure mechanisms, and the spatio-temporal evolution of mine tremors [3,4,5,6,7,8]. Furthermore, it is vital for monitoring and early warning of dynamic disasters like rockbursts, coal and gas outbursts, and water inrushes [9,10,11,12,13]. After nearly three decades of development, the technique has proven robust due to its real-time, dynamic, and continuous monitoring capabilities. It has thus established a solid scientific and technical foundation for ensuring coal mine safety.
Currently, various microseismic monitoring systems have been developed both domestically and internationally [14,15,16,17]. Among these, the Polish SOS microseismic monitoring system [18] and the ARAMIS M/E system [19] stand out as two representative technologies widely applied in rockburst-prone mines across China. These two systems play crucial roles in rockburst monitoring and early warning. Specifically, they enable stratified and differentiated evaluation of rockburst risk based on microseismic activity indicators [20]; they facilitate the analysis of focal mechanisms and the assessment of rockburst risk induced by strong tremors using microseismic data [21]; and the integration of multi-parameter monitoring and warning technology, combining microseismic, stress, and acoustic emission methods, has further enhanced the accuracy of rockburst monitoring and warning [22,23,24].
Accurate monitoring and early warning of rockburst hazards fundamentally depend on precise microseismic location and energy calculation. In the field of mine microseismic monitoring, methods for microseismic location and energy calculation primarily draw upon theories and methodologies from seismology. Common microseismic location techniques include the classical Geiger method [25], the Powell method [26], and the DDA method [27]. Han Yaning et al. proposed a GA-PSO algorithm, combining Genetic Algorithm and Particle Swarm Optimization, to enhance source location accuracy [28]. Similarly, Ning Dianyan et al. achieved high-precision, rapid acoustic source localization using time-difference transmission tomography based on numerical simulation methods [29]. Regarding microseismic energy calculation, methods include energy density methods, vibration duration methods, seismogram integration methods, and Richter magnitude methods [30,31,32]. Among these, the vibration duration method estimates energy magnitude by calculating the duration of vibration for a microseismic event, simplifying its dependence on source parameters and making it suitable for rapid energy calculation of dynamically changing events. Conversely, the seismogram integration method, based on the integration of seismic waveforms, can more accurately reflect the energy release of microseismic events; however, its calculation process is more complex, necessitating consideration of multiple source parameters. Although these aforementioned methods are effectively applied in earthquake monitoring, significant differences exist between mine microseisms and natural earthquakes in terms of source mechanisms, vibration frequencies, and source scales. Consequently, there is currently no unified method for location and energy calculation specifically tailored for mine microseisms. In practical applications, the varying methods used for microseismic location and energy calculation across different monitoring systems make it challenging to establish unified warning standards.
Current trends in rockburst monitoring and warning indicate a movement towards data fusion across different mines. However, when mines employ disparate types of microseismic monitoring systems, the fundamental data are inherently on different scales. This disparity presents significant obstacles to establishing unified standards and conducting integrated fusion analysis for effective warning. Furthermore, challenges inherent in the fusion process stem from variations in the spectral response characteristics of sensors to signals, discrepancies in system microseismic localization algorithms, and differing energy calculation methodologies. Consequently, research into cross-system microseismic energy calculation comparison and fusion methods is imperative.
To address these challenges, this study selects the Dongtan Coal Mine, operated by Shandong Energy Group, as a pilot site. By deploying both System A and System B microseismic monitoring systems within the 6306 Working Face of the No. 6 Mining District, we conducted a comparative and fusion study on cross-system microseismic energy calculations. Specifically, this paper first compares the differences between the two systems in terms of P-wave arrival time, amplitude–frequency characteristics, source location accuracy, and energy calculation results. Subsequently, an energy calculation model based on the displacement magnitude scale function and incorporating regional empirical coefficients was developed to unify the energy outputs of both systems. The linear correlation coefficient of energy calculation was used as a validation criterion to demonstrate the effectiveness of the proposed method. The core innovation of this approach lies in its pioneering achievement of seamless data fusion between heterogeneous systems, laying the groundwork for establishing unified warning standards. Meanwhile, this study also provides a reusable theoretical framework and technical pathway for cross-system microseismic data integration and monitoring and early warning of dynamic disasters in mines.
2. The Layout Plan for the Microseismic Monitoring System Network of A and B
The SOS microseismic monitoring system (System A) and the ARAMIS M/E system (System B) are the most widely used in rockburst-prone coal mines in China. The technical parameters of the two systems are listed in Table 1. To facilitate a robust comparison between the two microseismic monitoring systems, their respective sensors were meticulously designed and installed at identical locations within the 6306 working face of Dongtan Coal Mine. Concurrently, to optimize the positioning capabilities of both systems and thereby obtain highly accurate microseismic energy calculation results, this study determined the optimal sensor installation locations and quantities. This determination was based on a network optimization layout algorithm specifically designed to enhance the positioning accuracy of coal mine microseismic monitoring [33]. As depicted in Figure 1, the system positioning error progressively decreased with an increasing number of sensors. However, considering practical constraints such as cost and on-site installation feasibility, a final decision was made to install seven sensors, as illustrated in Figure 2.

Table 1.
Technical parameters of the microseismic monitoring system.
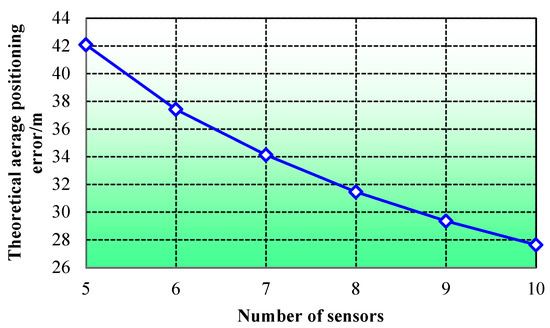
Figure 1.
Relationship between the number of sensors and positioning error.
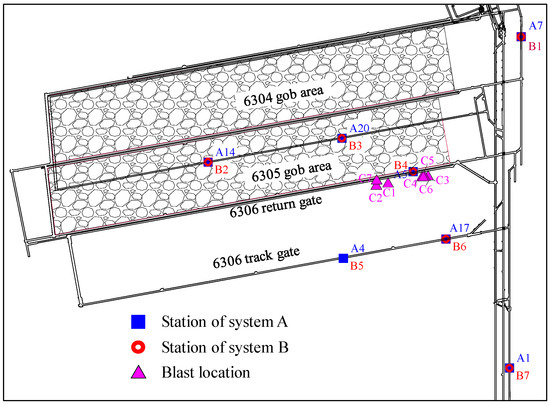
Figure 2.
The final installation and blasting positions of the two systems measuring stations.
3. Comparison of the Microseismic Energy Calculation Results of the Two Systems
3.1. Blasting Scheme Design
Building upon the optimized layout of the microseismic monitoring system network, this study designed blasting experiments with varying charge quantities within the 6306 working face. These experiments aimed to facilitate a comparative analysis of microseismic energy using the resulting blasting signals. To ensure that all seven deployed sensors could effectively receive the microseismic signals, seven blasting holes were strategically positioned on the roof of the 6306 working face. Their coordinates and corresponding charge quantities are detailed in Table 2, and their spatial layout is presented in Figure 2.

Table 2.
Blasting Parameters.
3.2. Comparison of P-Wave First Arrival Times
Given the strong correlation between energy and precise positioning results, and recognizing that the accuracy of positioning primarily hinges on the accurate picking of P-wave first arrival times, a comparative analysis of the P-wave first arrival time picking results from blasting waveforms recorded by both systems became essential. During the blasting events, no valid waveforms were observed from the A1 sensor of the System A microseismic monitoring system and the B4 sensor of the System B microseismic monitoring system, as these channels were not functioning properly. Consequently, as illustrated in Figure 3a,b, the effective number of operational channels for both systems was reduced to six. Specifically, the effective channels for the System A microseismic monitoring system were A4, A5, A7, A14, A17, and A20, while those for the System B microseismic monitoring system were B1, B2, B3, B5, B6, and B7.
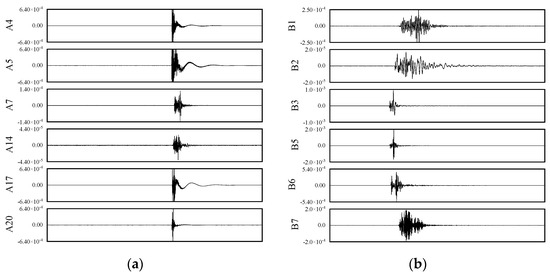
Figure 3.
Microseismic waveforms recorded by two systems under C2 blasting. (a) Waveform recorded by System A. (b) Waveform recorded by System B.
Initially, the P-wave first arrival times of the blasting signals were manually picked. To facilitate a direct comparison of the P-wave first arrival times from both systems at identical observation points, channels where both systems successfully recorded waveforms at the same locations were selected. The minimum P-wave first arrival times from these co-located channels were then determined and designated as reference values. Subsequently, for each system, the P-wave first arrival time of every channel was subtracted from its respective reference value to yield the corresponding relative arrival times. The statistical results of these relative arrival times are presented in Figure 4.
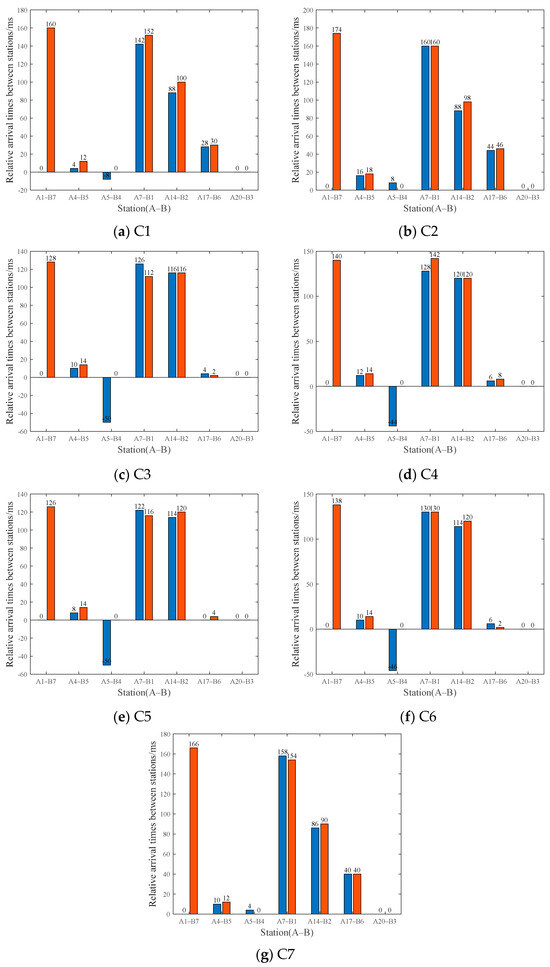
Figure 4.
Comparison of relative P-wave initial arrival times between two systems.
As sensors A1 (System A) and B4 (System B) failed to record valid signals, their corresponding P-wave first arrival times are indicated as zero in Figure 4. The consistently zero relative arrival times for A20-B3 suggest that, across all roof deep-hole blasting signals, channels A20 and B3 were consistently the first to record P-wave arrivals at their respective measurement points for both systems. Consequently, the P-wave first arrival times from these two channels were established as the reference values, against which the relative first arrival times of all other channels were calculated.
The statistical results reveal significant variations in the relative P-wave arrival times across different channels. This observed deviation correlates directly with the distance between the sensor and the blasting point. Specifically, a shorter sensor-to-blasting point distance corresponds to a smaller difference in relative P-wave arrival times. Conversely, this difference progressively increases as the distance grows.
This observed phenomenon can likely be attributed to several contributing factors. Firstly, manual picking introduces a substantial source of error in determining P-wave first arrival times, particularly under conditions of low signal-to-noise ratio. In such instances, the picking error is typically considerable, generally falling within a range of ±4 ms. Secondly, although the observation points for both systems were designed to be co-located, deviations in the relative sensor positions may have occurred during actual installation. For example, some sensors of System B were installed on the roof, whereas those of System A were positioned on the floor. Such discrepancies inevitably lead to variations in wave propagation paths, consequently impacting the accuracy of the P-wave first arrival times.
The observed deviation in the relative P-wave arrival times between the two systems directly impacts the consistency of their respective positioning results. This discrepancy, even in the absence of variations in their underlying positioning algorithms, inherently leads to divergent positioning outcomes for the two systems. Consequently, further investigation into their actual positioning results remains imperative to comprehensively evaluate the positioning capabilities of both systems.
3.3. Comparison of Amplitude–Frequency Characteristics
Using the blasting signal depicted in Figure 3 as an illustrative example, a notable disparity in microseismic signal recordings from identical locations by the two systems is evident. Despite the close proximity of the sensors employed by both systems, the substantial differences observed in their recorded waveform amplitudes strongly suggest underlying variations in signal processing methodologies or detector sensitivities between the two systems.
To quantitatively assess the correlation of signals recorded by different systems at identical measurement points, the waveform correlation coefficient was computed using Equation (1). The results of this calculation are presented in Table 2.
In the formula, x and y denote the amplitude values of the waveform signals recorded at the same measurement point, n is the length of the signal, m is the time delay length selected for the two waveforms, and k is the range for the summation calculation. The maximum value obtained for a certain m is taken as the correlation coefficient between the two waveforms.
Based on the calculation results presented in Table 3, certain measurement points, specifically channels A4-B5, A14-B2, and A20-B3, exhibit relatively high correlation coefficients, exceeding 0.5. This indicates a demonstrable degree of consistency between the two systems in recording signals for these particular channels. Conversely, channels A7-B1 and A17-B6 show low correlation coefficients, with pronounced waveform discrepancies. These significant differences imply that the two systems may encounter substantial errors in signal capture at these specific measurement points, particularly when the signal amplitude is low.

Table 3.
Waveform Correlation Coefficient.
Secondly, spectral analysis further elucidates the discrepancies between the two systems concerning signal frequency components, primarily reflecting variations in the energy-carrying constituents within the waveforms. The dominant frequency, which encapsulates the most significant energy, constitutes the primary frequency of the signal. The main frequency statistics for each channel are summarized in Table 4, and a correlation analysis of these main frequencies is illustrated in Figure 5.

Table 4.
Comparison of main frequency of recorded signals in each Channel.
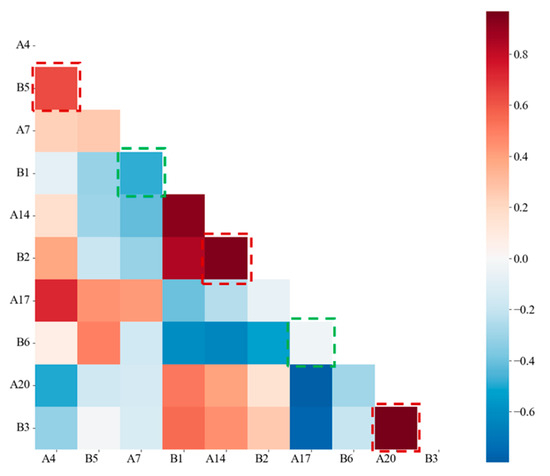
Figure 5.
Correlation matrix of main frequency of different channel. (The dashed box indicates the correlation of the dominant frequency signals from sensors at the same location, with red representing high correlation and green representing low correlation.).
The most pronounced differences are evident between Channel A7 of System A and Channel B1 of System B. Specifically, the waveform from Channel A7 carries substantially less energy than that from Channel B1, and their dominant frequencies exhibit a considerable disparity. Analogously, substantial discrepancies exist between Channel A17 of System A and Channel B6 of System B. Here, the Channel A17 waveform contains significantly more energy than its Channel B6 counterpart, accompanied by a notable difference in dominant frequency.
Overall, the comparative analysis of both amplitude and spectral characteristics reveals substantial discrepancies between the two systems in their recording of blasting signals. Notably, these amplitude variations directly impact subsequent energy calculations, particularly concerning the determination of blasting tremor energy. Therefore, when undertaking comparative analyses of blasting tremor energy, it is advisable to prioritize the waveforms from channels A4-B5, A14-B2, and A20-B3 for energy computations. The higher waveform correlation observed in these specific channels ensures a more accurate reflection of the systems’ consistency in capturing microseismic signals.
3.4. Comparison of Positioning Accuracy
The outcomes of energy calculations are intricately linked to the positioning results. In this experiment, P-wave velocity models inherent to Systems A and B were utilized, leading to the selection of both a constant velocity mode and a distance-dependent velocity mode, respectively. Specifically, within the constant velocity mode, the P-wave velocity was fixed at 4370 m/s. Conversely, the distance-dependent mode involved assigning distinct constant wave velocities for varying propagation distances. For positioning error analysis, all channels that recorded waveforms were incorporated, and the analysis was conducted using five distinct schemes detailed in Table 5. The positioning error for each scheme was subsequently determined by comparison with the actual blasting location.

Table 5.
Positioning Scheme.
The source locations and corresponding positioning errors derived from the aforementioned five schemes are presented in Table 6.

Table 6.
Microseismic source positioning errors under various schemes.
A comparison of the calculation results from Scheme 2 and Scheme 3 reveals that System B’s default mode, which assigns varying wave velocities based on propagation distance, substantially compromises its monitoring and positioning accuracy. The positioning error observed in this mode is, in fact, the largest among all evaluated schemes. Furthermore, the inherent complexity of this mode, coupled with the difficulty in precisely determining the magnitude and spatial extent of its velocity values, significantly diminishes its practical operability in field applications.
A comprehensive comparison of the calculation results from Schemes 3 and 4 with those from Schemes 1 and 5 reveals a comparable performance between the positioning algorithms of System A and B. However, the positioning accuracy achieved using data collected by System A (average error of 49 m) is demonstrably superior to that obtained from System B data (average error of 70 m). These discrepancies may primarily stem from the following factors: ① differences in waveform data recording due to inconsistent technical parameters between the two systems; ② non-standard operation of Sensor B4 in System B; ③ the influence of the velocity model; ④ significant deviations in the P-wave arrival times at distant measurement points when comparing the two systems.
3.5. Comparison of Energy Calculation Results
Systems A and B both provide energy calculation formulas based on the integration method, as detailed in Table 7. Additionally, System B incorporates two further methods: the integration method with filtering and the signal duration method. However, since filtering is typically employed only in the presence of significant background noise, and the duration method solely considers signal duration without accounting for amplitude (thus being primarily applicable to over-range signals), the standard integration method is generally more capable of accurately reflecting the magnitude of blasting wave energy.

Table 7.
Energy Calculation Formula.
The energy calculation results using the integration method are statistically presented in Table 8.

Table 8.
Statistical table of energy calculation results.
The energy calculation results reveal a substantial divergence between the two systems. These discrepancies are primarily influenced by the systems’ inherent technical parameters and energy calculation algorithms. Therefore, when both systems independently utilize their respective positioning results and energy algorithms, the energy calculations exhibit a low correlation, with a correlation coefficient of 0.59. Given the difficulty in modifying the systems’ technical parameters, this finding highlights the necessity of developing a new comprehensive energy calculation method.
4. Microseismic Energy Calculation Method Based on Displacement Gauge Function
Building upon the attenuation law of microseismic waveforms and the associated compensation mechanism, and incorporating the Gutenberg–Richter formula, this paper introduces a novel method for calculating seismic source energy. This method utilizes waveform displacement and a specific gauge function [34,35], and its mathematical expression is presented as follows:
In the formula, R(∆) is the gauge function, which compensates for the maximum displacement D of the recorded waveform based on the distance from the source to the sensor; a and b are empirical coefficients.
According to the local gauge function values R(∆) provided in Appendix A of GB 17740-2017 The Specification of Earthquake Magnitude [36], the current national standard has not yet established a specific method for determining small-scale R(∆) values. Consequently, the existing resolution remains insufficient to meet the energy calculation requirements for low-energy microseismic signals within the scale of mine environments.
4.1. Determination of Small-Scale Gauge Function
Given that microseismic sensors installed in mines are generally positioned within 2 km of the source, the existing conventional local gauge function R(∆) proves inadequate for energy calculation requirements at such distances. Therefore, a determination scheme for a small-scale gauge function R(∆) has been meticulously designed as follows:
Step 1: Initially, a fitting formula correlating epicentral distance with the local gauge function value is derived from the data presented in the local gauge function value table within GB 17740-2017. This relationship, depicted in Figure 6, exhibits a high degree of fit, with a correlation coefficient of 0.98.
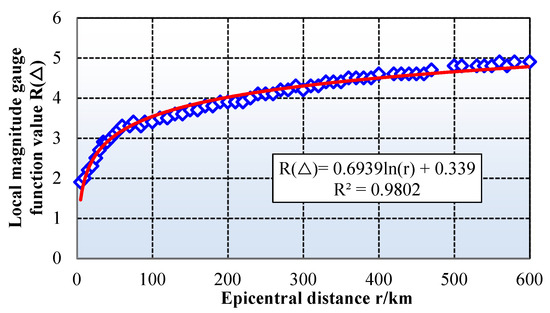
Figure 6.
Relationship between epicenter distance and local gauge function values.
In the formula, R(∆) is the gauge function, and r is the epicentral distance.
Consequently, it can be established that the local gauge function value exhibits the following logarithmic relationship:
In the formula, r is the distance from the source to the sensor, and α and β are the fitting coefficients.
Step 2: Secondly, the microseismic waveforms and station locations that can be recorded by both the microseismic system and the regional seismic system of Dongtan Coal Mine, as shown in Table 9, are collected. Through the earthquake magnitude published by the seismograph station, the corresponding R(∆) for each station (i.e., each distance) can be calculated.

Table 9.
Energy and magnitude of mine tremor of Dongtan coal mine.
Step 3: As shown in Figure 7, using the R(∆) values determined in Step 2 for short distances, the coefficients α = 0.5206 and β = 0.0481 are determined by the linear least squares method, and the local magnitude gauge function value under small scale is finally determined.
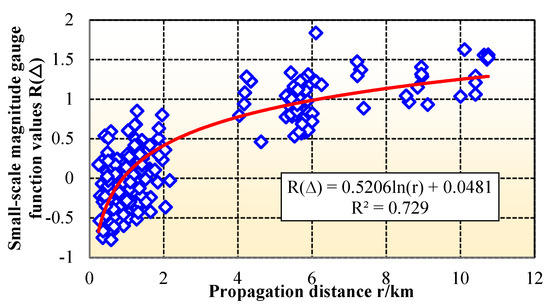
Figure 7.
Relationship between propagation distance and small-scale magnitude gauge function values.
4.2. Calculate the Energy of the Blasting Signal Using the Displacement Gauge Function Method
By substituting Equation (5) into Equation (2), the energy calculation formula utilizing the displacement gauge function is derived as follows:
In the formula, a is taken as 4.8 and b as 1.5 in Equation (2). The energy of the blasting signal was calculated using the newly proposed formula, with the results presented in Table 10. Figure 8 illustrates the linear fitting relationship between the energy calculation results from both systems. Notably, upon implementing the new calculation formula, the energy computations from System A and System B exhibit only minor discrepancies. Furthermore, the linear correlation coefficient reaches an impressive 0.99, indicating a remarkably high degree of consistency and thereby validating the effectiveness of the integrated algorithm.

Table 10.
Energy calculation results of systems A and B.
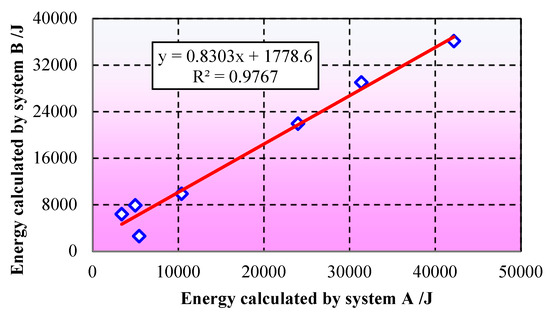
Figure 8.
Correlation between energy calculated by System A and B.
5. Conclusions
- (1)
- A comprehensive comparison of network layout, P-wave first arrival times, amplitude–frequency characteristics, and positioning accuracy between System A and System B revealed significant discrepancies in signal acquisition, waveform amplitude, dominant frequency distribution, and positioning error. Specifically, System A exhibited a considerably lower average positioning error (49 m) compared to System B (70 m). Furthermore, the waveform amplitude correlation coefficient between the two systems did not exceed 0.6. These disparities cumulatively resulted in a low correlation coefficient of merely 0.59 for energy calculations, thereby underscoring the inherent limitations of existing methods in facilitating effective cross-system data integration.
- (2)
- To effectively mitigate the observed discrepancies in energy calculations, a novel energy fusion method predicated on the displacement gauge function was developed. This approach involved fitting a small-scale gauge function and determining empirical coefficients through the meticulous use of actual mine seismic data. Consequently, the consistency of energy calculation results between System A and System B was demonstrably and significantly improved. Experimental results conclusively illustrate that, under this new methodology, the linear correlation coefficient for energy calculations between the two systems attained an impressive 0.977. This outcome unequivocally validates the method’s efficacy in eliminating inter-system disparities and facilitating data standardization.
- (3)
- The fusion method developed in this study offers crucial technical support for the integration of multi-system microseismic data within mining environments and facilitates the establishment of unified early warning standards. This significantly contributes to enhancing the monitoring accuracy of geo-hazards, such as rockburst. For future endeavors, it is imperative to prioritize the further optimization of the gauge function’s applicability and to thoroughly investigate the influence of dynamic wave velocity models on positioning errors. Moreover, promoting the rigorous verification and broader application of this cross-system data fusion technology across diverse mining scenarios will be critical to enhancing the universality and overall reliability of microseismic monitoring technology.
Author Contributions
Conceptualization, H.S.; methodology, S.G.; software, S.G.; validation, X.Z. and R.Y.; formal analysis, S.G. and H.Y.; investigation, S.G., Q.Z., and C.W.; resources, H.Y. and X.Y.; data curation, H.S.; writing—original draft preparation, H.S.; writing—review and editing, S.G.; visualization, H.S.; supervision, S.G.; project administration, S.G.; funding acquisition, S.G. All authors have read and agreed to the published version of the manuscript.
Funding
This research was supported by the National Science and Technology Major Projects (2024ZD1004108), the National Natural Science Foundation of China (52474270), the Jiangsu Basic Research Program (Natural Science Foundation) (BK20231499), the Shandong Energy Group 2022 Project with Chief Scientist System (SNKJ2022BJ03-R28) and the Taishan Leading Talent Project in Industry (NO. tscx202408130).
Institutional Review Board Statement
Not applicable.
Informed Consent Statement
Not applicable.
Data Availability Statement
The original contributions presented in this study are included in the article. Further inquiries can be directed to the corresponding author.
Conflicts of Interest
Authors Hang Sun, Chao Wang, Quan Zhang and Xianyang Yan were employed by the company Yankuang Energy Group Co., Ltd. Authors Xiufeng Zhang and Haichen Yin were employed by the company Shandong Energy Group Co., Ltd. The remaining authors declare that the research was conducted in the absence of any commercial or financial relationships that could be construed as a potential conflict of interest.
References
- Liu, F.; Wang, Y.; Kou, M.; Liang, C. Applications of Microseismic Monitoring Technique in Coal Mines: A State-of-the-Art Review. Appl. Sci. 2024, 14, 1509. [Google Scholar] [CrossRef]
- Dong, L.; Zhu, H.; Yan, F.; Bi, S. Risk Field of Rock Instability using Microseismic Monitoring Data in Deep Mining. Sensors 2023, 23, 1300. [Google Scholar] [CrossRef]
- Li, Q.; Peng, S.; Liang, Y.; Li, W.; Qian, Y.; Cheng, C.; Yu, C.; Zhan, J. Microseismic Monitoring and Assessment of Segmented Hydraulic Fracturing of Horizontal Wells in Coal Seam Roofs. Coal Geol. Explor. 2025, 53, 46–57. [Google Scholar]
- Li, Q.; Peng, Y.; Wu, H.; Cui, D. Cyclic Pressure Step and Mechanism on Working Face Based on Microseismic and Mining Pressure Monitoring. J. Min. Saf. Eng. 2020, 37, 571–577. [Google Scholar] [CrossRef]
- Qian, Y.; Li, Q.; Liang, Y.; Hu, Q.; Li, W.; Li, J.; Yu, C.; Liu, R.; Peng, S. Evaluation of Hydraulic Fracturing in Coal Seam using Ground Microseismic Monitoring and Source Location. Rock. Mech. Rock. Eng. 2024, 57, 679–694. [Google Scholar] [CrossRef]
- Cao, A.; Wang, C.; Yang, X.; Wang, B.; Zhang, N.; Zhao, W. Fractures Characterization in Mining Field Considering Seismic Location Accuracy and its Application on Pre-warning Coal Burst Hazards. Coal Sci. Technol. 2024, 52, 1–9. [Google Scholar]
- Zhao, J.S.; Zhao, Y.M.; Li, P.X.; Chen, C.F.; Zhang, J.C.; Chen, J.H. Microseismic Monitoring of the Fracture Nucleation Mechanism and Early Warning for Cavern Rock Masses. Processes 2023, 11, 2800. [Google Scholar] [CrossRef]
- Chen, Y.; Chen, Z.; Li, Z.; Wang, P. Investigation of Microseismic Monitoring of and Precursor Information on Roof Collapse. Appl. Sci. 2023, 13, 11307. [Google Scholar] [CrossRef]
- Dou, L.; Zhou, K.; Song, S.; Cao, A.; Cui, H.; Gong, S.; Ma, X. Occurrence Mechanism Monitoring and Prevention Technology of Rockburst in Coal Mines. J. Eng. Geol. 2021, 29, 917–932. [Google Scholar]
- Hao, X.; Li, H.; Zhao, Y.; Yang, H.; Yang, B.; Liu, K.; Li, Y. An Early Warning Method and Application of Water Inrush from Coal Mining Floor Based on the Correlation Effect Between Daily Cumulative Microseismic Indicators and Water Level. Chin. J. Rock Mech. Eng. 2024, 43, 2125–2139. [Google Scholar] [CrossRef]
- Zhang, Z.; Zhang, Q.; Liu, J. Research Progress and Prospects of Coal and Gas Outburst and Composite Dynamic Disaster Warning Systems in China. J. China Coal Socity 2024, 49, 911–923. [Google Scholar]
- Pan, J.; Liu, S.; Ma, W.; Xia, Y.; Wang, S.; Feng, M. Occurrence Law and Classification Prevention of Rockburst in Coal Mines of Shanxi Province. Coal Sci. Technol. 2024, 52, 95–105. [Google Scholar]
- Xu, Y.; Huang, L. Full-time and Space Early-Warning Method for Floor Water Inrush in Working Face Based on Microseismic Monitoring. Coal Sci. Technol. 2023, 51, 369–382. [Google Scholar]
- Du, T. Joint Monitoring of Surface and Underground Microseismic Monitoring Technology in Rockburst Coal Mine. Saf. Coal Mines 2022, 53, 92–98. [Google Scholar]
- Zhang, D.; Dai, R.; Zeng, Z.Y.; Ji, H.; Shi, Y.Q.; Chang, Y.; Han, P. Technology and Application of BSN Microseismic Monitoring in Mines. Earthq. Res. China 2021, 37, 332–348. [Google Scholar]
- Sun, X.; Li, Z.; Wang, Y.; Chen, F.; Li, Y. Research on High-precision Wireless Microseismic Monitoring Technology Based on 5G Communication Network. Min. Saf. Environ. Prot. 2022, 49, 83–90. [Google Scholar]
- Fan, X.; Cheng, J.; Li, S.; Duan, J.; Fan, T.; Li, B.; Wang, Y. Application of Microseismic Monitoring System for Coal Mines to the Prevention and Control of Water Disasters on Working Face Roofs. Coal Geol. Explor. 2024, 52, 115–127. [Google Scholar]
- He, G.; He, H.; Yang, Z. Influence of Weak Earthquake on Rockburst Risk in Adjacent Mine Field. Coal Eng. 2023, 55, 114–118. [Google Scholar]
- Xu, G.; Chen, F.; Zhang, Z.; Wang, Y.; Li, Y.; Lu, C.; Lu, Y. Study on Optimization of Vertical Location Accuracy of Seismic Source Based on Joint Monitoring of Surface and Underground Microseismic Monitoring. Coal Sci. Technol. 2020, 48, 80–88. [Google Scholar] [CrossRef]
- Bian, G.; Niu, Y.; Gao, X.; Li, H.; Liu, Y.; Li, Y.; Chu, F.; Hao, X.; Gao, H. Risk Evaluation and Early Warning for Rockburst Based on Microseismic Activity Index of Geological Layers. China Coal 2024, 50, 46–54. [Google Scholar] [CrossRef]
- Stec, K.; Drzewiecki, J. Mine Tremor Focal Mechanism: An Essential Element for Recognising the Process of Mine Working Destruction. Acta Geophys. 2012, 60, 449–471. [Google Scholar] [CrossRef]
- Dou, L.; Wang, S.; Gong, S.; Cai, W.; Li, X. Cloud Platform of Rock-burst Intelligent Risk Assessment and Multi-parameter Monitoring and Early Warning. J. China Coal Soc. 2020, 45, 2248–2255. [Google Scholar]
- He, S.Q.; He, X.Q.; Song, D.Z.; Li, Z.L.; Chen, J.Q.; Xue, Y.R.; Li, Y. Multi-parameter Integrated Early Warning Model and an Intelligent Identification Cloud Platform of Rockburst. J. China Univ. Min. Technol. 2022, 51, 850–862. [Google Scholar]
- Pan, J.; Feng, M.; Lu, Z.; Xia, Y.; Xu, G.; Ma, H.; Wang, Y.; Zhang, J. Research and Application of Comprehensive Monitoring and Early Warning Platform for Coal Mine Rockburst. Coal Sci. Technol. 2021, 49, 32–41. [Google Scholar]
- Geiger, L. Probability Method for the Determination of Earth Quake Epicenters from Arrival Time Only. In Bulletin of St. Louis University; St. Louis University: St. Louis, MO, USA, 1912; pp. 60–71. [Google Scholar]
- Tang, G. A General Method for Determination of Earthquake Parameters by Computer. Acta Seismol. Sin. 1979, 1, 186–196. [Google Scholar]
- Wang, K.K.; Tang, C.A.; Ma, K.; Yu, G.; Zhang, S.; Peng, Y. Cross-related Microseismic Location Based on Improved Particle Swarm Optimization and the Double-difference Location Method of Jointed Coal Rock Mass. Waves Random Complex Media 2021, 34, 5459–5482. [Google Scholar] [CrossRef]
- Han, Y.; Zeng, F.; Fu, L.; Zheng, F. GA-PSO Algorithm for Microseismic Source Location. Appl. Sci. 2025, 15, 1841. [Google Scholar] [CrossRef]
- Ning, D.; Zhu, K.; Zhu, Y.; Yuan, S.; Zhou, Z. A Method for High-accuracy Localization of Microseismic Sources in Mines Based on Finite Element Simulation. Coal Geol. Explor. 2025, 53, 167–178. [Google Scholar]
- Wang, J.; Hu, N.; Jiang, F.; Lü, W.S.; Qu, X.C. Calculation Method for the Seismic Wave Energy of Microseismic Hypocenters. Chin. J. Eng. 2013, 35, 703–708. [Google Scholar]
- Wang, J.; Zhu, Q.; Zhang, E. A Method for Micro-seismic Energy Expressions in Mine. Coal Eng. 2020, 52, 86–91. [Google Scholar]
- Dou, L.; He, X.; Wang, E.; Cao, S. The Mechanism of Rock Burst and Seismic Waves and Its Prevention. J. Min. Saf. Eng. 1999, 199–203. [Google Scholar]
- Gong, S.Y.; Dou, L.M.; Ma, X.P.; Mu, Z.L.; Lu, C.P. Optimization Algorithm of Network Configuration for Improving Location Accuracy of Microseism in Coal Mine. Chin. J. Rock Mech. Eng. 2012, 31, 8–17. [Google Scholar]
- Guo, Y.; Li, J.; Jin, X.; Lin, B.; Cai, H. Study on Local Magnitude Deviations in Fujian. J. Geod. Geodyn. 2025, 45, 266–272. [Google Scholar] [CrossRef]
- Wang, Y.; Mao, G.; Zhou, Y.; Wang, N.; Jiang, H. Study on the Calibration Function and Azimuth Correction of Hebei Local Earthquake Magnitude. Technol. Earthq. Disaster Prev. 2023, 18, 797–808. [Google Scholar] [CrossRef]
- GB 17740-2017; The Specification of Earthquake Magnitude. Standards Press of China: Beijing, China, 2017.
Disclaimer/Publisher’s Note: The statements, opinions and data contained in all publications are solely those of the individual author(s) and contributor(s) and not of MDPI and/or the editor(s). MDPI and/or the editor(s) disclaim responsibility for any injury to people or property resulting from any ideas, methods, instructions or products referred to in the content. |
© 2025 by the authors. Licensee MDPI, Basel, Switzerland. This article is an open access article distributed under the terms and conditions of the Creative Commons Attribution (CC BY) license (https://creativecommons.org/licenses/by/4.0/).