Article

Assessment of Continuous Flow-Dependent Red Cell Aggregation Using a Microfluidic Chip

by
Yang Jun Kang
Department of Mechanical Engineering, Chosun University, 10, Chosundae 1-gil, Dong-gu, Gwangju 61452, Republic of Korea
Appl. Sci. 2025, 15(21), 11481; https://doi.org/10.3390/app152111481
Submission received: 30 September 2025 / Revised: 23 October 2025 / Accepted: 27 October 2025 / Published: 27 October 2025
(This article belongs to the Special Issue Current Applications of Microfluidics for Biosensing and Diagnostics)

Featured Application

The present method is aimed at measuring RBC aggregation in continuously varying flow rate. As a promising application, it could be employed to probe continuous RBC settlement in a driving syringe, or quantify blood circulated in closed fluidic circuit.

Abstract

Measuring RBC aggregation can be considered as a valuable tool for detecting pathological diseases. Most previous methods need to stop and run blood flows periodically. Thus, it is impossible to probe RBC aggregation in continuously varying infusion flow. To resolve the issues, a novel bifurcated continuous-flow mechanism is suggested to probe RBC aggregation without periodic interruption of blood flow. A microfluidic chip is then designed to split single flow into two branches (low flow rate and high flow rate). RBC aggregation occurs in the low flow-rate channel, whereas it is dispersed fully in the high flow-rate channel. Using a syringe pump, blood is infused into a microfluidic chip at constant and sinusoidal pattern. RBC aggregation index (AI) is calculated from time-lapse imaging intensity within each channel. From fluidic circuit analysis and experimental results, the optimal infusion flow rate is determined as Qsp = 0.5~2 mL/h. The AI is higher at Hct = 30% than at Hct = 50%. The high concentration of dextran solution increases AI considerably. The period of pulsatile infusion flow rate has a strong influence on time-lapse AI. In conclusion, the present method can be capable of measuring time-lapse AI consistently, without interrupting infusion flow.

1. Introduction

Red blood cell (RBC) aggregation occurs at stasis or extremely low shear rates. An increase in fibrinogen concentration promotes rouleaux formation [1,2]. In addition, hematocrit (Hct) [3,4,5,6,7,8], density [9,10,11,12], and viscoelasticity [13,14,15,16] have an influence on RBC aggregation. Due to a reversible process, RBC aggregates are dispersed completely at high shear rates. RBC aggregation contributes to increasing blood viscosity at low shear rates. Increased aggregation indicates alternation in RBC cellular property or plasma protein, which leads to impaired blood flows [17,18] or tissue perfusions [19]. Thus, measuring RBC aggregation can be considered as a valuable tool for detecting pathological diseases, including cardiovascular diseases [20,21,22,23,24], diabetes [2,25,26,27], and hypertension [28].
Following the recent introduction of microfluidic technology [29], a microfluidic chip has been extensively applied to quantify several rheological properties [30,31,32,33,34,35], including viscosity [36,37,38,39], RBC deformability [40,41,42,43,44,45,46,47], RBC aggregation [48,49], hematocrit [50], and RBC sedimentation [51,52].
To probe RBC aggregation, blood is loaded into a microfluidic chip. Shear stress is applied to break up RBC aggregates. RBC aggregation index (AI) is then acquired by analyzing a time-lapse syllectogram. First, to break up RBC aggregates, a microfluidic chip has a sudden-constricted channel, a hyperbolic-constricted channel [53], a triangular configuration of three pillars [49], and a wide-rectangular channel [51,54]. After a microfluidic channel is filled with blood, several infusion tools, including a vibrational motor [49,55], a syringe pump [56], a pinch valve [54], and a pressure source, are operated for breaking up RBC clusters. The infusion source operates sufficiently until RBC aggregates are fully dispersed. After the elapse of a certain time, RBC aggregation occurs by turning off the infusion source. Second, time-lapse shear stress [26,56], image intensity [55], and light intensity are obtained by quantifying RBC clustered in a microfluidic channel in terms of optical component (i.e., camera [57], photo detector), electrical impedance, and pressure [26]. RBC aggregation index is then estimated by analyzing a typical syllectogram. From the literature survey, the previous methods show a limitation on the measurement of RBC aggregation in continuous blood flows. That is, for aggregating and disassociating RBCs, most of the previous methods need to stop and run blood flows periodically. For this reason, it is impossible to monitor RBC aggregation continuously, where RBC sedimentation occurs continuously in a driving syringe [48]. Furthermore, the previous methods cannot be applied to probe the effect of pulsatile infusion flow rate [58] on alternation in RBC aggregation.
To resolve the issue (i.e., RBC aggregation measurement in continuously varying blood flow rate) raised by the previous studies, a microfluidic channel-splitting innovation is suggested to probe RBC aggregation without periodic interruption of blood flow. A single parent channel is bifurcated into a low flow-rate channel and high flow-rate channel, respectively. RBC aggregation is observed in the low flow-rate channel, but is dispersed fully in the high flow-rate channel. RBC aggregation index (AI) is then calculated by analyzing time-lapse blood imaging intensity within each channel. For a performance demonstration, first, contribution of key parameters (i.e., infusion flow rate and hematocrit) to RBC aggregation is evaluated through measuring blood velocity as well as image intensity. After that, several kinds of blood test are conducted by adding normal RBCs into several different concentrations of dextran solution, and changing hematocrit in each test blood. At last, the RBC aggregation index is acquired under periodic flow-rate infusion.
When compared with previous methods [48,59], first, RBC aggregation could be obtained and quantified without interrupting blood streams or sources. It is then possible to monitor RBC sedimentation in a driving syringe, where RBC sedimentation occurs continuously. Second, the present method is capable of assessing RBC aggregation in continuously varying flow rate (i.e., sinusoidal flow-rate pattern). It might be applied to quantify time-lapse aggregation where test blood is circulated in a closed fluidic circuit [60,61].

2. Materials and Methods

2.1. Microfluidic Chip and Experimental Setup

To probe RBC aggregation for continuously loaded blood, as depicted in Figure 1A, the experimental setup composed of a syringe pump, a microfluidic chip, and a microscope imaging acquisition system.
As shown in Figure 1A(i), the microfluidic channel consisted of an inlet, an outlet, a main channel (mc), and a test channel (tc). The test channel was connected to the mid position of the main channel (width = 1.0 mm, length = 14.5 mm). It was composed of three segments connected in series: the first segment (width = 0.1 mm, length = 4.9 mm), the second segment (width = 1.0 mm, length = 2.0 mm), and the last segment (width = 0.1 mm, length = 8.8 mm). Channel depth was fixed at 0.05 mm.
A 4-inch silicon mold was produced using photolithography and deep reactive-ion etching. A polydimethylsiloxane (PDMS, Sylgard 184, Dow Corning, Midland, MI, USA) block was cast by soft lithography. The inlet through-hole was punched using a biopsy punch (outer diameter = 0.75 mm) and the outlet was trimmed with a razor blade. Using an oxygen plasma system, oxygen plasma was exposed to the PDMS block and glass-bottom dish (30 mm well, Cellvis, Mountain View, CA, USA). The treated parts were then bonded to assemble the PDMS chip.
As shown in Figure 1A(ii), a flexible Tygon tubing (inner diameter = 0.25 mm, length = 300 mm) was fitted to the inlet port. To prevent non-specific adsorption of plasma proteins on the channel walls, bovine serum albumin (50 mg/mL) was introduced through the inlet to fill the channels. After 10 min of incubation, the channels were then flushed with 1× PBS. A syringe (~1 mL) was filled with test blood (~0.4 mL). The syringe needle was connected to the Tygon tubing. By slowly pushing the syringe plunger, test blood was infused into the microfluidic channels and discharged from the outlet.
As represented in Figure 1A(iii), a driving syringe was installed into a syringe pump which aligned vertically against gravitational direction. The syringe pump (neMESYS, Cetoni GmbH, Korbußen, Germany) was set to flow rate (Qsp). The right-side panel showed RBC sedimentation in a driving syringe during blood delivery. RBC sedimentation contributed to the separation of test blood into RBC- and RBC-depleted mediums (t = t1) in a driving syringe. Following continued infusion for a specific duration, the syringe contained only RBC-depleted medium (t = t2).
As shown in Figure 1A(iv), blood flow in microfluidic channels were recorded using an inverted microscope (IX81, Olympus, Tokyo, Japan) coupled to a high-speed camera (FASTCAM MINI, Photron, Tokyo, Japan). A halogen lamp (TH4-200, Olympus, Tokyo, Japan) was employed to illuminate the test blood in a microfluidic channel. The microfluidic chip was mounted on the moving stage of the microscope. The objective lens was set to 4× (NA = 0.1). The camera operated at 5000 fps. A functional generator produced a sawtooth trigger (period = 1 s) to acquire two images separated by 1 s. All experiments were performed at a constant room temperature of 25 °C.

2.2. Blood Velocity and Blood Imaging Intensity in Main and Test Channels

To assess RBC aggregation using microscopic imaging intensity, it was necessary to quantify the imagining intensity of RBC aggregates and RBC disaggregates. In addition, time-lapse blood velocity was acquired to estimate variations in blood flow rate in each channel.
First, imaging intensity of RBC disaggregates was obtained within a main channel. As shown in Figure 1B, a specific region-of-interest (ROI) in the main channel was chosen at a certain distance from the junction point of the test channel. Its ROI area was set to 1.8 mm2. Simultaneously, the imaging intensity of RBC aggregates was obtained within the largest chamber of the test channel (ROI area = 1.8 mm2). To obtain the contribution of RBC aggregation, the image intensity of blood flow within each channel was calculated by subtracting the image intensity of each microscopic imaging from the intensity of the initial background image. With regard to a specific ROI selected in the main channel and the test channel, the imaging intensity of blood flow was acquired as Imc (main channel) and Itc (test channel) using MATLAB 2024 (MathWorks; Natick, MA, USA).
Second, with regard to the specific ROI of each channel, blood velocity fields were obtained using an open-source micro-PIV program [62]. For micro-PIV analysis, the interrogation window was 13 × 13 µm2 with 50% overlap. Velocity fields were corrected with local median and standard-deviation filters. Using analytical expression for the depth of correlation (DOC)73, the DOC of our imaging system was calculated as 325 µm. Because the DOC exceeded the channel depth, the micro-PIV produced depth-averaged velocities within each interrogation window. The mean velocity was computed by averaging the velocities over the ROI. The average velocity of each channel was denoted as Umc (main channel) and Utc (test channel).

2.3. Quantification of RBC Aggregation Index (AI)

To clearly visualize variations in RBC aggregation, dextran solution (Cdex = 20 mg/mL) [49] was selected as the blood medium and a low hematocrit of 30% was selected; they were carefully selected for increasing RBC aggregation in the test blood. The test blood (Hct = 30%) was prepared by mixing normal RBCs into the dextran solution (Cdex = 20 mg/mL). Infusion flow rate was set to Qsp = 1 mL/h.
As depicted in Figure 1C(i), microscopic image was captured at a specific time (t) (t = 30, 60, 400, and 1080 s). Within the largest chamber of the test channel, RBC aggregation was clearly visualized. RBC aggregation decreased over time. However, imagining intensity of the main channel remained unchanged due to RBC disaggregation. At t = 1080 s, RBC-depleted blood came into the main channel and the test channel.
As shown in Figure 1C(ii), variations in image intensity (Imc, Itc) and blood velocity (Umc, Utc) were acquired over time. Initially, blood was loaded manually for discharging air bubbles that existed in fluidic paths (i.e., tubing, syringe needle, and microfluidic channels) [63]. Thereafter, blood was supplied at a constant flow rate (Qsp = 1 mL/h) with a syringe pump. The intensity difference between Imc and Itc (i.e., ΔI = ImcItc) represented the strength of RBC aggregation. Due to continuous RBC settlement in a driving syringe [48], hematocrit increased continuously over time [64]. Thus, both intensities tended to increase gradually over time. After an elapse of a sufficient long period (t > 1000 s), RBC-depleted blood began to come in both channels. Thus, image intensity decreased substantially. Blood velocity increased suddenly.
As shown in Figure A1 (Appendix A), to inspect RBC aggregation (i.e., rouleaux form), the field of view (FOV) was magnified by changing the objective lens from 4× to 20×. At high magnification, the rouleaux form was clearly visualized. However, the Itc was decreased significantly. Thus, low magnification (4×) was fixed for achieving a high sensitivity of AI.
As shown in Figure 1C(iii), to define RBC aggregation index with imaging intensity (Imc, Itc), temporal variations in Imc, Itc, and AI were revisited with an elapse of time. Taking into account the fact that the imaging intensity difference between both intensities (ΔI = ImcItc) represented the magnitude of RBC aggregation, the RBC aggregation index (AI) as a dimensionless form was defined as AI (ti) = (Imc [ti] − Itc [ti])/Imc (ti) at a specific time (t = ti). When RBC sedimentation began to occur in a driving syringe, the AI decreased gradually over time.
From the preliminary study, the RBC aggregation index (AI) could be acquired under continuous blood infusion.

2.4. Blood Sample Preparation for Quantifying RBC Aggregation

Concentrated normal RBCs were purchased from the Gwangju–Chonnam Blood Bank (Gwangju, Republic of Korea) and kept in a refrigerator prior to experiments.
With regard to washing protocols, concentrated normal RBCs were diluted about 50% with 1× PBS. The suspension was dropped and filtered through the cell strainer (mesh size = 70 µm). The filtered blood was loaded into a centrifuge tube. After centrifugation at 4000 rpm for 10 min, packed RBCs were isolated by removing 1× PBS and buffy coat. This procedure was repeated twice. Test blood was then prepared by resuspending packed RBCs into the desired blood medium (1× PBS, or diluted dextran solution).
First, to assess the effect of hematocrit on RBC aggregation, test blood was prepared at 30% or 50% hematocrit by adding packed RBCs into either 1× PBS or dextran solution (20 mg/mL). Second, to promote RBC aggregation in the test blood [48,49], dextran powder (Leuconostoc spp., M.W. = 450–650 kDa, Sigma-Aldrich, Saint Lousis, MO, USA) was dissolved into 1× PBS over a range of 5~20 mg/mL. Test blood was then prepared by suspending packed RBCs into each concentration of dextran solution.

3. Results and Discussion

3.1. Mathematical Model and Its Validation of a Proposed Microfluidic System

According to the previous study [65], RBC aggregation occurred at shear rates for up to about 43 s−1. To check whether RBC aggregation within the largest chamber of the test channel (width = 1 mm, and depth = 0.1 mm) occurred or not, it was necessary to estimate shear rate with respect to infusion flow rate.
As shown in Figure 2A(i), infusion flow rate was set to Qsp using a syringe pump. The right-side panel represented a mathematical model of a proposed microfluidic system. Using discrete fluidic elements, including infusion flow rate (Qsp), and fluidic resistance (i.e., tubing: Rtb, upper and lower main channels: Rmc, and test channel: Rtc), a fluidic circuit model of a proposed microfluidic system was constructed. The junction point between the main channel and test channel was denoted as “j”. The corresponding flow rate in the main channel and test channel was denoted as Qmc and Qtc, respectively. Based on simple fluidic resistance formula for a rectangular channel (Rf = 12   μ   L w   h 3 , μ: viscosity, L: channel length, w: channel width, and h: channel depth) and a circular channel (Rf = 8   μ   L π   a 4 , a: radius, and L: tubing length) [66], the corresponding fluidic resistance of tubing, main channel, and test channel was acquired as Rth = 3.13 × 10¹² Pa·s/m3, Rmc = 2.10 × 10¹² Pa·s/m3, and Rtc = 43.38 × 10¹² Pa·s/m3. Herein, viscosity of the fluid was assumed as μ = 3 cP. Fluidic resistance ratio between the test channel and main channel was then calculated as Rtc/Rmc = 20.61.
Using circuit analysis principle, the flow-rate conservation law ( Q i n = Q o u t , summation of inflowing flow rate = summation of outgoing flow rate) as well as the same pressure at the junction point (“j”), the following equation was derived as,
Q s p = P j R m c + P j R t c
Flow rate formula of the test channel and main channel was then estimated as,
Q m c = R t c R m c + R t c × Q s p ,
Q t c = R m c R m c + R t c × Q s p .
Based on shear rate formular (i.e., a rectangular channel:   γ ˙ = 6 Q w   h 2 , and a circular tubing: γ ˙ = 32 Q π   d 3 ) [66] as depicted in Figure 2A(ii), the corresponding shear rate of an inlet tubing, a main channel, and a test channel (i.e., narrow width segment, and wide-width segment) were obtained with respect to Qsp. Infusion flow rate ranged from 0.1 mL/h to 4 mL/h. According to simulation results, the shear rate of a main channel was estimated as above 50 s−1, even at Qsp = 0.1 mL/h. It was confirmed that no RBC aggregation was observed within the specific infusion flow-rate ranges. To avoid RBC aggregation within the tubing, the infusion flow rate should be kept above 0.3 mL/h. Furthermore, to continuously induce RBC aggregation in test channel, infusion flow rate should be set to less than 2 mL/h. For inducing RBC aggregation effectively, specially within a test channel, the infusion flow rate should be selected between 0.3 mL/h and 2 mL/h. Herein, the shear rate of each segment was then estimated as γ ˙ = 93–617 s−1 (narrow width segment) and γ ˙ = 9–62 s−1 (wide-width segment), respectively. For this reason, RBC aggregation could occur only within the wide-width segment of the test channel.
To validate simulation results, as shown in Figure 2B(i), blood velocity (Umc, Utc) as well as blood imaging intensity (Imc, Itc) were obtained with respect to infusion flow rate ranging from 0.5 mL/h to 4 mL/h. Herein, to prevent continuous RBC sedimentation in a driving syringe, control blood (Hct = 50%) was prepared by mixing normal RBCs into 1× PBS. Figure 2B(ii) showed temporal variations in Imc and Itc at the infusion flow rate of Qsp = 1 mL/h. As expected, both intensities remained unchanged over time because the blood medium, 1× PBS, did not contribute to RBC sedimentation. To analyze overall variations in Imc and Itc during blood delivery, the average value of each intensity was calculated as <Imc> and <Itc> for the overall acquisition period. As depicted in Figure 2B(iii), variations in <Imc> and <Itc> were acquired with respect to Qsp = 0.5~4 mL/h. As both intensities maintained constant, it was confirmed that no RBC sedimentation was present during blood infusion. With regard to the variation in blood velocity in the main channel and test channel, as shown in Figure 2B(iv), temporal variations in Umc and Utc were acquired at an infusion flow rate of Qsp = 1 mL/h. The corresponding velocity of each channel was obtained as Umc = 4.71 ± 0.22 mm/s and Utc = 0.15 ± 0.08 mm/s, respectively. The ratio of Umc and Utc was calculated as Umc/Utc = 32.06. Furthermore, as depicted in Figure 2B(v), variations in Umc, Utc, and Umc/Utc were summarized with respect to Qsp = 0.5~4 mL/h. From the linear regression analysis, both Umc and Utc were proportional to infusion flow rate (R2 = 0.995 for Umc, R2 = 0.9957 for Utc). The corresponding Umc/Utc for each infusion flow rate was obtained as Umc/Utc = 21.88 (Qsp = 0.5 mL/h), Umc/Utc = 32.06 (Qsp = 1 mL/h), Umc/Utc = 29.68 (Qsp = 2 mL/h), Umc/Utc = 31.26 (Qsp = 3 mL/h), and Umc/Utc = 30.13 (Qsp = 4 mL/h). Considering that Rtc/Rmc = 20.61 was obtained from the fluidic circuit analysis, a normalized difference of 6~36% was observed between circuit analysis and experimental results.
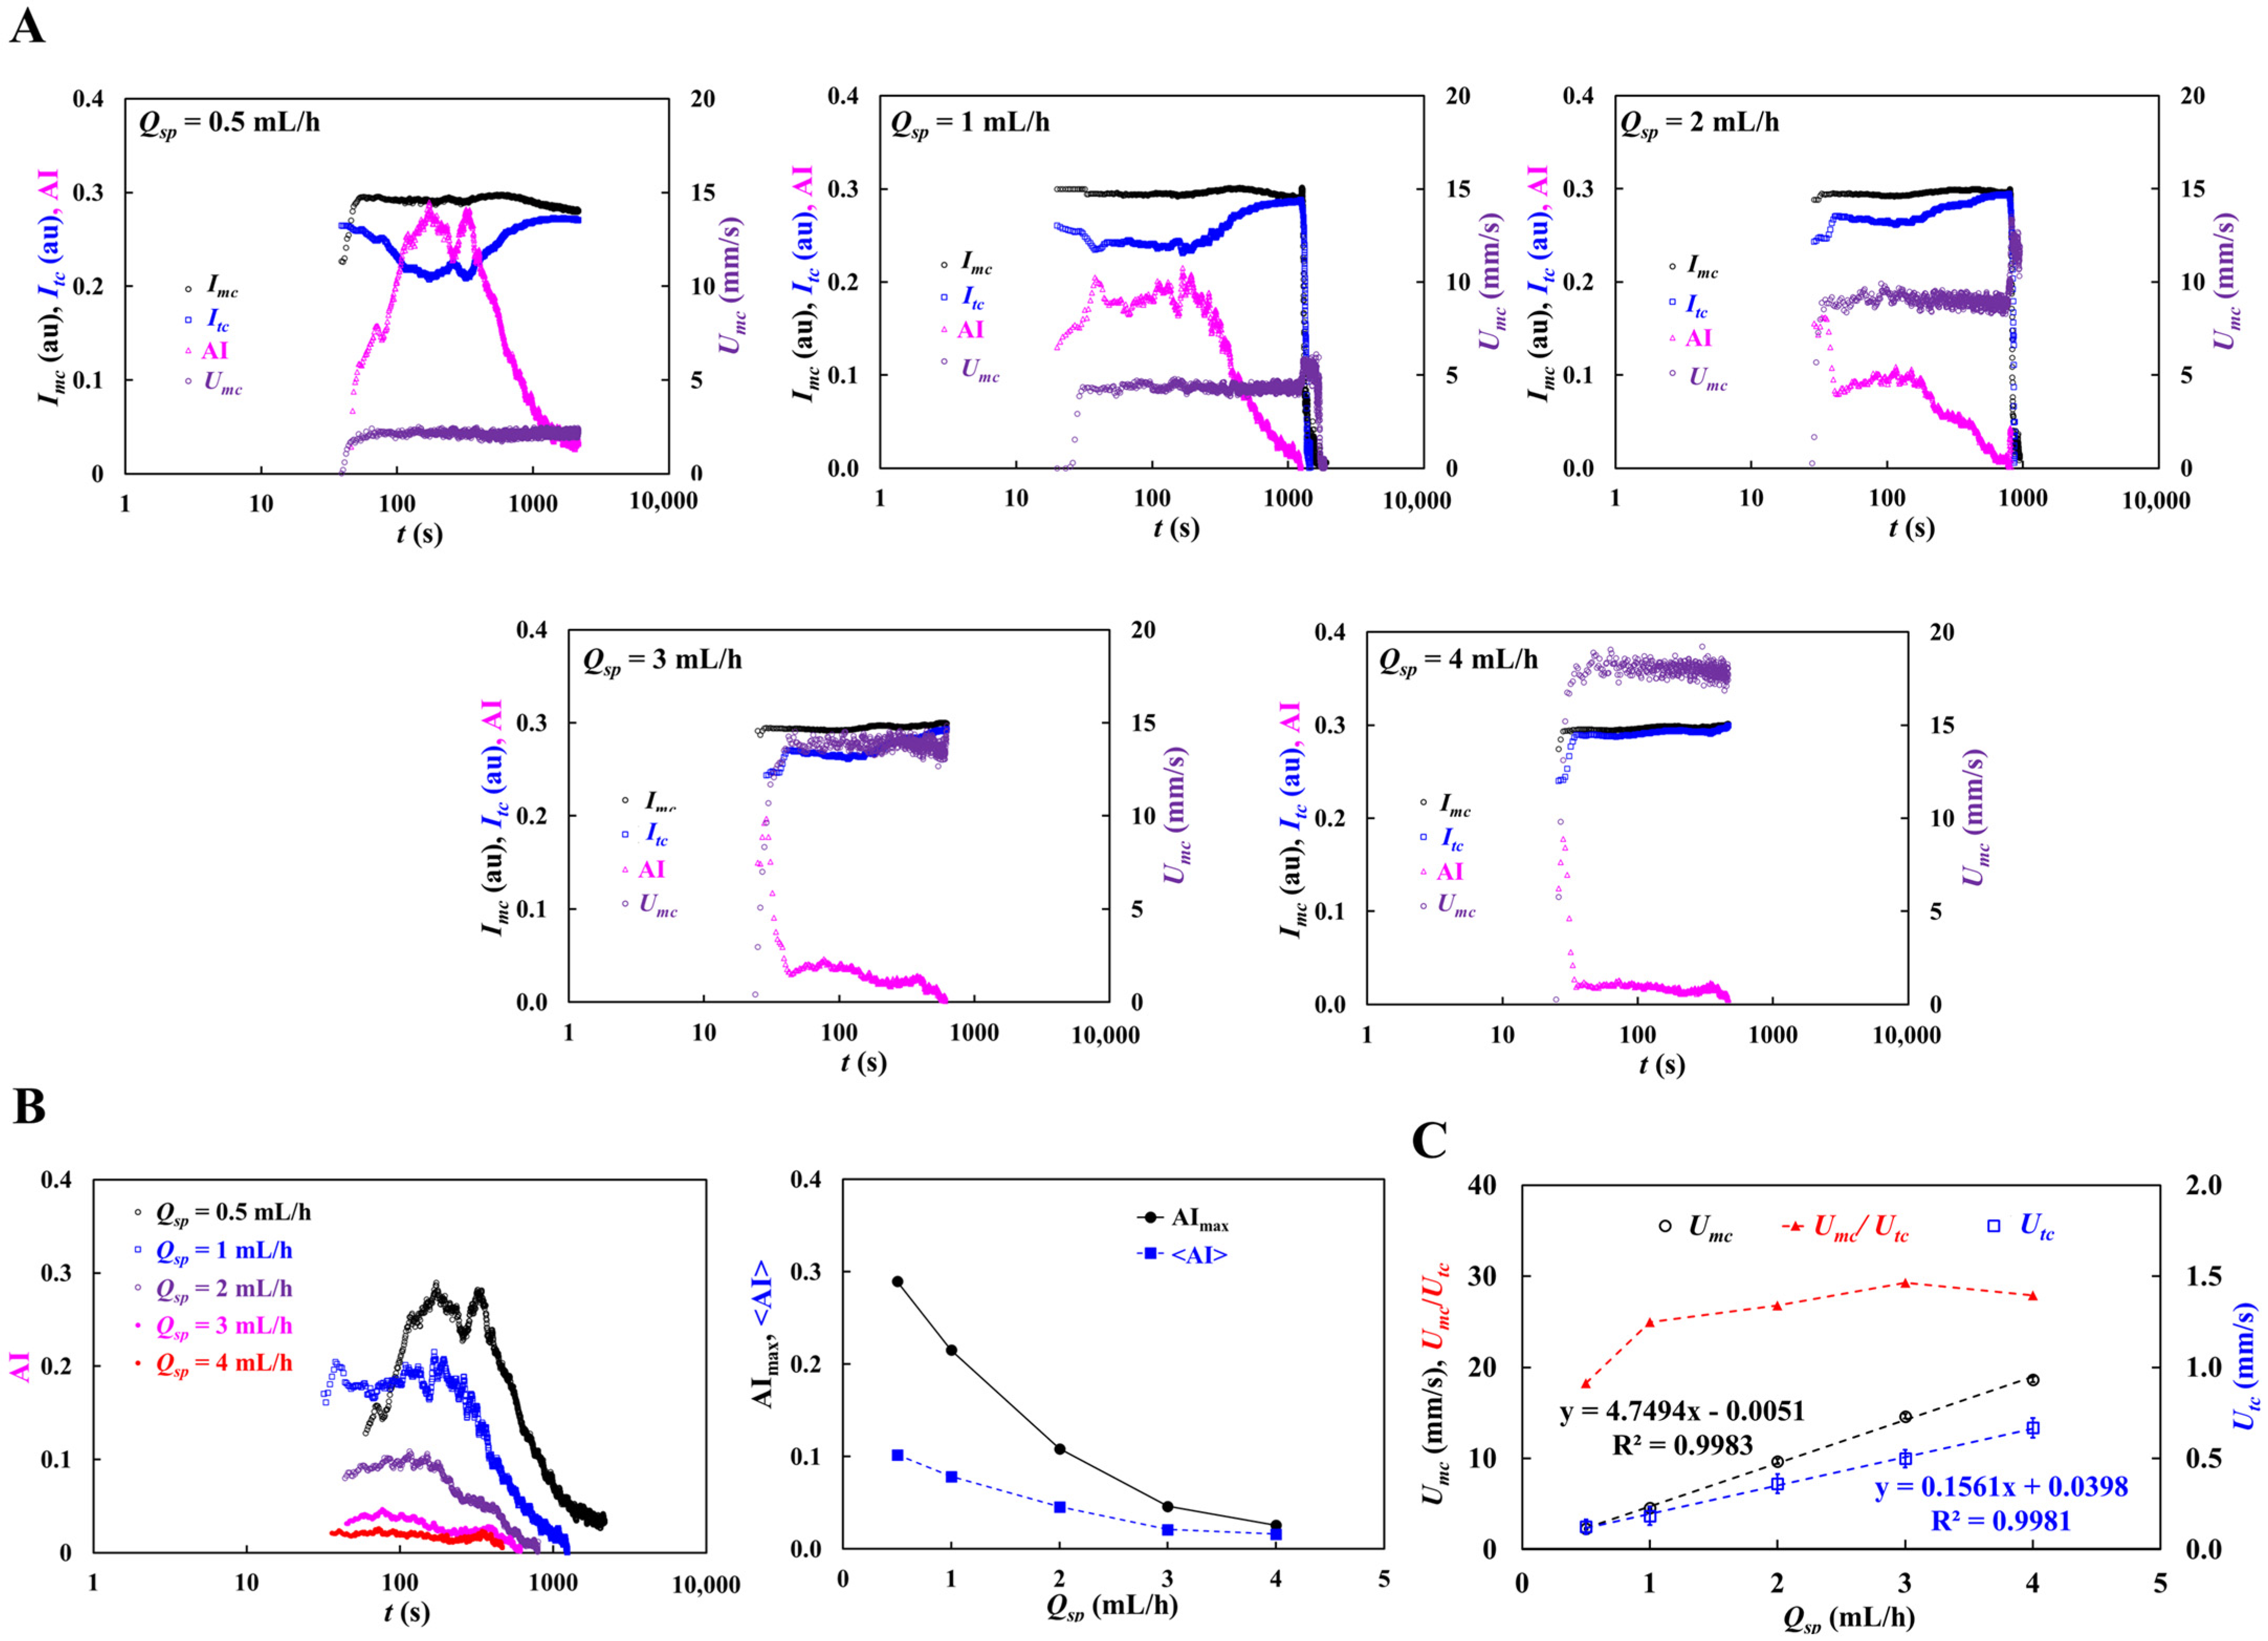
To consider continuous RBC sedimentation in a driving syringe, blood medium was changed from 1× PBS to dextran solution (20 mg/mL) [49]. Hematocrit of the test blood was set to 50%. As shown in Figure 3A, temporal variations in image intensity (Imc, Itc) and blood velocity (Umc, Utc) were acquired with respect to Qsp = 0.5~4 mL/h. From the results, the Imc did not exhibit a substantial difference at high infusion flow rate. However, the Itc exhibited substantial variations during blood delivery. Its variation was decreased substantially by increasing infusion flow rate. As shown in the left-side panel of Figure 3B, temporal variations in AI were re-summarized with respect to Qsp. The AI varied markedly during blood delivery and declined substantially at higher infusion flow rates. To summarize AI fluctuations, maximum (AImax) and mean (<AI>) were computed from time-lapse AI data. The right-side panel of Figure 3B showed variations in AImax and <AI> with respect to Qsp. According to the results, both parameters decreased substantially with respect to Qsp. As summarized in Figure 2A(ii), considering shear rate estimation with respect to Qsp, the simulation results were consistent because a distinctive change in the RBC aggregation index appeared within the 0.5~2 mL/h infusion range. Figure 3C shows variations in Umc, Utc, and Umc/Utc with respect to Qsp. Based on linear regression analysis, Umc and Utc were proportional to infusion flow rate (R2 = 0.9983 for Umc, R2 = 0.9981 for Utc). The corresponding Umc/Utc of each infusion flow rate was obtained as Umc/Utc = 18.26 (Qsp = 0.5 mL/h), Umc/Utc = 24.95 (Qsp = 1 mL/h), Umc/Utc = 26.79 (Qsp = 2 mL/h), Umc/Utc = 29.30 (Qsp = 3 mL/h), and Umc/Utc = 27.93 (Qsp = 4 mL/h). Considering Rtc/Rmc = 20.61 was obtained from fluidic circuit analysis, a normalized difference of 12~30% was observed between circuit analysis and the experimental results.
From fluidic circuit analysis and experimental investigation, the optimal range for quantifying AI was selected as 0.5~2 mL/h. Evaluating the fluidic resistance or velocity ratios of the two channels revealed a normalized difference of 6~36% between fluidic circuit analysis and experimental measurements.

3.2. Contribution of Syringe Installation to RBC Aggregation

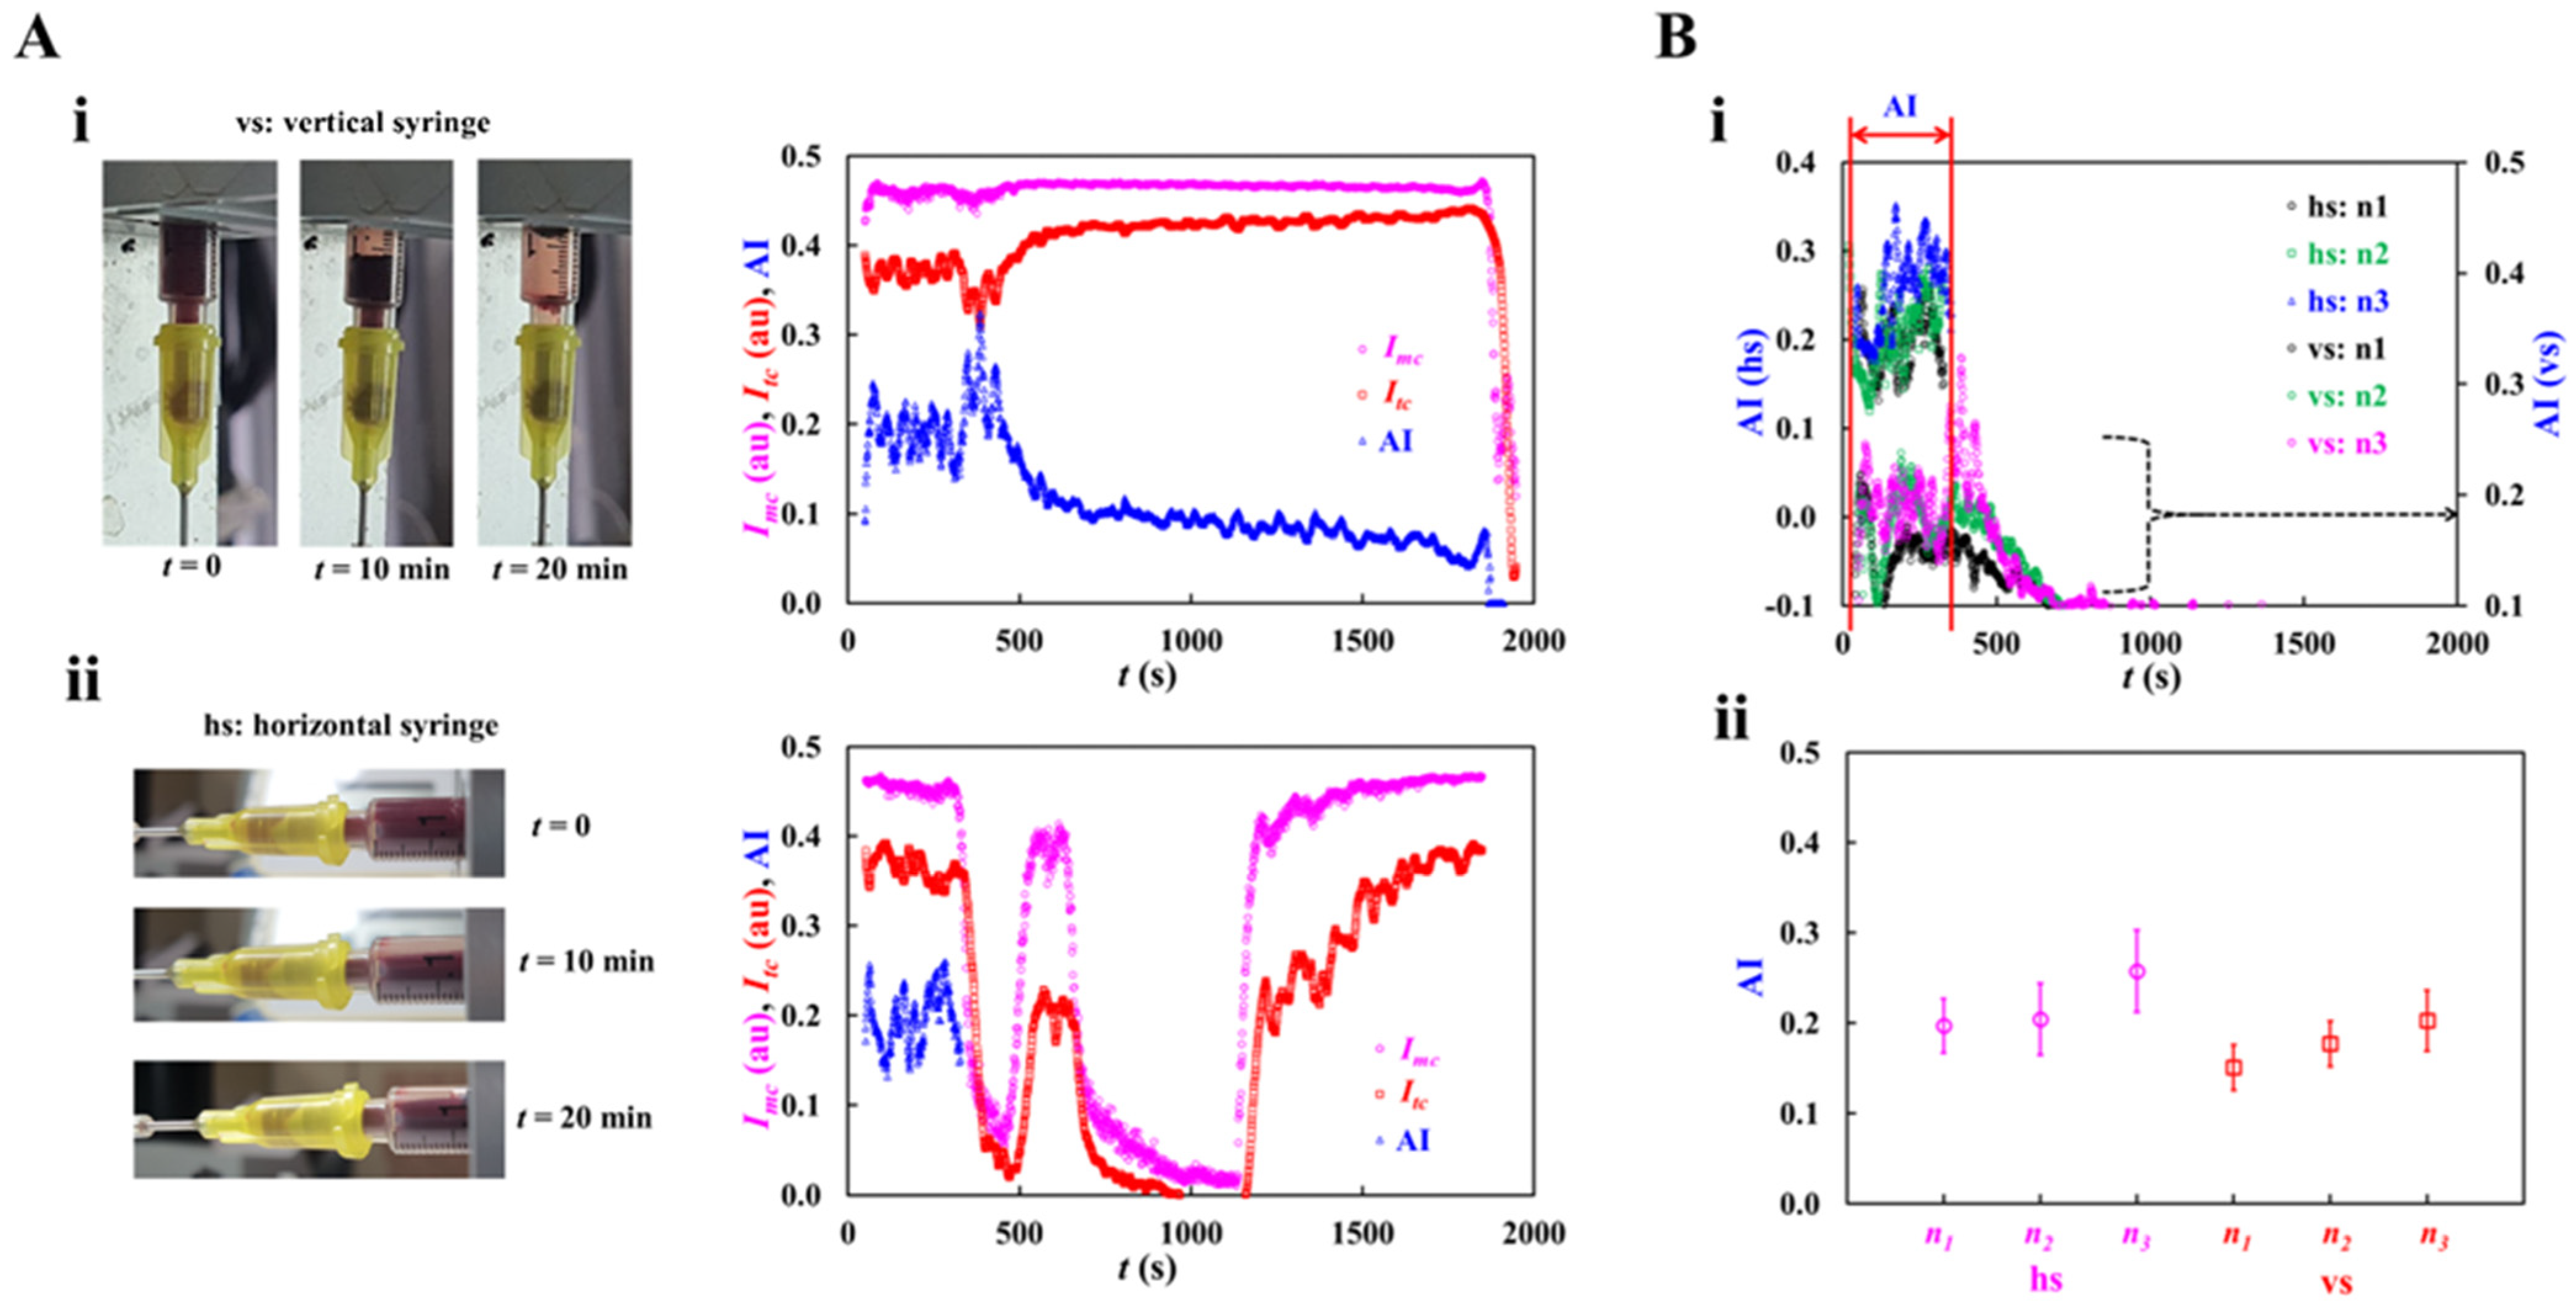
To probe the contribution of syringe installation direction to RBC aggregation, a driving was installed in horizontal and vertical direction. Due to different suction positions (i.e., horizontal syringe: side hole, vertical syringe: button hole), the hematocrit of blood infused into a microfluidic channel varied over time. Herein, test blood (Hct = 50%) was prepared by mixing normal RBCs into the dextran solution (20 mg/mL). Flow rate was set to Qsp = 0.5 mL/h.
As shown in Figure 4A, snapshot images showed RBC sedimentation in a driving direction at a specific time (t = 0, 10, and 20 min). RBC sedimentation occurred continuously in the vertical syringe. The Imc and Itc remained constant over time until RBC aggregation occurred distinctively. RBC aggregation caused a significant increase in both image intensities. For this reason, RBC aggregation index tended to decrease gradually over time. However, with regard to horizontal syringe, RBC sedimentation occurred continuously for up to the middle position of the syringe. As blood was loaded from the side position, hematocrit decreased substantially when RBC aggregation began to occur. Both image intensities (Imc, Itc) were varied largely over time. From the results, it was inferred that syringe installation direction caused the variation in hematocrit of blood flowing in a microfluidic channel. That is, when the syringe pump was installed vertically, the Imc did show little variation over time. However, the horizontal syringe exhibited substantial variations in Imc over time because RBC sedimentation caused reduced hematocrit over time.
As shown in Figure 4B(i), temporal variations in AI were obtained with respect to syringe installation direction. Herein, with regard to horizontal syringe (hs), variations in AI were obtained until the Imc remained constant over time. A repetitive test (n = 3) was conducted with respect to each installation direction. According to the results, both syringes exhibited similar trends of AI before RBC sedimentation increased considerably. To compare with variations in AI, time-lapse AI data were selected and calculated as mean ± standard deviation. Figure 4B(ii) exhibited variations in AI with respect to syringe direction. The AI gave similar values of AI with respect to syringe installation direction before RBC sedimentation occurred. On the other hand, with regard to the horizontal syringe, it was difficult to obtain RBC sedimentation in terms of AI. However, with regard to the vertical syringe, as the AI tended to decrease gradually over time, temporal variations in AI could be used to detect RBC sedimentation indirectly.
From the experimental investigation, it led to the conclusion that a vertical syringe could be considered as effective for obtaining AI as well as RBC sedimentation.

3.3. Contribution of Hematocrit to RBC Aggregation

To evaluate the effect of hematocrit on RBC aggregation, test blood (Hct = 30%, and 50%) was prepared by suspending normal RBCs into dextran solution (20 mg/mL). The infusion flow rate was fixed at Qsp = 1 mL/h.
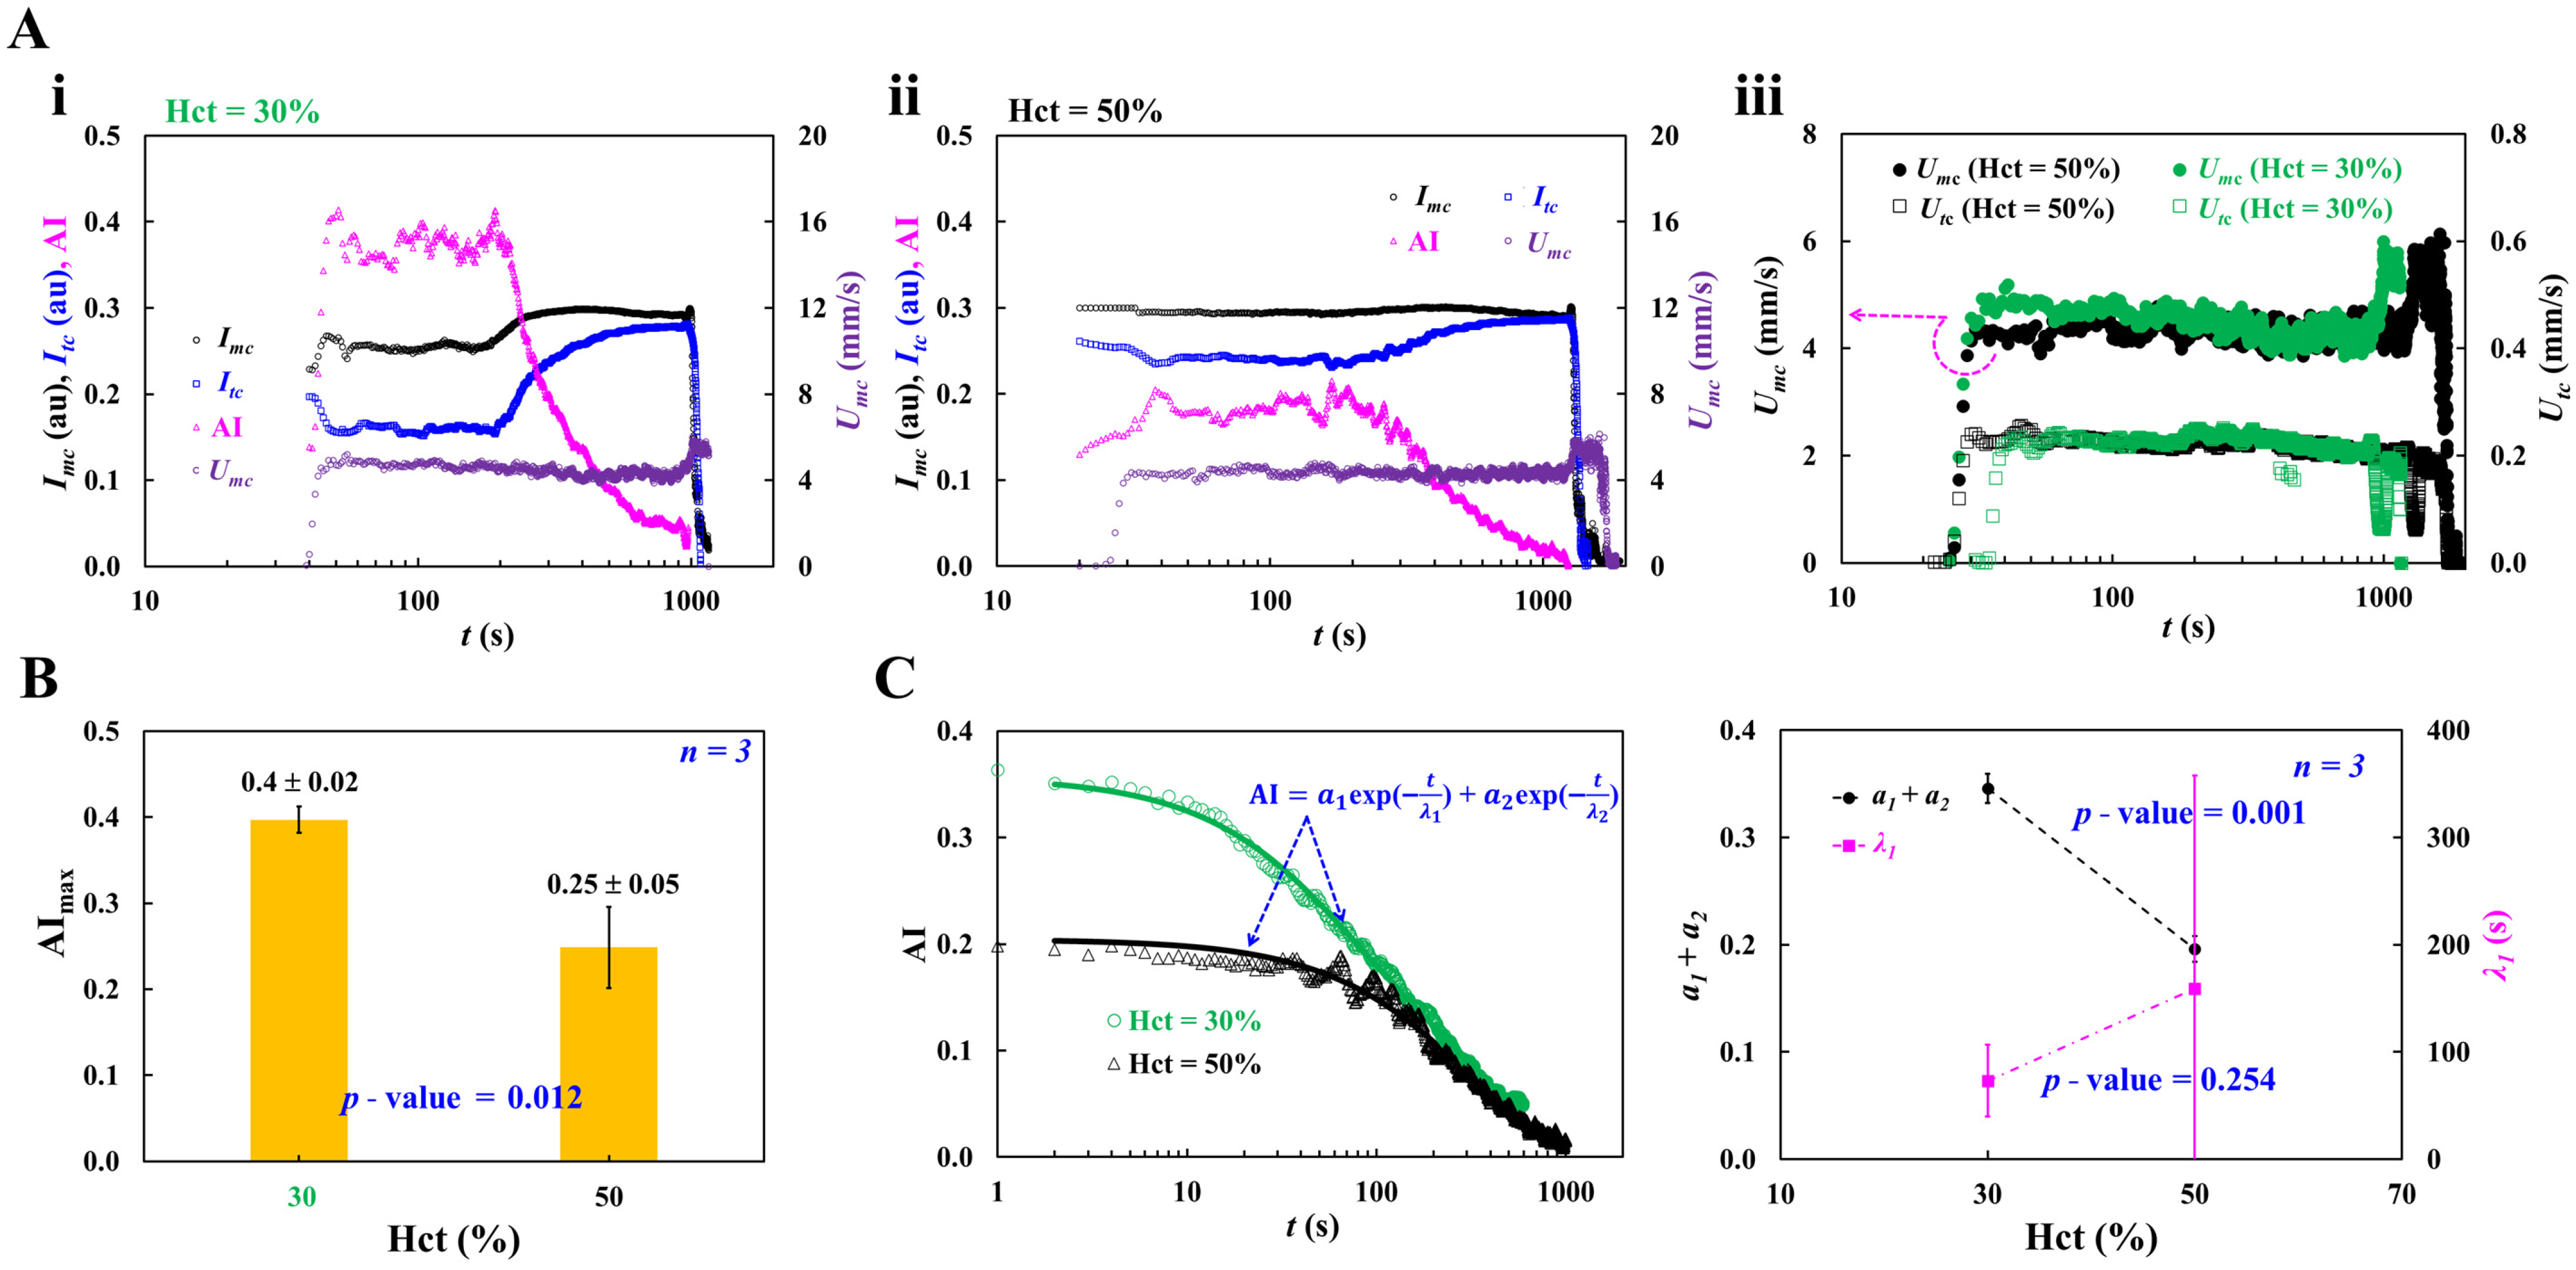
As depicted in Figure 5A, temporal variations in Imc, Itc, and Umc were obtained with respect to Hct = 30% and 50%. With regard to the low hematocrit of 30%, after a certain time elapse, Imc and Itc increased gradually over time. The AI decreased gradually over time. However, with regard to the high hematocrit of 50%, the Imc decreased slightly over time. The AI decreased gradually over time. Thus, the elevating hematocrit (from 30% to 50%) markedly reduced AI. To examine variations in blood velocity with respect to hematocrit, as shown in Figure 5A(iii), temporal variations in Umc and Utc were acquired with respect to Hct = 30% and 50%. According to the results, both velocities did not exhibit substantial differences with respect to hematocrit. That is, either Umc or Utc was not suitable for reliable RBC aggregation quantification. Based on Figure 5A(i,ii), the maximum value of AI (AImax) was calculated with respect to Hct. Herein, the number of test blood was set to n = 3. As shown in Figure 5B, the corresponding AImax of each hematocrit was obtained as AImax = 0.4 ± 0.02 (Hct = 30%) and AImax = 0.25 ± 0.05 (Hct = 50%), respectively. The results indicate that hematocrit contributed to decreasing AImax significantly (ANOVA test, p-value = 0.012).
As shown in the left-side panel of Figure 5C, time-lapse AI was revisited with respect to Hct. To analyze time-dependent trends of AI quantitatively, time-lapse AI data was best fitted as AI = a1 exp (−t/λ1) + a2 exp (−t/λ2). The first component (a1, λ1) represents the initial, rapid phase of RBC aggregate formation, while the second component (a2, λ2) describes the slower restructuring and stabilization of larger aggregates. According to non-linear regression analysis, at a low hematocrit of 30%, the four unknown parameters were estimated as a1 = 0.21 ± 0.07, a2 = 0.14 ± 0.07, λ1 = 73.3 ± 33.4 (s), and λ2 = 511.7 ± 201.6 (s). At a high hematocrit of 50%, the four unknown parameters were acquired as a1 = 0.13 ± 0.10, a2 = 0.07 ± 0.09, λ1 = 158.9 ± 198.9 (s), and λ2 = 1544.3 ± 573.07 (s). For convenience, two parameters (i.e., summed amplitude: a1 + a2, short time constant: λ1) were selected for quantitative comparison between two hematocrits. The right-side panel of Figure 5C showed variation in the summed amplitude (a1 + a2) and time constant (λ1) with respect to Hct. From the results, the summed amplitude (a1 + a2) tended to decrease when hematocrit increased from 30% to 50% (ANOVA test, p-value = 0.001). However, the λ1 tended to increase gradually with respect to hematocrit, whereas it did not exhibit substantial difference with respect to Hct (ANOVA test, p-value = 0.254).
From the experimental investigation, hematocrit had a strong influence on AI. The AI was higher at Hct = 30% than at Hct = 50%. In contrast, blood velocity did not provide a consistent relationship with RBC aggregation. Based on the quantitative analysis of time-lapse AI, the summed amplitude (a1 + a2) varied markedly with Hct, whereas time constant (λ1) did not exhibit substantial difference with respect to Hct.

3.4. Contribution of Dextran Solution and Hematocrit to RBC Aggregation

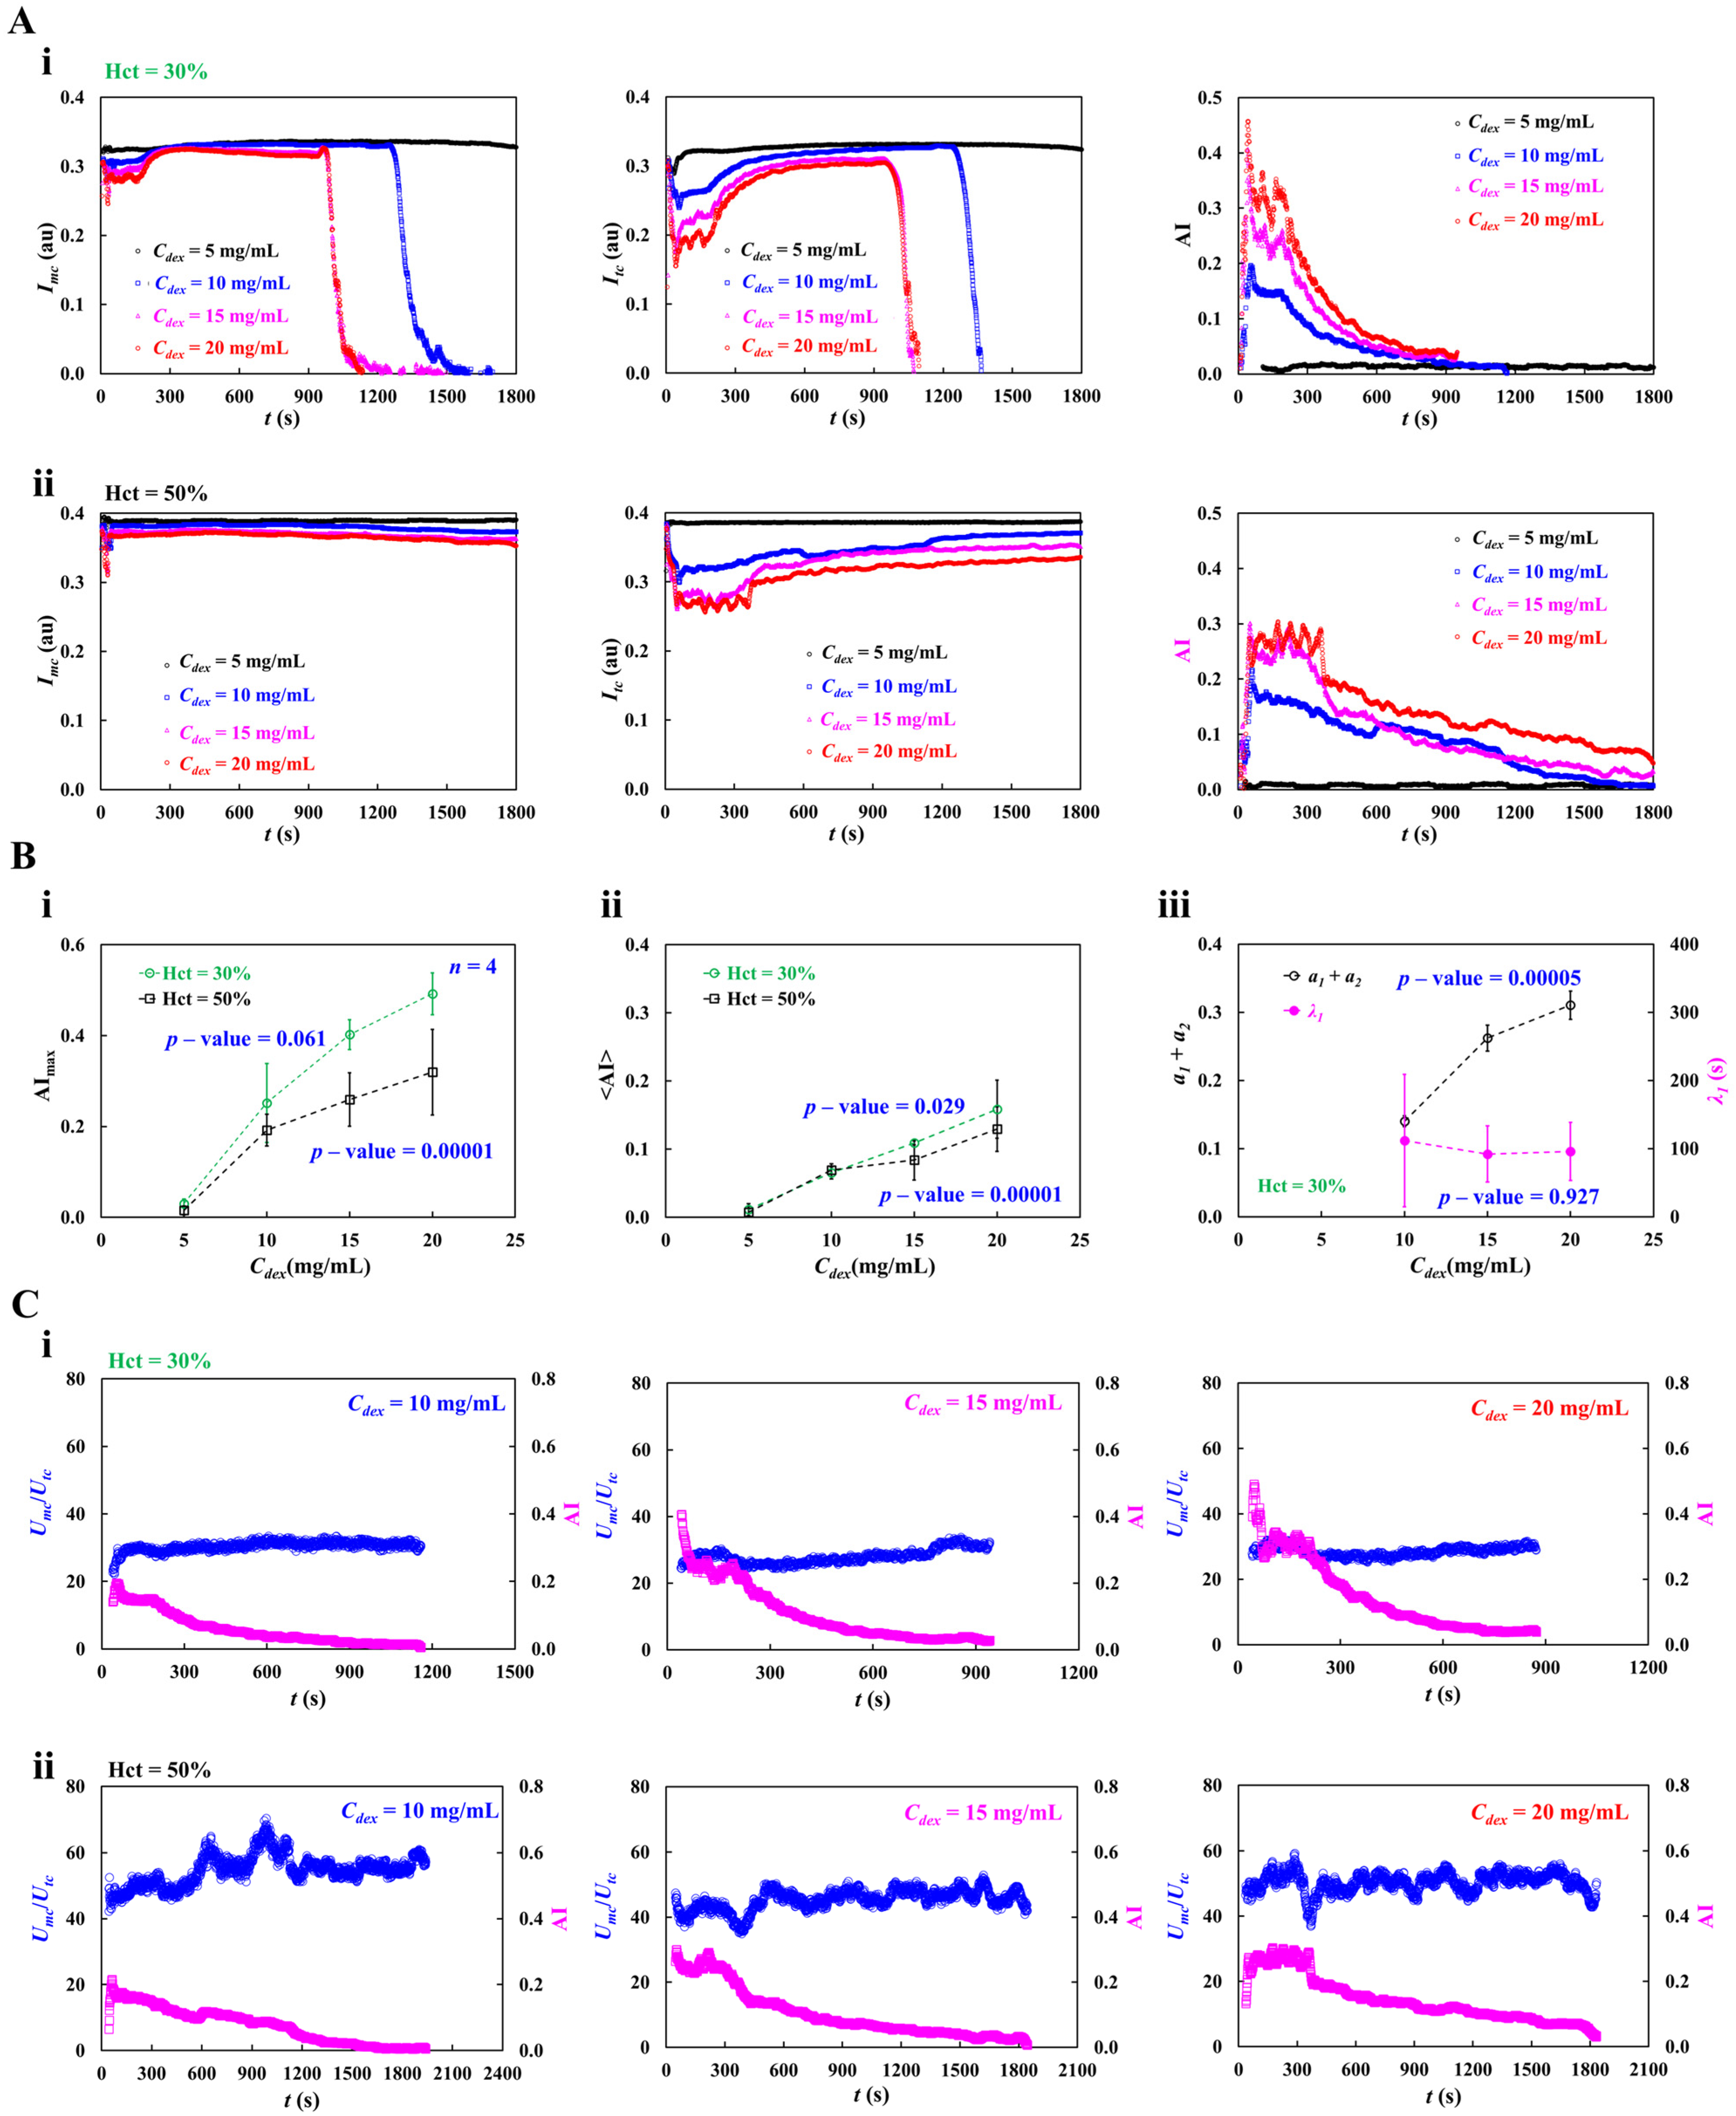
To examine variations in AI quantitatively, various concentrations of dextran solution (Cdex = 5~20 mg/mL) which have been commonly used in RBC aggregation tests were prepared [49]. Furthermore, setting a hematocrit of 30% or 50% was needed to guarantee a measurable impact on RBC aggregation. That is, the test blood (Hct = 30% or 50%) was prepared by suspending normal RBCs into each dextran solution. The infusion flow rate was set to Qsp = 1 mL/h.
As shown in Figure 6A(i,ii), temporal variations in Imc, Itc, and AI were acquired with respect to Cdex and Hct. At a low hematocrit of 30%, both intensities did not exhibit substantial change over time at Cdex = 5 mg/mL. Due to significant RBC settlement in the driving syringe, the Imc dropped to zero at 1300 s (Cdex = 10 mg/mL) and 1000 s (Cdex = 15~20 mg/mL). The Itc showed a similar temporal pattern. Higher concentrations of dextran solution produced higher AI. It started at a maximum and subsequently decreased over time. The temporal pattern was consistent with the other concentrations except Cdex = 5 mg/mL. At a high hematocrit of 50%, except Cdex = 5 mg/mL, the Imc did drop gradually over time, whereas Itc increased gradually over time. The AI reached an early peak and then declined gradually for up to 1800 s.
As shown in Figure 6B(i,ii), variations in AImax and <AI> were acquired with respect to Cdex and Hct. At low hematocrit (Hct = 30%), both parameters rose markedly with increasing Cdex (ANOVA test, p-value = 0.00001). At high hematocrit, the AImax exhibited substantial difference (ANOVA test, p-value = 0.061). The dextran solution contributed to increasing the <AI> significantly (ANOVA test, p-value = 0.029). Using the time-lapse AI dataset, non-linear regression analysis was conducted to obtain the summed amplitude (a1 + a2), and time constant (λ1) with respect to Cdex and Hct = 30%. As depicted in Figure 6B(iii), variations in the summed amplitude (a1 + a2) and time constant (λ1) were summarized with respect to Cdex. The results indicated that the summed amplitude (a1 + a2) was increased markedly with increasing Cdex (ANOVA test, p-value = 0.0005), whereas the λ1 had little change (ANOVA test, p-value = 0.927).
To examine quantitative comparison between Umc/Utc and AI with respect to Cdex and Hct, as shown in Figure 6C(i,ii), temporal variations in Umc/Utc and AI were acquired with respect to Cdex = 10, 15, and 20 mg/mL and Hct = 30%, and 50%. From the results, Umc/Utc did not exhibit a substantial difference with respect to Cdex and Hct. For this reason, the Umc/Utc was not suitable for monitoring RBC aggregation. However, hematocrit as well as dextran concentration had a strong influence on time-lapse AI patterns.
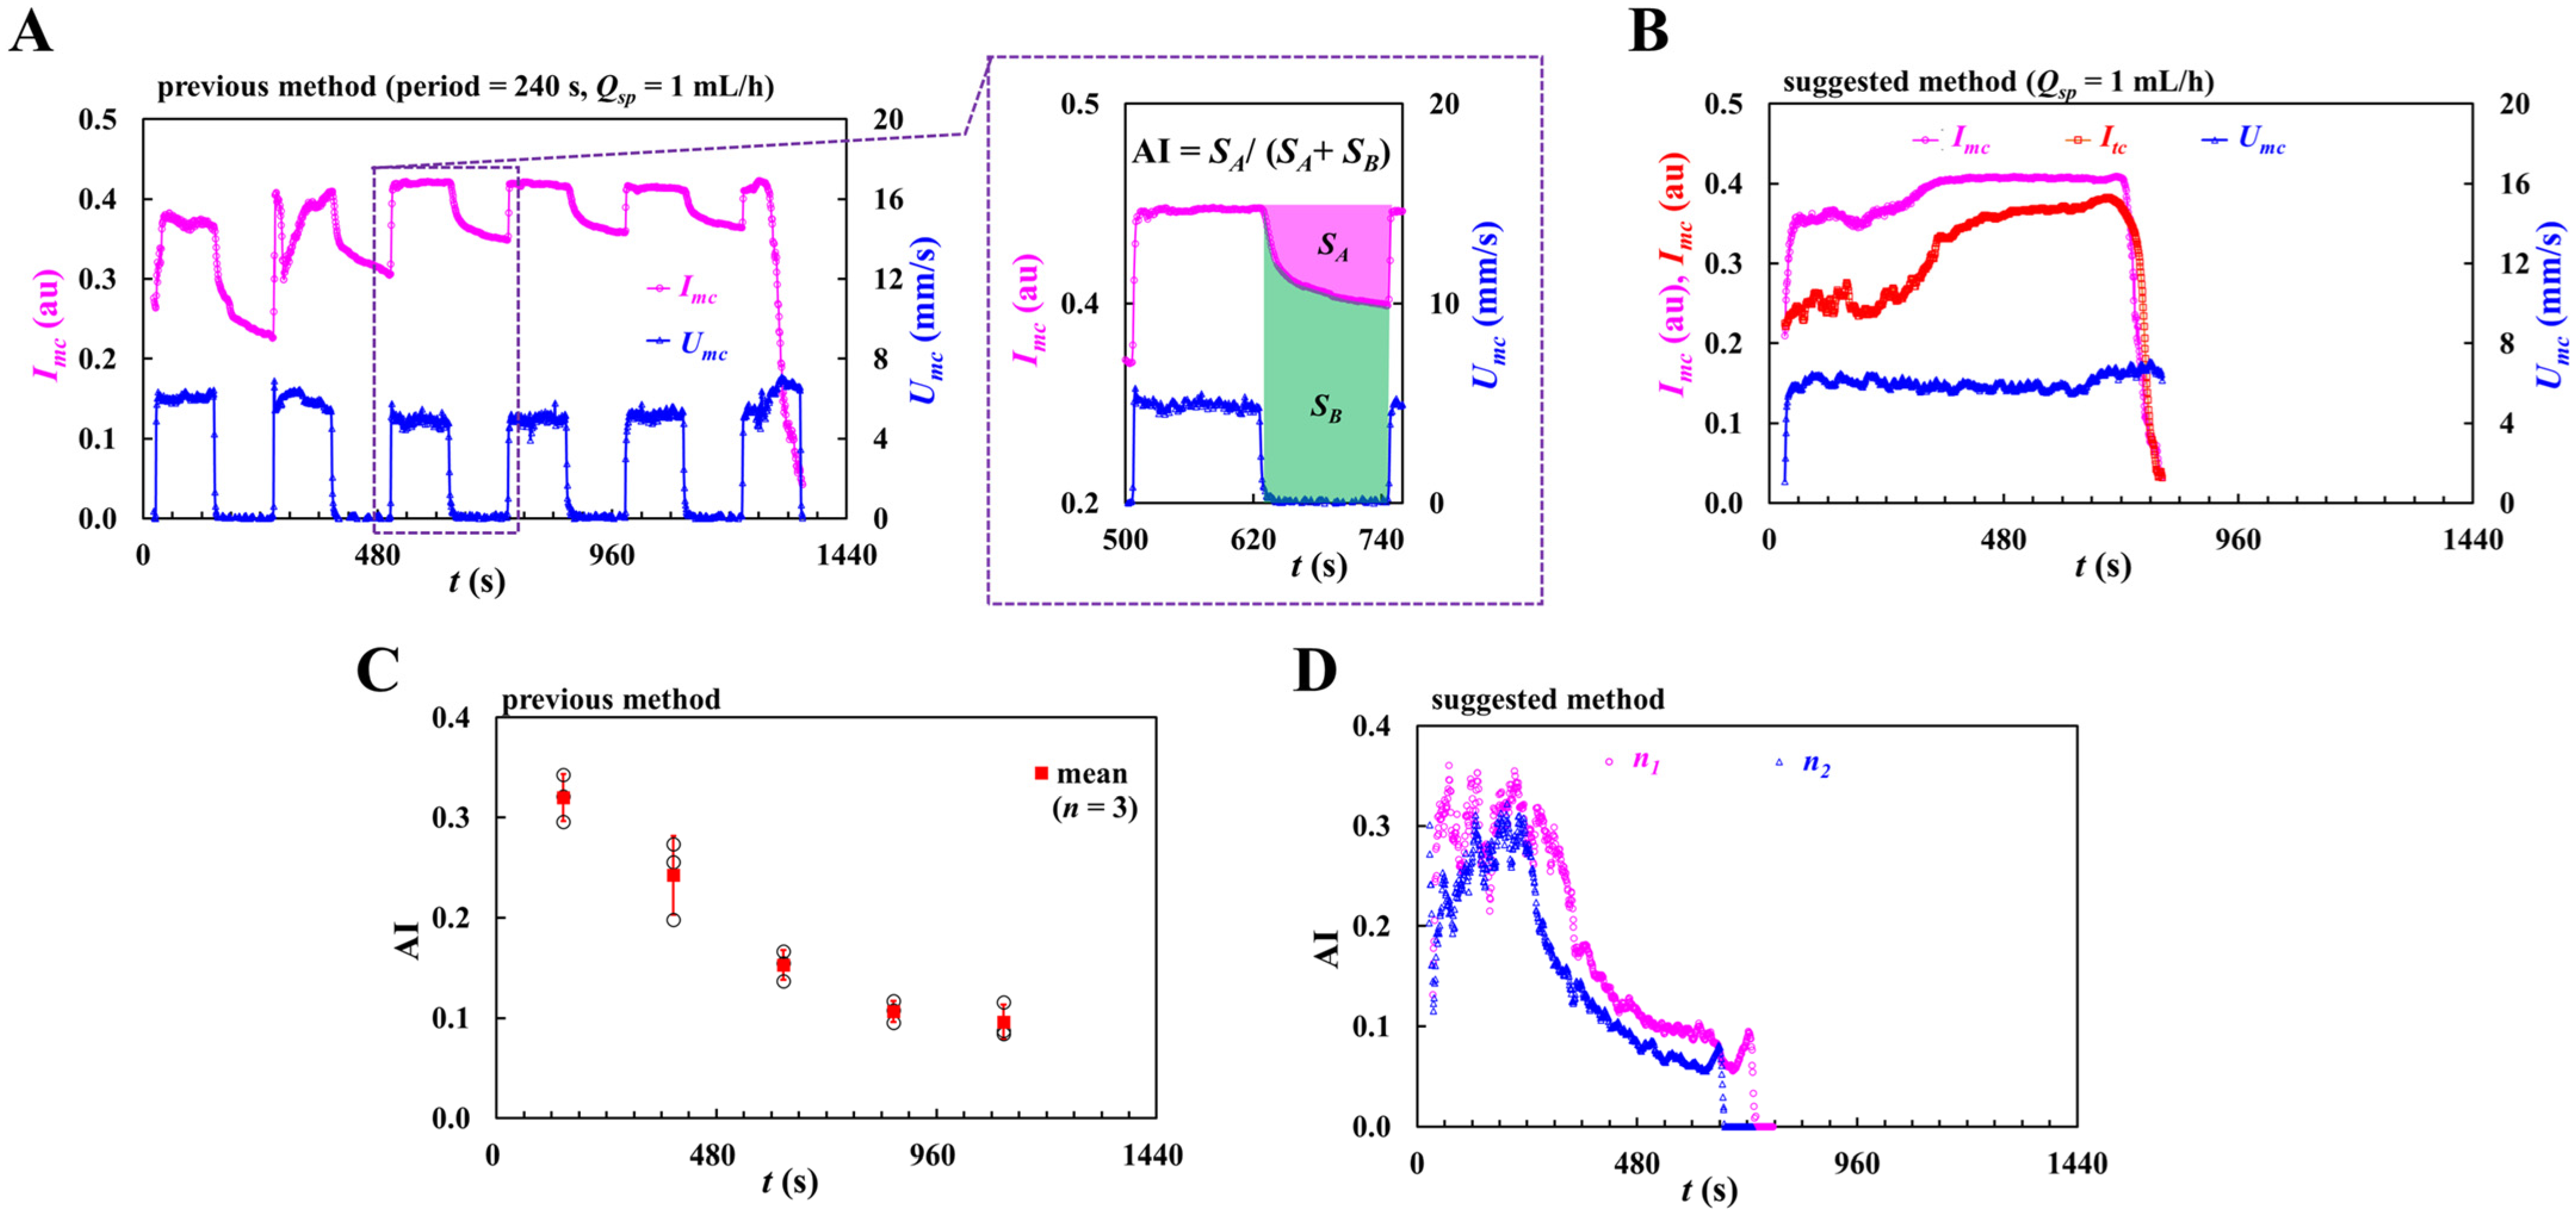
To quantitatively compare with both methods (i.e., previous method, and suggested method) in terms of AI, the flow-rate profile was only adjusted as constant flow rate (proposed method, Qsp = 1 mL/h) and periodic on–off flow rate (previous method, on–off period = 240 s, Qsp = 1 mL/h). Both methods had the same kinds of test blood and microfluidic device. With regard to the previous method, to probe temporal variations in RBC aggregation and image intensity was obtained in the main channel (Imc). Furthermore, to monitor temporal variations in infusion flow rate, blood velocity was obtained within the main channel (Umc). As shown in Figure A2A (Appendix A), variations in Imc and Umc were acquired with an elapse of time. According to the left-side panel, the Imc increased gradually at every turn-off period. The variation decreased gradually with an elapse of period. The Umc tended to decrease substantially for two consecutive periods. After then, its peak remained at a plateau for every turn-on period. The right-side panel showed the definition of AI (AI = SA/[SA + SB]). Herein, SA and SB were obtained by analyzing temporal variations in Imc for a turn-off period of 120 s. Figure A2B (Appendix A) shows temporal variations in Imc, Itc, and Umc for the suggested method. As shown in Figure A2C (Appendix A), AI of the previous method was represented as mean ± standard deviation. The repetitive number was set to n = 3. The corresponding AI at a specific time was obtained as AI = 0.32 ± 0.02 (t = 146 s), AI = 0.24 ± 0.04 (t = 386 s), AI = 0.15 ± 0.01 (t = 626 s), AI = 0.11 ± 0.01 (t = 866 s), and AI = 0.10 ± 0.02 (t = 1106). As shown in Figure A2D (Appendix A), variations in AI obtained by the proposed method were obtained over time. Herein, the repetitive number set to n = 2 (n1, n2). The AI obtained by the proposed method gave continuously varying values rather than discrete value. Furthermore, both methods gave a comparable variation in the range of AI.
From the experimental investigation, the high concentration of dextran solution increased AI considerably. The AI was greater at low hematocrit than at high hematocrit. Furthermore, continuous RBC settlement in a driving syringe caused AI to peak initially and then decline over time.

3.5. Contribution of Pulsatile Infusion Flow Pattern to Time-Lapse AI

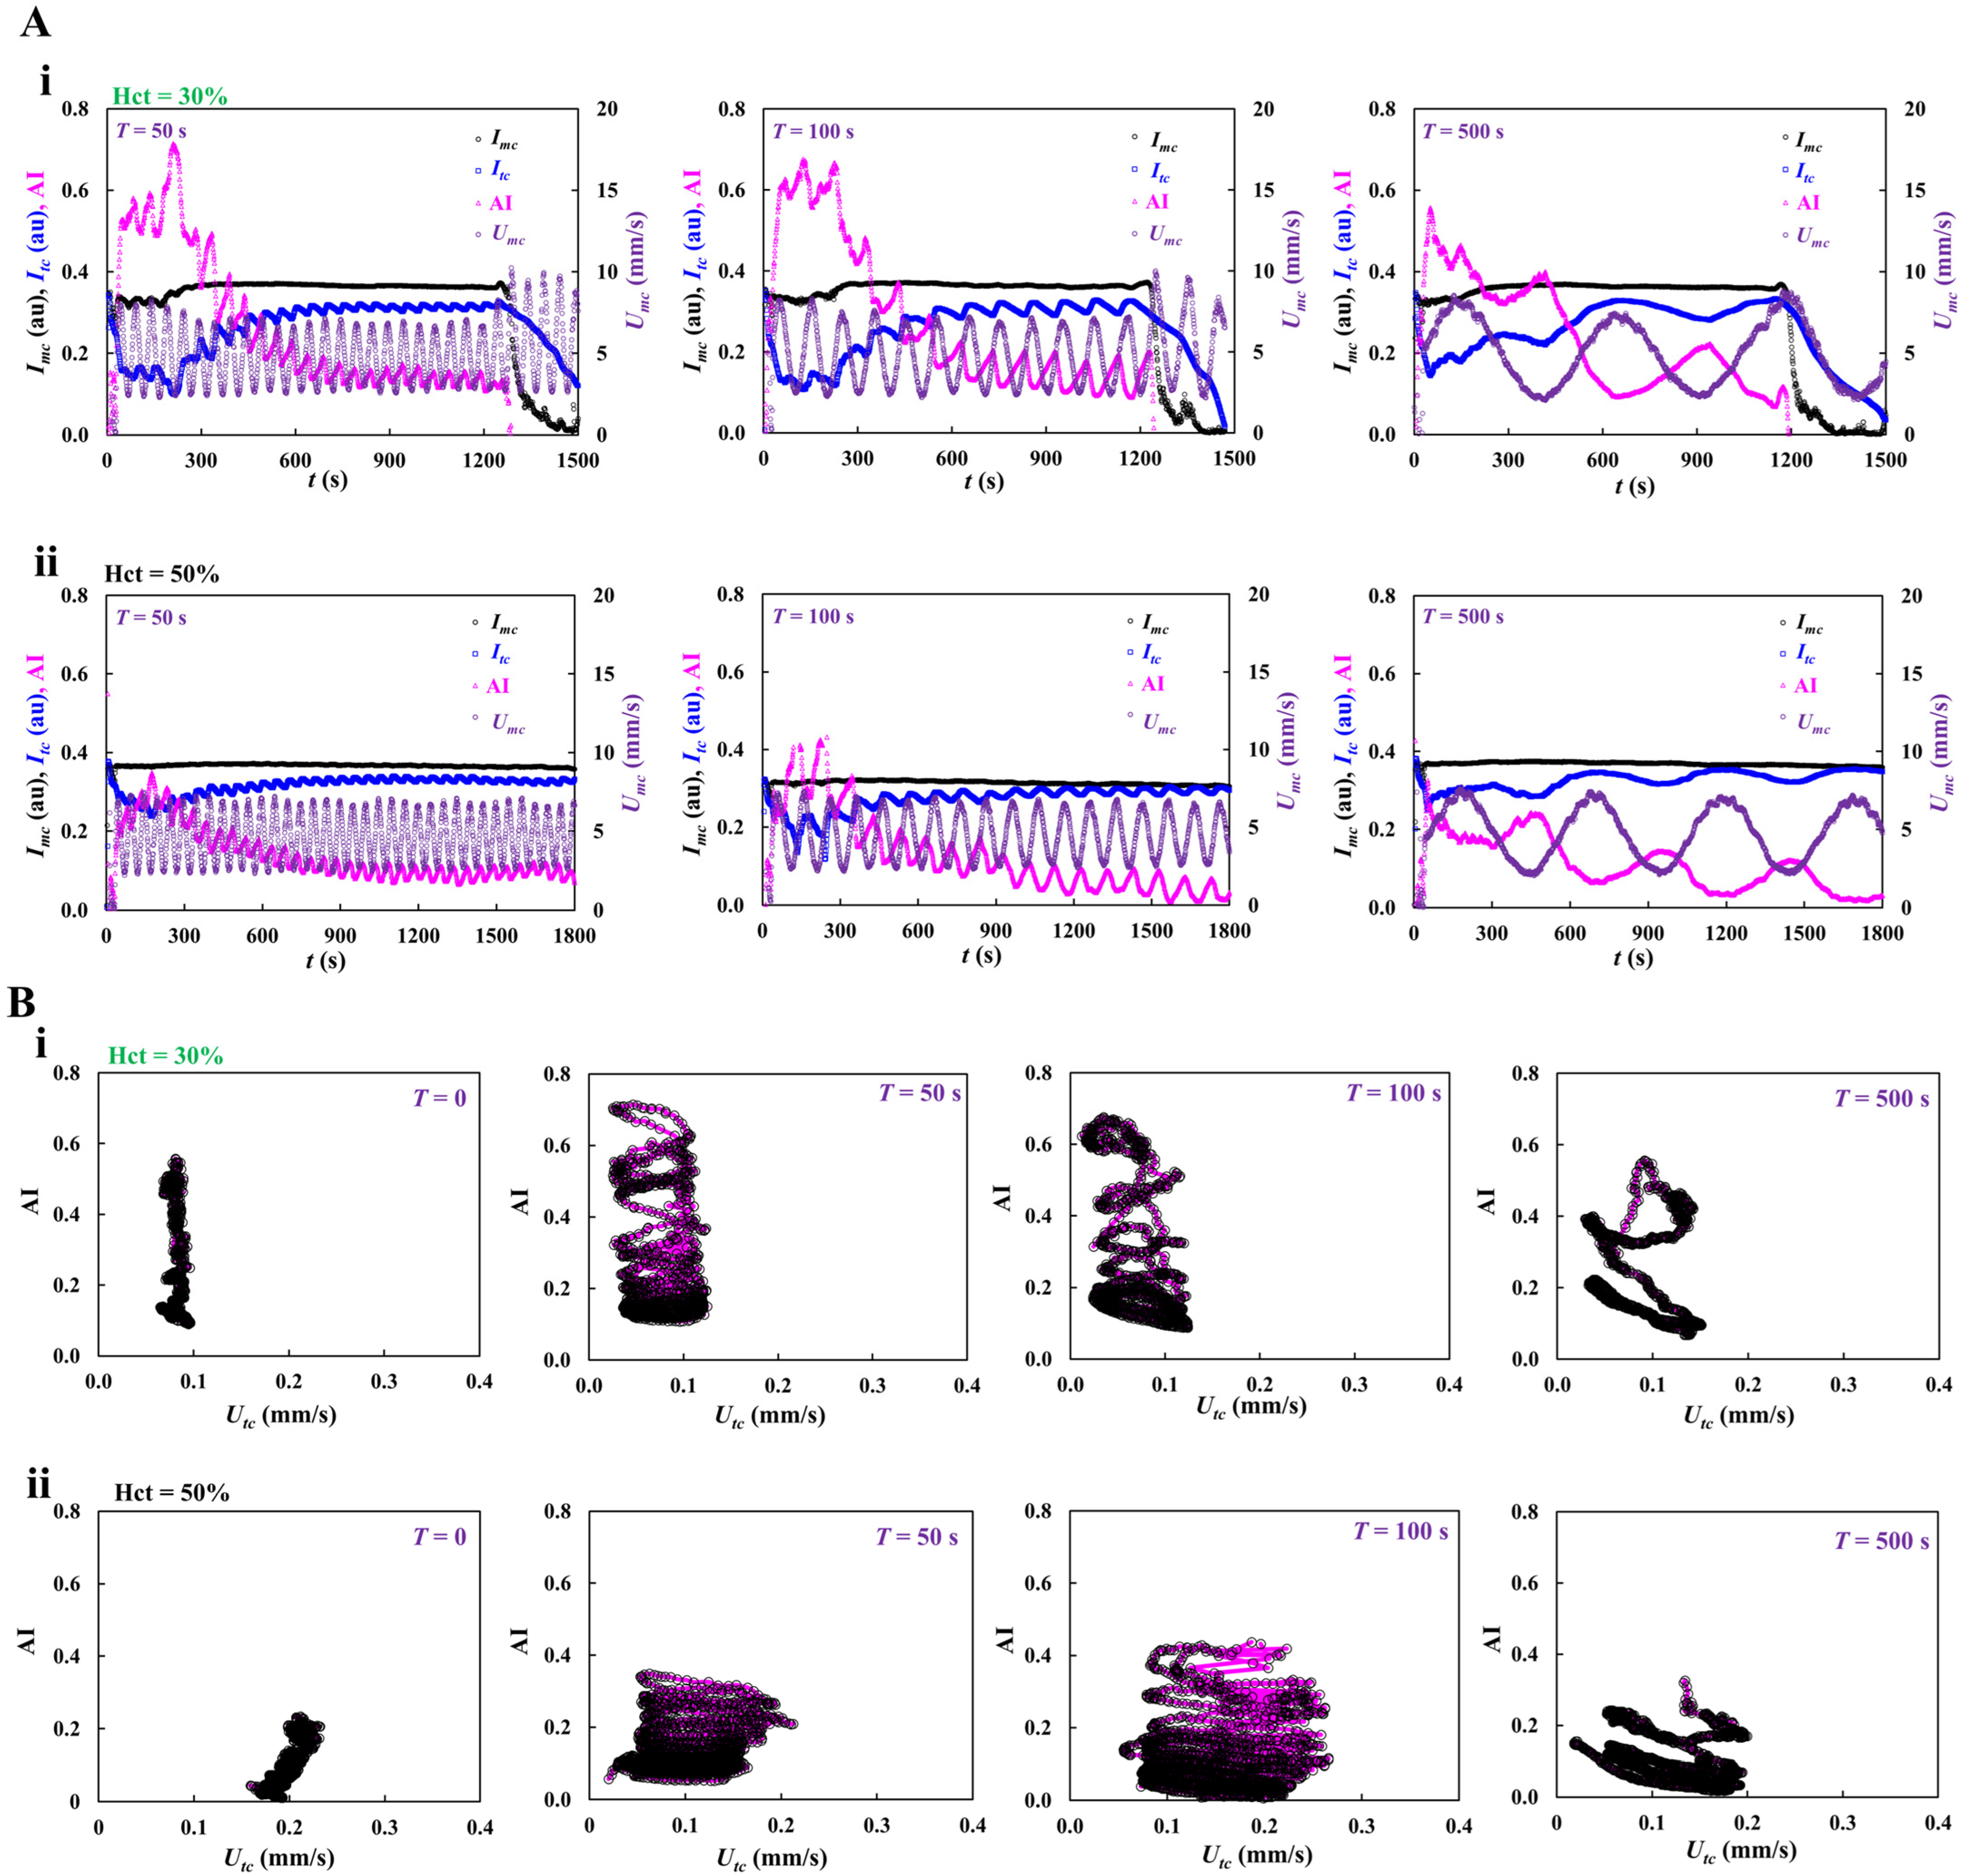
Up to now, the RBC aggregation index (AI) was measured at constant infusion flow rate, even without interruption of blood flow. At the last demonstration, it was necessary to probe time-lapse AI at a pulsatile infusion flow rate. That is, the infusion flow rate was set to Qsp (t) = 1 + 0.5 sin (2πt/T) mL/h. T represented the period ranged from 50 s to 500 s. Test blood (Hct = 30%, and 50%) was prepared by mixing normal RBCs into dextran solution (Cdex = 20 mg/mL).
As shown in Figure 7A(i,ii), temporal variations in Imc, Itc, AI, and Umc were acquired with respect to T = 50, 100, and 500 s, and Hct = 30% and 50%. According to the results, at a low hematocrit of 30%, the AI showed similar temporal pattern at T = 50 or 100 s. However, the maximum of AI decreased significantly at T = 500 s. It was inferred that continuous RBC sedimentation in a driving syringe caused AI to decline over time. At a high hematocrit of 50%, the variation in AI showed a similar temporal pattern when compared with 30% hematocrit. The AI decreased significantly when hematocrit set from 30% to 50%.
As the AI was obtained in the test channel, as shown in Figure 7B(i,ii), to find out correlation between the RBC aggregation index (AI) and blood velocity in the test channel (Utc), AI and Utc were represented using a X-Y scatter plot (i.e., X-axis: Utc, Y-axis: AI). From the results, the AI varied depending on period (T) significantly. The variation range of AI decreased during a longer period. High hematocrit contributed to decreasing variations in AI considerably.
From the experimental investigation, the period of pulsatile infusion flow rate had a strong influence on time-lapse AI. Due to continuous RBC sedimentation in a driving syringe, AI was declined continuously over time. High hematocrit caused a decrease in time-lapse AI when compared with low hematocrit. In conclusion, the present method can be capable of measuring time-lapse AI consistently, without interrupting infusion flow. Furthermore, it was then possible to probe the effect of pulsatile flow pattern on time-lapse AI. As a limitation of this study, the present method was demonstrated using a driving syringe pump, where continuous RBC sedimentation occurred continuously. It will be necessary to probe time-lapse AI again, even without RBC sedimentation in a driving syringe, and at the physiological temperature of 37 °C. In addition, as hematocrit had a strong influence on time-lapse AI, it will be necessary to monitor hematocrit [3,5,7,8,50,67,68] or an equivalent parameter (i.e., pressure or viscosity). In the near future, a newly updated device will be applied to quantify time-lapse AI and Hct of blood circulated within a closed fluidic circuit.

4. Conclusions

In this study, a novel method was demonstrated to assess RBC aggregation in continuously varying blood flow rate, even without the interruption of infusion blood flow. To achieve the objective, a microfluidic chip was designed to split the flow into two branches—low flow rate and high flow rate. Then, RBC aggregation was observed in the low flow-rate channel but was dispersed fully in high flow-rate channel. Using a syringe pump, blood was infused into a microfluidic chip in a continuous fashion. The RBC aggregation index (AI) was newly defined and calculated from time-lapse blood imaging intensity within each channel. First, from fluidic circuit analysis and experimental results, the optimal infusion flow rate for the effective measurement of AI was determined as Qsp = 0.5~2 mL/h. Evaluating the fluidic resistance or velocity ratios of the two channels revealed a normalized difference of 6~36% between fluidic circuit analysis and experimental measurements. Second, the AI was higher at Hct = 30% than at Hct = 50%. Using non-linear regression analysis (AI = a1 exp [−t/λ1] + a2 exp [−t/λ2]), the summed amplitude (a1 + a2) varied markedly with respect to Hct, whereas time constant (λ1) did not exhibit substantial difference with respect to Hct. Third, high concentration of dextran solution increased AI considerably. Furthermore, continuous RBC settlement in a driving syringe caused AI to peak initially and then decline over time. At last, the period of pulsatile infusion flow rate had a strong influence on time-lapse AI. In conclusion, the present method can be capable of measuring time-lapse AI consistently, without interrupting infusion flow.

Funding

This study was supported by a research fund from the Chosun University in 2025.

Institutional Review Board Statement

The research was conducted under the Declaration of Helsinki and was approved by Chosun University’s Ethics Committee (ref. 2-1041055-AB-N-01-2021-80).

Informed Consent Statement

Not applicable.

Data Availability Statement

The original contributions presented in this study are included in the article. Further inquiries can be directed to the corresponding author.

Acknowledgments

During the preparation of this manuscript, the author used ChatGPT (Ver. 5) for the purposes of generating text. The author has reviewed and edited the output and takes full responsibility for the content of this publication.

Conflicts of Interest

The author declares no conflicts of interest.

Appendix A

Figure A1. Variation in microscopic image intensity (Itc) captured within a test channel with respect to objective lens magnification. Herein, test blood (Hct = 30%) was prepared by mixing normal RBCs into dextran solution (20 mg/mL). Flow rate set to Qsp = 1 mL/h. (A) Microscopic image of blood flow at a specific time (t = 0, 240, and 550 s) with respect to objective lens magnification (i.e., 4×, 10×, and 20×). (B) Temporal variations in Itc with respect to objective lens magnification.
Applsci 15 11481 g0a1
Figure A2. Quantitative comparison of previous method and suggested method. Herein, test blood (Hct = 30%) was prepared by mixing normal RBCs into dextran solution (20 mg/mL). Previous method turned on and off Qsp = 1 mL/h at an interval of 120 s. The suggested method was set to constant flow rate of Qsp = 1 mL/h. (A) Temporal variations in Imc and Umc for the previous method. Right-side panel gave definition of RBC aggregation index as AI = SA/(SA + SB). (B) Temporal variations in Imc, Itc, and Umc for the suggested method. (C) Temporal variations in AI for the previous method. (D) Temporal variations in AI for the suggested method.
Applsci 15 11481 g0a2

References

  1. Moreno, N.; Korneev, K.; Semenov, A.; Topuz, A.; John, T.; Lettinga, M.P.; Ellero, M.; Wagner, C.; Fedosov, D.A. Aggregation and disaggregation of red blood cells: Depletion versus bridging. Biophys. J. 2025, 124, 1285–1297. [Google Scholar] [CrossRef]
  2. Deng, Y.; Papageorgiou, D.P.; Li, X.; Perakakis, N.; Mantzoros, C.S.; Dao, M.; Karniadakis, G.E. Quantifying fibrinogen-dependent aggregation of red blood cells in type 2 diabetes mellitus. Biophys. J. 2020, 119, 900–912. [Google Scholar] [CrossRef]
  3. Barath, B.; Somogyi, V.; Tanczos, B.; Varga, A.; Bereczky, Z.; Nemeth, N.; Deak, A. Examination of the relation between red blood cell aggregation and hematocrit in human and various experimental animals. Clin. Hemorheol. Microcirc. 2021, 78, 187–198. [Google Scholar] [CrossRef]
  4. Baskurt, O.K.; Farley, R.A.; Meiselman, H.J. Erythrocyte aggregation tendency and cellular properties in horse, human, and rat: A comparative study. Am. J. Physiol. Heart Circ. Physiol. 1997, 273, H2604–H2612. [Google Scholar] [CrossRef]
  5. Yalcin, O.; Aydin, F.; Ulker, P.; Uyuklu, M.; Gungor, F.; Armstrong, J.K.; Meiselman, H.J.; Baskurt, O.K. Effects of red blood cell aggregation on myocardial hematocrit gradient using two approaches to increase aggregation. Am. J. Physiol. Heart Circ. Physiol. 2006, 290, H765–H771. [Google Scholar] [CrossRef]
  6. Higuchi, M.; Watanabe, N. A rapid and accurate method for estimating the erythrocyte sedimentation rate using a hematocrit-corrected optical aggregation index. PLoS ONE 2022, 17, e0270977. [Google Scholar] [CrossRef] [PubMed]
  7. Xu, X.; Yu, L.; Chen, Z. Effect of erythrocyte aggregation on hematocrit measurement using spectral-domain optical coherence tomography. IEEE Trans. Biomed. Eng. 2008, 55, 2753–2758. [Google Scholar] [CrossRef]
  8. Daousani, C.; Kostić, N.; Malenović, A.; Rmandić, M.; Dotsikas, Y. On the Use of Image Analysis for Hematocrit Evaluation in Dried Blood Spots. Appl. Sci. 2024, 14, 9860. [Google Scholar] [CrossRef]
  9. Melepattu, M.P.; Maitrejean, G.; Wagner, C.; Podgorski, T. Influence of erythrocyte density on aggregability as a marker of cell age: Dissociation dynamics in extensional flow. J. Biomech. 2025, 183, 112603. [Google Scholar] [CrossRef]
  10. Maurer, F.; John, T.; Makhro, A.; Bogdanova, A.; Minetti, G.; Wagner, C.; Kaestner, L. Continuous percoll gradient centrifugation of erythrocytes-explanation of cellular bands and compromised age separation. Cells 2022, 11, 1296. [Google Scholar] [CrossRef] [PubMed]
  11. Ermolinskiy, P.; Lugovtsov, A.; Yaya, F.; Lee, K.; Kaestner, L.; Wagner, C.; Priezzhev, A. Effect of red clood cell aging In vivo on their aggregation properties in vitro: Measurements with laser tweezers. Appl. Sci. 2020, 10, 7581. [Google Scholar] [CrossRef]
  12. Zhao, Y.; Brandon-Coatham, M.; Yazdanbakhsh, M.; Mykhailova, O.; William, N.; Osmani, R.; Kanias, T.; Acker, J.P. Cold storage surpasses the impact of biological age and donor characteristics on red blood cell morphology classified by deep machine learning. Sci. Rep. 2025, 15, 7735. [Google Scholar] [CrossRef] [PubMed]
  13. Matteoli, P.; Nicoud, F.; Mendez, S. Impact of the membrane viscosity on the tank-treading behavior of red blood cells. Phys. Rev. Fluids 2021, 6, 043602. [Google Scholar] [CrossRef]
  14. Gürbüz, A.; Pak, O.S.; Taylor, M.; Sivaselvan, M.V.; Sachs, F. Effects of membrane viscoelasticity on the red blood cell dynamics in a microcapillary. Biophys. J. 2023, 122, 2230–2241. [Google Scholar] [CrossRef] [PubMed]
  15. Zhang, J.; Johnson, P.C.; Popel, A.S. Red blood cell aggregation and dissociation in shear flows simulated by lattice boltzmann method. J. Biomech. 2008, 41, 47–55. [Google Scholar] [CrossRef]
  16. Lazari, D.; Leal, J.K.F.; Brock, R.; Bosman, G. The relationship between aggregation and deformability of red blood cells in health and disease. Front. Physiol. 2020, 11, 288. [Google Scholar] [CrossRef]
  17. Weber-Fishkin, S.; Seidner, H.S.; Gunter, G.; Frame, M.D. Erythrocyte aggregation in sudden flow arrest is linked to hyperthermia, hypoxemia, and band 3 availability. J. Thromb. Haemost. 2022, 20, 2284–2292. [Google Scholar] [CrossRef]
  18. Çolak, E.; Ekici, Ö.; Erdener, Ş.E. In silico investigation of the RBC velocity fluctuations in ex vivo capillaries. Appl. Sci. 2025, 15, 7796. [Google Scholar] [CrossRef]
  19. Reinhart, W.H.; Piety, N.Z.; Shevkoplyas, S.S. Influence of red blood cell aggregation on perfusion of an artificial microvascular network. Microcirculation 2017, 24, e12317. [Google Scholar] [CrossRef]
  20. Porro, B.; Conte, E.; Zaninoni, A.; Bianchi, P.; Veglia, F.; Barbieri, S.; Fiorelli, S.; Eligini, S.; Di Minno, A.; Mushtaq, S.; et al. Red blood cell morphodynamics: A new potential marker in high-risk patients. Front. Physiol. 2020, 11, 603633. [Google Scholar] [CrossRef]
  21. Peshkova, A.D.; Rednikova, E.K.; Khismatullin, R.R.; Kim, O.V.; Muzykantov, V.R.; Purohit, P.K.; Litvinov, R.I.; Weisel, J.W. Red blood cell aggregation within a blood clot causes platelet-independent clot shrinkage. Blood Adv. 2025, 9, 3418–3428. [Google Scholar] [CrossRef] [PubMed]
  22. Hadengue, A.L.; Del-Pino, M.; Simon, A.; Levenson, J. Erythrocyte disaggregation shear stress, sialic acid, and cell aging in humans. Hypertension 1998, 32, 324–330. [Google Scholar] [CrossRef]
  23. Kiełtyka-Słowik, A.; Teległów, A.; Gradek, J. Rheological and morphological properties of blood vs. vibration exercises (Smovey®)—A preliminary study on elderly women. Appl. Sci. 2025, 15, 5058. [Google Scholar] [CrossRef]
  24. McCarthy, R.P.; LaDisa, J.F., Jr. Influence of boundary conditions and blood rheology on indices of wall shear stress from IVUS-based patient-specific stented coronary artery simulations. Sci. Rep. 2025, 15, 15868. [Google Scholar] [CrossRef]
  25. Wang, Y.; Yang, P.; Yan, Z.; Liu, Z.; Ma, Q.; Zhang, Z.; Wang, Y.; Su, Y. The relationship between erythrocytes and diabetes mellitus. J. Diabetes Res. 2021, 2021, 6656062. [Google Scholar] [CrossRef]
  26. Chung, S.M.; Oh, J.H.; Moon, J.S.; Kim, Y.K.; Yoon, J.S.; Won, K.C.; Lee, H.W. Critical shear stress is associated with diabetic kidney disease in patients with type 2 diabetes. Sci. Rep. 2018, 8, 908. [Google Scholar] [CrossRef]
  27. Park, K.H.; Kim, U.; Choi, K.U.; Nam, J.H.; Lee, J.H.; Lee, C.H.; Son, J.W.; Park, J.S.; Shin, D.G.; Won, K.C.; et al. Hemorheologic alterations in patients with type 2 diabetes mellitus presented with an acute myocardial infarction. Diabetes Metab. J. 2018, 42, 155–163. [Google Scholar] [CrossRef]
  28. Lominadze, D.; Joshua, I.G.; Schuschke, D.A. Increased erythrocyte aggregation in spontaneously hypertensive rats. Am. J. Hypertens. 1998, 11, 784–789. [Google Scholar] [CrossRef]
  29. Whitesides, G.M.; Ostuni, E.; Takayama, S.; Jiang, X.; Ingber, D.E. Soft lithography in biology and biochemistry. Annu. Rev. Biomed. Eng. 2001, 3, 335–373. [Google Scholar] [CrossRef] [PubMed]
  30. Del, F. Giudice A Review of Microfluidic Devices for Rheological Characterisation. Micromachines 2022, 13, 167. [Google Scholar]
  31. Antonova, N.; Khristov, K. Microrheological and Microfluidic Approaches for Evaluation of the Mechanical Properties of Blood Cells. Appl. Sci. 2025, 15, 8291. [Google Scholar] [CrossRef]
  32. Kim, H.; Zhbanov, A.; Yang, S. Microfluidic systems for blood and blood cell characterization. Biosensors 2022, 13, 13. [Google Scholar] [CrossRef]
  33. Trejo-Soto, C.; Lazaro, G.R.; Pagonabarraga, I.; Hernandez-Machado, A. Microfluidics Approach to the Mechanical Properties of Red Blood Cell Membrane and Their Effect on Blood Rheology. Membranes 2022, 12, 217. [Google Scholar] [CrossRef]
  34. Grigorev, G.V.; Lebedev, A.V.; Wang, X.; Qian, X.; Maksimov, G.V.; Lin, L. Advances in Microfluidics for Single Red Blood Cell Analysis. Biosensors 2023, 13, 117. [Google Scholar] [CrossRef] [PubMed]
  35. Hentschel, G.; Doll-Nikutta, K.; Mueller, M.; Berg, P.; Glasmacher, B. Development and characterization of a Dextran/CaCl(2)-based blood-mimicking fluid: A comparative study of rheological and mechanical properties in artificial erythrocyte suspensions. Soft Matter 2025, 21, 3101–3116. [Google Scholar] [CrossRef] [PubMed]
  36. Kapadia, W.; Giri, N.V.; Qin, N.; Zhao, P.; Phan, C.-M.; Haines, L.; Jones, L.; Ren, C.L. A novel microfluidic viscometer for measuring viscosity of ultrasmall volumes of Newtonian and non-Newtonian liquids. J. Micromech. Microeng. 2025, 35, 055005. [Google Scholar] [CrossRef]
  37. Kang, Y.J. Simultaneous viscosity measurement of suspended blood and plasma separated by an ultrasonic transducer. Appl. Sci. 2023, 13, 3574. [Google Scholar] [CrossRef]
  38. Kang, Y.J. A microfluidic-based blood viscometer. Phys. Fluids 2025, 37, 091904. [Google Scholar] [CrossRef]
  39. Du, J.; Lee, S.; Sinha, S.; Solberg, F.S.; Ho, D.L.L.; Sampson, J.P.; Wang, Q.; Tam, T.; Skylar-Scott, M.A. A visual, in-expensive, and wireless capillary rheometer for characterizing wholly-cellular bioinks. Small 2024, 20, e2304778. [Google Scholar] [CrossRef]
  40. Liang, M.; Ming, D.; Zhong, J.; Shannon, C.S.; Rojas-Carabali, W.; Agrawal, K.; Ai, Y.; Agrawal, R. Pathophysiological associations and measurement techniques of red blood cell deformability. Biosensors 2025, 15, 566. [Google Scholar] [CrossRef]
  41. Yang, T.; Bragheri, F.; Minzioni, P. A comprehensive review of optical stretcher for cell mechanical characterization at single-cell level. Micromachines 2016, 7, 90. [Google Scholar] [CrossRef]
  42. Guo, Q.; Duffy, S.P.; Matthews, K.; Santoso, A.T.; Scott, M.D.; Ma, H. Microfluidic analysis of red blood cell deformability. J. Biomech. 2014, 47, 1767–1776. [Google Scholar] [CrossRef]
  43. Stathoulopoulos, A.; Passos, A.; Kaliviotis, E.; Balabani, S. Partitioning of dense RBC suspensions in single microfluidic bifurcations: Role of cell deformability and bifurcation angle. Sci. Rep. 2024, 14, 535. [Google Scholar] [CrossRef] [PubMed]
  44. Xu, T.; Lizarralde-Iragorri, M.A.; Roman, J.; Ghasemi, R.; Lefevre, J.P.; Martincic, E.; Brousse, V.; Francais, O.; El Nemer, W.; Le Pioufle, B. Characterization of red blood cell microcirculatory parameters using a bioimpedance microfluidic device. Sci. Rep. 2020, 10, 9869. [Google Scholar] [CrossRef]
  45. Jiang, H.; Li, X.; Liu, Z.; Luo, S.; Huang, J.; Chen, C.; Chen, R.; Li, F. A Microfluidic Approach for Assessing the Rheological Properties of Healthy Versus Thalassemic Red Blood Cells. Micromachines 2025, 16, 957. [Google Scholar] [CrossRef] [PubMed]
  46. Liu, Y.; Rao, H.; Zhang, H.; Wang, M.; Wu, Y.; Wu, Y.; Han, C.; Yan, C.; Zhang, L.; Chen, W.; et al. Efficient characterization of red blood cell rheological properties using a multichannel microfluidic chip and optical tweezers. Mater. Today Adv. 2024, 24, 100545. [Google Scholar] [CrossRef]
  47. Isiksacan, Z.; D’Alessandro, A.; Wolf, S.M.; McKenna, D.H.; Tessier, S.N.; Kucukal, E.; Gokaltun, A.A.; William, N.; Sandlin, R.D.; Bischof, J.; et al. Assessment of stored red blood cells through lab-on-a-chip technologies for precision transfusion medicine. Proc. Natl. Acad. Sci. USA 2023, 120, e2115616120. [Google Scholar] [CrossRef]
  48. Kang, Y.J. Microfluidic chip for quantitatively assessing hemorheological parameters. Micromachines 2025, 16, 567. [Google Scholar] [CrossRef]
  49. Namgung, B.; Lee, T.; Tan, J.K.S.; Poh, D.K.H.; Park, S.; Chng, K.Z.; Agrawal, R.; Park, S.Y.; Leo, H.L.; Kim, S. Vibration motor-integrated low-cost, miniaturized system for rapid quantification of red blood cell aggregation. Lab Chip 2020, 20, 3930–3937. [Google Scholar] [CrossRef]
  50. Kim, B.J.; Lee, Y.S.; Zhbanov, A.; Yang, S. A physiometer for simultaneous measurement of whole blood viscosity and its determinants: Hematocrit and red blood cell deformability. Analyst 2019, 144, 3144–3157. [Google Scholar] [CrossRef]
  51. Passos, A.; Louka, M.; Vryonidis, C.; Inglezakis, A.; Loizou, C.; Nikiphorou, E.; Psarelis, S.; Kaliviotis, E. Red blood cell sedimentation rate measurements in a high aspect ratio microchannel. Clin. Hemorheol. Microcirc. 2022, 82, 313–322. [Google Scholar] [CrossRef]
  52. Zhbanov, A.; Yang, S. Effects of aggregation on blood sedimentation and conductivity. PLoS ONE 2015, 10, e0129337. [Google Scholar] [CrossRef]
  53. Melepattu, M.P.; Maîtrejean, G.; Podgorski, T. Dissociation of red blood cell aggregates in extensional flow. Phys. Rev. Fluids 2024, 9, L071101. [Google Scholar] [CrossRef]
  54. Isiksacan, Z.; Erel, O.; Elbuken, C. A portable microfluidic system for rapid measurement of the erythrocyte sedimentation rate. Lab Chip 2016, 16, 4682–4690. [Google Scholar] [CrossRef] [PubMed]
  55. Shin, S.; Yang, Y.; Suh, J.S. Measurement of erythrocyte aggregation in a microchip stirring system by light transmission. Clin. Hemorheol. Microcirc. 2009, 41, 197–207. [Google Scholar] [CrossRef]
  56. Kang, Y.J. Biomechanical investigation of red cell sedimentation using blood shear stress and blood flow image in a capillary chip. Micromachines 2023, 14, 1594. [Google Scholar] [CrossRef]
  57. Mehri, R.; Mavriplis, C.; Fenech, M. Red blood cell aggregates and their effect on non-Newtonian blood viscosity at low hematocrit in a two-fluid low shear rate microfluidic system. PLoS ONE 2018, 13, e0199911. [Google Scholar] [CrossRef]
  58. Sebastian, B.; Dittrich, P.S. Microfluidics to mimic bood flow in health and disease. Annu. Rev. Fluid Mech. 2018, 50, 483–504. [Google Scholar] [CrossRef]
  59. Isiksacan, Z.; Serhatlioglu, M.; Elbuken, C. In vitro analysis of multiple blood flow determinants using red blood cell dynamics under oscillatory flow. Anayst 2020, 145, 5996–6005. [Google Scholar] [CrossRef] [PubMed]
  60. Lezzar, D.L.; Lam, F.W.; Huerta, R.; Mukhamedshin, A.; Lu, M.; Shevkoplyas, S.S. A high-throughput microfluidic device based on controlled incremental filtration to enable centrifugation-free, low extracorporeal volume leukapheresis. Sci. Rep. 2022, 12, 13798. [Google Scholar] [CrossRef]
  61. Nam, K.H.; Yeom, E.; Lee, S.J. Extracorporeal bypass model of blood circulation for the study of microvascular hemodynamics. Microvasc. Res. 2012, 83, 372–375. [Google Scholar] [CrossRef] [PubMed]
  62. Thielicke, W.; Stamhuis, E.J. PIVlab—Towards user-friendly, affordable and accurate digital particle image velocimetry in MATLAB. J. Open Res. Softw. 2014, 2, e30. [Google Scholar] [CrossRef]
  63. Kang, Y.J. Blood viscometer using capillary blood flow under disposable compliance pump. Int. J. Mech. Sci. 2024, 277, 109456. [Google Scholar] [CrossRef]
  64. Kang, Y.J. Red blood cell sedimentation index using shear stress of blood flow in microfluidic channel. Biosensors 2022, 12, 547. [Google Scholar] [CrossRef]
  65. Schmid-Schonbein, H.; Gaehtgens, P.; Hirsch, H. On the shear rate dependence of red cell aggregation in vitro. J. Clin. Investig. 1968, 47, 1447–1454. [Google Scholar] [CrossRef]
  66. Oh, K.W.; Lee, K.; Ahn, B.; Furlani, E.P. Design of pressure-driven microfluidic networks using electric circuit analogy. Lab Chip 2012, 12, 515–545. [Google Scholar] [CrossRef]
  67. Riera-Llobet, C.; Méndez-Mora, L.; Cabello-Fusarés, M.; Hernández-Machado, A. Altered blood rheology in multiwidth microchannels: Hematocrit and tonicity variation. Phys. Fluids 2023, 35, 082017. [Google Scholar] [CrossRef]
  68. Li, G.; Ye, T.; Yang, B.; Wang, S.; Li, X. Temporal-spatial heterogeneity of hematocrit in microvascular networks. Phys. Fluids 2023, 35, 021906. [Google Scholar] [CrossRef]
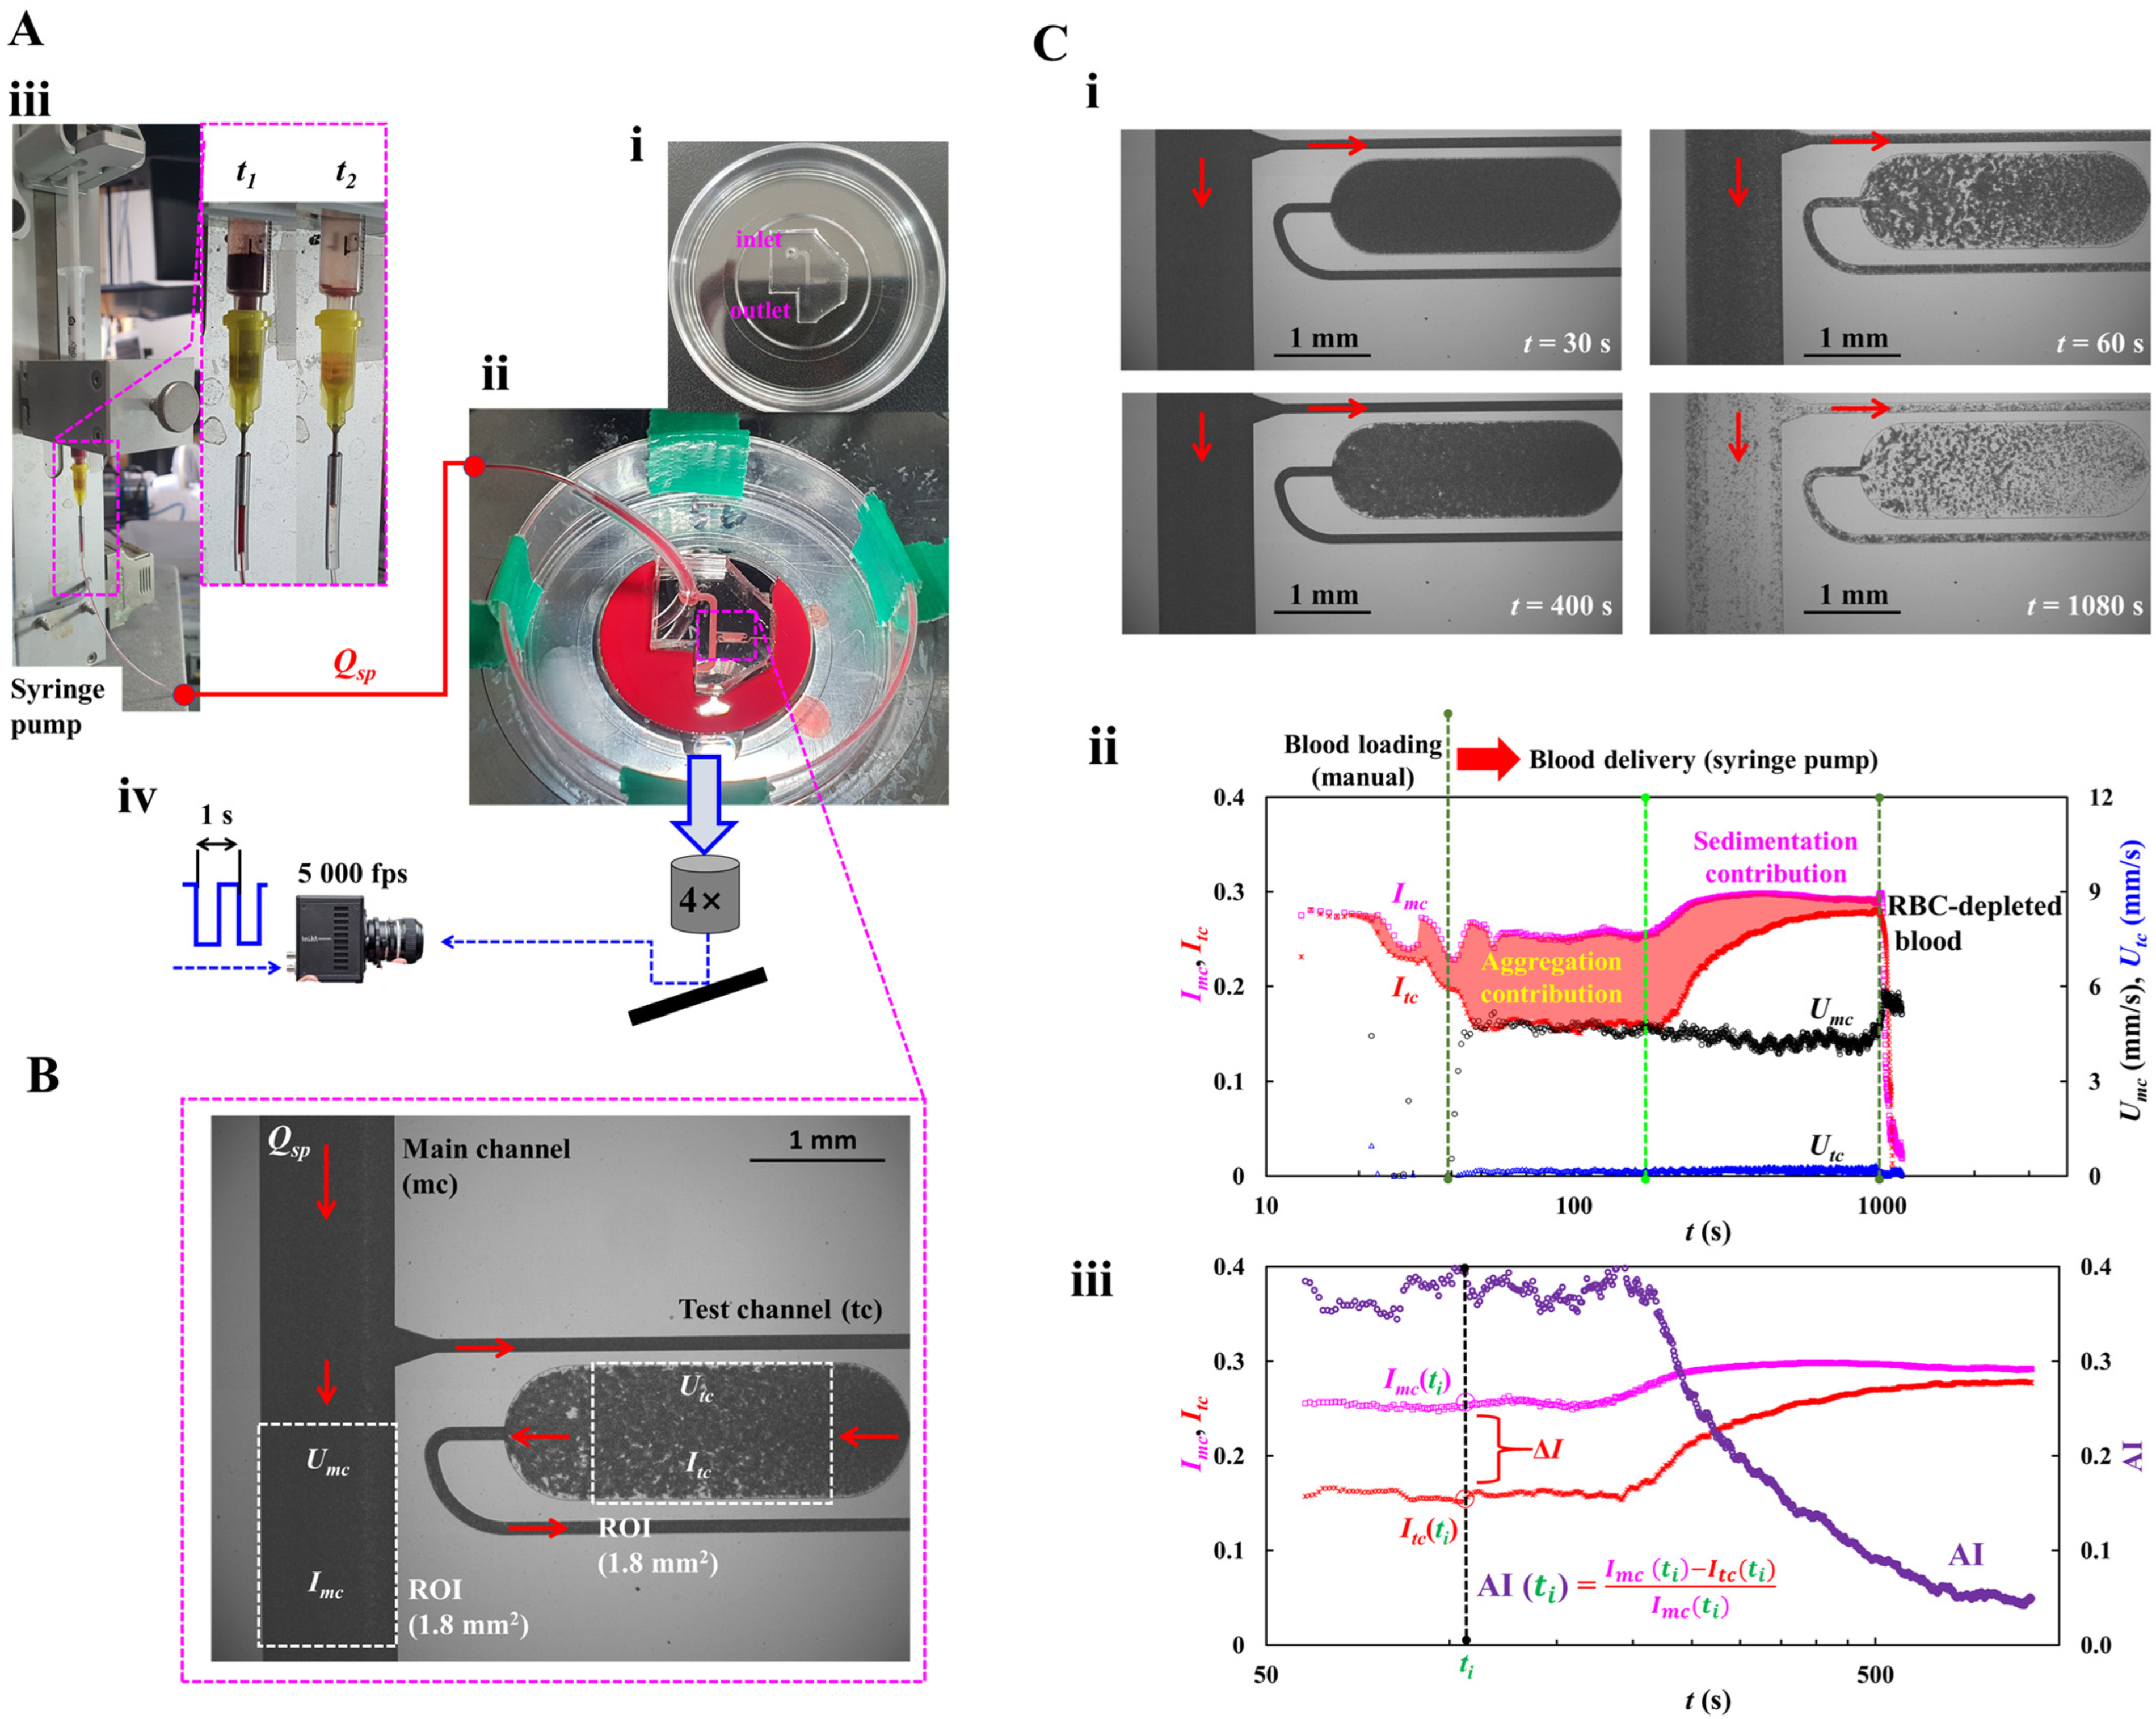
Figure 1. A proposed method for quantifying red blood cell (RBC) aggregation index (AI) under continuous blood infusion. (A) Experimental setup for loading blood, inducing red blood cell aggregation, and quantifying microscopic imaging. (i) A PDMS microfluidic channel consisting one inlet, one outlet, a main channel (mc), and a test channel (tc). (ii) Test blood was loaded through a Tygon tubing connected to an inlet port. Test blood was infused through an inlet of microfluidic channels, and discharged from the outlet. (iii) A driving syringe was installed into a syringe pump which aligned vertically against gravitational direction. The syringe pump was set to flow rate (Qsp). Right-side panel showed RBC sedimentation in a driving syringe with respect to delivery time (t1, t2). (iv) Microscopic imaging acquisition system, including, a microscope (objective lens = 4×), a high-speed camera (5000 fps), and function generator (period = 1 s). Consecutive microscopic images were sequentially captured at an interval of 1 s. (B) Quantification of blood velocity and image intensity. Based on specific region-of-interest (ROI = 1.8 mm2) within a main channel and a test channel, a micro particle image velocimetry (PIV) was used to obtain blood velocity (Umc, Utc). Image intensity within the specific ROI (Imc, Itc) was also acquired through an image processing technique. (C) Quantification procedure of RBC aggregation index (AI). Herein, test blood (Hct = 30%) was prepared by mixing normal RBCs into dextran solution (20 mg/mL). Infusion flow rate was set to Qsp = 1 mL/h (i) Microscopic images captured at a specific time (t) (t = 30, 60, 400, and 1080 s). (ii) Temporal variations in image intensity (Imc, Itc) and blood velocity (Umc, Utc). Three vertical dashed lines were used to compart manual blood-loading, aggregation contribution, and sedimentation contribution, respectively. (iii) Temporal variations in Imc, Itc, and AI.
Applsci 15 11481 g001
Figure 2. Mathematical representation and its validation of a proposed microfluidic system. (A) Shear rate calculation using a fluidic circuit model. (i) Mathematical representation of a proposed microfluidic system. (ii) Shear rate estimation of a main channel, a test channel (i.e., wide-width segment, and narrow width segment), and an inlet tubing with respect to Qsp = 0.1~4 mL/h. (B) Contribution of infusion flow rate to blood velocity as well as image intensity. (i) Quantification of blood velocity and image intensity under infusion flow rate (Qsp). Herein, to prevent RBC sedimentation in a driving syringe, control blood (Hct = 50%) was prepared by mixing normal RBCs into 1× PBS. (ii) Temporal variations in Imc and Itc at the flow rate of Qsp = 1 mL/h. (iii) Variations in <Imc> and <Itc> with respect to Qsp = 0.5~4 mL/h. (iv) Temporal variations in Umc and Utc at the infusion flow rate of Qsp = 1 mL/h. (v) Variations in Umc, Utc, and Umc/Utc with respect to Qsp = 0.5~4 mL/h.
Applsci 15 11481 g002
Figure 3. Contribution of infusion flow rate (Qsp) to RBC aggregation index (AI) as well as blood velocity ratio (Umc/Utc). Herein, test blood (Hct = 50%) was prepared by mixing normal RBCs into dextran solution (20 mg/mL). (A) Temporal variations in image intensity (Imc, Itc) and blood velocity (Umc, Utc) with respect to Qsp = 0.5~4 mL/h. (B) Contribution of infusion flow rate (Qsp) to RBC aggregation index (AI). Left-side panel showed time-lapse RBC aggregation index (AI) with respect to Qsp. Right-side panel represented variations in AImax and <AI> with respect to Qsp. (C) Variations in Umc, Utc, and Umc/Utc with respect to Qsp.
Applsci 15 11481 g003
Figure 4. Quantitative comparison of RBC aggregation index (AI) with respect to syringe installation direction (i.e., horizontal direction, and vertical direction). Herein, test blood (Hct = 50%) was prepared by mixing normal RBCs into dextran solution (20 mg/mL). Flow rate set to Qsp = 0.5 mL/h. (A) Variation in RBC aggregation index (AI) with respect to syringe installation direction. (i) RBC sedimentation in a driving syringe fitted into a horizontal syringe (hs). Right-side panel showed temporal variations in Imc, Itc, and AI. (ii) RBC sedimentation in a driving syringe fitted into a vertical syringe (vs). Right-side panel showed temporal variations in Imc, Itc, and AI. (B) Contribution of syringe installation direction to RBC aggregation index (AI). (i) Temporal variations in AI with respect to syringe installation direction. (ii) Variations in AI with respect to syringe installation direction.
Applsci 15 11481 g004
Figure 5. Contribution of hematocrit to RBC aggregation index (AI). Herein, test blood (Hct = 30%, and 50%) was prepared by adding normal RBCs into dextran solution (20 mg/mL). Infusion flow rate was set to Qsp = 1 mL/h. (A) Contribution of hematocrit to imaging intensity and blood velocity. (i) Temporal variations in Imc, Itc, AI, and Umc at low hematocrit of 30%. (ii) Temporal variations in Imc, Itc, AI, and Umc at high hematocrit of 50%. (iii) Temporal variations in Umc and Utc with respect to Hct = 30% and 50%. (B) Variations in AImax with respect to Hct = 30% and 50%. (C) Quantification of time-lapse AI with a curve-fitting analysis. Left-side panel showed temporal variations in AI with respect to Hct = 30% and 50%. Time-lapse AI was best fitted as AI = a1 exp (−t/λ1) + a2 exp (−t/λ2). Right-side panel depicted variation in the summed amplitude (a1 + a2) and time constant (λ1) with respect to Hct.
Applsci 15 11481 g005
Figure 6. Contributions of dextran concentration (Cdex) and hematocrit (Hct) to time-lapse RBC aggregation index (AI) and blood velocity ratio (Umc/Utc). Herein, infusion flow rate set to Qsp = 1 mL/h. (A) Contribution of dextran solution and hematocrit to time-lapse AI. (i) Temporal variations in Imc, Itc, and AI with respect to Cdex = 5, 10, 15, and 20 mg/mL, at low hematocrit of 30%. (ii) Temporal variations in Imc, Itc, and AI with respect to Cdex, at high hematocrit of 50%. (B) Quantitative analysis of time-lapse AI. (i) Variations in AImax with respect to Cdex and Hct. (ii) Variations in <AI> with respect to Cdex and Hct. (iii) Variations in the summed amplitude (a1 + a2) and time constant (λ1) with respect Cdex and Hct. (C) Quantitative comparison between Umc/Utc and AI with respect to dextran concentration and hematocrit. (i) Temporal variations in Umc/Utc and AI with respect to Cdex = 10, 15, and 20 mg/mL, at low hematocrit of 30%. (ii) Temporal variations in Umc/Utc and AI with respect to Cdex, at high hematocrit of 50%.
Applsci 15 11481 g006
Figure 7. Contribution of pulsatile infusion flow rate to time-lapse AI. Herein, infusion flow rate was set to Qsp (t) = 1 + 0.5 sin (2πt/T) mL/h. T was denoted as period and ranged from 50 s to 500 s. Test blood (Hct = 30%, and 50%) was prepared by mixing normal RBCs into dextran solution (Cdex = 20 mg/mL). (A) Contributions of T to AI with respect to Hct. (i) Temporal variations in Imc, Itc, AI, and Umc with respect to T = 50~500 s, at a low hematocrit of 30%. (ii) Temporal variations in Imc, Itc, AI, and Umc with respect to T, at a high hematocrit of 50%. (B) Effect of blood flow-rate pattern on AI. (i) Correlation between AI and Utc with respect to T = 0, 50, 100, and 500 s, at a low hematocrit of 30%. (ii) Correlation between AI and Utc with respect to T, at a high hematocrit of 50%.
Applsci 15 11481 g007
Disclaimer/Publisher’s Note: The statements, opinions and data contained in all publications are solely those of the individual author(s) and contributor(s) and not of MDPI and/or the editor(s). MDPI and/or the editor(s) disclaim responsibility for any injury to people or property resulting from any ideas, methods, instructions or products referred to in the content.