Abstract
The valorization of waste materials is essential for sustainability, with used cooking oils (UCOs) offering potential for transformation into valuable functional products. The study investigates the oxidative stability of sunflower and olive oils subjected to high temperatures (160–200 °C) and frying on their physico-chemical properties (acidity, peroxide and iodine value, total polar compounds). Significant deterioration occurred above 180 °C, with increased peroxide and polar compounds and reduced iodine values. A technological process for the purification and saponification of UCOs (sunflower, olive, and palm oils) was developed, demonstrating the potential to transform pollutant waste into a valuable and sustainable product—soap. The incorporation of oregano and thyme essential oils (EOs), identified by GC-FID as rich sources of carvacrol, thymol, p-cymene, and limonene, improved the functional properties of the soaps. The antimicrobial activity of soaps largely relates to their alkaline pH, while the incorporation of EOs contributes to additional antimicrobial effects, obtaining zones of inhibition of up to 10.8 mm against Staphylococcus aureus and up to 7.6 mm against Escherichia coli for palm oil. The study highlights a sustainable approach that transforms waste oils into functional soaps with EOs for added antimicrobial benefits.
1. Introduction
Used cooking oils (UCOs) are complex mixtures of degraded lipids and oxidation products that must be properly reprocessed, both at the individual level, in households, and on an industrial scale [1]. These oils have negative environmental impacts, which makes their proper collection and treatment essential [2]. Furthermore, their revalorization brings economic benefits by reducing the costs associated with oil and energy production [3]. Within the food industry, UCOs constitute an environmental concern, yet their efficient management can support sustainability and resource circularity [4]. Effective management of UCOs in the food industry requires well-defined protocols for collection, storage, and transfer to authorized facilities for proper treatment and recycling [5]. Proper management of UCOs not only helps prevent soil and water pollution but can also generate direct economic and reputational benefits for companies [6]. Therefore, the sustainable management of UCOs by food industry operators is an important task for environmental protection and also an opportunity to promote more responsible business practices within the sector [7].
In 2024, the global UCO market was valued at USD 6.90 billion, with a compound annual growth rate (CAGR) of 8.13%. The market’s development is supported by environmental initiatives, technological advancements, and the growing demand for renewable energy sources [8]. The European UCO market has experienced significant growth in recent years, driven by the shift towards renewable energy sources and supportive recycling regulations, reaching an estimated value of approximately USD 5.23 billion [9]. The purpose of Directive 75/439/EEC [10] was to establish common measures at the EU level to protect the environment against the harmful effects of improper waste oil disposal. The directive aimed to ensure the proper collection, treatment, and recovery of such waste, giving priority to the regeneration (recycling) of waste oils over other disposal methods such as incineration. Directive 2008/98/EC [11] (also known as the Waste Framework Directive) repeals and incorporates the provisions of Directive 75/439/EEC, establishing a general legal framework for waste management in the European Union, including for waste oils.
One of the promising avenues for the valorization of UCOs is their use as raw materials in soap production. Different techniques have been developed for converting UCOs into soap, whether in solid or liquid form [12,13], including the cold process, hot process, and rebatching method [14,15,16]. Through the saponification process, triglyceride-based oils—whether fresh or used—can be transformed into soap, although oxidation products and other compounds present in used oils may affect saponification efficiency and the quality of the final product, which serves both hygienic and functional purposes [17]. Furthermore, the incorporation of essential oils (EOs) into these soaps not only enhances fragrance but also confers antimicrobial, antioxidant, and preservative properties, potentially contributing to improved safety and shelf life, depending on EO type, concentration, and interactions with the lipid matrix [18]. EOs are complex mixtures of volatile organic compounds, primarily composed of terpenes, terpenoids, and phenolic compounds, which contribute to their characteristic aroma and bioactive properties [19]. Therefore, the valorization of UCOs through soap production, combined with the addition of bioactive EOs, represents a sustainable approach to create environmentally friendly soaps with enhanced antimicrobial properties, addressing both waste management and public health concerns.
The aim of this study is to investigate the chemical composition and oxidative stability of sunflower, olive, and palm oils under different thermal treatments. In addition, a technological process for the purification (filtration, decantation, chemical treatment with NaCl and H2O2) and saponification of UCOs is proposed, aiming to transform a potentially polluting waste into a valuable, functional, and sustainable product—soap. The study further focuses on the effects of high-temperature frying on oil quality, the incorporation of oregano and thyme EOs, and the resulting impact on soap characteristics such as texture, lathering, and antimicrobial activity.
2. Materials and Methods
2.1. Fresh Oil Samples—Origin and Acquisition
Three oil samples were utilized in this study: one of sunflower oil (brand “Cu Gust”, refined, batch no. 14), one of extra virgin olive oil (origin: Crete, unrefined, batch no. 2), and one of palm oil (brand “Pentru Gătit”, refined, batch no. 021), all commercially sourced from retail outlets in Hunedoara, Romania. The first two samples (sunflower oil and extra virgin olive oil) were subsequently employed in a controlled laboratory experiment designed to simulate typical frying conditions.
2.2. Used Vegetable Oils—Origin and Usage Context
The UCOs were collected from public catering units in Hunedoara, Romania, and from the canteen of the Faculty of Engineering in Hunedoara, as shown in Table 1.

Table 1.
Characterization of UCO samples collected.
For each type of collected oil, a sample of fresh oil, not subjected to thermal treatment, was also obtained.
2.3. Essential Oils
Oregano and thyme EOs were obtained from Esentivia Company, Drâmbar, Alba County, Romania, as commercially available products. The oils were stored in their original packaging, in dark glass bottles, at room temperature to preserve their chemical stability and bioactive properties, until further analysis.
2.4. Laboratory Simulation of Food Mix Frying
Sunflower oil and extra virgin olive oil were evaluated for oxidative stability under controlled thermal conditions. Laboratory frying experiments were performed using 200 mL of oil (either sunflower oil or extra virgin olive oil) in each trial. A standardized food mixture consisting of 20 g of potatoes, 20 g of mushrooms, and 20 g of chicken breast was fried at target temperatures of 160, 170, 180, 190, and 200 °C. The desired temperature was maintained throughout the frying process using a digital constant-temperature oil bath (Shanti Scientific Industries, Mazgaon, Mumbai, Maharashtra). Each temperature condition was tested separately under identical experimental settings. Food items were replaced every 5 min, and oil samples were collected at the same intervals. Monitoring continued for 30 min, with samples taken every 5 min. Collected oil samples were cooled to room temperature and analyzed immediately.
2.5. Filtration of Used Vegetable Oils
Used sunflower, olive, and palm oils were filtered through a 400-micron mesh to remove solid residues prior to analysis. For palm oil, which was solid at room temperature, samples were gently melted in a water bath maintained at approximately 10 °C above the oil’s melting point, with mild stirring to ensure uniform liquefaction before filtration.
2.6. Purification of Used Vegetable Oils Collected
200 mL of used sunflower, olive, and palm oils were heated to 90 ± 5 °C and washed with 20 mL of hot brine solution (10% NaCl, w/v). The ratio of UCO to brine solution was 10:1 (v/v). The mixture of UCO and hot brine was stirred with an AT-MD 20 digital mechanical stirrer (Falc Instruments SRL, Treviglio, Italy) at 60 rpm for 60 min. Afterwards, the mixture was allowed to separate into two phases in a separating funnel for 8 h: the oil phase and the aqueous phase. The lower phase, containing the brine solution and impurities, was removed [20].
2.7. Bleaching of Purified Vegetable Oils
Purified sunflower, olive, and palm oils were heated to 70 ± 5 °C and treated with 3% H2O2 (v/v). Equal volumes of oil and hydrogen peroxide (25 mL each) were stirred with an AT-MD 20 digital mechanical stirrer (Falc Instruments SRL, Treviglio, Italy) at 80 rpm for 30 min at 70 ± 5 °C. The mixture was then transferred to a separating funnel for 6 h to allow phase separation. The lower aqueous phase, containing residual solution, was removed, leaving the bleached oil [21].
2.8. Soap Samples Preparation
The soap samples were prepared using cold saponification [22], incorporating a mix of used frying oils. UCOs of the same type/botanical origin (sunflower, palm, and olive oil) were blended and then incorporated into the soap recipes.
Distilled water is added to the oil in a heat-resistant container at 30% of the oil’s mass, corresponding to a mass ratio of water to fat of 1:2.5. The calculation assumes a water density of 1 g/mL. Caustic soda (NaOH) is added to the water—not the other way around—because the reaction is exothermic and may cause splashing or accidents. The mixture is stirred slowly with a plastic or silicone spoon until the NaOH crystals are completely dissolved. The solution is then allowed to cool to a temperature range of 35–45 °C.
In parallel, the oils were heated in a separate vessel to a temperature close to that of the caustic soda solution. It is important that both components—the soda solution and the oils—have comparable temperatures at the time of mixing to ensure a stable and complete chemical reaction. Once the appropriate temperatures were reached, the caustic soda solution was gradually poured over the oils while stirring continuously for homogenization. Using an AT-MD 20 digital mechanical stirrer (Falc Instruments SRL, Treviglio, Italy), the mixture was homogenized at 400 rpm until a viscous consistency was achieved. At the end of the process, optional ingredients—EO in this case at 2% total (1% oregano + 1% thyme)—were added after the soap cooled to below 40 °C and incorporated by gentle stirring. The mixture was then poured into molds and allowed to solidify.
The final mixture was poured into special silicone soap molds. The molds were kept at room temperature to allow the reaction to continue throughout the mass. After 24–48 h, the soap had hardened sufficiently to be removed from the molds and, if necessary, cut into smaller pieces. The obtained soap requires drying and curing for at least 4–6 weeks in a warm, well-ventilated place, protected from direct light.
2.9. Soap Recipe Preparation
For soap production, the amounts of NaOH and distilled water were calculated considering a 5% superfat (SF), as follows:
- Total mass of oils, g:
- Theoretical mass of NaOH (SF = 0%), g:
- Superfat correction (SF), g:
- Water (distilled water) as a percentage of the mass of oils:
where Moils = ∑mi—total mass of oils (g); mi—mass of oil i (g), n—total number of types of oils; SVi—saponification value of oil i (g NaOH/g oil); SF—superfat percentage (0–10%, usually);
—mass of distilled water required—usually 30% of the total oil weight (mL).
For the preparation of the five types of soaps from UCOs, the saponification process was carried out according to the recipes presented in Table 2, which detail the quantities of oils, NaOH, and distilled water used.
Table 2.
Soap recipe composition and the corresponding saponification values of the ingredients used.
2.10. Analysis of Vegetable Oils
Determination of the Peroxide Value (PV). 2.5 g of oil was weighed into a stoppered bottle. 10 mL of chloroform was added, and the mixture was shaken until complete dissolution. Subsequently, 15 mL of acetic acid and 1 mL of potassium iodide solution were added. The bottle was immediately closed, shaken for one minute, and allowed to stand in the dark for 5 min. Next, approximately 75 mL of distilled water was added. The released iodine was titrated in the presence of starch as an indicator, with continuous stirring, using 0.01 N sodium thiosulfate solution for samples with PV up to 19 meq/kg, or 0.1 N for samples exceeding 19 meq/kg. The PV is calculated using the formula: PV = ((v1 − v2)·n)/m·100 [milliequivalents/kg], where v1—volume of sodium thiosulfate solution used for titrating the sample, in mL; v2—volume of sodium thiosulfate solution used for titrating the blank, in mL; m—mass of the sample taken for analysis, in g; n—normality of the sodium thiosulfate solution used for titration (0.1 or 0.01) [23].
Determination of the Iodine Value (IV). 0.25 g of oil was accurately weighed into a stoppered Erlenmeyer flask. 10 mL of solvent (chloroform or CCl4) was added, and the mixture was shaken until complete dissolution. Then, 25 mL of Hanus solution (c(IBr) = 0.1 mol/L, ready-to-use volumetric solution for titration, Titripur®, Merck KGaA, Darmstadt, Germany) was added using a burette, and the flask was gently swirled to mix. The flask was sealed and allowed to stand in the dark at room temperature for 30–60 min. After the reaction, 20 mL of potassium iodide solution and 100 mL of distilled water were added, carefully rinsing the neck and stopper to remove any traces of iodine. The liberated iodine was titrated immediately with 0.1 N sodium thiosulfate solution until a pale-yellow color appeared. 1–5 mL of starch solution was then added, and titration was continued until the blue color completely disappeared. A blank was prepared in parallel using the same quantities of solvent and Hanus reagent but without oil. Calculation: IV is calculated as = (0.1269 ∙ (V − V1) ∙ n ∙ 100)/m = [g/100 g], where 0.1269—grams of iodine corresponding to 1 mL of sodium thiosulfate solution of normality n; V—volume of sodium thiosulfate solution used for titrating the blank, in mL; V1—volume of sodium thiosulfate solution used for titrating the sample, in mL; n—normality of the sodium thiosulfate solution used for titration; m—mass of the sample analyzed, in g [24].
Determination of Acid Value (AV). 2 g of the sample was accurately weighed into an Erlenmeyer flask. 50 mL of a solvent mixture (ethyl alcohol and diethyl ether, 1:2, neutralized with respect to phenolphthalein) was added, and the mixture was shaken until the sample was completely dissolved. 6 drops of phenolphthalein indicator were added, and the solution was titrated with KOH solution until the endpoint was reached, indicated by a persistent pink color for 1 min. The results of the analysis are expressed as: AV = (56.11 · V · n)/m [mg KOH/Kg], where 56.11—amount of KOH in mg corresponding to 1 mL of KOH solution of normality n; V—volume of KOH solution used for titration, in mL; n—normality of the KOH solution; m—mass of the sample, in g [25].
Determination of Free Fatty Acids (FFAs). The FFA content of the oil samples was determined by titration with 0.1 N KOH, using phenolphthalein as an indicator. The acid value of the sample was first determined as described previously. The FFA content was then calculated from the AV (mg KOH/g oil) using the following formula: FFA =Acidity (mg KOH/g) × 0.503 [%], where 0.503 is the factor converting the acid value to the corresponding FFA content expressed as oleic acid [26].
Determination of Total Polar Compounds (TPCs). The oil is heated to a temperature between 150 and 180 °C, after which the sensor of the portable FOM 310—Food Oil Monitor device (Ebro, Xylem Analytics Germany Sales GmbH & Co. KG, Ingolstadt, Germany) is immersed in the oil sample. The percentage value is recorded according to the instructions displayed on the instrument’s screen. Measurements were performed in triplicate.
Viscosity. The determination was carried out using the microVISC—M viscometer (RheoSense Inc., San Ramon, CA, USA). Measurements were performed in triplicate at 40 °C [27].
The relative density of the oil samples was determined at 25 °C using a 50 mL pycnometer. Prior to measurements, the pycnometer was cleaned by sequential washing with a degreasing solution, distilled water, and petroleum ether to remove any residues. Each oil sample was introduced into the pycnometer, and the mass was recorded. Measurements were performed in triplicate [28].
The refractive index (RI) of the samples was measured in triplicate using a Cell RX4 refractometer (Mettler Toledo, Shah Alam, Selangor, Malaysia). The instrument was calibrated prior to the measurements, and the temperature was controlled to ensure reproducibility and accuracy [29].
FT-IR Analysis. FT-IR spectra of 2 mL of each oil sample were recorded using a Bruker Vertex 70 spectrometer (Bruker Optik GmbH, Rosenheim, Germany) equipped with a Platinum ATR module (Bruker Optik GmbH, Rosenheim, Germany) and Bruker Diamond Tip A225/Q.1 (Bruker Optik GmbH, Rosenheim, Germany). Measurements were performed over the 4000–400 cm−1 range, with a nominal resolution of 4 cm−1 and 128 scans per sample.
GC-FID Analysis of the EO (Oregano and Thyme). The composition of the EO was analyzed using a 7890B Gas Chromatograph (Agilent Technologies, Santa Clara, California, USA) equipped with a flame ionization detector (FID) and a J&W DB-5 fused silica capillary column (60 m × 0.325 mm × 0.5 μm; stationary phase: macrogol 20,000). The GC oven was programmed from 50 °C (1 min) to 260 °C at a rate of 50 °C/min, followed by a 1 min hold. Injector and detector temperatures were set at 260 °C. Hydrogen (99.99%) was used as the carrier gas at a flow rate of 2 mL/min. Samples of EO (2 μL) were injected in split mode (1:80). The standard solution is prepared from a mixture of standard solutions of known concentration that are injected into the GC system before performing analyses for essential oils. The relative composition of the EO was expressed as percentages based on peak area normalization (each peak area divided by the total area), providing semi-quantitative results. Chemical constituents were tentatively identified by comparing their retention times and mass spectra with data from the literature and commercial databases. Absolute concentrations were not determined [30].
2.11. Qualitative Analysis of Soap
pH. The pH of the soap samples was determined by preparing a 10% (w/v) aqueous solution. Specifically, 5 g of finely grated solid soap was dissolved in 50 mL of distilled water. The solution was continuously stirred in a 250 mL Erlenmeyer flask with a ground glass stopper for 5 min until complete dissolution of the soap was achieved. The pH of the resulting solution was measured directly using a calibrated pH meter: HI98108 pHep+ (Hanna Instruments, Nușfalău, Romania), and the recorded value was reported as the pH of the sample [31].
Foam Stability. 5 g of solid soap was finely grated and continuously stirred for 10 min with 100 mL of distilled water to form a foam in a stoppered Erlenmeyer flask until the soap was completely dissolved. The foam was then transferred into a tall graduated cylinder with a diameter of 4 cm, and the height of the foam was measured after 2 min using a ruler [32,33].
The matter insoluble in ethanol (MIIE). Over 5.0 g of grated soap sample, 150 mL of ethanol is added to a 250 mL laboratory beaker. The mixture is gently heated with continuous stirring until the soap is completely dissolved. A folded filter paper is placed in an oven at 105 °C for 30 min to dry it completely and weighed (W1). The dissolved soap solution is filtered through the paper. The beaker is rinsed three times with small portions of ethanol to ensure complete transfer of the soap. The filter paper is then dried again in the oven at 105 °C for an additional 10 min to ensure complete drying and weighed again (W2). The mass of the residue is then calculated (%) = (W2 − W1) x 100/5 g [34].
2.12. Antibacterial Sensitivity Testing
2.12.1. Preparation of Soap Samples
Each of the soaps was scraped with a sterile grater. One gram of the soap was dissolved in 9 mL of sterile distilled water to give a stock solution. The soaps were dissolved smoothly and quietly in water, without producing foam and bubbles during the process, and the stock solutions were placed in tightly closed containers and stored in the refrigerator until use. To determine the antibacterial activity, three soap concentrations in sterile distilled water were used: 500 mg/mL, 250 mg/mL and 125 mg/mL.
2.12.2. Preparation of Microorganism Cultures
The in vitro antimicrobial activity of different soaps was evaluated using the agar well diffusion method [35] against two selected bacteria: Escherichia coli (ATCC 25922) and Staphylococcus aureus (ATCC 25923), provided by MicroBioLogics Inc. (St. Cloud, MN, USA). Cultures were prepared in 10 mL of nutrient broth (Merck KGaA, Darmstadt, Germany) and incubated for 18 ± 2 h at 37 ± 1 °C. Turbidity was adjusted using a McFarland densitometer (Mettler Toledo, Columbus, OH, USA) to match a turbidity of 0.5 McFarland standard (Thermo Fisher Scientific Inc., Waltham, MA, USA).
2.12.3. Antimicrobial Assay
Mueller-Hinton agar (Merck KGaA, Darmstadt, Germany) plates were used for testing the antimicrobial capacity of the soaps analyzed using the agar well diffusion method. The Mueller Hinton plates were prepared in 9 cm sterile plastic plates to a depth of approximately 4 mm. When performing spread plating, 0.1 ml of bacterial culture was plated using a glass spreader. After inoculation, the plates were kept for 15 min at 37 ± 1 °C to absorb the inoculum into the agar. A sterile stainless-steel tube was used to create 6.0 mm diameter circles by pressing and cutting into the culture medium of the Petri dishes. This method allows for a larger volume of the solution to be loaded and is more suitable for testing compounds that may adhere to the disc and not diffuse properly. Each hole was then filled with 100 μL of prepared soap solutions. Commercially available Safeguard antibacterial soap, containing active antibacterial agents such as piroctone olamine (and in some formulations triclocarban or triclosan—restricted or banned in certain EU products) as well as citric acid and sodium citrate for pH regulation, was used as a positive control, and sterile distilled water was used as a negative control. The plates were incubated at 37 ± 1 °C for 24 h after which, for evaluation of the antimicrobial activity, zones of inhibition (in mm) were determined, using a DIN 862 ABS digital caliper (Fuzhou Conic Industrial Co., Ltd., Fuzhou, China). All tests were performed in triplicate and the results were expressed as the average of the three tests. Statistical differences between the mean inhibition zones of the experimental soaps and the control—Safeguard were analyzed using Student’s t-test. All tests were performed in triplicate, and results are expressed as mean ± standard deviation (SD). Differences were considered statistically significant at p < 0.001.
3. Results
3.1. Experimental Study of Food Mix Frying
PV and IV were determined according to standardized methods to assess the degree of oxidation and the reduction in fatty acid unsaturation in sunflower and olive oils. The quantities of the food components and the procedure used for the laboratory simulation are described in Section 2.4. Laboratory Simulation of Food Mix Frying.
In Table 3 and Table 4, the changes in the PV of fresh oils are presented, depending on frying temperature and duration.
Table 3.
Peroxide Value (mEq O2/kg) of sunflower oil after frying a mix of potatoes, mushrooms, and chicken breast.
Table 4.
Peroxide Value (mEq O2/kg) of olive oil after frying a mix of potatoes, mushrooms, and chicken breast.
At temperatures above 180 °C, the PV increases exponentially, especially after 30 min. At 200 °C, after 30–40 min, the oil is strongly oxidized. Above 180 °C, degradation is severe, and the values rapidly exceed 20 meqO2/kg, which is the legal limit for extra virgin olive oil according to Reg. EU 2568/91 [36].
Frying moist foods (mushrooms) and protein-rich foods (meat) accelerates oxidation through the release of water and amino acids that interact with fats. Oxidation is influenced by temperature, time, contact with air, and the water/protein content of the food (e.g., mushrooms and meat).
There are no specific regulations in the EU establishing legal limits for the PV of used oils intended for industrial or energy reuse. However, existing standards for edible oils can serve as a reference for evaluating the degree of oxidation in used oils. Only in South Korea, according to national legislation [37], regulations require frying oils for common foods to have PV below 50 meq/kg. However, there are no specific regulations for oils used to fry animal-based foods and the corresponding fried products.
Table 5 and Table 6 show the changes in the IV of fresh oils depending on frying temperature and duration.
Table 5.
Iodine Value (g I2/100 g) of sunflower oil after frying a mix of potatoes, mushrooms, and chicken breast.
Table 6.
Iodine Value (g I2/100 g) of olive oil after frying a mix of potatoes, mushrooms, and chicken breast.
The obtained values for the PV and IV highlight a progressive degradation of the analyzed oils as frying temperature and duration increase. At higher temperatures, particularly above 180 °C, sunflower oil shows a pronounced increase in PV, reaching over 59 meq O2/kg at 200 °C after 30 min, indicating severe oxidation. In comparison, olive oil, although initially more resistant, also exceeds the legal limit of 20 meq O2/kg (EU Reg. 2568/91) after 25 min at 200 °C, signaling the loss of the characteristic qualities of extra virgin oil.
The IV, reflecting the degree of unsaturation of fatty acids, decreased steadily for both oils, confirming the degradation of the lipid structure. Sunflower oil showed a reduction from approximately 119 to 102 (at 200 °C), while olive oil decreased from 84 to 69, indicating a significant loss of unsaturated fatty acids in both cases. A decrease in the IV below 75 g I2/100 g may indicate significant oil degradation, particularly in virgin oils, according to Codex Alimentarius standards [38].
In comparison, olive oil demonstrated superior oxidative stability compared to sunflower oil during the frying process. The PV of sunflower oil increased much more rapidly, exceeding 20 meqO2/kg already after 20 min at 180 °C, whereas olive oil reached this value only at 200 °C after 25–30 min.
Using Minitab Statistical Software version 21.4.1 (Minitab, LLC, State College, PA, USA), the experimental data were analyzed to obtain a series of statistical models describing the variation in PV and IV in the samples depending on the temperature and exposure time. An empirical second-order polynomial function was applied to model these relationships and to evaluate the effect of temperature on the oxidative stability of the oils. The experimental data and the surfaces generated by the statistical mathematical models are presented in Figure 1 and Figure 2 (for the variation in PV) and Figure 3 and Figure 4 (for the variation in IV).
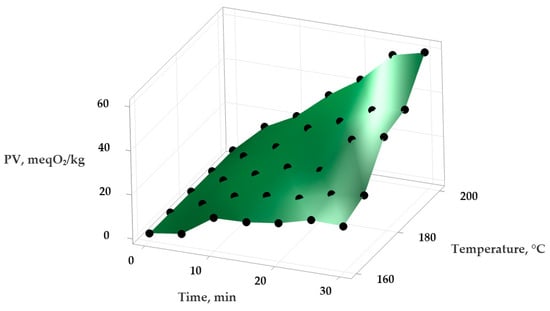
Figure 1.
Variation in the PV (peroxide value) in sunflower oil depending on temperature and time of heat treatment.
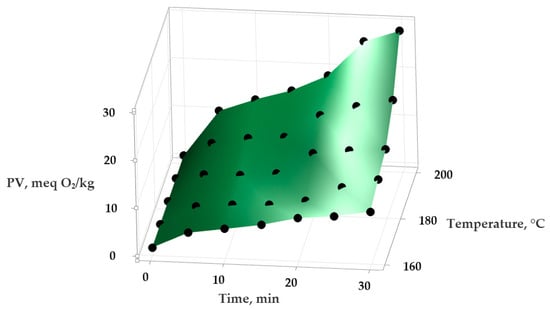
Figure 2.
Variation in the PV (peroxide value) in extra virgin olive oil depending on the applied temperature and the duration of heat treatment.
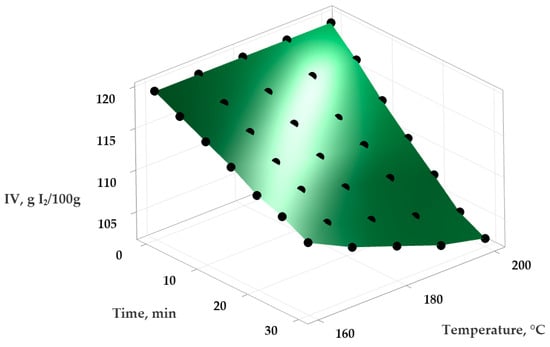
Figure 3.
Variation in the IV (iodine value) in sunflower oil depending on temperature and time of heat treatment.
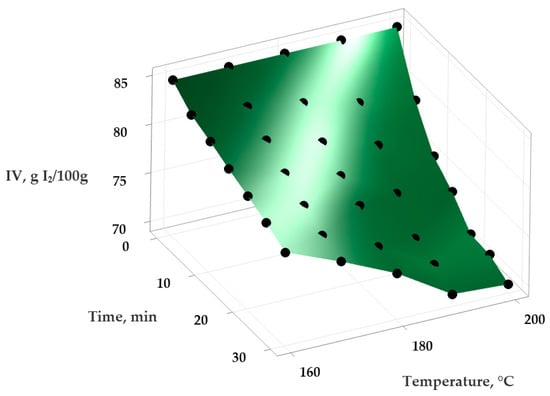
Figure 4.
Variation in the IV (iodine value) in extra virgin olive oil depending on the applied temperature and the time of heat treatment.
The equations of the statistical mathematical models obtained from multiple polynomial regression are presented in Table 7.
Table 7.
Equations of the statistical models obtained for the two studied oils.
After calculating the model coefficients, the predictions were compared with experimental data. The resulting concordance indicators are presented in Table 8.
Table 8.
Concordance indicators of the determined statistical models.
The statistical models obtained for the variation in the PV and IV of sunflower oil and olive oil with temperature and time demonstrated high precision, being able to explain over 95% of the variation in the indices. It should be emphasized that the PV and IV models are empirical, being valid only within the studied range of temperature and exposure time. Nevertheless, they can serve as useful tools to predict trends and provide guidance on the oxidative behavior of sunflower and olive oils under similar conditions.
3.2. Technological Process for Soap Production
The sequence of steps in the technological process used for converting UCOs into soap is:
1. Collection and storage of UCOs. The process begins with the collection of UCOs from sources such as restaurants, households, or food processing units. These oils are transferred to collection and storage tanks made from corrosion-resistant materials such as stainless steel or food-grade plastic. Storage is carried out safely, avoiding further contamination and separating the oils from other wastes.
2. Mechanical filtration (removal of solid impurities). Collected oils contain food residues, solid particles, and water, which must be removed before processing. Filtration is performed using a mesh filter (nylon), a filter press, a fine metal sieve, or by gravitational decantation. This step is essential to prevent contamination of subsequent chemical processes and to protect the equipment.
3. Physico-chemical purification with brine solution (sodium chloride—NaCl). After filtration, UCOs may undergo purification with a concentrated NaCl solution. This treatment aims to separate polar compounds, mucilages, proteins, and other soluble impurities that dissolve or precipitate under the action of salt. The oil is mixed with 10% (w/w) NaCl solution at a 1:1 v/v ratio in a stirred reaction vessel and left in contact for 30–60 min at room temperature or slightly heated (~30–40 °C). The saline solution aids impurity separation through differences in solubility and density.
4. Decantation and phase separation. After the reaction, the mixture is allowed to decant in the mixer, where phase separation occurs: the upper layer contains the oils, and the lower layer contains water and heavy impurities. For higher efficiency, a centrifuge may be used to accelerate separation. This step removes most of the water and other residues.
5. Bleaching with hydrogen peroxide. To improve the visual appearance of the soap, the purified oil undergoes an oxidative bleaching step with 30% H2O2 solution, at 1–2% v/v relative to the oil. This chemical treatment removes natural colorants or those formed through oxidation. Because H2O2 is a strong oxidizing agent, the pH (7–8) and temperature (40–60 °C) must be rigorously controlled during the 30 min reaction to avoid excessive oxidation of fatty acids and degradation of the raw material. The treatment is carried out with a 30% H2O2 solution at 1–2% v/v relative to the oil.
6. Post-bleaching separation. After bleaching, the mixture undergoes a decantation/separation process in the mixer, either in a static decanter or by centrifugation, allowing phase separation. The bleached, purified oil rises to the surface, while the aqueous phase, containing impurities and excess adsorbed substances, settles at the bottom and is subsequently removed. Residual peroxide is checked using potassium iodide-starch paper.
7. Treatment with caustic soda (saponification). After bleaching, the oils are transferred into a mixer, where NaOH is added in a calculated excess based on the triglyceride content to ensure complete conversion of the remaining triglycerides into soap. This stage guarantees a complete reaction and stability of the final product. The saponification vessel is equipped with a constant stirring system, and the process is carried out at approximately 40 °C.
8a. Glycerin separation. After saponification, the soap paste contains glycerin as a by-product, which can affect stability and texture. Glycerin in excess is separated from the soap paste by decantation (or centrifugation). The recovered glycerin can be collected for further use. This step ensures that the soap has a consistent quality and reduces irritation.
Note: If a superfat content of 5% is maintained, a portion of glycerin may remain in the soap together with the superfat, contributing to increased moisturization and a softer texture, without compromising product safety.
8b. Washing and neutralization of soap. To ensure safety, stability, and quality of the final product, the soap is washed with warm demineralized water or a 5–10% (w/v) saline solution. The mixture is stirred during washing and then allowed to settle. The washed soap is subsequently drained, and the process may be repeated. The pH of the final soap is carefully monitored and adjusted if necessary to ensure dermal safety. After washing and neutralization, the soap is allowed to cool and solidify, and the final product is formed into solid soap.
The purification of used oils using NaCl and H2O2 was applied as a simple laboratory-scale method to remove colorants and excess unsaponified matter [39]. However, H2O2 may induce lipid oxidation if not properly controlled, potentially affecting the chemical stability of the oils [40,41]. To ensure safety, residual peroxide was tested after the final soap washing using potassium iodide–starch paper, and no detectable peroxide was observed, confirming that the purified oils are suitable for soap production. While this method is practical for laboratory-scale purification, industrial applications may require more controlled or alternative oxidation-limiting procedures [42].
3.3. Analysis of Fresh, Used, and Purified Oils
Table 9 presents the main physicochemical parameters determined from the analyses of the tested fresh oils. These values provide an overview of the initial quality of the products and serve as a reference point for subsequent comparisons with the UCO.
Table 9.
Results of physicochemical analyses of fresh oils.
Table 10 presents the main physicochemical parameters determined from the analyses of UCOs. The results highlight the changes in their composition and properties during use, compared to the initial values of fresh oils. This allows for the assessment of the degree of degradation and the influence of operating conditions on oil quality.
Table 10.
Results of physico-chemical analyses of used oils.
Table 11 presents the main physicochemical parameters determined from the analyses of purified oils. The obtained data reflect the efficiency of the purification process and allow for the assessment of the extent to which the initial properties of fresh oils have been restored. Comparing these results with the corresponding values of used and fresh oils highlights the degree of improvement in physico-chemical characteristics following the applied treatment. Oils with a TPC content exceeding 40% are considered highly degraded, surpassing commonly accepted food safety limits (25–27%), and therefore must be purified before reuse.
Table 11.
Results of physico-chemical analyses of purified oils.
3.4. FTIR
In Figure 5, the FT-IR spectra of four used sunflower oil samples (S1 (―), S2 (―), S3 (―), S6 (―)) and one purified oil mixture (a blend of the of four purified sunflower oils PSF (―) used as an ingredient in soap production) are presented.
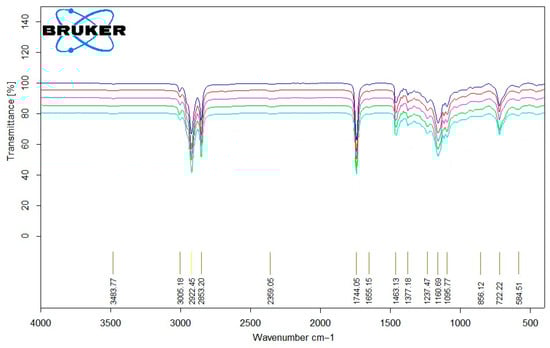
Figure 5.
FT-IR spectrum analysis of sunflower oil (S1 (―), S2 (―), S3 (―), S6 (―), PSF (―)).
For sunflower oils, the main vibrational peaks at 3005 cm−1 (unsaturated C–H), 2922 cm−1 (saturated C–H), and 2853 cm−1 (symmetric and asymmetric stretching of C–H bonds in CH2 and CH3 groups) were clearly identified. The absorption at 1744 cm−1 corresponds to the C=O stretching in triglycerides and esters, while the fingerprint region between 1600 and 550 cm−1 contains complex vibrations characteristic of the oil matrix, including C–O stretching (1237, 1160, 1095 cm−1) and CH2/CH3 bending (1463, 1377 cm−1) [39]. Upon comparing the spectra of fresh (S1) and aged or thermally treated oils (S2–S6), slight shifts and changes in intensity were observed, particularly in the carbonyl (1744 cm−1) and unsaturated C–H (3005 cm−1) regions. These modifications indicate partial oxidation, leading to the formation of peroxides, aldehydes, and hydroperoxide compounds. The decrease in intensity of the unsaturated C–H stretching peak suggests the consumption of double bonds during oxidation, while broadening or increased intensity in the C=O region reflects the accumulation of oxidative products.
In Figure 6, the FT-IR spectra of two used palm oil samples: S4 (―) and S5 (―) and one purified oil mixture (a blend of the two purified palm oils PP (―) used as an ingredient in soap production) are presented.
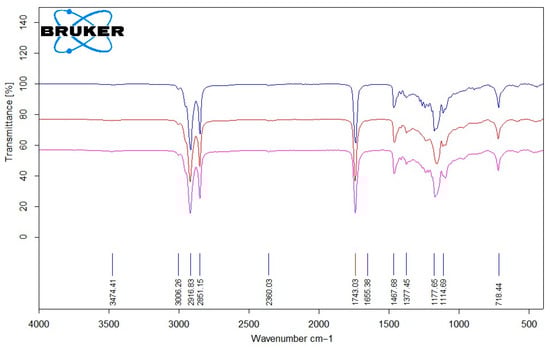
Figure 6.
FT-IR spectrum analysis of palm oil (S4 (―), S5 (―), PP (―)).
The characteristic C–H stretching vibrations of methyl (–CH3) and methylene (–CH2–) groups occur at 2851, 2916, and 3036 cm−1. The C–O stretching band at 1377 cm−1, and the absorption near 1177 cm−1 correspond to ester groups of long-chain fatty acids. The carbonyl (C=O) absorption of saturated aliphatic esters typically appears at 1743 cm−1. Comparison of fresh and thermally treated palm oils shows minor changes in the C=O region, suggesting the formation of oxidative products such as peroxides and aldehydes. Due to the lower degree of unsaturation in palm oil, changes in the unsaturated C–H region (3036 cm−1) are less pronounced than in sunflower oil.
In Figure 7, the FT-IR spectra of a used olive oil sample, S6 (―) and a purified olive oil sample PO (―) used as an ingredient in soap production are shown.
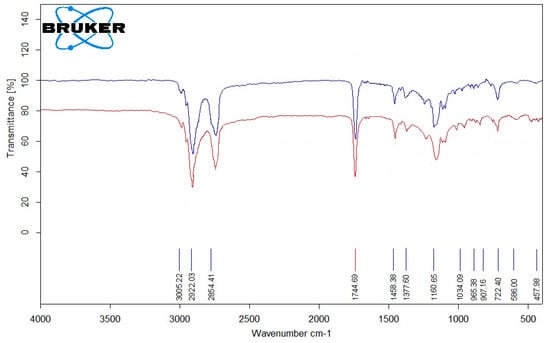
Figure 7.
FT-IR spectrum analysis of olive oil (S6 (―), PO (―)).
The FT-IR spectrum of olive oil shows characteristic absorption bands of triglycerides and fatty acids. The peak at 1744 cm−1 corresponds to the C=O stretching of ester carbonyl groups, while the weak band at 3005 cm−1 indicates the presence of unsaturated C–H bonds. The region between 2800 and 3000 cm−1 represents symmetric and asymmetric C–H stretching of CH2 and CH3 groups. Bands at 1160 cm−1 are attributed to C–O stretching of ester bonds. The fingerprint region (700–1500 cm−1) displays complex bending vibrations of aliphatic chains [43]. Comparison of the fresh and used olive oil spectra reveals subtle changes in both the C=O and unsaturated C–H regions. The decrease in intensity of the 3005 cm−1 band indicates consumption of double bonds during oxidation, while slight broadening or increased absorption in the 1744 cm−1 region reflects the formation of oxidation products such as peroxides and aldehydes. These observations provide qualitative evidence of olive oil oxidation, in agreement with the trends observed in PV and IV measurements.
3.5. Chemical Composition of Essential Oils Used in Soap Production
GC–FID analysis was performed to determine the chemical composition of oregano (Origanum vulgare) and thyme (Thymus vulgaris) EOs, as presented in Figure 8 and Figure 9.
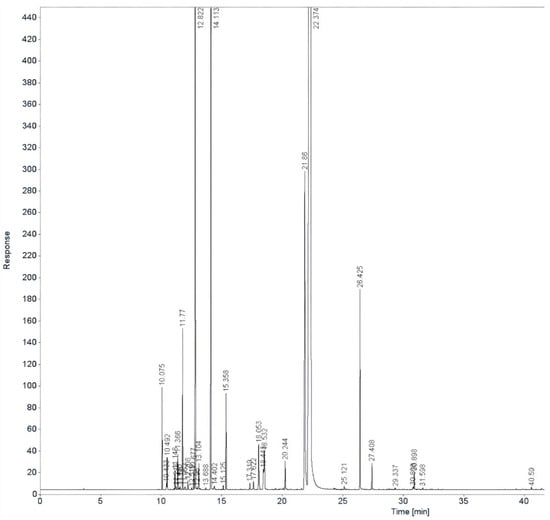
Figure 8.
GC-FID chromatogram of oregano EO.
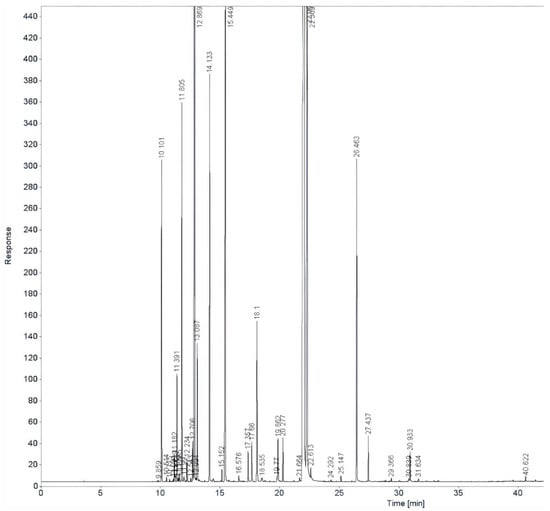
Figure 9.
GC-FID chromatogram of thyme EO.
GC–FID analysis indicated that the oregano EO (Figure 5) was primarily composed of carvacrol (68.9%), with notable amounts of para-cymene (8.86%), limonene (5.86%), thymol (2.30%), α-pinene (1.4%), and γ-terpinene (0.96%).
GC–FID analysis revealed that the thyme EO (Figure 6) was predominantly composed of thymol (40.49%) and carvacrol (12.25%). Other major constituents included limonene (14.54%), γ-terpinene (14.54%), para-cymene (7.47%), α-pinene (3.02%), myrcene (3.77%), and borneol (4.03%). Minor components present at levels above 1% were camphene (1.06%) and α-terpinene (0.24%).
The results reveal the major and minor constituents of each oil, highlighting key bioactive compounds such as carvacrol, thymol, limonene, and α-pinene, which are responsible for the antimicrobial and therapeutic properties that enhance the functional value of the soaps.
3.6. Analysis of Soaps Obtained from Used Oils
Table 12 presents the physical properties and main parameters of soaps obtained from UCOs. Analysis of these characteristics allows for the evaluation of the final product’s quality, its stability, and compliance with usage standards. The data provide insight into how the properties of UCOs influence the texture, consistency, and other physical characteristics of the soaps.
Table 12.
Physical properties of soaps obtained from UCOs.
The pH of soaps generally ranges from 9 to 10. The palm soap (SP3) showed a slightly higher pH of 10.15. This minor increase is unlikely to compromise the product’s stability; however, it may slightly enhance the alkalinity, which could affect skin moisture if used frequently. Incorporating moisturizing agents or buffers can mitigate these effects in practical applications.
3.7. Antimicrobial Analysis of Soaps
Table 13.
Diameter of Zone of Inhibition (mm) on S. aureus by soap samples.
Table 14.
Diameter of Zone of Inhibition (mm) on E. coli by soap samples.
The results show that all tested soaps exhibit some antimicrobial activity against S. aureus; however, the intensity depends on both the concentration and the type of oil used. In general, the inhibition zones decrease with decreasing concentration, confirming a dose–response relationship. Among the prepared soaps, the palm oil-based soap (alone or in combination with other oils) showed the largest inhibition zones, while the sunflower oil-based soap exhibited the weakest activity. Compared to the produced soaps, the commercial soap (Safeguard) showed larger inhibition zones at all concentrations, confirming the superior efficacy of the commercial product specifically formulated with antibacterial agents.
The results show that all soaps exhibited moderate antimicrobial activity against E. coli, with inhibition zones smaller than those observed against S. aureus. The activity decreases with decreasing concentration, confirming dose-dependence. Among the prepared soaps, the palm oil-based soap consistently showed larger inhibition zone diameters, indicating relatively higher efficacy, while the sunflower and olive oil soaps exhibited weaker effects. Oil combinations produced intermediate zones, without a clear advantage over the plain palm oil soap. As with S. aureus, the commercial soap (Safeguard) demonstrated the largest inhibition zones at all concentrations, confirming its superior efficacy due to the specific antibacterial ingredients in its industrial formulation.
4. Discussion
In the EU, the majority of UCOs are recycled for biodiesel and energy production, while alternative uses remain limited due to economic and market constraints [44]. As a result, products such as biobased lubricants, surfactants, fertilizers, soaps, and cosmetic or animal feed additives are mostly derived from vegetable oils, with UCO-based products still occupying a niche segment [45]. In 2024, the European UCO market generated approximately USD 1.77 billion in revenue, with biodiesel production being the largest revenue-generating application. The market is projected to grow at a compound annual growth rate (CAGR) of 7% from 2025 to 2030 [46]. Similarly, the European bioplastics market is experiencing significant growth, with projections to expand from 0.67 million tons in 2025 to 1.54 million tons by 2030, supported by a forecast CAGR of 17.96% [47]. Although bioplastics currently account for only 1% of total plastics production in Europe, the increasing demand for sustainable materials is driving the adoption of bio-based alternatives, including those derived from UCO [48]. UCO has been identified as a potential feedstock for the development of next-generation biosurfactants, offering promising applications in skin care products [49]. These developments underscore the potential for diversifying UCO utilization beyond traditional applications, such as biodiesel production, into high-value sectors like bioplastics and cosmetics.
The improper disposal of UCO represents a significant environmental concern; however, its transformation into solid soap provides an effective and sustainable approach to waste reduction while generating value-added products [50]. Although soap production involves energy consumption and chemical reagents (e.g., NaOH, bleaching agents), its environmental footprint is generally lower than that of other UCO recycling methods, such as biodiesel production. The reuse of UCO requires a series of purification steps to remove impurities and improve its suitability for further applications [20,51].
The results obtained in our study regarding the evolution of PV and IV indices in sunflower and olive oils during the frying of a mix of potatoes, mushrooms, and chicken are consistent with previous studies, which reported a significant increase in the PV in sunflower and olive oils at high temperatures. The study published by Longobard et al. [52] reported an increase in the PV of olive oil at similar frying temperatures. Furthermore, previous research has shown a decrease in the IV in sunflower and olive oils during frying, indicating a loss of unsaturated fatty acids. According to Regulation (EU) 2568/91 [36], the PV of fresh extra-virgin olive oil should not exceed 20 meqO2/kg, highlighting the importance of controlling oxidation to maintain oil quality. The results confirm that high temperatures and prolonged heat exposure promote lipid oxidation, and the combination of water- and protein-rich foods (mushrooms and meat) intensifies this process. Therefore, the repeated use of oil under such conditions becomes unsafe from a health perspective.
The oxidative ability of olive oil to resist oxidation, possibly due to its high content of natural antioxidants, such as polyphenols. In contrast, sunflower oil, although richer in polyunsaturated fatty acids, is more prone to oxidation under high temperatures and in the presence of water and proteins from the fried foods. Furthermore, the decrease in IV was more pronounced for sunflower oil, indicating a greater loss of unsaturated fatty acids and more intense structural degradation. Therefore, olive oil proves more stable under moderate frying conditions, yet both oils become unsuitable for safe consumption after prolonged exposure to temperatures above 180 °C.
Thus, our results, including other physico-chemical parameters (which, in the case of fresh oils, should be: AV: ≤0.8%, moisture and volatile matter—≤0.2%, impurities/insoluble matter ≤0.1% for extra-virgin olive oil)), confirm the trends observed in earlier studies [53,54] and emphasize the importance of monitoring oil quality during the frying process, particularly to ensure compliance with regulatory standards.
The environmental and economic aspects of sustainability are important, as the valorization of UCOs contributes to circular economy principles by reducing waste disposal and recovering valuable resources [55,56,57]. Recycling oils into soaps can decrease environmental pollution and lower the carbon footprint compared to conventional waste treatment methods [58,59]. Economically, UCO-based soap production can provide cost-effective alternatives to conventional raw materials, offering both social and industrial benefits, particularly in developing regions [60]. Future studies should include life cycle assessment (LCA) and techno-economic analyses to quantify the environmental benefits, economic feasibility, and overall sustainability of such processes [61,62].
Depending on the source and mode of use, the chemical composition of UCOs can vary significantly. UCOs represent a complex mixture of organic compounds formed during repeated thermal cooking processes. They contain degraded triglycerides, FFA, oxidized polymers, aromatic compounds, and other compounds/contaminants.
The production of soaps from UCO provides a sustainable recycling pathway, converting food waste into eco-friendly raw materials. The composition of UCO is influenced by the characteristics of the oil used as well as the conditions of the saponification reaction. In general, UCOs, previously subjected to filtration and decantation to remove solid impurities and water, reacts with a NaOH solution, thereby producing soap and glycerin as the main products. The process may include additives such as fragrances, colorants, or stabilizers, depending on the desired final application. This valorization method contributes to reducing the environmental impact of food waste and aligns with current circular economy trends.
The purification process chosen in this study for UCO combines mechanical filtration, purification with a NaCl solution, decantation, and bleaching with H2O2, prior to the saponification stage. Although alternative methods exist using various adsorbents, such as zeolites, activated carbon [20,63], bleaching clay (bentonite, kaolin, etc.) [64], silica gel [65], activated alumina [66], corn cobs [67], and sawdust [68] or coconut coir [69], the selected approach effectively removes solid impurities, proteins, mucilages, and natural colorants, preparing the oil for the main chemical reaction and ensuring improved stability and quality of the final soap product. These steps remove solid impurities, proteins, mucilages, and natural colorants, preparing the oil for the main chemical reaction [70]. However, the purification and bleaching steps may also reduce natural antioxidants (such as tocopherols and phenolic compounds), which could affect the oxidative stability and overall quality of the soap. In addition, the use of H2O2 requires careful control, as excessive oxidation may alter the fatty acid composition and influence saponification efficiency.
The chemistry of saponification involves the base-catalyzed hydrolysis of triglycerides with NaOH, yielding soap (sodium salts of fatty acids) and glycerol [15]. In most studies, saponification of refined oils proceeds directly without preliminary purification [71].
From older chemical practices, crude oils were often used with minimal treatment, such as simple filtration or heating, before saponification. In contrast, the proposed process integrates physico-chemical preparation of UCO, including filtration, saline treatment, and bleaching, enabling complete conversion of triglycerides and FFA, and improving the stability, foaming, and appearance of the final soap. Thus, the proposed method optimally harmonizes technological optimization and chemical efficiency, demonstrating how the pretreatment of UCO can be compatible with the principles of saponification chemistry and industrial quality requirements [72].
Soaps made from UCO have been investigated in various contexts, including waste valorization, sustainable production, and antimicrobial applications [73,74]. These studies highlight the potential of recycling cooking oils into high-value products while maintaining acceptable physicochemical and hygienic properties.
The antimicrobial activity of soap is not primarily determined by the type of oil used, but rather by its alkaline pH, which inhibits the growth of certain bacteria, and by any added antibacterial agents such as EOs, extracts, or other natural compounds [74].
Several studies have reported similar chemical compositions in oregano EO. For instance, a study by Walasek-Janusz et al. [75] analyzed EO samples from Poland, Europe, Turkey and the USA, identifying carvacrol as the dominant component, followed by thymol and p-cymene. Similarly, research by Laghmouchi et al. [76] found carvacrol (2.18–63.65%), p-cymene (6.69–42.64%), and thymol (0.16–34.29%) as major constituents in oregano EO.
Carvacrol, 68.90% in our analysis sample, the main component of oregano EO, is a monoterpenic phenol with broad-spectrum activity against fungi, yeast, bacteria, and drug-resistant or biofilm-forming pathogens, primarily due to its disruptive effects on the structural and functional properties of the cytoplasmic membrane [77]. Para-cymene (8.86%) also exhibits broad-spectrum antimicrobial activity against bacteria, fungi, and other pathogenic microorganisms [78], while limonene (5.86%) demonstrates broad-spectrum antibacterial activity and potential for food preservation due to its safety and low toxicity [79]. Thymol (2.30%), another major monoterpene phenol, contributes significant antibacterial, antifungal, and preservative effects [80]. Additionally, α-pinene, present at 1.4% in oregano EO used for soap production, exhibits anti-inflammatory activity via PGE1 [81], along with antimicrobial and antimalarial effects [82].
Our research aligns with findings by Imelouane et al. [83], who identified myrcene and α-pinene as significant components in the EO of Thymus vulgaris from Eastern Morocco. These compounds contribute to the oil’s antimicrobial properties, supporting their potential use in various applications. In thyme EO, carvacrol (15.00%), exhibiting broad-spectrum activity against food spoilage and pathogenic fungi, yeast, and bacteria, including drug-resistant and biofilm-forming microorganisms. Its antibacterial effect is attributed to disruption of the structural and functional properties of the cytoplasmic membrane [84]. Thymol (45.00%) and other constituents, including γ-terpinene (10.00%) and p-cymene (6.00%), act as broad-spectrum antimicrobial agents [80], while limonene (12.00%) disrupts microbial plasma membranes [85]. Myrcene (3.20%) and α-pinene (2.50%) exhibit antimicrobial activity, contributing to the overall antibacterial properties of the EO.
In the present study, the antibacterial properties of the soaps produced were evaluated against Gram-positive and Gram-negative bacteria. S. aureus is a commonly found bacterium on the skin which is responsible for skin infection, and E. coli is one of the most widespread enterobacteria and its presence on the skin is very common.
In our study, it was observed that palm soap, alone or in combination with olive or sunflower soap, had the best antimicrobial effect. This may be due to the higher proportion of medium-chain saturated fatty acids, with direct antimicrobial effect by disruption of bacterial cell membranes.
Other studies have evaluated the antibacterial properties of various soaps against bacteria or even fungi. Most studies have been conducted on commercial antibacterial soaps [86,87,88]. Although some studies have evaluated antibacterial activity on several bacterial or fungal strains, most of them have focused on S. aureus and E. coli. In most of these studies, commercial antibacterial soaps had stronger antibacterial activity than our soaps, although there were also cases in which no bacterial inhibition was observed with some commercial soaps [86]. The general conclusions of these studies were that the inhibition of bacteria was most pronounced with the highest soap concentration, and the efficacy was higher for Gram-positive bacteria than for Gram-negative ones, consistent with our results.
There are also studies conducted on traditional, local soaps. One such study conducted in Nigeria demonstrated the antibacterial activity of a local traditional medicated soap against S. aureus and Candida albicans, but weaker on E. coli [89].
Regarding composition, sunflower oil, rich in linoleic acid (≈80%), gives the soap a softer texture and moisturizing properties but is generally reported to have little inherent antibacterial effect [90,91]. Olive oil contributes polyphenols (approximately 60 mg per 100 g) with some antioxidant and antimicrobial activity, although most of these are largely neutralized during the saponification process [92]. The combination of the two oils merges the benefits. Sunflower oil contributes to hydration, increasing skin hydration by 5–15% in in vivo tests, while soaps containing 30–40% coconut or palm oil typically show higher hardness (penetration depth 0.8–1.2 mm). Despite these differences, the combination does not significantly enhance antimicrobial activity. Thus, whether sunflower oil, olive oil, palm oil, or a blend is used, the soap’s antibacterial effect primarily results from its high pH. Variations among formulations are mainly reflected in texture, lathering (foam volume increases with higher coconut oil content, reaching up to 250 mL in 2 min tests), and cosmetic properties [93,94]. Importantly, the valorization of UCOs through their transformation into soaps not only provides a sustainable route for waste management but also converts a potential environmental pollutant into a valuable and commercially useful product, combining ecological benefits with functional and cosmetic advantages.
A limitation of the study was the use of only two commercial bacterial strains for the evaluation of antimicrobial activity. However, Gram-positive and Gram-negative bacteria were chosen, some of the most common that can be found on the skin and can cause skin infections. In addition, the tests were carried out at three different concentrations. More comprehensive studies, including a broader range of microorganisms or bacteria isolated from patients with skin infections, are planned for future work to better characterize the antimicrobial contribution of each component.
Although the present study focused primarily on the chemical characterization and preliminary evaluation of the soap formulations, it is important to acknowledge that a full assessment of product safety, stability, and compliance with cosmetic quality standards (e.g., ISO 22716:2007 [95], Reg. (EC) No 1223/2009 [96]) was not performed. Safety evaluation of soaps typically includes microbial stability, pH, potential irritancy, and shelf-life testing to ensure suitability for consumer use [97,98]. Future work should incorporate such assessments to verify that the formulations meet regulatory requirements and maintain long-term stability while retaining their functional properties.
Beyond the reduction in waste and pollution, the valorization of UCOs through soap production contributes to several Sustainable Development Goals (SDGs), particularly SDG 6 (Clean Water and Sanitation), SDG 12 (Responsible Consumption and Production), and SDG 13 (Climate Action). The process promotes circular economy principles by reintroducing waste oils into the production chain as value-added biobased materials, thereby reducing dependence on virgin feedstocks and lowering greenhouse gas emissions associated with oil disposal or incineration [99]. Compared with energy-intensive processes such as biodiesel production, the proposed saponification route operates under milder conditions, uses fewer chemical reagents, and produces non-toxic, biodegradable end-products.
5. Conclusions
The study demonstrates the dual valorization of vegetable oils, both in terms of evaluating their oxidative stability during high-temperature frying and their conversion into sustainable soap products through saponification. The results showed that sunflower, olive, and palm oils undergo notable physico-chemical changes when exposed to high temperatures, with PV and IV confirming accelerated oxidation and loss of unsaturation, particularly above 180 °C. Olive oil appeared to have higher oxidative stability compared to sunflower oil, likely due to its natural antioxidant content.
The proposed pretreatment and saponification process of UCOs appears effective in transforming a potentially polluting waste into a value-added and functional product. The addition of oregano and thyme EOs, characterized by GC-FID as rich in bioactive compounds such as carvacrol, thymol, p-cymene, and limonene, further enhanced the antimicrobial potential of the resulting soaps.
Antimicrobial testing indicated that the soaps exhibited moderate inhibitory effects against S. aureus and E. coli, with palm oil-based soaps showing the strongest activity, while sunflower oil-based soaps were the least effective. The antibacterial activity of all soaps was more effective against S. aureus than E. coli. All soaps worked better against S. aureus than E. coli, and adding essential oils made them even more effective. Commercial soap (Safeguard) showed the inhibition zones higher than in the soaps analyzed, reflecting its specific antibacterial formulation.
The study presents a circular economy model that converts waste into biodegradable, functional products, reducing pollution and promoting resource-efficient, low-carbon production. Our results suggest that UCOs can be valorized into sustainable soaps with antimicrobial activity, particularly when EOs are added. While these soaps may provide a potential eco-friendly and affordable hygiene solution, it should be noted that a detailed economic or environmental assessment was not performed. Furthermore, strict quality control, toxicological evaluation, and standardization of essential oil content are necessary to ensure safe use.
Author Contributions
Conceptualization, M.G. and M.L.V.; methodology, M.G.; software, M.G.; validation, S.G.Ş., M.-L.S. and I.K.; formal analysis, M.-L.S.; investigation, M.L.V.; resources, S.G.Ş.; data curation, S.G.Ş.; writing—original draft preparation, M.G.; writing—review and editing, M.-T.C.; visualization, I.K.; supervision, M.L.V.; project administration, M.G.; funding acquisition, M.-T.C. All authors have read and agreed to the published version of the manuscript.
Funding
This research received no external funding.
Institutional Review Board Statement
Not applicable.
Informed Consent Statement
Not applicable.
Data Availability Statement
Data are contained within the article.
Acknowledgments
We gratefully acknowledge Tiberius-Ilie Opruța, from Esentivia Company, Romania, for his valuable technical guidance and for generously providing the EOs. We also thank the students of the Faculty of Engineering, Hunedoara, for their assistance with oil sampling and the preliminary analysis of the oils, as well as the university canteen and local food business operators for their support in providing the oils.
Conflicts of Interest
The authors declare no conflicts of interest.
References
- Cárdenas, J.; Orjuela, A.; Sánchez, D.L.; Narváez, P.C.; Katryniok, B.; Clark, J. Pre-treatment of used cooking oils for the production of green chemicals: A review. J. Clean. Prod. 2021, 289, 125129. [Google Scholar] [CrossRef]
- The Environmental Impacts of Dumping Cooking Oil in the Ground. 2024. Available online: https://bsirecycling.com/blog/the-environmental-impacts-of-dumping-cooking-oil-in-the-ground/ (accessed on 25 May 2025).
- Sunartono; Lenggogeni; Handayani, I.D.; Setiawan, H.; Adiarso, A.; Nelly, A.; Hermawan, E.; Wijono, R.A.; Wicaksana, D.E.P.; Marsudi, A.; et al. Assessing Competitiveness and Sustainability of the Cooking Oil Industry through the Valuation of Eco-Efficiency on the Utilization of Spent Bleaching Earth. Case Stud. Chem. Environ. Eng. 2025, 11, 101176. [Google Scholar] [CrossRef]
- Hamdi, N.A.; Sha’arani, S.; Azman, N.F.; Mohd. Rafi, S.B.; Norsin, E.; Othman, N. Management of Waste Cooking Oil and Its Potential for Value-Added Materials: A Mini Review. IOP Conf. Ser. Earth Environ. Sci. 2022, 1091, 012054. [Google Scholar] [CrossRef]
- Lopresto, C.G.; De Paola, M.G.; Calabrò, V. Importance of the Properties, Collection, and Storage of Waste Cooking Oils to Produce High-Quality Biodiesel—An Overview. Biomass Bioenergy 2024, 189, 107363. [Google Scholar] [CrossRef]
- Tye, C.T. Recent Advances in Waste Cooking Oil Management and Applications for Sustainable Environment. In Handbook of Research on Resource Management for Pollution and Waste Treatment; Affam, A.C., Ezechi, E.H., Eds.; IGI Global: Hershey, PA, USA, 2020; pp. 47–63. [Google Scholar] [CrossRef]
- Okpo, S.O.; Edafiadhe, E.D. Unlocking the Power of Waste Cooking Oils for Sustainable Energy Production and Circular Economy: A Review. ABUAD J. Eng. Res. Dev. 2024, 7, 41–55. [Google Scholar] [CrossRef]
- Fortune Business Insights. Used Cooking Oil Market Size, Share & Industry Analysis by Source (Food Services and Households), by Application (Industrial Usage [Biofuels, Cosmetics, and Others] and Animal Feed), and Regional Forecast, 2025–2032. Available online: https://www.fortunebusinessinsights.com/used-cooking-oil-market-103665 (accessed on 1 September 2025).
- Phagare, M. Europe Used Cooking Oil Market Report 2025. Cognitive Market Research. Available online: https://www.cognitivemarketresearch.com/regional-analysis/europe-used-cooking-oil-market-report?utm_source=chatgpt.com (accessed on 21 April 2025).
- Council of the European Communities. Directive 75/439/EEC on the Disposal of Waste Oils. Available online: http://data.europa.eu/eli/dir/1975/439/oj (accessed on 1 June 2025).
- The European Parliament and the Council of the European Union. Directive 2008/98/EC on Waste (Waste Framework Directive). Available online: http://data.europa.eu/eli/dir/2008/98/oj (accessed on 11 August 2025).
- Azme, S.N.K.; Yusoff, N.S.I.M.; Chin, L.Y.; Mohd, Y.; Hamid, R.D.; Jalil, M.N.; Zaki, H.M.; Saleh, S.H.; Ahmat, N.; Manan, M.A.F.A.; et al. Recycling Waste Cooking Oil into Soap: Knowledge Transfer through Community Service Learning. Clean. Waste Syst. 2023, 4, 100084. [Google Scholar] [CrossRef]
- Ruiz, B.; Flotats, X. Citrus Essential Oils and Their Influence on the Anaerobic Digestion Process: An Overview. Waste Manag. 2014, 34, 2063–2079. [Google Scholar] [CrossRef]
- Zayed, L.; Gablo, N.; Kalcakova, L.; Dordevic, S.; Kushkevych, I.; Dordevic, D.; Tremlova, B. Utilizing Used Cooking Oil and Organic Waste: A Sustainable Approach to Soap Production. Processes 2024, 12, 1279. [Google Scholar] [CrossRef]
- Félix, S.; Araújo, J.; Pires, A.M.; Sousa, A.C. Soap Production: A Green Prospective. Waste Manag. 2017, 66, 190–195. [Google Scholar] [CrossRef] [PubMed]
- Lefebvre, X.; Paul, E.; Mauret, M.; Baptiste, P.; Capdeville, B. Kinetic Characterization of Saponified Domestic Lipid Residues Aerobic Biodegradation. Water Res. 1998, 32, 3031–3038. [Google Scholar] [CrossRef]
- Stănescu, V.-G.; Popescu, V.; Vasilache, V.; Popescu, G.; Rîmbu, C.M.; Popescu, A. Cleaner Processes for Making Laundry Soap from Vegetable Oils and an Essential Oil. Appl. Sci. 2025, 15, 3821. [Google Scholar] [CrossRef]
- Alves, J.O.; Franco, M.T.S.; Silva, P.P.; Malpass, G.R.P.; Okura, M.H.; Granato, A.C. Development of antimicrobial soaps using essential oil of Schinus terebinthifolius and Piper nigrum. Res. Soc. Dev. 2020, 9, 10328. [Google Scholar] [CrossRef]
- Miri, B.Y. Essential oils: Chemical composition and diverse biological activities: A comprehensive review. Nat. Prod. Commun. 2025, 20, 1. [Google Scholar] [CrossRef]
- Bostan, R.; Glevitzky, M.; Varvara, S.; Dumitrel, G.-A.; Rusu, G.I.; Popa, M.; Glevitzky, I.; Vică, M.L. Utilization of Natural Adsorbents in the Purification of Used Sunflower and Palm Cooking Oils. Appl. Sci. 2024, 14, 4417. [Google Scholar] [CrossRef]
- Aïder, M.; Martel, A.-A.; Ferracci, J.; de Halleux, D. Purification of Whole Brown Flaxseed Meal from Coloring Pigments by Treatment in Hydrogen Peroxide Solutions: Impact on Meal Color. Food Bioprocess Technol. 2012, 5, 3051–3065. [Google Scholar] [CrossRef]
- Antonić, B.; Dordević, D.; Jančíková, S.; Tremlova, B.; Kushkevych, I. Physicochemical Characterization of Home-Made Soap from Waste-Used Frying Oils. Processes 2020, 8, 1219. [Google Scholar] [CrossRef]
- ISO 3960:2017; Animal and Vegetable Fats and Oils—Determination of Peroxide Value—Iodometric (Visual) Endpoint Determination. SR (Romanian Standard). Romanian Standards Association: Bucharest, Romania, 2017.
- AOAC International Official Method. Iodine absorption number of oils and fats 1998.
- AOAC International Official Method. Determination of Acid Value 1995.
- STAS 3005-1:2013; ASRO. Vegetable Oils—Methods of Analysis—Part 1: Determination of Free Fatty Acids (FFA) by Titration with KOH Solution. Romanian Standards Association: Bucharest, Romania, 2013.
- AOCS Cd 2d-25; Kinematic Viscosity of Oils and Fats. American Oil Chemists’ Society: Urbana, IL, USA, 2009.
- 145/3-67; Vegetable Oils and Fats—Determination of Relative Density. Romanian Standards Association: Bucharest, Romania, 1967.
- AOAC 921.08Index of Refraction of Oils and Fats—AOAC Official Method; AOAC: San Diego, CA, USA, 1921.
- Opruța, T.; Tița, O. Studies on the Use of Essential Oils in Processing Food Products. J. Agroaliment. Process. Technol. 2022, 28, 397–399. [Google Scholar]
- AOAC International Official Method. 981.12—pH of Soaps and Detergents; AOAC International: Rockville, MD, USA, 2000. [Google Scholar]
- D4009-92(2023); Standard Guide for Foam Stability of Hand Dishwashing Detergents. ASTM International: West Conshohocken, PA, USA, 2023.
- Krüss Scientific. Ross-Miles Method—Foam Height and Stability of Surfactant Solutions; Krüss Scientific: Hamburg, Germany, 2023; Available online: https://www.kruss-scientific.com/en-US/know-how/glossary/ross-miles-method (accessed on 14 May 2025).
- AOAC International Official Method. 930.23—Total Fat in Foods; AOAC International: Rockville, MD, USA, 2000. [Google Scholar]
- CLSI M100; Performance Standards for Antimicrobial Susceptibility Testing. Clinical and Laboratory Standard Institute: Wayne, PA, USA, 2020. Available online: https://clsi.org/shop/standards/m100/ (accessed on 17 September 2025).
- Commission Regulation (EEC) No 2568/91 of 11 July 1991 on the Characteristics of Olive Oil and Olive-Residue Oil and on the Relevant Methods of Analysis. Off. J. Eur. Communities 1991, L248, 1–83. Available online: http://data.europa.eu/eli/reg/1991/2568/oj (accessed on 1 June 2025).
- Park, J.M.; Koh, J.H.; Kim, J.M. Determining the Reuse of Frying Oil for Fried Sweet and Sour Pork according to Type of Oil and Frying Time. Food Sci. Anim. Resour. 2020, 40, 785–794. [Google Scholar] [CrossRef]
- Codex Stan 33-1981; Codex Alimentarius Commission. Standard for Olive Oils and Olive-Pomace Oils. Codex Alimentarius Commission: Rome, Italy, 1981.
- Akoh, C.C.; Min, D.B. Food Lipids: Chemistry, Nutrition, and Biotechnology, 2nd ed.; Marcel Dekker, Inc.: New York, USA, 2008. [Google Scholar]
- Frankel, E.N. Lipid Oxidation, 2nd ed.; The Oily Press: Bridgwater, UK, 2012. [Google Scholar]
- Choe, E.; Min, D.B. Chemistry of deep-fat frying oils. J. Food Sci. 2007, 72, R77–R86. [Google Scholar] [CrossRef]
- Shahidi, F. (Ed.) Handbook of Antioxidants for Food Preservation; Woodhead Publishing: Cambridge, UK, 2015. [Google Scholar]
- Laachari, F.; Maâtaoui, H.; El Bergadi, F.; Boukir, A.; Ibnsouda, S.K. Improvement of a lipolytic activity assay protocol to increase the efficiency of the lipases activity measurement and validation by infrared spectroscopy. Afr. J. Biotechnol. 2015, 14, 12345–12355. [Google Scholar]
- Bettenhausen, C. Oil Majors Back Out of Biofuel in Europe. CEN Glob. Enterp. 2024, 102, 9. [Google Scholar] [CrossRef]
- Virtue Market Research. Europe Used Cooking Oil Market; Virtue Market Research: [Place of Publication]. 2024. Available online: https://virtuemarketresearch.com/report/europe-used-cooking-oil-market (accessed on 1 October 2025).
- Grand View Research. Europe Used Cooking Oil Market Size & Outlook, 2024–2030. Available online: https://www.grandviewresearch.com/horizon/outlook/used-cooking-oil-market/europe (accessed on 14 October 2025).
- Mordor Intelligence. Europe Bioplastics Market Size & Share Analysis—Growth Trends & Forecasts (2025–2030). Available online: https://www.mordorintelligence.com/industry-reports/european-bioplastics-market-industry (accessed on 14 October 2025).
- Polymeer Project. Bioplastics Trends in 2024. Available online: https://polymeerproject.eu/bioplastics-trends-2024/ (accessed on 14 October 2025).
- Pitman, S. Cooking Oil Waste May Become Next Generation Biosurfactants. CosmeticsDesign.com. Available online: https://www.cosmeticsdesign.com/Article/2007/02/21/cooking-oil-waste-may-become-next-generation-biosurfactants/ (accessed on 14 October 2025).
- Octarya, Z.; Yenti, E.; Utami, L.; Yusbarina. Sustainable Solid Soap Production Using Recycled Cooking Oil with Ecoenzyme and Lemongrass Extract. Acta Biochim. Indones. 2025, 8, 191. [Google Scholar] [CrossRef]
- Oparanti, S.O.; Obebe, E.O.; Fofana, I.; Jafari, R. A State-of-the-Art Review on the Potential of Waste Cooking Oil as a Sustainable Insulating Liquid for Green Transformers. Appl. Sci. 2025, 15, 7631. [Google Scholar] [CrossRef]
- Longobardi, F.; Contillo, F.; Catucci, L.; Tommasi, L.; Caponio, F.; Paradiso, V.M. Analysis of Peroxide Value in Olive Oils with an Easy and Green Method. Food Control 2021, 130, 108295. [Google Scholar] [CrossRef]
- Popa, M.; Glevitzky, I.; Dumitrel, G.-A.; Glevitzky, M.; Popa, D. Study on Peroxide Values for Different Oils and Factors Affecting the Quality of Sunflower Oil. Land Reclam. Earth Obs. Surv. Environ. Eng. 2017, VI, 137–140. [Google Scholar]
- Salek, R.N.; Burešová, I.; Kráčmar, S.; Lorencová, E.; Zálešáková, L.; Dabash, V. Evaluation of Selected Physicochemical Parameters of Extra Virgin Olive Oil Commercialized in the Czech Market and Stored over a Period of 5 Months. Potravin. Slovak J. Food Sci. 2017, 11, 664–672. [Google Scholar] [CrossRef][Green Version]
- Kumar, A.; Bhayana, S.; Singh, P.K.; Tripathi, A.D.; Paul, V.; Balodi, V.; Agarwal, A. Valorization of used cooking oil: Challenges, current developments, life cycle assessment and future prospects. Discov. Sustain. 2025, 6, 119. [Google Scholar] [CrossRef]
- Judijanto, L. From waste to renewable source: A review of used cooking oil’s role in sustainable energy systems. Rev. Acadêmica Online 2025, 11, e1562. [Google Scholar] [CrossRef]
- Ma, F.; Hanna, M.A. Biodiesel production: A review. Bioresour. Technol. 1999, 70, 1–15. [Google Scholar] [CrossRef]
- Sharma, Y.C.; Singh, B.; Upadhyay, S.N. Advancements in development and characterization of biodiesel: A review. Fuel 2008, 87, 2355–2373. [Google Scholar] [CrossRef]
- Anil, N.; Rao, P.K.; Sarkar, A.; Kubavat, J.; Vadivel, S.; Manwar, N.R.; Paul, B. Advancements in sustainable biodiesel production: A comprehensive review of bio-waste derived catalysts. Energy Convers. Manag. 2024, 318, 118884. [Google Scholar] [CrossRef]
- Beghetto, V. Waste Cooking Oils into High-Value Products: Where Is the Industry Going? Polymers 2025, 17, 887. [Google Scholar] [CrossRef] [PubMed]
- Chung, Z.L.; Tan, Y.H.; Chan, Y.S.; Kansedo, J.; Mubarak, N.M.; Ghasemi, M.; Abdullah, M.O. Life cycle assessment of waste cooking oil for biodiesel production using waste chicken eggshell derived CaO as catalyst via transesterification. Biocatal. Agric. Biotechnol. 2019, 21, 101317. [Google Scholar] [CrossRef]
- Ahadito, B.R.; Afriani, S.R. Soap Production from Waste Cooking Oil: A Review. Indones. J. Fundam. Appl. Chem. 2023, 9, 96. [Google Scholar] [CrossRef]
- Hendi, E.S.; Rusdi, R.; Nur Alam, B.; Nurbaeti, S. Purification of Used Cooking Oil by Alkali Neutralization and Bleaching of Bayah Natural Zeolite. J. Bahan Alam Terbarukan 2021, 10, 36–42. [Google Scholar] [CrossRef]
- Hailemariam, T. Production of Acid-Activated Bleaching Earth from Bentonite Clay for Edible Oil Bleaching. Int. J. Sci. Environ. 2025, 5, 70–79. [Google Scholar] [CrossRef]
- Miyagi, A.; Nakajima, M. Regeneration of Used Frying Oils Using Adsorption Processing. J. Am. Oil Chem. Soc. 2003, 80, 91–96. [Google Scholar] [CrossRef]
- Nikolopoulos, I.; Kogkos, G.; Tsavatopoulou, V.D.; Kordouli, E.; Bourikas, K.; Kordulis, C.; Lycourghiotis, A. Nickel—Alumina Catalysts for the Transformation of Vegetable Oils into Green Diesel: The Role of Preparation Method, Activation Temperature, and Reaction Conditions. Nanomaterials 2023, 13, 616. [Google Scholar] [CrossRef]
- Haryanto, B.; Nasution, I.T.; Polem, A.F.; Tambun, R.; Alexander, V. Natural Adsorbent of Corncob (Zea mays L.) Powder Capability in Purification of Used Cooking Oil with Shaking Operation Based on Turbidity. Results Eng. 2023, 19, 101233. [Google Scholar] [CrossRef]
- Daniel, A.B.; Zahir, E.; Asghar, M.A. On the Practicability of a New Bio-Sorbent: Lasani Sawdust and Coconut Coir for Cleanup of Oil Spilled on Water. Petrol. Sci. Technol. 2019, 37, 1143–1154. [Google Scholar] [CrossRef]
- Adou, A.I.; Brelle, L.; Marote, P.; Sylvestre, M.; Cebriàn-Torrejòn, G.; Nomede-Martyr, N. Physicochemical Properties of Coconut and Waste Cooking Oils for Biofuel Production and Lubrication. Fuels 2025, 6, 57. [Google Scholar] [CrossRef]
- Gharby, S. Refining Vegetable Oils: Chemical and Physical Refining. Sci. World J. 2022, 2022, 6627013. [Google Scholar] [CrossRef]
- Wahyudi, A.; Sitrous, B.; Hidayat, F. Kinetic Analysis of Saponification Reaction in Eco-Friendly Soap Production Based on Waste Cooking Oil. Hydrog. J. Kependidikan Kim. 2025, 13, 713–723. Available online: https://e-journal3.undikma.ac.id/index.php/hydrogen/article/view/14828 (accessed on 1 October 2025).
- Foo, W.H.; Koay, S.S.N.; Tang, D.Y.Y.; Chia, W.Y.; Chew, K.W.; Show, P.L. Safety Control of Waste Cooking Oil: Transforming Hazard into Multifarious Products with Available Pre-Treatment Processes. Food Mater. Res. 2022, 2, 1. [Google Scholar] [CrossRef]
- Mustakim, M.; Taufik, R.; Trismawati, T. The Utilization of Waste Cooking Oil as a Material of Soap. J. Degrad. Res. 2020, 4, 114. [Google Scholar] [CrossRef]
- Cruz, A.P.M.; Nishimura, F.G.; Santos, V.C.O.d.; Steling, E.G.; Von Zeska Kress, M.R.; Marins, M.; Fachin, A.L. Essential Oil-Based Soap with Clove and Oregano: A Promising Antifungal and Antibacterial Alternative against Multidrug-Resistant Microorganisms. Molecules 2024, 29, 4682. [Google Scholar] [CrossRef]
- Walasek-Janusz, M.; Grzegorczyk, A.; Malm, A.; Nurzyńska-Wierdak, R.; Zalewski, D. Chemical Composition, and Antioxidant and Antimicrobial Activity of Oregano Essential Oil. Molecules 2024, 29, 435. [Google Scholar] [CrossRef] [PubMed]
- Laghmouchi, Y.; Belmehdi, O.; Senhaji, N.S.; Abrini, J. Chemical Composition and Antibacterial Activity of Origanum compactum Benth. Essential Oils from Different Areas at Northern Morocco. S. Afr. J. Bot. 2018, 115, 120–125. [Google Scholar] [CrossRef]
- Nostro, A.; Papalia, T. Antimicrobial Activity of Carvacrol: Current Progress and Future Prospectives. Recent Pat. Anti-Infect. Drug Discov. 2012, 7, 28–35. [Google Scholar] [CrossRef]
- Balahbib, A.; El Omari, N.; Hachlafi, N.E.; Lakhdar, F.; El Menyiy, N.; Salhi, N.; Naceiri Mrabti, H.; Bakrim, S.; Zengin, G.; Bouyahya, A. Health Beneficial and Pharmacological Properties of p-Cymene. Food Chem. Toxicol. 2021, 153, 112259. [Google Scholar] [CrossRef] [PubMed]
- Kim, Y.W.; Kim, M.J.; Chung, B.Y.; Bang, D.Y.; Lim, S.K.; Choi, S.M.; Lim, D.S.; Cho, M.C.; Yoon, K.; Kim, H.S.; et al. Safety Evaluation and Risk Assessment of d-Limonene. J. Toxicol. Environ. Health Part B 2013, 16, 17–38. [Google Scholar] [CrossRef] [PubMed]
- Marchese, A.; Orhan, I.E.; Daglia, M.; Barbieri, R.; Di Lorenzo, A.; Nabavi, S.F.; Gortzi, O.; Izadi, M.; Nabavi, S.M. Antibacterial and Antifungal Activities of Thymol: A Brief Review of the Literature. Food Chem. 2016, 210, 402–414. [Google Scholar] [CrossRef] [PubMed]
- Özbek, H.; Yılmaz, B.S. Anti-inflammatory and Hypoglycemic Activities of Alpha-pinene. Acta Pharm. Sci. 2017, 55, 4. [Google Scholar] [CrossRef]
- Salehi, B.; Upadhyay, S.; Orhan, I.E.; Jugran, A.K.; Jayaweera, S.L.D.; Dias, D.A.; Sharopov, F.; Taheri, Y.; Martins, N.; Baghalpour, N.; et al. Therapeutic Potential of α- and β-Pinene: A Miracle Gift of Nature. Biomolecules 2019, 9, 738. [Google Scholar] [CrossRef]
- Imelouane, B.; Amhamdi, H.; Wathelet, J.P.; Ankit, M.; Khedid, K.; El Bachiri, A. Chemical Composition and Antimicrobial Activity of Essential Oil of Thyme (Thymus vulgaris) from Eastern Morocco. Int. J. Agric. Biol. 2009, 11, 205–208. [Google Scholar]
- Lin, H.; Li, Z.; Sun, Y.; Zhang, Y.; Wang, S.; Zhang, Q.; Cai, T.; Xiang, W.; Zeng, C.; Tang, J. D-Limonene: Promising and Sustainable Natural Bioactive Compound. Appl. Sci. 2024, 14, 4605. [Google Scholar] [CrossRef]
- Espina, L.; Gelaw, T.K.; de Lamo-Castellví, S.; Pagán, R.; García-Gonzalo, D. Mechanism of Bacterial Inactivation by (+)-Limonene and Its Potential Use in Food Preservation Combined Processes. PLoS ONE 2013, 8, e56769. [Google Scholar] [CrossRef]
- Nova, J.F.; Smrity, S.Z.; Hasan, M.; Tariquzzaman, M.; Hossain, M.A.A.; Islam, M.T.; Islam, M.R.; Akter, S.; Rahi, M.S.; Joy, M.T.R.; et al. Comprehensive Evaluation of Physico-Chemical, Antioxidant, and Antimicrobial Properties in Commercial Soaps: A Study on Bar Soaps and Liquid Hand Wash. Heliyon 2025, 11, e41614. [Google Scholar] [CrossRef]
- Butron, W.; Gaikwad, J. An In Vitro Analysis of the Efficacy of Selected Bar Soaps as Antibacterial Agents. Bios 2009, 80, 66–75. [Google Scholar] [CrossRef]
- Obi, C.N. Antibacterial Activities of Some Medicated Soaps on Selected Human Pathogens. Am. J. Microbiol. Res. 2014, 2, 178–181. [Google Scholar] [CrossRef]
- Aliyu, M.S.; Tijjani, M.B.; Doko, M.H.I.; Garba, I.; Ibrahim, M.M.; Abdulkadir, S.M.; Abba, D.; Zango, U.U. Antimicrobial Activity of Sabulun Salo, a Local Traditional Medicated Soap. Niger. J. Basic Appl. Sci. 2012, 20, 35–38. [Google Scholar]
- Da Rocha-Filho, P.A.; Maruno, M.; Ferrari, M.; Topan, J.F. Liquid Crystal Formation from Sunflower Oil: Long Term Stability Studies. Molecules 2016, 21, 680. [Google Scholar] [CrossRef]
- Qu, E. The Ratio of Linoleic to Oleic Acid in Sunflower Oil, and Its Effects on Bacterial Growth. J. Student Res. 2022, 10, 4. [Google Scholar] [CrossRef]
- Bucciantini, M.; Leri, M.; Nardiello, P.; Casamenti, F.; Stefani, M. Olive Polyphenols: Antioxidant and Anti-Inflammatory Properties. Antioxidants 2021, 10, 1044. [Google Scholar] [CrossRef] [PubMed]
- Monterrubio-López, G.P.; Mendieta-Pérez, C.C.; Santiago-Carrillo, M.; Monterrubio-López, R. Antimicrobial Effect of Olive and Sunflower Oils Determined by Microbial Challenge. J. Basic Biomed. Res. 2023, 7, 1–7. [Google Scholar] [CrossRef]
- Pote, N.N. Evaluation of Physical Properties of Liquid Soap Preparations from Virgin Coconut Oil (VCO) and Coconut Oil (CO). Strada J. Pharm. 2019, 1, 1–8. Available online: https://www.thesjp.org/index.php/SJP/article/view/119 (accessed on 2 October 2025).
- ISO 22716:2007; Cosmetics—Good Manufacturing Practices (GMP)—Guidelines on Good Manufacturing Practices. International Organization for Standardization: Geneva, Switzerland, 2007.
- European Commission. Regulation (EC) No 1223/2009 of the European Parliament and of the Council on Cosmetic Products; Official Journal of the European Union: Luxembourg, 2009. [Google Scholar]
- Sakamoto, K.; Lochhead, R.Y.; Maibach, H.I.; Yamashita, Y. (Eds.) Cosmetic Science and Technology: Theoretical Principles and Applications, 1st ed.; Elsevier: Amsterdam, The Netherlands, 2017. [Google Scholar]
- Draelos, Z.D. (Ed.) Cosmetic Dermatology: Products and Procedures, 3rd ed.; Wiley-Blackwell: Hoboken, NJ, USA, 2022. [Google Scholar]
- Loizides, M.I.; Loizidou, X.I.; Orthodoxou, D.L.; Petsa, D. Circular Bioeconomy in Action: Collection and Recycling of Domestic Used Cooking Oil through a Social, Reverse Logistics System. Recycling 2019, 4, 16. [Google Scholar] [CrossRef]
Disclaimer/Publisher’s Note: The statements, opinions and data contained in all publications are solely those of the individual author(s) and contributor(s) and not of MDPI and/or the editor(s). MDPI and/or the editor(s) disclaim responsibility for any injury to people or property resulting from any ideas, methods, instructions or products referred to in the content. |
© 2025 by the authors. Licensee MDPI, Basel, Switzerland. This article is an open access article distributed under the terms and conditions of the Creative Commons Attribution (CC BY) license (https://creativecommons.org/licenses/by/4.0/).