Article

Automated Modeling Method and Strength Analysis of Irregular Deformation of Floating Roof Caused by Welding—Taking Double-Layer Floating Roof Storage Tanks as an Example

by
Chunyang Li
1,2,
Yuanyuan Jiang
3,
Luyang Zhang
2,
Wei Guan
1,2 and
Yan Zhou
2,*
1
Zhengzhou Research Institute, Harbin Institute of Technology, Zhengzhou 450000, China
2
Department of Astronautics and Mechanics, Harbin Institute of Technology, Harbin 150001, China
3
Beijing Institute of Control Engineering, Beijing 100190, China
*
Author to whom correspondence should be addressed.
Appl. Sci. 2025, 15(21), 11473; https://doi.org/10.3390/app152111473
Submission received: 5 September 2025 / Revised: 5 October 2025 / Accepted: 23 October 2025 / Published: 27 October 2025
(This article belongs to the Section Applied Industrial Technologies)

Abstract

The external floating roof of a large storage tank directly covers the liquid surface as the liquid level rises and falls, enhancing the tank’s safety and environmental performance. It is fabricated from thin SA516 Gr.70 steel plates, with a carbon equivalent of 0.37% calculated according to AWS standards, using single-sided butt welding. Such plates are susceptible to welding-induced deformations, resulting in irregular warping of the bottom plate. Current research on floating roofs for storage tanks mostly relies on idealized models that assume no deformation, thereby neglecting the actual deformation characteristics of the floating roof structure. To address this, the present study develops an automated modeling approach that reconstructs a three-dimensional floating roof model based on measured deformation data, accurately capturing the initial irregular geometry of the bottom plate. This method employs parametric numerical reconstruction and automatic finite element model generation techniques, enabling efficient creation of the irregular initial deformation caused by welding of the floating roof bottom plate and its automatic integration into the finite element analysis process. It overcomes the inefficiencies, inconsistent accuracy, and challenges associated with traditional manual modeling when conducting large-scale strength analyses under in-service conditions. Based on this research, a strength analysis of the deformed floating roof structure was conducted under in-service conditions, including normal floating, extreme rainfall, and outrigger contact scenarios. An idealized geometric model was also established for comparative analysis. The results indicate that under the normal floating condition, the initial irregular deformation increases the local stress peak of the floating roof bottom plate by 19%, while the maximum positive and negative displacements increase by 22% and 83%, respectively. Under extreme uniform rainfall conditions, it raises the stress peak of the bottom plate by 24%, with maximum positive and negative displacements increasing by 21% and 28%, respectively. Under the extreme non-uniform rainfall condition, it significantly elevates the stress peak of the bottom plate by 227%, and the maximum positive and negative displacements increase by 45% and 47%, respectively. Under the outrigger bottoming condition, it increases the local stress peak of the bottom plate by 25%, with maximum positive and negative displacements remaining similar. The initial irregular deformation not only significantly amplifies the stress and displacement responses of the floating roof bottom plate but also intensifies the deformation response of the top plate through structural stiffness weakening and deformation coupling, thereby reducing the safety margin of the floating roof structure. This study fills the knowledge gap regarding the effect of welding-induced irregular deformation on floating roof performance and provides a validated workflow for automated modeling and mechanical assessment of large-scale welded steel structures.

1. Introduction

Floating roof storage tanks are widely used for storing petroleum and volatile liquids because they effectively reduce evaporation losses and fire risks [1,2], while offering strong safety and economic performance. These tanks are essential storage equipment in the petrochemical industry [3]. With the expansion of oil pipelines and large-scale storage facilities, floating roof tanks have grown in size and structural complexity, making safety a critical consideration throughout their design, operation, and maintenance [4]. Floating roof structures are classified into single-plate and double-plate types. Compared to single-plate floating roofs, double-plate floating roofs feature trusses and partitions between the upper and lower decks, which enhance their overall bending section modulus and load-bearing capacity [5]. The bottom plate of a double-deck floating roof is typically composed of thin steel plates with a large surface area and dense weld distribution [6]. Additionally, due to the numerous floating roof accessories and significant rigidity constraints, the bottom plate is susceptible to thin-plate instability deformation after welding, which appears as irregular wavy distortions [7]. Floating roof deformation can impede drainage and cause localized liquid accumulation, increasing the risk of overload. It may also compromise the sealing system, leading to gas leakage, reduced containment efficiency, elevated evaporation losses, and heightened fire hazards [8,9]. Furthermore, severe deformation can impair the normal raising and lowering of the floating roof, compromising its safe operation. In extreme cases, it may cause the roof to become stuck, tilted, or unstable, thereby threatening the tank‘s safety and reliability during service and posing significant challenges to its safe operation and management [10,11]. Existing research [12,13,14,15] on the deformation of storage tanks has largely focused on the tank shell itself, with comparatively little attention paid to the deformation of the floating roof. This imbalance limits the understanding of how floating roof deformations influence the overall structural performance, stress distribution, and operational safety under service conditions.
Currently, most scholars’ research on floating roof structures relies on idealized models [16,17,18,19], with limited analysis of actual initial irregular deformations. Consequently, related research remains relatively insufficient. Noaman et al. [20] applied five different cumulative rainfall loads to a single-layer floating roof and compared the structural stress and deflection using three distinct analysis methods. However, they did not consider the effect of the initial deformation of the bottom plate on the static load response, making it difficult to accurately evaluate the stress characteristics and safety margin of the floating roof structure under actual service conditions. Goudarzi et al. [21] developed a numerical method incorporating fluid–structure interaction and geometric details of a double-layer floating roof tank. They studied the effect of geometric nonlinearity on the seismic response of the double-layer floating roof and proposed a practical seismic design method for evaluating dynamic stress in the tank. Nevertheless, their numerical model did not account for the initial irregular deformation of the bottom plate caused by welding, limiting its ability to fully represent the actual deformation state of the floating roof during service and its potential impact on seismic performance. At the same time, existing experimental studies [22,23,24,25] primarily focus on the dynamic stability of floating roofs under earthquake or liquid sloshing conditions. However, the quantitative evaluation of structural strength and safety margins under normal service conditions remains insufficient.
There are still two major challenges in researching this type of problem. First, irregular initial deformations frequently arise during manufacturing and assembly due to uneven welding heat input, assembly errors, and local rigid constraints [26]. Second, it remains unclear whether these initial irregular deformations affect the strength performance of the floating roof structure and how such changes impact the safety margin under various service conditions [27]. Additionally, the complex geometric characteristics pose significant challenges for numerical modeling, mesh generation, and constraint application. Recent advances in high-precision laser scanning, unmanned aerial vehicle (UAV) photogrammetry, point-cloud processing, and automated mesh generation have greatly accelerated the digitalization of large above-ground storage tanks (ASTs) and their floating roofs. UAV- and TLS-based data acquisition has been increasingly adopted to capture the global geometry of floating roofs and tank shells, enabling rapid reconstruction of three-dimensional models and supporting real-time structural monitoring and risk assessment. For instance, Priyadarshan et al. [28] developed a UAV-based digital-twin framework that converts dense point-cloud data into parametric models of floating roofs, which are subsequently used for deformation tracking and reliability evaluation. Despite these advances, a fully automated workflow that integrates geometry reconstruction, boundary condition recognition, nonlinear material modeling, and coupled load case analysis for floating roof structures remains largely unexplored.
Systematic quantitative research and engineering validation are currently lacking. Some scholars have conducted relevant research from various perspectives. Omari et al. [29] employed finite element analysis to investigate the relationship between tank bottom settlement and floating roof deformation when the floating roof was in a static position. They also measured the extent of the floating roof’s protrusion. The results were compared with the finite element analysis outcomes, confirming the feasibility of numerical methods for addressing the coupled deformation problem caused by settlement. Chen et al. [30] investigated the relationship between pressure distribution and liquid height for double-layer floating roofs at various levels. They developed a large-deformation finite element model, applied the pressure distribution to the top plate, and obtained the overall displacement, deformation, and stress. An engineering calculation method was proposed for effectively analyzing the strength and stability of double-layer floating roofs under wind loading. Although these studies address the deformation problem of the floating roof bottom plate, they primarily rely on idealized geometric models and do not systematically account for the initial irregular deformation caused by welding in their numerical simulations.
In addition to geometric imperfections introduced during fabrication, environmental actions such as intense rainfall and strong winds can significantly influence the performance and safety of floating roofs under service conditions. Bernier et al. [27] performed a fragility assessment of single-deck floating roofs subjected to various cumulative rainfall scenarios and demonstrated that localized ponding of rainwater can induce excessive deflection and stress concentration, increasing the risk of roof sinking or collapse. Their results highlight the importance of roof drainage capacity and surrounding site drainage in mitigating rainfall-induced failures. Similarly, Qin et al. [31] proposed a multi-hazard framework combining rainfall ponding, wind loading, and seismic actions, showing that the interaction between these loads can substantially increase the probability of floating roof failure. These findings suggest that a reliable safety evaluation of floating roof structures should account for extreme environmental conditions and combined load cases, rather than relying solely on idealized static models.
In this study, the floating roof is fabricated from fine-grain carbon–manganese pressure vessel steel SA516 Gr.70, in accordance with ASME SA-516/SA-516M-2021 [32]. The material exhibits a minimum yield strength of 260 MPa, a tensile strength in the range of 485–620 MPa, and an elongation not less than 21%, ensuring good toughness and weldability. Its calculated carbon equivalent is approximately 0.37%, which falls within the range of steels considered to possess good weldability. The plates used in this work have a thickness of 5–6 mm, and the annular plates and radial plates of the floating roof are joined using single-side butt welding. Gas metal arc welding is employed with a controlled heat input of 10–15 kJ/cm to minimize residual stresses.
Despite the growing adoption of double-layer floating roof tanks in large-scale oil and gas storage and transportation projects, there is currently a lack of standardized methods for assessing the static performance of floating roof structures subjected to geometric deformations caused by welding processes. Consequently, there is an urgent need to develop repeatable and efficient automated modeling and numerical analysis techniques based on measured initial deformation data. Based on this, the primary objectives of this study are to (1) develop an automated modeling method that can accurately simulate the initial irregular deformation of double-layer floating roof structures caused by welding, and (2) systematically evaluate the effects of such deformations on the static performance and stress distribution of floating roofs under typical service conditions, including normal floating, extreme rainfall, and outrigger bottoming. The findings are intended to provide practical guidance for improving the design, safety assessment, and operation of large-scale floating roof storage tanks.

2. Materials and Methods

2.1. Bottom Plate Deformation Data Measurement

In actual service, the floating roof bottom plate inevitably exhibits irregular initial geometric deformation. This deformation mainly arises from the combined effects of welding residual stress, assembly errors, local rigid constraints, and temperature and load fluctuations during long-term operation [19]. Figure 1 presents the actual irregular deformation pattern of the floating roof bottom plate, as determined by on-site measurements. The figure clearly shows wavy undulations on the bottom plate, illustrating the complex geometric deformation resulting from the welding process. Therefore, it is essential to use measured data to identify and quantitatively analyze the initial deformation of the floating roof bottom plate. This approach enables accurate capture of the structure’s actual deformation mode.
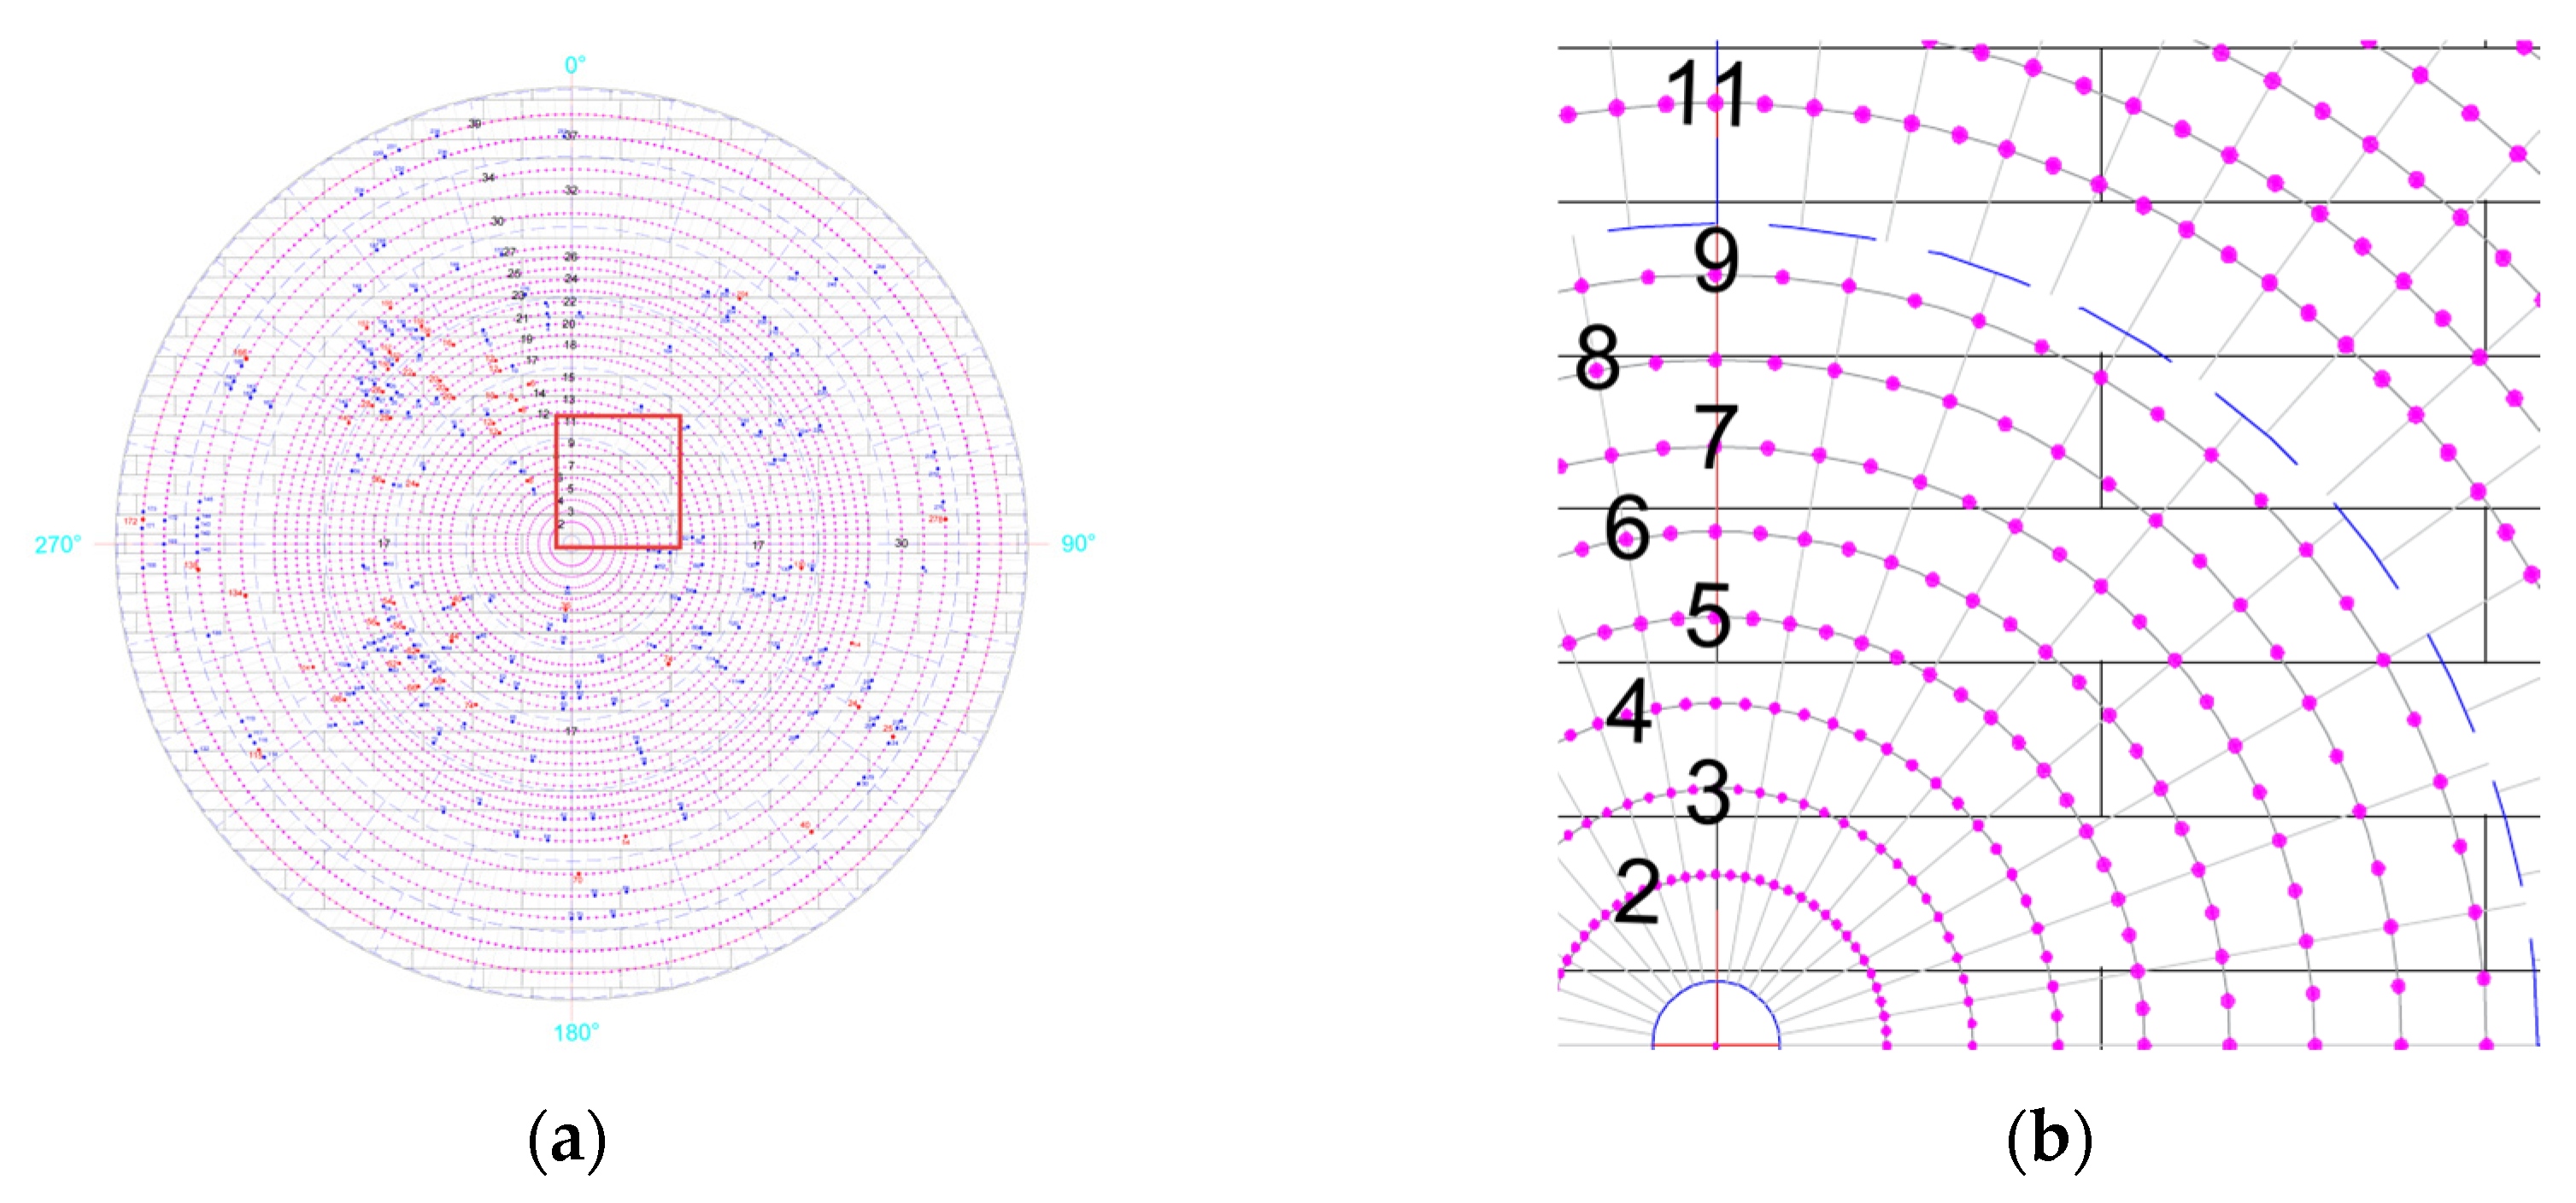
To accurately measure the deformation of the floating roof structure’s bottom plate and precisely restore its initial irregular shape, this paper systematically organizes the measurement process. Figure 2 illustrates the layout of the measurement points on the bottom plate. The bottom plate is divided into six annular measurement zones, each corresponding to a structural ring. Within each zone, concentric circular lines of varying radii are defined, and measurement points are evenly spaced along these lines. This arrangement provides a systematic and detailed coverage of the entire bottom plate, ensuring that deformations are measured consistently across all regions. This systematic arrangement allows for a comprehensive and high-resolution assessment of the actual deformation across the entire bottom plate, facilitating accurate identification of local and global deformation patterns induced by welding.
Figure 2b illustrates the first annular region. In this region, eight circular measurement lines are evenly spaced from 2 m to 9 m from the center, totaling 576 measurement points. The arrangement of measurement points for the remaining annular regions is shown in Table 1, with a total of 4944 measurement points. The dense and systematic placement of these points ensures comprehensive coverage of the bottom plate surface, enabling precise mapping of the spatial deformation pattern and facilitating a thorough understanding of the plate’s geometric variations.
For data processing and spatial modeling, a two-dimensional coordinate system is established by defining a horizontal line through the center of the baseplate as the x-axis. Since the measurement points are evenly distributed along the circular line, their two-dimensional coordinates can be determined through geometric calculations. By combining these positions with the height coordinates of each measurement point, obtained via laser measurement and reflecting uneven deformation, the three-dimensional coordinates of all points can be reconstructed.
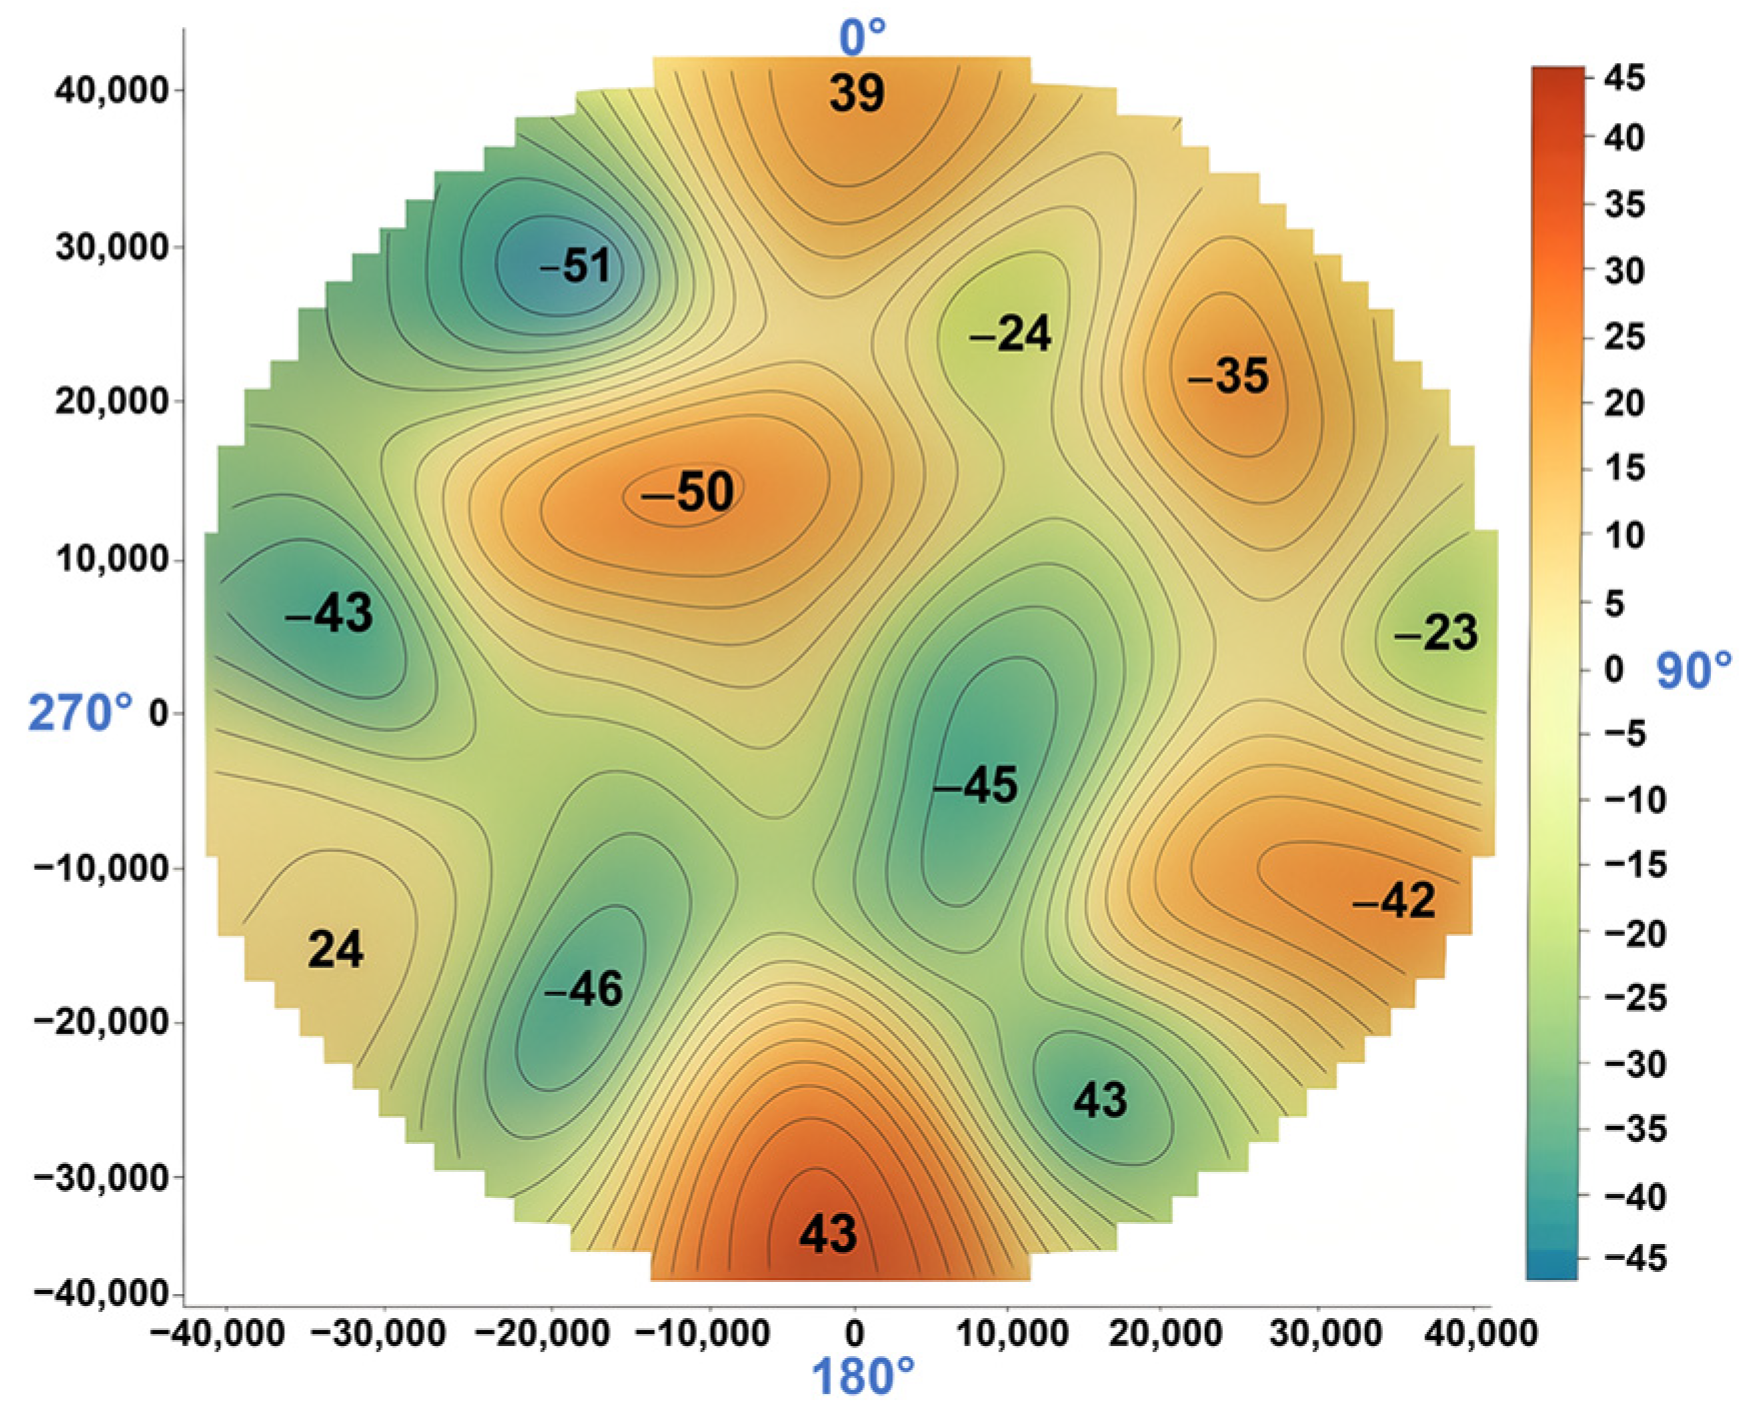
Figure 3 presents a 3D deformation cloud map of the floating roof bottom plate, generated from data collected at 4944 measurement points. This map clearly illustrates distinct wave-like undulations and localized warping across different areas of the floating roof bottom plate, highlighting its complex and irregular geometric deformation. Overall, deformation is more pronounced near the edges, with some regions exhibiting significant bulging or concavity. These measurement data accurately capture the initial geometric deformation of the bottom plate during manufacturing and installation, providing precise and reliable model data for subsequent finite element modeling and mechanical analysis based on the actual initial deformation state.

2.2. Floating Roof Automation Modeling

In actual service, the bottom plates of floating roofs often exhibit large-scale initial irregular deformations, with deformation points distributed sporadically and lacking clear patterns. This makes traditional manual modeling of measured deformation data significantly challenging. Adjusting node coordinates point by point is not only labor-intensive and inefficient but also prone to human error, making it difficult to ensure consistency between the finite element model and the measured shape. Consequently, this affects the accuracy and reliability of the analysis results.
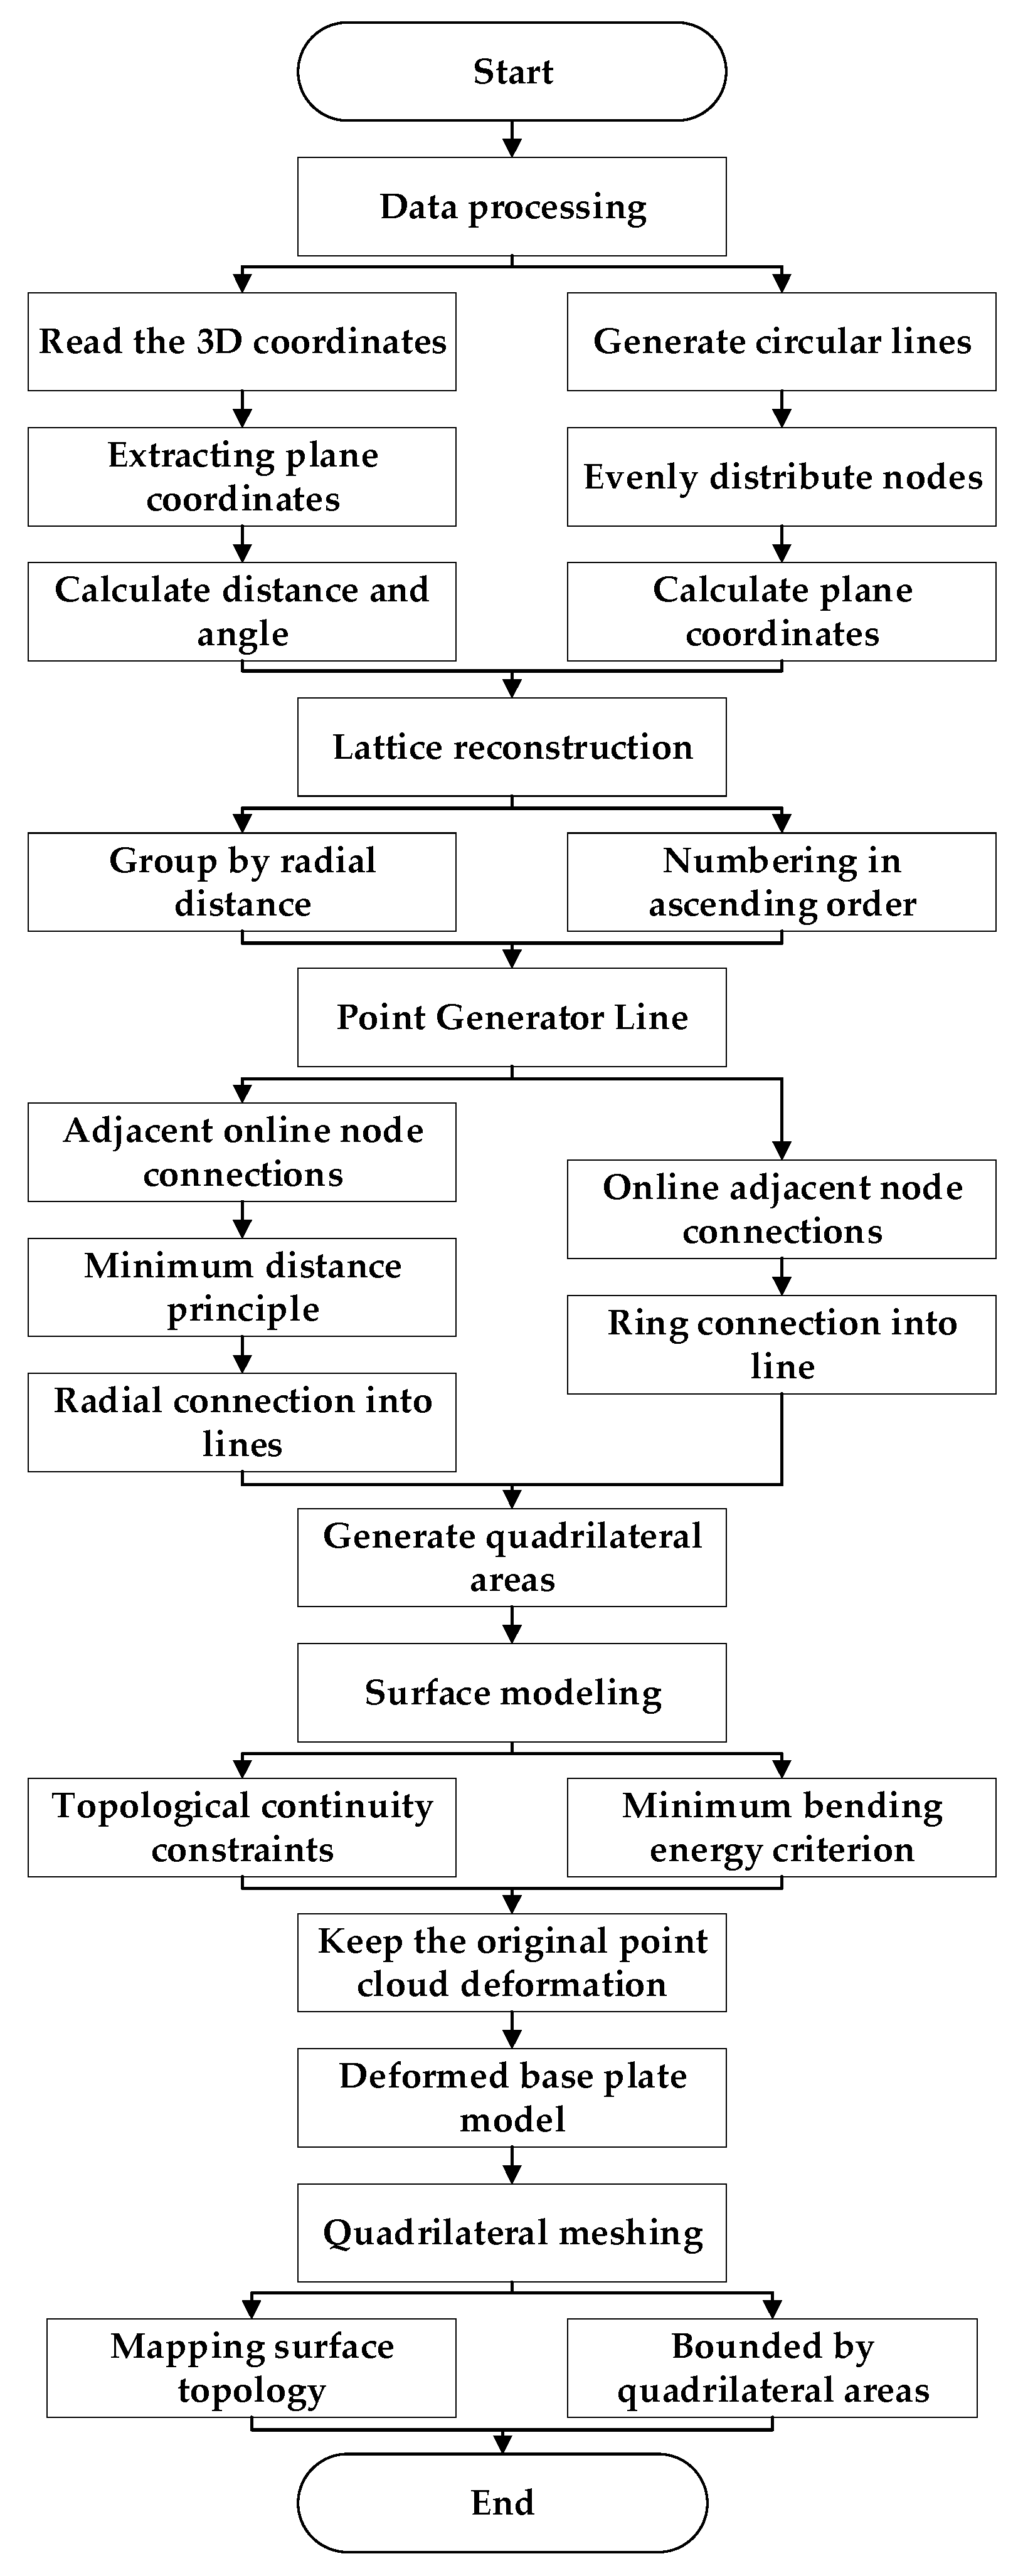
To address these issues, this paper presents an automated modeling program that rapidly reconstructs a finite element model of the floating roof bottom plate using measured deformation data. Figure 4 illustrates the key steps of this automated modeling process, including data preprocessing, point–line relationship construction, and surface reconstruction. This approach provides efficient and reliable modeling support for structural analysis based on measured morphology.
The program features automatic reading of measured point data, construction of geometric topological relationships, and surface fitting modeling. These capabilities significantly enhance modeling efficiency, eliminate manual intervention, and ensure high consistency between the finite element analysis geometric input and the measured data. The program first reads the 3D coordinates of the measured points, automatically extracts their planar components, and calculates each point’s radial distance from the center of the baseplate as well as its angle relative to the horizontal axis. To manage grid transitions within annular regions, auxiliary circular measuring lines are established at their intersections, with nodes evenly spaced along these lines. The number of nodes equals the sum of the nodes on the adjacent inner and outer measuring lines. Planar coordinates are determined based on the distribution of polar angles, while height coordinates are uniformly set to zero. All measuring points are organized from the inside out according to the circular measuring lines they belong to and sorted in ascending order by angle to form a standardized lattice structure.
During the node pairing process, the program applies the minimum distance principle to sequentially match nodes on the inner and outer adjacent circular measurement lines. It then constructs connecting lines to generate continuous, closed quadrilateral mesh units layer by layer, enabling automatic regional division of the measurement point set. Based on the generated quadrilateral mesh structure, the program employs a “line-generated surface” algorithm, combined with topological continuity and minimum bending energy criteria, to automatically fit and generate a smooth surface model. This approach ensures natural transitions between regions and accurately captures the surface morphology reflecting the original point cloud’s deformation characteristics. Building on this, the program further performs finite element discretization by using a method that integrates structural topology and spatial mapping. It automatically generates corresponding four-node shell elements within each quadrilateral area, ensuring node consistency and mesh quality. This process results in a high-quality finite element model of the floating roof bottom plate, accurately representing its irregular corrugation and warping features.
For the roof, the program follows the same basic logic as the base plate modeling but does not incorporate measured deformation data. Instead, nodes are directly arranged within the plane to generate a smooth, regular roof geometry. This approach simplifies the modeling process and provides a unified, clear reference for subsequent response comparisons with the base plate model. Consequently, both the base and roof plates of floating roof structures have achieved automated modeling driven by raw data, significantly improving modeling efficiency and structural consistency.
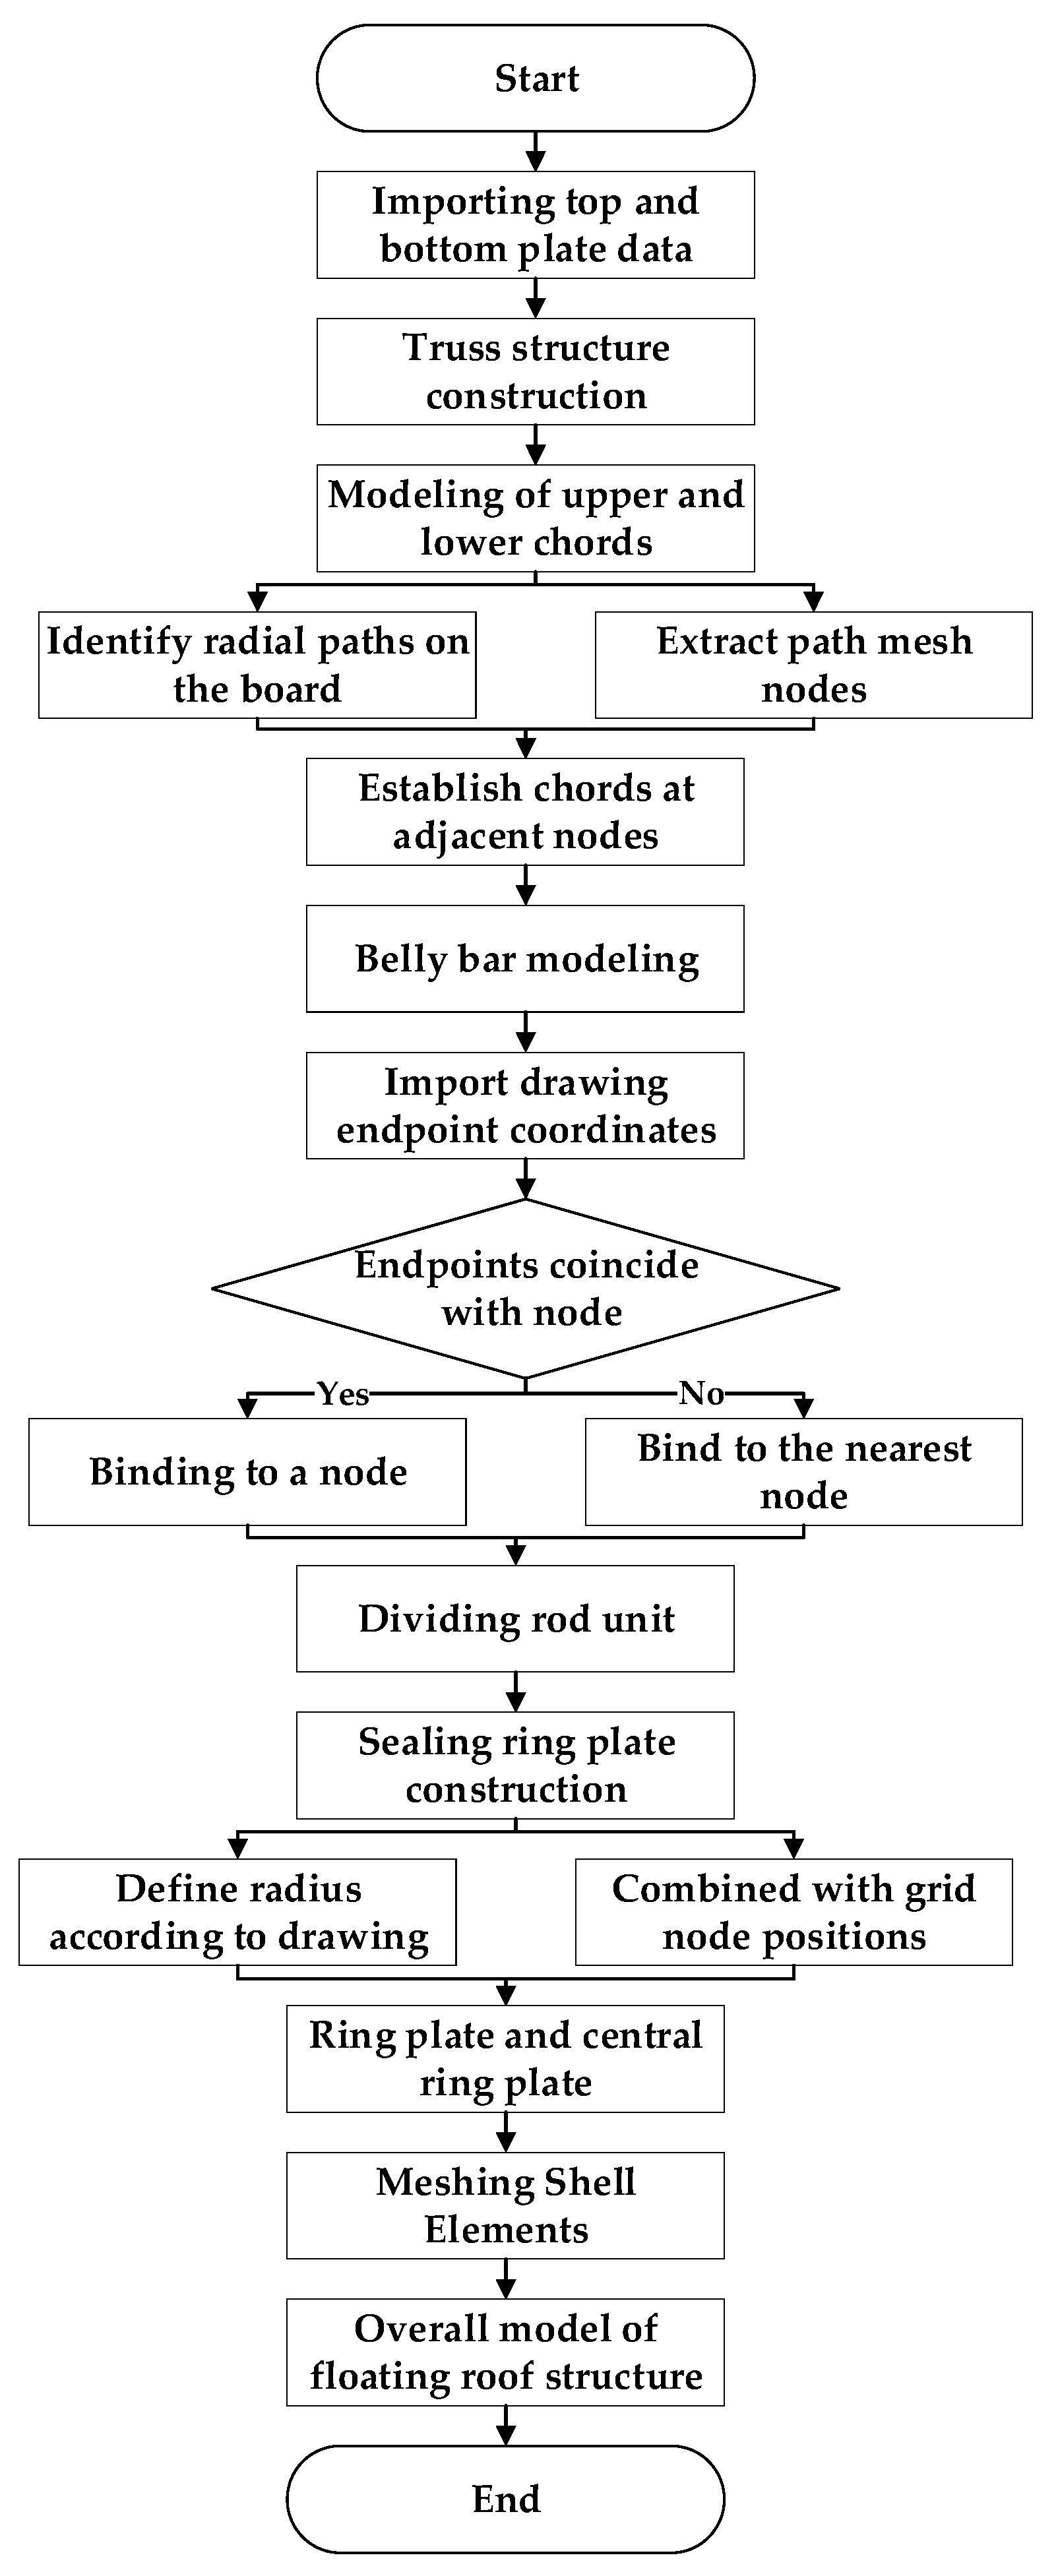
After completing the modeling of the top and bottom plates, the program proceeds to construct the truss and ring plate structures, automatically generating the complete floating roof assembly. The truss system, composed of upper and lower chords and webs, primarily connects the top and bottom plates, forming a three-dimensional framework that provides overall structural rigidity and stability. The ring plate system, consisting of multiple rings of sealing plates and a central ring plate, enhances structural integrity and improves sealing performance. Figure 5 illustrates the automatic modeling process for the truss and ring plate structures, which are generated step by step based on the top and bottom plate data. The final output is a finite element model of the floating roof structure, featuring complete topological relationships and mechanical properties.
The floating roof structure comprises 72 radially arranged truss chords, each welded to the inner surfaces of the top and bottom plates. The program automatically identifies the radial paths of each chord on both plates and extracts the mesh nodes along these paths. By sequentially connecting adjacent nodes, chord segments are generated, ultimately forming the entire chord. These chords share nodes with the plate surfaces, ensuring spatial consistency and structural continuity at the welded connections. All segments are automatically divided into bar elements and numbered, facilitating efficient modeling of the 72 upper and lower chords.
To connect the upper and lower chords and enhance overall rigidity, numerous web members are arranged within the structure, forming a typical truss grid system. Using the spatial coordinates of each web member’s endpoints from the drawing, the program automatically determines whether they coincide with the chord nodes. If they do not, a nearest neighbor search is performed, and the nodes are linked to achieve precise common-node connections, ensuring geometric accuracy and connection reliability. Ultimately, a total of 5544 web members were generated and automatically divided into rod elements, completing the modeling of the truss’s internal connections.
The floating roof structure features six concentrically arranged sealing rings and a central ring, primarily designed to enhance sealing performance and structural rigidity. The program automatically generates the corresponding annular geometry based on the ring plate radius and width parameters specified in the drawing and meshes the geometry using existing mesh nodes. Each ring plate is connected to the top or bottom plate at common nodes, ensuring overall continuity and stiffness transfer within the welded structure. All ring plate regions are automatically divided into shell elements, completing the parametric modeling of the sealing structure.
In summary, the program automatically constructs a comprehensive finite element model of a floating roof, encompassing the trusses, top plate, and ring plates, based directly on the measured deformation of the bottom plate. By integrating the actual geometric irregularities of the structure into the model, this approach not only ensures a more realistic representation of the floating roof’s as-built condition but also significantly improves the efficiency and accuracy of the modeling process. The automated procedure reduces the need for manual modeling, minimizes human errors.
To further investigate the impact of the initial geometric deformation of the floating roof bottom plate on structural performance, this paper develops two types of 3D geometric models: a deformed model derived from measured bottom plate deformation data, and an idealized model based on design drawings. The former accurately captures the localized wave undulations and global warping characteristics exhibited by the floating roof bottom plate under actual service conditions, while the latter represents the standard geometric state of the structure under ideal manufacturing and assembly conditions. Figure 6 illustrates a complete 3D model of the floating roof structure generated by the independently developed automated modeling program. This model integrates the bottom plate, top plate, six sealing ring plates, and internal truss system, precisely reproducing the actual geometric form and spatial configuration of the floating roof structure. By conducting a comparative analysis using the idealized model as a reference, a systematic assessment is performed to evaluate the impact of initial geometric deformation on the overall mechanical performance of the floating roof.

2.3. Mathematical Model

The bottom plate of the floating roof structure can be modeled as a circular thin plate, and its deformation behavior can be analyzed using the geometric nonlinear bending theory for thin plates [33]. In the polar coordinate system, the governing differential equation for the large deflection bending of a circular thin plate with uniform thickness can be expressed as follows [34]:
2 ρ 2 + 1 ρ ρ + 1 ρ 2 2 φ 2 2 ω δ σ ρ 2 ω ρ 2 + 2 δ τ ρ φ ρ 1 ρ ω φ + δ σ φ 1 ρ ω ρ + 1 ρ 2 2 ω φ 2 = q
where
ω —deflection of the circular thin plate (m);
ρ —radius coordinates in polar coordinates (m);
φ —angular coordinates in polar coordinates (rad);
δ —thickness of the circular thin plate (m);
q —longitudinal distributed load on the circular thin plate (MPa);
σ ρ —normal stress in radial direction (MPa);
σ φ —normal stress in the angular direction (MPa);
τ ρ φ —shear stress (MPa).
Since the circular thin plate structure is axisymmetric, the deflection function depends only on the radial coordinate ρ , allowing the above differential equation to be simplified as follows:
d 2 d ρ 2 + 1 ρ d d ρ 2 ω δ σ ρ d 2 ω d ρ 2 δ σ φ 1 ρ d ω d ρ = q
The corresponding compatibility condition equation [35] is
ρ 2 d 2 δ σ ρ d ρ 2 + 3 ρ d δ σ ρ d ρ + E δ 2 d ω d ρ 2 = 0
Combined with the boundary conditions, we can solve the above Equations (2) and (3) to obtain ω = ω ( ρ ) and σ ρ = σ ρ ( ρ ) . Further calculate the stress components, strain components, and displacement distribution at each location of the thin plate.
To ensure consistency with the output results of the finite element solution, the stress components in the polar coordinate system must be converted to the rectangular coordinate system. The conversion relationship [36] is as follows:
σ x = σ ρ + σ φ 2 + σ ρ σ φ 2 cos 2 φ τ ρ φ sin 2 φ
σ y = σ ρ + σ φ 2 σ ρ σ φ 2 cos 2 φ + τ ρ φ sin 2 φ
τ x y = σ ρ σ φ 2 sin 2 φ + τ ρ φ cos 2 φ
Under a plane stress state, the principal stresses at any point can be calculated using the following formula [37]:
σ 1 = σ x + σ y 2 + σ x σ y 2 2 + τ x y 2
σ 2 = σ x + σ y 2 σ x σ y 2 2 + τ x y 2
where σ 1 and σ 2 are the first and second principal stresses, respectively.
In finite element analysis, the equivalent stress method is commonly used to assess the strength of the bottom plate in a floating roof structure. Based on the deformation energy theory, the equivalent stress (Von Mises stress) σ s is expressed as follows [38]:
σ s = 1 2 σ 1 σ 2 2 + σ 1 2 + σ 2 2
To ensure the validity of the finite element approach, the model was carefully verified against classical analytical solutions. Gujar et al. [39] employed classical plate theory and ANSYS to analyze the bending behavior of circular plates under both simply supported and clamped boundary conditions. Their results showed strong agreement between analytical solutions and FEM predictions, confirming the accuracy of the numerical approach for circular plate problems. In the present study, a similar strategy was adopted: the finite element model was constructed with boundary conditions and loadings consistent with the assumptions of the analytical model, enabling the numerical results to faithfully reproduce the stress and deformation patterns predicted by classical theory.

2.4. Boundary Conditions

To accurately represent the mechanical behavior of a floating roof structure under typical service conditions, this paper designs three representative load cases. These cases ensure that the finite element analysis results effectively simulate the structure’s mechanical response in real engineering scenarios. The three load cases include normal floating condition, extreme rainfall condition, and outrigger bottoming condition.
The normal floating condition simulates the upward buoyant force acting on the floating roof during standard tank operation. A uniformly distributed buoyancy load, equal in magnitude to the roof’s deadweight, is applied to the bottom plate. The outriggers are left unconstrained and treated as suspended. An inertial release method is employed to achieve a natural equilibrium between buoyancy and gravity, thereby preventing any interference with the structural response caused by improper boundary conditions.
The extreme rainfall condition simulates the additional loads caused by water accumulation on the floating roof during heavy rain. Two typical scenarios are considered. The first involves a uniform rainfall load, where the entire roof is subjected to hydrostatic pressure equivalent to a water depth of 250 mm. The second involves a linear, non-uniform load that simulates the load distribution caused by poor drainage, with water depth increasing linearly from 0 mm at the center to 250 mm at the edge. This scenario more accurately reflects actual rainwater accumulation.
The outrigger bottoming condition simulates the scenario in which the floating roof structure contacts the tank bottom and is rigidly supported by the outriggers during tank emptying or maintenance. The outriggers are fully fixed at their bases, isolating the structure from buoyancy and liquid loads. Consequently, the weight of the floating roof is supported exclusively by the 203 outriggers.
All loads and boundary conditions are established in strict accordance with current design specifications and on-site working conditions to ensure the accuracy of input parameters and engineering relevance. Both geometric models employ identical loading and constraint methods under all operating conditions, providing an objective and consistent basis for subsequent response comparisons.

3. Results

To systematically evaluate the mechanical response characteristics of the floating roof structure under typical service conditions, this paper conducted a finite element static analysis of both the deformation model and the ideal model under three representative scenarios: normal floating, extreme rainfall, and outrigger bottoming. For each scenario, equivalent stress and axial displacement contour maps of the bottom plate were generated to highlight differences in overall stress distribution, local stress concentrations, and deformation patterns under varying initial geometric conditions. To further quantify the stress variation along the radial direction of the bottom plate, the positive x-axis was selected as the path for extracting equivalent stress data. Subsequently, stress versus radial distance curves were plotted, enabling a quantitative comparative analysis of the two models under different loading conditions.

3.1. Normal Floating Condition

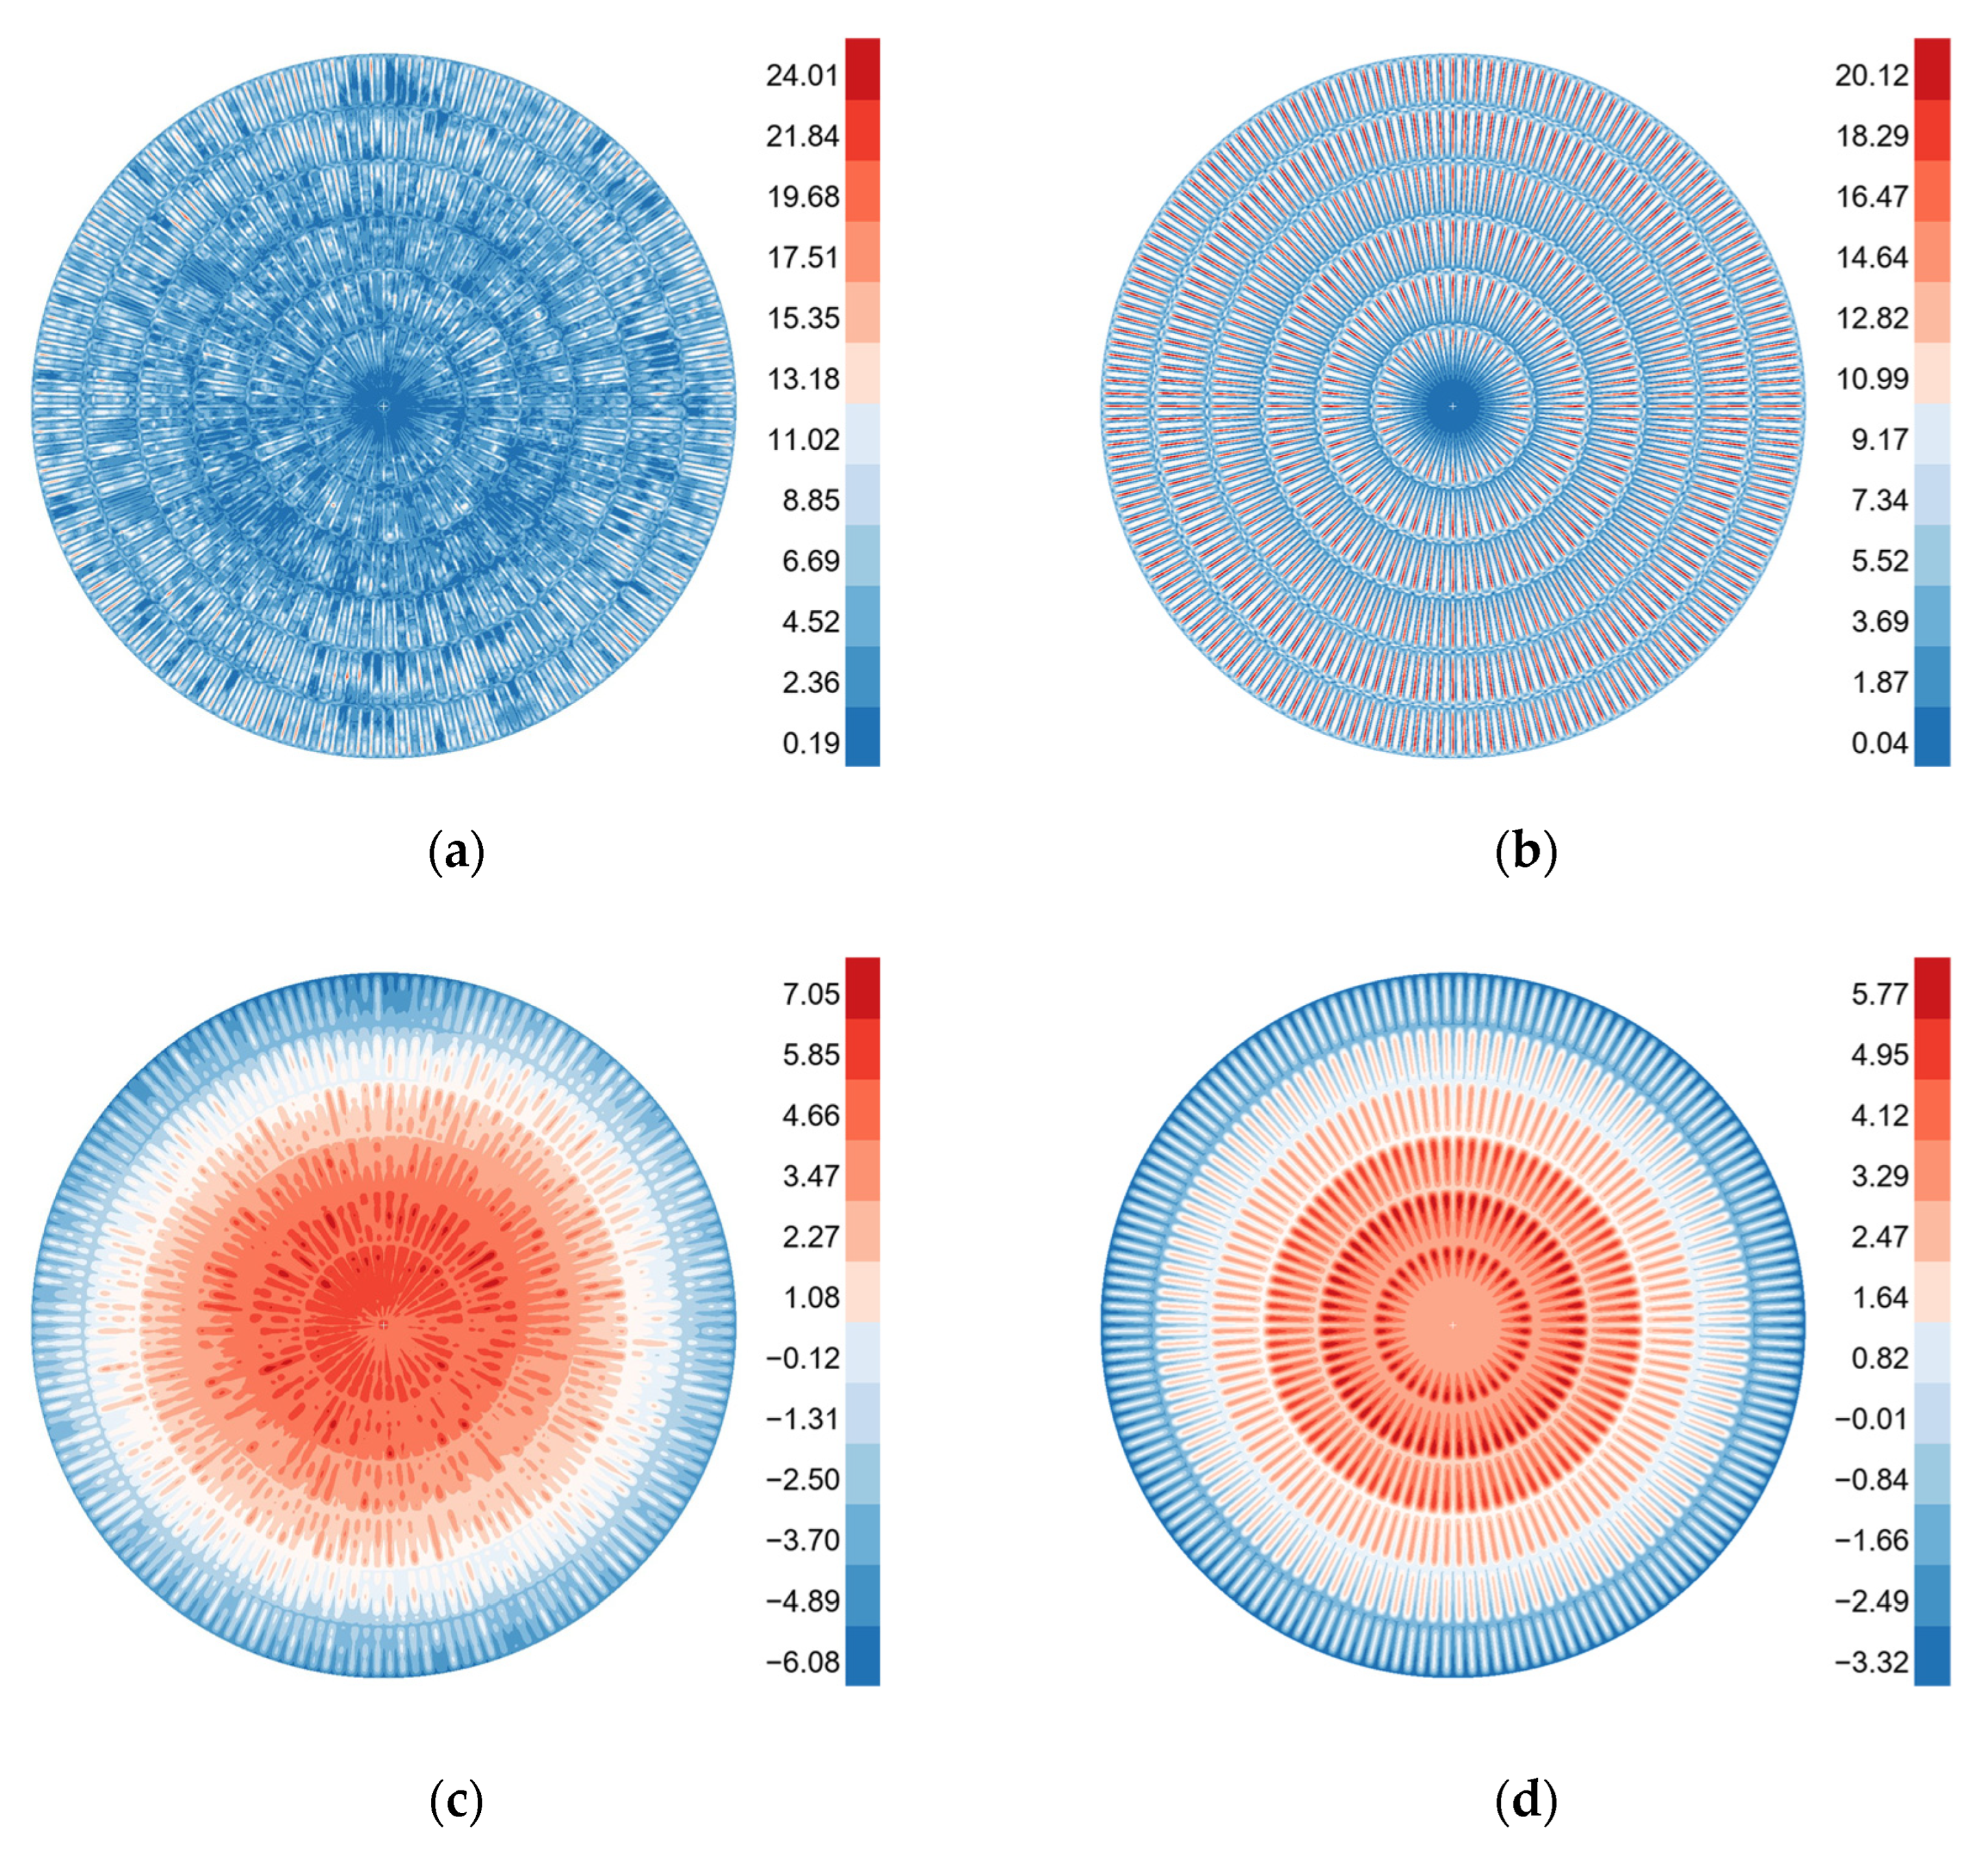
Figure 7 presents the equivalent stress and displacement contours of the bottom plates of two floating roof models under the normal floating condition, used to evaluate the impact of initial irregular deformation on structural response. Overall, both models display radial distribution patterns, with stress increasing from the center toward the edge and displacement decreasing from the center outward. This indicates that the overall deformation trend of the floating roof remains consistent under buoyancy and gravitational equilibrium. However, the deformed model shows significant differences from the ideal model in terms of stress and displacement magnitudes as well as local distribution.
In Figure 7a, the deformed model exhibits significant local stress concentration in the baseplate, with a peak value of 24.01 MPa—approximately 19% higher than the 20.12 MPa observed in the ideal model shown in Figure 7b. This indicates that the initial geometric deformation induces additional local stress and reduces the structural safety margin. In Figure 7c, the baseplate displacement of the deformed model ranges from −6.08 mm to 7.05 mm, which is significantly greater than the −3.32 mm to 5.77 mm range of the ideal model in Figure 7d. The maximum positive and negative displacements increase by approximately 22% and 83%, respectively, indicating that initial irregularities reduce structural stiffness and lead to greater deformation. The response contour of the deformed model exhibits irregular patches and pronounced local asymmetry, whereas the ideal model maintains a uniform and symmetrical circumferential distribution.
The bottom plates are made of SA516 Gr.70 steel with good toughness and moderate carbon equivalent, providing sufficient yield strength, but limited thickness (5–6 mm) reduces bending stiffness locally. Single-side butt welding introduces geometrical irregularities along the weld seams, leading to local stiffness variations. As Epstein et al. [18] highlighted, the trade-off between edge stiffness and roof weight significantly affects local deformation patterns.
Figure 8 compares the equivalent stress distributions along radial paths for the deformed and idealized bottom plates. Overall, the stress distribution trends for both models are quite consistent across most radial locations, indicating that the initial geometric deformation of the floating roof structure has a limited effect on the overall stress levels. However, at the center and edges of the bottom plate, the equivalent stress in the deformed model increases significantly compared to the idealized model, demonstrating that the initial geometric perturbation has a substantial impact on the local stress response.

3.2. Extreme Rainfall Condition

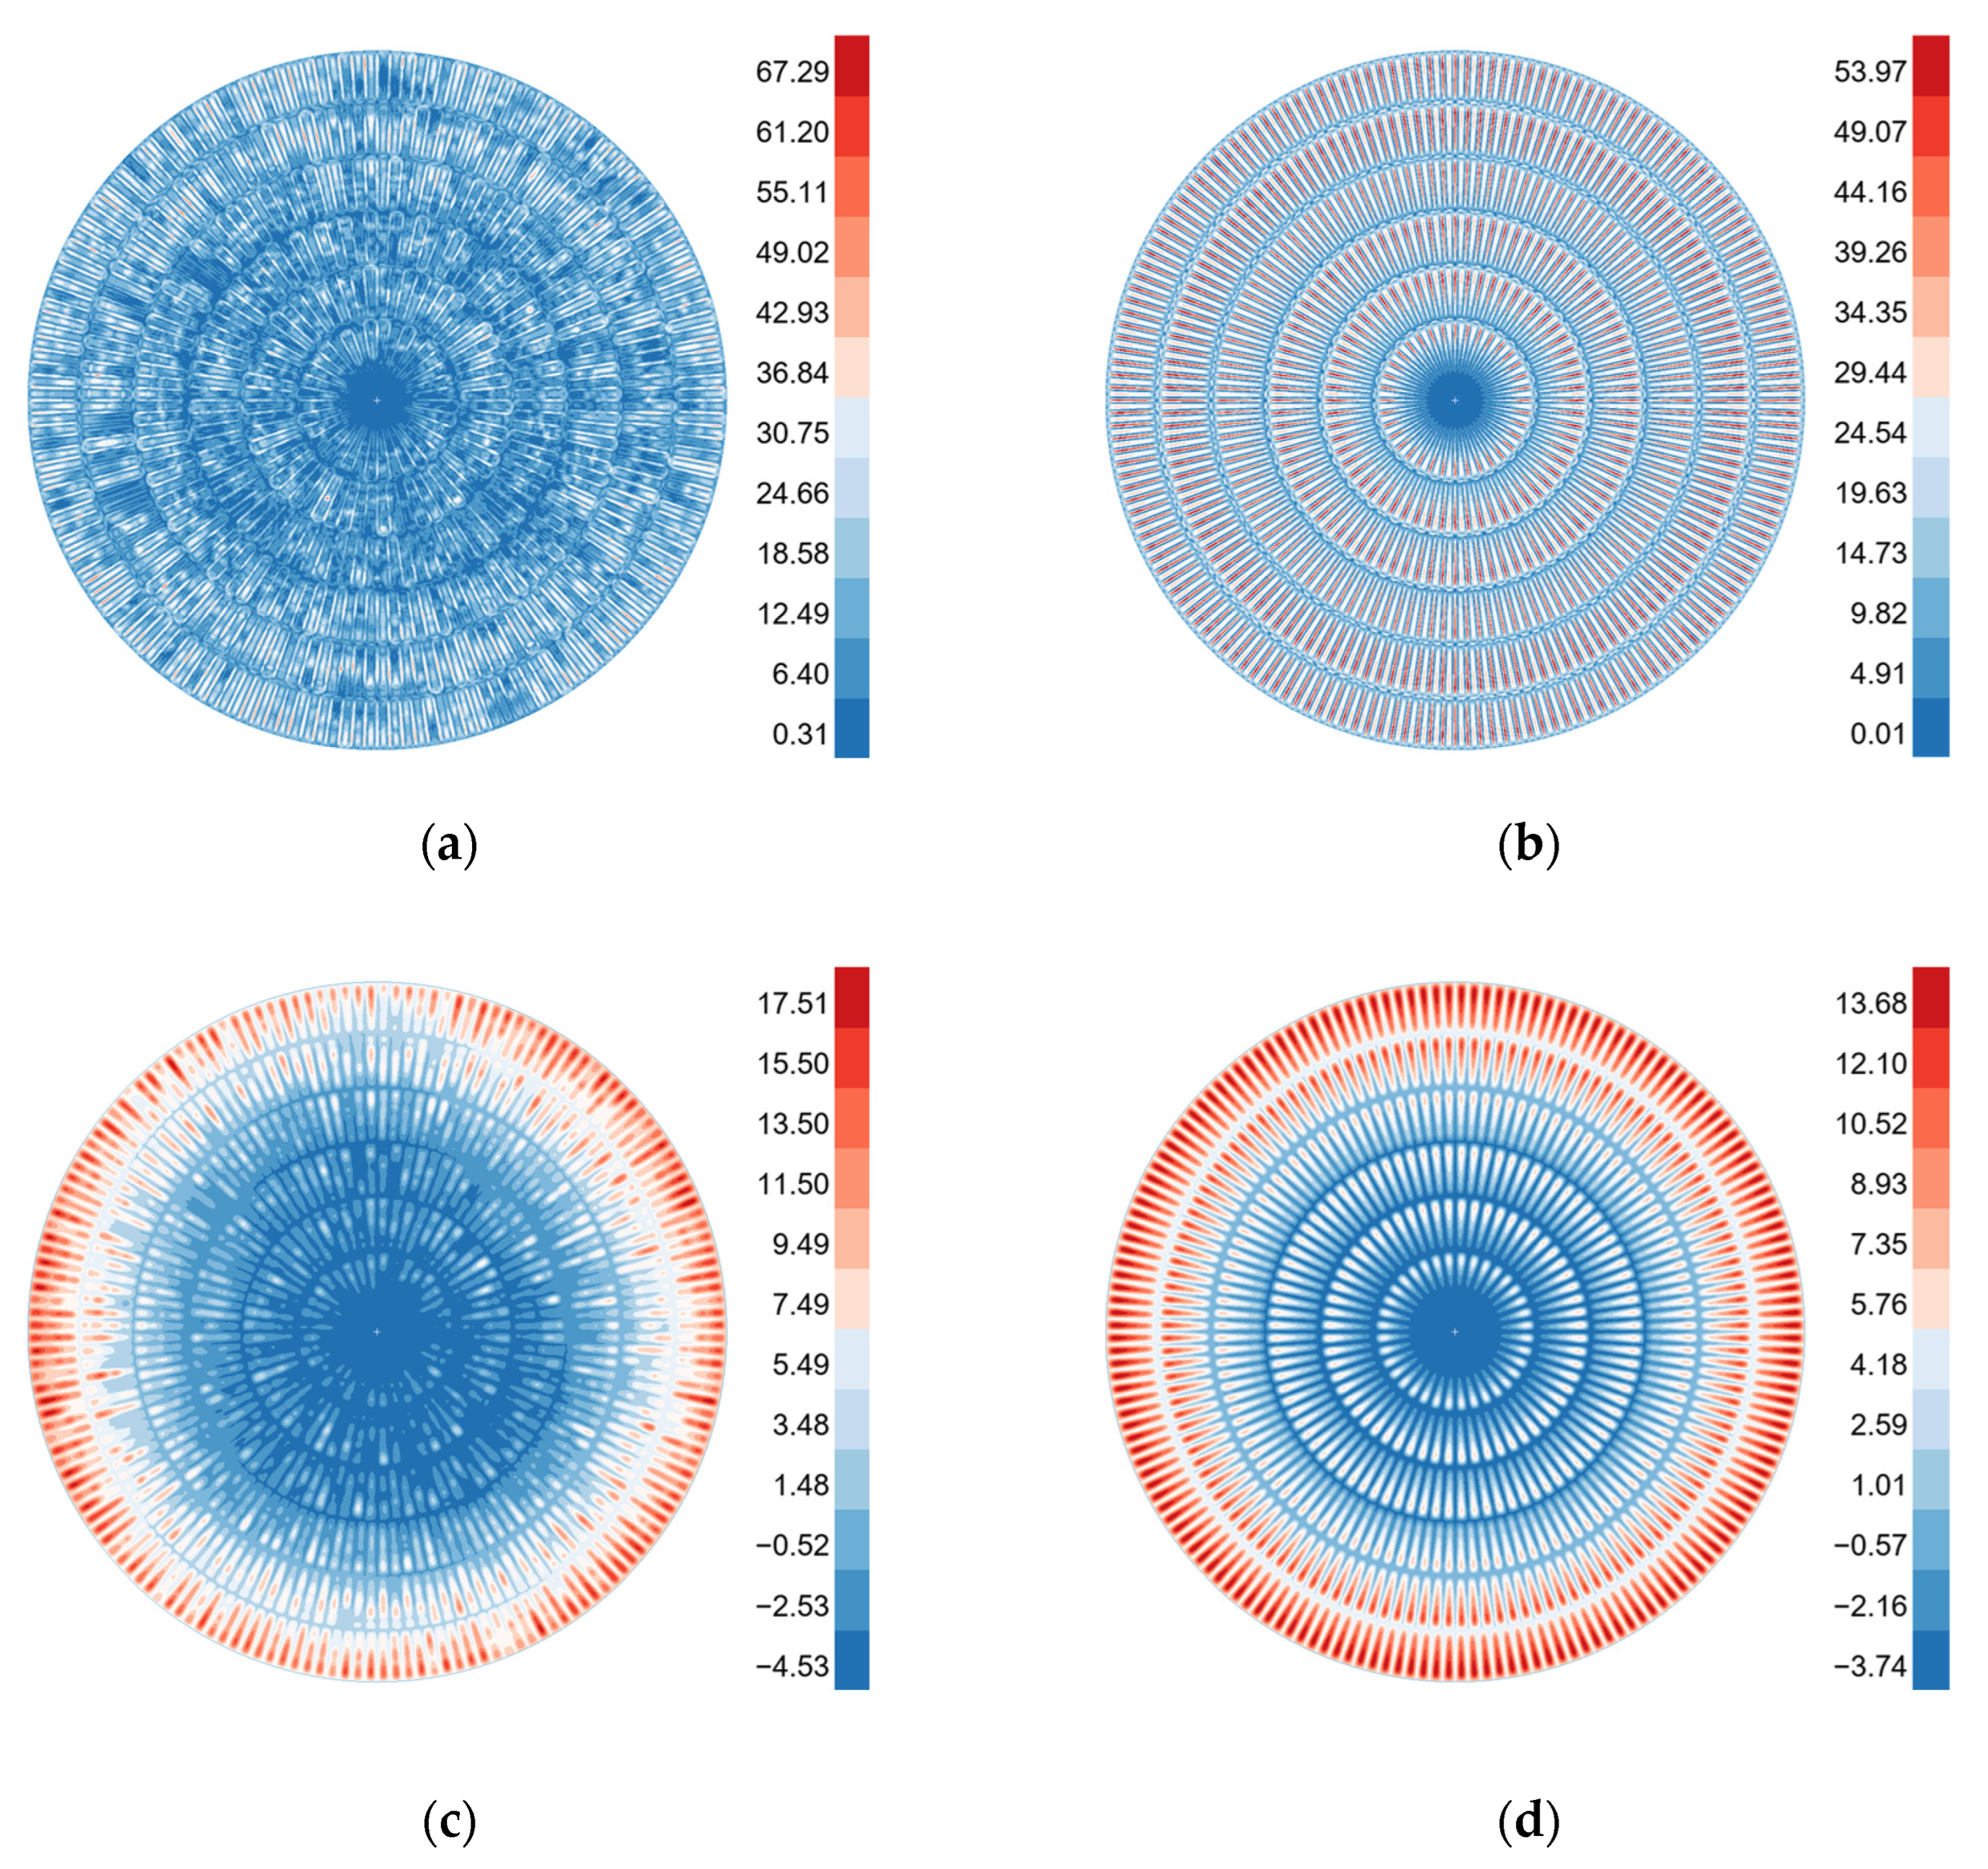
Figure 9 compares the equivalent stress and displacement contour diagrams of the base plates of the two models under the extreme uniform rainfall condition, aiming to reveal the influence of initial irregular deformation on the structural response. The results show that both models exhibit radially increasing stress and displacement distributions, with the response in the edge regions being significantly higher than in the central region.
In contrast, the measured model exhibits more pronounced localized heterogeneity, with the stress and displacement contour diagrams displaying patchy high-value distributions and significant localized stress concentrations. In Figure 9a, the peak stress of the base plate in the deformed model reaches 67.29 MPa, representing an increase of approximately 24% compared to the 53.97 MPa observed in the ideal model shown in Figure 9b. In Figure 9c, the displacement range of the base plate in the deformed model spans from −4.53 mm to 17.51 mm, which is significantly larger than the −3.74 mm to 13.68 mm range of the ideal model depicted in Figure 9d. The positive and negative displacement ranges increase by 21% and 28%, respectively, indicating that the initial geometric perturbation amplifies the local structural response and reduces overall stiffness, with edge warping being particularly pronounced.
The 5–6 mm SA516 Gr.70 steel plates, while having adequate yield strength and toughness, exhibit limited bending stiffness locally. The single-side butt welds introduce geometric irregularities along the seams, which interact with the thin plate sections to produce local stress concentrations and asymmetric deformation patterns. These results demonstrate that even under symmetrical loading, the initial deformation of the base plate can induce a significant heterogeneous response, and its weakening effect on structural performance must be thoroughly considered in design and evaluation.
The results obtained in this study under a uniform rainfall load of 250 mm were further contextualized through comparison with previous research. In particular, Noaman et al. [20] reported a maximum stress of approximately 40 MPa for a double-layer floating roof under the same rainfall condition using a nonlinear finite element model. In contrast, the present study, which incorporates the measured initial geometric deformation of the bottom plate, predicts a significantly higher maximum stress of 67.29 MPa. This discrepancy highlights the critical influence of initial irregular deformation on local stress amplification. The findings indicate that neglecting the as-built deformation in conventional idealized models may underestimate stress concentrations and compromise the assessment of structural safety.
Figure 10 compares the equivalent stress distribution along the radial path of the bottom plate between the deformed model and the ideal model. The results indicate that the overall stress level in the deformed model is higher, demonstrating that the initial geometric perturbation significantly amplifies the local stress response under the extreme operating condition. Noticeable stress fluctuations occur in the middle and edge regions of the deformed model, suggesting increased sensitivity to in-plane stress redistribution and greater uncertainty in the local response. In contrast, the stress distribution in the ideal model remains stable, reflecting superior structural stability and geometric continuity. These findings highlight the importance of considering stress concentration effects induced by initial deformation during extreme load assessments, particularly the potential weak points formed by rainwater accumulation in the central area.
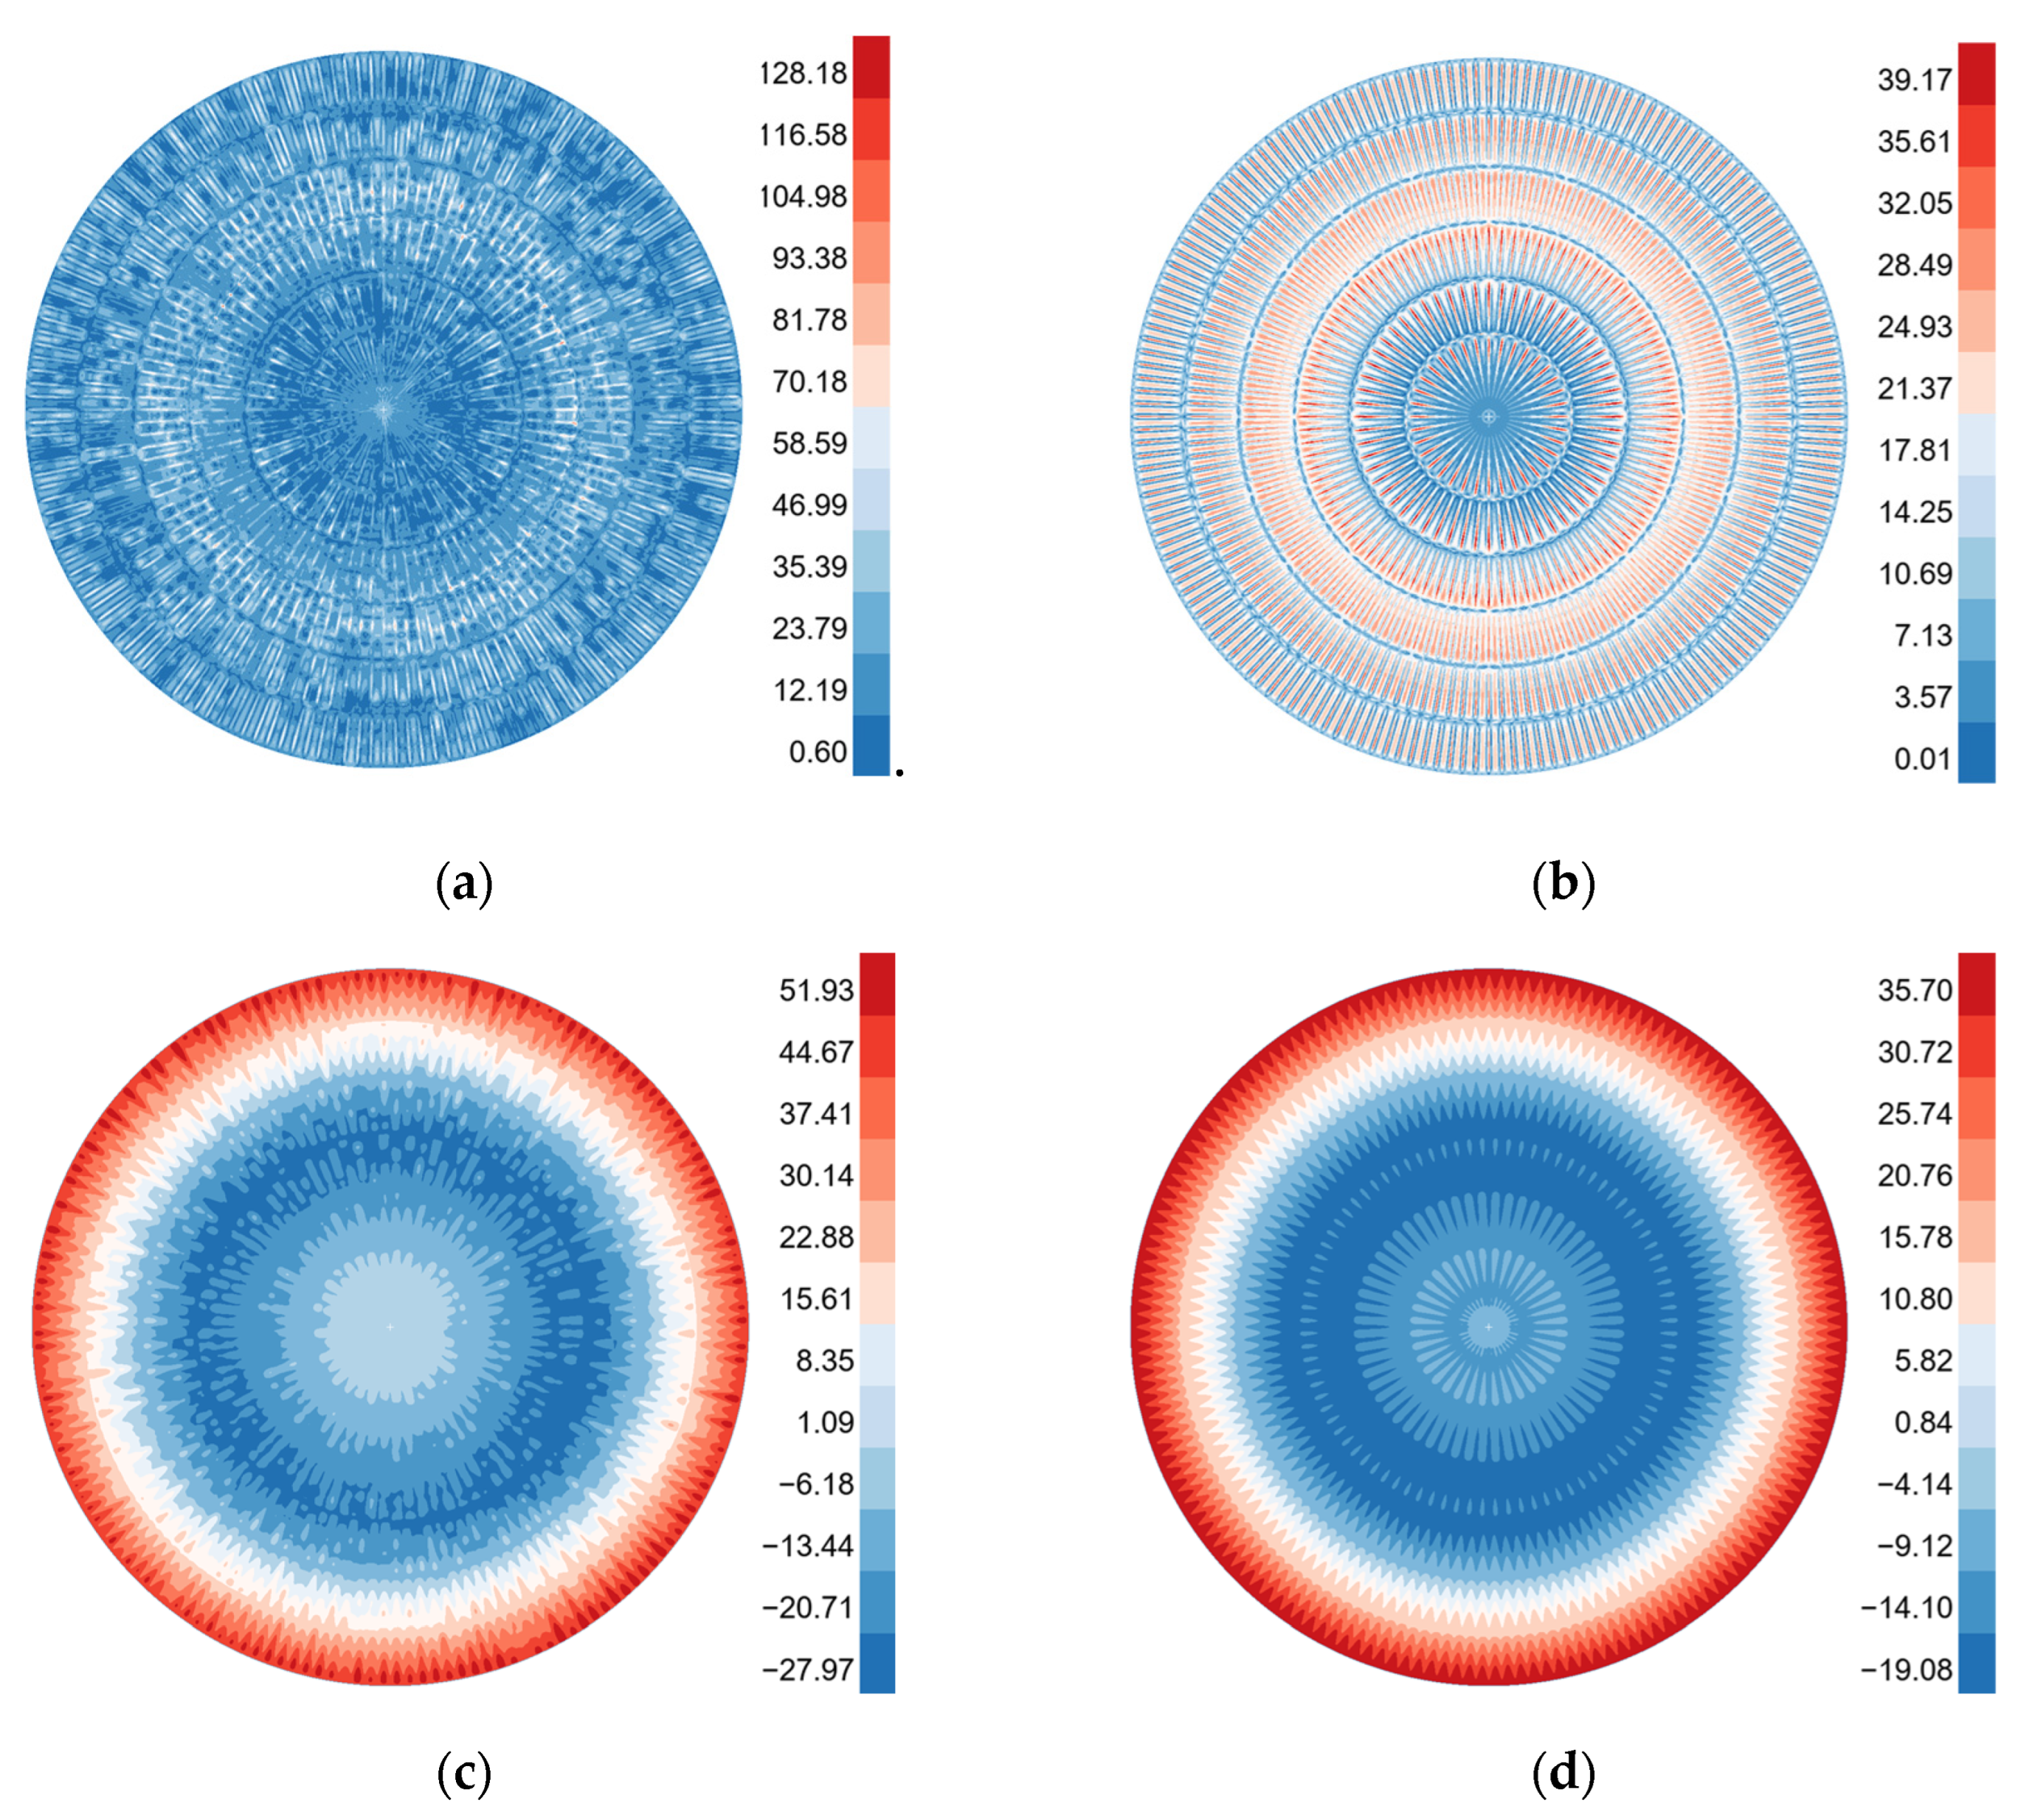
Figure 11 compares the equivalent stress and displacement distribution cloud diagrams of two base plate models under the extreme non-uniform rainfall condition, simulating structural response differences under poor drainage conditions. The results show that both models exhibit a deformation pattern characterized by a concave center and warped edges, with stress and displacement increasing radially from the center toward the edges.
In Figure 11a, the peak stress in the base plate of the deformed model reaches 128.18 MPa, approximately 3.27 times higher than the peak stress of 39.17 MPa observed in the ideal model shown in Figure 11b. This indicates that initial geometric perturbations significantly increase local stress concentrations under extreme nonuniform loads, thereby reducing the structural safety margin. In Figure 11c, the displacement range of the deformed model, from −27.97 mm to 51.93 mm, is substantially greater than the displacement range of −19.08 mm to 35.7 mm for the ideal model in Figure 11d. The maximum positive and negative displacements increase by approximately 45% and 47%, respectively, demonstrating that initial irregular deformation markedly amplifies the overall warping and denting responses of the structure. Compared to extreme uniform rainfall, nonuniform loads are more likely to induce large structural deformations and local distortions, highlighting the importance of fully considering their potential impacts in structural design and drainage safety assessments.
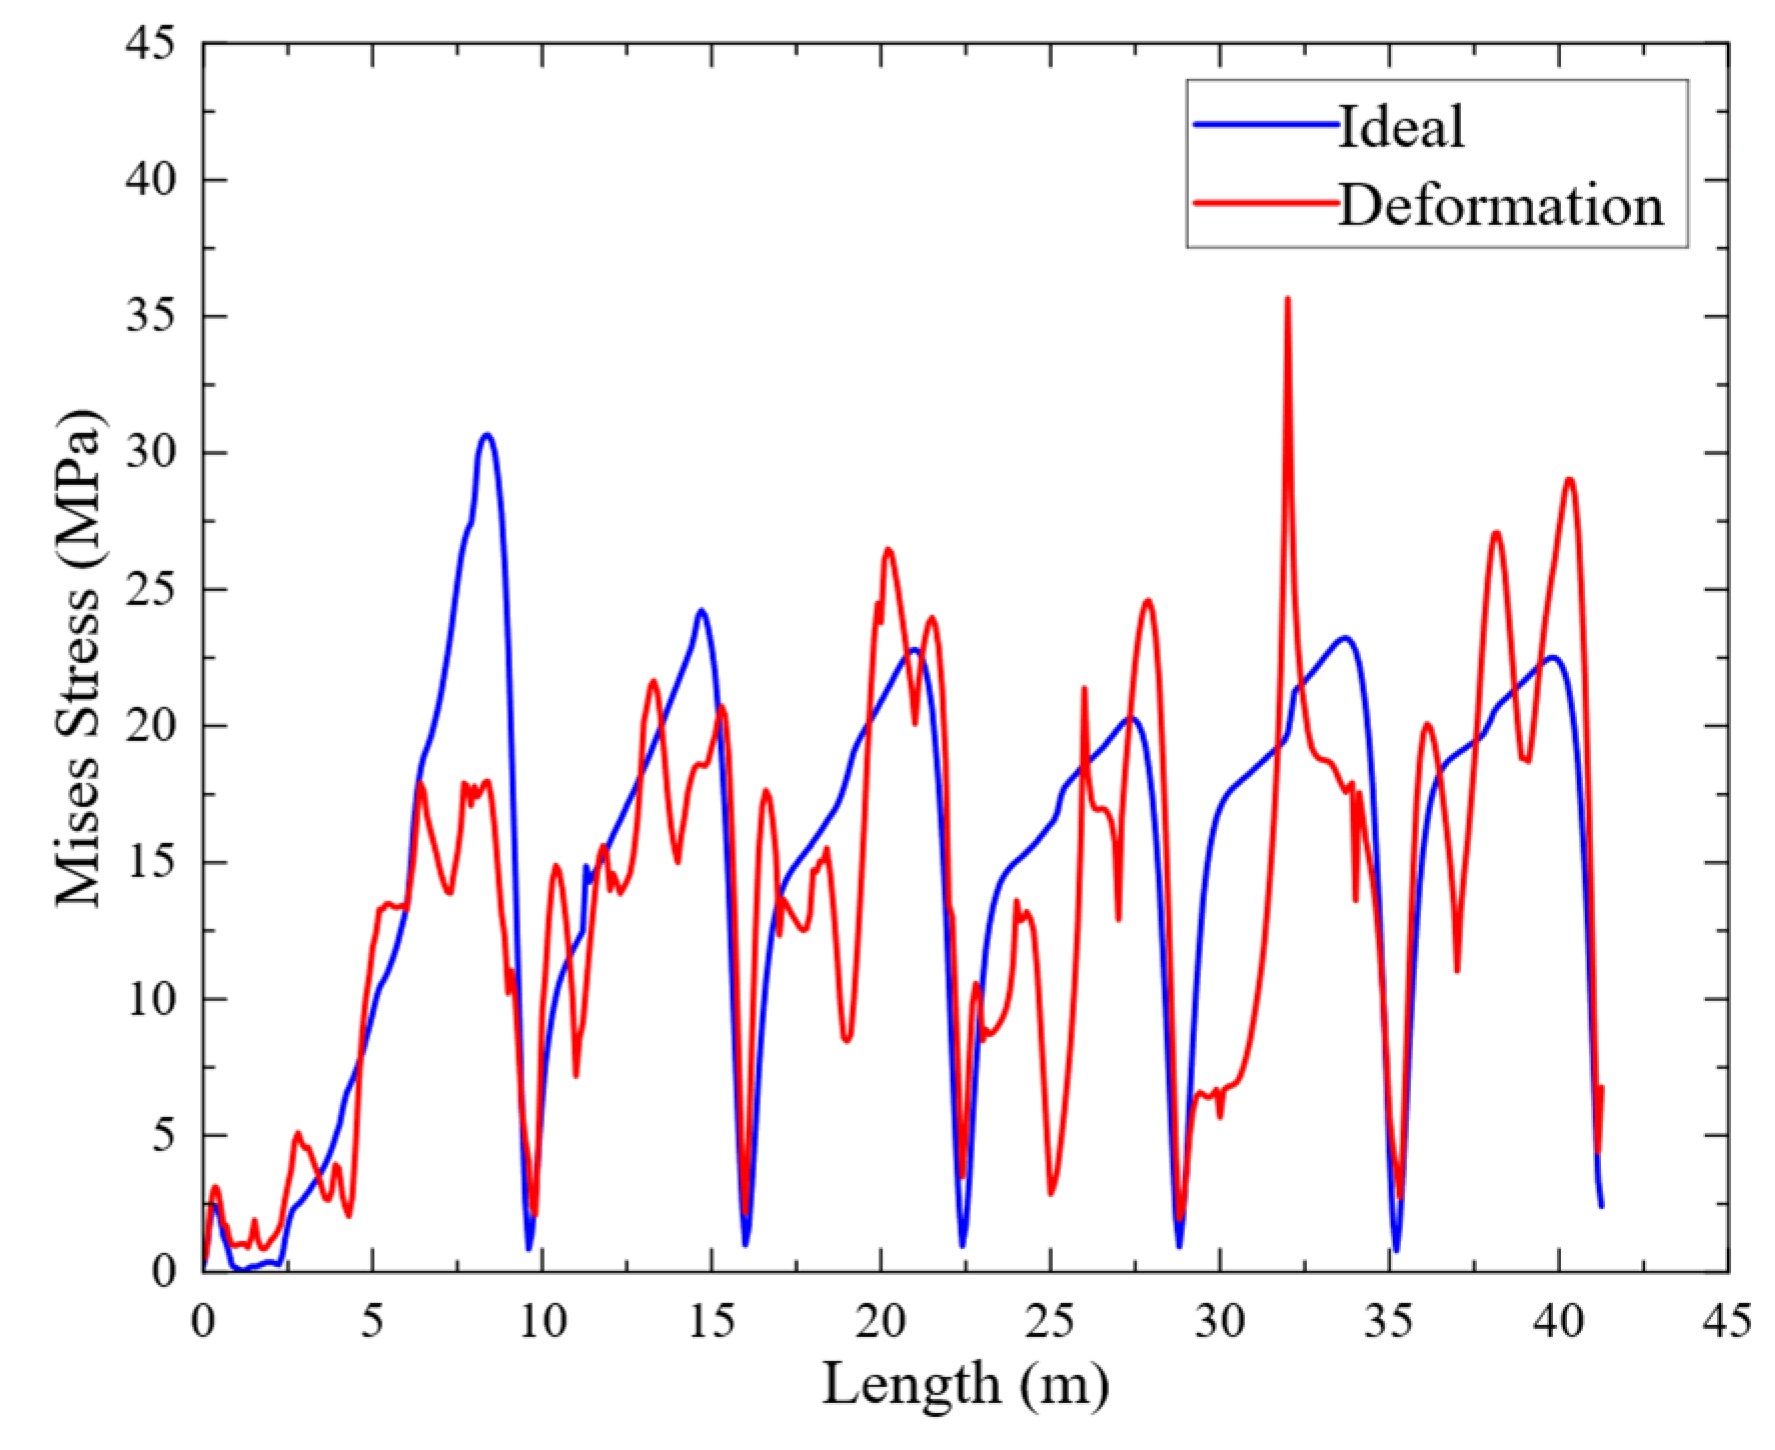
Figure 12 compares the equivalent stress distribution of the base plate between the deformed model and the ideal model along the radial path. The results indicate that the stress levels in the deformed model are significantly higher than those in the ideal model across most radial regions, particularly in the midsection of the base plate, where multiple local stress peaks occur. This suggests that this area is highly sensitive to the combined effects of non-uniform loading and initial disturbances. The stress curve of the deformed model exhibits pronounced fluctuations, demonstrating that initial geometric irregularities substantially amplify the local stress response under non-uniform loading, resulting in stronger stress concentrations and uneven stress distribution. Therefore, the potential impact of the interaction between geometric deformation and spatially uneven load distribution on structural safety must be thoroughly considered when assessing extreme working conditions.

3.3. Outrigger Bottoming Condition

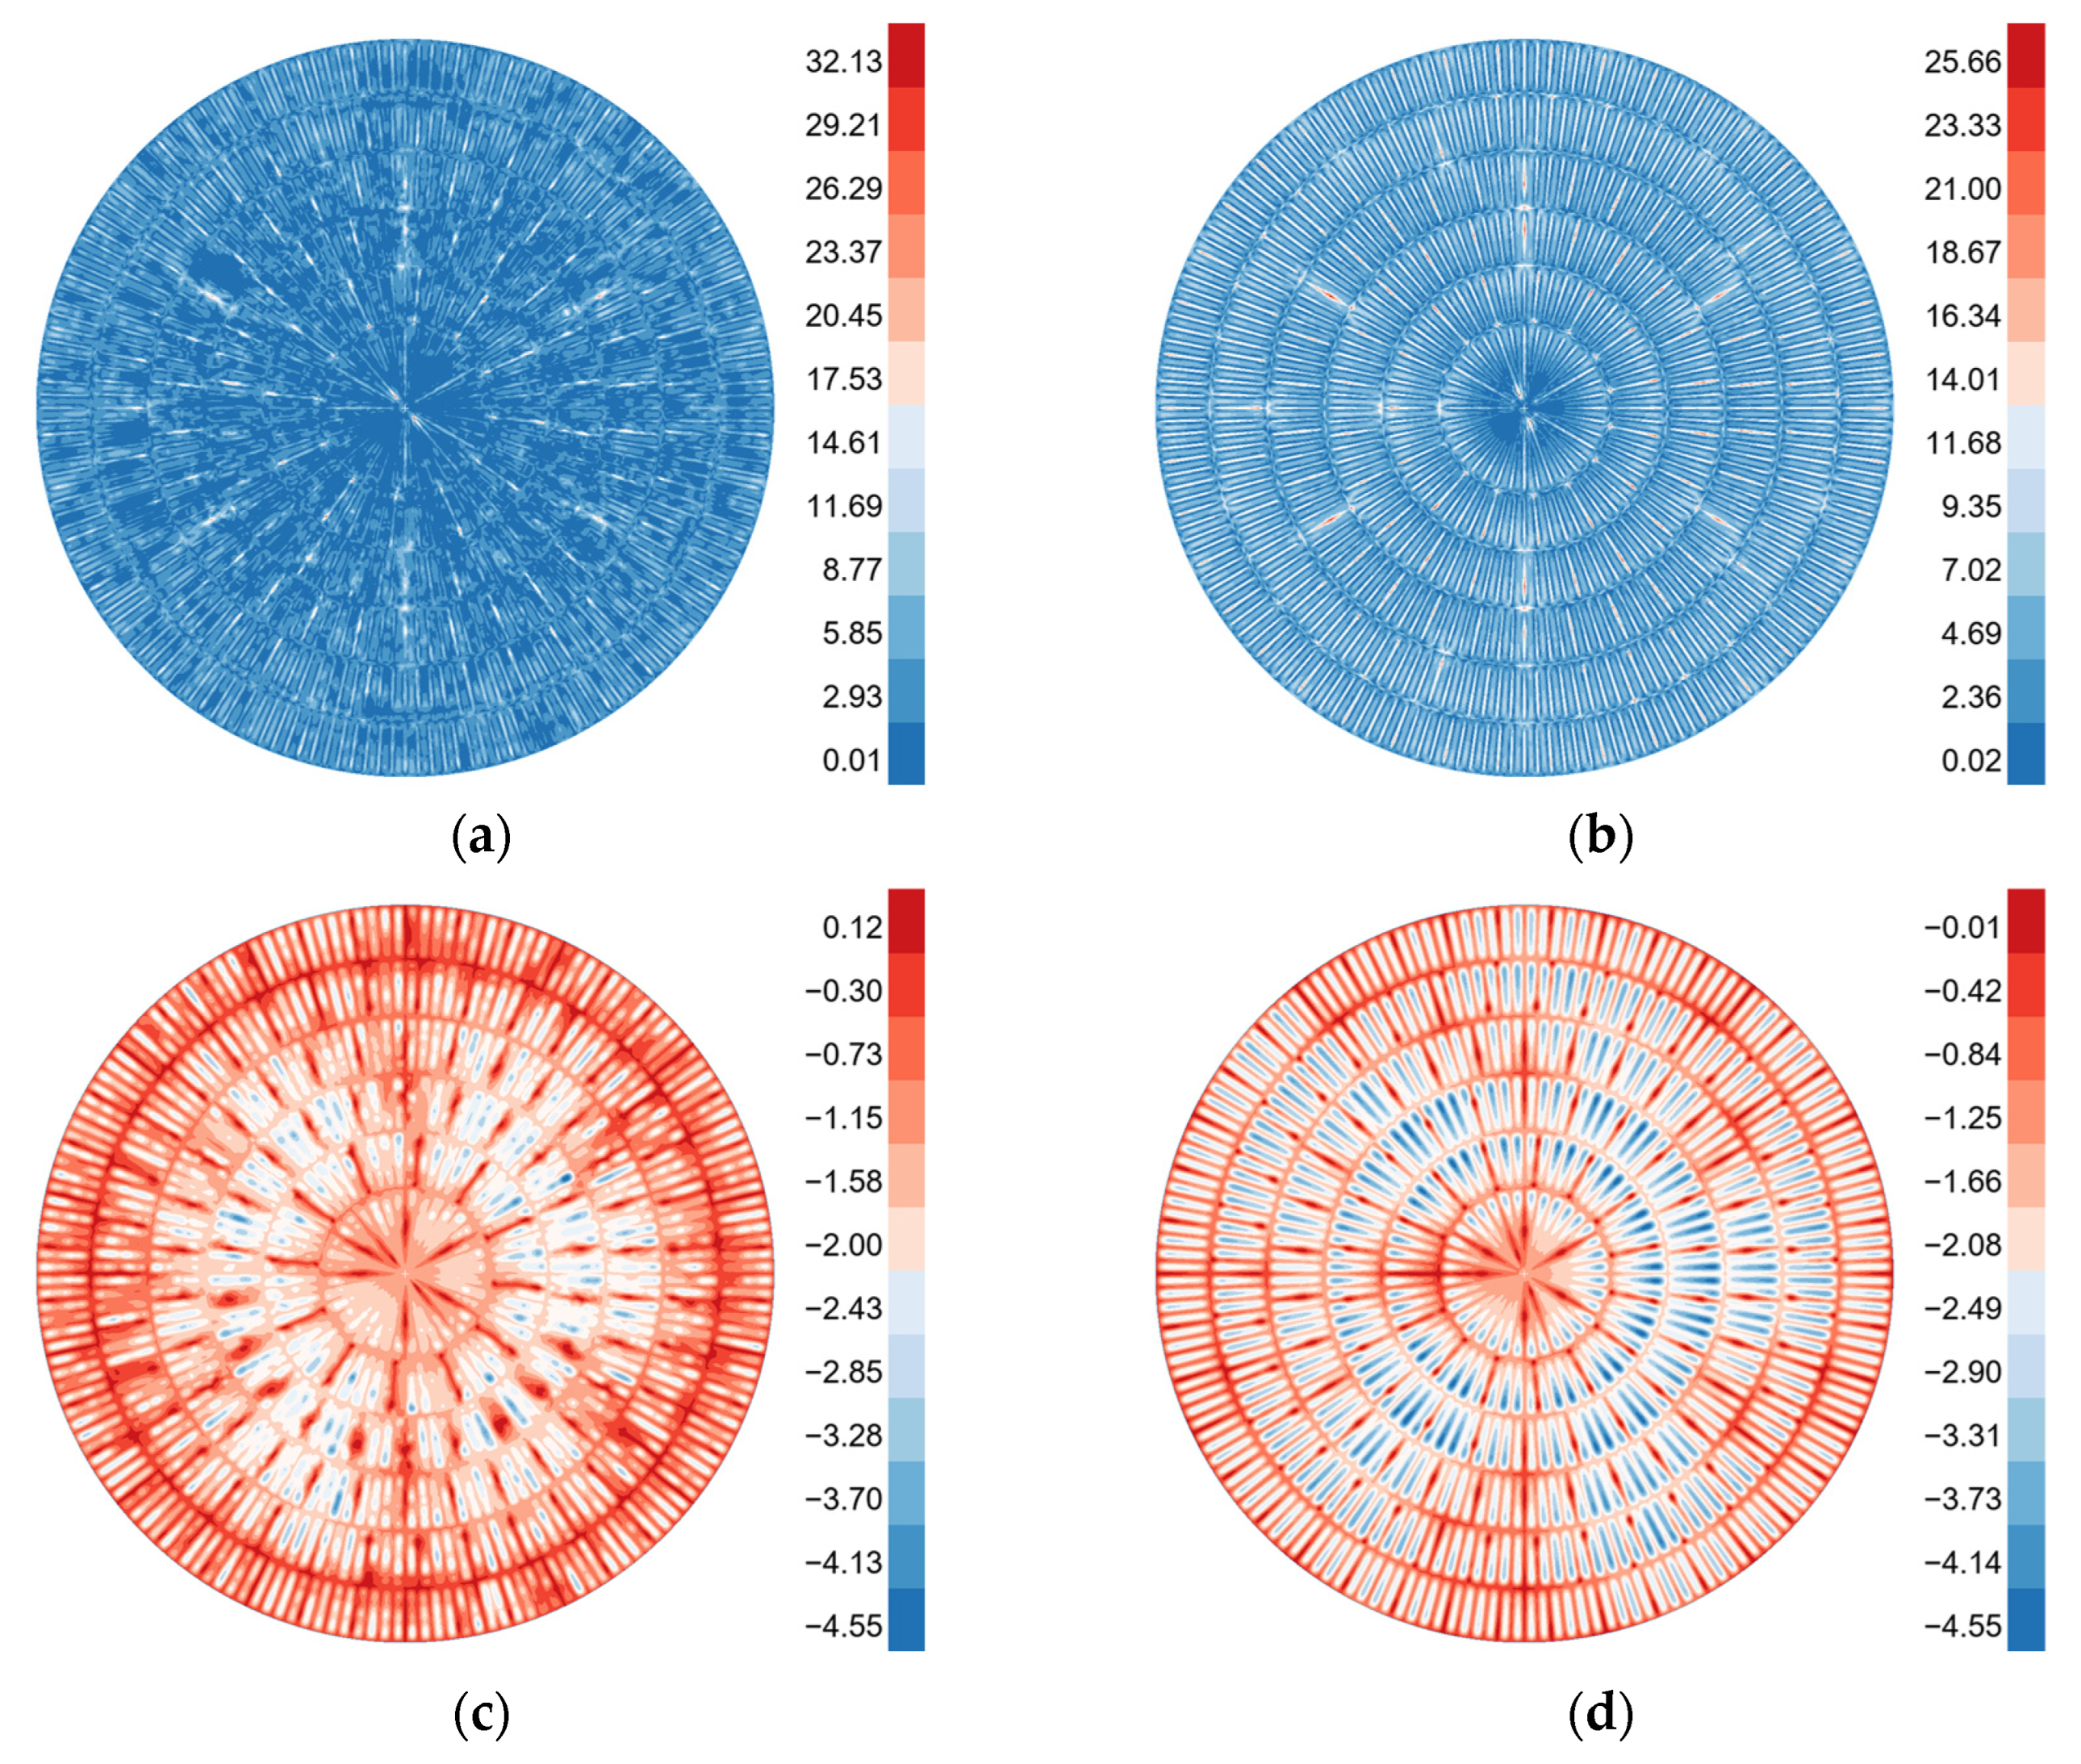
Figure 13 illustrates the equivalent stress and displacement distributions of the baseplate for both the deformed and ideal models under the outrigger contact condition. The results indicate that the stress and displacement patterns caused by the local rigid support differ significantly from those observed under floating or rainfall conditions. Specifically, there is a general trend of increasing stress and displacement from the center toward the edges, with pronounced stress concentrations at the edges and outriggers.
Figure 13a,c display the response cloud diagrams of the deformed model, revealing irregular high-stress patches and warping deformations, while the response cloud diagrams of the ideal model also exhibit patchy stress distributions. In Figure 13a, the maximum stress in the deformed model reaches 32.13 MPa, approximately 25% higher than the 25.66 MPa observed in the ideal model shown in Figure 13b, indicating a significant increase in local stress concentration. Although the maximum positive and negative deformations of both models are similar, the local deformation in the deformed model is more severe and spreads asymmetrically outward. This reflects the amplification effect of initial irregularities on structural stiffness and deformation modes under multi-point support. These results suggest that, under the outrigger bottoming condition, the influence of initial deformation on local forces and the overall mechanical response must be fully considered to mitigate the risk of stress concentration.
These findings are consistent with the observations reported by Mangushev et al. [7], who emphasized that geometric imperfections in large-diameter floating roofs can lead to non-uniform stress redistribution when local supports are engaged. The results also align with the conclusions of Tariverdilou [33], who found that reduced membrane stiffness in locally deformed regions increases stress concentration near boundary supports. In summary, the outrigger bottoming condition introduces a unique load path that magnifies the effect of initial geometric irregularities on stress and deformation patterns.
Figure 14 compares the equivalent stress distribution along radial paths for both the deformed and idealized bottom plates. The results indicate that the deformed bottom plate exhibits a consistent increase in stress levels compared to the ideal model at most radial locations, particularly in the central region. The stress curve of the deformed model shows a sharp gradient change near the central support constraint, highlighting the significant amplification effect of the geometric perturbation on the stress distribution under the support reaction force. Initial geometric deformation substantially compromises the uniformity of load transfer within the structure. Therefore, the design of the floating roof bottom plate should prioritize reinforcing structural measures in the areas adjacent to the supports to prevent buckling.

3.4. Summary and Comparison

To systematically and quantitatively analyze the influence of initial irregular deformation on the stress and deformation characteristics of the floating roof bottom plate, this paper summarizes the numerical results of the equivalent stress peak and displacement range of both the floating roof bottom plate and top plate under three typical service conditions. These results are obtained using both the deformation model and the ideal model, as shown in Table 2.
The data indicate that the initial geometric irregularities consistently amplify both stress levels and displacement magnitudes of the bottom plate, with the amplification being more pronounced under extreme load scenarios, particularly in the non-uniform rainfall condition, where the peak stress increases by over 200%. The bottom plate of the deformed model shows a 19% and 24% increase in maximum stress under normal floating and extreme uniform rainfall conditions, respectively, while the non-uniform rainfall condition results in a substantial 227% increase. Correspondingly, displacement ranges are amplified by 22–83% for normal floating, 21–28% for uniform rainfall, and 45–47% for non-uniform rainfall, indicating that the initial irregularities reduce local stiffness and exacerbate structural deformation, especially under high-intensity and uneven loads.
The top plate, which exhibits no initial geometric deformation, also shows increased deformation due to stiffness reduction and load transfer effects caused by the deformed bottom plate. Under extreme uniform rainfall, the top plate displacement range increases by up to 60%, and in the non-uniform rainfall scenario, peak stress and displacement increase by 41% and 34–44%, respectively. This demonstrates that bottom plate irregularities can propagate through the structure, amplifying top plate responses via stiffness weakening and deformation coupling, thereby reducing the safety margin and service reliability of the floating roof system.
Overall, these findings indicate that neglecting initial geometric deformation in conventional idealized models may lead to underestimation of stress concentrations and structural deformations, particularly under extreme load conditions such as non-uniform rainfall. Therefore, accurate consideration of as-built irregularities is essential for safe and reliable design and assessment of floating roof structures.

4. Conclusions

Based on measured deformation data of floating roof structures and an automated modeling process, this paper establishes a realistic model incorporating initial irregular deformation and an idealized flat benchmark model. Using the finite element method, the stress and deformation characteristics of the floating roof structure under normal floating, extreme rainfall, and outrigger bottoming conditions were systematically analyzed. The impact of initial irregular deformation on the service performance of the floating roof was quantitatively assessed. The main conclusions are as follows:
  • The automated modeling approach developed in this study successfully reconstructs the three-dimensional geometry of the floating roof bottom plate based on measured deformation data, accurately capturing initial irregularities caused by welding. This method provides an efficient workflow for integrating irregular initial deformations into finite element analysis, enabling realistic simulation of structural responses under various operating conditions. The approach offers a practical tool for engineering design, assessment, and maintenance of large-scale floating roof storage tanks.
  • Under the normal floating condition, the measured initial geometric deformation has a limited effect on the overall stress distribution pattern of the floating roof bottom plate. However, it significantly exacerbates local stress concentrations and deformation amplitudes, reduces structural stiffness and safety margins, and disrupts the symmetry and continuity of the stress and displacement fields. These results demonstrate that initial irregularities play a critical role in local mechanical responses and should be explicitly considered during the early design stage to ensure sufficient structural stiffness under atmospheric conditions.
  • Under the extreme uniform rainfall condition, the initial irregular deformation of the floating roof bottom plate significantly amplifies local stress and displacement responses and reduces overall stiffness. It further induces non-uniform high-stress regions and warping deformation. Notably, stress fluctuations are pronounced in the central and edge areas, indicating heightened sensitivity to in-plane stress redistribution. The combination of high stress and deformation near plate edges highlights the importance of weld quality, plate thickness, and material toughness in resisting localized deformation. Design strategies should consider these factors to enhance service reliability under extreme environmental loads.
  • Under the extreme non-uniform rainfall condition, the measured initial geometric deformation of the floating roof bottom plate significantly amplified the structural response, leading to a substantial increase in stress in the central region and the emergence of multiple localized high-stress areas. Compared with the ideal model, the deformed model exhibits more pronounced radial equivalent stress fluctuations, making it more susceptible to large deformations and localized warping under uneven loading.
  • Under the outrigger bottoming condition, the initial geometric deformation markedly modifies the stress and displacement distribution of the base plate, resulting in increased local stress concentration and asymmetric deformation patterns. It induces a pronounced stress gradient near the support constraints, thereby amplifying their effect on structural stiffness and overall mechanical response. Therefore, the impact of initial deformation on the safety of the support area should be thoroughly considered during design, and local structural reinforcements should be implemented to mitigate stress concentration and maintain sufficient stiffness.
  • Comparing the responses of the deformation model and the ideal model under three typical operating conditions reveals that initial irregular deformation significantly amplifies the stress and displacement responses of the floating roof’s bottom and top plates. This amplification effect is especially pronounced under extreme loads. This amplification effect reduces the effective coupling between stiffness and deformation, thereby lowering the safety margin of the roof. Consequently, accurate measurement, early correction of initial irregularities, and stiffness control should be integrated into the design process to improve the structural robustness of floating roofs.

Author Contributions

Conceptualization, C.L. and L.Z.; methodology, C.L. and Y.J.; software, C.L. and L.Z.; validation, C.L. and Y.J.; formal analysis, C.L. and Y.J.; investigation, C.L.; resources, Y.Z. and W.G.; data curation, C.L.; writing—original draft preparation, C.L.; writing—review and editing, Y.J.; visualization, C.L. and L.Z.; supervision, Y.Z. and W.G.; project administration, Y.Z. and W.G.; funding acquisition, Y.Z. and W.G. All authors have read and agreed to the published version of the manuscript.

Funding

This work was funded by the National Natural Science Foundation of China [grant numbers 42474141 and 42404125], the National Key R&D Program of China [grant number 2023YFF0720700], the Seventh Young Scientist Workshop (Harbin Institute of Technology) [grant number IUGD0200801224], and the Heilongjiang Chunyan Innovation Team Program [grant number CYQN24044].

Data Availability Statement

The datasets used and/or analyzed during the current study are available from the authors upon reasonable request.

Conflicts of Interest

The authors declare that they have no known competing financial interests or personal relationships that could have appeared to influence the work reported in this paper.

References

  1. Pouyakian, M.; Jafari, M.J.; Laal, F.; Nourai, F.; Zarei, E. A comprehensive approach to analyze the risk of floating roof storage tanks. Process Saf. Environ. Prot. 2021, 146, 811–836. [Google Scholar] [CrossRef]
  2. Lang, X.Q.; Liu, Q.Z.; Gong, H. Study of fire fighting system to extinguish full surface fire of large scale floating roof tanks. Procedia Eng. 2011, 11, 189–195. [Google Scholar] [CrossRef]
  3. Huang, W.; Huang, F.; Fang, J.; Fu, L. A calculation method for the numerical simulation of oil products evaporation and vapor diffusion in an internal floating-roof tank under the unsteady operating state. J. Pet. Sci. Eng. 2020, 188, 106867. [Google Scholar] [CrossRef]
  4. Shaluf, I.M.; Abdullah, S.A. Floating roof storage tank boilover. J. Loss Prev. Process Ind. 2011, 24, 1–7. [Google Scholar] [CrossRef]
  5. Yang, H.; Ren, B.; Huang, Y.; Zhang, Z.; Hu, W.; Liu, M.; Zhao, H.; Jiang, G.; Hao, Z. Volatile organic compounds (VOCs) emissions from internal floating-roof tank in oil depots in Beijing: Influencing factors and emission reduction strategies analysis. Sci. Total Environ. 2024, 916, 170222. [Google Scholar] [CrossRef] [PubMed]
  6. Hameed, A.S.; Salmi, H.; Hajri, Z. Successful Implementation of Innovative Technologies and Solutions for the Design and Construction of Heavy Wall Oversized Double Deck Floating Roof Tanks at MAF Tank Farm. In Proceedings of the SPE EOR Conference at Oil and Gas West Asia, Muscat, Oman, 12–14 May 2025; SPE: Richardson, TX, USA, 2025; p. D021S021R002. [Google Scholar]
  7. Mangushev, R.; Sotnikov, S. Comparison of deformations of the large floating-roof tanks with the results of long-term monitoring. E3S Web Conf. 2020, 164, 01022. [Google Scholar] [CrossRef]
  8. API Standard. Welded Tanks for Oil Storage; American Petroleum Institute: Washington, DC, USA, 2013; p. 1220. [Google Scholar]
  9. Jia, P.; Lv, J.; Sun, W.; Jin, H.; Meng, G.; Li, J. Modified analytic hierarchy process for risk assessment of fire and explosion accidents of external floating roof tanks. Process Saf. Prog. 2024, 43, 9–26. [Google Scholar] [CrossRef]
  10. Moshashaei, P.; Alizadeh, S.S.; Khazini, L.; Asghari-Jafarabadi, M. Investigate the causes of fires and explosions at external floating roof tanks: A comprehensive literature review. J. Fail. Anal. Prev. 2017, 17, 1044–1052. [Google Scholar] [CrossRef]
  11. Salimbeni, M.; De Angelis, M.; Ciucci, M. Modeling of floating roof tanks under seismic excitation, accounting for the influence of sealing system and the roof pounding. Structures 2024, 70, 107590. [Google Scholar] [CrossRef]
  12. Wu, W.; Zhang, J. Buckling Mode Analysis of Floating Roof Storage Tank under Wind Load. J. Liaoning Univ. Pet. Chem. Technol. 2020, 40, 78. [Google Scholar]
  13. Sun, B.; Ma, D.; Gao, L.; He, M.; Peng, Z.; Li, X.; Wang, W. Wind buckling analysis of a large-scale open-topped steel tank with harmonic settlement-induced imperfection. Buildings 2022, 12, 1973. [Google Scholar] [CrossRef]
  14. Du, L.; Zhao, W.; Yan, H.; Liu, D. Stability and Strength Analysis of Internal Floating Roof Atmospheric Tank. In Proceedings of the IOP Conference Series: Materials Science and Engineering, Wuhan, China, 14–16 June 2019; IOP Publishing: Bristol, UK, 2019; p. 012066. [Google Scholar]
  15. Żyliński, K.; Górski, J. Probabilistic estimation of diverse soil condition impact on vertical axis tank deformation. Bull. Pol. Acad. Sciences. Tech. Sci. 2023, 71, e144576. [Google Scholar] [CrossRef]
  16. Bernard, G.; Vera, D.; Lim, W.K. Seismic Response Analysis of Flexible Drain System Into External Floating Roof Storage Tanks. In Proceedings of the Pressure Vessels and Piping Conference, Waikoloa, HI, USA, 16–20 July 2017; American Society of Mechanical Engineers: New York, NY, USA, 2017; p. V008T08A019. [Google Scholar]
  17. Wang, M.; Sun, Z.; Sun, J.; Cui, L.; Wu, Y. Probabilistic seismic fragility assessment of vertical storage tank with a floating roof. Structures 2023, 48, 318–330. [Google Scholar] [CrossRef]
  18. Epstein, H.I. Stresses and displacements for floating pan roofs. Comput. Struct. 1982, 15, 433–438. [Google Scholar] [CrossRef]
  19. Chiappelloni, L.; Belardi, V.; Serraino, F.; Trupiano, S.; Gaetani, L.; Vivio, F. Structural behaviour of single-deck floating roof tanks subject to seismic loading. In Proceedings of the IOP Conference Series: Materials Science and Engineering, Genova, Italy, 6–9 September 2023; IOP Publishing: Bristol, UK, 2024; p. 012002. [Google Scholar]
  20. Noaman, A.S.; El-Samanody, M.; Ghorab, A. Design and study of floating roofs for oil storage tanks. Int. J. Eng. Dev. Res. 2016, 4, 1–12. [Google Scholar]
  21. Goudarzi, M.A. Seismic behavior of a single deck floating roof due to second sloshing mode. J. Press. Vessel. Technol. 2013, 135, 11801. [Google Scholar] [CrossRef]
  22. Shi, L.; Shuai, J.; Wang, X.; Xu, K. Experimental and numerical investigation of stress in a large-scale steel tank with a floating roof. Thin-Walled Struct. 2017, 117, 25–34. [Google Scholar] [CrossRef]
  23. Nishi, H.; Yamada, M.; Zama, S.; Hatayama, K.; Sekine, K. Experimental study on the sloshing behavior of the floating roof using a real tank. J. High Press. Inst. Jpn. 2008, 46, 4–17. [Google Scholar]
  24. Rouzbahani, A.; Amirsradari, S.; Goudarzi, M. Experimental study of using an innovative porous floating roof for suppression of sloshing effects in cylindrical storage tanks. Ocean Eng. 2024, 310, 118735. [Google Scholar] [CrossRef]
  25. De Angelis, M.; Giannini, R.; Paolacci, F. Experimental investigation on the seismic response of a steel liquid storage tank equipped with floating roof by shaking table tests. Earthq. Eng. Struct. Dyn. 2010, 39, 377–396. [Google Scholar] [CrossRef]
  26. Kuś, J.; Wałach, S. Analysis of steel tank shell deformation and its impact on further utilisation. Int. J. Press. Vessel. Pip. 2021, 193, 104453. [Google Scholar] [CrossRef]
  27. Bernier, C.; Padgett, J.E. Fragility assessment of floating roof storage tanks during severe rainfall events. J. Perform. Constr. Facil. 2020, 34, 04020101. [Google Scholar] [CrossRef]
  28. Priyadarshan, S.S.; Iacono, S.; Vercelli, G. A UAV-Based Digital Twin Framework for Real-Time Monitoring and Risk Assessment of Floating Roof Storage Tanks. In Proceedings of the 2024 IEEE International Conference on Big Data (BigData), Washington, DC, USA, 15–18 December 2024; IEEE: New York, NY, USA, 2024; pp. 5526–5531. [Google Scholar]
  29. Al Omari, A.; Herzalla, O.; Toubar, A.; Almalood, N.; Al Hammadi, H. Floating roof storage tanks life extension: A novel risk revealed. In Proceedings of the Abu Dhabi International Petroleum Exhibition and Conference, Abu Dhabi, United Arab Emirates, 11–14 November 2019; SPE: Richardson, TX, USA, 2019; p. D021S036R003. [Google Scholar]
  30. Chen, Z.; Huang, S.; Fan, H. Strength and stability analysis of double-deck floating roof under wind load. In Proceedings of the Pressure Vessels and Piping Conference, Boston, MA, USA, 19–23 July 2015; American Society of Mechanical Engineers: New York, NY, USA, 2015; p. V01BT01A040. [Google Scholar]
  31. Qin, R.; Zhu, J.; Khakzad, N. Multi-hazard failure assessment of atmospheric storage tanks during hurricanes. J. Loss Prev. Process Ind. 2020, 68, 104325. [Google Scholar] [CrossRef]
  32. ASME SA-516/SA-516M-2021; Specification for Pressure Vessel Plates, Carbon Steel, for Moderate- and Lower-Temperature Service. American Society of Mechanical Engineers: New York, NY, USA, 2021.
  33. Tariverdilou, S.; Shabani, R.; Salarieh, H. Effect of flexural and membrane stiffness on the analysis of floating roofs. Arch. SID 2010, 23, 57–64. [Google Scholar]
  34. Hakim, G.; Abramovich, H. Large deflections of thin-walled plates under transverse loading—Investigation of the generated in-plane stresses. Materials 2022, 15, 1577. [Google Scholar] [CrossRef]
  35. Gharababaei, H.; Darvizeh, A. Experimental and analytical investigation of large deformation of thin circular plates subjected to localized and uniform impulsive loading#. Mech. Based Des. Struct. Mach. 2010, 38, 171–189. [Google Scholar] [CrossRef]
  36. Roylance, D. Transformation of Stresses And Strains. Lecture Notes in Mechanics of Materials; Department of Materials Science and Engineering, Massachusetts Institute of Technology: Cambridge, MA, USA, 14 May 2001; Available online: https://resources.saylor.org/wwwresources/archived/site/wp-content/uploads/2012/09/ME1022.4.3.pdf (accessed on 1 September 2025).
  37. Velikanov, N.; Koryagin, S.; Sharkov, O. Stresses in circular plates with rigid elements. J. Phys. Conf. Ser. 2018, 1015, 052028. [Google Scholar] [CrossRef]
  38. Amstutz, S.; Novotny, A.A. Topological optimization of structures subject to von Mises stress constraints. Struct. Multidiscip. Optim. 2010, 41, 407–420. [Google Scholar] [CrossRef]
  39. Gujar, P.; Ladhane, K. Bending analysis of simply supported and clamped circular plate. Int. J. Civ. Eng. 2015, 2, 69–75. [Google Scholar] [CrossRef]
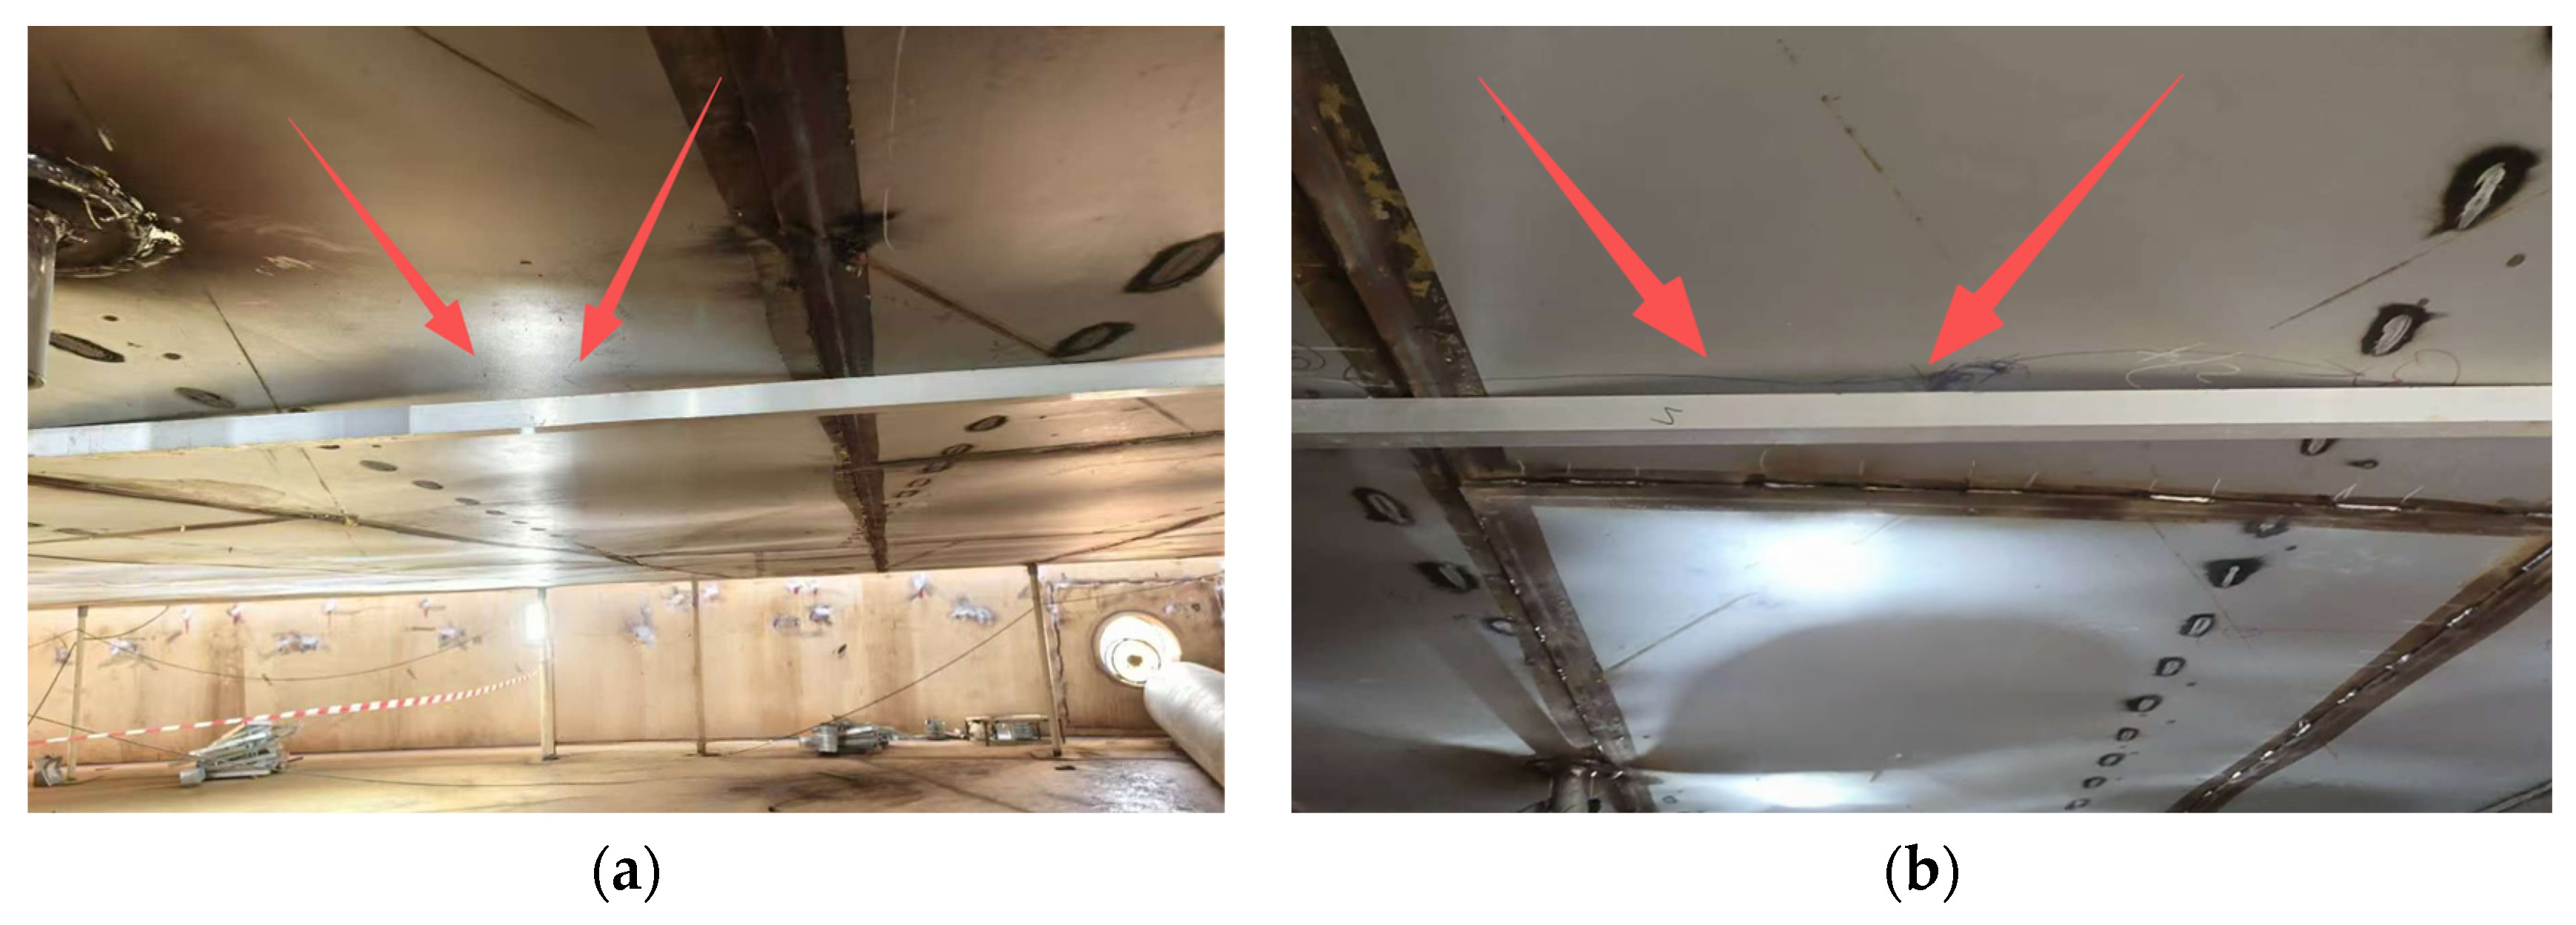
Figure 1. Irregular deformation of the floating roof bottom plate welding measured on-site: (a) irregular deformation in the middle area; (b) irregular deformation in the edge area.
Applsci 15 11473 g001
Figure 2. Data point locations for base plate measurements: (a) overall measurement point distribution; (b) local distribution of measurement points in the first annular area. Black numbers represent the radius from the disk center. Red and blue numbers denote the measurement point IDs, where red points correspond to deformation values greater than 50 mm, and blue points indicate deformation values between 40 and 50 mm.
Applsci 15 11473 g002
Figure 3. Base plate deformation cloud map generated based on measured data.
Applsci 15 11473 g003
Figure 4. Automated process flow for building a deformable base plate model.
Applsci 15 11473 g004
Figure 5. Automated modeling process of the overall finite element model of the floating roof structure.
Applsci 15 11473 g005
Figure 6. A complete 3D model of the floating roof structure. Different color areas represent different ring plate intervals, from the inside to the outside, they are ring plate intervals 1–6.
Applsci 15 11473 g006
Figure 7. Comparative cloud diagram illustrating the mechanical responses of the two model bottom plates under the normal floating condition: (a) equivalent stress cloud diagram of deformation model; (b) equivalent stress cloud diagram of ideal model; (c) displacement cloud map of deformation model in the vertical direction; (d) displacement cloud map of ideal model in the vertical direction.
Applsci 15 11473 g007
Figure 8. Comparison of equivalent stress extracted along the radial path between the deformation model and the ideal model under the normal floating condition.
Applsci 15 11473 g008
Figure 9. Comparative cloud diagram illustrating the mechanical responses of the two model bottom plates under the extreme uniform rainfall condition: (a) equivalent stress cloud diagram of deformation model; (b) equivalent stress cloud diagram of ideal model; (c) displacement cloud map of deformation model in the vertical direction; (d) displacement cloud map of ideal model in the vertical direction.
Applsci 15 11473 g009
Figure 10. Comparison of equivalent stress extracted along the radial path between the deformation model and the ideal model under the extreme uniform rainfall condition.
Applsci 15 11473 g010
Figure 11. Comparative cloud diagram illustrating the mechanical responses of the two model bottom plates under the extreme non-uniform rainfall condition: (a) equivalent stress cloud diagram of deformation model; (b) equivalent stress cloud diagram of ideal model; (c) displacement cloud map of deformation model in the vertical direction; (d) displacement cloud map of ideal model in the vertical direction.
Applsci 15 11473 g011
Figure 12. Comparison of equivalent stress extracted along the radial path between the deformation model and the ideal model under the extreme non-uniform rainfall condition.
Applsci 15 11473 g012
Figure 13. Comparative cloud diagram illustrating the mechanical responses of the two model bottom plates under the outrigger bottoming condition: (a) equivalent stress cloud diagram of deformation model; (b) equivalent stress cloud diagram of ideal model; (c) displacement cloud map of deformation model in the vertical direction; (d) displacement cloud map of ideal model in the vertical direction.
Applsci 15 11473 g013
Figure 14. Comparison of equivalent stress extracted along the radial path between the deformation model and the ideal model under the outrigger bottoming condition.
Applsci 15 11473 g014
Table 1. Statistics of the number of concentric circle measurement lines and measurement points in different annular areas.
Ring Area NumberRadius Range [m]Number of Measuring LinesNumber of Measuring Points on the Measuring LineTotal Number of Regional Measuring Points
12–9872576
211–155120600
317–2261761056
423–2752401200
530–343280840
637–392336672
Table 2. Comparison of the response results of the two models under all working conditions.
ConditionsModelBottom PlateTop Plate
Maximum Stress [MPa]Displacement Range [mm]Maximum Stress [MPa]Displacement Range [mm]
normal floatingdeformation24.01−6.08–7.0514.30−7.69–4.67
ideal20.12−3.32–5.7714.25−5.13–2.66
relative ratio19%22–83%0.35%49–75%
extreme uniform rainfalldeformation67.29−4.53–17.5166.09−15.26–9.22
ideal53.973.74–13.6865.34−14.53–5.76
relative ratio24%21–28%1.13%5–60%
extreme non-uniform rainfalldeformation128.18−27.97–51.93164−40.44–44.48
ideal39.17−19.08–35.70116.04−28.04–33.13
relative ratio227%45%–47%41%34–44%
outrigger bottomingdeformation32.13−4.55–0.1236.11−4.32–−0.01
ideal25.66−4.55–0.0129.15−4.47–0.24
relative ratio25%––24%––
Disclaimer/Publisher’s Note: The statements, opinions and data contained in all publications are solely those of the individual author(s) and contributor(s) and not of MDPI and/or the editor(s). MDPI and/or the editor(s) disclaim responsibility for any injury to people or property resulting from any ideas, methods, instructions or products referred to in the content.