Article

Mitigating Crossfire Attacks via Topology Spoofing Based on ENRNN-MTD

1
School of Cryptography Engineering, Information Engineering University, Zhengzhou 450001, China
2
Henan Key Laboratory of Information Security, Zhengzhou 450001, China
*
Author to whom correspondence should be addressed.
Appl. Sci. 2025, 15(21), 11432; https://doi.org/10.3390/app152111432 (registering DOI)
Submission received: 10 September 2025 / Revised: 13 October 2025 / Accepted: 17 October 2025 / Published: 25 October 2025
(This article belongs to the Special Issue IoT Technology and Information Security)

Abstract

Crossfire attacks disrupt network services by targeting critical links of server groups, causing traffic congestion and server failures that prevent legitimate users from accessing services. To counter this threat, this study proposes a novel topology spoofing defense mechanism based on a sequence-based Graph Neural Network–Moving Target Defense (ENRNN-MTD). During the reconnaissance phase, the method employs a GNN to generate multiple random and diverse virtual topologies, which are mapped to various external hosts. This obscures the real internal network structure and complicates the attacker’s ability to accurately identify it. In the attack phase, an IP random-hopping mechanism using a chaotic sequence is introduced to conceal node information and increase the cost of launching attacks, thereby enhancing the protection of critical services. Experimental results demonstrate that, compared to existing defense mechanisms, the proposed approach exhibits significant advantages in terms of deception topology randomness, defensive effectiveness, and system load management.

1. Introduction

As an emerging form of DDoS attacks, crossfire attacks often employ scanning, probing, and other techniques [1,2] to gather topology information of the target network and identify critical assets such as pivotal links and decoy servers. By flooding these key links, attackers can disrupt connectivity between the target network and the Internet, resulting in large-scale network failures and significant threats to cybersecurity [3,4]. In response, researchers have developed various defensive approaches to combat crossfire attacks, including detection mechanisms, mitigation strategies based on attack source identification and rerouting, traffic scrubbing techniques, and topology spoofing-based defense methods.
Network topology spoofing functions as an active defense strategy that obscures the actual network structure and impedes attackers’ analysis, all without interfering with normal traffic forwarding. This mechanism helps mitigate defenders’ disadvantages during attacks and has gained increasing attention as a prominent research focus in recent years.
The existing virtual-topology dynamic defense algorithms can be categorized into three main types.
(1)
Defense algorithms based on Flow Rerouting [5,6,7,8,9] can achieve traffic protection by rerouting probe flows or balancing flow density. However, they may create bottlenecks in the other physical nodes and links.
(2)
Defense algorithms based on Overlay Networks [10,11] typically obscure network routing through route tracking, whereas their reliance on a single metric limits their effectiveness and overlooks other possible forms of physical topology.
(3)
Defense algorithms based on Virtual Networks [12,13,14,15] can protect the real network topology and characteristics by blocking network reconnaissance and implementing other strategies. However, they fail to account for complex topological structures during the reconnaissance phase, thereby limiting their practical application.
Existing topology spoofing methods can primarily defend against crossfire attacks through dynamic topology generation and node spoofing. Although they offer defensive effectiveness, several issues remain to be resolved. (1) The randomness of the virtual network topology is limited because topology generation relies on manual input parameters, thereby reducing unpredictability. Attackers can exploit this weakness using traversal or other methods, thereby undermining their defense. (2) The depth of defense is weak because once attackers bypass the deception mechanism during the topology exploration phase, there is no additional protection against crossfire attacks, making it difficult for core modules to maintain service availability. (3) The defense mechanism impacts service efficiency, as network topology spoofing increases the operational overhead, potentially disrupting normal service delivery.
To overcome these challenges, this paper proposes a novel topology spoofing defense mechanism based on a sequence-based Graph Neural Network–Moving Target Defense (ENRNN-MTD). Moving beyond the conventional paradigm of merely combining multiple techniques in hybrid defenses, our method achieves, for the first time, intelligent collaboration between topology spoofing and address hopping mechanisms. Furthermore, it establishes a novel “perception-decision-concealment” framework for dynamic defense. The main contributions of this work are as follows:
  • We propose a topology spoofing defense mechanism based on GNN. By designing a novel network topology encoding method and adopting depth-first search (DFS) traversal, the network topology is encoded into a set of quintuples consisting of edge sequences and node sequences. Based on the graph neural network model, a large number of virtual topologies with similar structures but distinct differences are generated. This effectively addresses the issue of low randomization in the dynamic defense of virtual topologies and enhances the defense capability during the network detection phase.
  • A dynamic stealth defense mechanism based on IP hopping is proposed. By leveraging Moving Target Defense (MTD), a random address-hopping technique using chaotic sequences was designed to conceal the key node information of core services and enhance defense capabilities during the attack phase.
  • The evaluation was achieved by implementing a topology spoofing defense prototype system that was optimized by fine-tuning the parameters of the GNN and IP hop mechanisms. Experimental results demonstrate that our approach reduces the server response time by over 60% under crossfire attacks compared to an undefended system, while introducing less than 10% additional CPU overhead and maintaining sub-10 ms latency for legitimate traffic.
The remainder of this article is organized as follows: Section 2 introduces technological research, and Section 3 presents the overall defense framework along with the attack model. Section 4 details the design of the key defense mechanisms, and Section 5 describes the experiments and analysis. Finally, Section 6 provides a summary and outlook.

2. Related Work

2.1. Topology Spoofing Defense Scheme

Table 1 systematically compares the differences between existing virtual topology dynamic defense mechanisms and the proposed approach. Next, we present related work, classifying them into the three main categories of topology spoofing defense schemes.
(1)
Flow Rerouting (FR)-based methods. LinkBait [5] introduced a link ambiguity algorithm that selectively rerouted probe flows to conceal target links from adversaries, misleading them into identifying a decoy link as the target. SPIFFY [6] increases attack costs and enhances attack traffic detection by temporarily expanding the core link bandwidth through Software-Defined Networking (SDN). Kim et al. proposed EqualNet [7], a secure long-term network topology obfuscation framework that is able to balance flow density to prevent attackers from targeting network bottlenecks and link flooding. Zhou et al. presented PRDD [8], an SDN-based persistent routing diversification defense method that mitigates attacks on routing nodes by identifying persistent links through congestion measurements and deploying multiple agents on the entry switches of attacked persistent links in a scalable manner.
(2)
Overlay Network (ON)-based methods. Trassare et al. [10] hid the critical routes and links by mapping the false topology to remote attackers through traceroute. Meier et al. proposed NetHide [11], a network topology obfuscation framework that can transform topology obfuscation into a multi-objective optimization problem based on security requirements and availability indicators. By leveraging P4 programmable switches, NetHide provides attackers with false network topology information while maintaining traceroute availability and link security.
(3)
Virtual Network (VN)-based methods. The Reconnaissance Deception System (RDS) [13] obstructs network reconnaissance by delaying the adversaries’ scanning techniques and invalidating the collected information while minimizing the impact of performance on legitimate traffic. Aydeger et al. [12] applied Network Function Virtualization (NFV) to deceive attackers with false topology information without exposing the actual network structure. Kim et al. [16] proposed an SDN-based active defense method, SDHoneyNet, which leveraged the SDN switches’ statistical functions to identify the key network nodes potentially containing bottleneck links. the Barabási-Albert model [17] deploys a decoy network following a power law distribution near these nodes. Liu et al. [18] introduced NetObfu, a lightweight and cost-effective network topology spoofing method that is able to compute a virtual topology under security constraints, minimizing costs while ensuring that each node responded to the attackers’ detection attempts based on the spoofed topology. BOTTLENET [15] presented a comprehensive topology spoofing framework that offers a range of bottleneck metrics and topology spoofing algorithms, enabling the construction and deployment of more secure virtual topologies.

2.2. Graph Generation Models

Graph generation models can be categorized into traditional algorithms and deep learning-based methods. Traditional algorithms are typically grounded in mathematical graph theory and predefined structural rules. They aim to generate graphs that possess specific statistical properties observed in real-world networks, such as a power-law degree distribution (e.g., the Barabási-Albert model), a small-world structure (e.g., the Watts-Strogatz model), or random connectivity (e.g., the Erdős–Rényi model). While highly interpretable and computationally efficient, these models rely on manually observing and encoding the key features of real graphs, introducing a degree of subjectivity and often failing to capture the complex, multi-faceted structural patterns and attribute information present in real network topologies. In contrast, deep learning-based methods learn these characteristics directly from datasets, capturing both structural and attribute information to better fit graph structures in a more holistic and data-driven manner.
Existing deep learning-based graph generation algorithms include variational autoencoder-based models, adversarial generative networks, and recurrent neural network (RNN)-based models. Variational autoencoders such as JTVAE [19], GraphVAE [20], and NeVAE [21] use an encoder to transform molecular graphs into hidden vectors and a decoder to reconstruct the original data. Generative adversarial networks, including NetGAN [22], ORGAN [23], MolGAN [24], and CONDGEN [25], consist of generators and discriminators. The generator produces data similar to real samples to confuse the discriminator, which in turn attempts to distinguish between real and generated data, continuously enhancing the model through adversarial training. RNN-based graph generation models such as GraphRNN [26], DeepRNN [27], and MGRNN [28] treat graph generation as a sequence generation process by converting graphs into sequences and using RNNs to generate similar structures, which can then be mapped back to graphs.
The virtual topology generation mechanism proposed in this study belongs to the third category, in which the physical topology is mapped to a graph model, an RNN generates a similar graph, and the generated graph is then mapped back to a virtual topology corresponding to the physical topology.

2.3. Moving Target Defense Method Based on IP Hopping

The IP address serves as a crucial identifier for network nodes and is fundamental to various network attack methods. Traditional static IP address assignments make it easier for attackers to identify targets and launch attacks via network sniffing or address scanning. As a form of moving target defense, address hopping introduces a dynamic transformation and update mechanism for network addresses, replacing traditional frequency-hopping communication. By processing network data packets or coordinating network address transformations, this approach makes it difficult for attackers to determine the actual addresses of communicating parties, thereby reducing the attack success rate. However, in traditional distributed networks, address mutations can lead to session interruptions, and the frequency of address changes is limited by the speed of end-host configuration updates. SDN enables address mutation based on the data flow, thereby preventing session interruptions. In addition, SDN controllers can manage switches along the transmission path to rewrite packet addresses, thereby allowing dynamic address changes during transmission. Therefore, in SDN-based network architectures, address hopping can be implemented more flexibly and efficiently at lower costs.
Based on SDN, SHARMA et al. [29] proposed Flexible Random Virtual IP Multiplexing (FRVM), which equipped hosts with multiple virtual IP addresses and dynamically mapped them through multiplexing and demultiplexing events, increasing the cost for attackers to collect information but reducing the communication service quality for legitimate users. Jafarian et al. [30] introduced an IP address dynamic transformation method using OpenFlow, where virtual IPs (vIPs) are assigned by the OpenFlow controller based on satisfiability modulo theories (SMT) and reassigned at fixed intervals using either equal probability or weight-based assignment. However, this approach is limited to SDN architecture. To address this, the same research team later proposed a spatiotemporal address dynamic transformation method for traditional networks [31], where each host was assigned a temporary IP address set that is able to update continuously at random intervals, making it difficult for both users and attackers to determine the actual communication address. Wang et al. [32] developed an SDN-based dynamic network address transfer method to overcome the constraints of traditional network architectures, utilizing a POX controller to manage network addresses and DNS responses, thereby expanding the address transfer range and increasing the difficulty for attackers to obtain real host addresses. To address the issue of excessively large transfer ranges and invalid transfer addresses in SDN-based address transformation, Makanju et al. [33] introduced an evolutionary algorithm that can search for a vast address space to select an optimal network address for transfer. Although this approach offers a novel research direction, it suffers from long search times, giving attackers opportunities to obtain system information and analyze the network environment. Qin et al. [34] developed a novel SDN-based automated traffic control and MTD defensive framework against DDoS attacks for ICS networks, enhancing protection for critical nodes with an innovative IP shuffling technique.
To address the challenges of synchronization in traditional networks, the impact of high-frequency jumps on communication quality, the vulnerability of static jump rules to attacks, and the inflexibility and high deployment cost of existing jump strategies, we proposed a random address-hopping scheme based on chaotic sequences in SDN. The pre-negotiated IP address between communication parties served as a low-frequency hopping virtual IP to initiate communication and ensure service quality, whereas a high-frequency hopping virtual IP was generated using chaotic sequences to enhance the randomness and prevent the predictability of static hopping rules.

3. System Model

3.1. Threat Modeling

Crossfire attacks employ a network of distributed bots to direct low-intensity traffic toward decoy nodes adjacent to the target server. The aggregation of these low-rate streams ultimately causes congestion in one or more critical links, thereby compromising the service availability of the target server or isolating the network segment.
This study assumed that the attacker is able to control m widely distributed bots in the external network, which could launch flooding traffic towards the target network area. Using a server in a specific network area as an example, the attack consists of two main phases: the reconnaissance phase, which includes topology investigation, key link selection, decoy server identification, and the attack phase, which involves sending flooding traffic.
Step 1: Topological probing. The attacker first scans the network to identify the IP addresses of online hosts and then utilizes a Traceroute or Simple Network Management Protocol (SNMP) to map the topology of the target network based on the obtained IP addresses.
Step 2: Select the Critical Links. The attacker directs each bot to send routing trace packets to the target server, obtaining the route set R and link set L. The set R comprises m “bot-to-target server” routes, corresponding to m attacker-controlled hosts, while L includes all the links involved in these routes. Each route comprises a sequence of consecutive links ( l k L ), and a link l k is considered to cover a route if it appears within it. A ratio threshold α is set to determine the smallest subset L L that can cover a × m segment routes in R, identifying L as the set of critical links.
Step 3: Select the Decoy Servers. Each selected decoy server must satisfy two conditions. First, the network distance between the decoy server and the target server should be within a predefined number of hops, which is an artificially set threshold. Assuming that the attacker has knowledge of the network topology near the target server, hosts that can satisfy this criterion form the set D 1 . Second, the routing path from a “bot-decoy server” should include at least β × | L | critical links, where β is an artificially set ratio threshold. For each host d k in D 1 , the attacker instructs each bot to send route tracing packets, obtaining the route set R 1 . If R 1 contains at least β × | L | routes, d k is retained as the decoy server. After traversing all hosts in D 1 , the remaining hosts form the set D 2 , which constitutes the final set of decoy servers.
Step 4: Send flooding traffic. The attacker directs bot hosts to send flooding traffic to decoy servers, causing the paralysis of critical links, increased latency, and excessive consumption of bandwidth and other resources. As network congestion builds at these critical links situated along the primary routes for external traffic to the target server, the target server becomes largely “isolated” and struggles to communicate with the external network.
The attacker was assumed to control the bot hosts to send routing trace data packets to the target server at T A intervals. If changes were detected in the set of critical links, the attacker repeated the process to initiate a new attack.

3.2. Defense Architecture

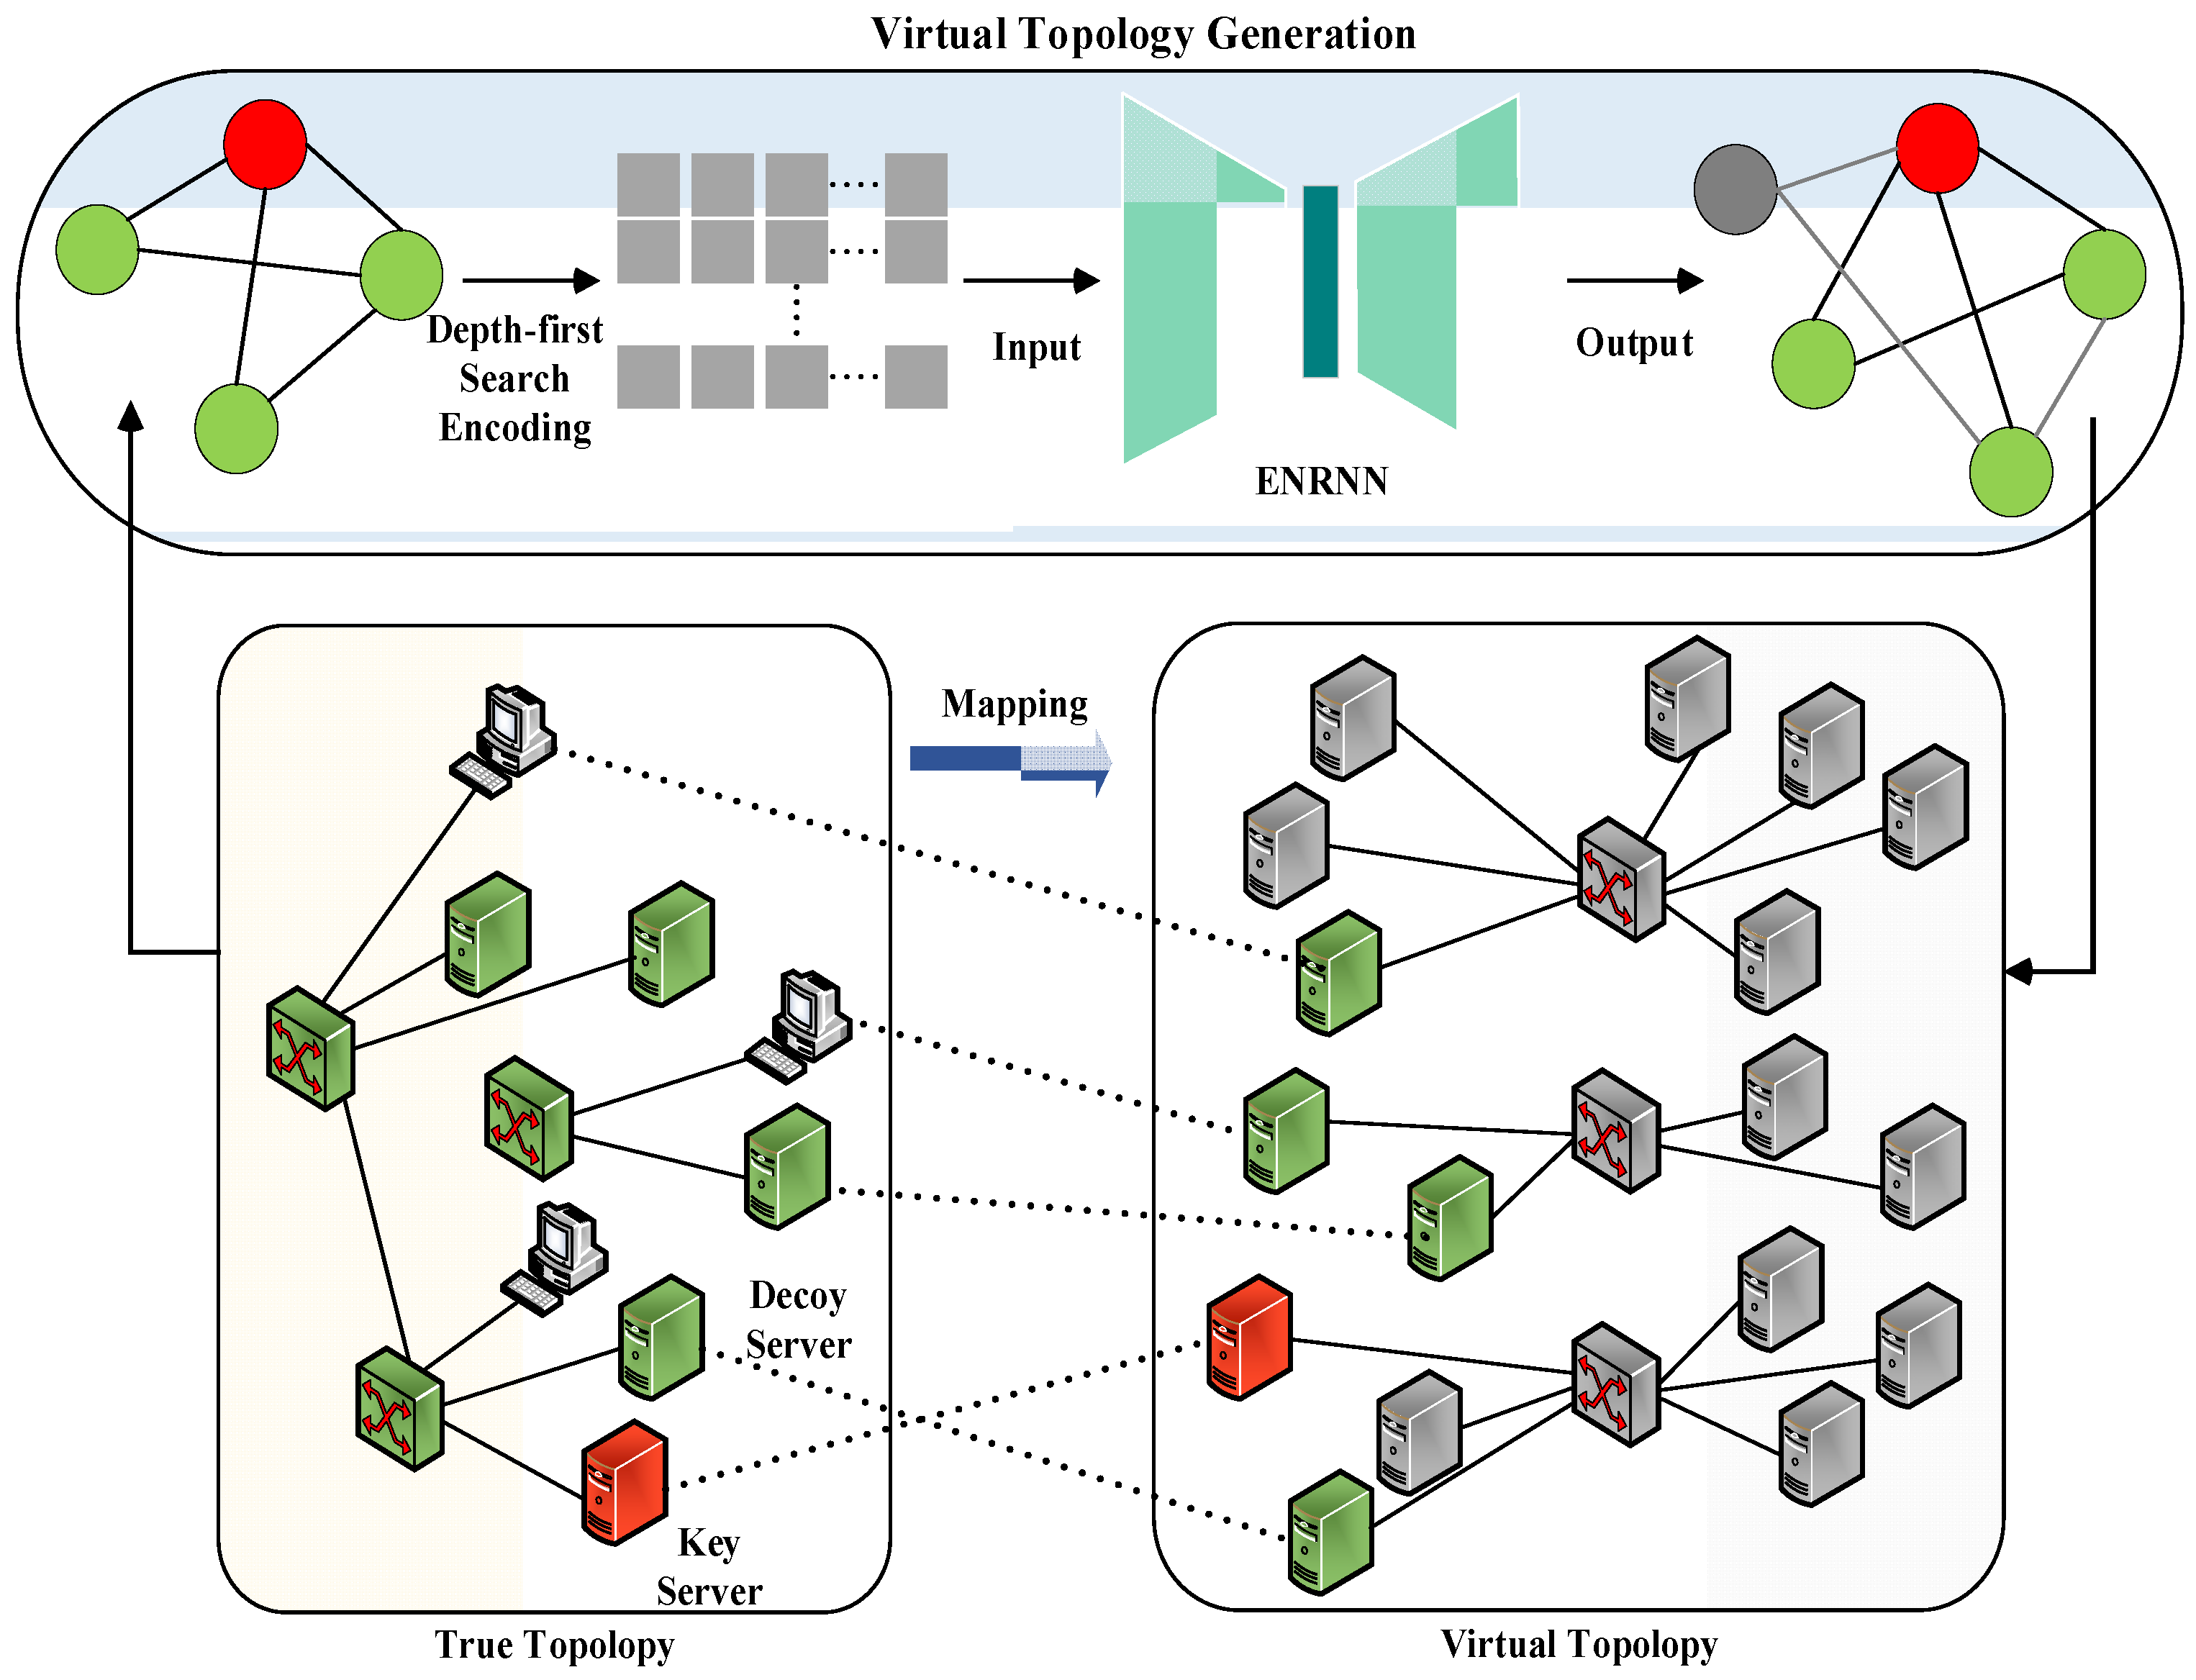
To address these threats, this study proposed a virtual topology spoofing defense architecture designed to counter crossfire attacks throughout the entire process (Figure 1).
During the attacker’s topology investigation and flooding attack, the defender utilized the controller to collect the network operation data and attacker information, responding with virtual topology generation/spoofing and dynamic IP address-hopping mechanisms. As shown in Figure 1, the defense process was centered on a controller that executed specific defense actions. The system workflow is outlined as follows:
(1)
Reconnaissance phase (main defense actions include steps 1–5). In period T, the defender detects topology exploration activities within the network and utilizes the topology analysis component to gather information on current physical network nodes, links, and related structures, thereby constructing a corresponding graph representation. Using DFS encoding, this graph structure is converted into sequence data and processed by a hierarchical recurrent neural network model, that is, a topology generator, to create a large set of random virtual network topologies stored in a topology pool. This randomness prevents attackers from accurately identifying structural changes, exploiting vulnerabilities, and predicting future virtual topologies.
During topology spoofing, the defender selects virtual topologies from the pool using a topology optimization algorithm, ensuring high structural similarity to the actual network while maintaining the same number of virtual topologies as the probe hosts. These virtual topologies are mapped to different probe host views, and false response packets are generated by modifying path hops. External attackers (i.e., topology inspectors) can only observe the virtual topology deliberately presented by the defender, with added random false transmission delays enhancing realism. Finally, the rule generator component generates the necessary network operation rules for the selected topology, which are then distributed to the corresponding nodes by the controller. When the number of remaining virtual topology structures in the pool falls below the threshold π or drops below the number of external probe hosts, new virtual topology structures are generated, and the topology pool is updated in the next cycle.
The expected defense effect in this phase was analyzed as follows. Suppose that the crossfire attack derives routing set R and link set L by controlling m bots. In this scenario, each bot independently observes a different internal network topology, and the attacker’s critical link set L′ has a size of α × m. Because no links are shared across different routes, if α × m routes are randomly selected from R and a link is randomly chosen from each to form a set, it satisfies the requirements of L′. The attacker then identifies decoy servers based on L′ and incorporates all hosts within h hops of the target server across all topology structures into the set D 1 . If routing trace packets are sent to hosts in D 1 , the number of critical links in R1 can be at most one. Consequently, the attacker must set an extremely small threshold β to ensure D2 ≠ ∅, resulting in |D2|≈|D1|, where a large number of decoys effectively disperses the attacker’s traffic.
(2)
Attack phase (main defense actions include steps 6–9). If the attacker successfully identifies the target node during the detection phase, the defender transitions to the attack phase. First, the hopping strategy management component generates a targeted hopping scheme based on existing network topology. Then, IP address hopping is implemented as the core mechanism to update the network node information. Finally, the rule generator component issues forwarding rules to the controller. The primary defense objective at this stage is to conceal the key node information, maximizing the attacker’s cost while ensuring that legitimate users receive timely forwarding table updates to maintain normal business traffic transmission.
The expected defense effect in the attack phase was analyzed as follows. If the attacker bypasses the topology exploration defense mechanism, they can send blind-flooding traffic to the key links and core servers of the target network, causing congestion in certain areas. At this point, the moving target defense mechanism is activated, implementing IP random hopping to effectively disperse the flooding traffic and protect the network and node resources. Additionally, by updating the list of bots identified through the intrusion detection system and other defense mechanisms, virtual topology spoofing is applied only to bots in the next round of defense, ensuring normal operation and service quality for legitimate external network users.

4. Proposed Defense Methods

This study proposed a topology spoofing dynamic defense method against crossfire attacks, incorporating a random topology generation mechanism and a dynamic IP hopping mechanism to enhance the security of key servers.

4.1. Virtual Topology Generation Based on Hierarchical Recurrent Neural Networks

Consider the scenario shown in Figure 2, which involves the real topology of the protected network (left) and virtual topology designed to deceive attackers (right). In real topology, each switch that functions as a forwarding node is connected to a spoofing server. When a switch receives a packet from an external network, it first forwards it to the spoofing server, which then modifies and forwards the packet according to the current virtual topology. In addition, the spoofing server generates fake replies, ensuring that external hosts can only observe the virtual topology while remaining unaware of the underlying true topology.
This study introduced a virtual topology generation and mapping mechanism based on a hierarchical Recurrent Neural Network. As shown in Figure 2, an Edge-Node Recurrent Neural Network (ENRNN) was adopted as the graph generation model to create the network topology. The topology generation method consisted of two main components.
(1)
Graph Structure Encoding. First, the graph structure of the real network was converted into sequence information using DFS coding.
(2)
Virtual topology generation. Edge-level and node-level recurrent networks in ENRNN were utilized to learn the graph structure and edge relationships, enabling the capture of potential topology changes.

4.1.1. DFS Encoding

In this section, the network topology is represented as a graph, where the nodes correspond to the real network entities and edges capture relationships between nodes and associated link information. Because all the graphs can be converted into an edge sequence using minimum DFS encoding, graph distribution learning was transformed into the learning of edge sequences.
Minimum DFS encoding identifies the smallest lexicographic order among the multiple DFS encodings of a graph. For instance, in the first five tuples, X in Figure 3b is smaller than Y in Figure 3c, making the lexicographical order encoded by the former smaller than that encoded by the latter. DFS encoding employed DFS traversal to convert the graph into an edge sequence. During traversal, each visited node was assigned a timestamp, and the edges were represented as five tuples that incorporated these timestamps. The five-tuple is formally defined as t p , t q , L p , L e , L q , where t p and t q denote the timestamp of the source node and destination node in DFS traversal, respectively, L p , L e and L q denote the label of the source node, edge and destination node, respectively. This specific five-element tuple is not arbitrary but is meticulously designed to form a complete and unique representation of the graph’s structure and attributes, applicable to any network topology. Each element serves a critical and non-redundant purpose: the timestamps t p and t q encode the structural order and connectivity discovered during traversal, allowing the model to distinguish between forward edges that expand the DFS tree and backward edges that form cycles; the node labels L p , L q preserve the semantic identity of the network entities; and the edge label L e captures the attributes of the link itself (e.g., bandwidth). The combination of these five elements into a single tuple for each edge ensures that the entire graph can be losslessly reconstructed from the sequence, providing a comprehensive foundation for the subsequent generation of realistic and diverse virtual topologies.
Then the sequence representation of the graph was formed using five tuples of all edges. If a forward edge (U, V) was part of the DFS traversal path, its timestamps could satisfy tU < tV, indicating that node U was visited before node V; otherwise, if tU > tV, edge (U, V) represents the backward path. Backward edges, as integral components of the graph, were also included in the sequence to ensure a complete graph representation.
In Figure 3, capital letters represent the node labels, and ‘a’ and ‘b’ indicate different edge attributes. The bold and dashed lines in Figure 3b,c denote the forward and backward edges, respectively, corresponding to the traversal paths included and excluded in the DFS. For instance, the depth-first traversal order in Figure 3b is [(v0, v1), (v1, v2), (v2, v3), (v2, v4)], resulting in the search encoding [(0, 1, W, a, X) (1, 2, X, b, Y)) (2, 0, Y, a, W (2, 3, Y, b, Z) (2, 4, Y, a, Z)]. Using the same method, the search encoding in Figure 3c is represented as [(0, 1, W, a, Y) (1, 2, Y, b, X) (2, 0, X, a, W) (1, 3, Y, b, Z) (1, 4, Y, a, Z)].
Minimum DFS encoding enables the graph to be uniquely represented as a sequence, establishing a one-to-one correspondence and reversible relationship between the graph and its sequence. This approach can reduce the sample space for the graph generation model and decrease the training time complexity.

4.1.2. Virtual Topology Generation

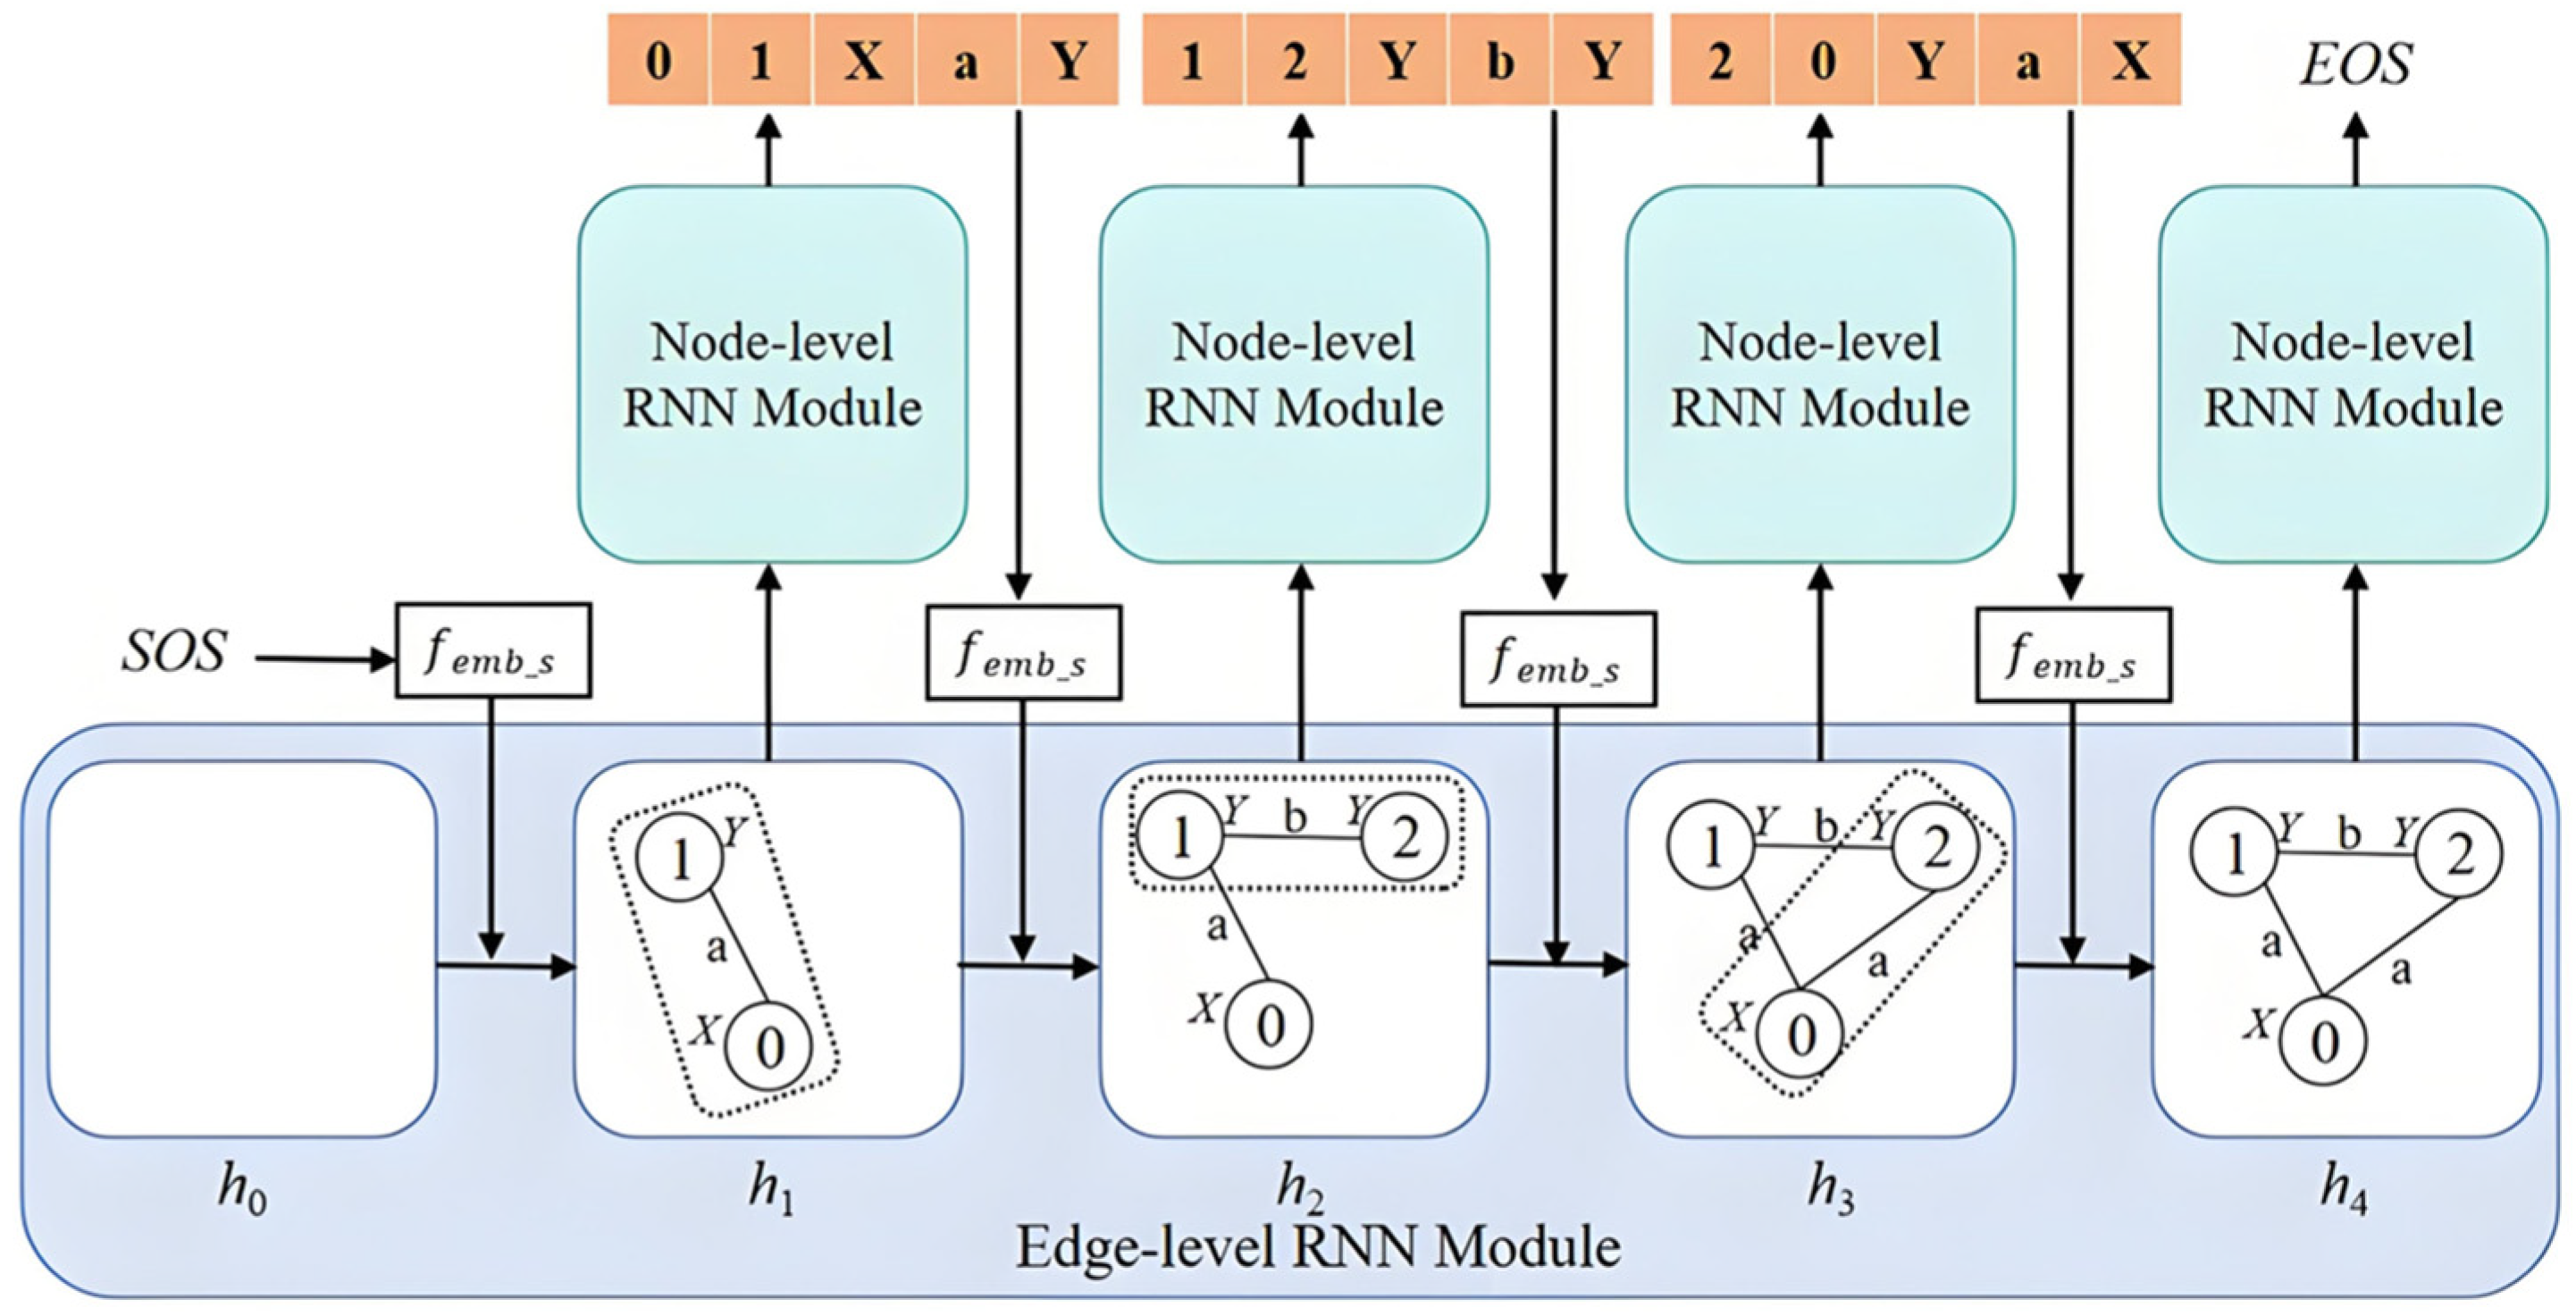
As shown in Figure 4, the hierarchical recurrent neural network completed mapping from the real topology to the corresponding virtual topology. Its main components included: (1) the Edge-Level Recurrent Neural Network (ELRNN), which learned the overall topology structure and generated a new hidden state based on the current input and the hidden state from the previous time step; and (2) the Node-Level Recurrent Neural Network (NLRNN), which captured the semantic information from nodes, edges, node labels, and edge labels in the real topology, generating timestamps and labels to form a complete edge.
Figure 4 illustrates the overall framework of the ENRNN, which comprises a hierarchical recurrent neural network. Learning the graph distribution from the edge sequence effectively captures the overall structure and generates the edge sequence of a new graph. The dotted rectangle in Figure 4 represents the structural information of the graph encoded in the new hidden state generated by ELRNN. An NLRNN sequentially generated the elements of a five-tuple to form a complete edge, thereby capturing the dependency relationships between nodes. Using the embedding function femb_s, each generated edge was transformed into the input for the next time step of the ELRNN. SOS and EOS denote start and end flags, respectively. When the hidden state of the ELRNN no longer contains new structural information, the NLRNN outputs the EOS flag, signaling the end of the graph generation process.
(1)
Edge-level Recurrent Neural Network (ELRNN)
Because long short-term memory (LSTM) neural networks can effectively handle long-term dependencies in sequences, they are used in ELRNN to capture the structural relationships between edges. The ELRNN is implemented as a two-layer stacked LSTM with a hidden state dimension of 256. A dropout rate of 0.2 is applied between layers to mitigate overfitting. At each time step, the ELRNN takes as input an embedding vector of the previously generated five-tuple edge, produced by the embedding function f e m b s .
Specifically, an ELRNN transforms the probability distribution of edge sequences into a product of individual edge probabilities, enabling it to learn both edge relationships and the overall graph structure. This architectural factorization—where the ELRNN operates at the coarse-grained edge sequence level—allows it to capture the global topological dependencies, establishing the context for the subsequent fine-grained node-level generation performed by the NLRNN. As Equation (1) presents, wi represents the five-tuple of the i-th edge, w<i represents the sequence of the previous i − 1 edges, and n denotes the total number of five-tuples:
p W = p w 1 , w 2 , , w n = Π i = 1 n p w i w < i
The ELRNN generated new five-tuples t based on previously generated ones, establishing relationships between them. To generate new edges, ELRNN derived the edge information by computing a new hidden state hi. As Equation (2) presents, femb_s serves as the embedding function that converts si−1 into the input vector for ftrans0 in ELRNN. Furthermore, using the hidden state vector hi−1 from the previous time step and the input vector from the current time step, ELRNN computes the new hidden state hi.
f t r a n s 0 h i 1 , f e m b s w i 1
(2)
Node-level Recurrent Neural Network (NLRNN)
An NLRNN captures dependencies between nodes. The NLRNN is implemented as a single-layer Gated Recurrent Unit (GRU) with a hidden state dimension of 128. This choice of GRU over LSTM was made for its computational efficiency while maintaining the ability to capture medium-range dependencies within the five-tuple elements. The NLRNN receives the current ELRNN hidden state hi as its initial input and sequentially processes the embedding vectors of each generated element in the five-tuple.
As each five-tuple consists of five elements, Equation (1) can be further decomposed into the product of the conditional probability distributions of the nodes, as shown in the following Equation (3):
p w i w < i = p t p , t q , l p , l e , l q w < i p t q w < i × p t q w < i , t p × p L p w < i , t p , t q × p L e w < i , t p , t q , L p × p L q w < i , t p , t q , l p , l e
This fine-grained factorization delegates the generation of individual five-tuple elements to the NLRNN, allowing it to specialize in capturing the semantic relationships and constraints between nodes and edge labels within a single edge context.
For each update of the hidden state in the ELRNN, the hidden state in the NLRNN must be updated four times. This process is represented with Equation (4), where ftrans1 generates the next node information in the NLRNN, and femb_tp, femb_tq, femb_Lp, and femb_Le are embedding functions that encode the generated nodes as inputs for the ELRNN.
h i , 0 = f t r a n s 1 h i , f e m b _ t p t p h i , 1 = f t r a n s 1 h i , 0 , f e m b _ t q t q h i , 2 = f t r a n s 1 h i , 1 , f e m b _ L p L p h i , 3 = f t r a n s 1 h i , 2 , f e m b _ L e L e
The node information was sampled from a parameterized probability distribution computed using the softmax layer. Each softmax output ranged between 0 and 1, with the sum of all values equal to 1. Specifically, the softmax layer converted Θ t p , Θ t q , Θ L p , Θ L e , and Θ L q , where Θ t p [ i ] and Θ L q [ j ] represent the probabilities of timestamp i and label j for node p , respectively. Θ t q , Θ L e , and Θ L q follow a similar representation. Thus, the node generation process is expressed with Equation (5), where f denotes the output function:
θ t p = s o f t m a x f t p h i , t p ~ C a t θ t p θ t q = s o f t m a x f t q h i , 0 , t q ~ C a t θ t q θ L p = s o f t m a x f L p h i , 1 , L p ~ C a t θ L p θ L e = s o f t m a x f L e h i , 2 , L e ~ C a t θ L e θ L q = s o f t m a x f L q h i , 3 , L q ~ C a t θ L q
This sampling procedure is executed sequentially for each of the five elements in the five-tuple ( t p , t q , L p , L e , L q ) following their dependency order defined in Equation (3). The temperature parameter τ = 0.8 was empirically determined to balance diversity and quality—lower values ( τ < 0.5 ) produce overly deterministic outputs, while higher values ( τ > 1.2 ) introduce excessive randomness that compromises structural coherence. Random sampling of the nodes from the distributions facilitates the generation of diverse graphs. In each time step of the ELRNN, the output was merged into a complete five-tuple w, representing a fully formed edge. The specific calculation process is as Equation (6):
w i = c o n c a t ( t p , t q , L p , L e , L q )

4.2. Random Address Hopping Defense Based on Chaotic Sequence

Although attackers cannot identify the real network topology or locate critical links and decoy servers, they may still attempt to send blind congested traffic to the target network, thereby causing congestion. In addition, if the virtual topology defense fails and the attacker detects a critical link, the second stage of defense is triggered.
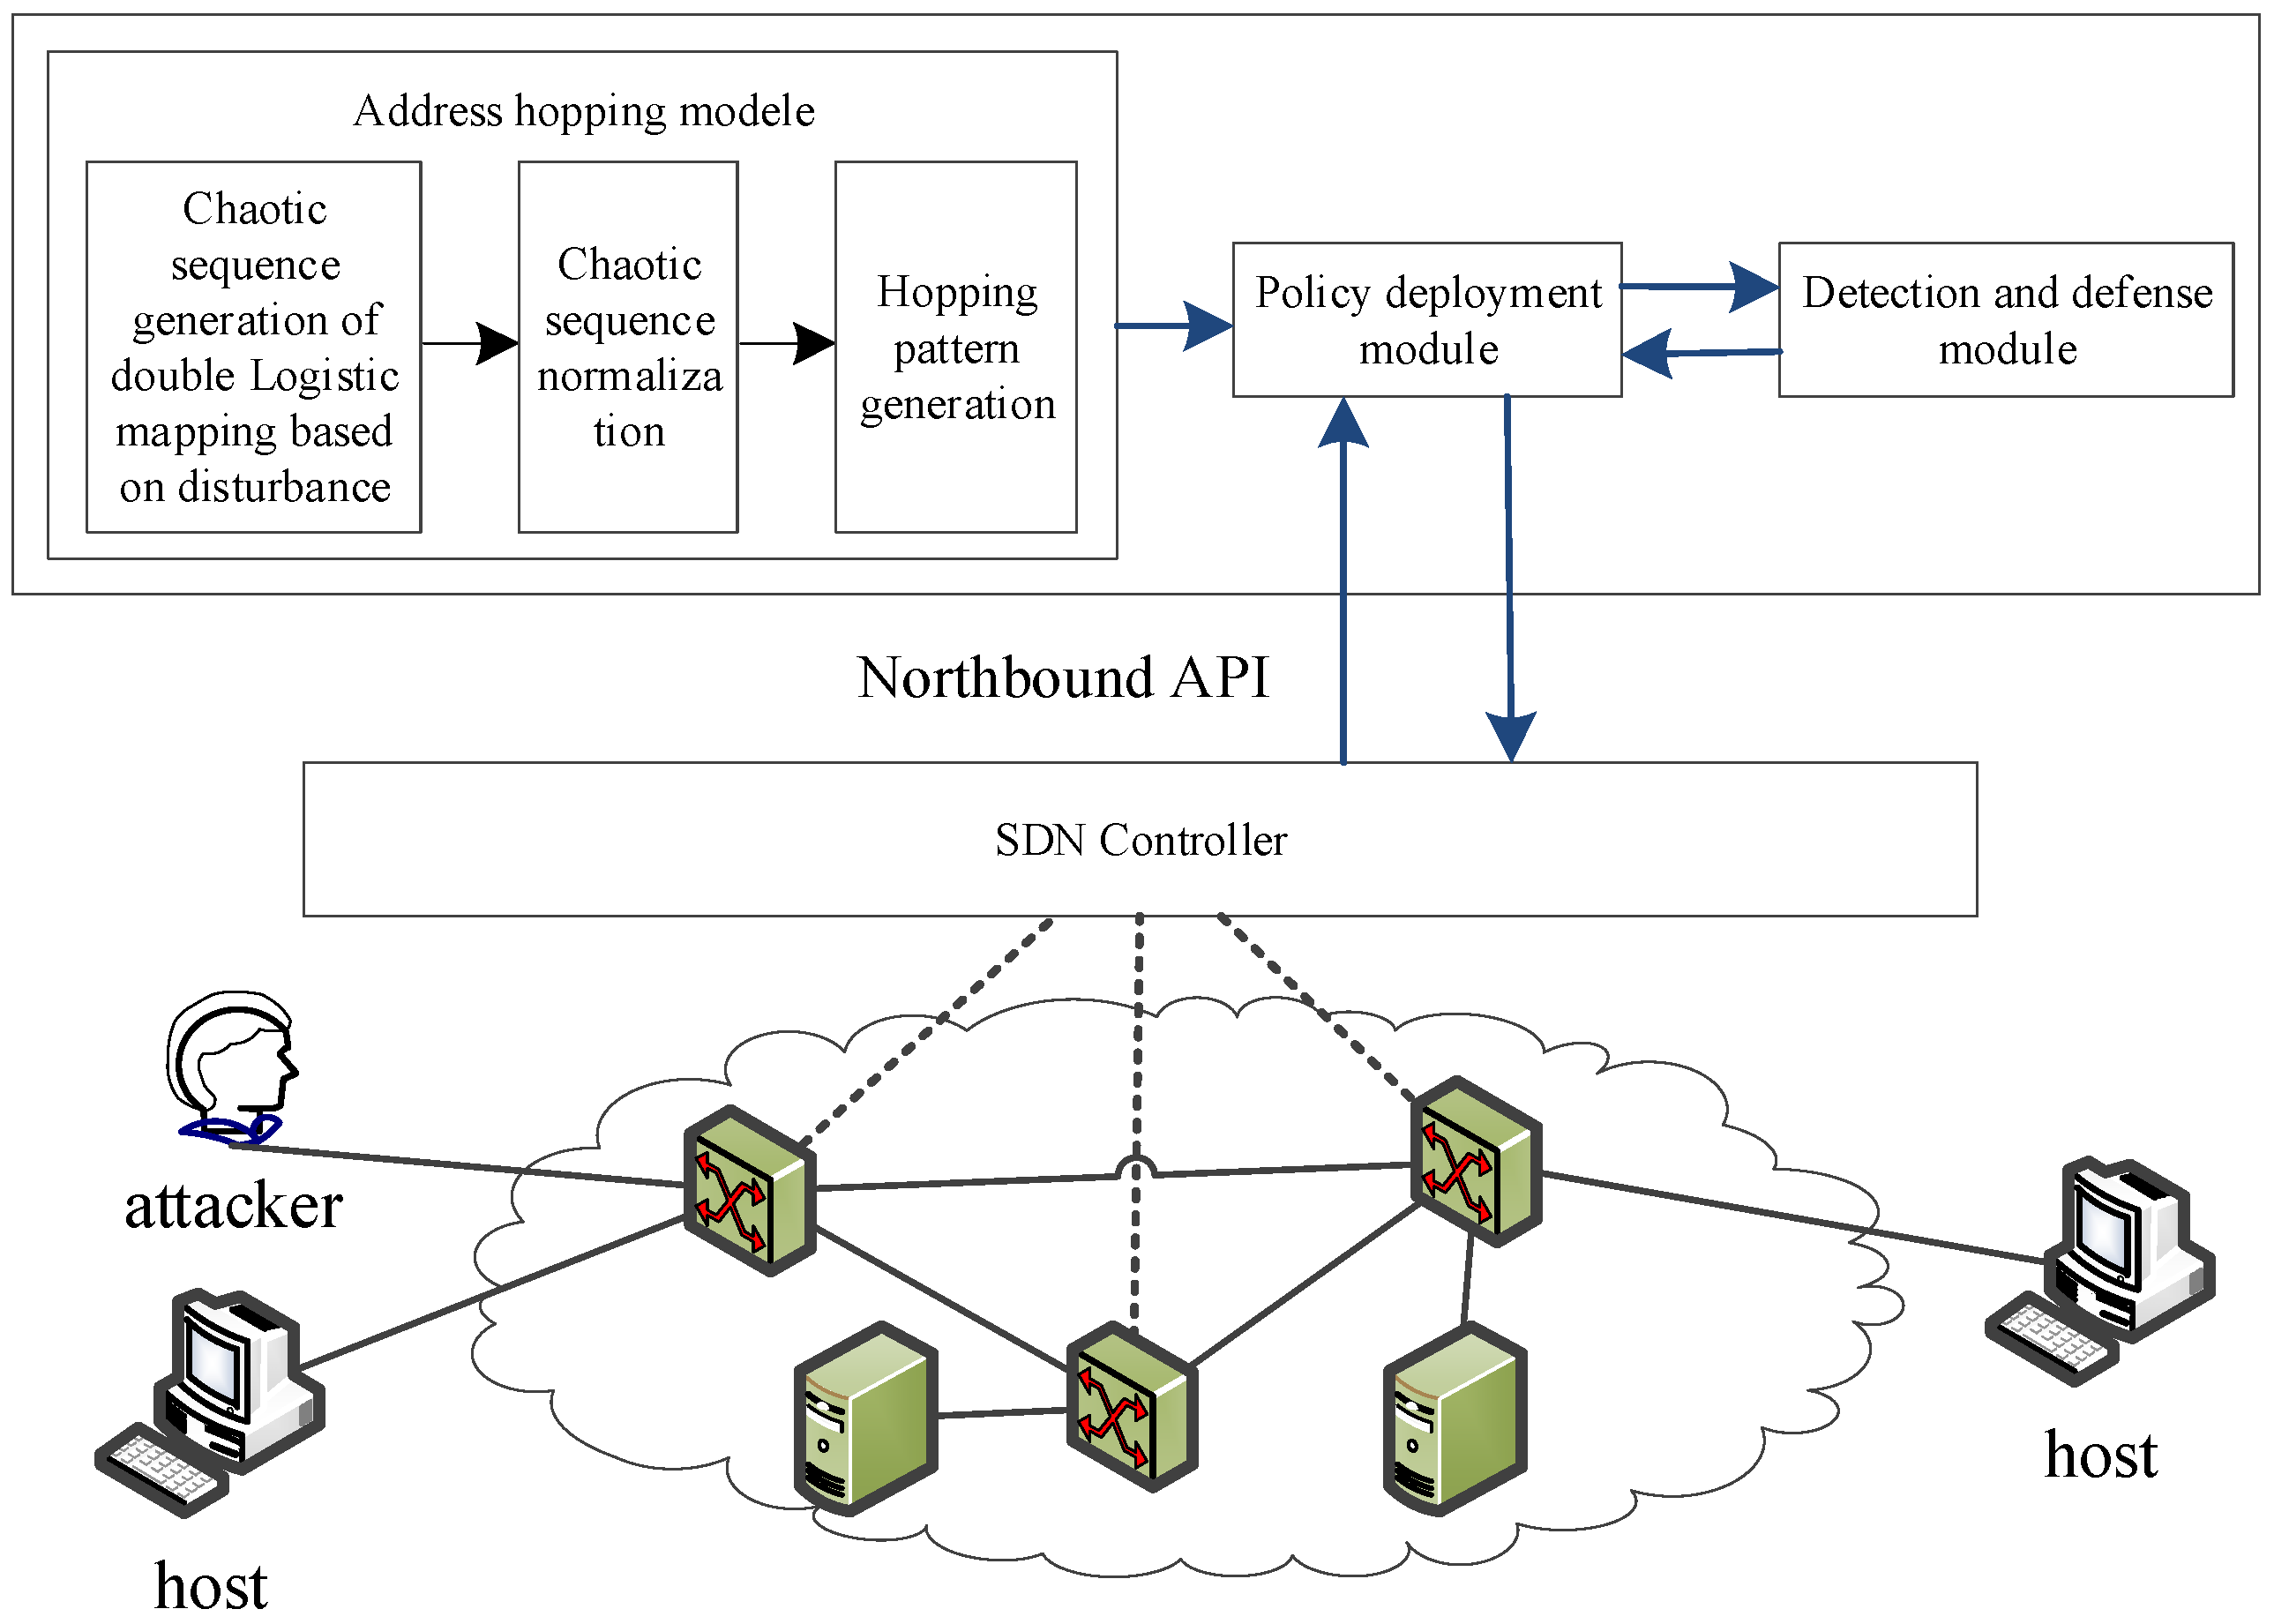
To address the challenges in traditional networks, including synchronization difficulties, communication service degradation from high-frequency hopping, inflexible hopping strategies, and high deployment costs, this study proposed an active defense technology called Random Address Hopping based on Chaotic Sequence (RAH-CS) to enhance protection against crossfire attacks. RAH-CS leveraged SDN features such as centralized control, programmability, and separation of control and data planes. As shown in Figure 5, its technical architecture consisted of three main components: the address-hopping module, policy deployment module, and detection and defense module.
The address-hopping module manages the host’s address mapping and communication list, thereby generating a hopping strategy for the RAH-CS IP address-hopping mechanism. It randomly selects a hopping address from the address pool based on the defined strategy, ensuring both the unpredictability of address changes and reliability of host communication. The hopping period was dynamically adjusted by the detection and defense modules according to the detection results. This module monitors network traffic through packet-in events, identifies attackers, and blocks communications. The policy deployment module enforces the strategies of address-hopping, detection, and defense modules. The defense at this stage relies on two key mechanisms: the design of a random address-hopping mechanism based on chaotic sequences and the implementation of the hopping process via the SDN controller.

4.2.1. Address Hopping Mechanism of RAH-CS

A chaotic sequence is a pseudo-random sequence characterized by strong randomness and unpredictability, which makes it effective in enhancing address-hopping randomness and preventing the vulnerabilities of static-hopping rules. Therefore, this study adopted the jump pattern generation method from the address-hopping scheme based on the chaotic sequences proposed in [35]. First, a chaotic sequence was generated using a perturbation-based dual logistic mapping coupling algorithm, which was then normalized to produce the required random IP addresses for hopping. The specific algorithm for generating chaotic sequences is as Equation (7):
x n + 1 = b m x n ( 1 x n ) x n + 1 = b x n ( 1 x n ) b m = 10 x n + 1 ( 0.357 x n + 1 0.4 & c n t 100 ) j u d g e = ( x n + 1 + x n + 1 ) [ x n + 1 + x n + 1 ] x n = j u d g e   ( j u d g e 0 ) x n + 1   ( j u d g e = 0 ) x n = x n + 1
where x n is the feedback input value of the chaotic sequence generator; b m is the chaotic sequence control parameter of the chaotic sequence generator; x n + 1 is the output value of the chaotic sequence; x n is the feedback input value of the disturbance parameter generator, b′ is the disturbance control parameter of the disturbance parameter generator; x n + 1 is the disturbance output value, and x n , x n 0 , 1 ; and cnt is the number of iterations after the last update of x n + 1 , with b m , b 3.57 , 4 applied to ensure chaotic characteristics. If inequality 0.357 x n + 1 0.4 is not satisfied when cnt = M, then set b m = 3.75 + 0.25 x n + 1 and restart the process, where M is a predetermined value.
To use the chaotic sequence values for IP address hopping, the generated sequence, ranging between 0 and 1, should be normalized to a value between 1 and 254. This was achieved by first extracting the 4th to 6th decimal places of each chaotic sequence value and computing their remainder when divided by 254. Then, adding 1 ensured that the final value fell within the desired range. The normalized value was used as the last segment of the IP address to form the address-hopping pattern.
Although global control of the SDN architecture facilitates hopping synchronization, inevitable network delays may cause communication failures during hopping. To mitigate this issue, the SDN controller maintained a sliding window of size (2n + 1), as proposed in reference [36], to reduce the impact of network delays and congestion on address synchronization. In addition to the IP address of the current hopping period, the IP addresses of the preceding and following n (e.g., three) hopping periods were also available. The value of n can be adjusted based on actual network delay.

4.2.2. Hopping Flow of IP Address

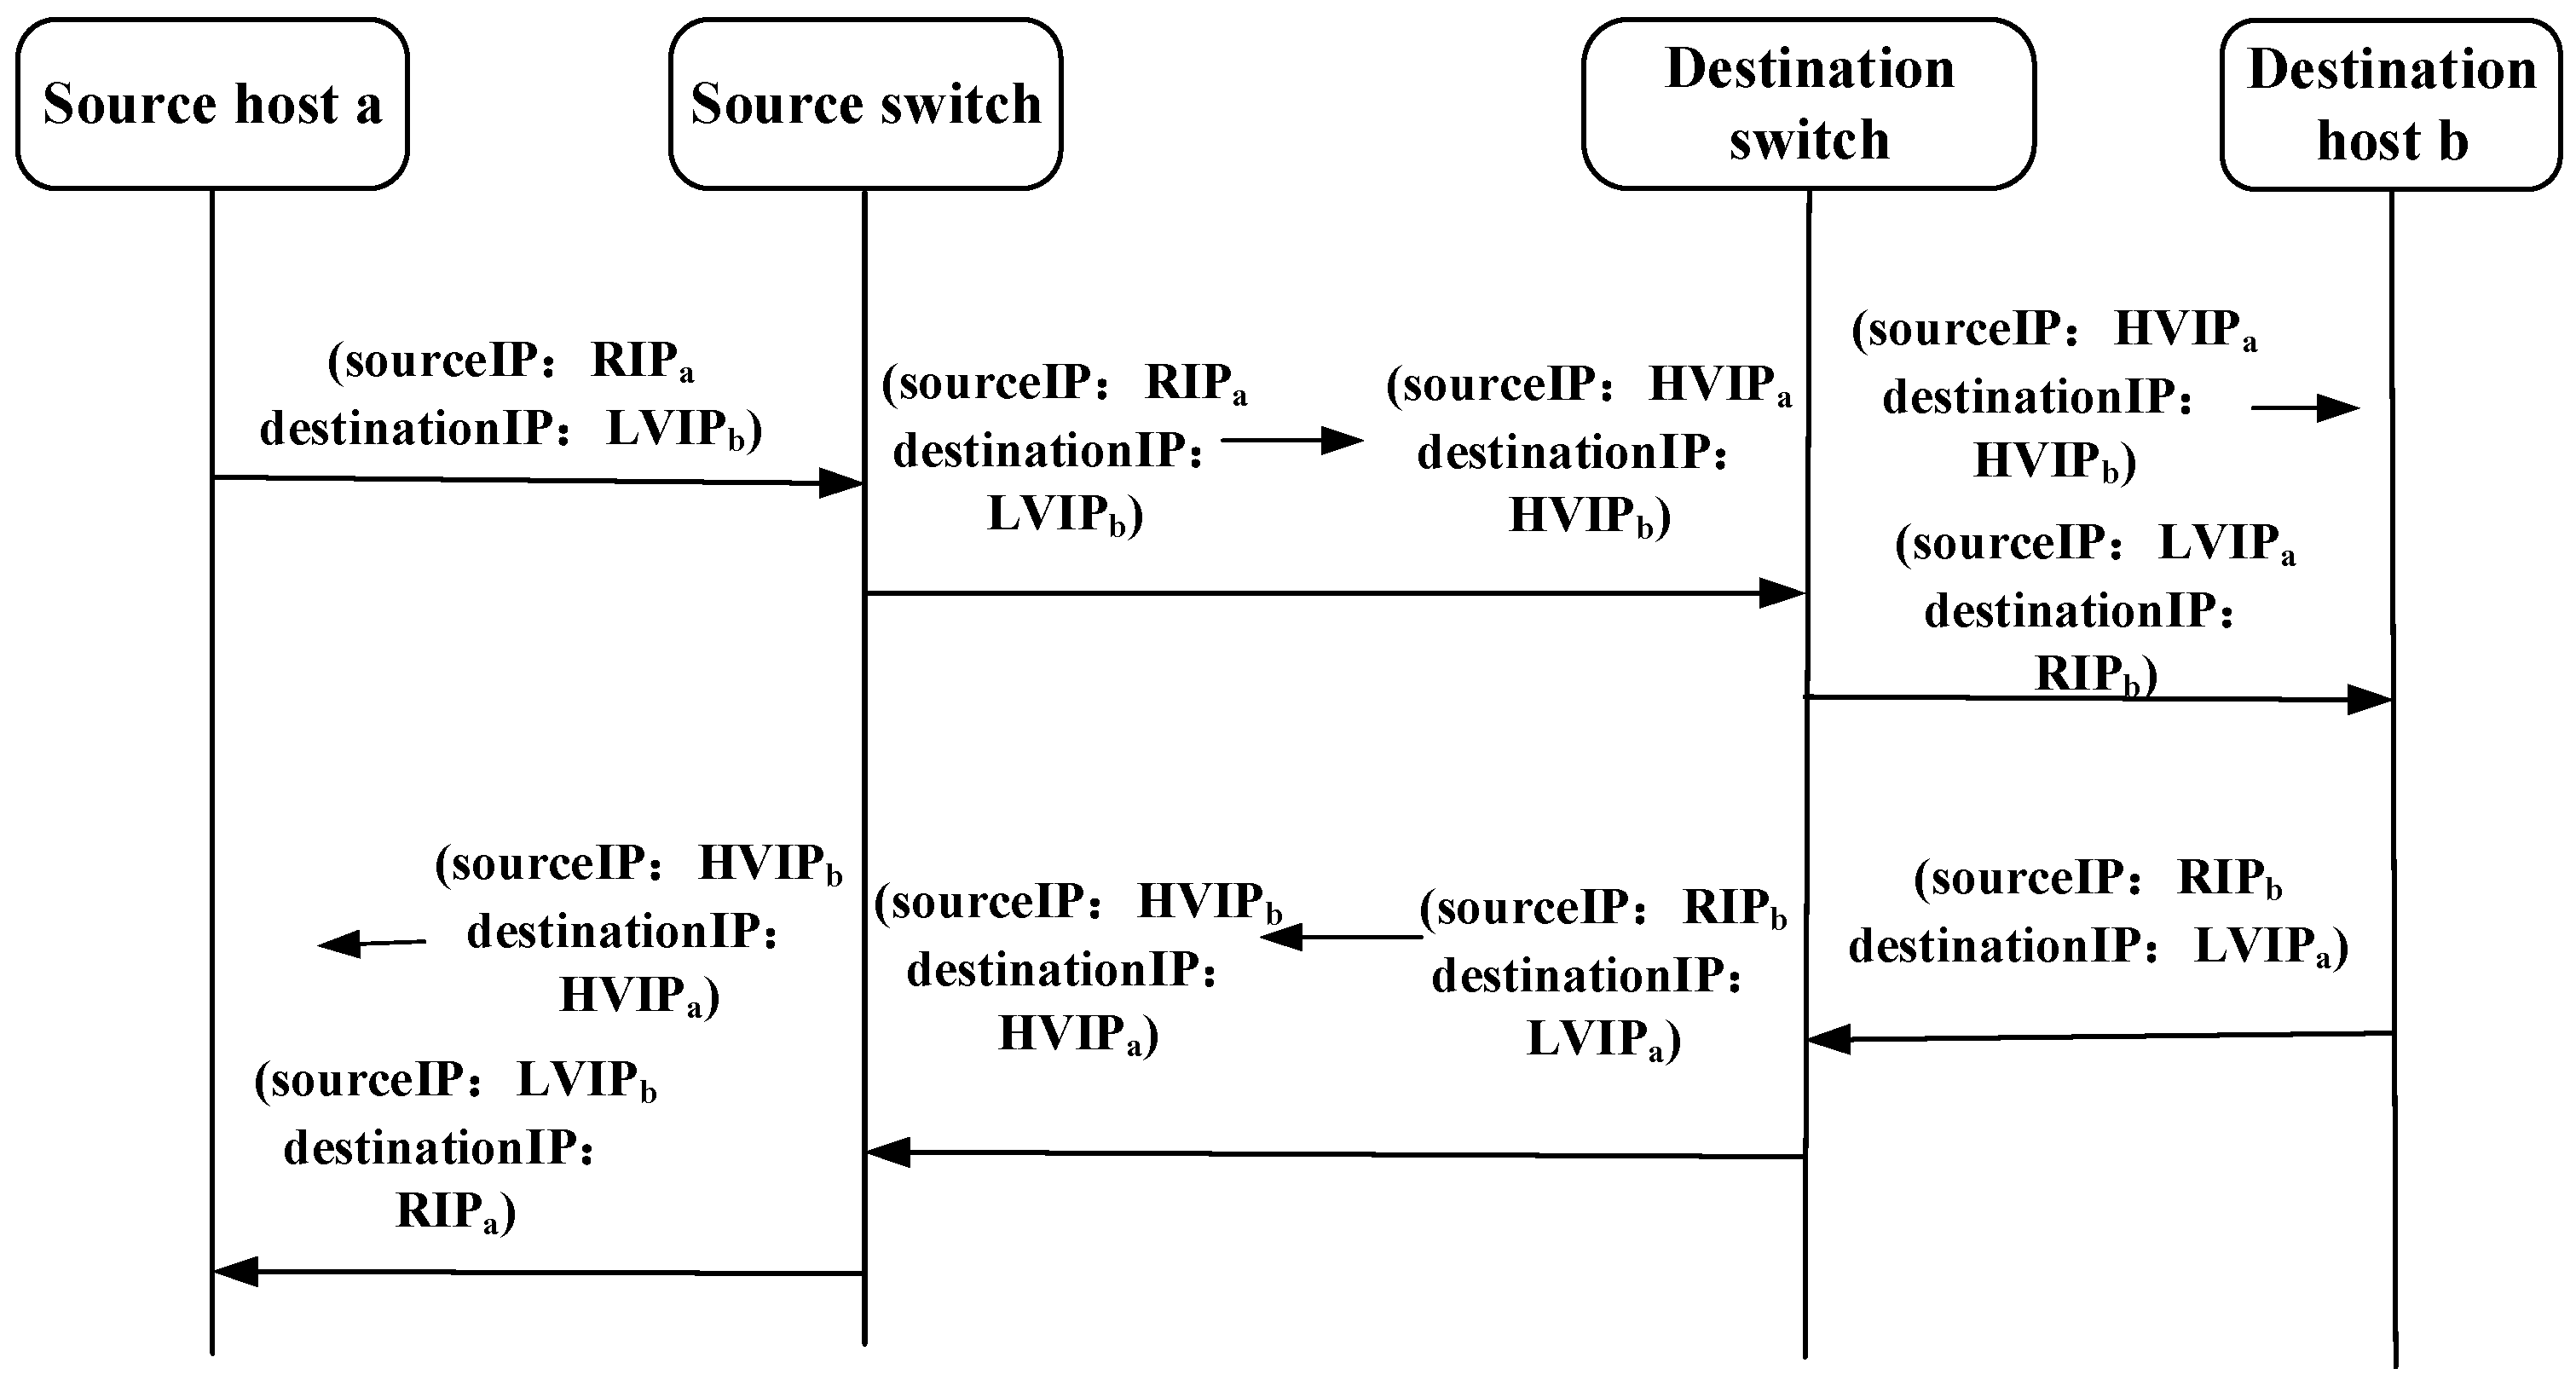
Under the SDN architecture, the communication parties exchanged data packets while performing address hopping. The communication flow during the hopping process is shown in Figure 6.
Where RIP is the real IP address of the terminal host, LVIP is the low-frequency (period = 180 s) hopping virtual IP address negotiated in advance to ensure communication service quality, and HVIP is the high-frequency (period = 5 s) hopping virtual IP address obtained according to the method proposed in this study to improve the ability to defend against crossfire attacks. The SDN controller utilized the IP address obtained from the address-hopping module as the address feature for data flows, allowing OpenFlow switches to receive and forward traffic only during a designated time. The corresponding flow entries were delivered to the OpenFlow switch to filter out the unauthorized data flows. When the source host a and destination host b initiated data transmission and address hopping began, the data packet processing steps were as follows.
(1)
Source host a sends the packets with IP address (RIPa, LVIPb) to the directly connected source OpenFlow switch to initiate a communication request. Upon receiving the packets, the source switch matches them against their flow tables, updates their IP address to (HVIPa, HVIPb) based on the flow table information, and forwards them through the designated forwarding port.
(2)
The modified packets continue to be forwarded along the designated route, and at the destination OpenFlow switch, their IP address is updated to (LVIPa, RIPb) based on the flow table information before being delivered to the destination host b.
(3)
Upon receiving the correct data packets, the destination host b sends the response packets with the IP address (RIPb, LVIPa), which are modified to (HVIPb, HVIPa) at the destination switch. The modified packets were then forwarded along the corresponding path to the source switch.
(4)
The source switch modifies the packet addresses from (HVIPb, HVIPa) to (LVIPb, RIPa) and forwards them to the source host a, completing the communication process.
The entire hopping process is managed by the controller and switches, ensuring that server b remains unaware of IP address changes during communication, making the hopping process transparent and reducing the server load. Because the SDN controller globally controls address hopping by distributing flow tables to the switches along the route path, synchronization costs are eliminated, removing the need for strict time synchronization and additional event synchronization packets while still ensuring the security of hopping information.

4.3. Computational Complexity Analysis

To address the practical deployment concerns, we provide a thorough analysis of the computational complexity and resource requirements for the ENRNN model. The time complexity of the two-layer ELRNN for processing a sequence of length T (number of edges) is dominated by the LSTM operations, which is O ( T × d h i d d e n 2 ) , where d h i d d e n = 256 . The NLRNN, with a hidden dimension of 128, contributes O ( 5 × 128 2 ) per generated edge. The total number of parameters is approximately 250,000, resulting in a memory footprint of less than 10 MB.
Crucially, this computational cost is incurred only during the offline topology generation phase, which occurs periodically (e.g., every few minutes) in the background. It does not lie on the real-time packet forwarding path. Therefore, the ENRNN’s complexity does not impact the data plane’s ability to handle high-speed traffic. The generated topologies are precomputed and stored in a pool, from which the SDN controller can select and deploy instantaneously during the reconnaissance phase. This design separation between the compute-intensive generation process and the latency-sensitive deployment process ensures that our defense mechanism can scale to real-world SDN environments handling thousands of flows per second, without introducing any processing delay to the data path.

5. Experiment and Discussion

5.1. Experimental Settings

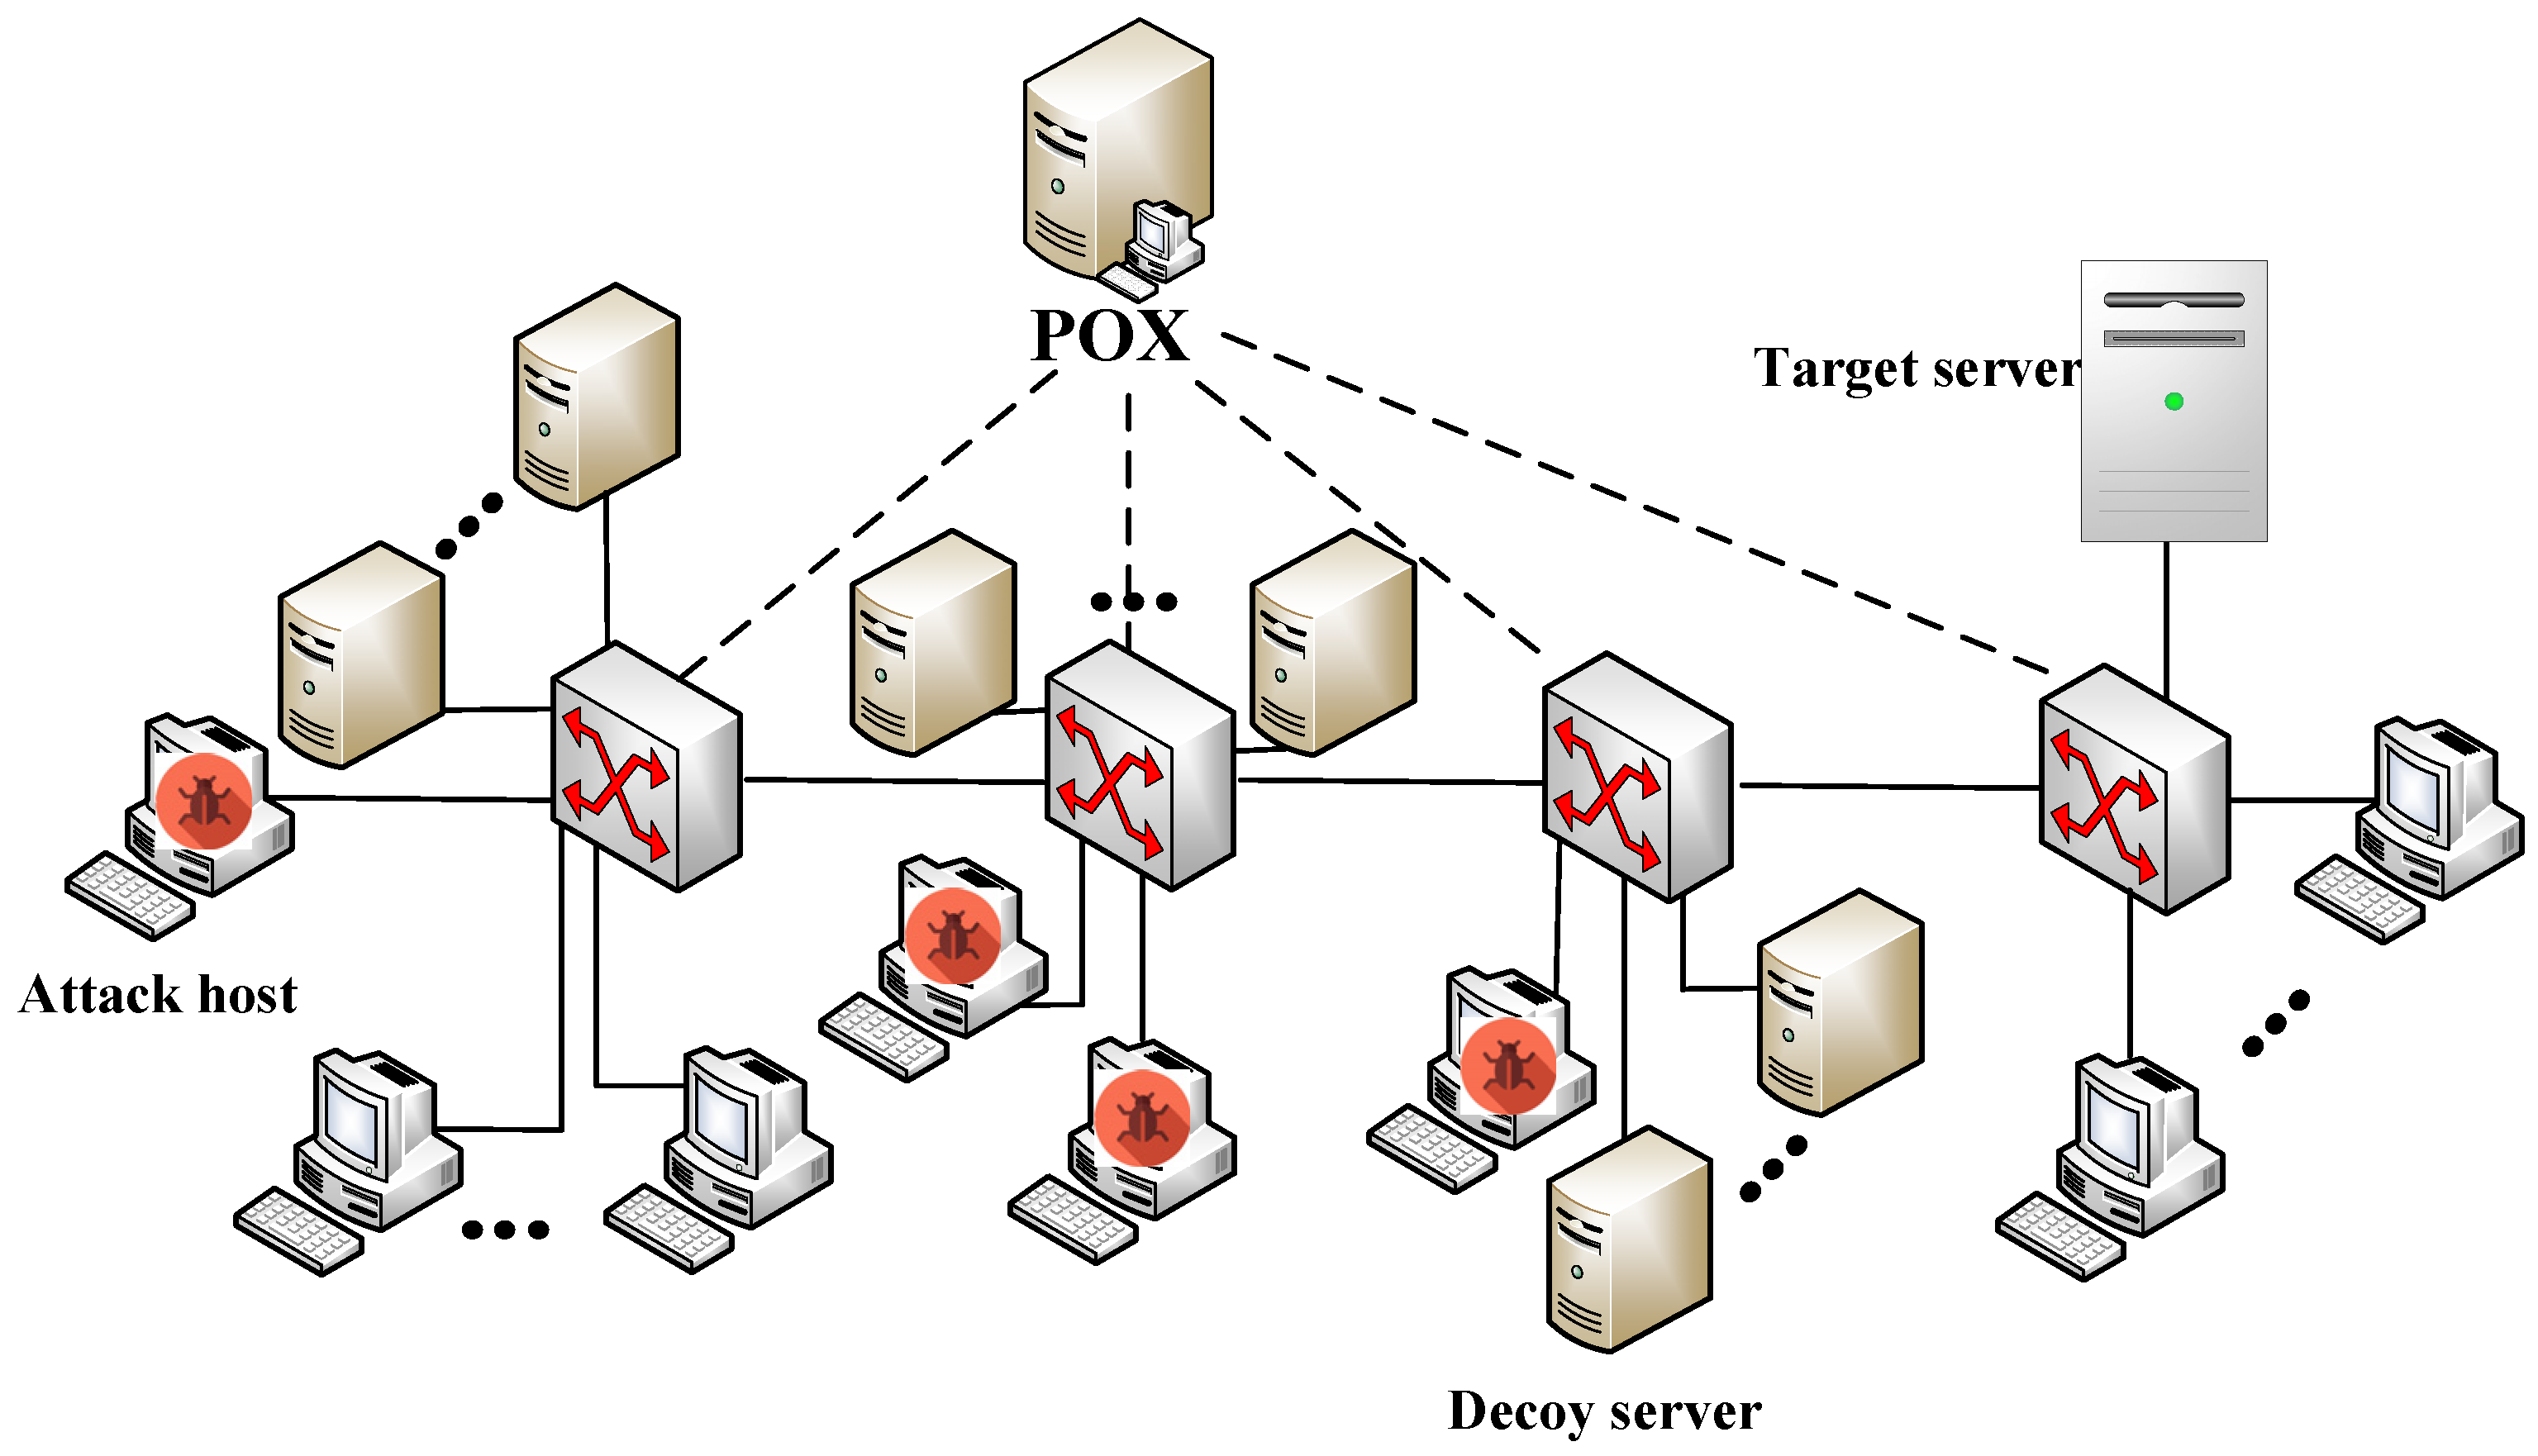
To verify the effectiveness of the proposed ENRNN-MTD based defense mechanism, Mininet was used to simulate the process of a normal host accessing file transmissions (Figure 7). The detailed descriptions of the experimental simulation environment are listed in Table 2.
(1)
Network size: The simulated network had 50 nodes, which consisted of 24 guest hosts, 4 OpenFlow vSwitches, 4 attack hosts, 16 decoy servers, a target server and a controller. The POX was selected as the SDN controller for generating and delivering defense mechanisms as well as for traffic control. The bandwidth of all links in the network was set to 300 kb/s.
(2)
Attacker models: During the attack phase, common topology probes and IP flooding tools were used. Firstly, the attack hosts executed the traceroute command to find all links connecting target server and decoy server in the target area and ultimately obtained the link map. Then, the flow density of all links in the link map would be calculated and the links with high flow density would be selected as target link. And finally, the HPING-3 was used to simulate attack flow, and the crossfire attack was simulated by sending attack flows of different attack intensities. The bandwidth of each attack flow was set to 100 kb/s.
(3)
Experimental datasets: To assess the effectiveness of our method, we used the Internet Topology Zoo dataset [37], which aggregates over 300 network maps from ISPs, data centers, academic networks, and more. This dataset contains metadata such as detailed information about nodes and links, network types, and source citations. It covers various network snapshots ranging from the ARPANET in 1969 to those after 2006. It provides important data support for research in computer science and engineering fields, including network structure analysis, network dynamic feature research, and network topology simulation and performance evaluation.
(4)
Parameters for the GNN training and IP-hopping mechanisms: ENRNN, implemented using the PyTorch 1.11.0+cu115 version, was applied to generate random virtual topologies for deception defense. During training, the Internet Topology Zoo dataset was split in an 8:1:1 ratio for the training, validation, and test sets. The training and validation sets were used for model training and validation, respectively, whereas the test set evaluated the modeL′s learning performance for the given task. The training process involves generating positive and negative edge samples, forward propagation, calculating the cross-entropy loss, and back-propagation to train the model. During the IP-hopping phase, IP address pools of the high frequency and low frequency hopping space were set to 152.0.0.0/24 and 10.0.0.0/24. Initial periods of high frequency and low frequency hopping were 5 s and 180 s. The code is available at https://github.com/lchang1977/Deceiving-Defense/tree/main (11 October 2025).

5.2. Results and Analysis

In the topology generation task, the closer the generated topology distribution was to the real one, the higher the similarity and the stronger the defense capability of the system. Therefore, in the experimental section, we first evaluated the fundamental quality of the generated virtual topology. As our method is RNN-based, this initial evaluation against other state-of-the-art RNN-based graph generation methods on the molecular benchmark graph datasets allows for an objective assessment of its core capability in structural replication. Subsequently, we further compared the defense effectiveness of our method with other state-of-the-art defense methods on the Internet Topology Zoo dataset. Additionally, the response time delay and file transfer rate served as evaluation criteria for measuring the system load and effectiveness in defending against crossfire attacks. The response time delay refers to the ICMP request packet delay between a legitimate client and the server, whereas the file transfer rate is defined as the ratio of file size to transfer time between the legitimate client and server.

5.2.1. Performance of Virtual Topology Generation

(1)
Topology Similarity. The Maximum Mean Discrepancy (MMD) measures the difference between two distributions, with smaller MMD values indicating a greater similarity. Therefore, calculating the MMD between the generated and real graphs can provide an effective evaluation of the virtual topology quality.
ENRNN was compared with existing graph generation methods, including GRAPHRNN [26], GRAPHGEN [30], and GHRNN [27], using the molecular benchmark graph datasets Lung, Yeast [33], and All [30] which are cited in the compared papers. The main differences among Lung, Yeast, and All datasets are as follows:
Lung dataset: It is mainly related to the lung, containing 203 samples, which are divided into five categories such as adenocarcinoma, small-cell lung cancer, normal tissue, and pulmonary carcinoid. It can be used for lung disease-related research.
Yeast dataset: It contains 1484 instances, each with 8 features and 1 category label. Derived from yeast, it aims to study the location of protein sites under different attribute values in yeast. It includes attributes such as sequence names and signal sequence recognition method scores, which is helpful for the research on protein structure and function.
All dataset: It includes 23,742 globally distributed regions of interest, with a total of 4 million images. Taking the ALLVB dataset as an example, it is a long-video understanding benchmark dataset, containing 1376 videos with an average duration of nearly 2 h, covering 16 categories. It is used to evaluate the understanding ability of multimodal large-language models for long-videos.
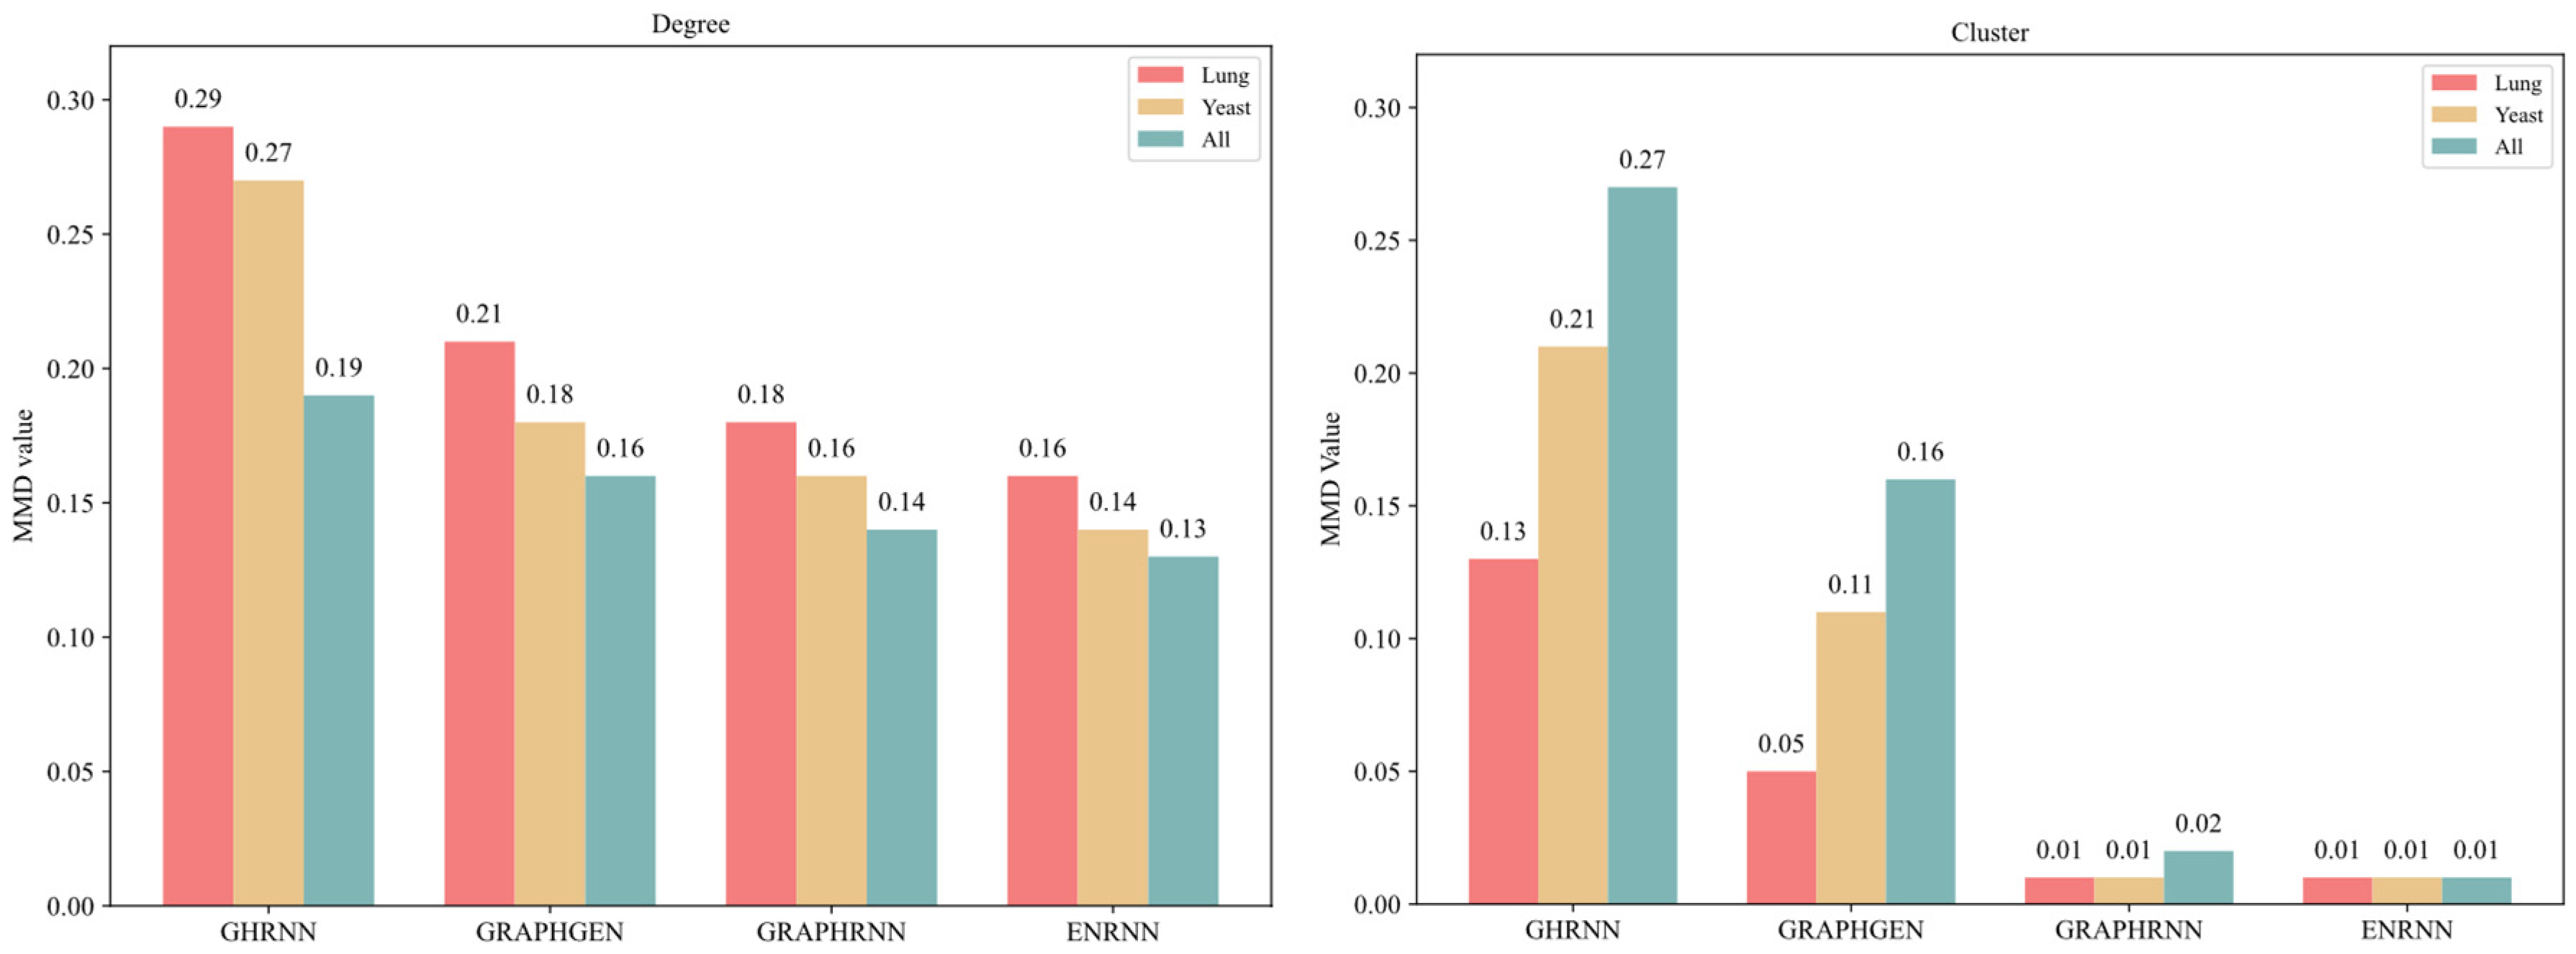
The evaluation was based on the node degree distribution and cluster distribution. As shown in Figure 8, which plots the MMD to quantify the distribution differences, the ENRNN demonstrated the best performance in learning the node degree distribution. Specifically, compared to GHRNN, GRAPHGEN, and GRAPHRNN, the difference between the node degree distribution of the ENRNN-generated graph and the real graph was reduced by 0.32, 0.12, and 0.05 on the Lung, Yeast, and All datasets, respectively. In capturing the node aggregation coefficient distribution, ENRNN achieved the best results, reducing the maximum average difference between the generated and real graphs by 0.58, 0.29, and 0.01 compared to GHRNN, GRAPHGEN, and GRAPHRNN, respectively. These results indicated that the ENRNN captured the structural information and distribution characteristics more effectively, generating topologies that closely resembled the input graph.
(2)
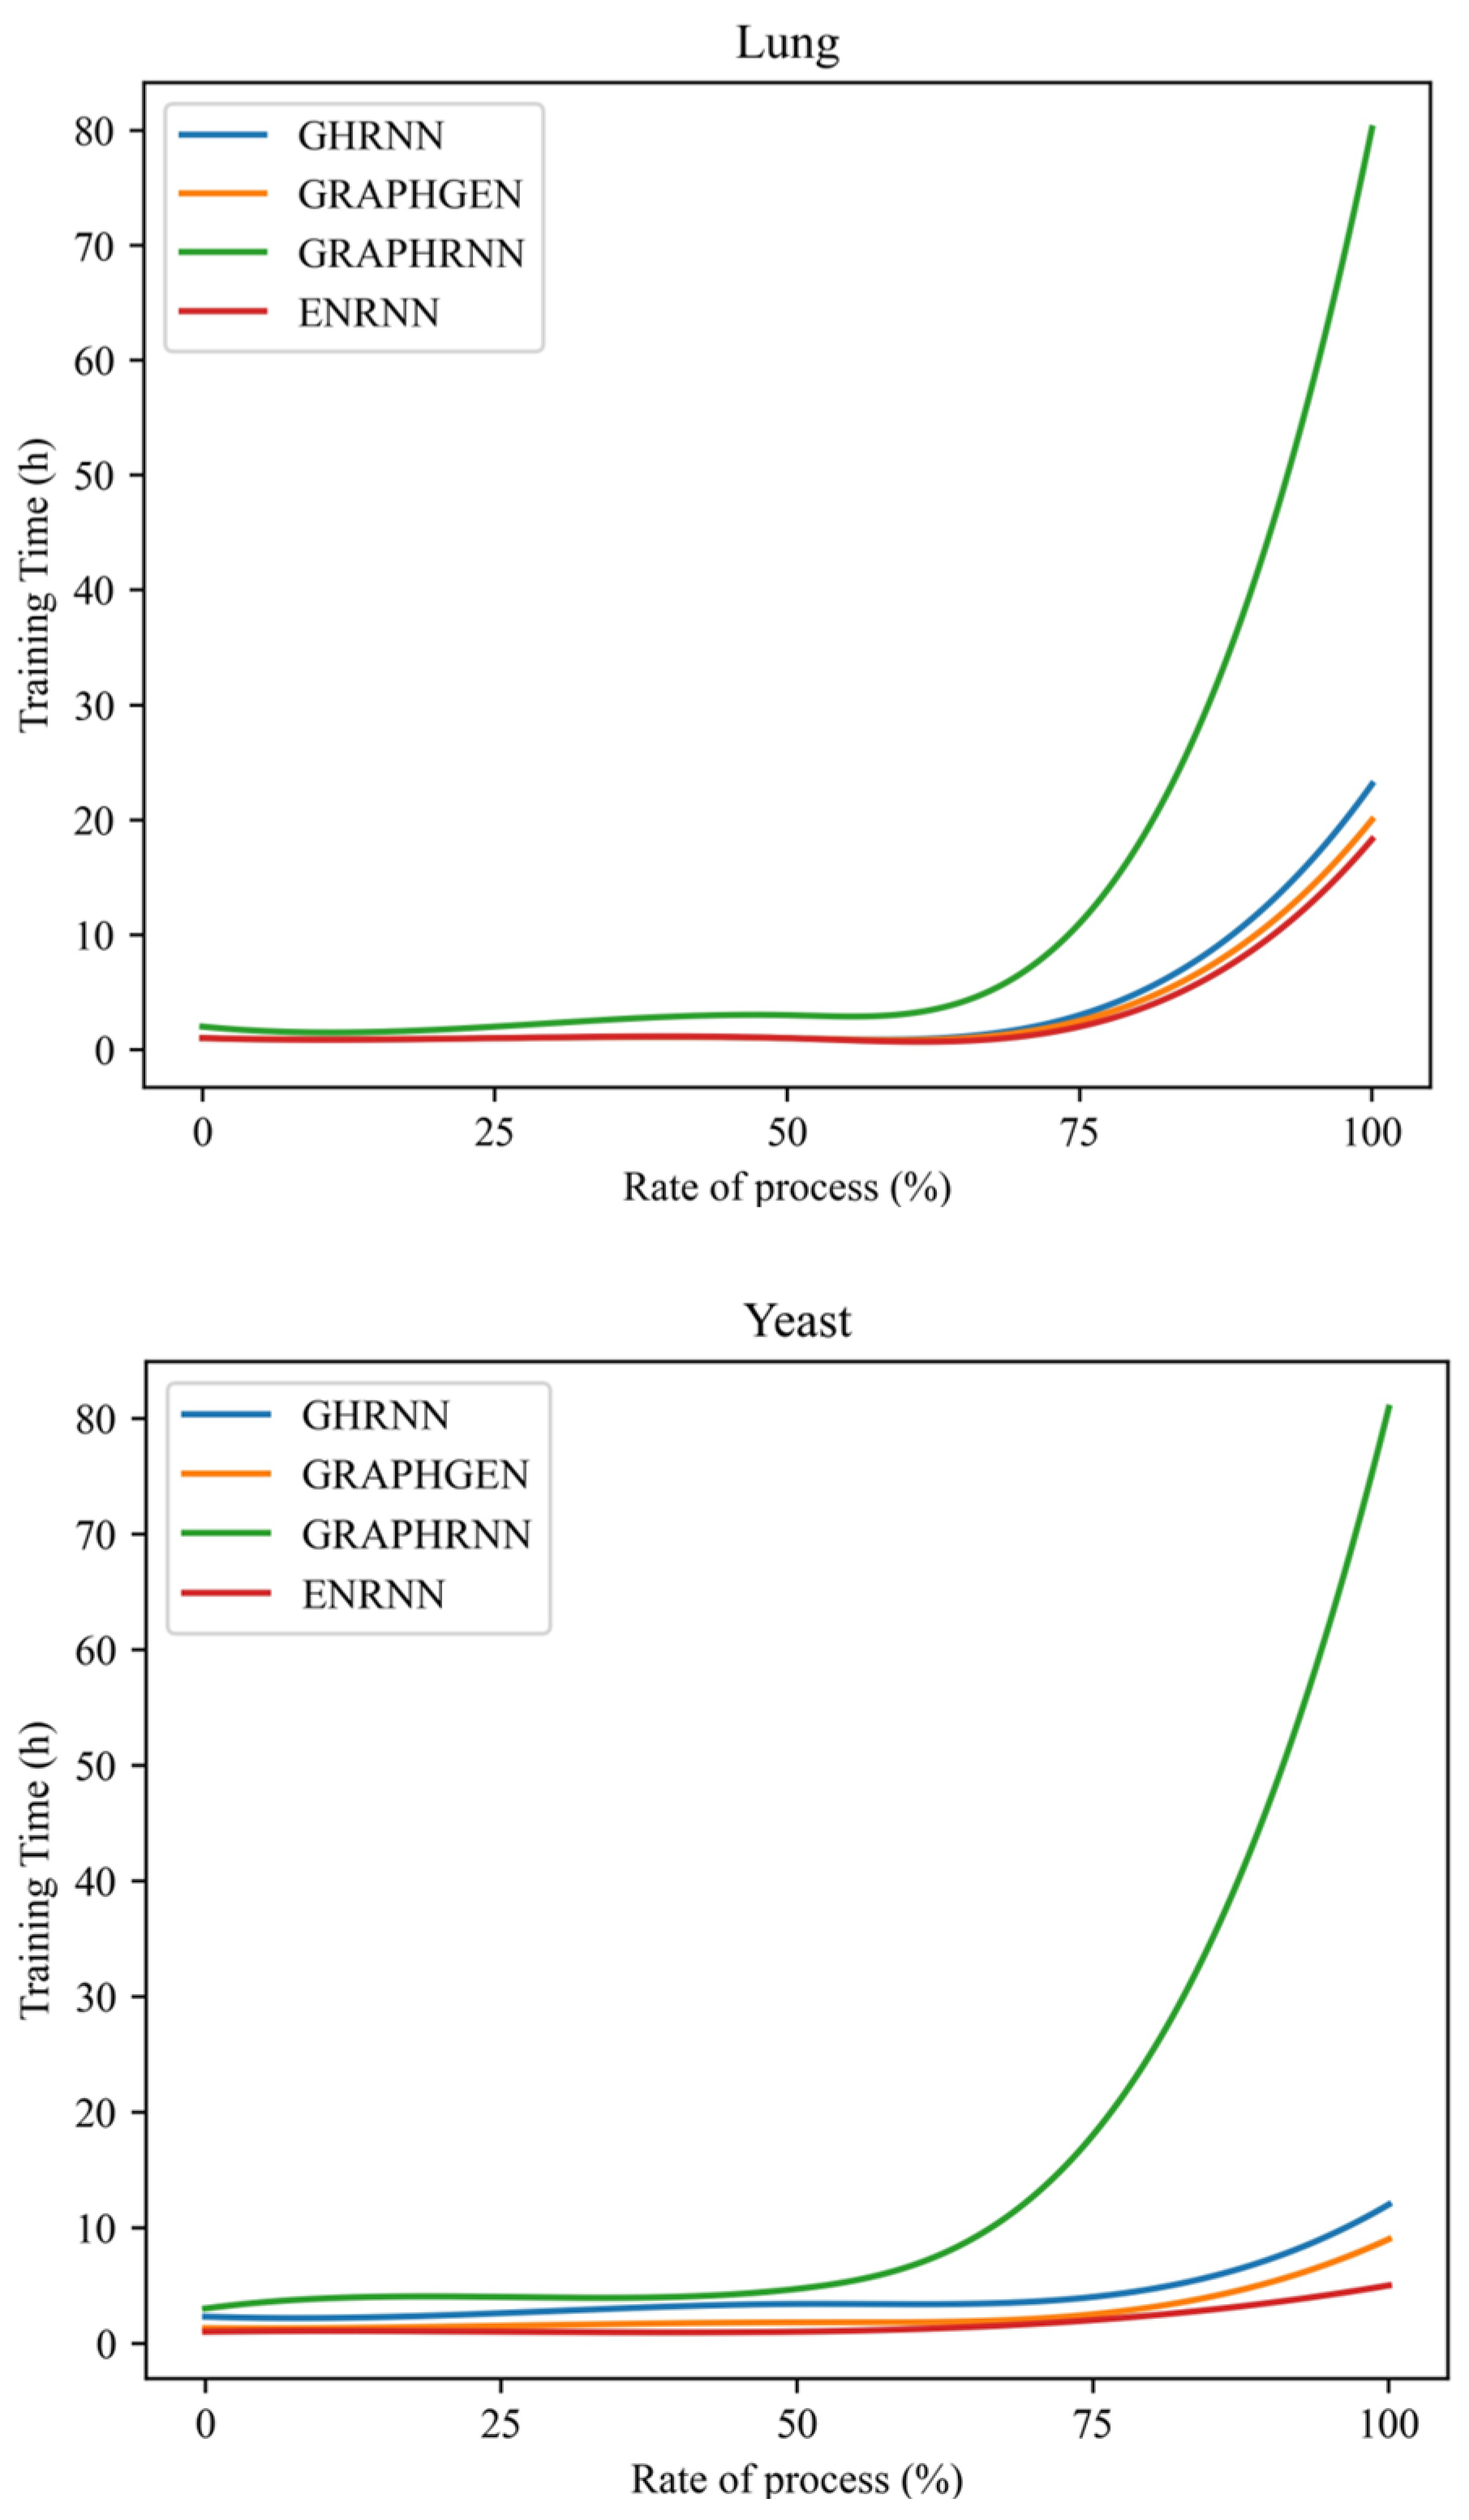
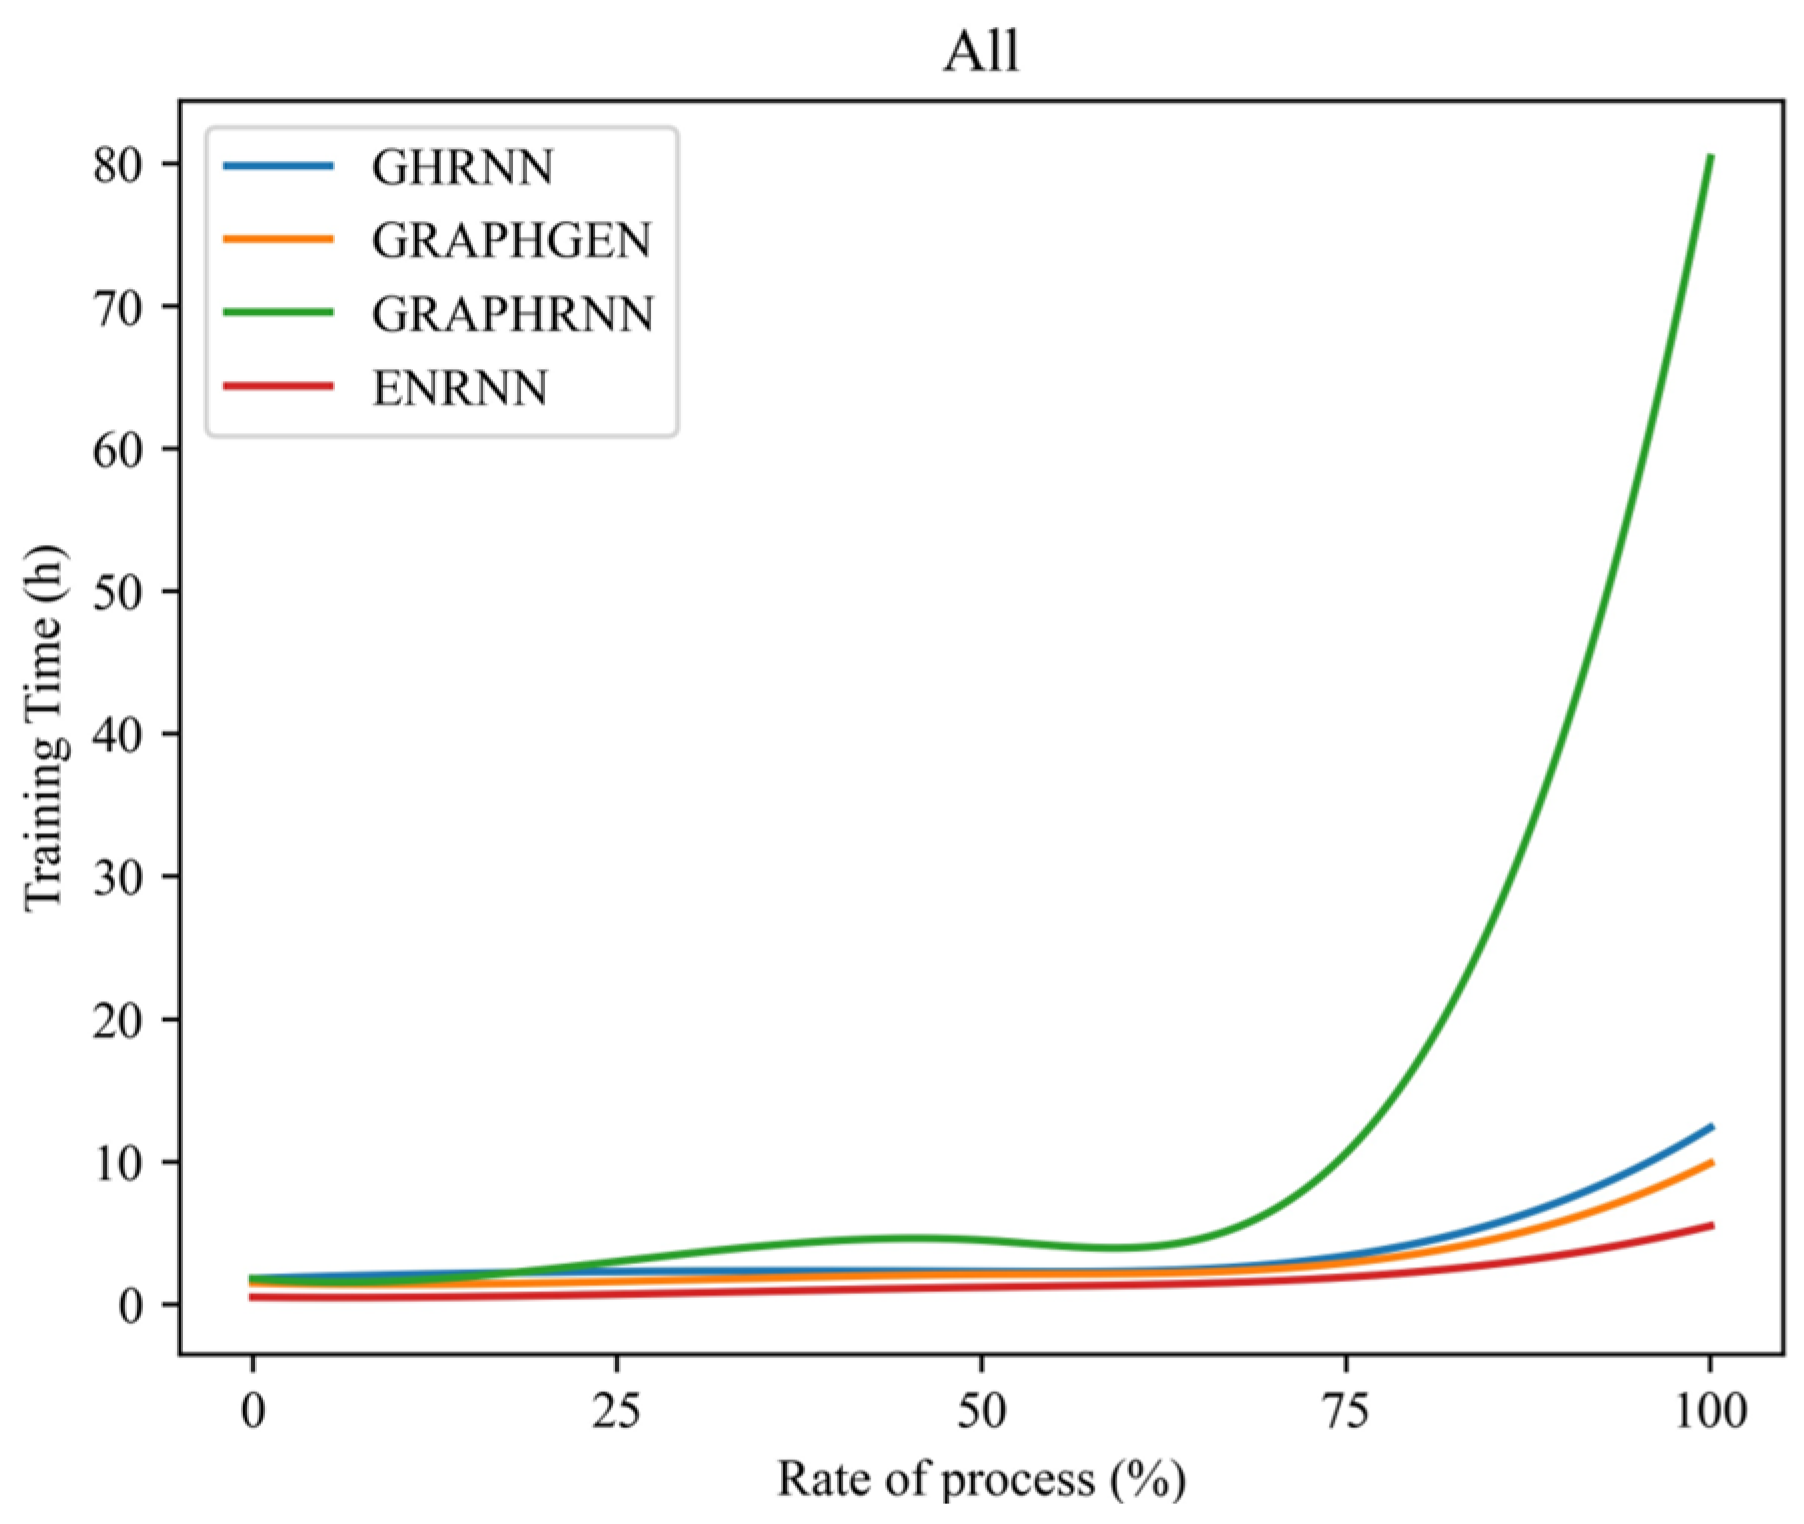
Scalability. Training time serves as an intuitive measure of model scalability. As shown in Figure 9, the training time curve over the training process was used to compare the performance of ENRNN with that of other models on the Lung, Yeast, and All datasets.
As shown in Figure 9, the trend of the model training time remained relatively consistent across all three datasets. GRAPHRNN exhibited the worst performance, with the training time escalating sharply in later stages. In contrast, ENRNN demonstrated greater stability, maintaining a lower training time trend than the other models. These results indicated that ENRNN offered the best scalability and stable performance, which was a critical characteristic for topology generation to ensure the reliability of defense mechanisms.
(3)
Unpredictability and Diversity
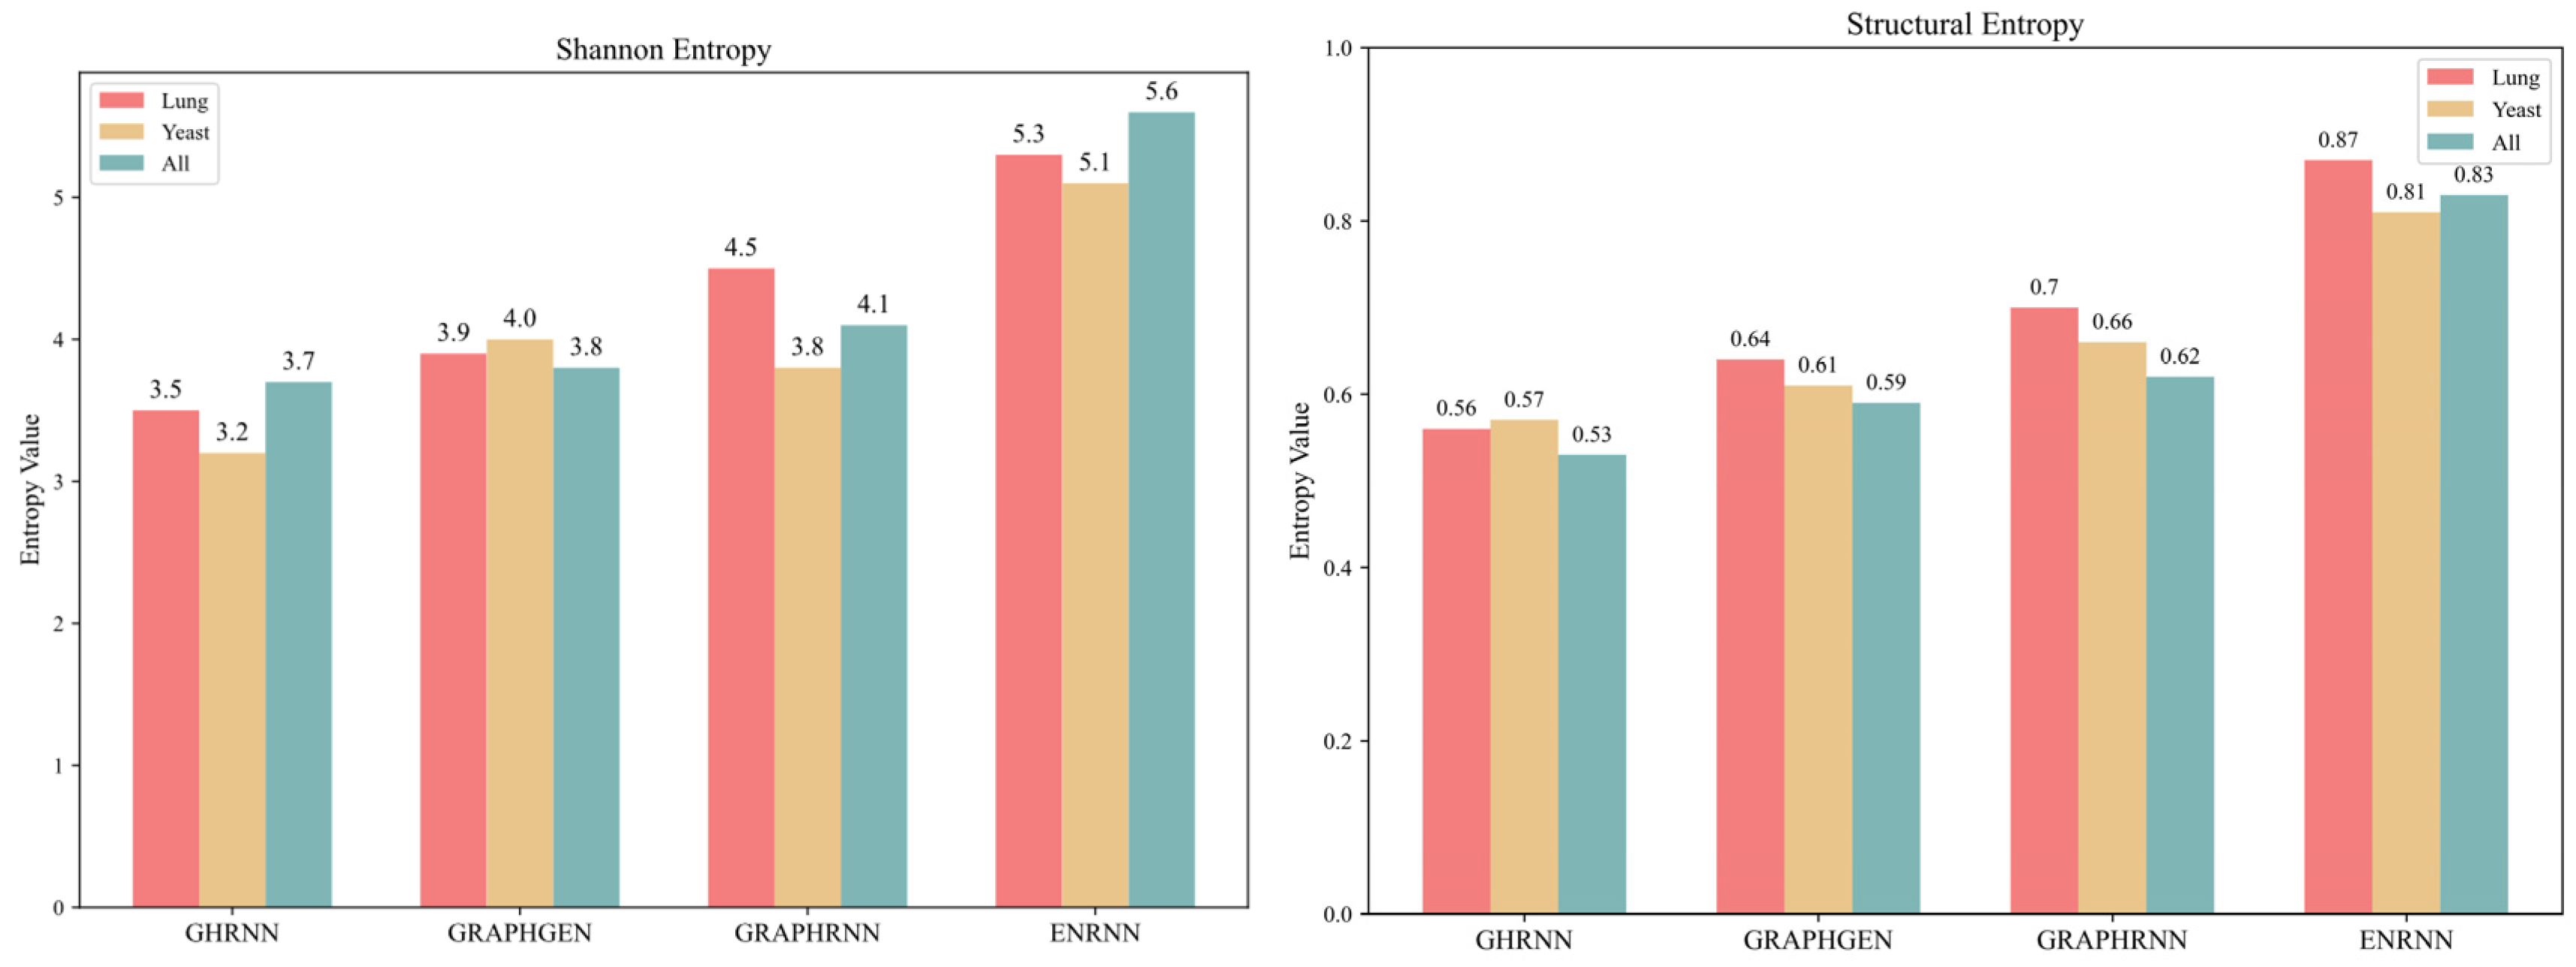
Entropy can be used to measure the uncertainty and diversity of information. Therefore, this section adopts Shannon entropy and structural entropy to evaluate the unpredictability and diversity of the generated virtual topologies, respectively. As shown in Figure 10, a comparison is made with graph generation methods GRAPHRNN [26], GRAPHGEN [30], and GHRNN [27] on the graph datasets Lung, Yeast [33], and All [30], respectively. It can be clearly seen from the comparison that in terms of Shannon entropy, ENRNN has a higher entropy value. Specifically, the maximum Shannon entropy of ENRNN on the All dataset can reach 5.6, which is 1.9, 1.8, and 1.5 higher than those of the other three methods, respectively. This means that the topology structures generated by ENRNN are more abundant and difficult to predict. In terms of structural entropy, ENRNN also has a higher entropy value. Specifically, the maximum structural entropy of ENRNN on the Lung dataset can reach 0.87, which is 0.31, 0.23, and 0.17 higher than those of the other methods, respectively. This indicates that the topology structures generated by ENRNN have higher diversity and stronger anti-attack capability.

5.2.2. Defense Effectiveness

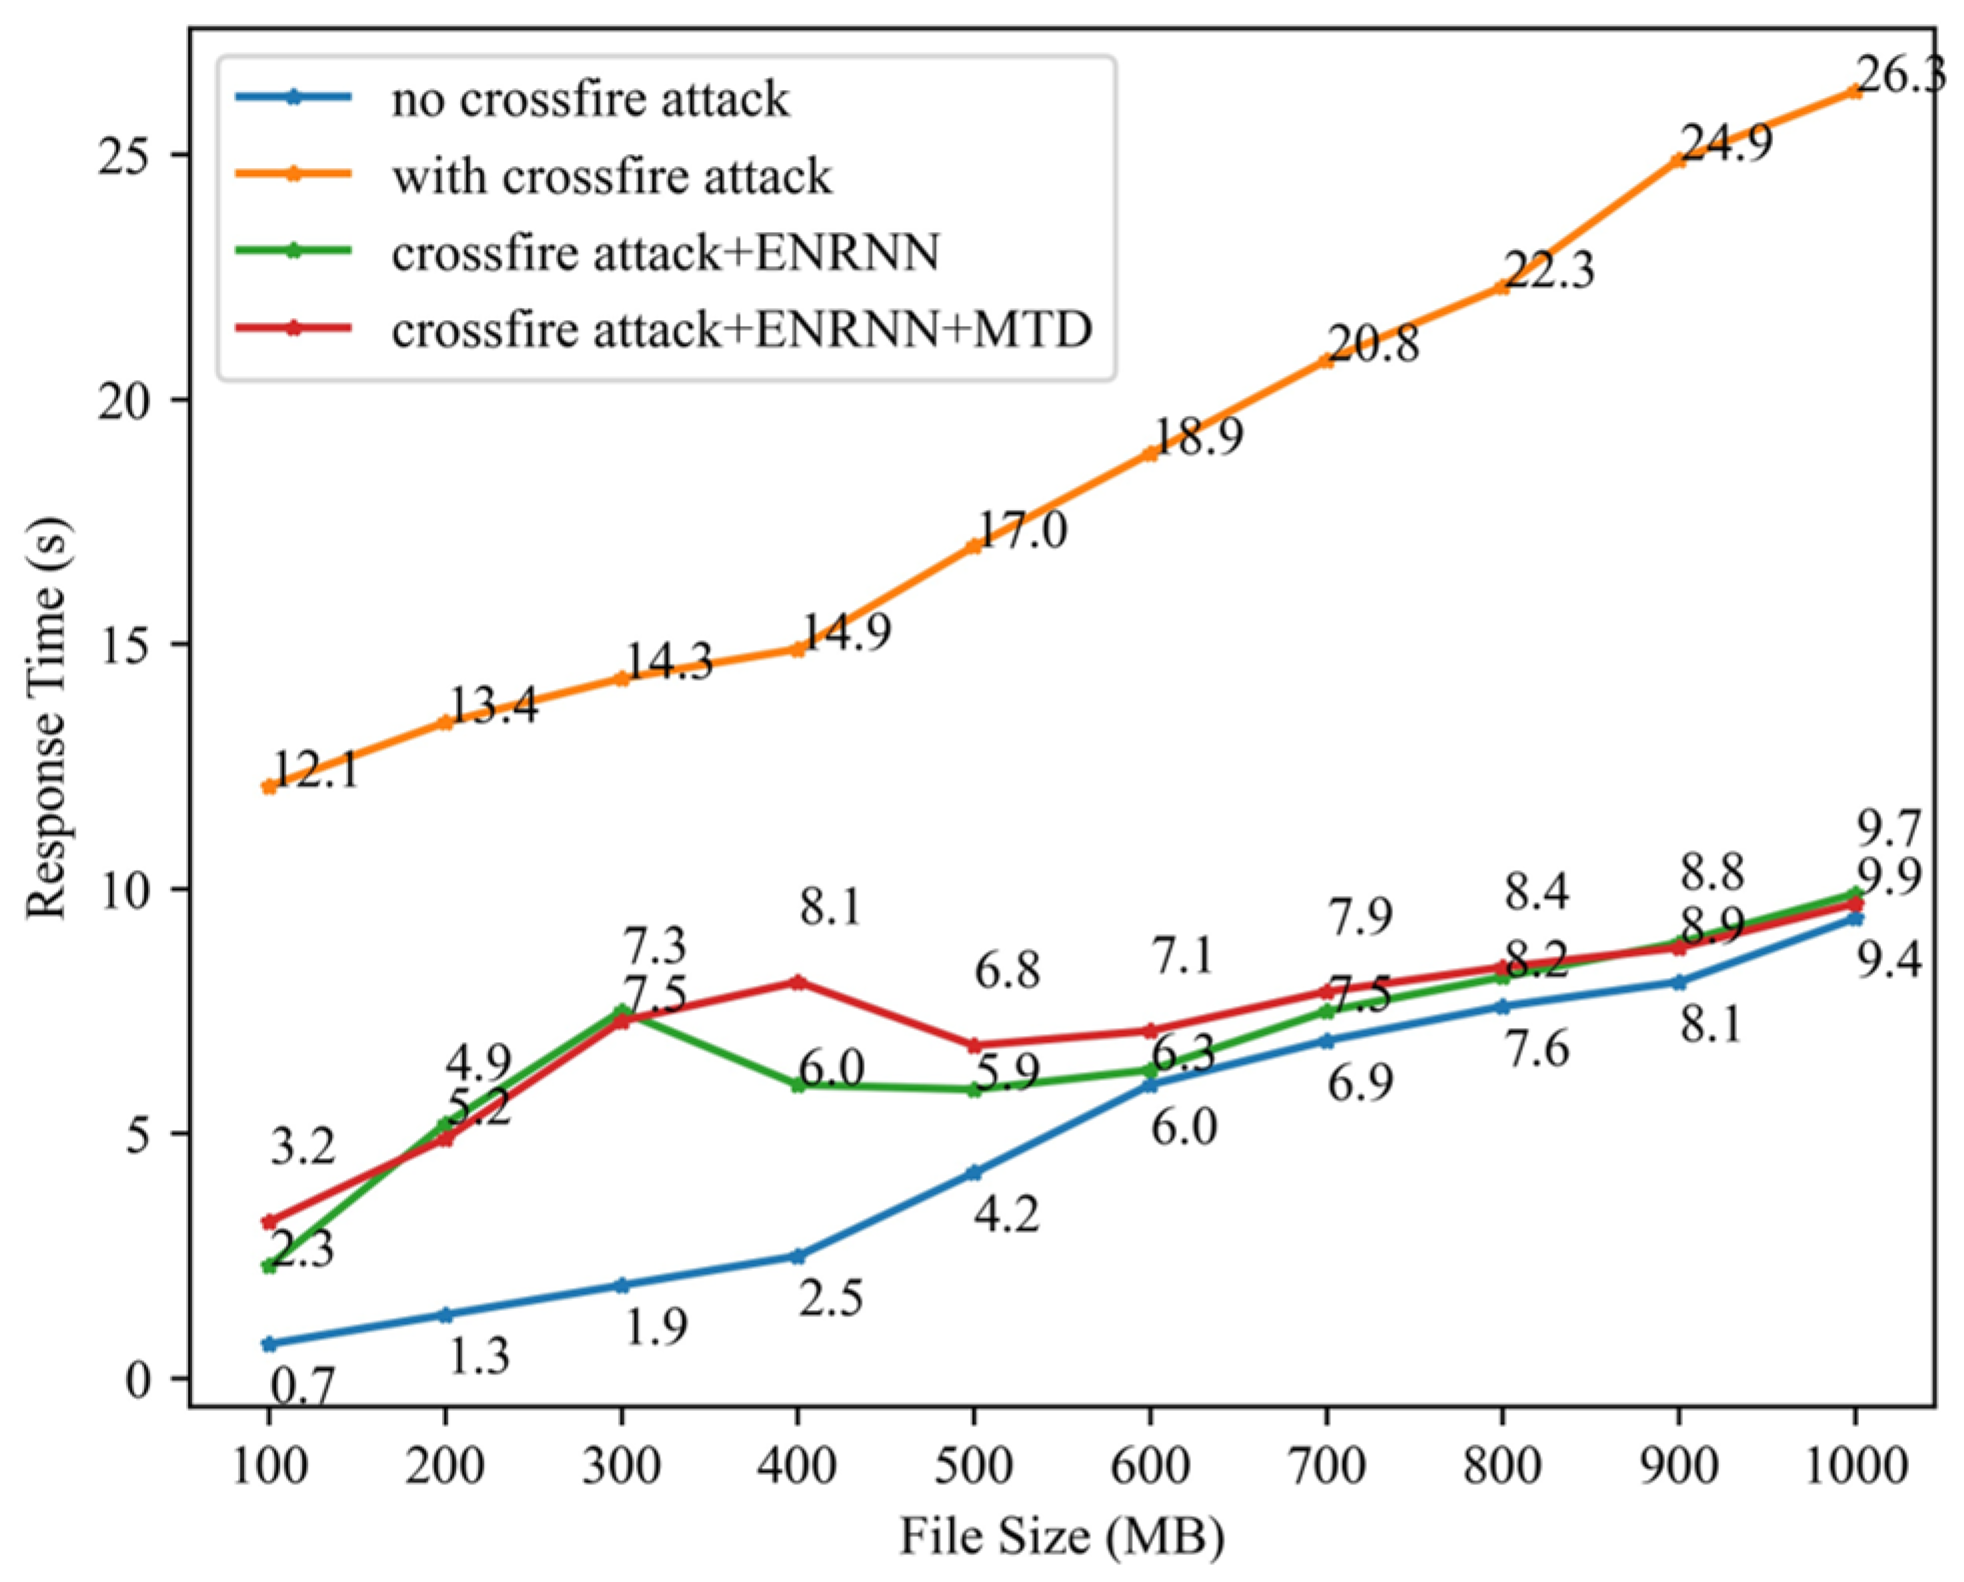
To evaluate the effectiveness of the proposed method against crossfire attacks, the open-source software hping3 was used to simulate an SYN flooding attack on the target link and the server. Using FTP file transfer services of different sizes as test cases, the effectiveness of the method was assessed based on the response time of the target server. As shown in Figure 8, the virtual topology update cycle and IP address-hopping cycle were both set to 5 s.
As shown in Figure 11, before enabling the defense mechanism, the server’s response time under attack was significantly higher than that in the absence of an attack, indicating the successful degradation of the service quality. When the virtual topology spoofing mechanism was activated, the response time decreased rapidly and then gradually increased with the size of the transferred file, whereas it remained longer than that in the no-attack scenario. This demonstrated that the proposed virtual topology spoofing mechanism effectively mitigated most crossfire attack traffic. However, a small portion of the attack traffic still penetrated. After enabling the IP address-hopping mechanism, the server response delay was further reduced, increasing by only approximately 10 ms compared with the no-attack scenario. These results confirmed that the ENRNN+MTD mechanism effectively defended against crossfire attacks.
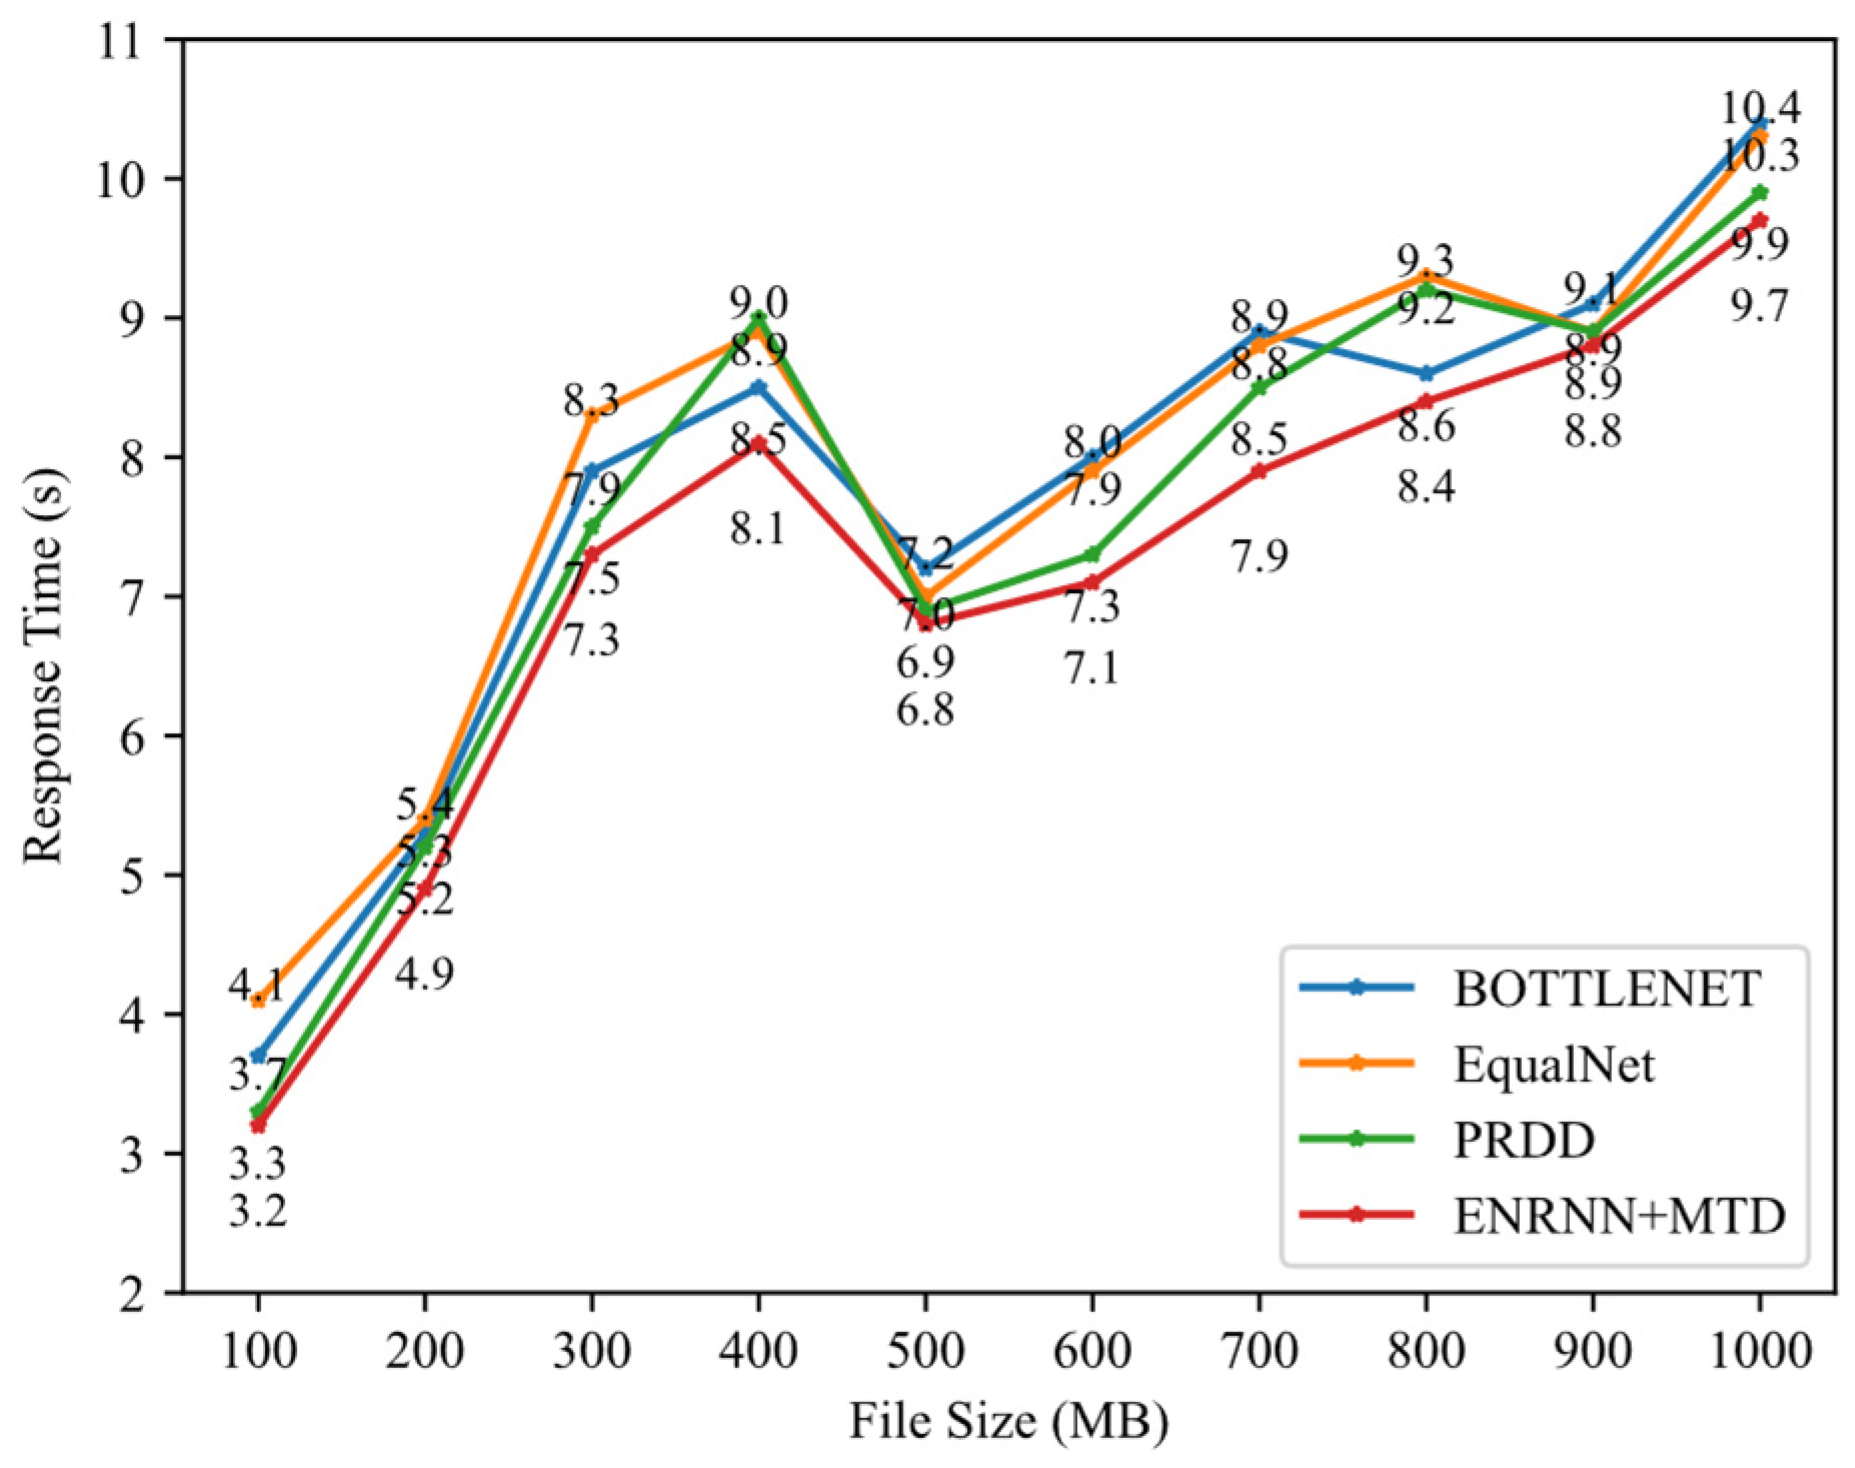
We also compared the proposed method with the state-of-the-art methods BOTTLENET [15], EqualNet [7], and PRDD [8] listed in Table 1 on the Internet Topology Zoo dataset, as shown in Figure 12. Under the condition of crossfire attacks, when the file size increases from 100 to 1000, the response times of different methods vary, but the proposed ENRNN+MTD consistently exhibits a shorter response time, verifying its effectiveness and stability.
To quantitatively assess whether the proposed method has a statistically significant improvement in response time, we conducted a rigorous statistical analysis. In a total of 20 repeated runs, we recorded the response times of the baseline method and the new method and calculated their paired differences. The results showed that the median reduction in response time was 0.7 ms (95% CI: [2.71, 11.71] ms, calculated using the Bootstrap method). For further verification, we used the non-parametric Wilcoxon signed rank test for pairwise comparison. The test results showed a significant difference in the median response times between the new method and the baseline method (p < 0.001), thus statistically confirming the effectiveness of the proposed method.
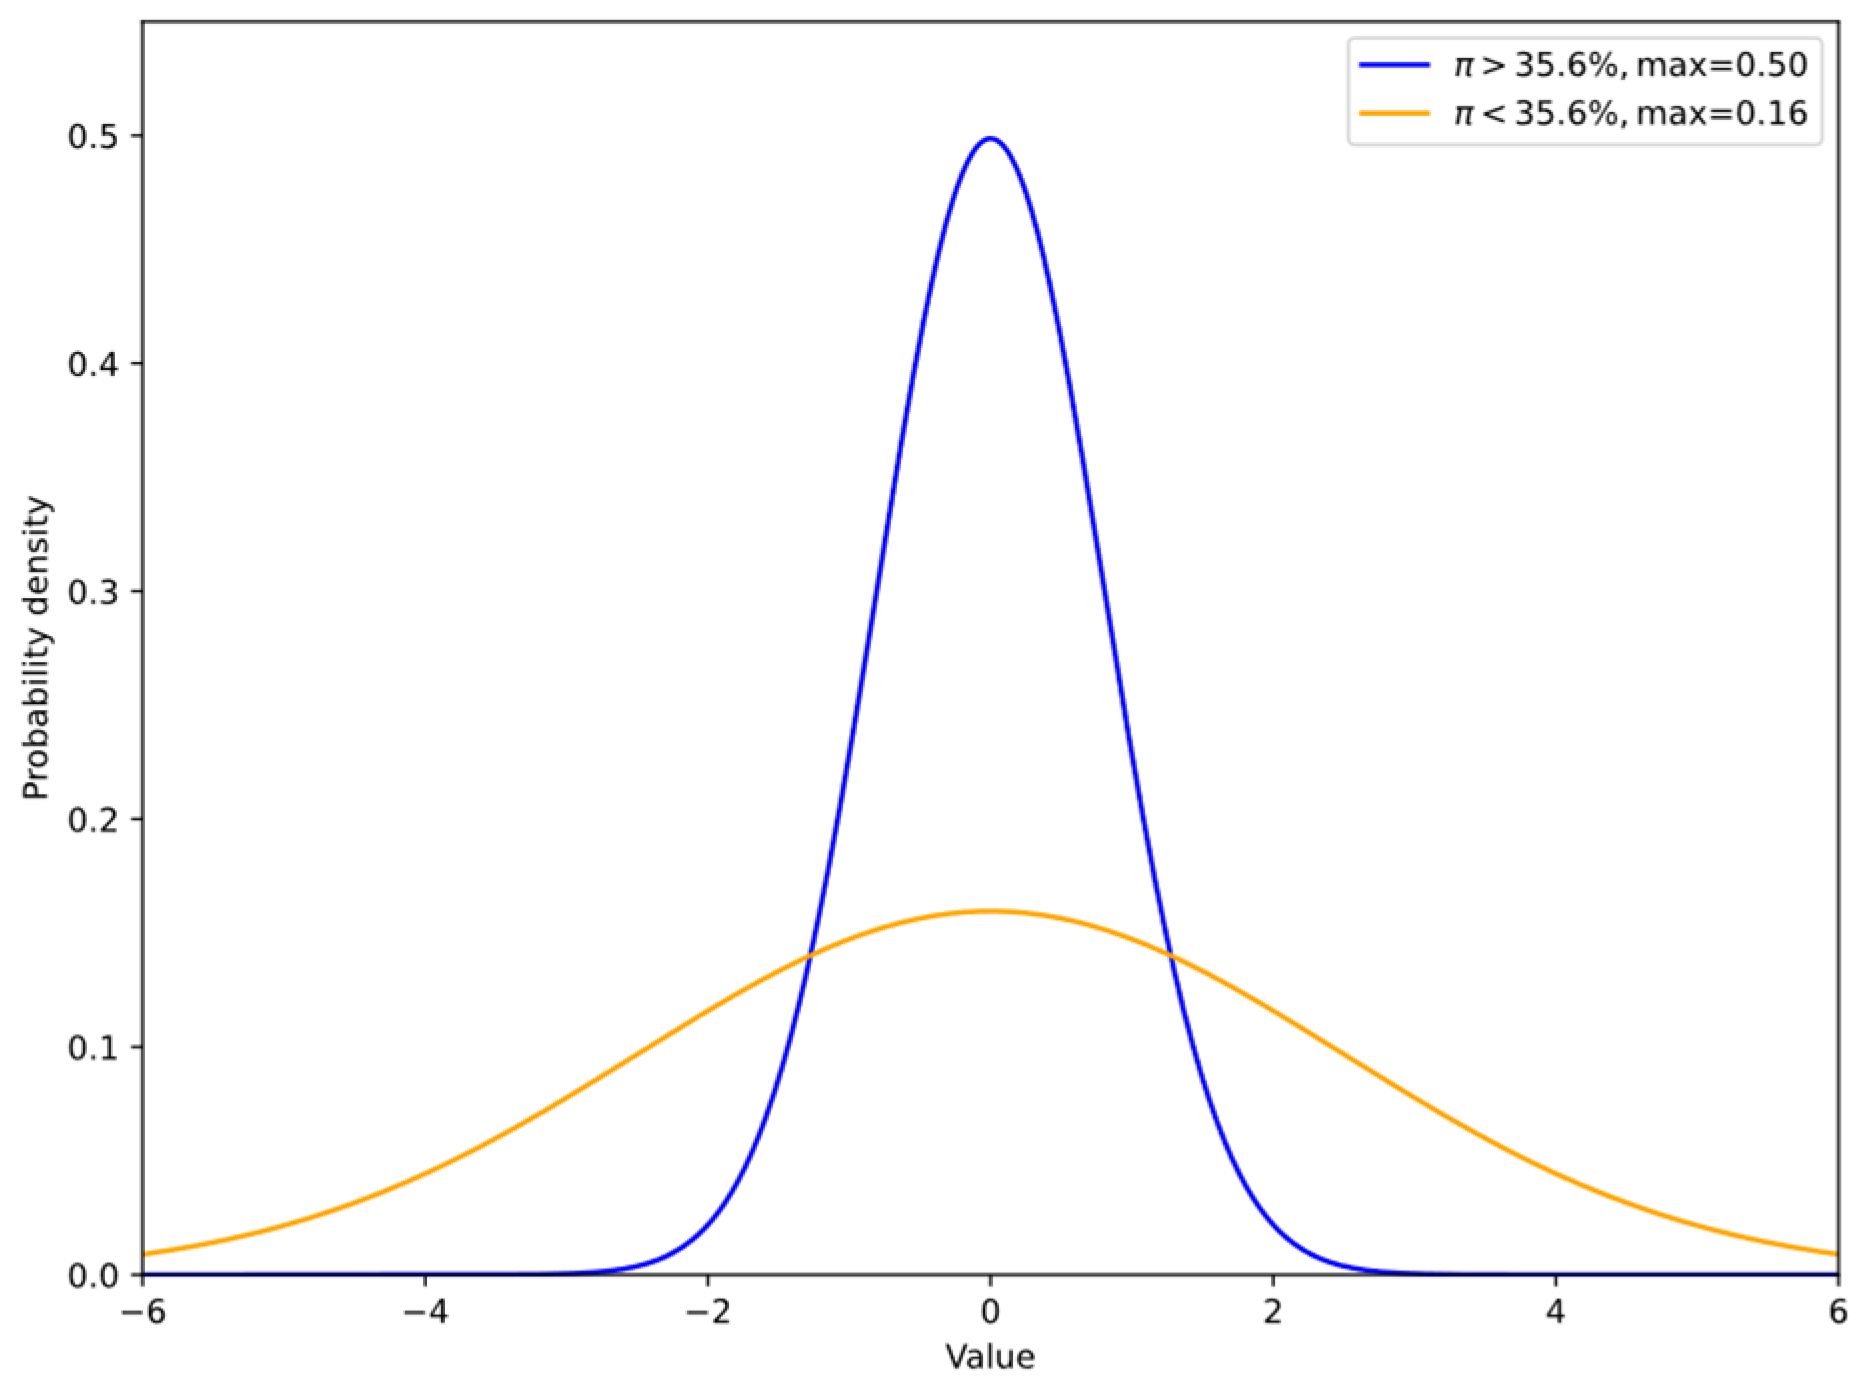
As introduced in Section 3.2, we set a threshold π to control the cycle of virtual topology generation. Experimental results, as shown in the following distribution Figure 13, indicate that when the maximum value of π is set to 35.6%, the distribution of topologies in the topology pool becomes more uniform. This makes it difficult for attackers to infer the form of the next topology, increasing the blindness of attacks. Therefore, it can fully defend against attacks with few iterations. When π exceeds this threshold, the generated topology distribution becomes relatively singular. For attacks with strong computing power, attackers can learn and adapt to the topology, identify the real topology, and once the defense is breached, the MTD mechanism will be further triggered.

5.2.3. System Load Testing

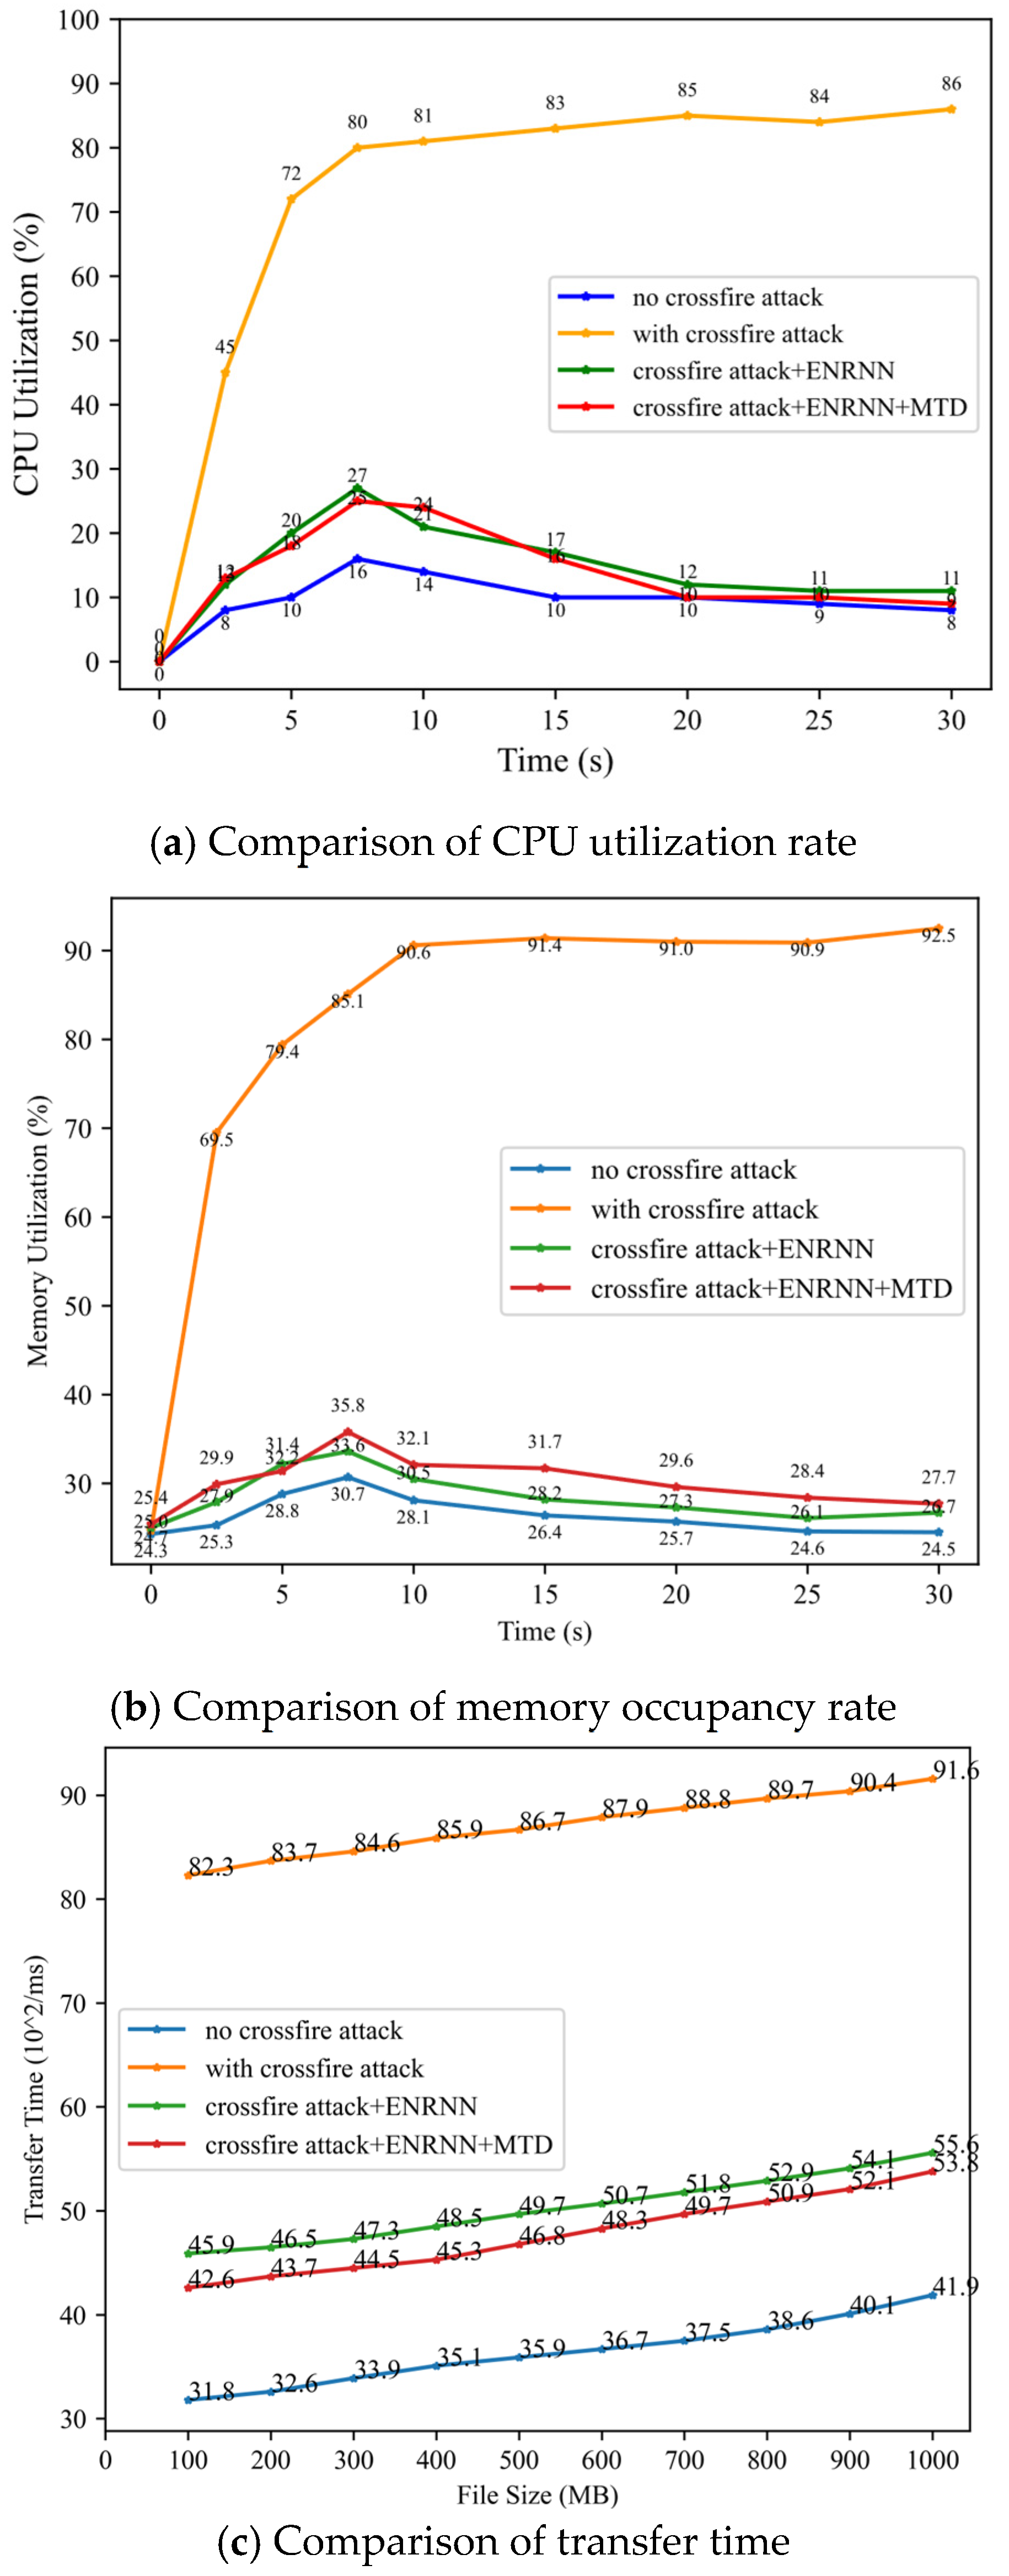
Using the FTP file transfer service, this section evaluates the modeL′s performance by comparing the CPU utilization rate, memory occupancy rate of the host, and file transfer time for different file sizes before and after enabling the proposed defense mechanism. The results (Figure 14a) were obtained using a virtual topology update cycle, and the IP address-hopping cycle was set to 5s.
During the defense process, virtual topology spoofing, virtual IP address generation, and flow table distribution contributed to increased CPU load, host memory occupancy, and system transmission time. However, as shown in Figure 14b,c, the increase in CPU load and memory usage remained within 10%, even with a transition cycle of 5 s, while the transmission time increase was limited to within 10 ms. These results demonstrated that the proposed method effectively enhanced defense while maintaining low resource overhead. For the legitimate traffic, virtual topology spoofing had no impact on them because they knew the real topology, whereas the IP hopping had a few impacts on them due to the change of IP address in this process. But as shown in Figure 11, we were able to achieve effective defense against crossfire attacks at a relatively low cost.

5.2.4. Communication Synchronization and Robustness Testing

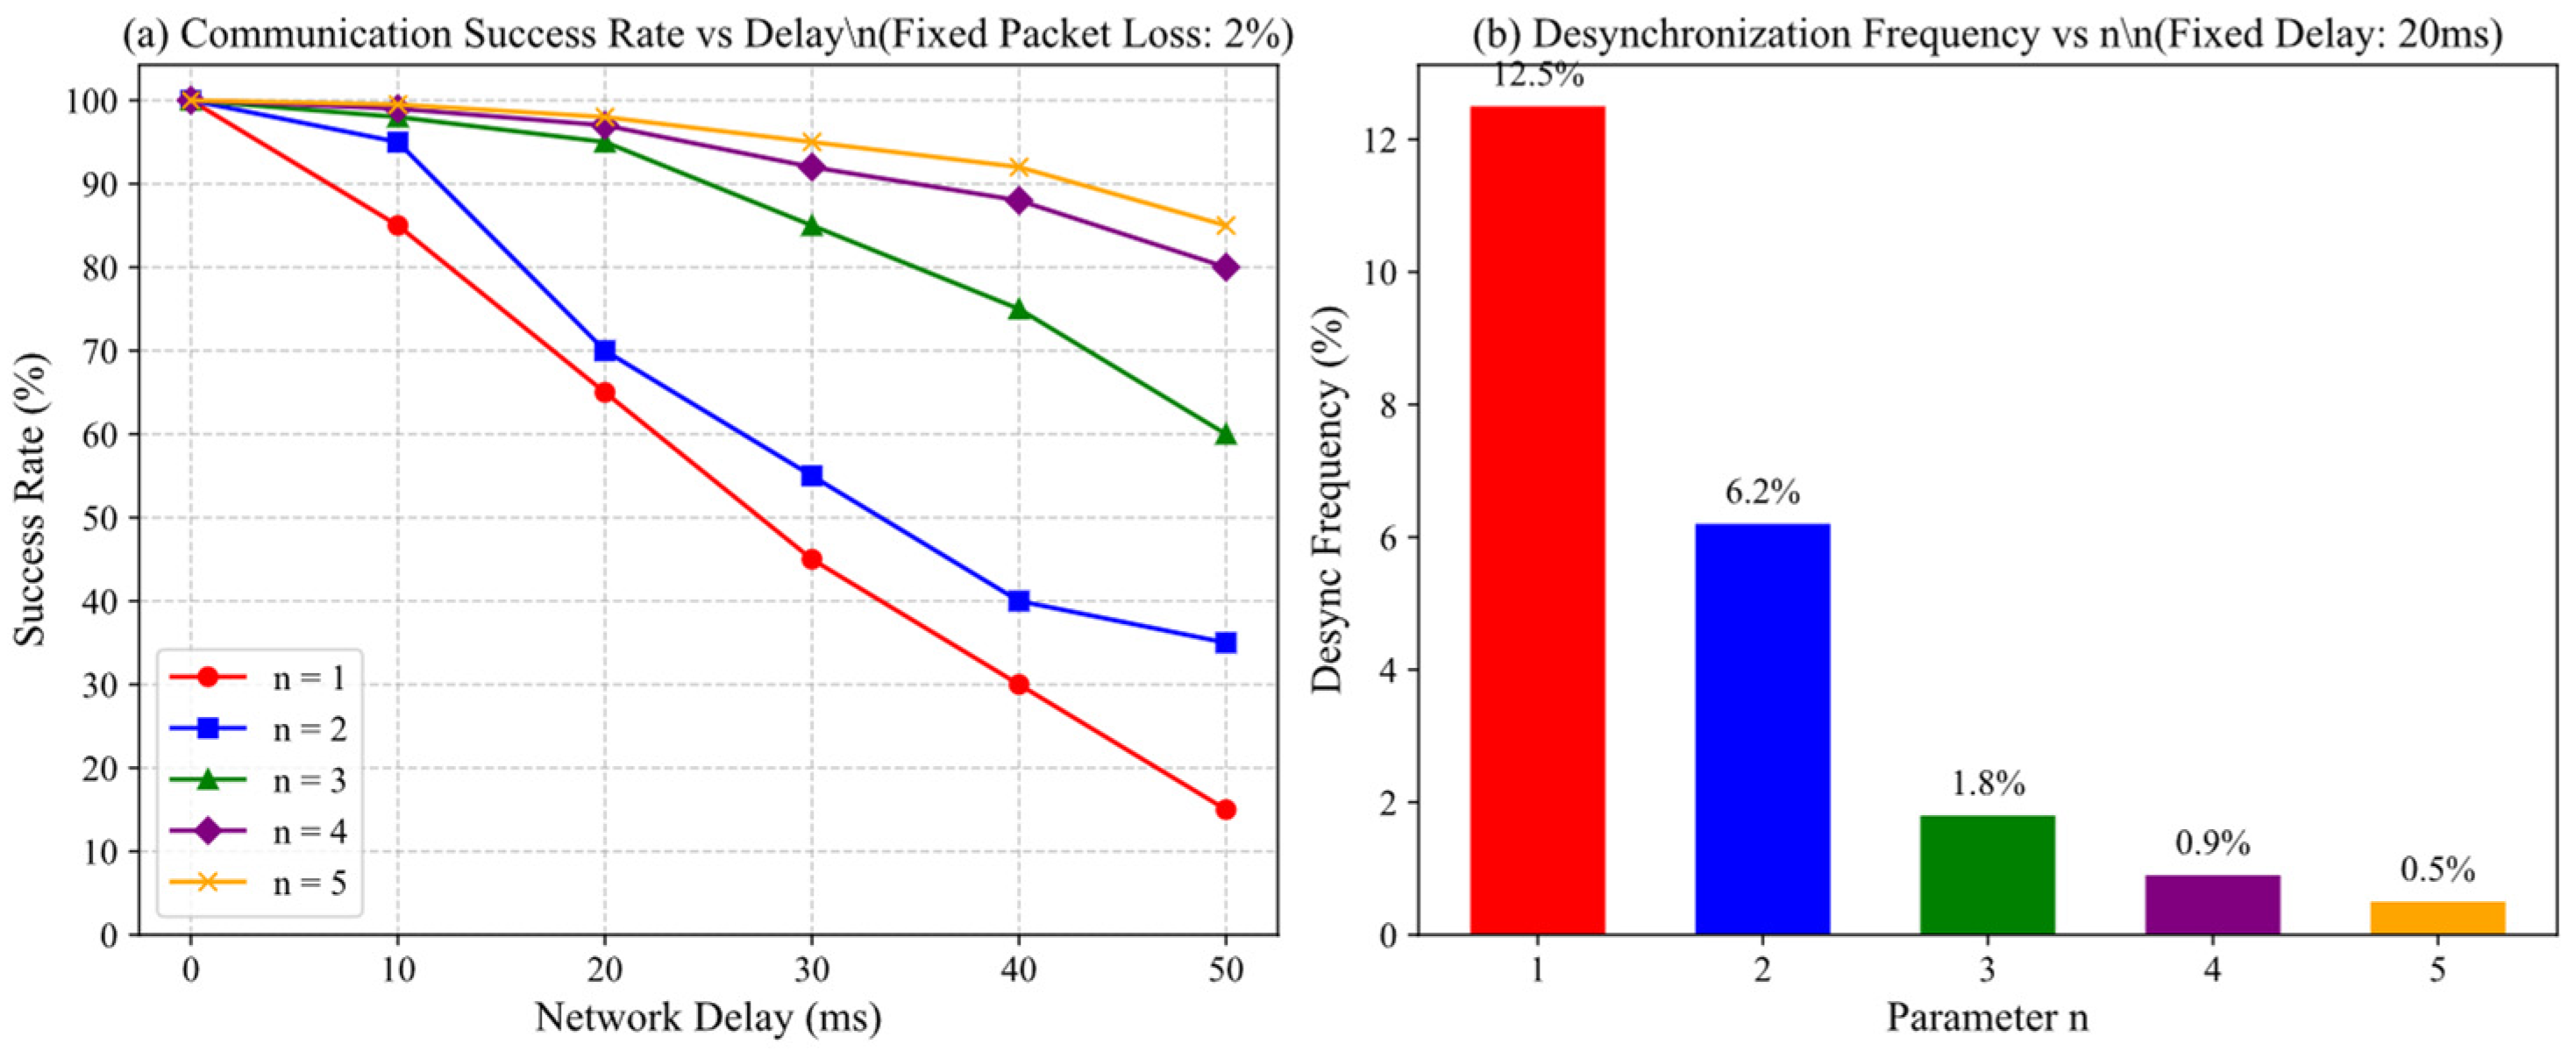
To evaluate the robustness of the IP hopping mechanism under non-ideal network conditions, we supplemented the evaluation with communication synchronization tests. These tests aimed to quantify the impact of control-plane delays and packet loss on communication success rate and verify the role of the sliding window parameter n in mitigating address desynchronization.
We introduced controllable network delays (0–50 ms) and random packet loss (0–5%) into the Mininet emulation environment to simulate real-world network fluctuations. The sliding window size n was swept from 1 to 5. For each value of n, we recorded the communication success rate and the desynchronization frequency during continuous IP hopping (high-frequency period of 5 s). Desynchronization was defined as a session failure caused by inconsistent address mappings between the communicating parties.
The results were shown in Figure 15. Figure 15a illustrated the relationship between the communication success rate and the value of n under different network delays, with a fixed packet loss rate of 2%. When n = 1, even slight delays caused a significant drop in the success rate. As n increased, the system’s tolerance to delay enhanced; with n ≥ 3, the communication success rate remained close to 100% even under delays up to 50 ms. Figure 15b further showed the desynchronization frequency for different n values under a fixed delay of 20 ms. When n = 1, the desynchronization frequency exceeded 12%, whereas with n = 3, it was effectively suppressed to below 2%, virtually eliminating service interruptions.
These experimental results demonstrated that the adopted sliding window mechanism effectively handled synchronization challenges posed by network delays and packet loss. Consequently, we selected n = 3 as the default parameter, which provided excellent robustness without significantly increasing the complexity of address pool management.

5.2.5. Sensitivity Studies of RAH-CS

To evaluate the impact of key parameters on the defense effectiveness and system performance, we conducted a systematic sensitivity study on the chaotic sequence generator, window synchronization mechanism, dual-period hopping parameters, and address pool size.
(1)
Impact of Sliding Window Size n
The sliding window mechanism, with a size of (2n + 1), is employed to mitigate communication desynchronization caused by network delays. We tested the communication synchronization success rate and service interruption rate under three configurations: n = 1, 2, 3, and the results were shown in Table 3.
Experimental results indicated that with n = 2, under simulated network delay condition (≤50 ms), the communication desynchronization rate remains below 1% with almost no service interruptions achieving the optimal balance between communication reliability and resource overhead.
(2)
Impact of Hopping Periods
We evaluated the defense effectiveness and system load under combinations of high-frequency hopping periods (1 s, 5 s, 10 s) and low-frequency hopping periods (60 s, 180 s, 300 s), the results were shown in Table 4.
As shown in Table 4, a high-frequency hopping period of 5 s stroked the best balance between defense effectiveness and system load. Reducing the period to 1s enhanced defense strength but increased CPU load by approximately 18.7%. Extending the period to 10 s enlarged the attack window, raising the attack success rate to 12.7%.
(3)
Impact of Address Pool Size
We compared the hopping randomness and system overhead under two address pool configurations: /24 (256 addresses) and /16 (65,536 addresses), and the results were shown in Table 5.
The /16 address pool significantly enhanced hopping randomness but led to an increase in flow table update delay of about 20 ms. The /24 address pool provided sufficient defensive effectiveness for most scenarios while maintaining more controllable system overhead.

5.2.6. Ablation Studies

To thoroughly evaluate the contribution of each component in our proposed ENRNN model, we conducted extensive ablation studies on the Internet Topology Zoo dataset. All experiments were repeated 5 times, and we report mean values with standard deviations.
(1)
Encoding Strategy Comparison
We compared our Minimum DFS encoding with two alternative graph encoding methods:
  • BFS Encoding: Breadth-first search traversal with node-level ordering
  • Random Walk Encoding: Fixed-length random walks with restart probability 0.15
Shannon Entropy in Table 6 quantifies topological diversity and unpredictability. From Table 6 we can see that our DFS encoding consistently outperformed alternatives across all metrics, demonstrating its superiority in capturing graph structural properties while maintaining efficiency.
(2)
Model Architecture Ablation
We evaluated different architectural configurations to understand the contribution of each component:
  • ELRNN-only: Only edge-level RNN without node-level modeling
  • NLRNN-only: Only node-level RNN without edge sequence modeling
  • Full ENRNN: Our complete hierarchical architecture
Valid Edge Ratio in Table 7 measures the proportion of generated edges that satisfy physical network constraints, including: (1) no self-loops, (2) no duplicate edges between the same node pair, and (3) connectivity to existing nodes in the topology. This metric ensures the practical deployability of generated virtual topologies. Table 7 shows that the full ENRNN architecture significantly outperforms both ablated versions, validating the importance of jointly modeling edge sequences and node dependencies.
(3)
Hidden Size and Depth Analysis
We investigated the impact of model capacity on generation quality, and the experimental results are show in Table 8.
As model capacity increases from Small to Medium configurations, we observe significant improvements in both structural fidelity (lower MMD) and diversity (higher Shannon entropy). However, further increasing model complexity to Large and X-Large configurations yields diminishing returns, with only marginal improvements in MMD at the cost of substantially increased training time and a slight reduction in diversity, likely due to overfitting to the training distribution. Therefore, the Medium configuration (hidden size 256, depth 2) achieves the optimal balance, delivering the highest Shannon entropy (5.42) while maintaining competitive structural similarity and reasonable training overhead.
(4)
Training Schedule Ablation
The training schedule, particularly the learning rate strategy, significantly impacts both model performance and practical deployment feasibility. We compare four learning rate strategies:
  • Fixed LR: Constant learning rate 0.003
  • Step Decay: Reduce by 30% at [100, 200, 400, 800] epochs (our schedule)
  • Cosine Annealing: Cosine annealing without restarts
  • Warmup+Cosine: Linear warmup for 50 epochs + cosine annealing
From Table 9 we can find that our step decay schedule achieves the best final performance with fastest convergence, making it suitable for practical deployment.

6. Conclusions and Future Work

This paper has developed a topology spoofing defense framework built on software-defined networking (SDN) to defend against crossfire attacks. By combining GNN-driven dynamic fake topology generation with adaptive IP hopping mechanisms, the framework demonstrates effective defense capabilities in a simulated environment. Critically, the proposed scheme is designed with practical deployment in mind. Its compatibility with existing network management systems is facilitated by leveraging standard SDN protocols (like OpenFlow) and NFV orchestration, allowing for incremental deployment without requiring a wholesale replacement of network infrastructure. Furthermore, the impact on legitimate traffic Quality of Service (QoS) is minimized through a dual-frequency IP hopping design—using a stable, low-frequency virtual IP for connection initiation and maintenance—and by ensuring that the topology deception mechanism is transparent to authorized users who possess the correct network view.
However, the scheme still has some limitations. Firstly, there is an impact on service performance: the computational overhead of GNN topology generation may cause delays in flow table updates, and high-frequency IP hopping may affect the QoS of critical services. Secondly, there is a risk of detection evasion. Advanced attackers may identify deceptive nodes through traffic pattern analysis (such as topology response time fingerprints) or bypass the hopping IP pool using adaptive scanning strategies. Thirdly, the current evaluation was conducted primarily against standard high-rate SYN flooding attacks and has not yet encompassed more stealthy attack variants, such as low-rate crossfire, multi-vantage probing, and adaptive scanning. In addition, there are challenges in system recoverability. A single point of failure in the controller may interrupt the deception strategy. Due to the limitations of implementation conditions, this paper has not yet considered the situation of controller clusters, failover, and rollback of expired rules under dynamic changes.
To address these limitations and further advance the proposed framework, future work will focus on the following directions:
  • Lightweight and Adaptive Defense: Adopting edge computing for GNN inference and combining reinforcement learning to optimize hopping frequency adaptively, thereby balancing system security and latency.
  • Large-Scale Validation: We plan to transition this research to a large-scale testbed (e.g., using GENI or FABRIC) or a real-world network deployment, where the system’s performance will be rigorously evaluated under conditions of scale, heterogeneous link speeds, and mixed background traffic. This will also allow for testing against the stealthy attack variants mentioned.
  • Resilient Architecture Design: Designing a more resilient architecture to tackle recoverability challenges, such as introducing a blockchain-assisted controller state synchronization mechanism to ensure second-level switching in case of failures and implementing a fast rollback process based on backup topologies.
  • Enhanced Deception: Implementing potential countermeasures against detection evasion, such as injecting random, bounded delays into response packets to obscure the differences between real and virtual nodes, or implementing a strategy mutation mechanism to render the defense model learned by attackers ineffective.

Author Contributions

Conceptualization, all authors; methodology, D.C. and X.Z.; software, X.Z. and J.S.; validation, X.Z. and J.S.; formal analysis, D.C. and C.F.; investigation, D.C.; resources, C.F.; data curation, X.Z. and J.S.; writing—original draft preparation, all authors; visualization, X.Z. and J.S.; supervision, C.F.; project administration, D.C.; funding acquisition, D.C. and C.F. All authors have read and agreed to the published version of the manuscript.

Funding

This work was funded by the Postdoctoral Fellowship Program of CPSF under Grant Number GZC20240321 and Natural Science Foundation of Henan Province under Grant Number 242300420700.

Institutional Review Board Statement

Not applicable.

Informed Consent Statement

Not applicable.

Data Availability Statement

The data used to support the findings of this study are included in the article.

Acknowledgments

The authors appreciate the comments and suggestions by the editors and anonymous reviewers.

Conflicts of Interest

The authors declare no conflicts of interest.

References

  1. Hyder, M.F.; Fatima, T. Towards Crossfire Distributed Denial of Service Attack Protection Using Intent-Based Moving Target Defense Over Software-Defined Networking. IEEE Access 2021, 9, 112792–112804. [Google Scholar] [CrossRef]
  2. Cheng, S.Y. Intelligent Detection and Defense Methods of Link Flooding Attacks. Ph.D. Thesis, University of Science and Technology of China, Hefei, China, 2024. [Google Scholar]
  3. Guo, L.; Jing, S.; Wei, L.; Zhao, C. Crossfire attack defense method based on software defined network. Comput. Eng. 2024, 54, 216–227. [Google Scholar]
  4. Rasool, R.; Wang, H.; Ashraf, U.; Ahmed, K.; Anwar, Z.; Rafique, W. A survey of link flooding attacks in software defined network ecosystems. J. Netw. Comput. Appl. 2020, 172, 102803. [Google Scholar] [CrossRef]
  5. Wang, Q.; Xiao, F.; Zhou, M.; Wang, Z. Linkbait: Active link obfuscation to thwart link-flooding attacks. arXiv 2017, arXiv:1703.09521. [Google Scholar]
  6. Kang, M.S.; Gligor, V.D.; Sekar, V. SPIFFY: Inducing CostDetectability Tradeoffs for Persistent Link-Flooding Attacks. In Proceedings of the Network and Distributed System Security Symposium, San Diego, CA, USA, 21–24 February 2016; Internet Society: Reston, VA, USA, 2016. [Google Scholar]
  7. Kim, J.; Marin, E.; Conti, M.; Shin, S. EqualNet: A Secure and Practical Defense for Long-term Network Topology Obfuscation. In Proceedings of the 2022 Network and Distributed System Security Symposium, San Diego, CA, USA, 24–28 April 2022. [Google Scholar]
  8. Zhou, B.; Wu, C.; Yang, Q.; Chen, X.; Zhang, D. A Persistent Route Diversification Mechanism for Defending Against Stealthy Crossfire Attack. Secur. Commun. Netw. 2022, 2022, 2566681. [Google Scholar] [CrossRef]
  9. Lu, Z.C. Low-Rate Denial of Service Attack Defense Method Based on Moving Target Defense Technology in SDN. Ph.D. Thesis, Civil Aviation University of China, Beijing, China, 2024. [Google Scholar]
  10. Trassare, S.T.; Beverly, R.; Alderson, D. A technique for network topology deception. In Proceedings of the MILCOM 2013-2013 IEEE Military Communications Conference, San Diego, CA, USA, 18–20 November 2013; IEEE: Piscataway, NJ, USA, 2013; pp. 1795–1800. [Google Scholar] [CrossRef]
  11. Meier, R.; Tsankov, P.; Lenders, V.; Vanbever, L.; Vechev, M. NetHide: Secure and Practical Network Topology Obfuscation. In Proceedings of the USENIX Security Symposium, Baltimore, MD, USA, 15–17 August 2018; pp. 693–709. [Google Scholar]
  12. Aydeger, A.; Saputro, N.; Akkaya, K. Utilizing NFV for Effective Moving Target Defense Against Link Flooding Reconnaissance Attacks. In Proceedings of the MILCOM 2018 IEEE Military Communications Conference (MILCOM), Los Angeles, CA, USA, 29–31 October 2018; pp. 946–951. [Google Scholar] [CrossRef]
  13. Achleitner, S.; La Porta, T.; McDaniel, P.; Sugrim, S.; Krishnamurthy, S.V.; Chadha, R. Cyber Deception: Virtual Networks to Defend Insider Reconnaissance. In Proceedings of the Workshop on Managing Insider Security Threats, Vienna, Austria, 28 October 2016; ACM: New York, NY, USA, 2016. [Google Scholar]
  14. Qin, X.; Jiang, F.; Qin, X.; Ge, L.; Lu, M.; Doss, R. CGAN-based cyber deception framework against reconnaissance attacks in ICS. Comput. Netw. 2024, 251, 110655. [Google Scholar] [CrossRef]
  15. Eshratifar, A.E.; Esmaili, A.; Pedram, M. BottleNet: A Deep Learning Architecture for Intelligent Mobile Cloud Computing Services. In Proceedings of the 2019 IEEE/ACM International Symposium on Low Power Electronics and Design (ISLPED), Lausanne, Switzerland, 29–31 July 2019; pp. 1–6. [Google Scholar] [CrossRef]
  16. Kim, J.; Shin, S. Software-defined HoneyNet: Towards mitigating link flooding attacks. In Proceedings of the 2017 47th Annual IEEE/IFIP International Conference on Dependable Systems and Networks Workshops (DSNW), Denver, CO, USA, 26–29 June 2017; pp. 99–100. [Google Scholar] [CrossRef]
  17. Barabási, A.L.; Albert, R. Emergence of scaling in random networks. Science 1999, 286, 509–512. [Google Scholar] [CrossRef] [PubMed]
  18. Liu, Y.; Zhao, J.; Zhang, G.; Xing, C. NetObfu: A lightweight and efficient network topology obfuscation defense scheme. Comput. Secur. 2021, 110, 102447. [Google Scholar] [CrossRef]
  19. Jin, W.; Barzilay, R.; Jaakkola, T. Junction tree variational autoencoder for molecular graph generation. In Proceedings of the 35th International Conference on Machine Learning (ICML), Stockholm, Sweden, 10–15 July 2018; PMLR: Cambridge, MA, USA, 2018; pp. 2323–2332. [Google Scholar]
  20. Simonovsky, M.; Komodakis, N. GraphVAE: Towards generation of small graphs using variational autoencoders. In Proceedings of the International Conference on Artificial Neural Networks (ICANN), Rhodes, Greece, 4–7 October 2018; Springer: Cham, Switzerland, 2018; pp. 412–422. [Google Scholar] [CrossRef]
  21. Samanta, B.; Abir, D.E.; Jana, G.; Chattaraj, P.K.; Ganguly, N.; Rodriguez, M.G. NeVAE: A deep generative model for molecular graphs. AAAI Conf. Artif. Intell. 2019, 33, 1110–1117. [Google Scholar] [CrossRef]
  22. Bojchevski, A.; Shchur, O.; Zügner, D.; Günnemann, S. Netgan: Generating graphs via random walks. In Proceedings of the International Conference on Machine Learning (ICML), Stockholm, Sweden, 10–15 July 2018; PMLR: Cambridge, MA, USA, 2018; pp. 610–619. [Google Scholar]
  23. Guimaraes, G.L.; Sanchez-Lengeling, B.; Outeiral, C.; Farias, P.L.; Aspuru-Guzik, A. Objective-reinforced generative adversarial networks (ORGAN) for sequence generation models. arXiv 2017, arXiv:1705.10843. [Google Scholar]
  24. De Cao, N.; Kipf, T. MolGAN: An implicit generative model for small molecular graphs. arXiv 2018, arXiv:1805.11973. [Google Scholar]
  25. Yang, C.; Zhuang, P.; Shi, W.; Luu, A.; Li, P. Conditional structure generation through graph variational generative adversarial nets. In Proceedings of the Neural Information Proceedings Systems (NIPS), Vancouver, BC, Canada, 8–14 December 2019; pp. 1338–1349. [Google Scholar]
  26. You, J.; Ying, R.; Ren, X.; Hamilton, W.; Leskovec, J. GraphRNN: Generating realistic graphs with deep auto-regressive models. In Proceedings of the International Conference on Machine Learning (ICML), Stockholm, Sweden, 10–15 July 2018; PMLR: Cambridge, MA, USA, 2018; pp. 5708–5717. [Google Scholar]
  27. Li, Y.; Vinyals, O.; Dyer, C.; Pascanu, R.; Battaglia, P. Learning deep generative models of graphs. arXiv 2018, arXiv:1803.03324. [Google Scholar] [CrossRef]
  28. Bjerrum, E.J.; Threlfall, R. Molecular generation with recurrent neural networks (RNNs). arXiv 2017, arXiv:1705.04612. [Google Scholar] [CrossRef]
  29. Sharma, D.P.; Kim, D.S.; Yoon, S.; Lim, H.; Cho, J.H.; Moore, T.J. FRVM: Flexible Random Virtual IP Multiplexing in Software-defined Networks. In Proceedings of the IEEE 2018 17th IEEE International Conference on Trust, Security and Privacy in Computing and Communications/12th IEEE International Conference On Big Data Science and Engineering (TrustCom/BigDataSE), New York, NY, USA, 1–3 August 2018; IEEE: Piscataway, NJ, USA, 2018; pp. 579–587. [Google Scholar] [CrossRef]
  30. Jafarian, J.H.; Al-Shaer, E.; Duan, Q. Openflow random host mutation: Transparent moving target defense using software defined networking. In Proceedings of the 1st Workshop on Hot Topics in Software Defined Networks, Helsinki, Finland, 13 August 2012; ACM Press: New York, NY, USA, 2012; pp. 127–132. [Google Scholar] [CrossRef]
  31. Jafarian, J.H.H.; Al-Shaer, E.; Duan, Q. Spatio-Temporal address mutation for proactive cyber agility against sophisticated attackers. In Proceedings of the 1st ACM Workshop on Moving Target Defense, Scottsdale, AZ, USA, 3 November 2014; ACM Press: New York, NY, USA, 2014; pp. 69–78. [Google Scholar] [CrossRef]
  32. Wang, S.; Zhang, L.; Tang, C. A new dynamic address solution for moving target defense. In Proceedings of the Information Technology, Networking, Electronic and Automation Control Conference IEEE, Chongqing, China, 20–22 May 2016; IEEE: Piscataway, NJ, USA, 2016; pp. 1149–1152. [Google Scholar] [CrossRef]
  33. Makanju, A.; Zincir-Heywood, A.N.; Kiyomoto, S. On evolutionary computation for moving target defense in software defined networks. In Proceedings of the Genetic and Evolutionary Computation Conference on Companion, Berlin, Germany, 15–19 July 2017; ACM Press: New York, NY, USA, 2017; pp. 287–288. [Google Scholar] [CrossRef]
  34. Qin, X.; Doss, R.; Jiang, F.; Qin, X.; Long, B. Securing ICS networks: SDN-based automated traffic control and MTD defensive framework against DDoS attacks. Comput. Commun. 2025, 241, 108252. [Google Scholar] [CrossRef]
  35. Tu, D.; Li, W. SDN address hopping scheme based on chaotic sequence. Comput. Digit. Eng. 2018, 46, 2315–2318. [Google Scholar]
  36. Feng, W. Research and Implementation of Address Port Dynamic Hopping Technology in Network Communication. Ph.D. Thesis, Huazhong University of Science and Technology, Wuhan, China, 2013. [Google Scholar]
  37. Knight, S.; Nguyen, H.X.; Falkner, N.; Bowden, R.; Roughan, M. The internet topology zoo. IEEE J. Sel. Areas Commun. 2011, 29, 1765–1775. [Google Scholar] [CrossRef]
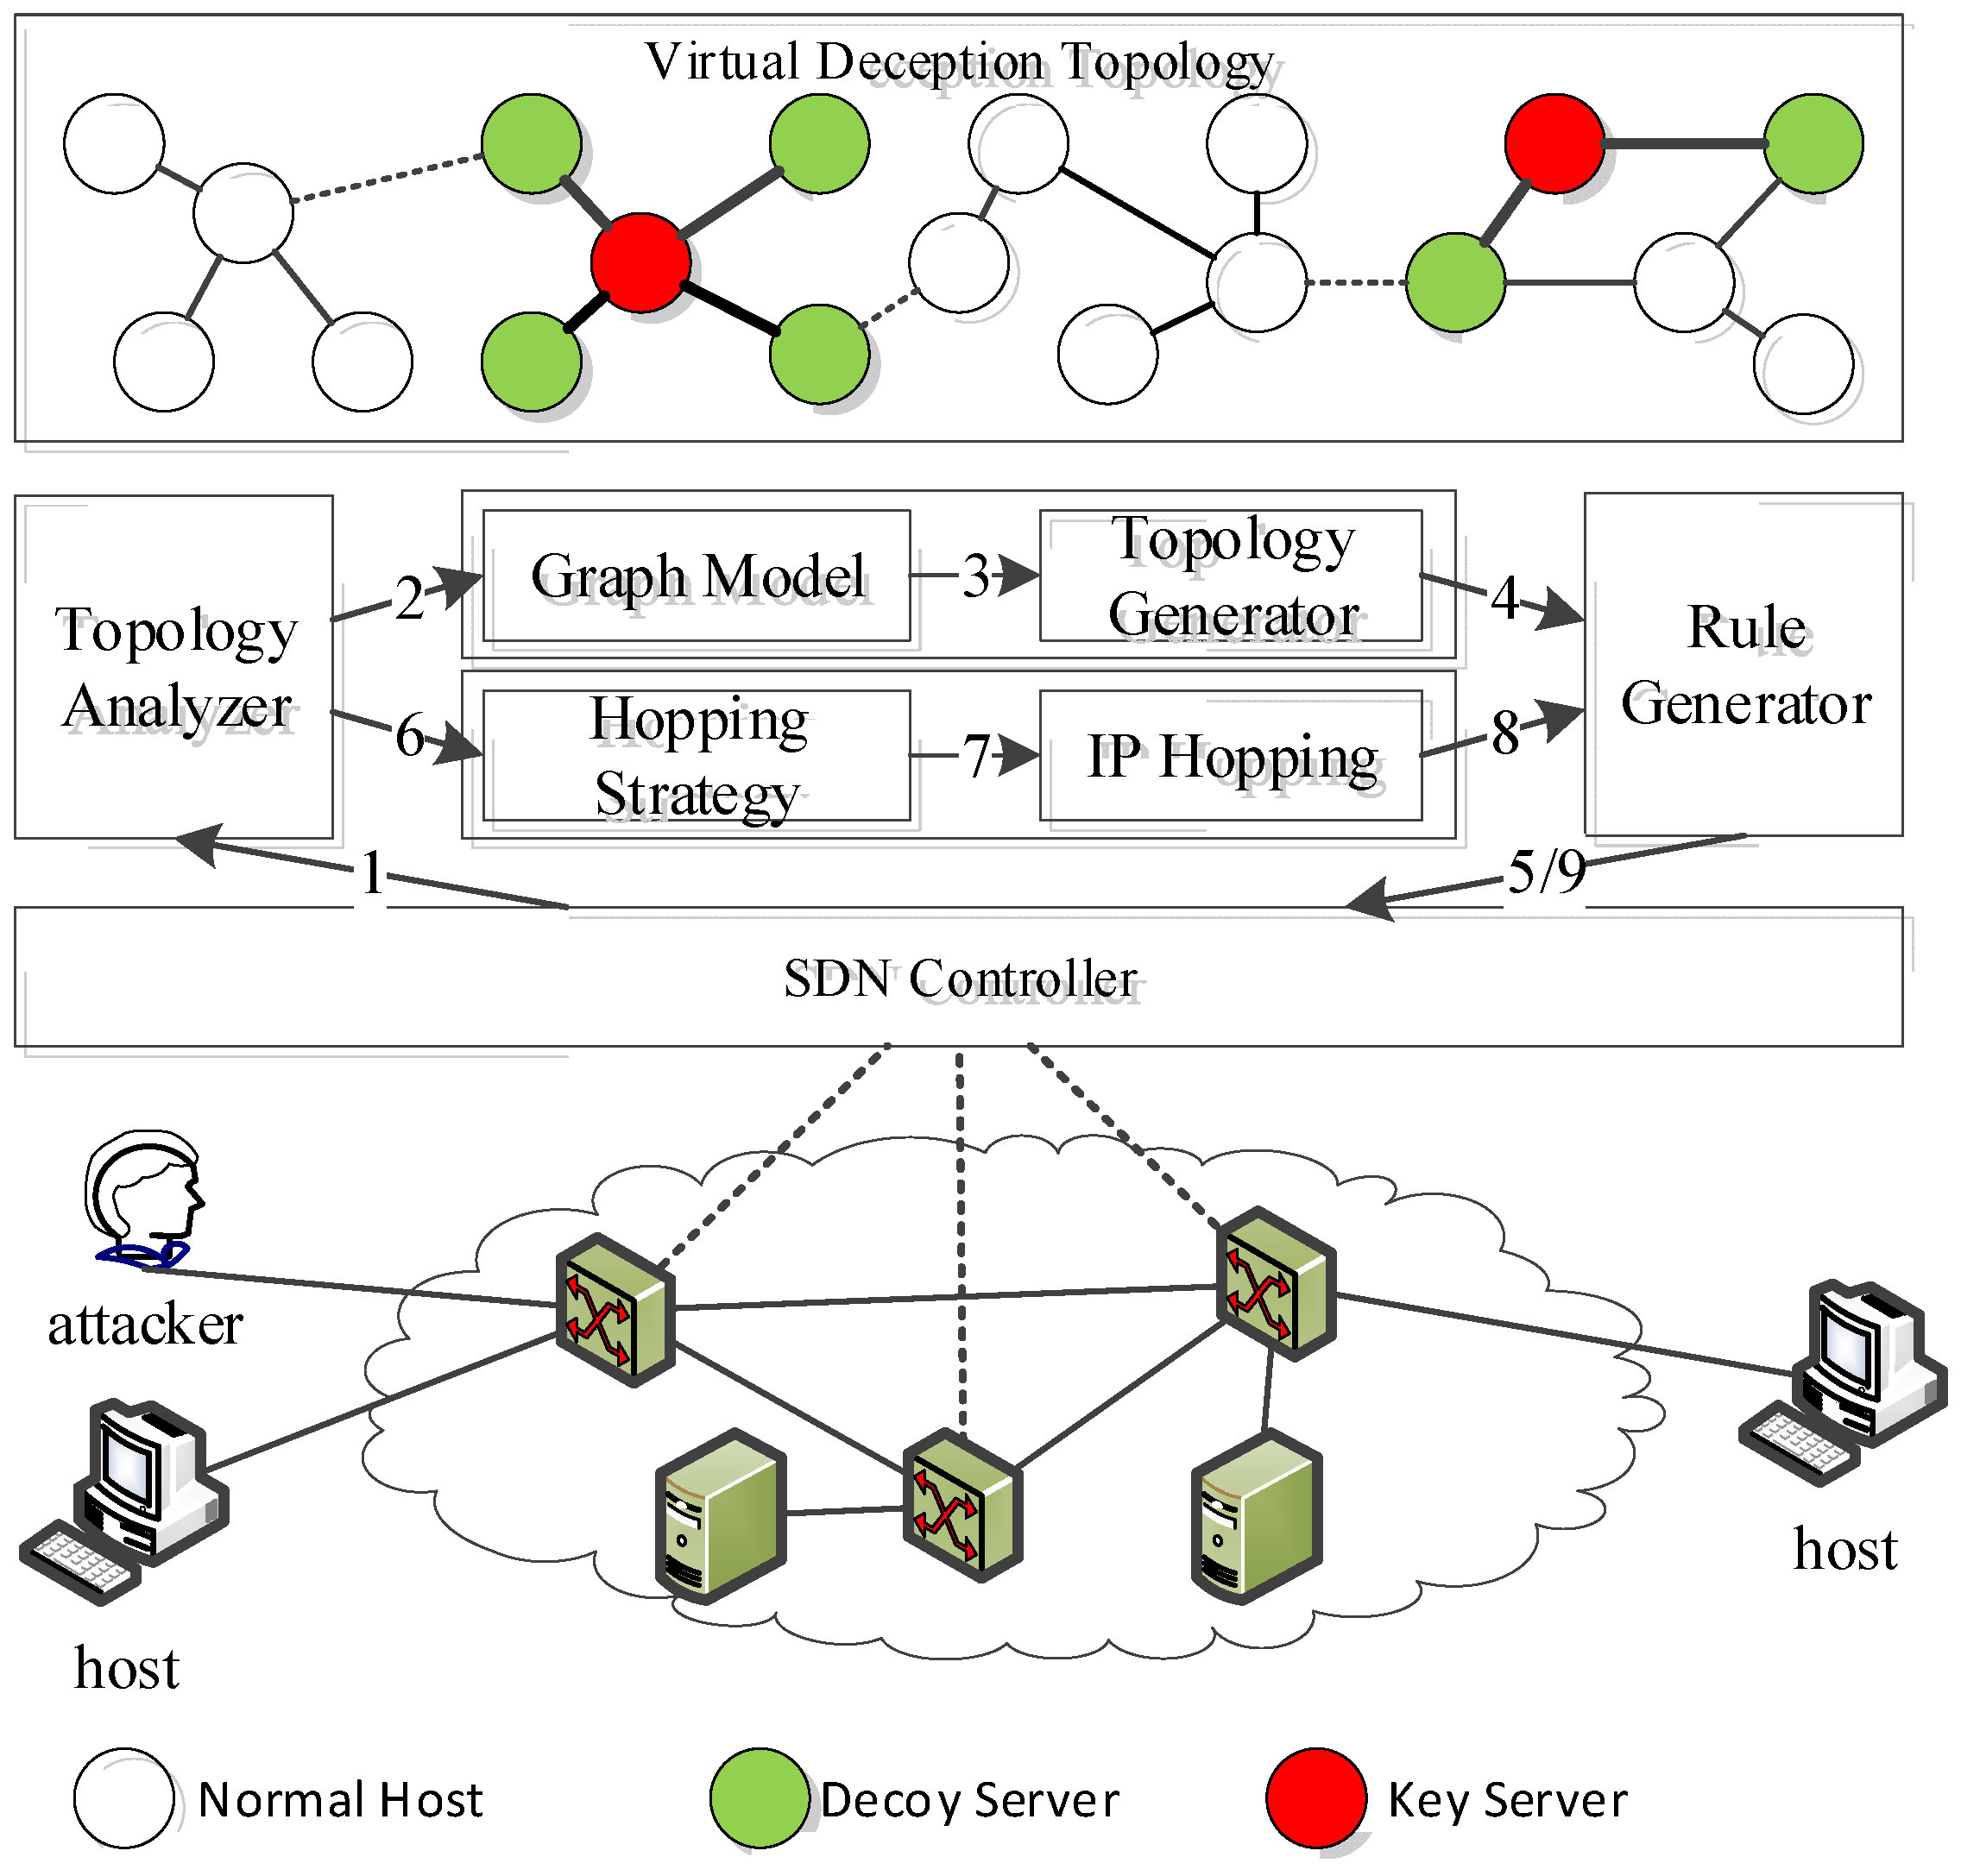
Figure 1. System architecture.
Applsci 15 11432 g001
Figure 2. Virtual topology spoofing generation.
Applsci 15 11432 g002
Figure 3. DFS encoding.
Applsci 15 11432 g003
Figure 4. Architecture of ENRNN.
Applsci 15 11432 g004
Figure 5. Architecture of RAH-CS.
Applsci 15 11432 g005
Figure 6. Communication flow of RAH-CS.
Applsci 15 11432 g006
Figure 7. Network topology.
Applsci 15 11432 g007
Figure 8. Distribution comparison of node degree and clustering coefficient.
Applsci 15 11432 g008
Figure 9. Comparison performance over different datasets.
Applsci 15 11432 g009aApplsci 15 11432 g009b
Figure 10. Comparison between Shannon entropy and structural entropy.
Applsci 15 11432 g010
Figure 11. Server response time testing.
Applsci 15 11432 g011
Figure 12. Server response time with compared methods.
Applsci 15 11432 g012
Figure 13. Impact of the threshold π on the distribution of virtual topologies.
Applsci 15 11432 g013
Figure 14. CPU utilization rate, Memory occupancy rate, and file transfer time test results.
Applsci 15 11432 g014
Figure 15. Impact of n on communication synchronization performance.
Applsci 15 11432 g015
Table 1. Comparison of different virtual topology deception algorithms.
MethodPurposeDeception Algorithms
LinkBait [5]Link confusionON
SPIFFY [6]Temporary increase in link bandwidthON
NTD [10]Hide critical linksVN
NetHide [11]Confusing network routingVN
RDS [13]Delayed scanning for investigation and deceptionFR
VSNs [12]Virtualization network functionalityFR
BOTTLENET [15]Complex topologyFR, ON, VN
EqualNet [7]Network topology confusionFR
PRDD [8]Persistent routing diversification defenseFR
OursVirtual topology & mobile target defenseVN, MTD
Table 2. Experimental parameter setting.
ENRNN-MTD
Graphics cardNVIDIA Geforce RTX 2080 Ti
Operating systemUbuntu 20.04
ProcessorIntel i7-9750h 4cores 2.6 GHz
Memory16 GB
SimulatorMininet
InterchangerOpenFlow vSwitch
ControllerPOX
Client24
OF switch4
Attacker4
Decoy server16
Target server1
Optimization algorithmAdam optimizer
Learning rate0.003 (decay 30% at 100/200/400/800 training epoch)
Batch size256
Hidden state dimension256
Input dimension92
Node number |V|333–431
Edge number |E|477–736
IP address pool of high frequency hopping152.0.0.0/24
IP address pool of low frequency hopping10.0.0.0/24
High frequency hopping period5 s
Low frequency hopping period 180 s
Table 3. Communication performance metrics under different n values.
n ValueWindow SizeAvg. Desync Rate (%)Service Interruption Rate (%)Memory Overhead Increase (%)
134.21.83.5
250.80.27.2
370.30.111.5
Table 4. Performance metrics under different hopping periods.
High-Freq Period (s)Low-Freq Period (s)Server Response time Increase (ms) CPU Load Increase (%)Attack Success Rate (%)
16015.318.72.1
51808.29.54.3
103005.16.212.7
Table 5. Performance comparison under different address pool size.
Address Pool SizeNumber of AddressesShannon EntropyFlow Table Update Delay (ms) Memory Usage (MB)
/24605.815.345.6
/161807.68.2128.4
Table 6. Performance comparison of different graph encoding strategies (mean ± std).
Encoding MethodMMDShannon EntropyTraining Time (s)
BFS0.051 ± 0.0064.83 ± 0.183120 ± 150
Random Walk0.089 ± 0.0114.21 ± 0.222980 ± 140
DFS (Ours)0.032 ± 0.0045.42 ± 0.152850 ± 120
Table 7. Ablation study on model architecture components (mean ± std).
Model VariantMMDShannon EntropyValid Edge Ratio
ELRNN-only0.071 ± 0.0084.25 ± 0.120.82 ± 0.04
NLRNN-only0.058 ± 0.0074.63 ± 0.100.88 ± 0.03
Full ENRNN0.032 ± 0.0045.42 ± 0.150.96 ± 0.02
Table 8. Impact of model capacity on generation quality.
ConfigurationHidden SizeDepthMMDShannon EntropyTraining Time (s)
Small12810.0684.851850
Medium25620.0325.422850
Large51230.0295.385270
Table 9. Performance with different training schedules (mean ± std).
ScheduleMMDShannon EntropyConvergence Epochs
Fixed LR0.047 ± 0.0064.92 ± 0.14950 ± 45
Cosine Annealing0.038 ± 0.0055.18 ± 0.12650 ± 38
Warmup+Cosine0.035 ± 0.0045.25 ± 0.11580 ± 32
Step Decay (Ours)0.032 ± 0.0045.42 ± 0.15520 ± 28
Disclaimer/Publisher’s Note: The statements, opinions and data contained in all publications are solely those of the individual author(s) and contributor(s) and not of MDPI and/or the editor(s). MDPI and/or the editor(s) disclaim responsibility for any injury to people or property resulting from any ideas, methods, instructions or products referred to in the content.