1. Introduction
The pressure difference between the interior and exterior of a building is caused by wind, temperature differences between the interior and exterior, and the operation of air- conditioning systems [
1]. This can cause unintended airflow through the building envelope, known as air infiltration or leakage. In particular, when there is a negative pressure difference between the interior and exterior, airflow from the exterior to the interior due to infiltration can cause unfiltered contaminated air from the exterior to enter the building. Infiltration occurring in the building envelope affects the indoor environment and building operation. According to a study by Du et al., analysis of air leakage in high-airtightness buildings under various climatic conditions in China revealed that heating energy demand due to winter infiltration can account for over 10% of the total building load [
2]. Straube, J.F. emphasized the importance of building pressure management for moisture control, stating that indoor negative pressure promotes moisture penetration, and that moisture diffusion affects mold growth as well as the performance and structural integrity of building materials [
3]. Previous studies have shown that condensation on the building envelope can cause problems such as increased heating and cooling energy consumption, poor indoor air quality, and moisture diffusion. One solution to these problems is to control the building pressure. The American Society of Heating, Refrigerating and Air-Conditioning Engineers (ASHRAE) recommends maintaining buildings at positive pressure (1–20 Pa) to reduce condensation [
4]. The main purpose of a heating, ventilation, and air-conditioning (HVAC) system is to maintain the indoor thermal environment and air quality by regulating the supply airflow rate, so the return airflow rate can be used to regulate the building pressure [
5]. Appropriate return fan control in variable air volume (VAV) systems is required for building pressurization [
6].
VAV system is a HVAC method used in a building’s heating and cooling system that maintains a constant-supply air temperature and changes the supply airflow rate according to load fluctuations [
7]. Methods of controlling building pressure using VAV systems include fan tracking control (FT) and volumetric tracking control (VT) [
8]. FT control operates the return fan at the same speed or slightly slower than the supply fan speed. In FT control of return fans, the supply and return fans operate at the same speed. VT control uses the airflow measurement of a duct or fan and adjusts dampers or fan speed to maintain a constant difference between the supply and return airflow rate. The control variable is the return airflow rate, and since it is set to follow the change in the VAV supply airflow rate, this method is called volume tracking control. Pang, X. et al.’s analyzed the impact of airflow and pressure control on the indoor environment and energy consumption under a VAV control system, and analyzed the basic operating principles of the system [
9]. Li D. et al. addressed the relationship between airflow and duct pressure in variable airflow systems and suggested ways to save energy through fan speed control and duct pressure control [
10]. In particular, this study effectively reduced the wear of terminal valves and fan energy consumption through a dual closed-loop control strategy in VAV systems. Liu, M. developed a variable speed drive volumetric tracking (VSDVT) control method utilizing VSD signals as a return fan control method for a VAV system [
11]. This method efficiently controls the supply and return airflow rate in a VAV system. Simulations demonstrated that annual return fan energy consumption can be reduced by up to 50% and supply fan energy consumption by up to 30%.
Ke, Y.’s study analyzed the return fan control methods of VAV systems in six climate regions and explained how the appropriate selection of return fan control strategies according to the environment affects indoor air quality and energy efficiency [
12]. The impact of climate-specific ventilation control strategies on energy efficiency was validated through experiments. Pang, X. et al.’s study analyzed the effects of airflow and pressure regulation through VAV system control methods on indoor environments and energy consumption, while also examining the system’s fundamental operating principles [
10]. Various control variables of VAV systems were evaluated and classified as excellent, average, or poor, thereby establishing criteria for control performance assessment. Simulations demonstrated that energy consumption and thermal performance may vary significantly depending on the use of SAT reset, airflow control, and economic operation mode. While the study focused on evaluating the performance variability of existing systems, it did not propose new control algorithms or specific methods for performance improvement. Li D. et al.’s paper addressed the correlation between airflow and duct pressure in VAV systems, proposing methods to save energy through fan speed control and duct pressure regulation [
8]. Notably, this study effectively reduced terminal valve wear and fan energy consumption in VAV systems using a dual closed-loop control strategy. Using experimental data, they modeled the dynamic temperature response to enhance adaptability to seasonal load variations. Liu, M. developed a VSDVT control method utilizing VSD signals as a ventilation fan control approach for variable air volume systems, efficiently regulating supply and return airflow rate in VAV systems [
13]. Simulations demonstrated that this method could reduce annual ventilation fan energy consumption by up to 50% and supply fan energy consumption by up to 30%.
Infiltration occurs due to the pressure difference between the interior and exterior of a building, and pressure control requires considering the infiltration rate based on the real-time fluctuations in the building pressure difference. Previous studies have proposed and demonstrated various approaches to improve the control performance and energy efficiency of VAV systems. However, they have not specifically considered the envelope pressure difference caused by HVAC system operation and the resulting impact on infiltration. Furthermore, the real-time applicability of the proposed control strategy and its validation in the field have been lacking. Therefore, research on pressure control methods that consider infiltration rate in buildings remains urgently needed.
Pressure differentials within a building fluctuate constantly depending on the operating status of the HVAC system. To accurately track these changes, pressure sensors must be installed to continuously monitor indoor–outdoor pressure differentials [
12,
14]. However, the installation location of exterior wall pressure sensors influences measurement uncertainty. Therefore, it is recommended to install them at points where leakage is likely to occur or at locations away from other buildings or obstacles. However, finding such locations is difficult in densely built-up urban areas, and permanently installing pressure sensors on all exterior walls of existing buildings presents physical and economic constraints. Therefore, an alternative to physical pressure sensors is needed during the building operation phase.
To predict the infiltration rate occurring in the building envelope and develop a pressure control method for the VAV system, previous research on predicting building infiltration rate and controlling the return fan in VAV system was investigated. Max Sherman attempted to predict infiltration based on building airtightness by collecting infiltration rate data from more than 100,000 residential units and developing a regression model [
15]. This model utilized a large database to analyze residential air leakage patterns, but its limitations included a failure to adequately account for changes in airflow through building exterior walls. Hrvoje Krstic conducted blower door tests on 58 residential buildings constructed between 1912 and 2013, establishing a database of airtightness performance and developing a model to predict airtightness performance based on window characteristics [
16]. This model, also based on large-scale data, did not account for variations in airflow. On the other hand, Yongming Ji developed a model to predict infiltration in high-density, single-compartment buildings through an experimental approach [
17]. However, this model suffers from the limitation of requiring real-time measurement of indoor–outdoor pressure differences, making it difficult to apply during actual building operation.
Previous studies have proposed and demonstrated various approaches to improve the control performance and energy efficiency of VAV systems. However, they did not specifically consider the impact of pressure differentials across the building envelope caused by HVAC system operation and the resulting infiltration rate. Furthermore, there was a lack of real-time applicability and verification of the proposed control strategies in actual environments. Considering these points, this study aims to propose an operational strategy that predicts infiltration rate during VAV system control and improves building infiltration by utilizing this prediction for ventilation fan control. To achieve this, a theoretical examination of existing VAV system operation and building pressure differentials was conducted, and a method for predicting infiltration rate based on VAV system airflow was developed and validated. Furthermore, a pressure control algorithm utilizing the predicted infiltration rate was derived and evaluated.
3. Return Fan Control Method Using Infiltration Rate Prediction
We propose a return fan control scheme considering infiltration rate by utilizing pressure and infiltration prediction methods based on supply and return airflow rates in VAV systems. FT control, VT control, and the proposed operational scheme—all return fan control methods for VAV systems—are compared and analyzed through simulation. The target building’s facility systems and detailed data were modeled using TRNSYS 18 and TRNFLOW. This enables the derivation of simulation results and evaluation of the proposed algorithm.
3.1. Proposal of a Return Fan Control Algorithm Using Infiltration Prediction
This algorithm describes the process of generating a return fan control signal based on the relationships between supply airflow rate, return airflow rate, and infiltration rate. At the beginning of the algorithm, initial values such as supply airflow rate (Q_supply), return airflow rate (Q_return), leakage coefficient (), and leakage exponent () are provided as inputs. These values define the initial conditions of the system and provide the basic variables required for calculating supply and return airflow rates and leakage. Next, based on the difference between the supply airflow rate and the return airflow rate, the pressure difference between the indoor and outdoor airflow is predicted, providing the basic data needed to calculate the infiltration rate. The infiltration rate is calculated using the indoor/outdoor pressure difference. In this step, the infiltration is quantified using the leakage coefficient and leakage index. Based on the infiltration rate, the return airflow rate adjustment value (RA_control) is calculated. In this step, the adjusted return airflow rate is calculated by subtracting the infiltration rate from the supply airflow rate. This represents the new return airflow rate value that will be reflected in the return fan control. Next, it is checked whether the adjusted return airflow rate (RA_control) is greater than zero. In this step, the return airflow rate (Q_return) is adjusted according to the following conditions. If the adjusted return airflow rate (RA_control) is positive, Q_return is set to the RA_control value. Otherwise, the return airflow rate (Q_return) remains equal to the supply airflow rate (Q_supply). Finally, the adjusted return airflow rate (Q_return_new) is generated as output. This value is transmitted as a return fan control signal and applied to maintain indoor air pressure and air quality.
3.2. Evaluation of Return Fan Control Algorithm Using Infiltration Rate Prediction
3.2.1. Target Space and System Modeling
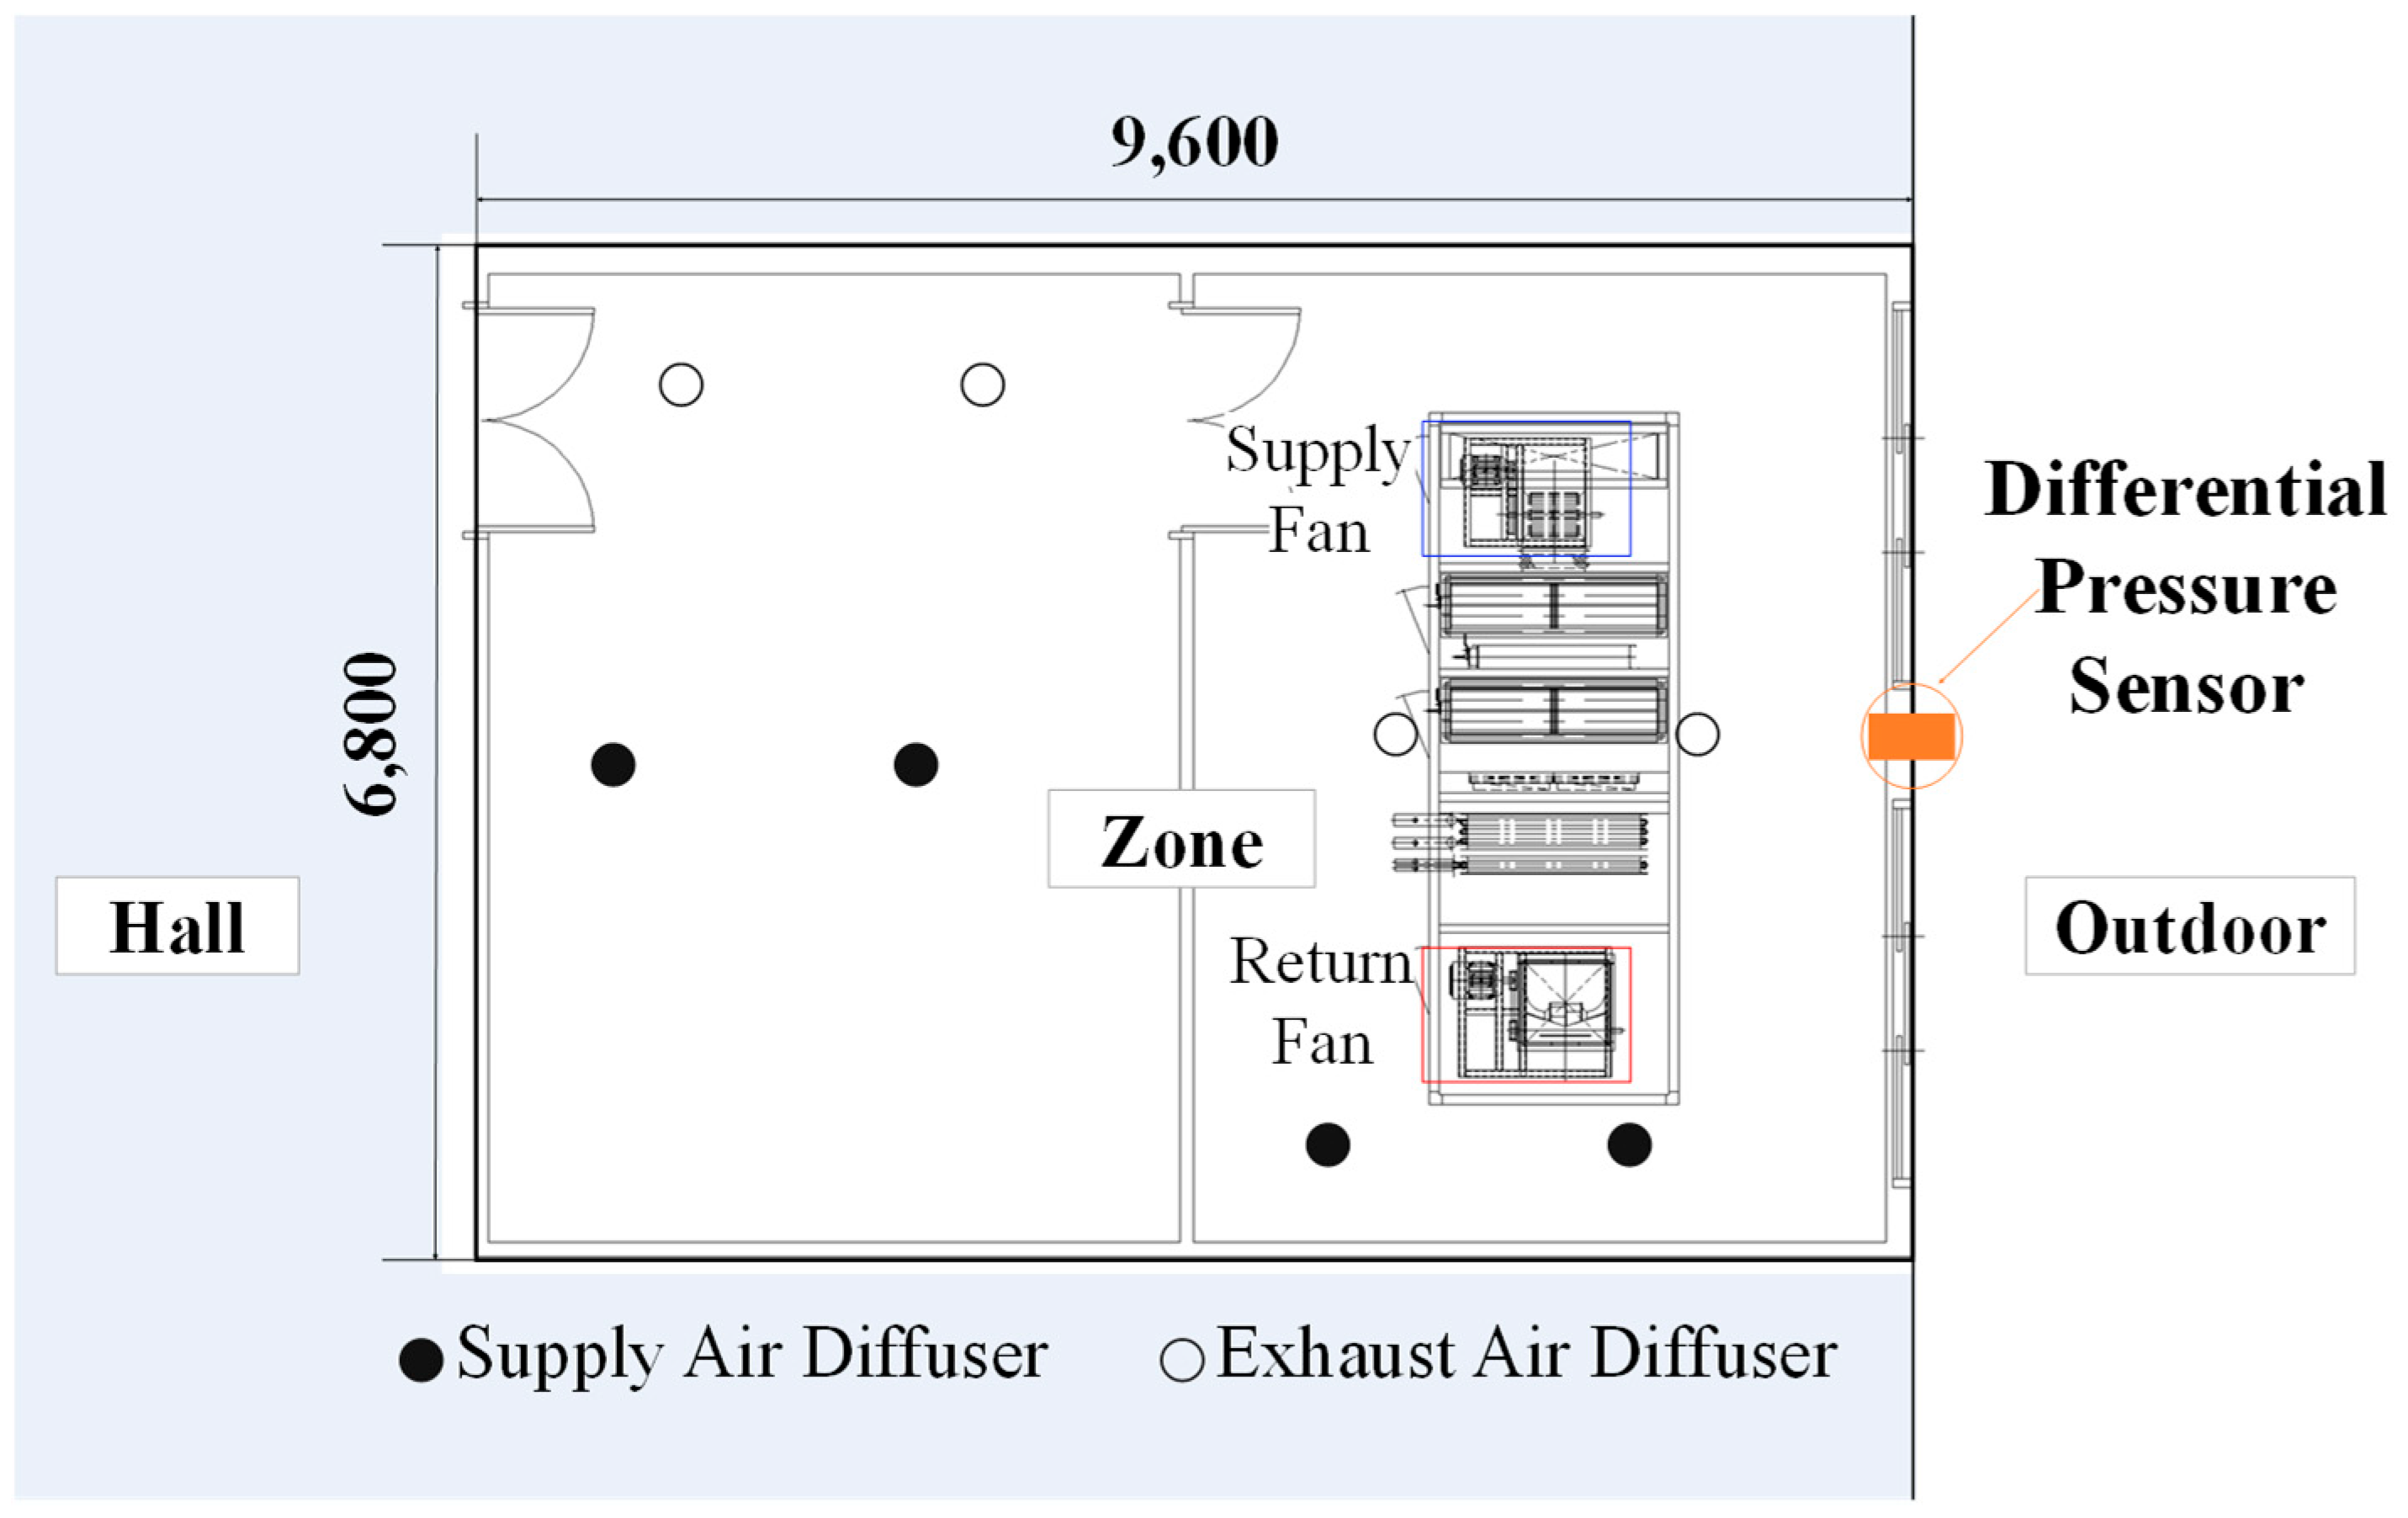
In this study, TRNSYS 18, a dynamic simulation program, was employed to analyze the energy consumption associated with the return fan control method of VAV system. To implement the VAV system in the target building described in [
Figure 2], Type 23 (PID controller) was used to model the VAV terminal unit and the supply fan to automatically control them based on indoor temperature. TRNFLOW was also used to analyze airflow. [
Figure 6] illustrates the simulation configuration and flowchart.
3.2.2. Simulation Conditions
To estimate the airflow of VAV according to changes in indoor heat generation, the maximum occupancy of the target space was calculated. [
Table 5] shows the conditions for calculating the occupancy of the target space. The maximum occupancy was calculated by applying the occupant density standard to the floor area. The indoor human heat generation was calculated based on the Korean Building Mechanical System Design Standard [
19]. To compare the airflow and infiltration rate according to changes in heat generation, the occupancy rate was compared at 75% (Case A), 50% (Case B), and 25% (Case C) compared to the maximum occupancy, and three simulation occupancy cases were set. The occupancy was assumed to be in the room from 9:00 to 18:00 throughout the day.
The simulation was conducted from August 3 to 6, and during the simulation period, the outside temperature ranged from 23 °C to 32 °C. Since the outside wind can affect the indoor and outdoor pressure difference, the wind speed during occupancy hours (9:00 to 18:00) was set to not exceed 5 m/s.
3.3. Evaluation Results of Pressure Control Algorithm Using Infiltration Rate Prediction
3.3.1. Fan Tracking Control
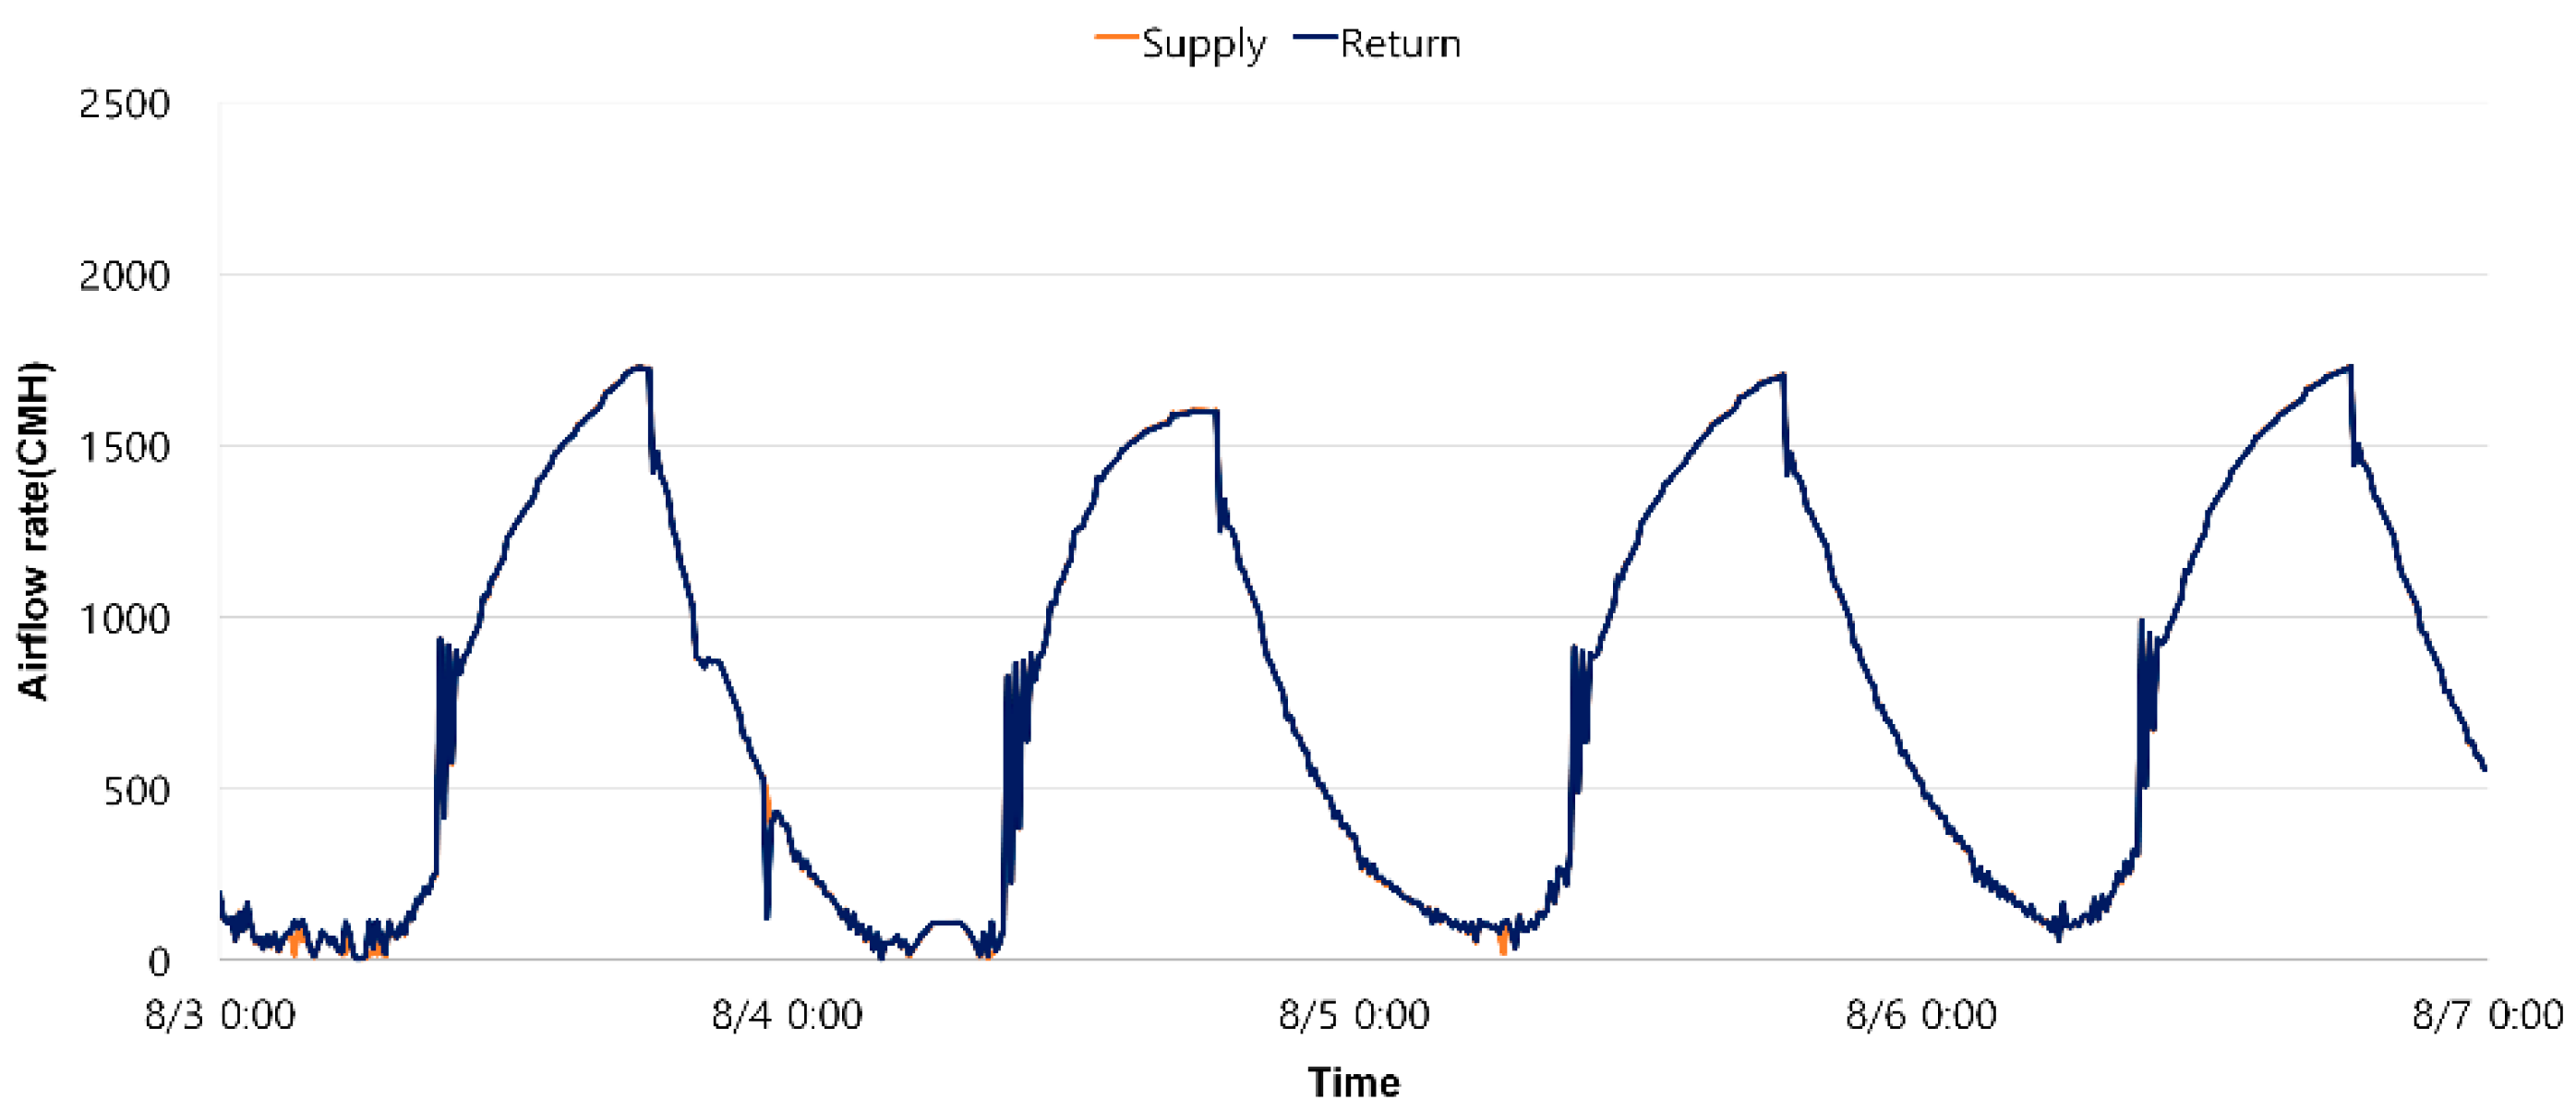
In FT control, the indoor temperature in Cases A, B, and C was maintained within the set temperature of 24 ± 1 °C, satisfying the indoor thermal environment. [
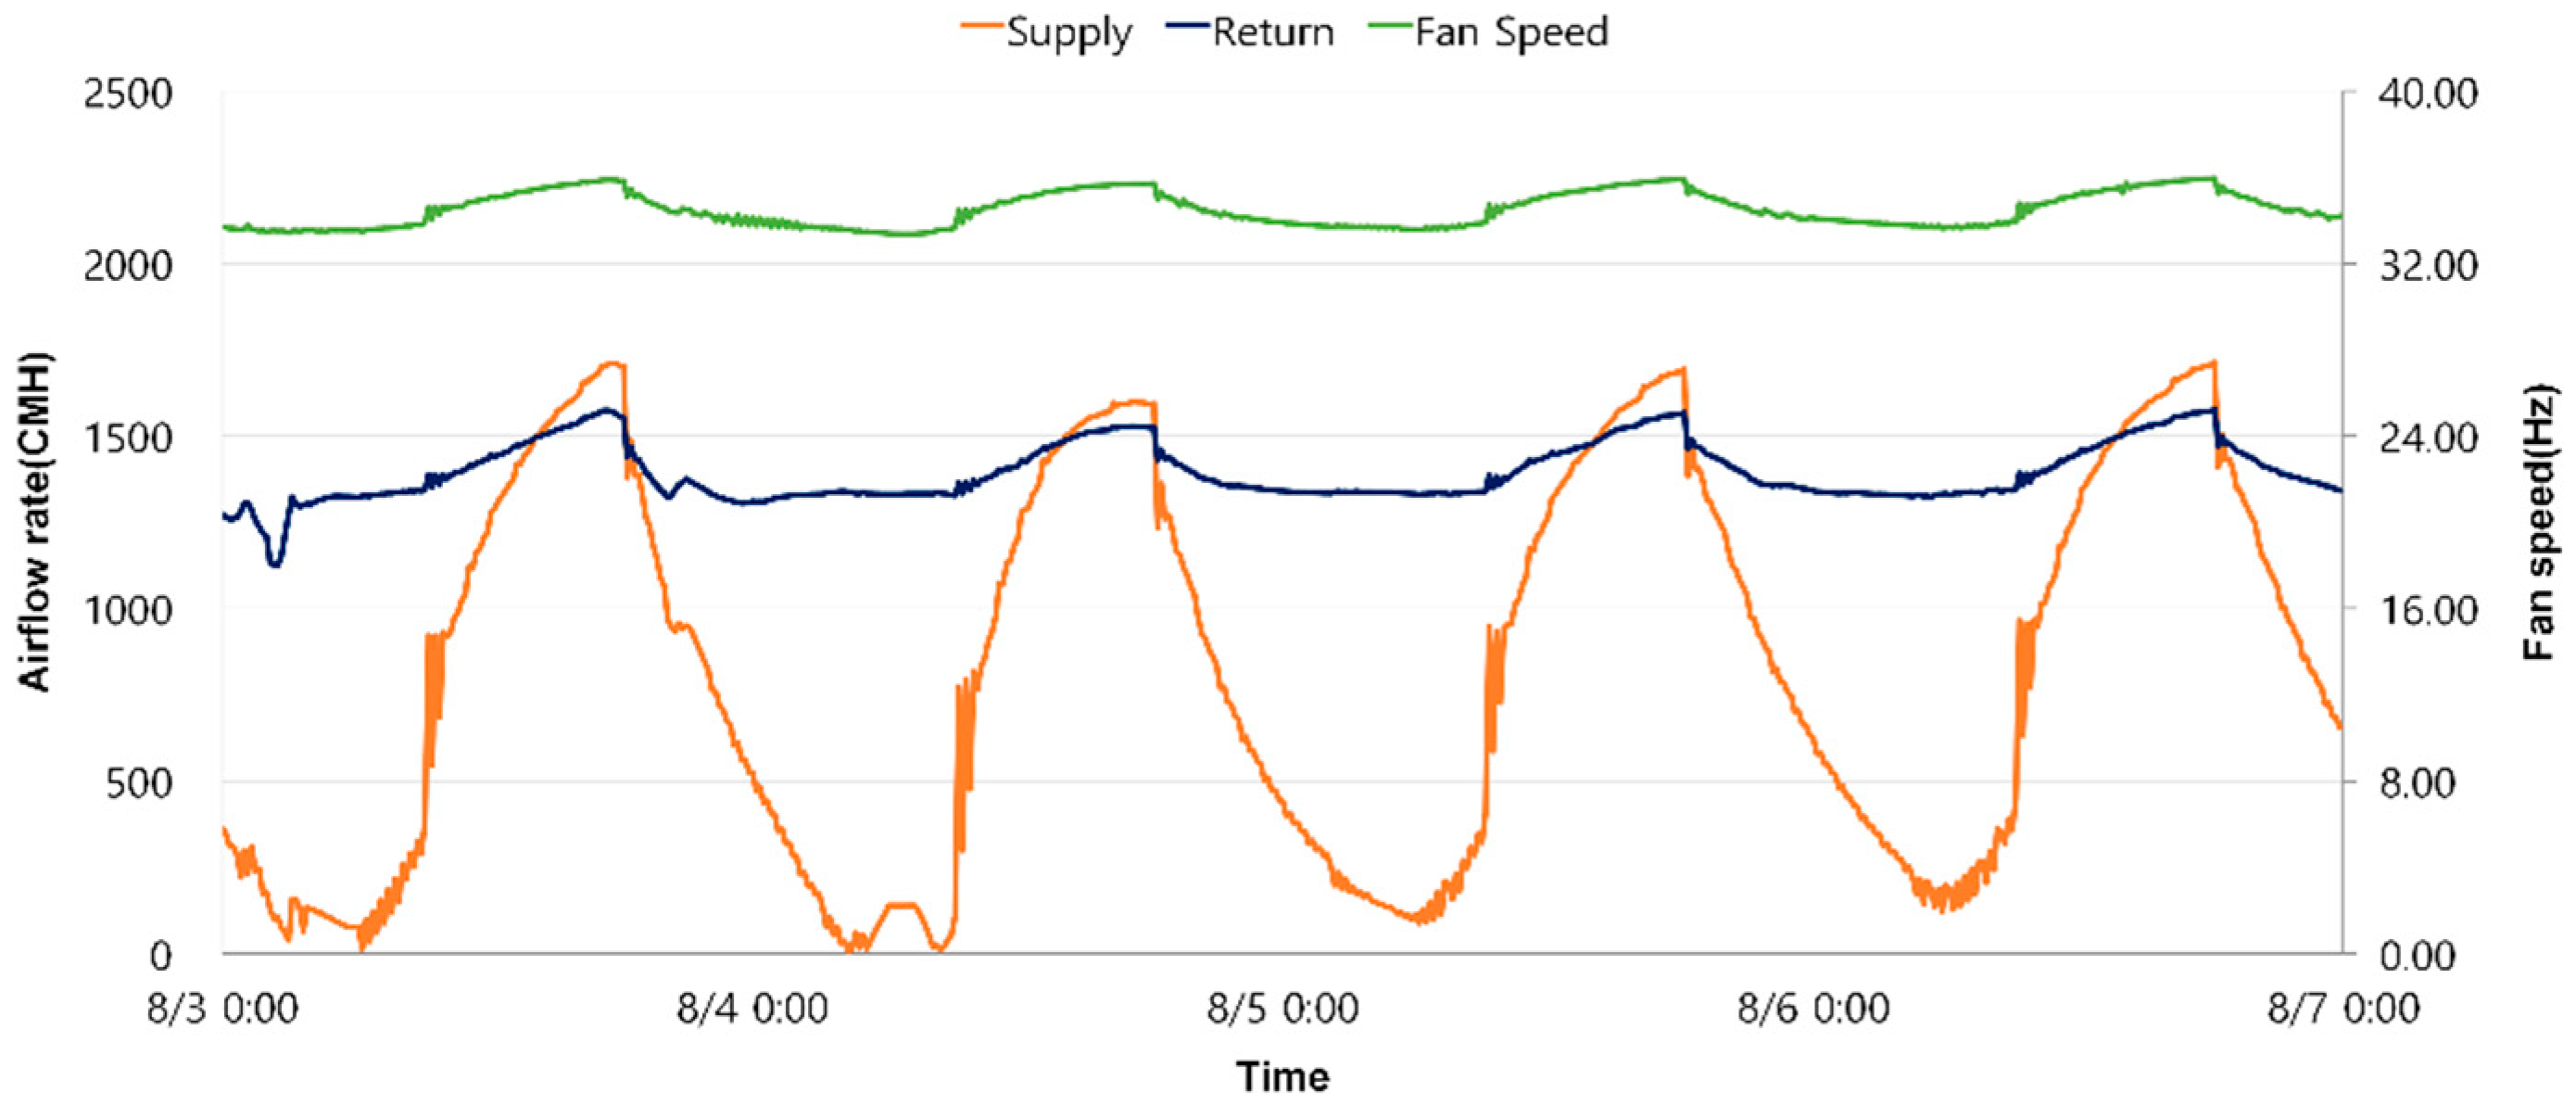
Figure 6] shows the changes in the supply airflow rate, return airflow rate, and fan frequency over time for Case A when operating with the fan tracking control method in the VAV system. In Case A of [
Figure 7], the number of occupants was 30, the highest occupancy level, and the supply airflow rate and return airflow rate at this time were almost the same, averaging 1418 CMH and 1417 CMH, respectively.
In Case B, where the number of occupants decreased to 20, the supply airflow rate decreased by about 13.8% to 1172 CMH, but the return airflow rate showed a tendency to slightly increase to 1370 CMH. In Case C, where the number of occupants decreased further to 10, the supply airflow rate decreased again to 993 CMH, but the return airflow rate decreased only by about 7%, showing a tendency for the difference with the supply airflow rate to gradually widen. In addition, an examination of the change in infiltration rate clearly showed a tendency to be inversely proportional to the number of occupants. The average infiltration rate in Case A was the lowest at 947 CMH, while it was the highest in Case C at 1167 CMH. This is because the smaller the number of occupants, the larger the indoor/outdoor pressure difference, resulting in more infiltration rate. In all cases, the infiltration rate decreased during the day according to the daily cycle and tended to increase at night when the outside temperature is low and the heating load is small.
3.3.2. Volumetric Tracking Control
In the VT control, the indoor temperature in Cases A, B, and C was maintained within the set temperature range 24 ± 1 °C, satisfying the indoor thermal environment. [
Figure 8] shows the changes in the supply airflow rate and return airflow rate over time for Case A when operating with the VT control method in the VAV system. As shown in [
Figure 8], when the number of occupants was 30, the supply airflow rate and return airflow rate were operated at the same rate of 1292 CMH each.
When the occupancy decreased to 20, the supply and return airflow rates decreased by approximately 17.4% to 1068 CMH each. When the occupancy decreased to 10, the airflow decreased further by approximately 22.2% to 831 CMH. When VT control was used, the infiltration rate remained nearly constant regardless of the occupancy. Comparing infiltration rate with outdoor temperature also showed similar results, except during periods of high winds.
3.3.3. Proposed Pressure Control Algorithm
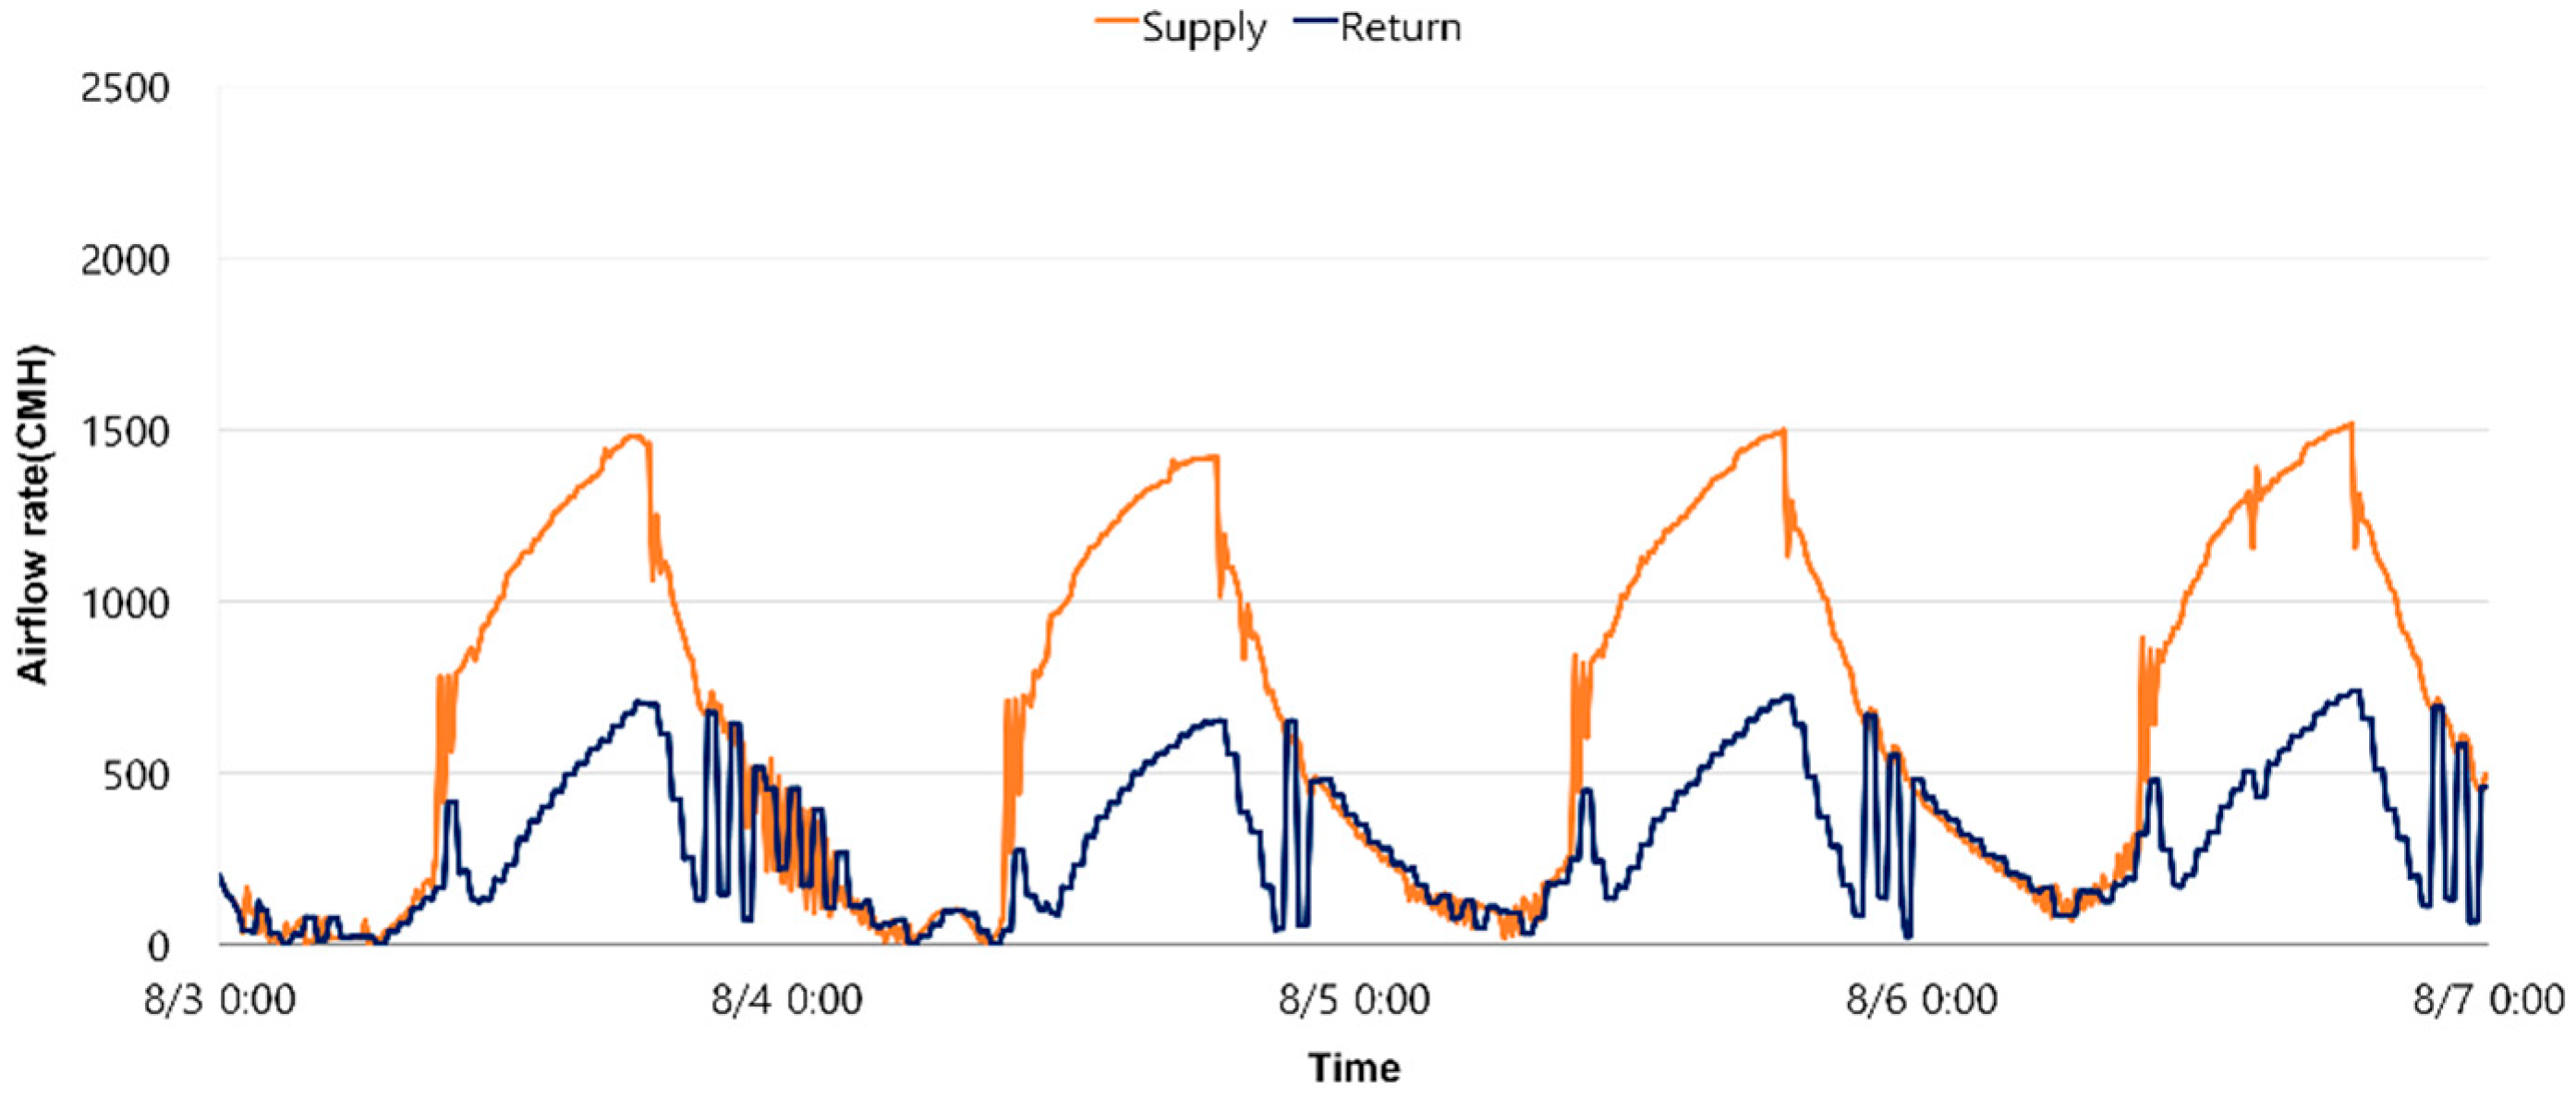
During the simulation period when the pressure control method considering infiltration rate was applied, the indoor temperature was stably maintained within the set temperature range 24 ± 1 °C, satisfying the indoor thermal environment. The Control_RA method dynamically adjusts the supply and return airflow rates considering the indoor and outdoor air infiltration rate, and shows the supply and return airflow rates when operating in this way. In [
Figure 9], in a high occupancy state such as Case A, the supply and return airflow rates were 1197 CMH and 467 CMH on average, respectively. In Case C, when the occupancy rate decreased, they decreased to 694 CMH and 184 CMH on average, respectively. This indicates that the pressure control method considering infiltration rate efficiently adjusts the supply and ventilation demand while maintaining the indoor and outdoor pressure difference. The difference between the supply and return airflow rates was adjusted according to the change in the occupancy rate as a result of reflecting the infiltration rate. When the occupancy rate was high, the difference between the supply airflow rate and the return airflow rate was 730 CMH, and when the occupancy rate decreased to 50%, the difference decreased to 510 CMH. This contributes to suppressing infiltration rate by maintaining the indoor space in a positive pressure state.
When the proposed pressure control was used, the change in infiltration rate according to the occupancy was almost constant even when the occupancy changed. When comparing the infiltration rate according to the outside temperature, a daily cycle was observed in which the infiltration rate decreased during the day and increased at night when the outside temperature was low and the heating load was small. In addition, when compared to the building envelope infiltration rate when the HVAC system was not operating, the infiltration rate was approximately 500 CMH lower on average when indoor occupants were present. This is believed to be because when the pressure control proposed in the VAV system was used, the return airflow rate was lower than the supply airflow rate, creating a positive pressure inside the room compared to the outside, which reduced the infiltration rate. In other words, it was confirmed that the infiltration rate decreased because the indoor–outdoor pressure difference decreased due to the operation of the HVAC system.
3.4. Analysis of Infiltration Rates According to Pressure Control
The characteristics of supply and return airflow rates by control method according to changes in the number of occupants were compared. In the case of the fan tracking control method, the supply airflow rate decreased in proportion to the indoor load as the number of occupants decreased from 30 to 20 and then to 10. However, the decrease in the return airflow rate was smaller than that of the supply airflow rate, and as a result, the difference between the supply and return airflow rates increased to 49 CMH, 198 CMH, and 441 CMH, respectively. On the other hand, the volumetric tracking control method is designed to always keep the supply and return airflow rates the same, so there was no difference between the supply and return airflow rates even when the number of occupants changed. Meanwhile, the proposed pressure control (Control_RA) method is designed to maintain positive indoor pressure by operating the return airflow rate lower than the supply airflow rate. When the number of occupants was 30, 20, and 10, the return airflow rate was operated lower than the supply airflow rate by approximately 721 CMH, 655 CMH, and 469 CMH, respectively.
[
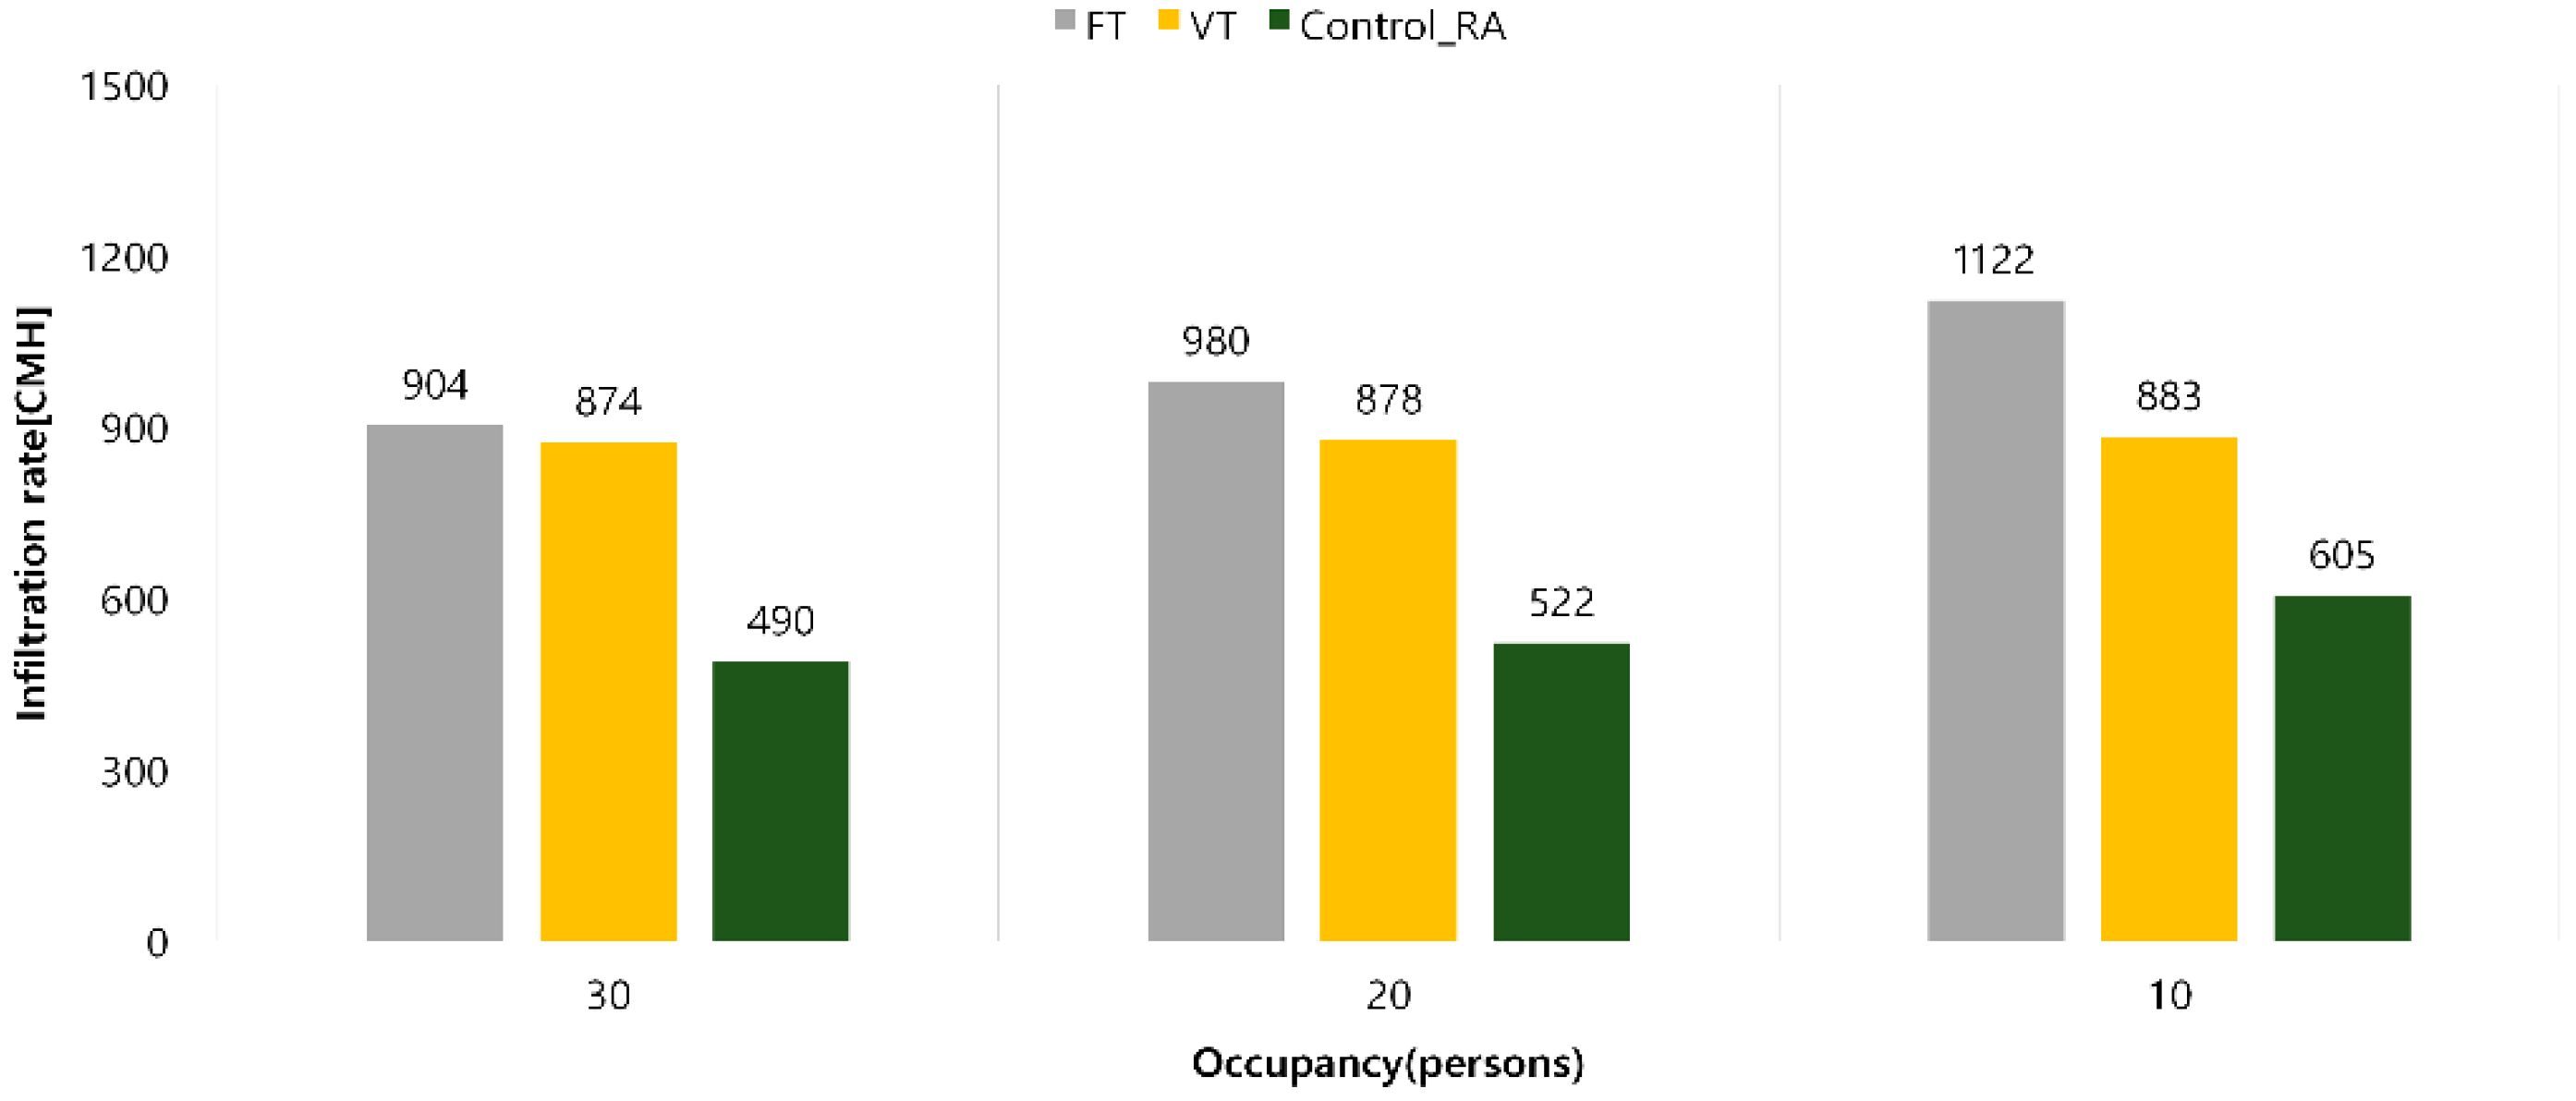
Figure 10] compares the average infiltration rate during the simulation period (9:00 to 18:00) according to the pressure control of the VAV system. In the case of fan tracking control, the infiltration rate increased from 904 CMH to 1122 CMH when the indoor occupancy decreased from 30 to 10.
When the proposed pressure control method was applied, when the number of occupants was 30, the Control_RA method showed an infiltration rate reduction effect of approximately 45.8% compared to the FT method and approximately 43.9% compared to the VT method. When the number of occupants was 20, the Control_RA method showed an infiltration rate reduction effect of approximately 46.7% compared to the FT method and approximately 40.5% compared to the VT method. When the number of occupants was 10, the Control_RA method showed an infiltration rate reduction effect of approximately 46.1% compared to the FT method and approximately 31.5% compared to the VT method. Therefore, it was confirmed that the infiltration rate reduction effect was more than 30% in all cases.
3.5. Energy Consumption Analysis
To estimate the total fan energy consumption in August according to fan control methods in VAV systems, the bin method was utilized. The bin method divides continuous data into ranges and analyzes the frequency of data occurrence within each range [
20]. [
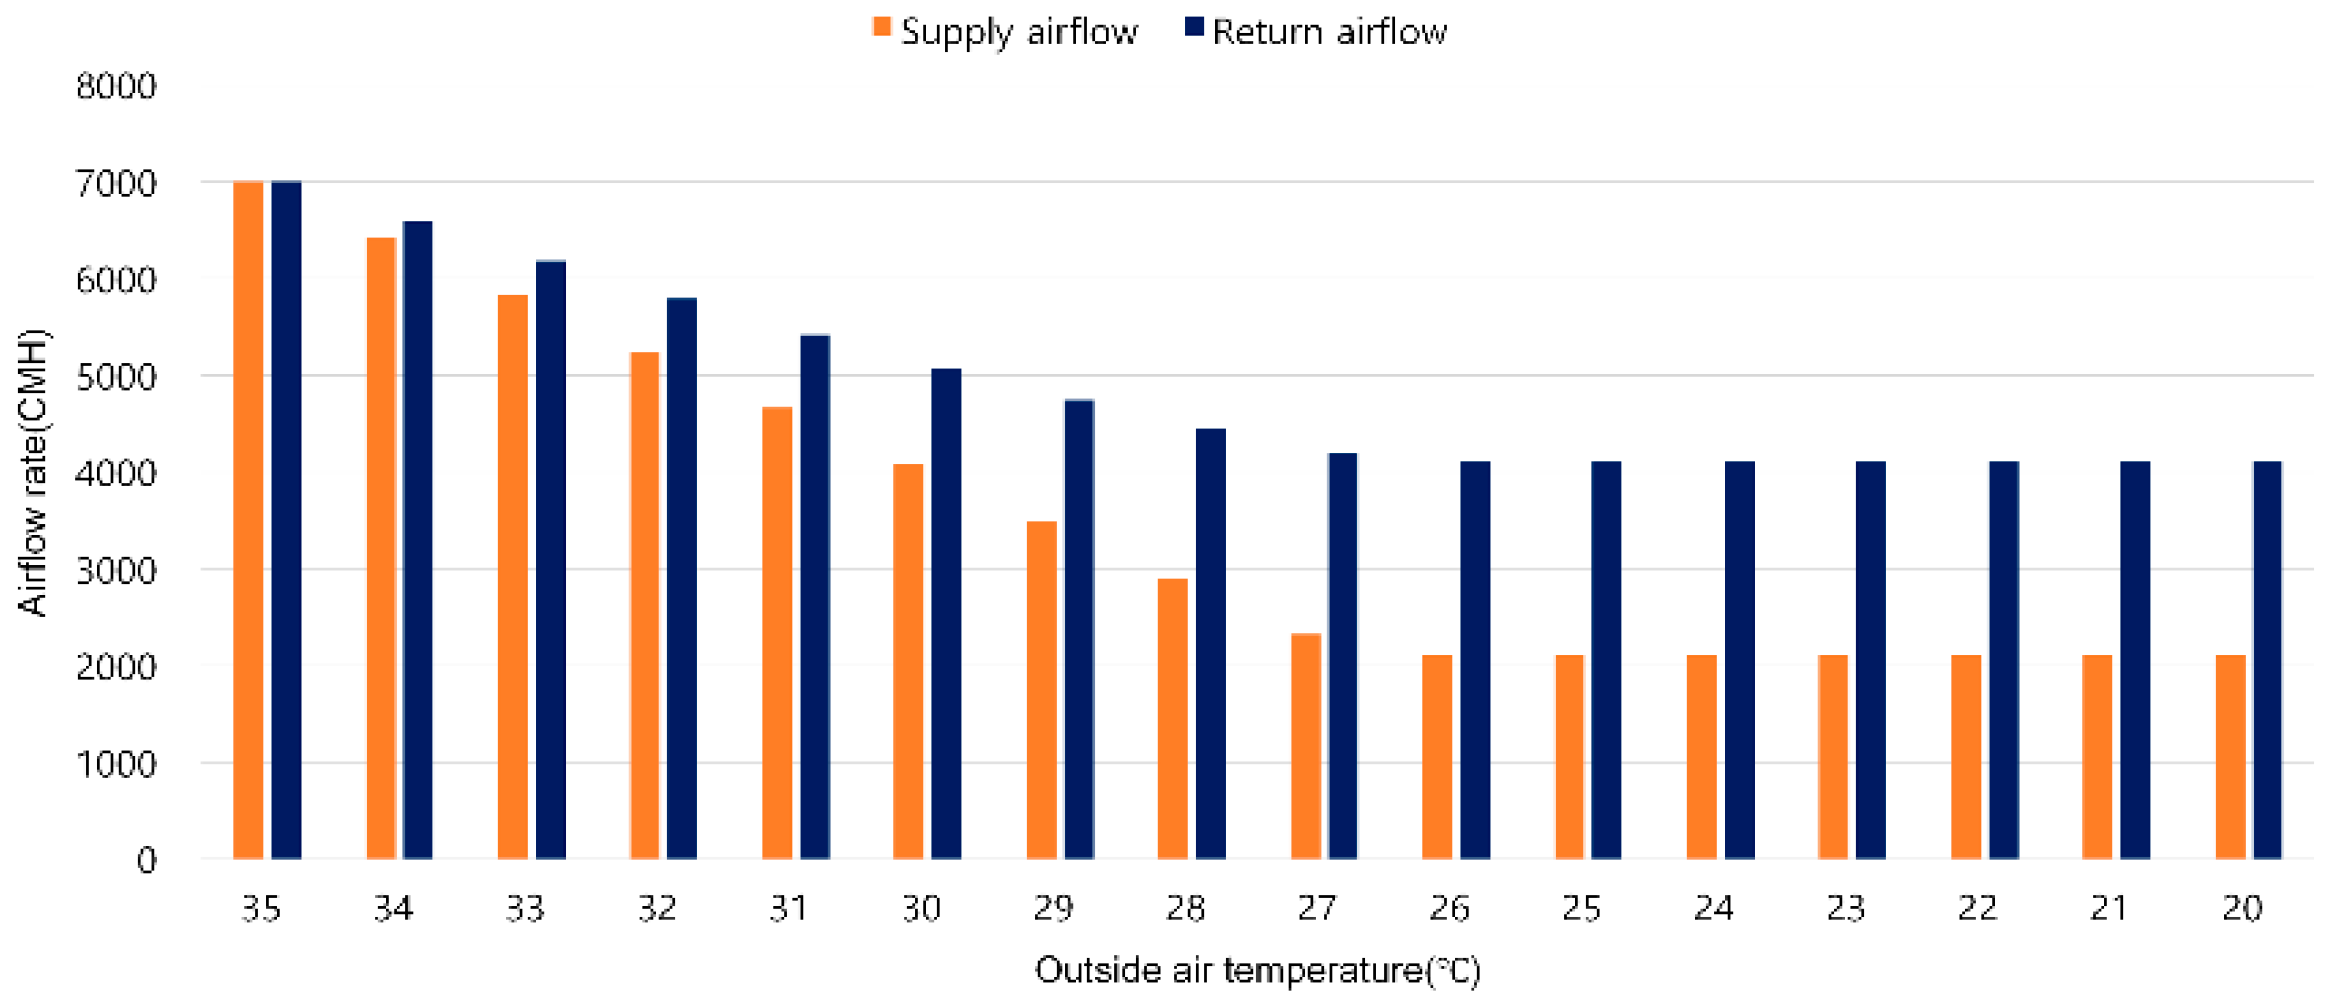
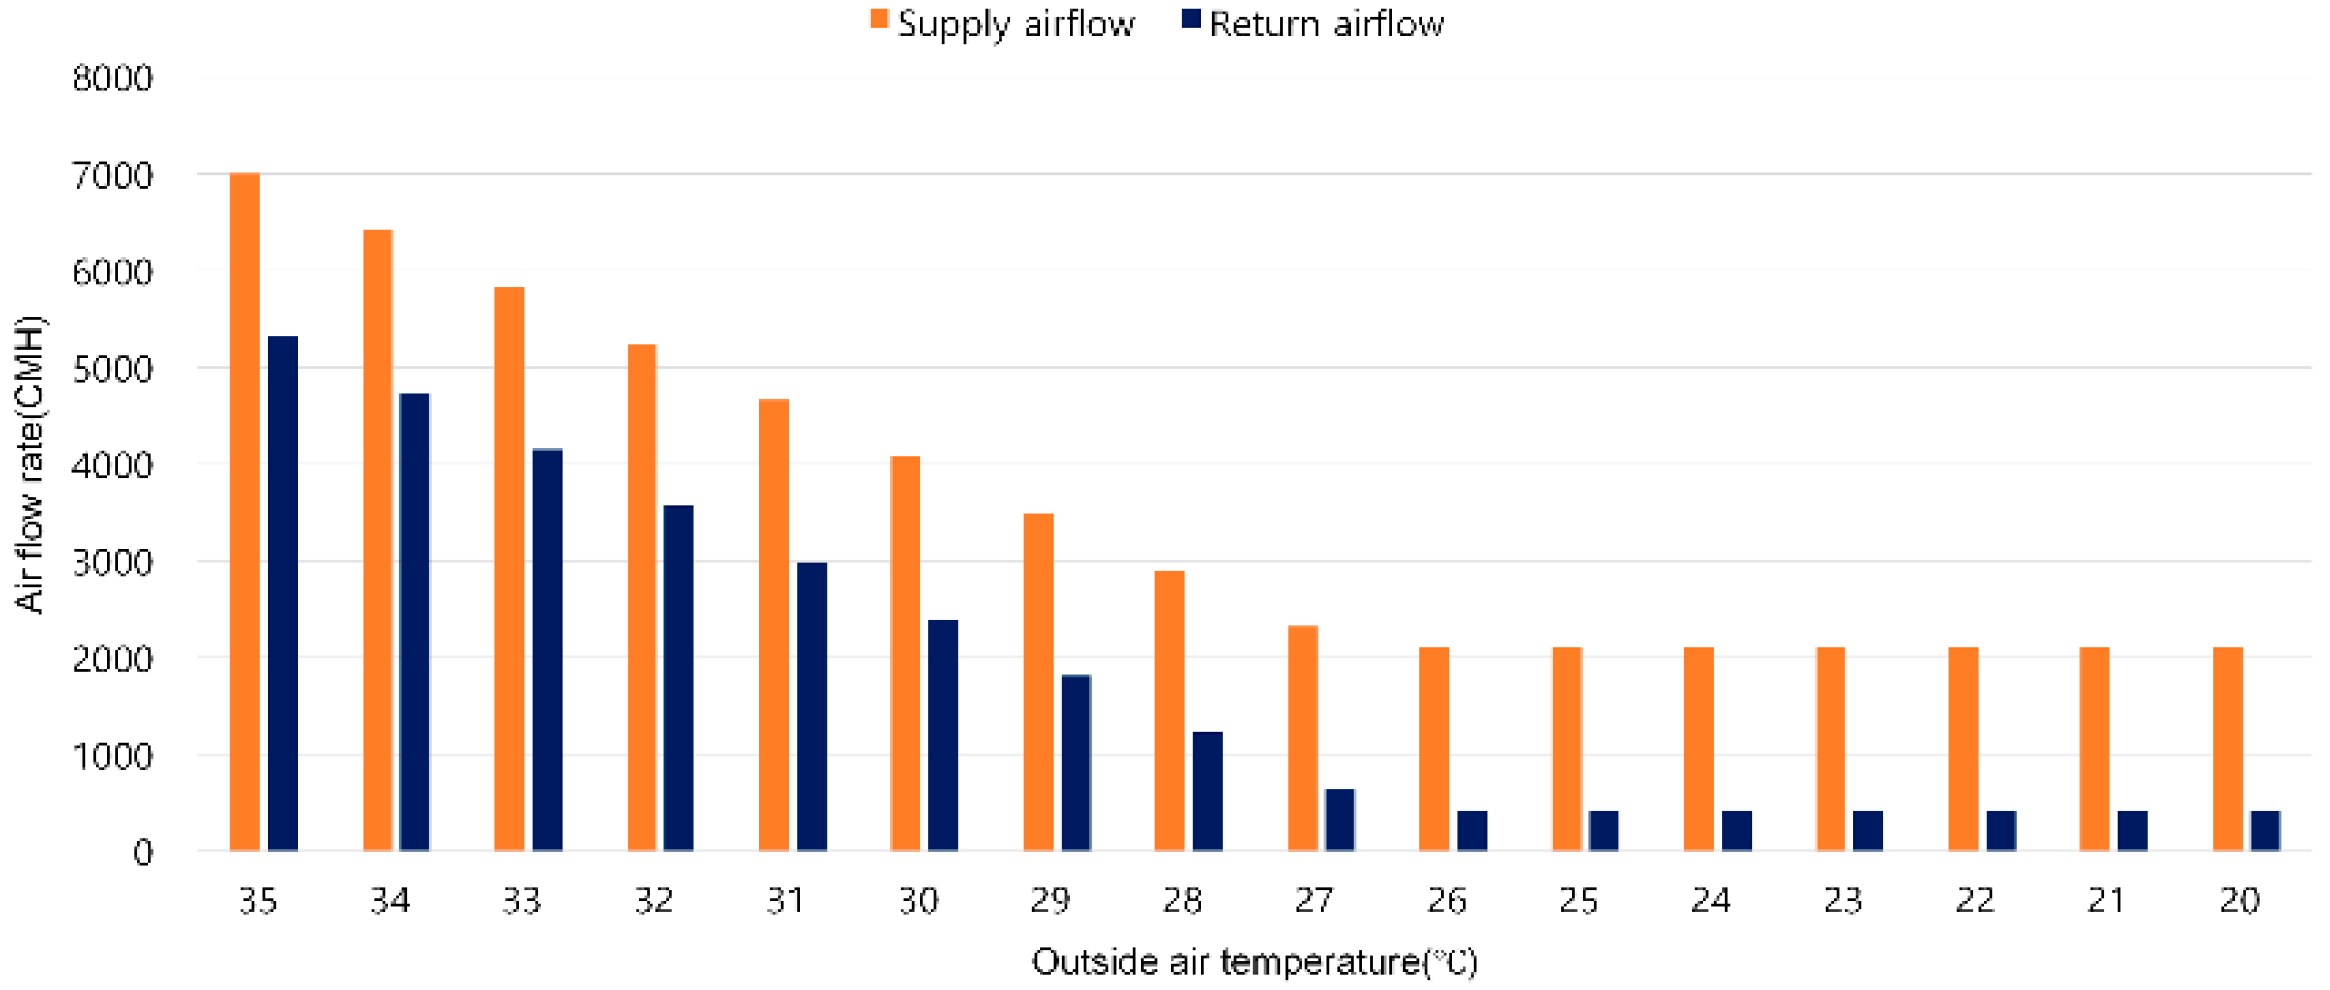
Figure 11] shows the changes in supply airflow rate and return airflow rate according to outdoor temperature changes under fan tracking control. The occupancy load is 40, the maximum occupancy. In the high outdoor temperature range (35 °C to 27 °C), the supply airflow rate remains relatively high, and the return airflow rate also shows a similar trend. This is interpreted as a result of the high cooling load, which increases the supply airflow and correspondingly increases the return airflow rate. As the outdoor temperature decreases from 26 °C to 20 °C, the indoor–outdoor temperature difference narrows, reducing heating and cooling loads. Consequently, the supply airflow rate decreased, while the return airflow rate tends to remain constant. The difference between the supply airflow rate and the return airflow rate was greatest when the indoor load was low and the supply airflow rate was operated at the minimum airflow rate, generating an infiltration rate load of approximately 2000 CMH. The infiltration rate load caused by the increase in the return airflow rate compared to the supply airflow rate leads to an increase in the cooling load. When calculated with blank data, this increases by approximately 44% compared to the existing indoor load.
In volumetric tracking control, both the supply airflow rate and the return airflow rate remain constant depending on the outdoor temperature. Therefore, it is believed that no pressure difference occurs due to the operation of the HVAC system.
[
Figure 12] shows the supply airflow rate and return airflow rate under the proposed pressure control. The proposed pressure control method assumes a slightly positive indoor/outdoor pressure difference of 5 Pa due to the supply and return airflow rates. The calculated difference between the supply and return airflow rates is approximately 1600 CMH. The return airflow rate is 1600 CMH less than the supply airflow rate across the entire outdoor temperature range.
[
Figure 13] shows the results of comparing the supply fan energy consumption by pressure control method (FT, VT, Control_RA) according to the occupancy level. When the energy consumption was analyzed by dividing the occupancy level into 40, 30, 20, 10, and 0 people, the FT method showed the highest energy consumption and the Control_RA method recorded the lowest consumption. Specifically, when the cooling load was high with 40 people in the room, the supply fan energy consumption of the FT method was 1204 kWh, that of the VT method was 1130 kWh, and that of the Control_RA method was 1073 kWh. When the room was not occupied, the FT method was 1092 kWh, the VT method was 1016 kWh, and the Control_RA method was 960 kWh.
[
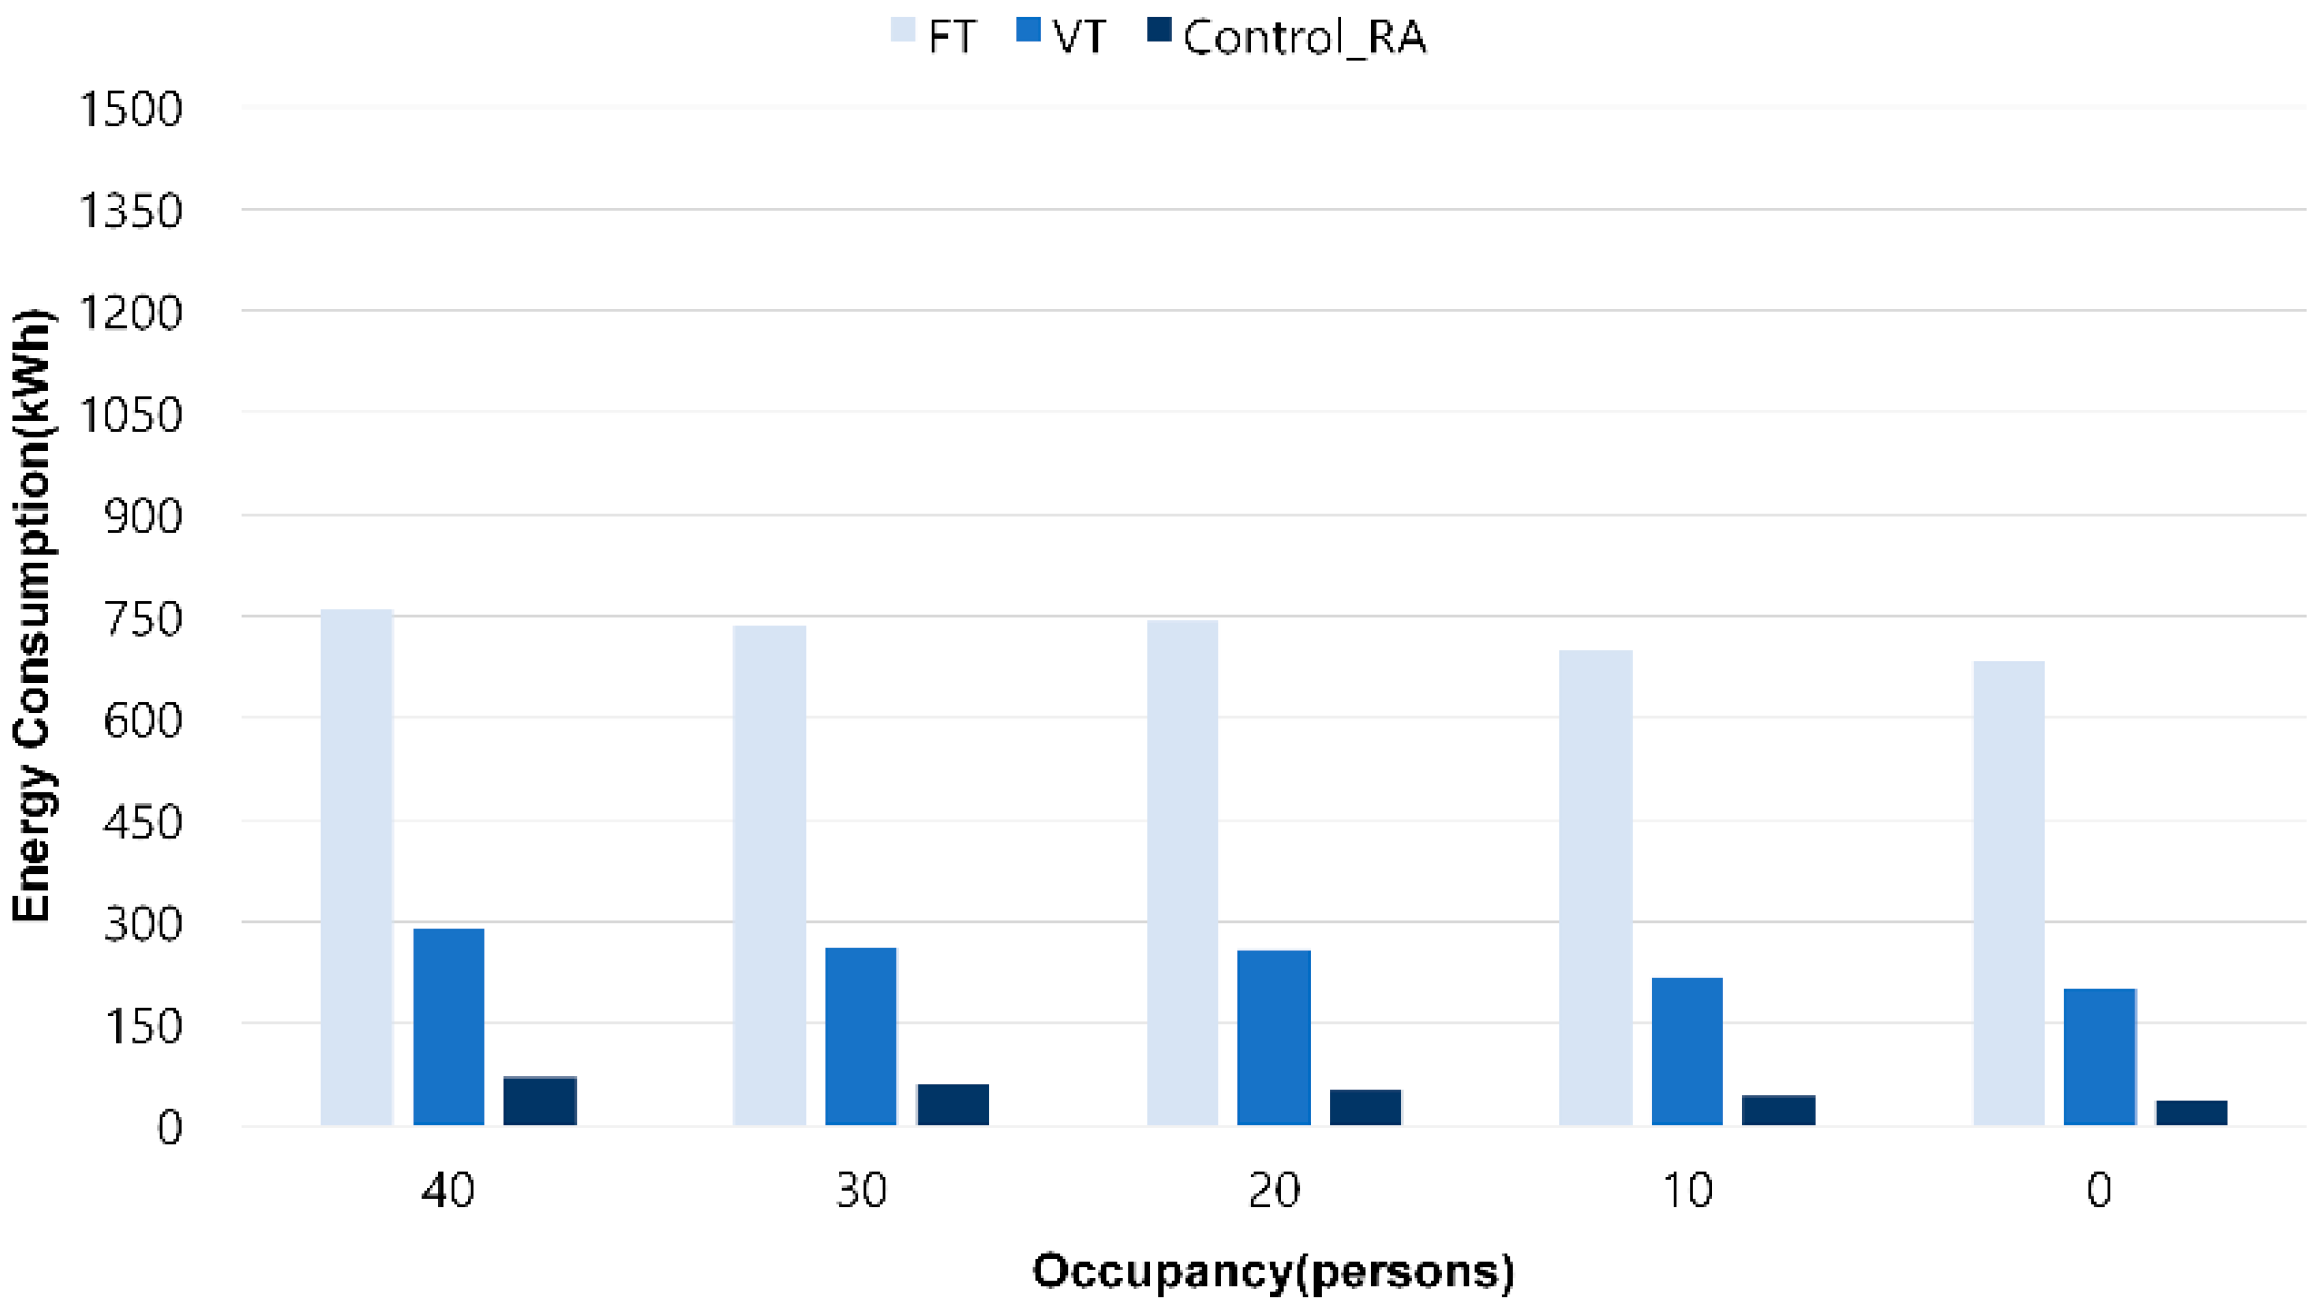
Figure 14] compares the ventilation fan energy consumption by pressure control method (FT, VT, Control_RA) according to the occupancy level. The analysis of energy consumption showed that the FT method had the highest energy consumption, and the Control_RA method had the lowest consumption. Specifically, when the occupancy level was 40, the return fan energy consumption for the FT method was 760 kWh, for the VT method was 289 kWh, and for the Control_RA method was 71 kWh. When the occupancy level was not occupied, the FT method consumed 684 kWh, the VT method 201 kWh, and the Control_RA method 36 kWh.
The energy savings from the supply and return fans increased with fewer occupants. The Control_RA method intentionally maintains the supply airflow rate higher than the return airflow rate, thereby creating a positive pressure state due to HVAC system operation, thereby reducing infiltration rate load and contributing to energy savings.
This study demonstrated that a pressure control strategy based on infiltration rate prediction effectively addresses the limitations of existing FT and VT methods, simultaneously reducing infiltration rate and improving energy efficiency. Future research should further validate the algorithm’s performance under various building conditions and environments and propose detailed design strategies to optimize it.
This study examined the relationship between supply and return airflow rates and infiltration rate in VAV systems, confirming that applying this relationship to pressure control can improve infiltration rate control and energy efficiency.
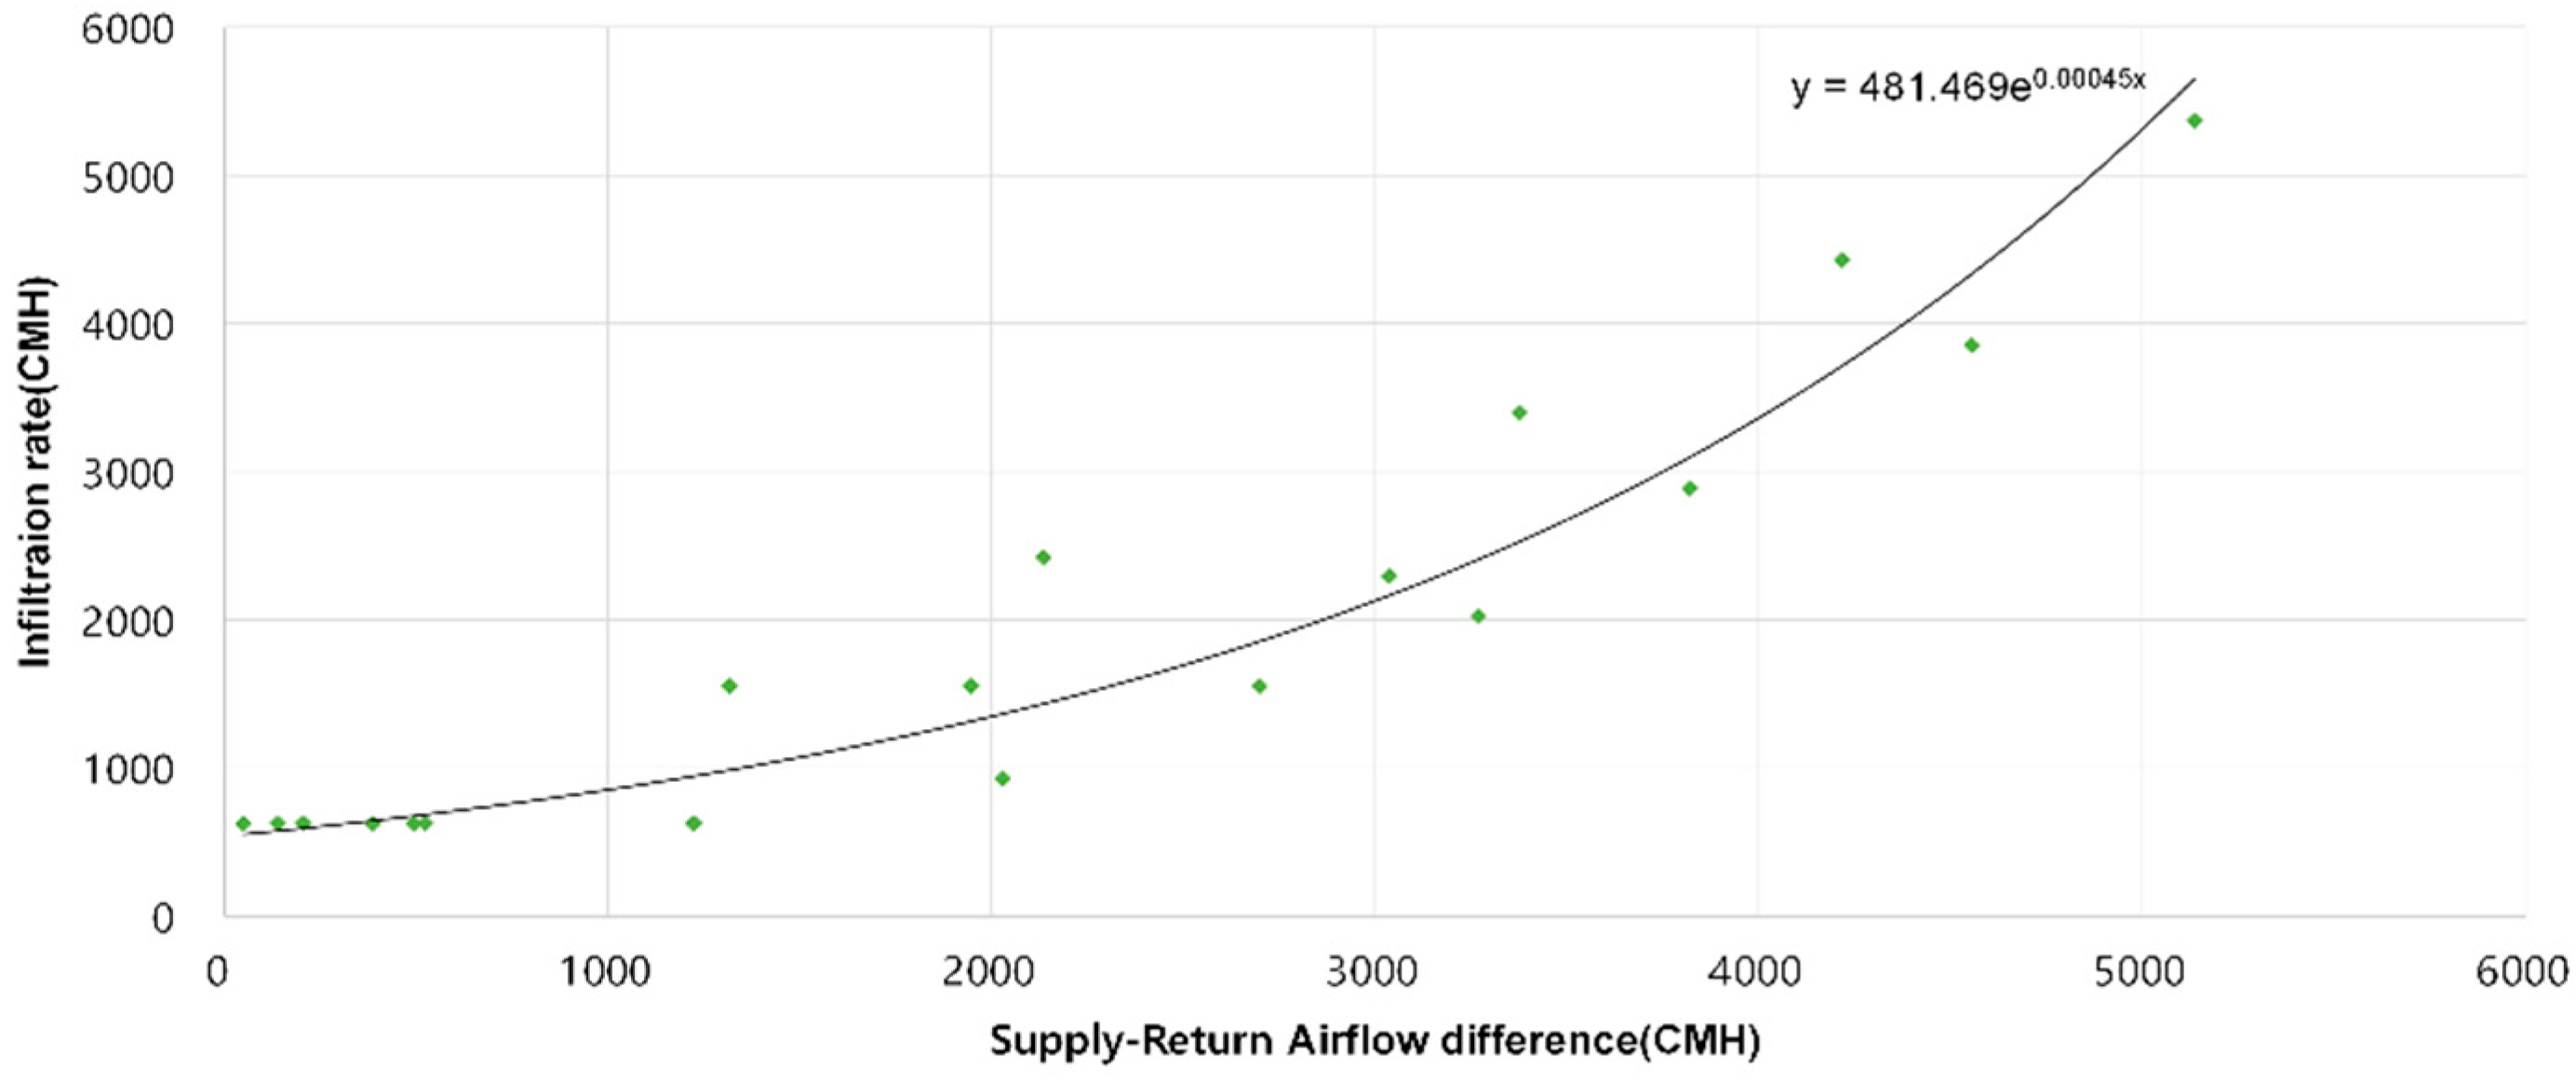
First, the difference between supply and return airflow rates and the indoor–outdoor pressure difference were experimentally derived as having an exponential relationship. This relationship was then applied to an airtightness-based leakage function to predict infiltration rate. This is significant as it overcomes the limitations of previous studies, which either relied on database-based airtightness values or focused solely on control performance.
Second, the proposed pressure control algorithm based on infiltration rate prediction significantly reduced infiltration rate compared to FT and VT methods under all conditions. It particularly improved the problem of increased infiltration rate due to negative pressure in the FT method, demonstrating an infiltration rate suppression effect of up to 46.1%. This demonstrates the effectiveness of the control strategy that maintains a positive indoor–outdoor pressure differential.
Third, from an energy consumption perspective, the reduced infiltration rate led to a decrease in cooling load. Significant savings were confirmed for both return and supply fans compared to existing control methods. Notably, return fan energy consumption was reduced by approximately 94.7% compared to the FT method, showing that infiltration rate prediction-based control is also advantageous in terms of energy efficiency.
However, this study only considered pressure changes caused by HVAC system operation and did not account for pressure variations due to external factors such as outdoor wind speed or indoor–outdoor temperature differences. Furthermore, since it relied on simulations based on TRNSYS and TRNFLOW, future verification of its applicability in actual systems is necessary.

