Abstract
In a conventional elastic beam with steady boundary stiffness, vibrational energy tends to concentrate at specific modal frequencies, often resulting in significant resonance phenomena. To address this issue, a novel control strategy is proposed in this study, in which the stiffness of boundary springs is dynamically modulated to alter the resonance characteristics of the beam. The Newmark–Beta method is employed to compute the transient response of the beam with time-varying stiffness in the time domain. A series of numerical simulations is conducted to analyze the vibration behavior of the structure under single-model frequency, multimodal frequency, narrowband, and broadband random excitations. The results indicate that time-varying stiffness effectively redistributes energy from resonance frequencies to other frequency bands, thereby suppressing resonance peaks and reducing displacement amplitudes. Furthermore, parametric analysis reveals that increasing the range of stiffness variation enhances spectral dispersion and improves vibration attenuation performance, and increasing the average stiffness level helps improve energy dispersion; however, it may lead to a slight increase in vibration response at low frequencies.
1. Introduction
Beam structures are critical load-bearing components in engineering fields such as construction and railways [1], and their dynamic characteristics play a decisive role in determining the overall performance of the structure. However, low-order modal vibrations of beam structures induced by external excitations have become increasingly prominent in practical applications. These vibrations not only affect the normal functional performance of the structure but may also lead to the accumulation of fatigue damage, which can result in a shortened service life and even sudden structural failure, posing a significant safety risk.
To address the aforementioned issues, researchers have proposed various methods to suppress beam vibrations. These methods mainly include vibration absorption [2,3,4], active control [5,6], and damping treatment [7,8]. However, all of these methods have limitations. Although damping treatment performs effectively in the high-frequency range, its vibration suppression performance is limited in the low-frequency range. On the other hand, vibration absorption techniques require the addition of substantial concentrated mass in the low-frequency range, and the effective vibration absorption bandwidth is relatively narrow. Meanwhile, active control faces stability issues, with the minor disturbances potentially triggering control overflow, thereby amplifying vibration [9].
The above works on beam vibration suppression are limited in their ability to suppress multi-modal vibrations under unknown disturbances. If the modal frequencies of the structure vary with time, stable multi-modal vibrations cannot be sustained, thereby contributing to vibration suppression. This conclusion was also observed in studies on structures with time-varying boundary conditions. During the time-varying process, the vibration characteristics will correspondingly change [10,11,12].
In recent years, using a time-varying strategy to reduce the vibration has attracted some researchers’ attention. Wang [13] employed a time-domain piecewise analytical method to study the vibration response of a beam with time-varying simply supported boundary conditions and validated the vibration suppression effect of the time-varying boundary method. The effects of damping, time-varying range, and time-varying speed on vibration suppression characteristics were also analyzed, leading to the identification of an optimized region for the time-varying position. Furthermore, Wang [14,15] investigated the vibration energy dissipation characteristics of a time-varying stiffness isolation platform using both the time-domain segmentation method and the finite element method. Experimental validation demonstrated that the time-varying stiffness isolation platform effectively suppresses low-frequency resonance responses under multi-frequency excitation.
Although it has been found that the time-varying structural parameters help suppress resonance responses, there is very little research in this area currently, and many aspects require further research. The elastic support of a beam or plate structure is commonly used in engineering. By replacing the steady stiffness spring with a time-varying stiffness spring, a special vibration performance may be acquired, which could be helpful in vibration control. However, the related research on time-varying stiffness boundary in a beam has not been studied in the public literature, which needs further study.
To determine the vibration behavior of structures with time-varying dynamic parameters, more complex methods are usually used, unlike the structures with steady dynamic parameters. The dynamic modeling of structures has also been widely studied. Abramyan [16] combined the Galerkin method with the averaging method for equations in Banach spaces to study the dynamic behavior of a simply supported Euler–Bernoulli beam with time-varying surface mass. Even though the system being studied is linear, its dynamic properties display features that are comparable to those of nonlinear systems. The riser was modeled as a moving Euler–Bernoulli beam by He [17], and a boundary control scheme was put forward to reduce its vibrational response. Zhang [18] utilized a time-varying high-gain observer to devise a continuous disturbance-rejection feedback controller, which dealt with the stability issues of Timoshenko beam systems with a tip mass under unforeseen and non-uniform disturbances. Amin [19] utilized the harmonic balance approach and pseudo-arc length continuation method to find a solution for the forced vibration equation of a simply supported axially moving system integrated with a nonlinear energy sink and obtained the corresponding analytical result. Huang [20] formulated the nonlinear motion control equations of a translating beam based on Newton’s second law and employed the incremental harmonic balance method to compute the periodic response of its high-dimensional model.
In addition, the Newmark–Beta method was also widely applied in modeling the non-steady vibration system [21,22] because of its modeling convenience and high stability performance. By properly setting the control parameters of the Newmark-β method, more accurate and converging results can be determined, and the vibration responses of structures can be calculated more easily than when using other methods. When the control parameters of the Newmark-β method are set as and , the calculation algorithm is unconditionally stable [23]. Considering its great advantages, the Newmark-β method is used in this work to solve the calculation problem introduced by the time-varying spring stiffness.
The modal frequencies of an elastically supported beam depend on the structure’s dimensions, material properties, and boundary conditions. However, in engineering practice, it is challenging to vary a structure’s dimensions and material properties over time. However, implementing time-varying boundary conditions is relatively straightforward and physically achievable. By adjusting the boundary conditions, the vibration characteristics of the beam can be effectively controlled, thereby influencing the resonance frequencies and modes.
The time-varying supporting stiffness can be achieved by using an electromagnetic spring in reality. Based on the magnetic principle of repulsion between identical poles, an electromagnetic spring can be fabricated as a variable stiffness support element. Two magnetic sources can be coaxially placed according to the principle of repulsion between identical poles, which physically forms a compression spring. At this point, the spring force essentially manifests as the repulsive force between the two magnetic sources, and the strength of this repulsive force is closely related to the magnetic field intensity of the sources. Therefore, by altering the magnetic induction strength between the sources, the output stiffness of this compression spring can be controlled. Since electrical parameters are easier to regulate, facilitating the change in the variable stiffness element according to a specified stiffness pattern, a combination of coil winding and permanent magnet sources can be used for fabrication. Adjusting the current input to the powered coil can change the electromagnetic force and thereby regulate the stiffness. Hence, the variable stiffness can be controlled through upper computer software, current controllers, amplifiers, and the electromagnetic spring. The control algorithm is output from the upper computer software to the current controller, which delivers a variable current. This current is amplified by the amplifier and then outputs to the electromagnetic spring, generating a time-varying magnetic field signal based on electromagnetic induction principles, thus producing a variable stiffness output. Yu [24] designed and fabricated a typical electromagnetic spring, which not only offers a wide adjustment range but also operates efficiently under conditions of high responsiveness and low power consumption. By precisely positioning an annular permanent magnet within a coaxial cylindrical coil, the design cleverly utilizes the interaction force between the magnets and, combined with the adjustable magnetic field characteristics, enables flexible adjustment of the spring stiffness. To further enhance adjustment precision, the influence of a reset spring was considered, allowing the spring’s output stiffness to vary between 1.53 N/mm and 5.77 N/mm, demonstrating excellent tunability. Furthermore, the spring achieves a stiffness variation accuracy of up to 97.5% when the fluctuation frequency is below 1 Hz, which is particularly crucial for high-precision vibration control. In terms of control, the maximum current required to adjust the stiffness is only 6A, showcasing exceptional energy efficiency. This provides clear direction for the practical application of time-varying stiffness beams in engineering.
Although there has been some research on time-varying parameters in vibration suppression, existing studies primarily focus on parameter variations under steady boundary conditions, with insufficient consideration of the comprehensive impact of dynamic boundary condition changes on structural vibration characteristics. This study proposes a novel approach by adopting time-varying stiffness boundary conditions, dynamically adjusting the support stiffness of the beam structure to effectively control vibration responses. Compared with existing studies, the innovation of this research lies in the systematic exploration of the vibration response characteristics of time-varying stiffness beams for the first time, providing a theoretical foundation for future engineering implementations based on electromagnetic springs and other variable stiffness components.
As this research mainly focuses on the theoretical modeling and mechanism elucidation of a beam with elastic time-varying stiffness boundaries, the corresponding experiments will be our future research work. This paper is outlined as follows. By using the Newmark–Beta numerical integration method, a theoretical model is established in Section 2 to investigate its vibration suppression performance under different excitation forms. The model’s calculation accuracy is validated by the commercial software COMSOL Multiphysics (Version 6.2) in Section 3. After that, the vibration performances of a beam with elastic time-varying stiffness boundaries are thoroughly discussed in Section 4, together with the parametric analysis, including the effects of stiffness variation rate, variation range, and average stiffness level on the vibration response. Finally, some critical conclusions are drawn in Section 4.
2. Structure Model and Calculation Method
2.1. Theory Model
The spring stiffness of traditional elastic boundary beams is steady, meaning that the natural frequencies of the beam modes remain unchanged. As a result, vibration energy is concentrated at specific modal frequencies, which is considered a fundamental assumption for many vibration control methods, such as active control. In contrast, the boundary conditions are modified by the time-varying method through adjustments to the spring stiffness of the supports, thereby altering the beam’s resonance frequencies. This approach enables the simultaneous experience of both transient and steady-state vibrations by the beam, thereby disrupting the resonance response. Therefore, vibration energy, originally concentrated at the modal frequencies, is redistributed to other frequencies, effectively suppressing the resonance response of the beam.
Figure 1 shows a slender beam supported by two linear springs, where the stiffness of the springs varies with time. The springs are attached to both ends of the beam. In the model, the stiffness of the linear springs at time is denoted as , and the excitation at time is denoted as . The beam parameters include the length , flexural rigidity , cross-sectional area , mass density , and Poisson’s ratio .

Figure 1.
Beam with time-varying stiffness elastic boundaries.
The frequency-domain analytical method is quite challenging due to the boundary’s time-varying stiffness. Therefore, the finite element method (FEM) and Newmark-Beta method are employed to obtain the time-domain solution for the vibrational response of the elastic beam with time-varying stiffness. In the model, the beam is divided into elements, each of length . As Timoshenko theory is more accurate than Euler–Bernoulli theory in high frequency or thick beams, this research considers Timoshenko theory in the modeling process.
As shown in Figure 2, the transverse displacements at the two nodal ends of the Timoshenko beam element are denoted by and , and the rotations are represented by and .

Figure 2.
Schematics and notations of the element.
In the Timoshenko beam element, the transverse displacement and the rotation angle
are independent, and each can be interpolated separately and expressed as:
In Equations (1) and (2), and are linear shape functions, which can be written as:
where , , represents the coordinate of the left endpoint of the element in the global coordinate system, is the coordinate of the right endpoint, denotes the coordinate of an arbitrary point, and is the local coordinate that maps from the global coordinate system to the interval [−1, 1].
The bending strain energy of the beam element can be expressed as
where , and .
By substituting Equation (2) into Equation (4), the bending stiffness can be obtained as
The shear strain energy can be expressed as
where a correction factor is introduced to account for the non-uniform distribution of shear strain and shear stress. The term can be expressed as .
Therefore, the shear stiffness matrix of the beam can be given by
When the shear stiffness matrix of the Timoshenko beam is applied to slender beams, errors may be introduced due to the shear locking phenomenon [25,26]. In order to eliminate or reduce the error caused by shear locking, various calculation models have been proposed. The reduced integration method is widely used in modeling the Timoshenko beam element in finite element analysis [27,28,29]. In this method, the reduced integration is conducted to calculate the stiffness matrix associated with the shear strain, while the full integration is used to evaluate the other parts of the stiffness matrix. In addition, Reddy also proposed the interdependent interpolation element, which contains the Timoshenko and the Euler-Bernoulli beam finite elements as special cases [30]. This element exhibits locking-free characteristics and is appropriate for frame structural analysis. In recent years, several advanced beam elements have also been proposed, which provide locking-free solutions [31,32,33]. Mahmood et al. have provided an exact solution to solve the vibration problems of two-phase Timoshenko nanobeams and proposed a shear-locking-free beam element appropriate for both classic and two-phase local/nonlocal elasticity materials [31]. In the consideration of elastic-plastic analysis of beam-type structure, Iandiorio et al. proposed a new approach to improve the computational efficiency by using elastic-plastic State Diagrams and section-slices subdivision [32]. The force interpolation functions and a mixed flexibility-stiffness in their model also help to avoid shear locking and can give accurate results. In order to solve the shear locking problem met in the standard Peridynamics for slender beams, Bai et al. proposed an improved numerical integration approach and combined it with standard Peridynamics [33]. The combined model can effectively alleviate the shear locking effect and allow for accurate evaluation for a wide range of beam shapes from very thin to thick.
As the reduced integration method is simple and computationally efficient, it has been widely used both in academia and engineering. It is also adequate in accuracy for the class of structures and the scientific question we are addressing. Thus, for the beams considered in this research, the reduced integration method is used, and one-point Gauss integration is employed in the calculation process of the shear stiffness matrix. Equation (7) can then be rewritten as
where is the weight.
Consequently, the stiffness matrix of the Timoshenko beam element is given by
For the first and last elements where the element is supported by the time-varying spring, the stiffness matrix must be modified to account for the spring supports. The modified stiffness matrix can be expressed as
By assembling the element stiffness matrices, the global stiffness matrix of the beam structure is obtained as
The mass matrix of the Timoshenko beam can be obtained from the kinetic energy expression. The kinetic energy of the element can be expressed as
Therefore, the mass matrix of the Timoshenko beam element can be represented as
By assembling the element mass matrices, the global mass matrix of the beam structure can be given by
In the absence of damping, the fundamental equations for solving structural dynamic time-history problems using the Newmark-Beta method can be given as
where is the excitation matrix.
To obtain the modal frequencies of the beam structure at any given steady spring stiffness, Equation (15) needs to be reformulated as
The solution is assumed in the form of
By substituting Equation (17) into Equation (16), it can be obtained that
where is the eigenvalue, and is the modal vector.
The corresponding eigenvalue problem for Equation (18) is
The characteristic frequencies of the beam structure can be obtained by solving the eigenvalues of Equation (19).
To determine the dynamic response of the beam structure at discrete time intervals, the following assumptions are made regarding its vibrational behavior.
where the value of determines the accuracy of the acceleration approximation, while controls the velocity update.
By simplifying Equation (21), the following expression can be obtained as
By substituting Equation (22) into Equation (20), the result can be given as
By substituting Equations (21) and (23) into Equation (15), the fundamental equations in matrix form can be given as
After simplifying Equation (24), the following expression can be obtained as
By substituting Equations (11) and (14) into Equation (21) and solving Equation (16), the time-domain solution for the vibrational response of the beam structure under the specified initial conditions and external excitation can be iteratively obtained.
The above model does not contain damping. However, damping of metal material may affect its vibration response, especially the response at modal frequencies. To evaluate the damping characteristics of structures, a number of models have been developed. Among these, the frequently employed ones are the Kelvin-Voigt model [34,35], the Maxwell model [36], and the generalized Maxwell model [37]. An elastic spring and a viscous damper connected in parallel make up the Kelvin–Voigt model, which is appropriate for depicting the delayed strain when under steady stress. An elastic spring and a viscous damper connected in series are used to symbolize the Maxwell model, and this model can be employed to depict stress relaxation. The generalized Maxwell model, alternatively referred to as the Maxwell–Wiechert model, is composed of several Maxwell elements joined in parallel and can be utilized to evaluate most of the actual stress relaxation and frequency-related behavior. In addition, another important damping modeling method is the use of the complex modulus, i.e., , where is the damping loss factor, and is the storage modulus. As the loss factor can be easily tested by several damping test methods and its modeling method is simple, the loss factor has been widely used in engineering [38].
For modeling convenience purposes in this research, the damping is contained in the model using the complex method. By replacing the real modulus with the complex modulus in the global stiffness matrix (Equation (11)), the vibration of the beam with damping can be acquired.
2.2. Stability Analysis
A time-integration method is deemed stable if a positive time step exists, such that for any , a finite change in the state vector at time yields only a non-increasing change in at . Assume that the time-integration scheme is given by
where , is the update matrix, and represents the contribution of the external load to the variation in the system state within the time interval .
For Equation (16), by solving the generalized eigenvalue problem , the updated matrix can be expressed as
where , and .
Equation (27) is stable provided that ; the updated characteristic equation is then given by
where .
For the midpoint rule, i.e., when and , substituting them into Equation (28) yields , which always holds. In this case, the Newmark–Beta method is unconditionally stable. Thus, in this research, the parameters of and are used to ensure the calculation stability.
3. Simulation Verification
To validate the accuracy and reliability of the proposed method, a benchmark test was first conducted on a uniform beam with steady stiffness. Table 1 presents the first four dimensionless frequency parameters calculated using the proposed method under specific boundary conditions (, as detailed in reference [30]), and compares these results with those obtained using the modified Fourier series method (MFSM) from reference [39]. The comparison shows that the results from the proposed method closely match those from the improved Fourier series method, with negligible error, thereby thoroughly confirming the accuracy and reliability of the proposed approach.

Table 1.
Comparison results of the frequency parameters.
The transient vibration responses of a beam with time-varying stiffness and a beam with steady stiffness are both computed using COMSOL Multiphysics software (Version 6.2) and compared with the results obtained from the Newmark–Beta method derived in this study. The length of the beam is set as , the width of the beam is set as , and the thickness of the beam is set as . The elastic beam is made of structural steel with a complex Young’s modulus , a density , and a Poisson’s ratio . The selection of spring stiffness is based on the stiffness variation range designed for the electromagnetic spring in Yu [24]. The beam with time-varying stiffness is supported at both ends by linear springs that are perpendicular to the beam’s axis. The spring stiffness is defined as , where represents time. This allows the spring stiffness to dynamically vary over time, providing the necessary time-varying boundary conditions and effectively controlling the beam’s vibrational behavior. To facilitate comparison, the beam with steady stiffness is also considered. The material properties, structural dimensions, and spring support positions of the steady stiffness beam are identical to those of the time-varying stiffness beam, with the spring stiffness set to . The element length of both the time-varying stiffness beam and the steady stiffness beam is set to . A transverse harmonic excitation is applied at .
Figure 3 compares the displacement response at the position of obtained by COMSOL Multiphysics (Version 6.2) and the Newmark–Beta method for both the time-varying boundary beam and the steady boundary beam. It can be observed that the results of the Newmark–Beta method are in close agreement with those from the commercial finite element software, thereby confirming the reliability of the method.
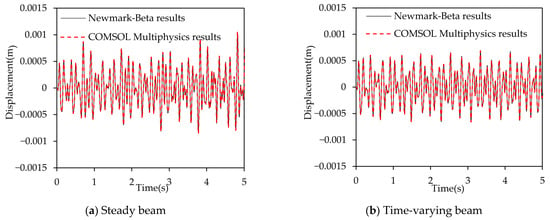
Figure 3.
Displacement comparisons between the FE software (Version 6.2) and the Newmark-Beta methods.
To address the impact of element number on modal accuracy, Table 2 presents the first four modal frequencies for different numbers of elements. It can be observed that as the number of elements increases, the modal frequencies gradually stabilize. However, increasing the number of elements also leads to a longer computation time. Therefore, to balance computational accuracy and efficiency, the mesh size is set as in subsequent analyses to ensure both accuracy and reduced computational time.

Table 2.
Impact of element number on modal accuracy.
4. Results and Discussion
4.1. Modal Frequencies and Modal Shapes
Figure 4 illustrates the variation in the first to the fourth modal frequencies with time for both the time-varying and steady stiffness beams. The beams are identical to those used in the model. As shown in Figure 4, the four resonance frequencies fluctuate with changes in the spring stiffness, with the first-order resonance frequency showing relatively small variation, while the higher-order resonance frequencies exhibit more pronounced oscillations.
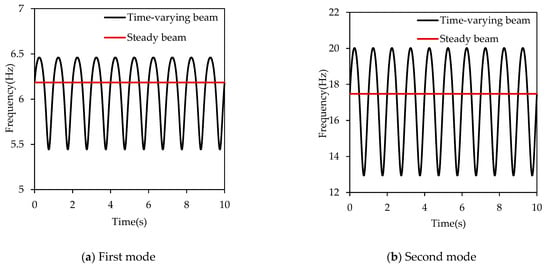
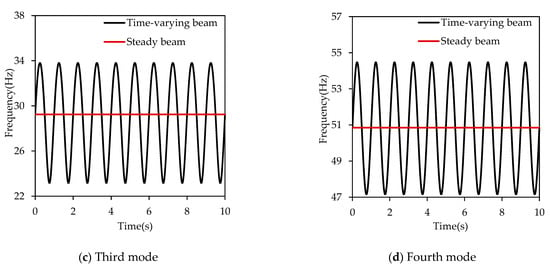
Figure 4.
The relationship between the support stiffness and the resonance frequencies.
Figure 5 illustrates the first to fourth mode shapes of the beam when the supporting stiffness is set to 3250 N/m and 5000 N/m. As shown in Figure 5, variations in supporting stiffness lead to noticeable adjustments in the beam’s vibration modes. This indicates that tuning the supporting stiffness not only affects the beam’s resonant frequencies but also induces slight changes in the mode shapes. Therefore, supporting stiffness plays a dual role in vibration control, simultaneously influencing both modal frequencies and modal shapes. Consequently, if the supporting stiffness varies with time, the modal frequencies and mode shapes of the structure will also evolve over time, thereby disrupting the original modal vibration patterns and further altering the vibration response characteristics.
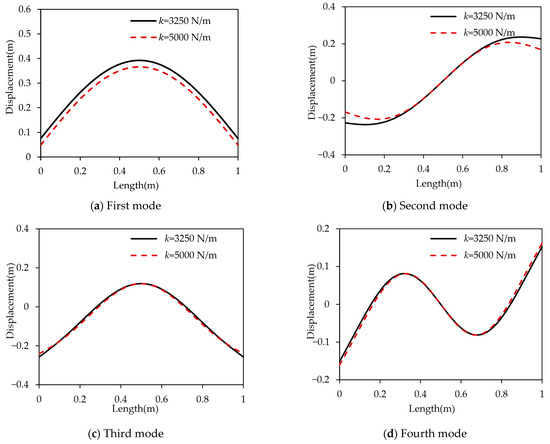
Figure 5.
Relationship between the support stiffness of the beam and the modal shapes.
4.2. Resonance Suppression Performance of the Time-Varying Stiffness Beam
To verify the effect of the stiffness variation on the beam’s resonance, the vibration responses of the time-varying stiffness beam and the steady stiffness beam under a single frequency excitation are first compared. The nodal position of a specific mode is a very special point, where the displacement of the corresponding mode at the nodal position will be zero. When the excitation point or measurement point is located at the nodal position, the modal participation factor would be very low. Thus, to accurately reflect the overall dynamic characteristics of the beam, the excitation and measurement points should be selected away from the node positions. Therefore, by referencing the modal shapes shown in Figure 6, a harmonic excitation with a frequency of 6.2 Hz, corresponding to the steady stiffness beam’s first-mode frequency, is applied at the position of for both beams. The vibration response at the position of is extracted, and the results are shown in Figure 6.
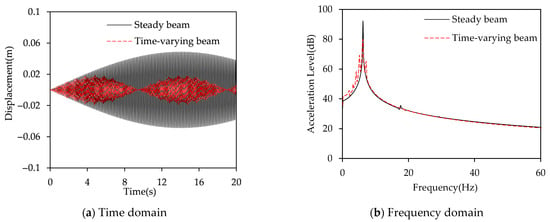
Figure 6.
Displacement response comparisons of the time-varying stiffness beam and the steady stiffness beam excited by the first-mode frequency.
The results in Figure 6a indicate that, in the time domain, the displacement response of the time-varying stiffness beam is smaller than that of the steady stiffness beam. The results shown in Figure 6b indicate that the time-varying stiffness beam exhibits multiple vibration peaks within the frequency range of 4–7 Hz. The maximum vibration response occurs at a frequency of 6.2 Hz, with a response level of 79.4 dB. Compared to the steady stiffness beam, this response is reduced by 12.7 dB. At other peak frequencies, the vibration response of the time-varying stiffness beam increases compared to the steady stiffness beam. By calculating the total level in the 4–7 Hz range, the total level of the steady stiffness beam is 92.2 dB, while the total level of the time-varying stiffness beam is 82.2 dB. This indicates that the time-varying nature of stiffness continuously alters the structure’s modal frequencies and mode shapes, preventing vibration energy from concentrating at a single modal frequency. As modal characteristics evolve over time, vibration energy gradually spreads across a broader frequency range rather than being confined to the original resonant points, thereby effectively reducing the response peaks associated with each modal frequency under steady stiffness conditions.
To verify the effectiveness of the time-varying stiffness method in suppressing multi-modal resonance of the beam, the first four modal frequencies of the steady stiffness beam were used as excitation frequencies and applied to both the time-varying and steady stiffness beams. The excitation point was located at . The excitation signal is represented by , and the vibration response at is extracted. The results are shown in Figure 7.
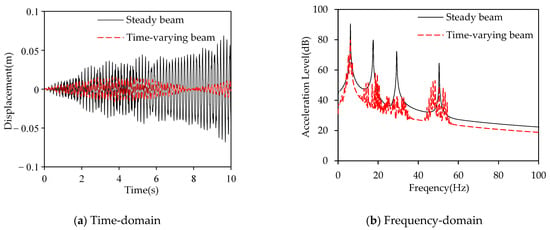
Figure 7.
Displacement response comparisons of the time-varying stiffness beam and the steady stiffness beam excited by the multi-frequencies.
As shown in Figure 7a, in the time domain, the displacement response of the time-varying stiffness beam exhibits a periodic characteristic, alternating between increasing and decreasing, and is much smaller than that of the steady stiffness beam. The results shown in Figure 7b indicate that the vibration response of the steady stiffness beam is concentrated at the first four modal frequencies, which are 6.2 Hz, 17.4 Hz, 29.2 Hz, and 50.4 Hz, with corresponding vibration levels of 90.5 dB, 79.6 dB, 71.9 dB, and 64.8 dB. The time-varying boundary beam also exhibits multiple peaks at the corresponding modal frequencies, with the highest peak frequencies being 6.2 Hz, 18.6 dB, 31.8 dB, and 48.4 dB. The vibration responses at these frequencies are 79.4 dB, 57.3 dB, 42.4 dB, and 53.1 dB, respectively.
Table 3 presents the peak dispersion range at the first four modal frequencies of the time-varying stiffness beam, along with the total acceleration decay and peak decay within this range. The dispersion ranges of the second and third modes are connected because the upper limit of the second mode’s frequency range and the lower limit of the third mode’s frequency range are too close. As shown in Table 3, under multi-modal excitation, the total and peak responses of the time-varying stiffness beam exhibit a more significant reduction than the steady stiffness beam. This indicates that under multi-modal excitation, the time-varying stiffness approach can simultaneously adjust the modal frequencies and mode shapes of the structure, dynamically redistributing vibration energy that would otherwise concentrate at specific modal frequencies across a broader frequency range. As a result, the response peaks of each mode are effectively reduced, improving the overall vibration performance of the structure under multi-frequency excitation.

Table 3.
Dispersion range and decay amount of the first four modal frequencies.
In engineering practice, beams are often subjected to random excitation. Therefore, analyzing the vibration response characteristics of time-varying stiffness beams under random excitation is of significant importance. A narrowband white noise excitation, ranging from 20 Hz to 40 Hz and encompassing the fourth-mode frequency of the steady stiffness beam, is applied to both the time-varying stiffness beam and the steady stiffness beam. The time-domain and frequency-domain excitation signals are shown in Figure 8.
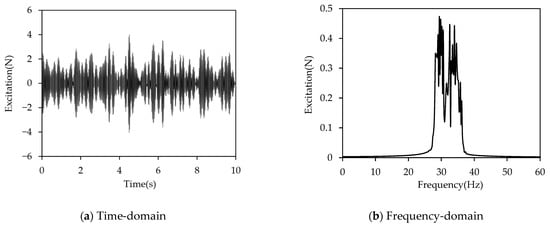
Figure 8.
Time-domain and frequency-domain excitation signals of the narrowband white noise excitation.
Figure 9 presents the time-domain and frequency-domain displacement responses of both beams. In Figure 9a, it can be observed that, compared with the modal-frequency excitation cases, the displacement responses of the time-varying stiffness beam and the steady stiffness beam under narrowband white noise excitation are pretty similar. However, the displacement response of the steady stiffness beam is still smaller than that of the time-varying stiffness beam. The results in Figure 9b show that under narrowband white noise excitation, which includes modal excitation, the time-varying stiffness beam continues to exhibit effective energy dispersion, dispersing the modal vibration energy of the steady stiffness beam into non-modal regions and achieving promising vibration suppression.
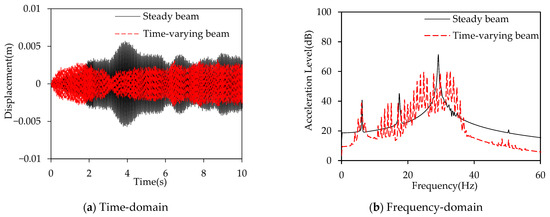
Figure 9.
Displacement response comparisons of the time-varying stiffness beam and the steady stiffness beam, excited by the narrowband white noise excitation.
Table 4 presents the peak dispersion range at the first four modal frequencies of the time-varying stiffness beam under narrowband excitation, along with the total acceleration decay and peak decay within this range. The results shown in Table 2 indicate that when a random excitation between 20 and 40 Hz is applied, the peak response attenuation at the first and second modal frequencies of the time-varying stiffness beam is 2.3 dB and 4.2 dB, respectively, while the attenuation at the third modal frequency is 11.8 dB. The total level attenuation results show that the vibration energy of both the time-varying and steady stiffness beams is similar in the energy-dispersing frequency range, with no additional vibration energy introduced. Therefore, the time-varying stiffness beam only redistributes the vibration energy concentrated at the modal frequencies to other frequencies, thereby achieving vibration suppression through energy redistribution.

Table 4.
Dispersion range and decay amount of the first three modal frequencies.
Figure 10 illustrates the variation in the total acceleration level with center frequency within a 5 Hz bandwidth. The results show that the vibration energy of the steady stiffness beam is primarily concentrated in narrow frequency bands, such as 5–7 Hz, 15–18 Hz, and 27–30 Hz, indicating that the beam’s vibrational energy is mainly concentrated around a limited set of natural frequencies. In contrast, for the time-varying stiffness beam, as the center frequency increases, the energy concentration range gradually broadens, particularly around the modal frequencies of the steady stiffness beam, covering a wider frequency range and resulting in a significant reduction in the total level. This further validates the impact of time-varying stiffness on energy distribution. By adjusting the stiffness, the time-varying stiffness beam can effectively redistribute the vibration energy that would normally be concentrated around the natural frequencies, spreading it across a broader frequency band, thereby suppressing harmful resonance peaks and reducing the structural resonance response.
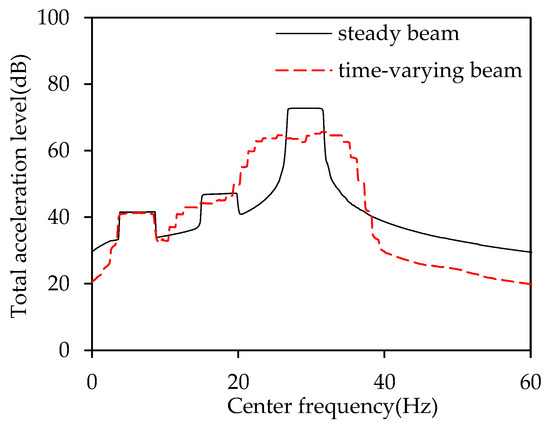
Figure 10.
Curve of total acceleration level with center frequency for a 5 Hz bandwidth under narrowband excitation.
Figure 11 presents the acceleration power spectral density (PSD) curves for both the steady stiffness and time-varying stiffness beams. As observed in the figure, the resonance peaks of the time-varying stiffness beam are significantly lower than those of the steady stiffness beam. The PSD at the first four modal frequencies is reduced by 1.2 dB/Hz, 6.7 dB/Hz, 9.5 dB/Hz, and 3.2 dB/Hz, respectively. Furthermore, the resonance peaks of the time-varying stiffness beam not only exhibit reduced amplitudes but also show noticeable broadening, with the spectral profile becoming more diffuse. This phenomenon suggests that time-varying stiffness causes the beam’s natural frequencies to fluctuate over a broader frequency range, rather than remaining fixed at a specific value. As a result, the vibration energy, which would typically be concentrated in a narrow frequency band, is redistributed across a wider continuous frequency band. This redistribution effectively reduces the concentration of vibrational energy at specific frequency points, thereby suppressing the structural resonance response.
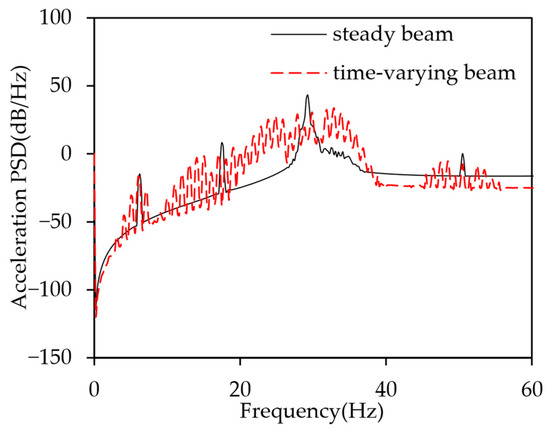
Figure 11.
Comparison of acceleration power spectral density under narrowband excitation.
Furthermore, to verify the effectiveness of the time-varying stiffness beam in suppressing resonance responses under broadband white noise excitation, a 0–400 Hz white noise excitation is applied simultaneously to both the time-varying stiffness beam and the steady stiffness beam. The time-domain and frequency-domain excitation signals are shown in Figure 12.
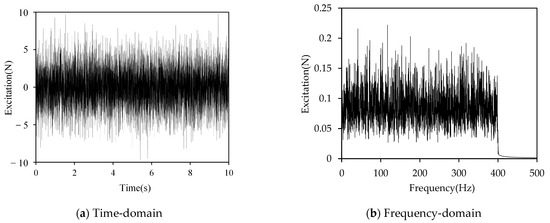
Figure 12.
Time-domain and frequency-domain excitation signals of the broadband white noise excitation.
Figure 13 compares the vibration responses of the time-varying stiffness beam and the steady stiffness beam under the aforementioned broadband white noise excitation. In Figure 13a, it is observed that under broadband white noise excitation, the time-varying stiffness beam’s displacement envelope and the steady stiffness beam’s displacement envelope are of comparable magnitudes. Figure 13b shows that, in the frequency domain, the time-varying stiffness beam exhibits a significant energy dispersion effect near the second, third, and fourth modal frequencies, with peak response attenuation of 3.8 dB, 5.9 dB, and 8.6 dB, respectively. At the first modal frequency, the vibration response of the time-varying stiffness beam increases by 0.8 dB. This is likely due to the relatively narrow frequency range around the first modal frequency, which limits the available frequencies for energy dispersion. The time-varying stiffness modulates the response spectrum, generating sidebands near the natural frequency. These sidebands may overlap with the first modal frequency, leading to an increase in the response. In addition, the vibration response at higher frequencies is almost identical to that of the steady stiffness beam. This phenomenon is attributed to the fact that at higher modes, the oscillation range of the modal frequencies caused by changes in spring stiffness is very small, closely resembling the modal frequencies under steady stiffness, which makes energy dispersion difficult.
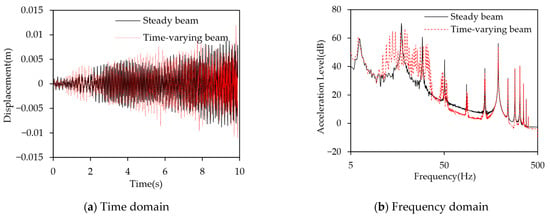
Figure 13.
Displacement response comparisons of the time-varying stiffness beam and the steady stiffness beam, excited by the broadband white noise excitation.
Figure 14 illustrates the relationship between the total acceleration level and the center frequency within a 5 Hz bandwidth under broadband excitation. Similarly to the results obtained with narrowband excitation, the energy concentration range of the time-varying stiffness beam at lower modal frequencies is noticeably broadened, with the total acceleration level reduced compared to the steady stiffness beam. This indicates that, near the lower modal frequencies, the time-varying stiffness effectively disperses the vibration energy. However, at mid- to high-modal frequencies, the relatively narrow modal oscillation range prevents significant energy dispersion, resulting in minimal differences in the response range and total acceleration level between the time-varying stiffness and steady stiffness beams in these frequency bands.
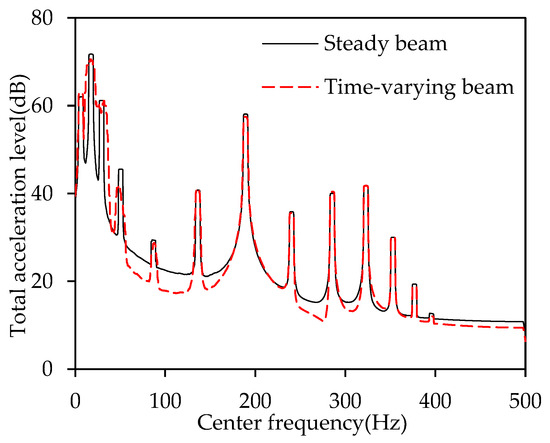
Figure 14.
Curve of total acceleration level with center frequency for a 5 Hz bandwidth under broadband white noise excitation.
Figure 15 presents the acceleration power spectral density (PSD) curves for both the steady stiffness and time-varying stiffness beams. Similarly to the narrowband excitation results, the resonance peaks at lower modal frequencies of the time-varying stiffness beam are lower than those of the steady stiffness beam. Additionally, at these frequencies, the peaks fluctuate over a broader frequency range, demonstrating the energy dispersion characteristic. This indicates that time-varying stiffness effectively redistributes vibration energy across a wider frequency range, thereby attenuating resonance responses. However, as the modal order increases, the oscillation range caused by the stiffness variation gradually narrows. As a result, at higher modal frequencies, the time-varying stiffness beam fails to exhibit significant energy dispersion, and the vibration energy remains concentrated within specific frequency bands, preventing effective energy redistribution.
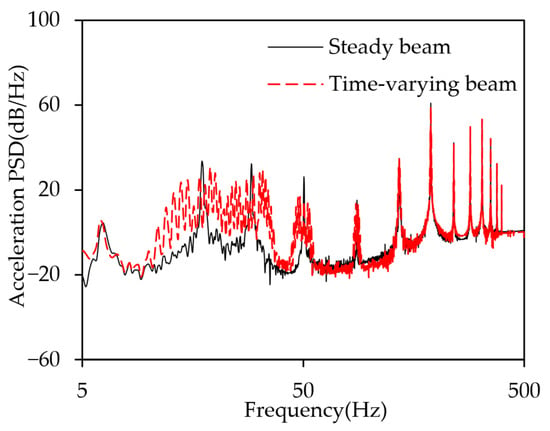
Figure 15.
Comparison of acceleration power spectral density under broadband white noise excitation.
4.3. Effects of Time-Varying Speed, Time-Varying Range, and Average Stiffness Level
The rate of stiffness variation affects the oscillation period of the modal frequencies, while the magnitude of stiffness variation influences the oscillation range of the modal frequencies. Both factors have an impact on the vibration response characteristics of the time-varying stiffness beam. Figure 16 illustrates the effect of stiffness variation speed on the vibration response. In this case, the stiffness variation periods are 4 s, 1 s, and 0.4 s, and the excitation is a multi-modal excitation based on the first four mode frequencies. It can be observed that under multi-modal excitation, the rate of stiffness variation influences the periodicity of the time-domain response but has a relatively small effect on the vibration response. Different rates of stiffness variation all demonstrate a good vibration suppression effect.
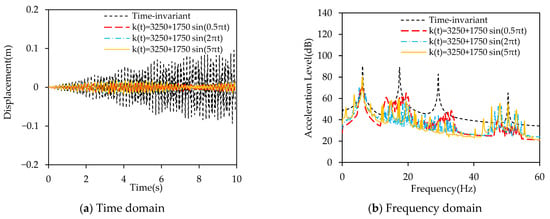
Figure 16.
Effect of the time-varying speed on the vibration suppression.
Figure 17 illustrates the effect of the stiffness variation range on the vibration suppression performance.
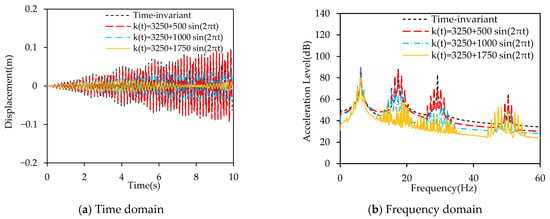
Figure 17.
Effect of the time-varying range on the vibration suppression.
It can be observed in Figure 17 that the displacement response of the beam decreases significantly as the range of stiffness variation increases. In the frequency domain, an increase in the stiffness variation range leads to a reduction in the vibration response at the excitation frequency and a greater number of spectral lines near that frequency. This indicates that a larger stiffness variation range allows more spectral lines to appear near the modal frequencies, thereby enhancing energy dispersion and achieving improved suppression of resonance responses.
To investigate the impact of average stiffness level on vibration suppression performance, this study selected average stiffness levels of , , and , with an oscillation stiffness amplitude of and an oscillation period of 1 s. The excitation is the same as in Figure 12. The results are shown in Figure 18. Table 4 presents the oscillation range of the first four modal frequencies at three different average stiffness levels.
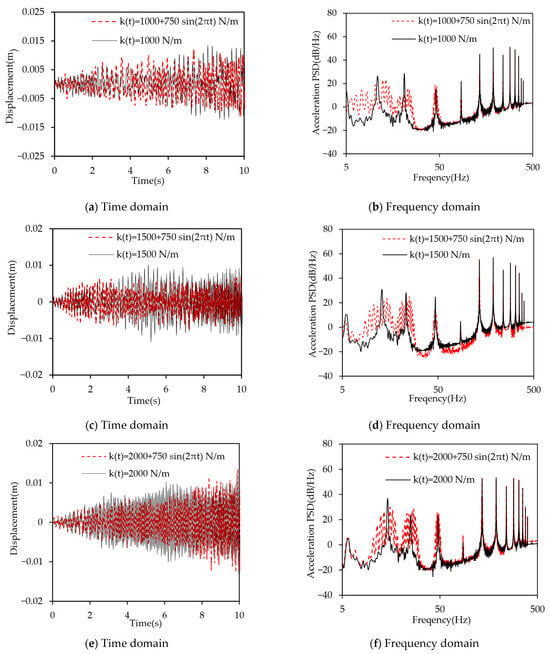
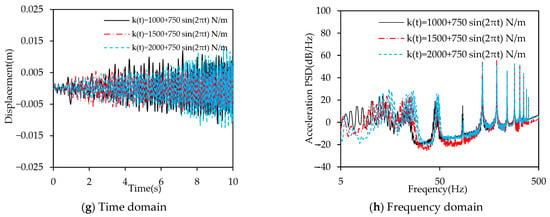
Figure 18.
Effect of the average stiffness level.
The results in Table 5 indicate that as the average stiffness level increases, the oscillation range of each modal frequency gradually decreases, leading to a reduction in the number of peaks available for dispersing vibration energy. In Figure 14, the vibration response of the time-varying stiffness beam in the 16–50 Hz range increases with the average stiffness level, corresponding to the previous findings. As for the very low-frequency range (<10 Hz), the increased vibration response can be attributed to the fact that the oscillation ranges of the first and second modal frequencies overlap when the average stiffness level is low. This causes the vibration energy to disperse into this frequency range, resulting in an increased response.

Table 5.
Frequency bandwidth of the first four modal frequencies.
4.4. Effects of Different Stiffness Variation Forms
In engineering applications, there are various forms of stiffness variation. Therefore, this section will analyze the vibration response characteristics of a time-varying stiffness beam under different stiffness variation methods. Figure 19 presents the time-varying stiffness curve of the spring when the stiffness follows a square wave variation. The two threshold stiffness values of the square wave are denoted as and .
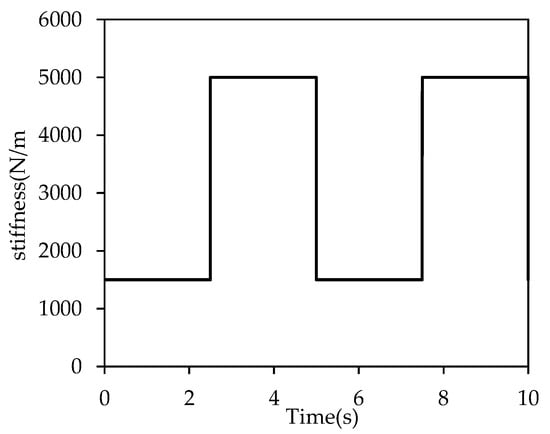
Figure 19.
Diagram of stiffness variation in the square-wave form.
A random excitation, as shown in Figure 12, is applied simultaneously to both the time-varying stiffness beam and the steady stiffness beam, where the stiffness of the steady stiffness beam is set to 1500. The results are presented in Figure 20. Table 6 presents the first five mode frequencies of the beam under two different stiffness conditions.
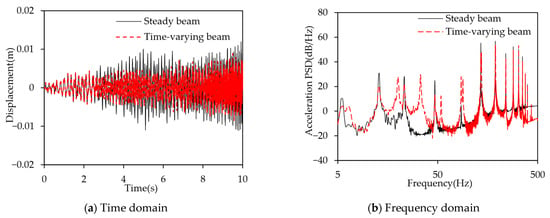
Figure 20.
Effect of the square wave variation.

Table 6.
First five mode frequencies of two different stiffness conditions.
Figure 20b shows that in the 0–100 Hz frequency range, the vibration energy of the steady stiffness beam is primarily concentrated at 5.6 Hz, 13 Hz, 23.2 Hz, 46.8 Hz, and 87.8 Hz, corresponding to the first five modal frequencies at , as shown in Table 6. In contrast, the time-varying stiffness beam exhibits not only the five peak frequencies mentioned above but also additional peak frequencies at 6.4 Hz, 19.8 Hz, 33.6 Hz, 54.2 Hz, and 91.2 Hz, corresponding to the first five modal frequencies at in Table 6. It is evident that the periodic variation in the support stiffness causes the beam structure to oscillate between two different modal forms. This variation not only alters the vibration characteristics of the structure but also leads to a dynamic redistribution of energy between various modes. Compared to the steady stiffness boundary, where vibration energy is typically concentrated in a single modal form, the periodically varying stiffness allows energy to transfer from the dominant mode to another, resulting in the appearance of two distinct modal frequency peaks in the spectrum. This phenomenon is not only a direct manifestation of the effect of support stiffness variation on structural vibration behavior but also reveals the potential mechanism of how stiffness time-variation can contribute to vibration suppression. By adjusting the period of stiffness variation, energy can be effectively dispersed, and vibrations within specific frequency ranges can be suppressed, thus providing effective control over structural vibrations.
Figure 21 illustrates the time-varying stiffness curve of the spring under a full-wave variation, while Figure 22 presents the corresponding vibration response of the beam with time-varying stiffness. For comparison, the stiffness of the beam with steady stiffness is set to .
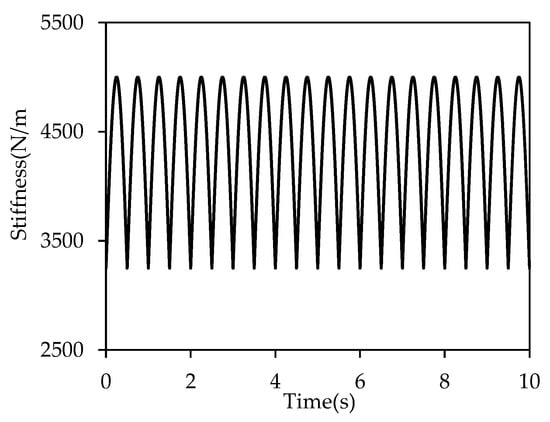
Figure 21.
Diagram of stiffness variation in the full-wave rectified variation form.
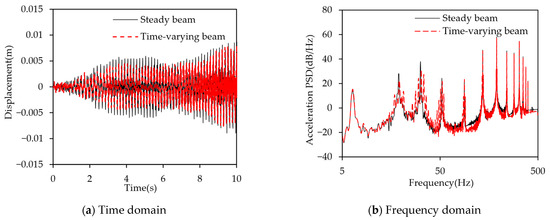
Figure 22.
Effect of the full-wave rectified variation.
The results in Figure 22 indicate that when the stiffness follows a full-wave variation, the acceleration levels of the beam with time-varying stiffness are reduced by 5.1 dB/Hz, 8.1 dB/Hz, and 2.8 dB/Hz at 18.8 Hz, 31.6 Hz, and 52.2 Hz, respectively. However, multiple peaks still appear in the vicinity of these frequency bands. These results demonstrate that the full-wave stiffness variation effectively promotes energy dispersion. Nevertheless, no significant vibration suppression is observed at the first modal frequency. This is because the oscillation range of the first modal frequency is limited to 6.2–6.4 Hz, which is relatively narrow, and the resolution of the power spectral density constrains its ability to capture a clear suppression effect.
Figure 23 illustrates the time-varying stiffness curve of the spring under a triangular-wave variation, while Figure 24 presents the corresponding vibration response characteristics of the beam with time-varying stiffness. For comparison, the stiffness of the steady-stiffness beam is set to .
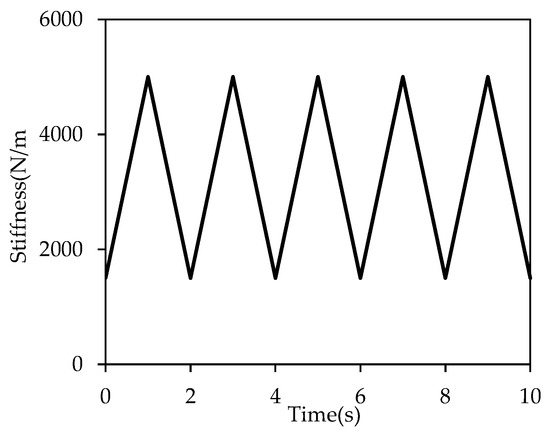
Figure 23.
Diagram of stiffness variation in the triangular-wave variation form.
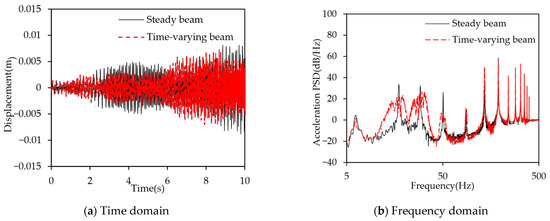
Figure 24.
Effect of triangular-wave variation.
Figure 24 illustrates the acceleration power spectral density of the time-varying stiffness beam when the stiffness changes in a triangular waveform. The PSD at 6.2 Hz, 17.4 Hz, 29.2 Hz, and 50.4 Hz decreased by 2.8 dB/Hz, 9.7 dB/Hz, 7.2 dB/Hz, and 18.5 dB/Hz, respectively. Compared to the steady stiffness beam’s response at these frequencies, the results show significant attenuation. This indicates that triangular waveform stiffness variation can still achieve a certain degree of vibration suppression and demonstrates more pronounced energy dispersion characteristics.
5. Conclusions
This study proposes a time-varying stiffness method for simultaneously controlling multi-modal resonance in beams with elastic supports. The resonance frequencies are altered by dynamically adjusting the support stiffness, achieving time-varying resonance frequencies. The transient response of the beam whose stiffness varies over time is resolved in the time domain by making use of the Newmark–Beta method, and the vibration response under different excitation types is discussed. Additionally, the effects of stiffness variation rate, stiffness variation range, and average stiffness level on resonance suppression performance are also analyzed to provide a more comprehensive understanding of the vibration characteristics of a beam with elastic time-varying stiffness boundaries.
The time-varying stiffness method effectively controls multi-modal resonance simultaneously. By dynamically adjusting the support stiffness to change resonance frequencies, the method disperses and suppresses resonance energy. Under single-modal, multi-modal, narrowband, and broadband random excitations, the time-varying stiffness beam outperforms the steady stiffness beam in terms of reducing displacement amplitude and suppressing resonance peaks, demonstrating superior vibration attenuation capability. Although the rate of stiffness variation has a minimal effect on resonance suppression, increasing the range of stiffness variation significantly broadens energy distribution in the frequency domain, thereby effectively enhancing resonance suppression performance. The average stiffness level influences the oscillation range of modal frequencies, which in turn affects the energy dispersion effect. A lower average stiffness level improves energy dispersion, resulting in an increased vibration response at very low frequencies.
As an innovative vibration control technique, the time-varying stiffness method can be combined with electromagnetic spring technology to dynamically adjust the spring stiffness by varying the electromagnetic force in real time. This provides a flexible solution for vibration control. In the future, this integration will effectively address the challenges of multi-modal resonance and hold great potential for applications in aerospace, automotive, and smart manufacturing sectors. The key challenge for future research lies in how to stably adjust the stiffness of electromagnetic springs in different working environments and precisely control the variation in electromagnetic force to ensure the stability of vibration control effects. Additionally, the practical application of electromagnetic springs must address technical challenges such as response speed, power consumption, and system integration. Therefore, future research will focus on developing experimental platforms to conduct system testing and optimization, thereby validating the accuracy of theoretical models and assessing the practical feasibility of the time-varying stiffness method in engineering applications.
Author Contributions
Conceptualization, Z.G. and M.S.; methodology, Z.G.; software, Y.Z.; validation, Y.Z.; formal analysis, Z.G. and Y.Z.; investigation, Y.Z.; resources, M.S.; data curation, Y.Z.; writing—original draft preparation, Y.Z.; writing—review and editing, Z.G. and M.S.; visualization, L.L. and Y.L.; supervision, M.S.; project administration, M.S.; funding acquisition, Z.G. and M.S. All authors have read and agreed to the published version of the manuscript.
Funding
This research was funded by the National Natural Science Foundation of China, grant number 52301388, and also by the National Key Laboratory on Ship Vibration and Noise, grant number 6142204250404.
Institutional Review Board Statement
Not applicable.
Informed Consent Statement
Not applicable.
Data Availability Statement
The original contributions presented in this study are included in the article. Further inquiries can be directed to the corresponding author.
Conflicts of Interest
The authors declare no conflicts of interest.
References
- Wei, L.; Sun, Y.; Zeng, J.; Qu, S. Experimental and numerical investigation of fatigue failure for metro bogie cowcatchers due to modal vibration and stress induced by rail corrugation. Eng. Fail. Anal. 2022, 142, 106810. [Google Scholar] [CrossRef]
- Zhang, Y.W.; Hou, S.; Zhang, Z.; Zang, J.; Ni, Z.Y.; Teng, Y.Y.; Chen, L.Q. Nonlinear vibration absorption of laminated composite beams in complex environment. Nonlinear Dyn. 2020, 99, 2605–2622. [Google Scholar] [CrossRef]
- Qian, F.; Zuo, L. Tuned nonlinear spring-inerter-damper vibration absorber for beam vibration reduction based on the exact nonlinear dynamics model. J. Sound Vib. 2021, 509, 116246. [Google Scholar] [CrossRef]
- Li, W.; Wang, Z. Symmetric Single-Sided Vibro-Impact Nonlinear Energy Sink for Shock Response Suppression of a Cantilever Beam: An Experimental Demonstration. In Proceedings of the International Conference on Vibration and Energy Harvesting Applications, Auckland, New Zealand, 26–29 June 2024; Springer Nature Singapore: Singapore, 2025. [Google Scholar] [CrossRef]
- Alsahlani, A.; Alsabery, A.I.; Al-Khateeb, A.E.; Eidan, A.; Alshukri, M.J. Vibration suppression of smart composite beam using model predictive controller. Open Eng. 2024, 14, 20240001. [Google Scholar] [CrossRef]
- Zhang, C.; Huang, J.; Li, H.; Zhou, H.; Hu, K.; Zhang, X.; Tzou, H. Active vibration control of flexible structures with super-coiled actuators. AIAA J. 2024, 62, 1195–1204. [Google Scholar] [CrossRef]
- Mishra, V.N.; Gupta, A.; Sarangi, S.K. Numerical and experimental study of layered beams with vibration-damping coatings for improved vibration mitigation. Mech. Res. Commun. 2025, 148, 104476. [Google Scholar] [CrossRef]
- Terzioglu, F.; Rongong, J.A. Selection of granular damper parameters to achieve optimum vibration attenuation on vibrating structures. Mech. Syst. Signal Process. 2025, 229, 112512. [Google Scholar] [CrossRef]
- Sinapius, M. Adaptronics—Smart Structures and Materials; Springer Vieweg: Berlin, Germany, 2021; pp. 128–137. [Google Scholar]
- Lei, X.; Shen, L.; Chen, Z.; Niu, H.; Wei, C.; Zhang, X. Experimental analysis of additional aerodynamic effects caused by wind-driven rain on bridge main girder. J. Cent. South Univ. 2022, 29, 2743–2756. [Google Scholar] [CrossRef]
- Zhang, Y.; Wang, M.; Guo, Z.; Sheng, M.; Li, Y. Vibration characteristics of the time-dependent stiffness oscillator system based on finite difference method. In Proceedings of the International Conference on Acoustics, Fluid Mechanics and Engineering, Hangzhou, China, 8–11 November 2024; IOP Publishing: Bristol, UK, 2025. [Google Scholar] [CrossRef]
- Wang, Y.; Wu, W.; Wang, Z.; Lou, X.; Görges, D. Robust boundary control approaches to the stabilization of the Euler–Bernoulli beam under external disturbances. J. Vib. Control 2023, 29, 4841–4856. [Google Scholar] [CrossRef]
- Wang, J.; Liu, J.; Pan, G. A time-varying boundary method for multimodal vibration suppression of beam. J. Cent. South Univ. 2023, 30, 4122–4137. [Google Scholar] [CrossRef]
- Wang, J.; Liu, J.; Pan, G. Analysis of Resonance Suppression Performance of a Time-Varying Isolation Platform. Int. J. Acoust. Vib. 2024, 29, 13–20. [Google Scholar] [CrossRef]
- Wang, J.; Liu, J.; Pan, G. A time-domain piecewise calculation method of a time-varying isolation platform. Mech. Syst. Signal Process. 2025, 228, 112416. [Google Scholar] [CrossRef]
- Abramyan, A.K.; Vakulenko, S.A. Oscillations of a beam with a time-varying mass. Nonlinear Dyn. 2011, 63, 135–147. [Google Scholar] [CrossRef]
- He, W.; Nie, S.; Meng, T.; Liu, Y. Modeling and vibration control for a moving beam with application in a drilling riser. IEEE Trans. Control Syst. Technol. 2016, 25, 1036–1043. [Google Scholar] [CrossRef]
- Zhang, L.; Liu, D.; Xu, G. Stabilization of a Timoshenko beam system with a tip mass under unknown non-uniformly bounded disturbances. IMA J. Math. Control Inf. 2020, 37, 241–259. [Google Scholar] [CrossRef]
- Moslemi, A.; Khadem, S.E.; Khazaee, M.; Davarpanah, A. Nonlinear vibration and dynamic stability analysis of an axially moving beam with a nonlinear energy sink. Nonlinear Dyn. 2021, 104, 1955–1972. [Google Scholar] [CrossRef]
- Huang, J.L.; Zhou, W.J.; Zhu, W.D. Quasi-periodic motions of high-dimensional nonlinear models of a translating beam with a stationary load subsystem under harmonic boundary excitation. J. Sound Vib. 2019, 462, 114870. [Google Scholar] [CrossRef]
- Pourzeynali, S.; Zhu, X.; Zadeh, A.G.; Rashidi, M.; Samali, B. Comprehensive study of moving load identification on bridge structures using the explicit form of Newmark-β method: Numerical and experimental studies. Remote Sens. 2021, 13, 2291. [Google Scholar] [CrossRef]
- Omar, A.; Sitli, Y.; Elmhaia, O.; Rammane, M.; Mesmoudi, S.; Hilali, Y.; Bourihane, O. Impact of polymeric composites on static and dynamic behaviors of Timoshenko beams using spectral and Newmark-methods. J. Vib. Eng. Technol. 2024, 12, 2095–2120. [Google Scholar] [CrossRef]
- Liu, Y.; Zhang, B.; Wang, T.; Su, T.; Chen, H. Dynamic analysis of multilayer-reinforced concrete frame structures based on NewMark-β method. Rev. Adv. Mater. Sci. 2021, 60, 567–577. [Google Scholar] [CrossRef]
- Yu, J. Study on the Compliance Control in Robot-Environment Interaction Using the Electromagnetic Variable Stiffness Principle; Shanghai Jiao Tong University: Shanghai, China, 2019; pp. 48–82. [Google Scholar]
- Rakowski, J. The interpretation of the shear locking in beam elements. Comput. Struct. 1990, 37, 769–776. [Google Scholar] [CrossRef]
- Mukherjee, S.; Prathap, G. Analysis of shear locking in Timoshenko beam elements using the function space approach. Commun. Numer. Methods Eng. 2001, 17, 385–393. [Google Scholar] [CrossRef]
- Zienkiewicz, O.C.; Taylor, R.L.; Too, J.M. Reduced integration technique in general analysis of plates and shells. Int. J. Numer. Methods Eng. 1971, 3, 275–290. [Google Scholar] [CrossRef]
- Hughes, T.J.R.; Cohen, M.; Haroun, M. Reduced and selective integration techniques in the finite element analysis of plates. Nucl. Eng. Des. 1978, 46, 203–222. [Google Scholar] [CrossRef]
- Prathap, G.; Bhashyam, G.R. Reduced integration and the shear-flexible beam element. Int. J. Numer. Methods Eng. 1982, 18, 195–210. [Google Scholar] [CrossRef]
- Reddy, J.N. On locking-free shear deformable beam finite elements. Comput. Methods Appl. Mech. Eng. 1997, 149, 113–132. [Google Scholar] [CrossRef]
- Fakher, M.; Hosseini-Hashemi, S. Vibration of two-phase local/nonlocal Timoshenko nanobeams with an efficient shear-locking-free finite-element model and exact solution. Eng. Comput. 2022, 38, 231–245. [Google Scholar] [CrossRef]
- Iandiorio, C.; Salvini, P. Elastic-plastic analysis with pre-integrated beam finite element based on state diagrams: Elastic-perfectly plastic flow. Eur. J. Mech. A Solids 2023, 97, 104837. [Google Scholar] [CrossRef]
- Bai, R.; Naceur, H.; Zhao, J.; Yi, J.; Ma, J.; Pu, H.; Luo, J. Improved numerical integration for locking treatment in the Peridynamic Timoshenko beam model. Eng. Comput. 2023, 40, 2225–2247. [Google Scholar] [CrossRef]
- Thomson, W. On the elasticity and viscosity of metals. Proc. R. Soc. Lond. A Math. Phys. Sci. 1865, 14, 289–297. [Google Scholar] [CrossRef]
- Voigt, W. Ieber innere Reibung fester korper, insbesondere der Metalle. Ann. Der Phys. 1892, 283, 671–693. [Google Scholar] [CrossRef]
- Maxwell, J.C. On the dynamical theory of gases. Philos. Trans. R. Soc. Lond. A 1867, 157, 49–88. [Google Scholar] [CrossRef]
- Wiechert, E. Gesetze der elastischen Nachwirkung für steadye Temperatur. Ann. Der Phys. 1893, 286, 335–348. [Google Scholar] [CrossRef]
- Cremer, L.; Heckl, M.; Petersson, B.A.T. Structure-Borne Sound: Structural Vibrations and Sound Radiation at Audio Frequencies; Springer Science & Business Media: New York, NY, USA, 2013. [Google Scholar]
- Lv, B.L.; Li, W.Y.; Dai, J.; Zhou, H.; Guo, F.; Gao, Z. Vibration analysis of beams with arbitrary elastic boundary conditions. Appl. Mech. Mater. 2011, 66, 1325–1329. [Google Scholar] [CrossRef]
Disclaimer/Publisher’s Note: The statements, opinions and data contained in all publications are solely those of the individual author(s) and contributor(s) and not of MDPI and/or the editor(s). MDPI and/or the editor(s) disclaim responsibility for any injury to people or property resulting from any ideas, methods, instructions or products referred to in the content. |
© 2025 by the authors. Licensee MDPI, Basel, Switzerland. This article is an open access article distributed under the terms and conditions of the Creative Commons Attribution (CC BY) license (https://creativecommons.org/licenses/by/4.0/).