Article

CatBoost Improves Inversion Accuracy of Plant Water Status in Winter Wheat Using Ratio Vegetation Index

1
Institute of Quantitative Remote Sensing & Smart Agriculture, School of Surveying and Land Information Engineering, Henan Polytechnic University, Jiaozuo 454000, China
2
Institute of Farmland Irrigation, Chinese Academy of Agricultural Sciences, Key Laboratory of Crop Water Use and Regulation, Ministry of Agriculture and Rural Affairs, Xinxiang 453002, China
*
Author to whom correspondence should be addressed.
Appl. Sci. 2025, 15(21), 11363; https://doi.org/10.3390/app152111363
Submission received: 11 September 2025 / Revised: 13 October 2025 / Accepted: 20 October 2025 / Published: 23 October 2025
(This article belongs to the Special Issue Advanced Plant Biotechnology in Sustainable Agriculture—2nd Edition)

Abstract

The accurate monitoring of crop water status is critical for optimizing irrigation strategies in winter wheat. Compared with satellite remote sensing, unmanned aerial vehicle (UAV) technology offers superior spatial resolution, temporal flexibility, and controllable data acquisition, making it an ideal choice for the small-scale monitoring of crop water status. During 2023–2025, field experiments were conducted to predict crop water status using UAV images in the North China Plain (NCP). Thirteen vegetation indices were calculated and their correlations with observed crop water content (CWC) and equivalent water thickness (EWT) were analyzed. Four machine learning (ML) models, namely, random forest (RF), decision tree (DT), LightGBM, and CatBoost, were evaluated for their inversion accuracy with regard to CWC and EWT in the 2024–2025 growing season of winter wheat. The results show that the ratio vegetation index (RVI, NIR/R) exhibited the strongest correlation with CWC (R = 0.97) during critical growth stages. Among the ML models, CatBoost demonstrated superior performance, achieving R2 values of 0.992 (CWC) and 0.962 (EWT) in training datasets, with corresponding RMSE values of 0.012% and 0.1907 g cm−2, respectively. The model maintained robust performance in testing (R2 = 0.893 for CWC, and R2 = 0.961 for EWT), outperforming conventional approaches like RF and DT. High-resolution (5 cm) inversion maps successfully identified spatial variability in crop water status across experimental plots. The CatBoost-RVI framework proved particularly effective during the booting and flowering stages, providing reliable references for precision irrigation management in the NCP.

1. Introduction

Wheat is one of the world’s most essential staple crops, and is a vital food source for human beings, meeting approximately 35% of global cereal demand [1,2]. In China, wheat covers a planting area of 2333 × 104 ha, accounting for 18% of total arable areas [3]. The North China Plain (NCP) is one of China’s major granaries, and produces 55% of its domestic wheat yields [4]. The crop is typically sown in October and reaches maturity at the beginning of June the following year, completing its life cycle in approximately 300 d. Throughout its growth and development, water availability serves as a key limiting factor because winter wheat is particularly sensitive to drought conditions [5,6,7,8]. Specifically, the crop’s sensitivity to water stress varies significantly across different phenological stages [9].
In drought-prone regions, irrigation serves as the decisive factor for maintaining grain yields. Even in areas with relatively abundant precipitation, supplemental irrigation remains essential to compensate for uneven rainfall distribution [10,11]. Consequently, implementing precise irrigation strategies holds critical importance for ensuring food security. In China, agriculture accounts for 70% of total water use [12]. The NCP constitutes the most extensive groundwater overdraft area in China, whereas excessive crop water consumption and low water use efficiency (WUE) are major challenges for the agricultural sector in the region. This dual challenge of over-consumption and low WUE not only exacerbates groundwater depletion but also limits the potential for sustainable agricultural development [13]. This underscores the need for precision irrigation in the NCP. Compared with satellite remote sensing, unmanned aerial vehicle (UAV) offers significant advantages in spatial resolution, temporal flexibility, controllable data acquisition, and cost-effectiveness for small-scale, and detailed monitoring [14,15]. Therefore, most field experiments have employed UAV as a primary data collection method for the inversion of crop water status [6,7]. Usually, crop water content (CWC) is chosen to provide real-time insights into plant water status, while equivalent water thickness (EWT) serves as a key indicator for assessing drought stress and photosynthetic efficiency [16,17]. These two factors are both essential for precision irrigation management. Traditional methods for estimating CWC and EWT, such as destructive sampling, are labor-intensive, time-consuming, and lack spatial scalability. Remote sensing technologies, particularly UAVs equipped with multispectral sensors, have emerged as powerful alternatives, enabling non-destructive, and high-resolution monitoring [18,19]. By capturing multispectral data from crop canopies, the technology enables the calculation of vegetation indices (VIs) and the inversion of CWC and EWT [20].
Recently, the application of machine learning (ML) techniques has been popularized for the estimation of CWC and EWT through VIs. For example, in the NCP, random forest (RF), partial least squares regression (PLSR), and ridge regression have been employed to estimate CWC in winter wheat using UAV multispectral data, and the results indicate that RF well outperformed other models, with R2 = 0.80 [16]. Traore et al. (2021) compared DNN, support vector machines (SVMs), and boosted regression trees (BRTs), finding that DNN achieved the highest accuracy (R2 = 0.934) in predicting EWT [17]. Furthermore, Rahman et al. (2025) compared two machine learning models, MoistNetLite and MoistNetMax, with other models, finding that MoistNetLite achieved 87% accuracy with minimal computational overhead in predicting CWC levels [21]. To further improve model accuracy, feature transformation (FC), feature selection (FS), and machine learning (ML) techniques were incorporated to develop a non-destructive ML model for gravimetric moisture content (GMC) estimation, and achieved high inversion accuracy [22]. Furthermore, novel VIs were also compared and selected to improve the model performance. For instance, in the Huang-Huai-Hai Plain, the global vegetation moisture index (GVMI) was used as an input in ML models to estimate CWC in cereal crops. Results show that GVMI significantly improved model performance [23]. In the NCP, Li et al. (2025) incorporated novel spectral indices into a BRNN model with transfer learning to estimate crop moisture status [24]. Their innovative approach delivered robust CWC predictions for both winter wheat and summer maize in the region.
Despite the advances in ML models for predicting CWC and EWT, ensuring that they generalize across all winter wheat growth stages remains a key challenge in the NCP. Typically, VIs and ML models show significant performance variations between phenological phases, requiring stage-specific calibration for the accurate prediction of crop water status [16,17]. Additionally, ML algorithms have not been fully utilized to close the knowledge gap with regard to the correlations between VIs and CWC, as well as with regard to EWT. Because of this, developing an ML-based approach to precisely predict CWC and EWT using only VIs remains important. While ML offers significant benefits, it also comes with notable limitations. For instance, ML models may incorporate unnecessary input variables, which not only increases complexity but also introduces misleading insights about which factors truly influence model performance [25]. Therefore, it is essential to identify the optimal VIs best correlated with crop water status before applying ML algorithms. In this study, we hypothesized that ML models based on UAV-based multispectral VIs were able to accurately predict the crop water status of winter wheat in the NCP. The objective of the present study was to evaluate the feasibility of using different ML algorithms—including random forest (RF), decision trees, the light gradient boosting machine (LightGBM), and the categorical boosting algorithm (CatBoost)—to predict CWC and EWT in winter wheat across different growth stages, based on 13 relevant VIs.

2. Materials and Methods

2.1. Site Description

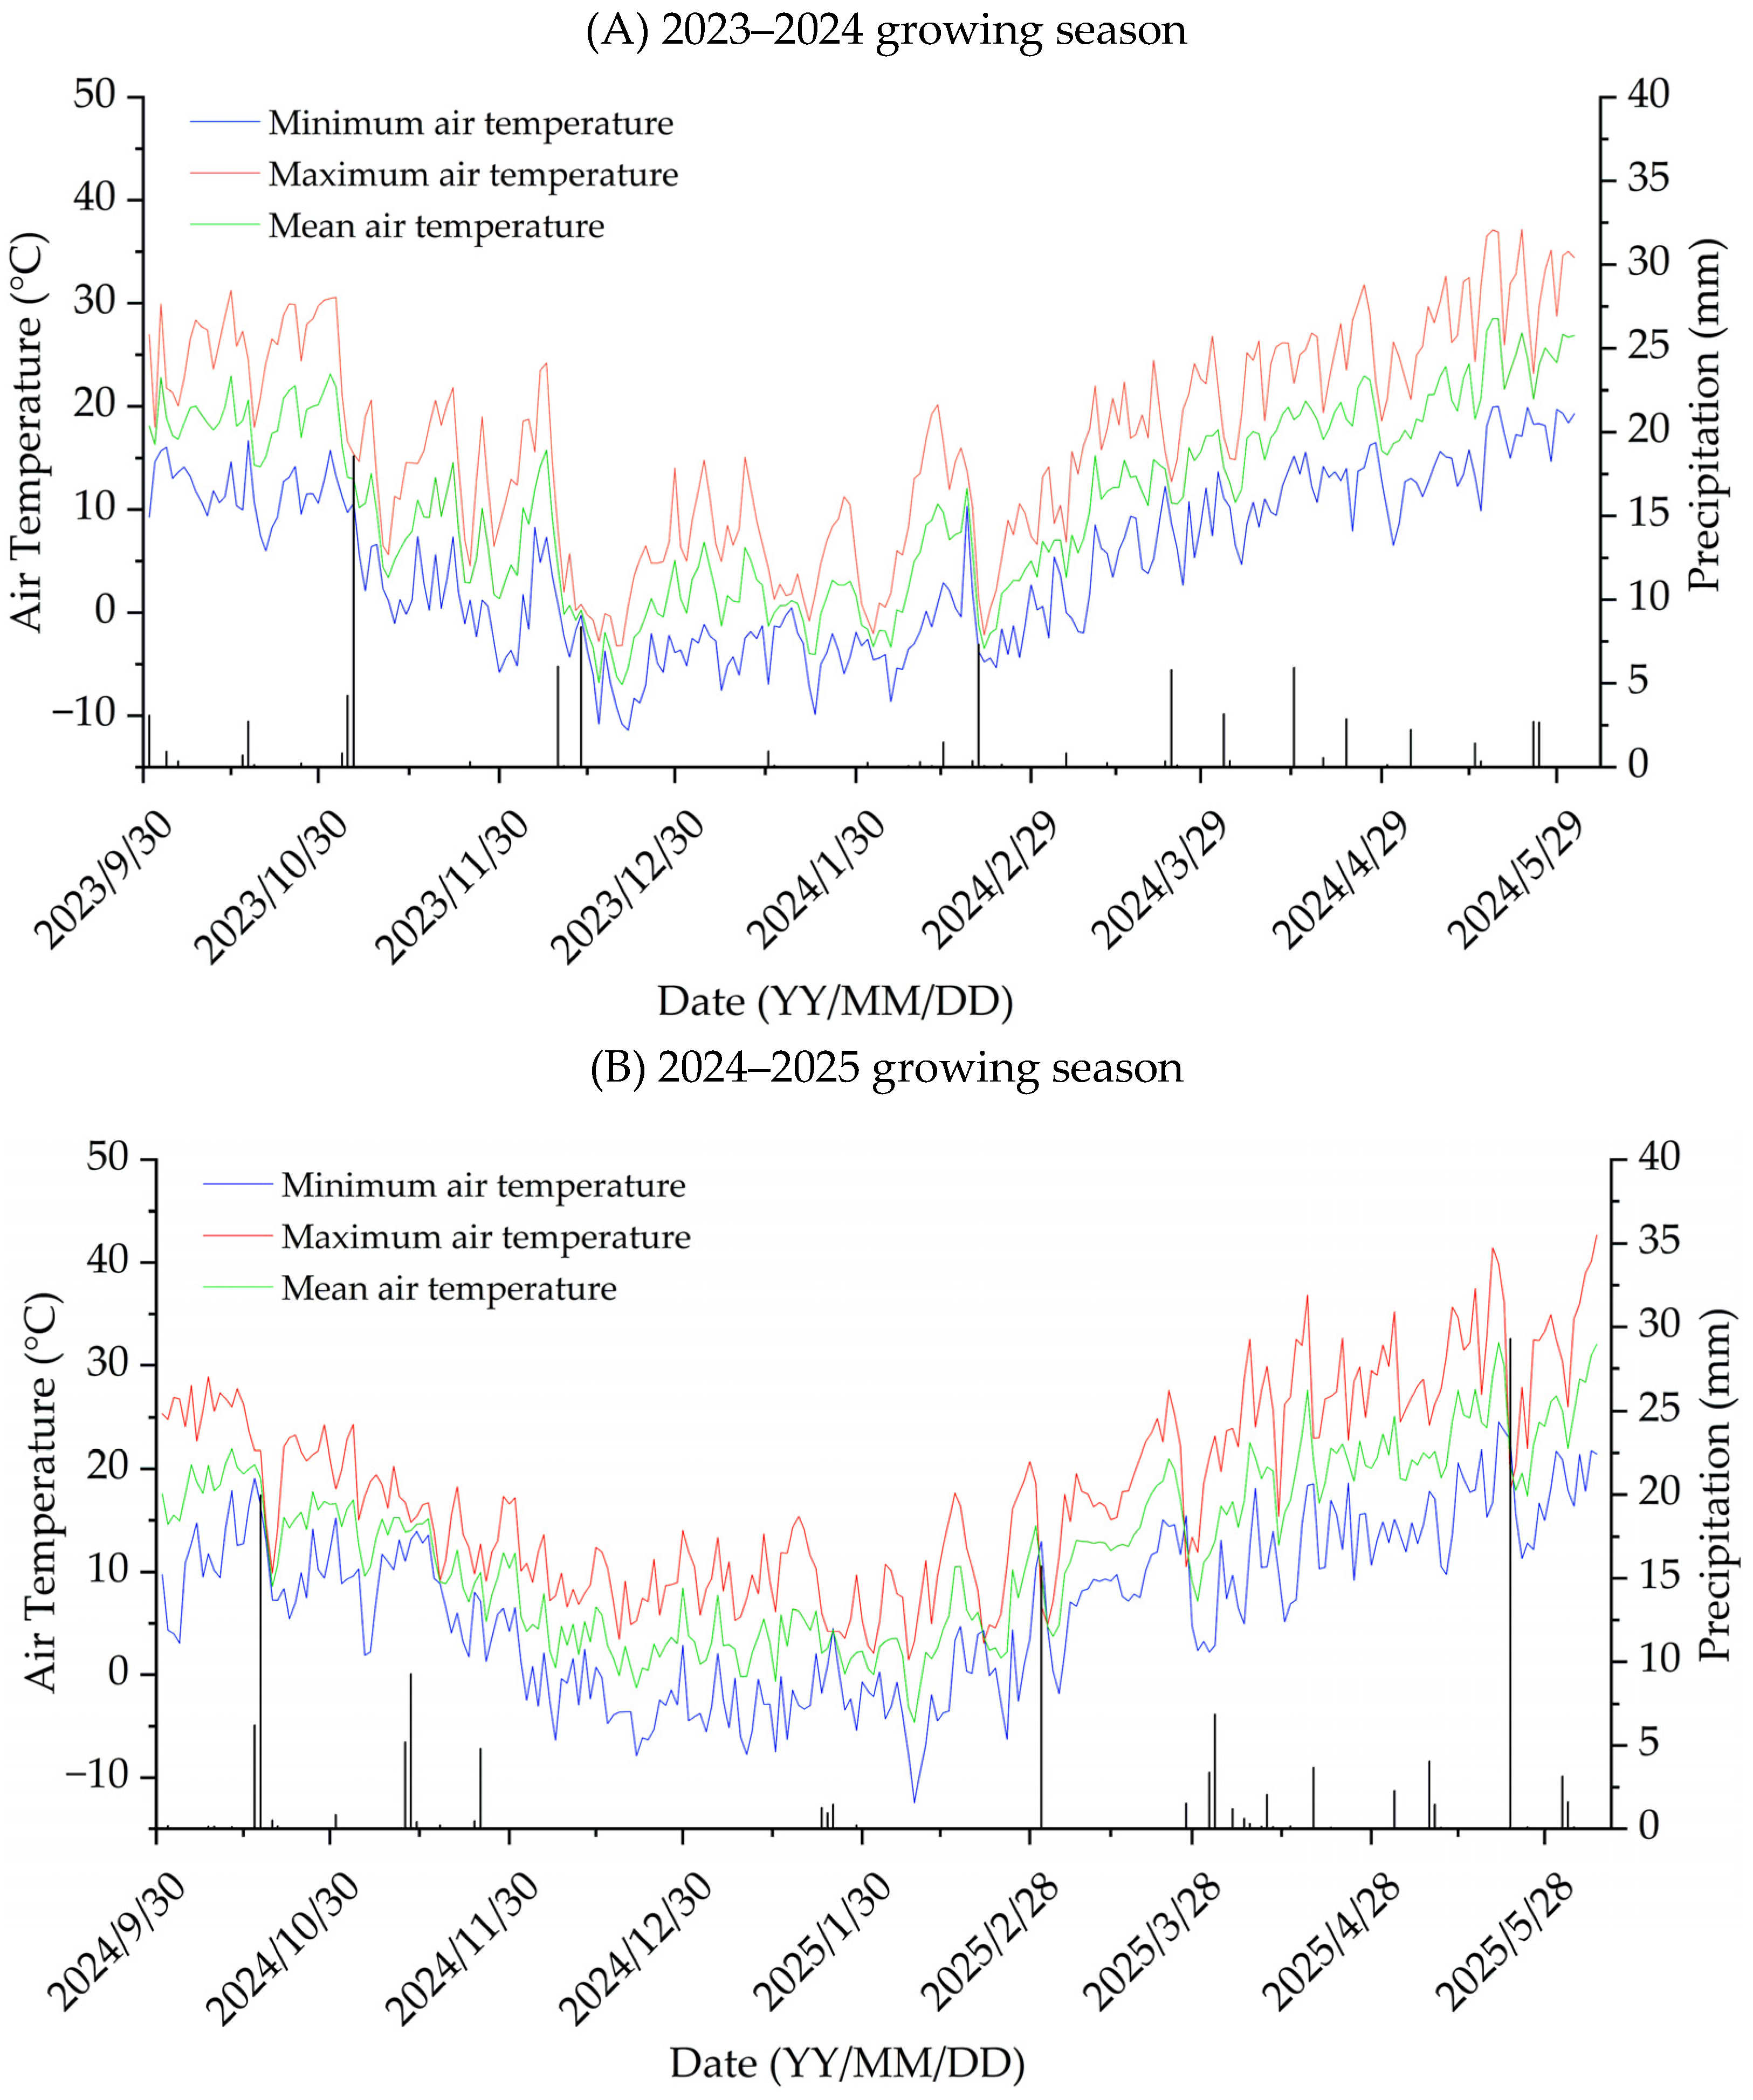
A two-season field experiment was conducted at the same location—the Xinxiang Comprehensive Experimental Station of the Chinese Academy of Agricultural Sciences (35°08′ N, 113°45′ E, 81 m a.s.l.) on the southern North China Plain (Figure 1)—using a winter wheat–summer maize rotation system under a continental temperate monsoon climate. The first season ran from October 2023 to June 2024, and the second from October 2024 to June 2025. Long-term climatic averages include a mean annual precipitation of approximately 590 mm (about one-third occurring during the wheat season), a mean annual temperature of 14.1 °C, annual evaporation of 1909 mm, 2408 h of sunshine, and a 201-day frost-free period. The soil is sandy loam, with groundwater irrigation sourced from wells. Notably, the 2024–2025 season experienced more extreme weather events, including a severe cold spell (−12.5 °C in February) and a heat wave (41.4 °C in May), with seasonal precipitation as low as 87.6 mm in 2023–2024 and 105.4 mm in 2024–2025 (Figure 2).

2.2. Experimental Design

Local popularized wheat seeds (c.v. Bainong 4199) were sown on 15 October 2023, and 20 October 2024, and harvested on 5 June 2024 and 2025. The seeding rate was 225 kg ha−1, with a sowing depth of 3–5 cm in both seasons. The row spacing of wheat plants was 18 cm, giving rise to a plant density of 4.5 × 10⁶ plants ha−1. The field experiment was designed with three irrigation (I) quantities (0, 30, 60 mm per irrigation event, respectively denoted as I0, I30, and I60) and three nitrogen (N) levels (0, 125 and 250 kg N ha−1 per growing season, respectively denoted as N0, N125, and N250). In total, nine treatments were arranged in an incomplete randomized block design with three replications. As a result, 27 plots were formed with an area of 120 m2 (10 m × 12 m) per plot. Aside from a uniform irrigation of 45 mm immediately after wheat sowing, no additional water was applied post-winter for the I0 treatment. In 2023–2024, three irrigation events were applied at the wintering (20 November 2023), jointing (20 March 2024), and flowering (21 April 2024) stages due to even precipitation distribution. In 2024–2025, five irrigation events were recorded at the wintering (25 November 2024), re-greening (20 February 2025), jointing (23 March 2025), flowering (19 April 2025), and grain-filling (16 May 2025) stages for I30 and I60 treatments. Different irrigation amounts were controlled using a flow meter (MIK-2000H Co., Ltd., Shanghai, China). The irrigation regime employed a micro-sprinkler system with a flow rate of 3.0 L hr−1. Phosphorus and potassium fertilizers were broadcast at rates of 90 kg P2O5 ha−1 and 80 kg K2O ha−1 as a single basal application. Calcium superphosphate and potash fertilizer were incorporated into the soil during plowing and prior to sowing. Nitrogen treatment adopted a split-application approach: 30% of total urea (46% of N) was applied as basal fertilizer across 0–40 cm soil layers before sowing, followed by three topdressings for the remaining 70% urea at the jointing, flowering, and grain-filling stages in a 6:3:1 ratio for both N125 and N250 treatments. All crops were managed using local government recommended practices, including uniform weeding, and pest control.

2.3. Data Collection

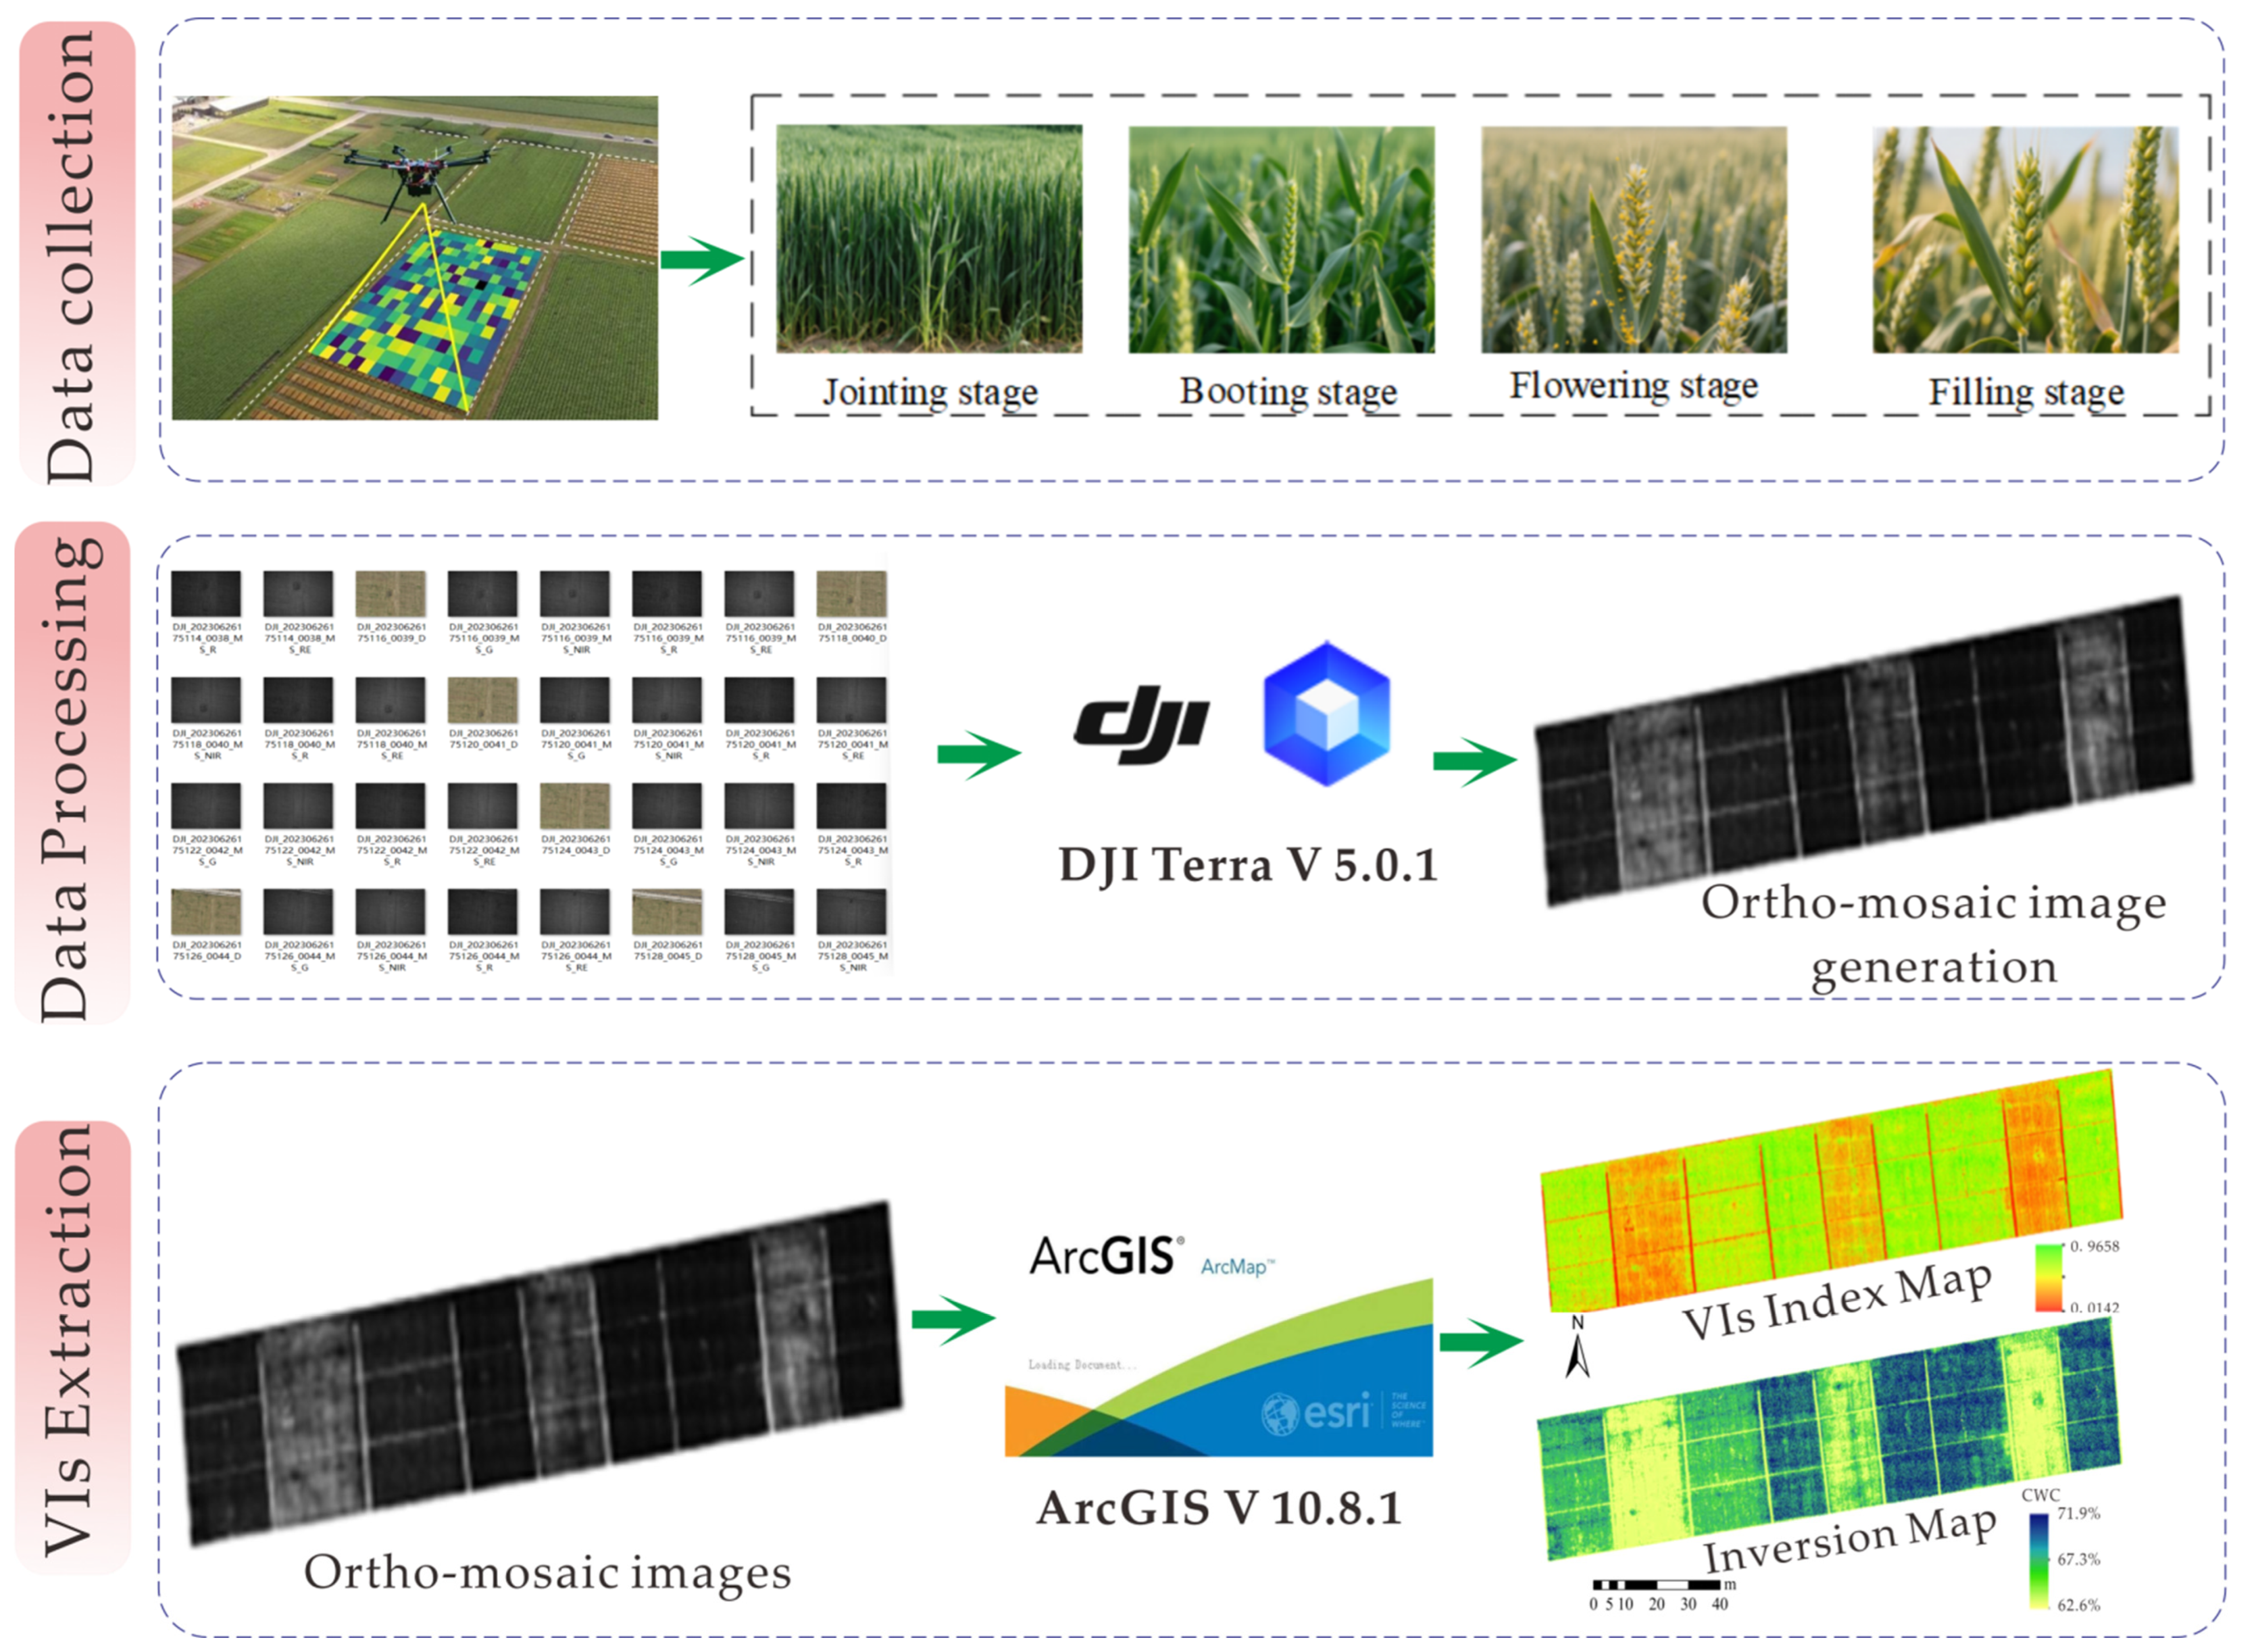
Data collection and processing during the 2023–2024 growing seasons have been described by Zhang et al. (2024) [16] for the same experimental location. During the 2024–2025 season, image acquisition was conducted using a DJI Mavic 3M UAV (DJI Technology Co., Ltd., Shenzhen, China) fitted with a multispectral camera. The take-off weight was 1.05 kg. The battery enabled 33 min of flight time per session. It had a maximum communication range of 5.0 km, and pre-programmed flight paths ensured full coverage of the study area. Multispectral images of wheat canopies were obtained during the key growth stages of winter wheat: the jointing (20 March 2025), booting (6 April 2025), flowering (17 April 2025), and filling (14 May 2025) stages (Figure 3). The built-in four-band camera was mounted on a pan-tilt stabilizer for smooth and high-quality captures. Its spectral bands included green (555 nm), red (660 nm), red-edge (720 nm), and near-infrared (840 nm), all with a 20 nm bandwidth and 8 nm resolution. Flights occurred between 11:00 and 14:00 under clear skies (solar altitude > 50°), with the lens fixed vertically downward at a 25 mm focal length. The UAV flew at an altitude of 30 m and flight speed of 5 m s−1, maintaining 85% longitudinal and 80% lateral overlap for a ground resolution of 4.77 cm/pixel. Calibration involved an optical intensity sensor for lighting correction and a fixed reflectance panel for radiometric accuracy. Sampling positions were recorded to extract the corresponding point reflectance values. These reflectance values were then correlated with the observed crop water content (CWC, %), and equivalent water thickness (EWT, g cm−2). Post-processing included image stitching in DJI Terra 5.0.1 (DJI Technology Co., Ltd., Shenzhen, China), band fusion and calibration in ENVI 5.6, and reflectance extraction at sample points using ArcMap 10.8.1.

2.4. Crop Water Status

2.4.1. Crop Water Content

During the critical growth stages of winter wheat, plant physiological parameters were measured in field plots by randomly selecting 20 representative plants per treatment to assess crop water content (CWC). Fresh weight was first measured with an electronic balance (0.01 g precision), followed by sample placement in breathable specimen bags for enzyme denaturation in a forced-air oven at 105 °C (30 min) [26], then drying at 75 °C until constant weight. The crop water content was calculated using the following formula [27]:
C W C = m 1 m 2 m 1 × 100 %
where CWC is crop water content (%), m1 is the fresh weight of plant samples (g), and m2 is the constant dry weight of samples after oven-drying (g).

2.4.2. Equivalent Water Thickness (EWT)

Equivalent water thickness (EWT) is a key biophysical parameter that quantifies the vertical depth of water distributed per unit leaf area (g cm−2 or mm), thus serving as a standardized measure for assessing crop water status across multi-scale remote sensing observations [28]. In this study, wheat leaves were collected during critical growth stages, and the leaf area was determined using the traditional coefficient method, in which meters were used to measure the maximum length and width of wheat leaves, with individual leaf area calculated using the cultivar-specific correction formula (Leaf area = length × width × 0.82) [29]. Total plant leaf area was derived by summing all individual leaf areas, and was then used for determining EWT. The calculation of EWT followed the following formula [17]:
E W T = F W D W ρ S l e a f
where FW is the fresh weight of the leaves (g), DW is the dry weight of the leaves (g), Sleaf is the leaf area per plant (cm2), and ρ is the density of water (1.0 g/cm3), yielding EWT in g cm−2 after unit conversion.

2.5. Vegetation Index Calculation

The captured images were processed by extracting regions of interest (ROIs) in ArcMap 10.8.1. The clipped images were imported into ENVI 5.6 for further analysis. Thirteen vegetation indices were calculated using ENVI 5.6, including the soil-adjusted vegetation index (SAVI), the red-edge model (R-M), the green-optimized soil-adjusted vegetation index (GOSAVI), the red-edge-optimized soil-adjusted vegetation index (REOSAVI), the ratio vegetation index (RVI), the difference vegetation index (DVI), the triangular vegetation index (TVI), the nitrogen reflectance index (NRI), the green normalized difference vegetation index (GNDVI), the leaf chlorophyll index (LCI), the normalized difference red-edge index (NDRE), the normalized difference vegetation index (NDVI), and the optimized soil-adjusted vegetation index (OSAVI) (Table 1). By employing a multi-index synergistic analysis strategy, the approach effectively reduced environmental noise—such as atmospheric scattering, soil background reflectance, and water absorption—on spectral signals, significantly improving the prediction accuracy and stability of inversion models based on the VIs.

2.6. Machine Learning Algorithms

The experiment had a distinct and complementary focus over two consecutive winter wheat growing seasons (2023–2024 and 2024–2025). During the 2023–2024 season, the primary objective was to conduct a broad-spectrum screening of machine learning (ML) algorithms and vegetation indices (VIs). The foundational study in 2023–2024 compared five different ML models (namely, multiple linear regression (MLR), random forest (RF), ridge regression, ElasticNet regression, and partial least squares regression (PLSR)) and thirteen VIs to identify the most promising combinations for CWC inversion [16]. The random forest (RF) algorithm paired with the normalized red-edge index (NDRE) was identified as the best performer for that season’s dataset. Building on the previous year’s findings, the objective was to refine and advance the modeling approach during the 2024–2025 growing season. Thus, the present study focused on evaluating more sophisticated, state-of-the-art gradient boosting algorithms (CatBoost, and LightGBM) against the previously best-performing model (RF) and a baseline model (DT). Concurrently, a deeper analysis of VIs was conducted in 2024–2025. Therefore, in order to avoid a convoluted and less focused narrative in the paper, the decision was made to present the results of the 2024–2025 season in a separate study. Moreover, the 2024–2025 experiment represented a significant iteration and improvement over the previous methodology. After a comprehensive assessment of currently popular ML models, four machine learning (ML) models were finally chosen for CWC and EWT prediction in this study, namely, random forest (RF), decision trees (DT), light gradient boosting machine (LightGBM), and categorical boosting algorithm (CatBoost). Each model was trained and tested to evaluate its performance in predicting CWC and EWT.

2.6.1. Random Forest (RF)

The random forest (RF) algorithm proved particularly effective in predicting CWC and EWT, as it captured complex non-linear relationships and feature interactions [43]. As an ensemble learning method, RF constructed numerous decision trees during training, then aggregated their predictions through either majority voting (for classification) or averaging (for regression). This architecture conferred notable advantages, including inherent resistance to overfitting and strong performance with high-dimensional datasets [44]. The optimal random forest parameters identified in this study were as follows: min_samples_split = 2, min_samples_leaf = 4, max_features = 0.5, and max_depth = 8.

2.6.2. Decision Trees (DTs)

Decision trees are widely used supervised ML models that make predictions by recursively splitting data into branches based on feature thresholds, leading to decision nodes that predict crop water status [45]. A DT model’s structure is like a hierarchical flowchart, where each internal node represents a feature-based decision, each branch an outcome, and each leaf node a final prediction. The model is compatible with both numerical and categorical data without strict preprocessing. It also does not require strict parametric assumptions, and is computationally efficient during inference [25]. The optimal decision tree parameters for this study were as follows: max_features = None, min_samples_leaf = 1, and min_samples_split = 20.

2.6.3. Light Gradient Boosting Machine (LightGBM)

The light gradient boosting machine (LightGBM) is a high performance gradient boosting framework optimized for speed and scalability, leveraging innovations like leaf-wise tree growth, gradient-based one-side sampling (GOSS), and exclusive feature bundling (EFB) to handle large-scale datasets with minimal memory usage [46]. Unlike traditional boosting algorithms that build trees level-by-level, LightGBM expands nodes where splits yield the highest loss reduction, accelerating convergence while maintaining accuracy. Its histogram-based approach discretizes continuous features into bins, reducing computational overhead, and it supports categorical variables without extensive preprocessing. This means that LightGBM outperforms many ML models in training speed and resource efficiency [47]. The optimal LightGBM parameters identified in this study were as follows: reg_alpha = 0.1, num_leaves = 15, n_estimators = 100, min_child_samples = 5, max_depth = 5, and learning_rate = 0.05.

2.6.4. Categorical Boosting Algorithm (CatBoost)

The categorical boosting algorithm (CatBoost) is a gradient-boosting algorithm designed to handle categorical features through ordered target encoding and ordered boosting, which prevent target leakage and improve stability [48]. Unlike conventional models that necessitate manual one-hot encoding, CatBoost natively handles categorical variables during model training, significantly simplifying dataset preprocessing workflows. It also incorporates symmetric tree structures and GPU acceleration, balancing speed and accuracy even with a default hyperparameter. Unlike many other ML models, CatBoost minimizes overfitting risks and manages mixed data types (numeric + categorical) efficiently, making it ready to use with almost no preprocessing [49]. The optimal CatBoost parameters for this study were as follows: learning_rate = 0.05, l2_leaf_reg = 5, iterations = 300, depth = 4, and border_count = 128.
In addition to the optimization of model parameters, the selection of the four ML models was also mainly due to the core strength of the algorithms in a powerful combination of practicality, robustness, and efficiency. As the selected models were all based on decision trees, they inherited key advantages like robustness and interpretability [27]. Their complementary strengths ensured that the combination of VIs and ML algorithms can address a wide range of potential modeling challenges [47,48,49].

2.7. Model Evaluation

To rigorously evaluate the predictive capability of the implemented models, a multifaceted assessment was employed, incorporating three key statistical indicators: the coefficient of determination (R2), root mean square error (RMSE), and relative prediction deviation (RPD). These evaluation metrics collectively enabled a comprehensive quantification of model performance by comparing the predicted CWC and EWT values and field observations. Calculated using Equation (3), the R2 metric provided valuable insight by quantifying the proportion of observable variance in the measured CWC and EWT values.
R 2 = i = 1 n ( x p r e x o b s ) 2 / i = 1 n ( x p r e x ¯ o b s ) 2
where R2 is root mean square error; xpre and xobs are predicted and observed CWC and EWT values, respectively; x ¯ o b s is the average observed values; and n is the number of values evaluated.
The RMSE was used to investigate the differences between predicted and observed CWC and EWT values and was calculated using Equation (4), as follows:
R M S E = i = 1 n x p r e x o b s 2 / n
where RMSE is root mean square error; xpre and xobs are the corresponding CWC and EWT values estimated based on model predictions and field observations, respectively; and n is the sample number. The smaller the RMSE values, the more accurate the model prediction data turned out to be.
The RPD was used to indicate the reliability of model prediction data and was calculated using Equation (5), as follows:
R P D = S T D E V ( x obs ) / R M S E
where RPD is relative prediction deviation; STDEV is the standard deviation of observed CWC and EWT values; RMSE is root mean square error; and xobs is observed CWC and EWT values. RPD ≥ 2.0 indicated predictions were reliable; 1.4 < RPD < 2.0 meant the data were feasible but needed to be improved; and RPD ≤ 1.4 indicated the data were unreliable [16].

2.8. Model Validation and Overfitting Prevention

This study employed leave-one-out cross-validation (LOOCV) for model validation. This is a method of cross-validation particularly well-suited for small datasets. In LOOCV, a single observation was retained as the test set, while all remaining observations were used for training. This process iterated until every sample had served as the test set. This approach maximized data utilization for training, provided an almost unbiased estimate of model performance, and mitigated the randomness inherent in a single train-test split, thereby offering a robust assessment of the model’s predictive accuracy on this specific dataset. However, it is important to note that, while LOOCV confirmed the model’s robustness within the context of the available data, its generalizability to other environmental conditions remained constrained until additional years of data were examined. The broader predictive utility of the identified ML models can only be established through successful validation against multi-year datasets.
To prevent the risk of overfitting, data inspection was first carried out before raw data were applied to ML models. Following this, data cleaning and augmentation were performed by handling missing values and outliers. Subsequently, model complexity was addressed by selecting simpler architectures, applying regularization, and adjusting structural parameters. Finally, training procedures and ensemble methods were refined to improve model performance.

2.9. Statistical Analysis

Pearson’s correlation analysis was systematically implemented to quantify the strength of linear associations between various vegetation indices and CWC or EWT values across critical phenological phases—specifically jointing, booting, flowering, and grain filling—in winter wheat (Triticum aestivum L.). The computational procedure, executed through Python 3.10, generated a quantitative correlation matrix wherein coefficient magnitudes directly corresponded to relationship strength.

3. Results

3.1. Correlation Between CWC and Vegetation Indices

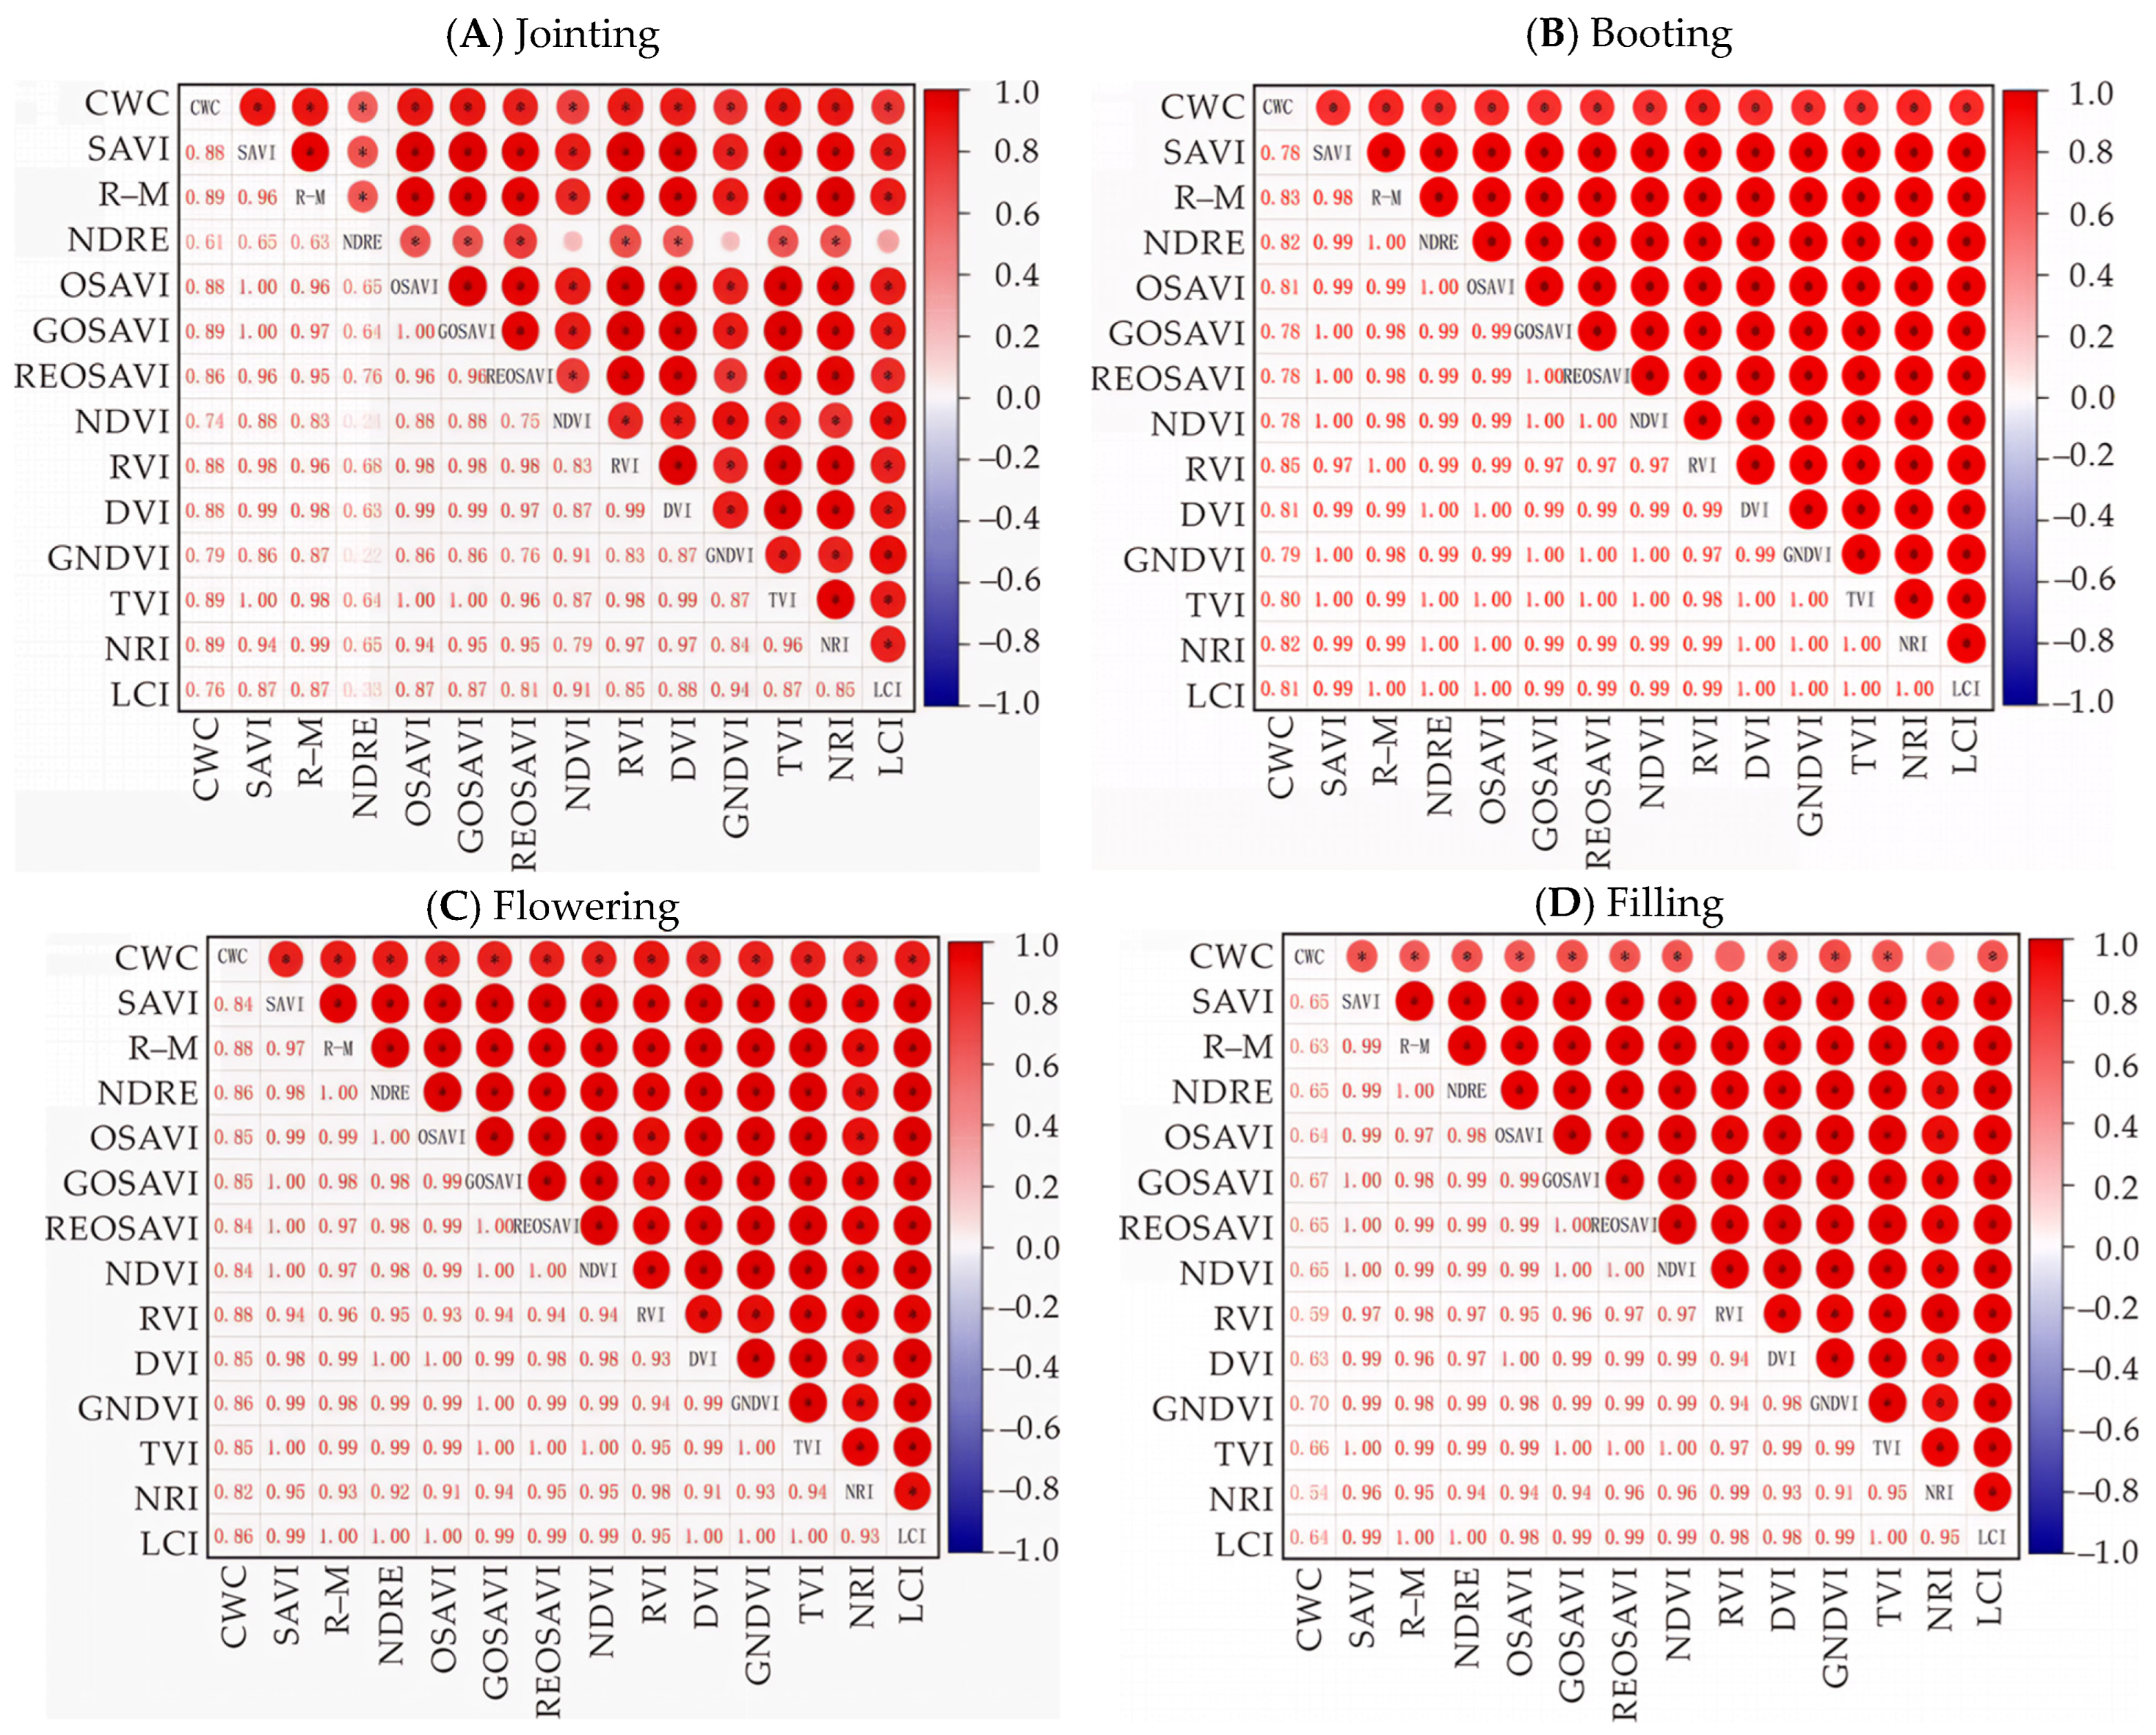
A Pearson correlation analysis was conducted between thirteen vegetation indices and crop water content (CWC, %) across critical growth stages of winter wheat (Figure 4). The results indicated that the red-edge model (R-M), green-optimized soil-adjusted vegetation index (GOSAVI), triangular vegetation index (TVI), and nitrogen reflectance index (NRI) exhibited the strongest correlation (R = 0.89) with CWC at the jointing stage, demonstrating their effectiveness in monitoring crop water status during this developmental phase. During booting, the ratio vegetation index (RVI) showed the highest sensitivity to water content variations (R = 0.85), confirming its reliability during peak growth period. The flowering stage was best characterized by RVI and R-M indices (R = 0.88), while the green normalized difference vegetation index (GNDVI) emerged as the most robust indicator (R = 0.70) for water content assessment during the grain-filling stage.

3.2. Correlation Between EWT and Vegetation Indices

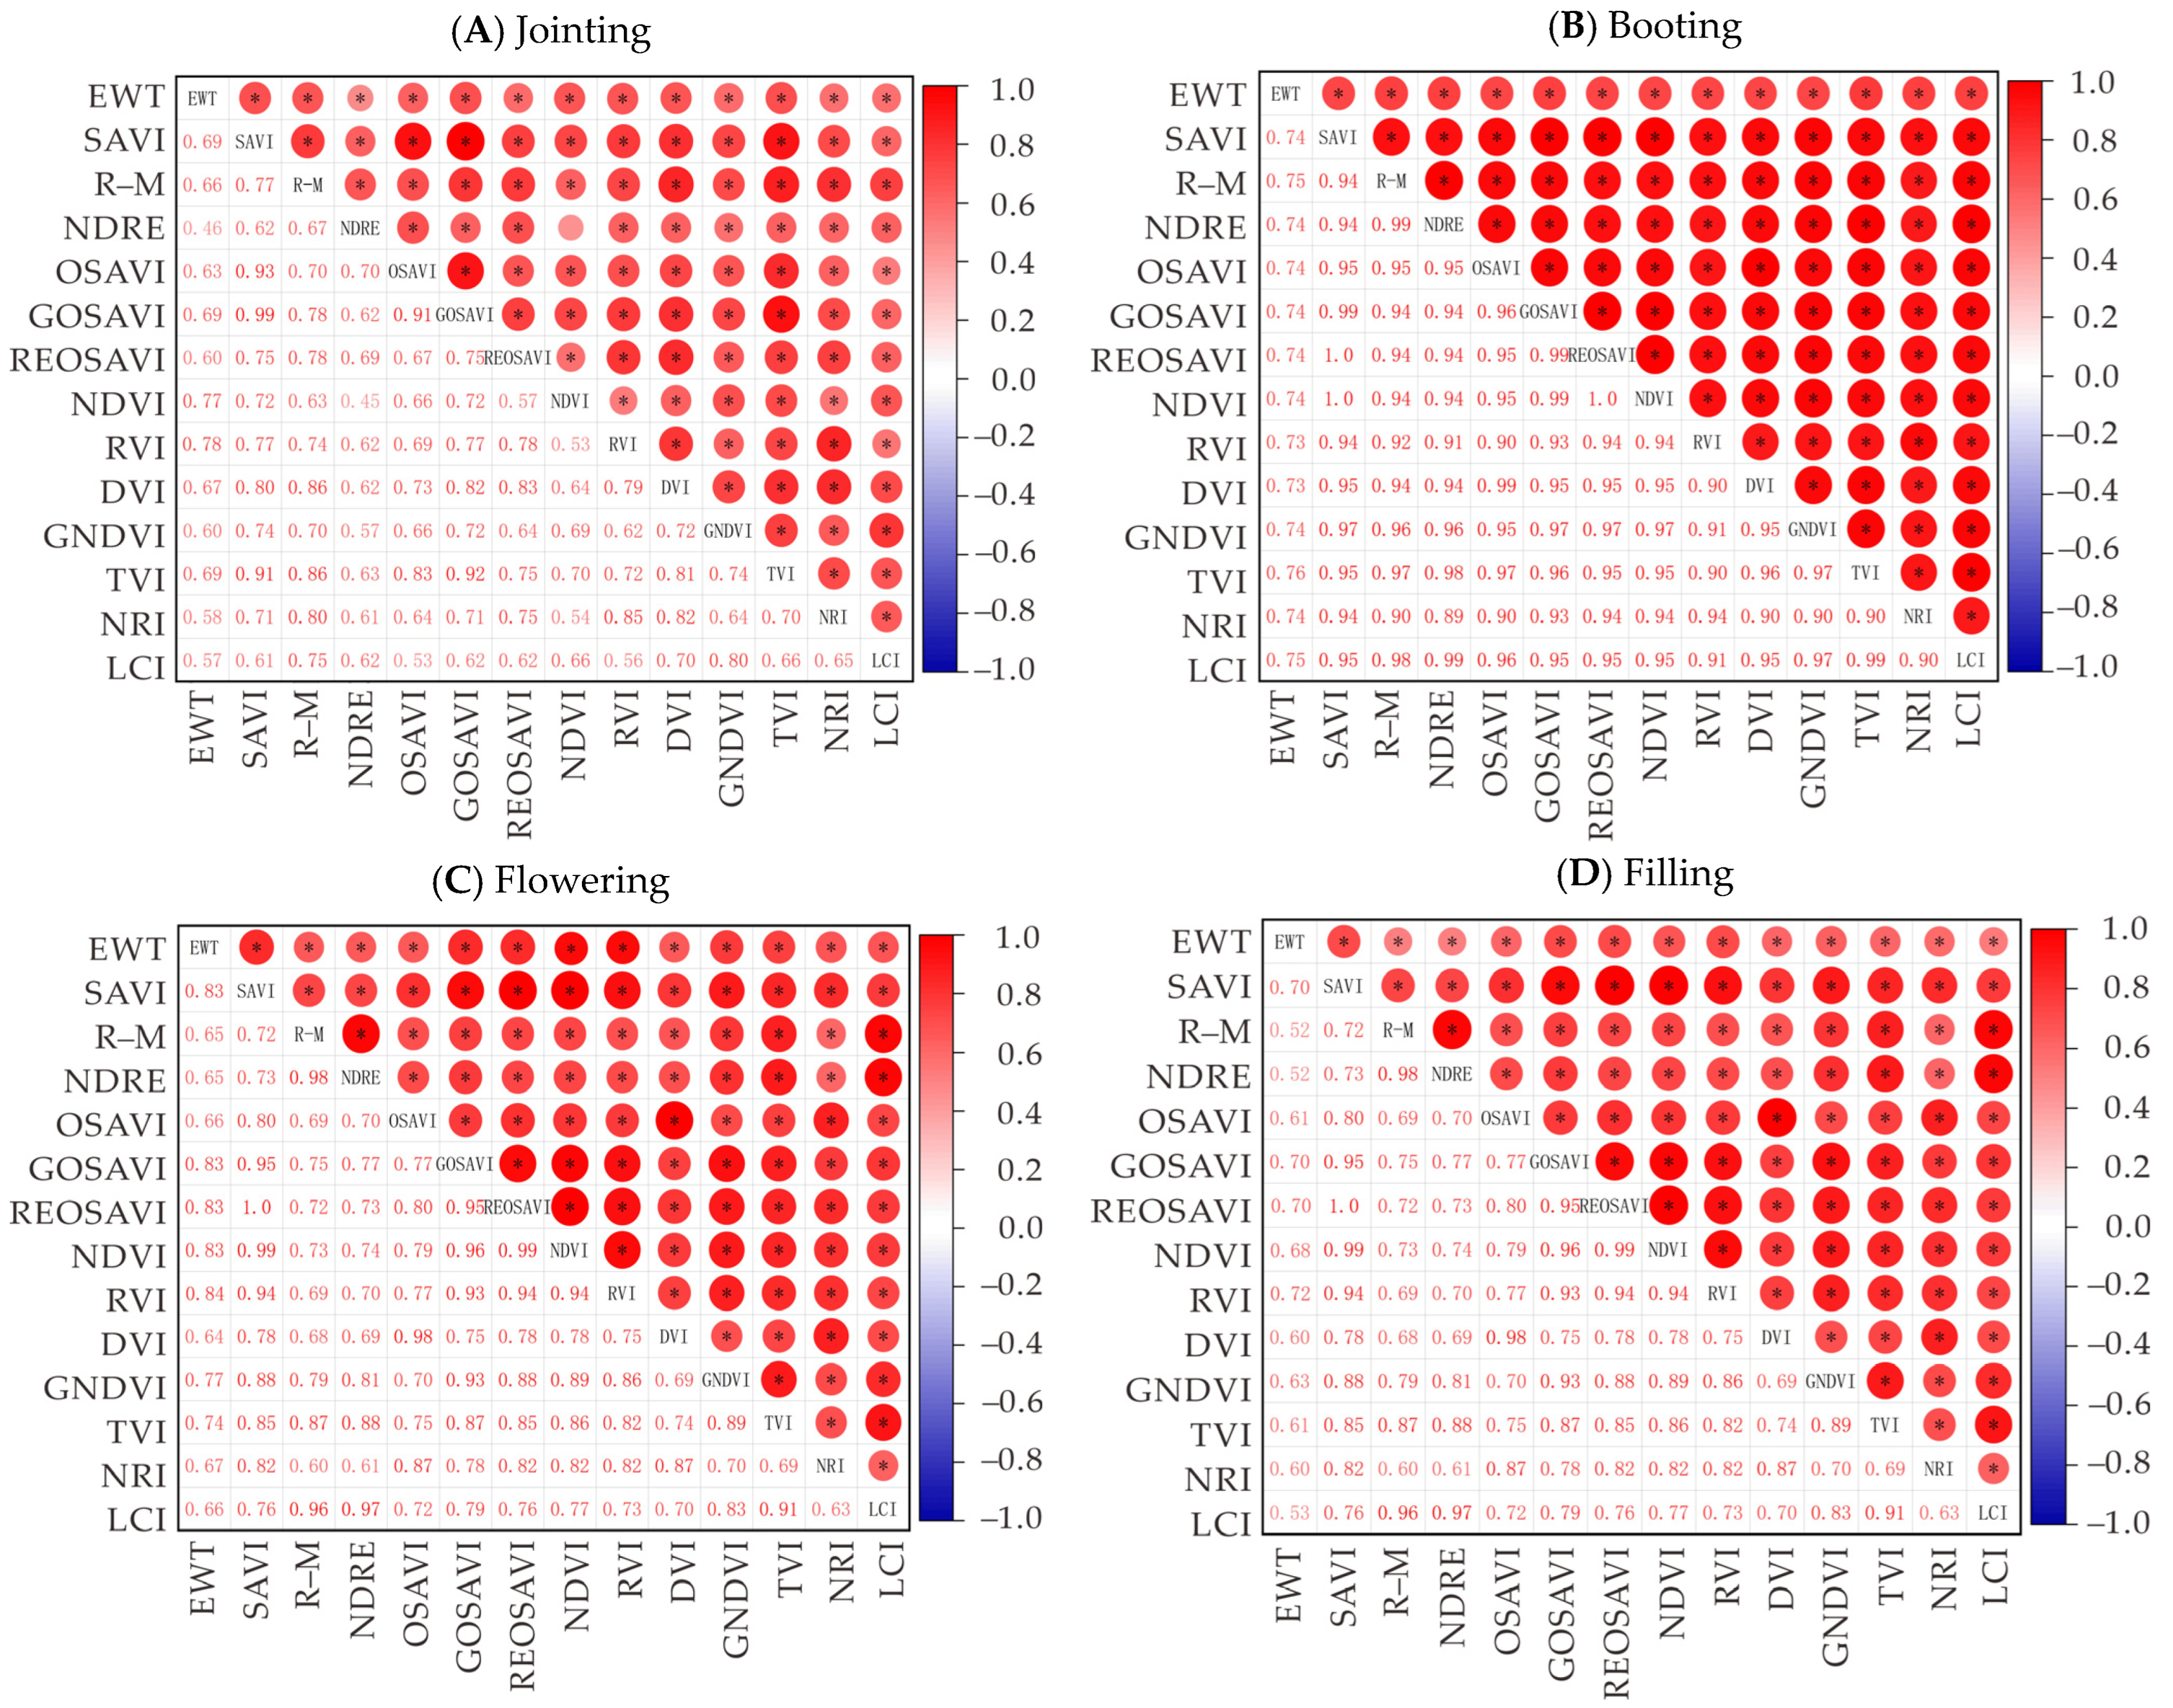
Correlation coefficients (R) between VIs and EWT (g cm−2) varied across different growth stages (Figure 5). During the jointing stage, RVI showed the strongest relationships with EWT (R = 0.78), followed by NDVI (R = 0.77). During booting, though TVI emerged as the top performer (R = 0.76), other VIs also had a similar correlation with R = 0.73–0.75. The flowering stage marked a shift, where RVI showed the highest correlation (R = 0.84), followed by SAVI, GOSAVI, REOSAVI, and NDVI (R = 0.83). Similarly, RVI had the highest correlation with EWT (R = 0.72), followed by SAVI, GOSAVI, and REOSAVI (R = 0.70) during the grain-filling stage. Our results confirm that VIs’ performance highly varied among growth stages. Generally, R values were highest at the flowering stages, intermediate at the jointing and booting stages, and least at the grain-filling stage. Therefore, the flowering stage was selected for EWT inversion.

3.3. Comparison of Vegetation Indices at Flowering Stage

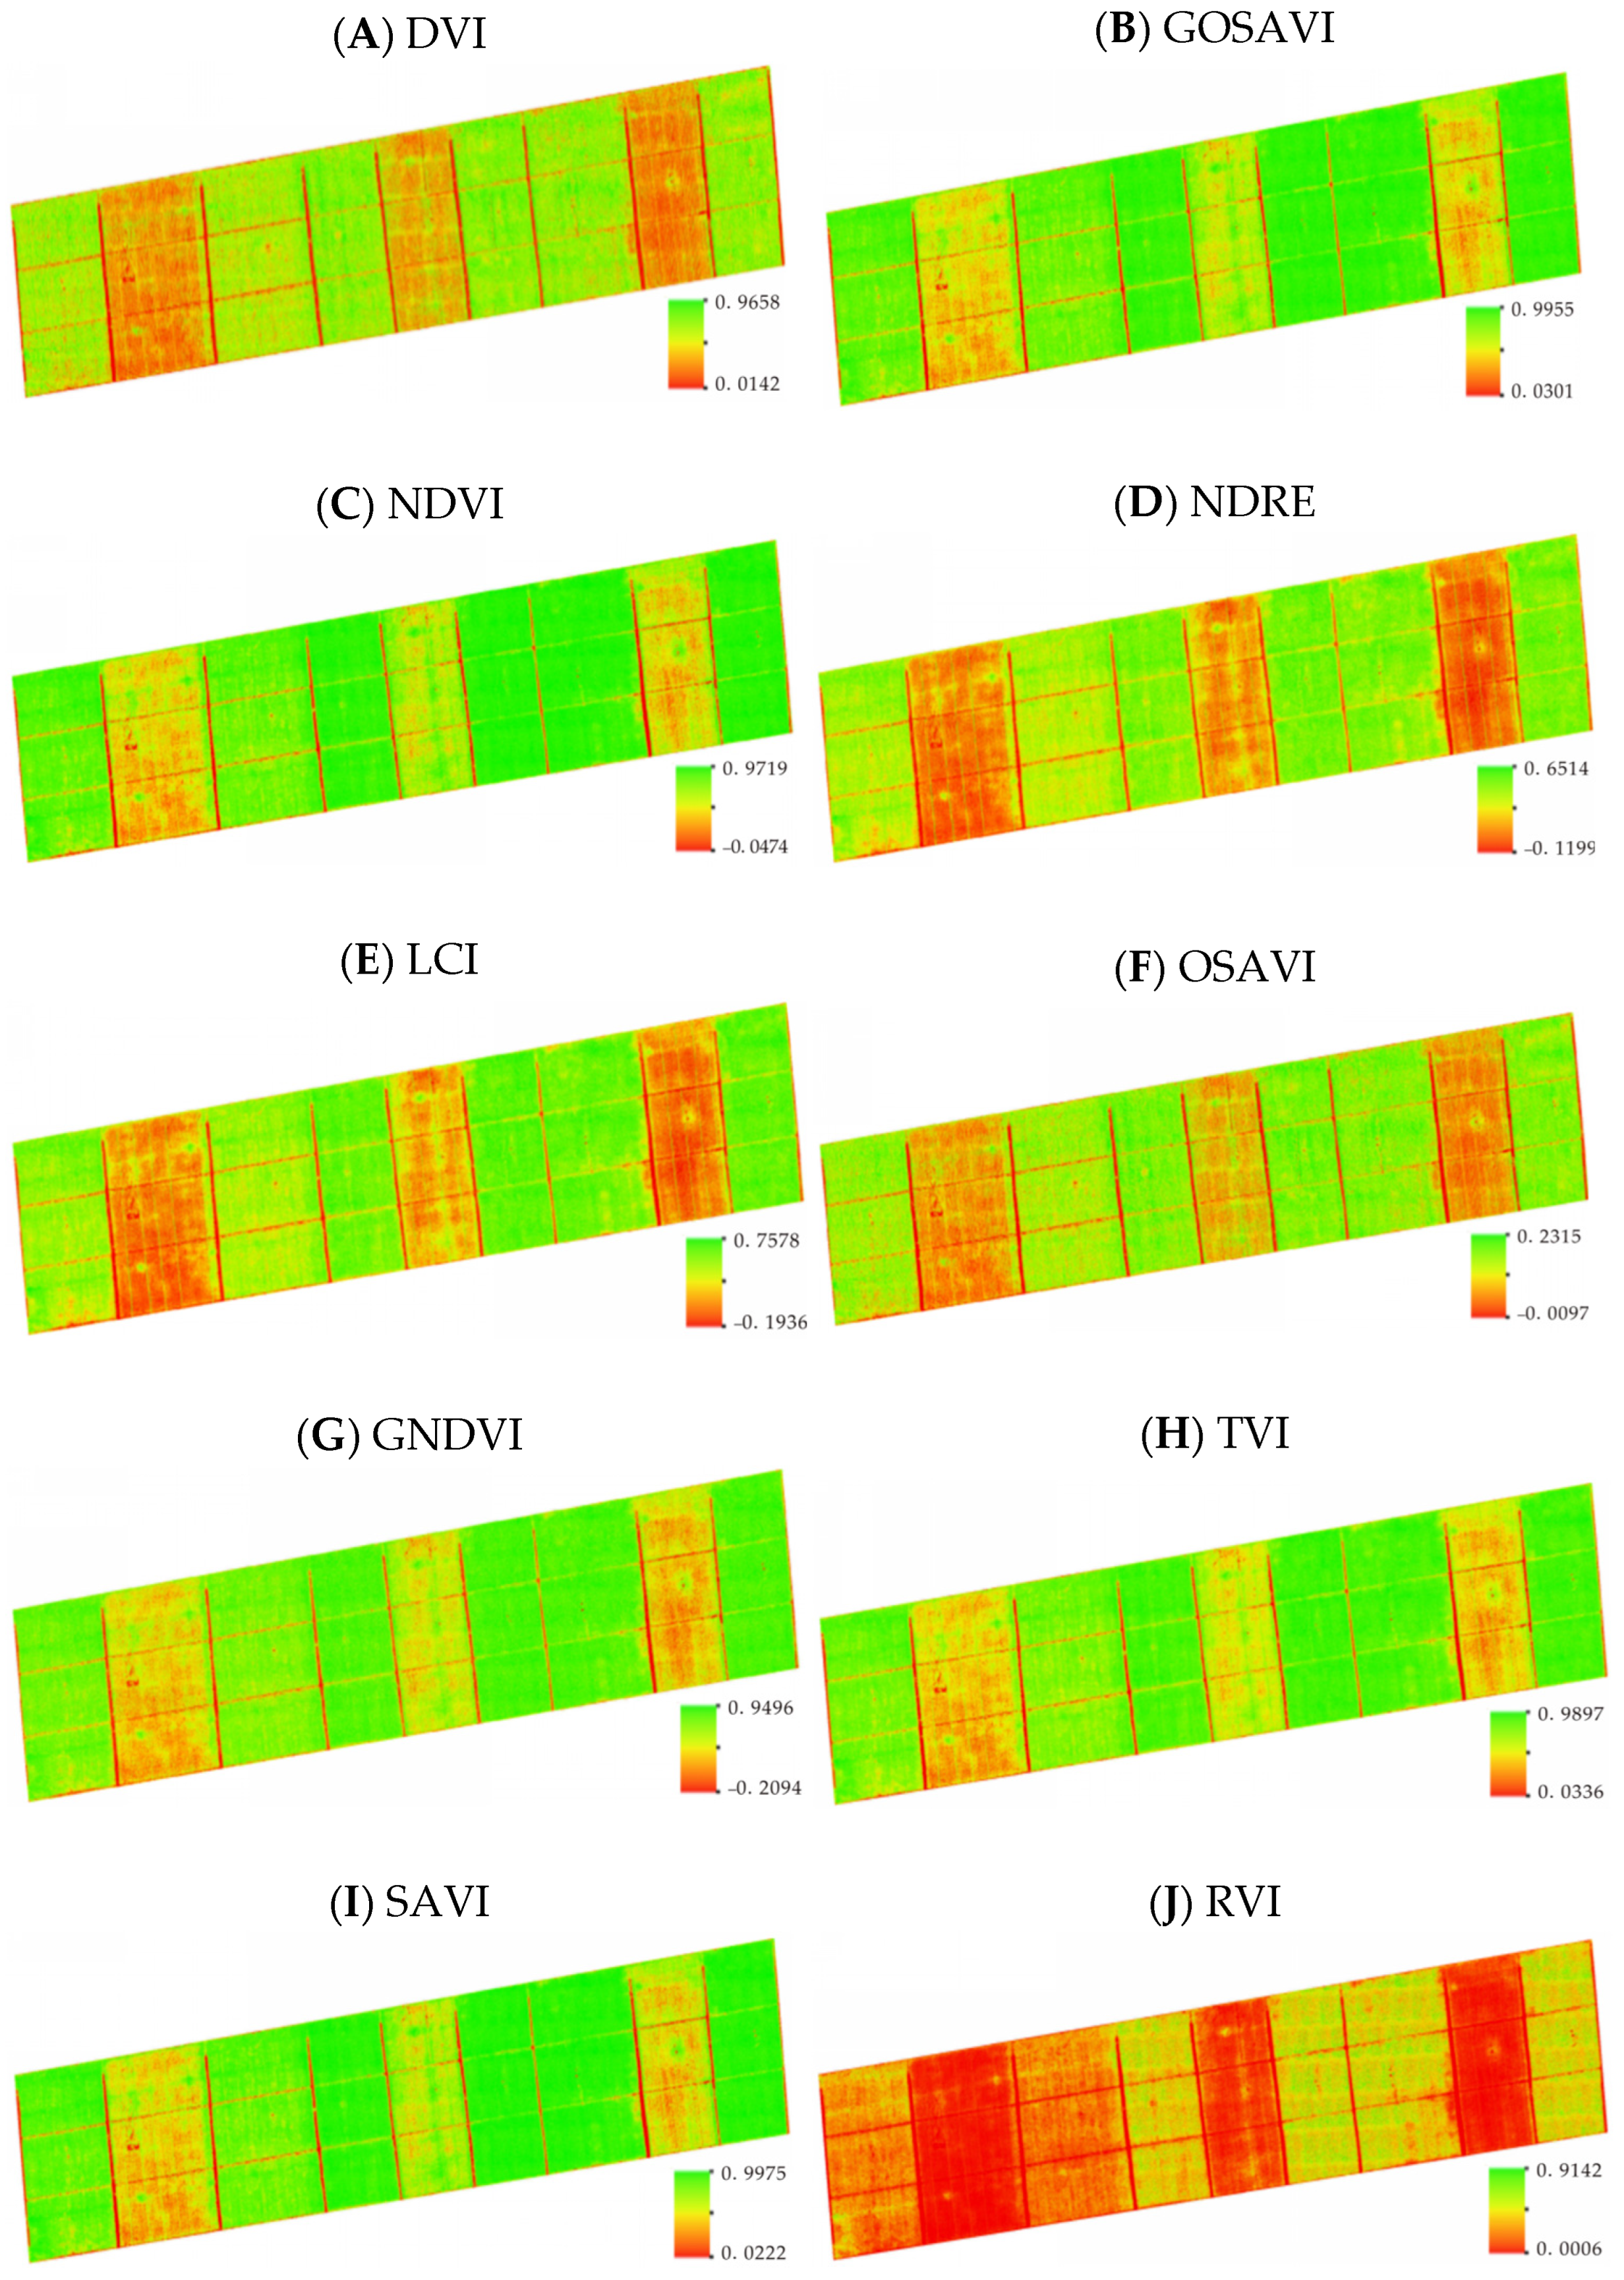
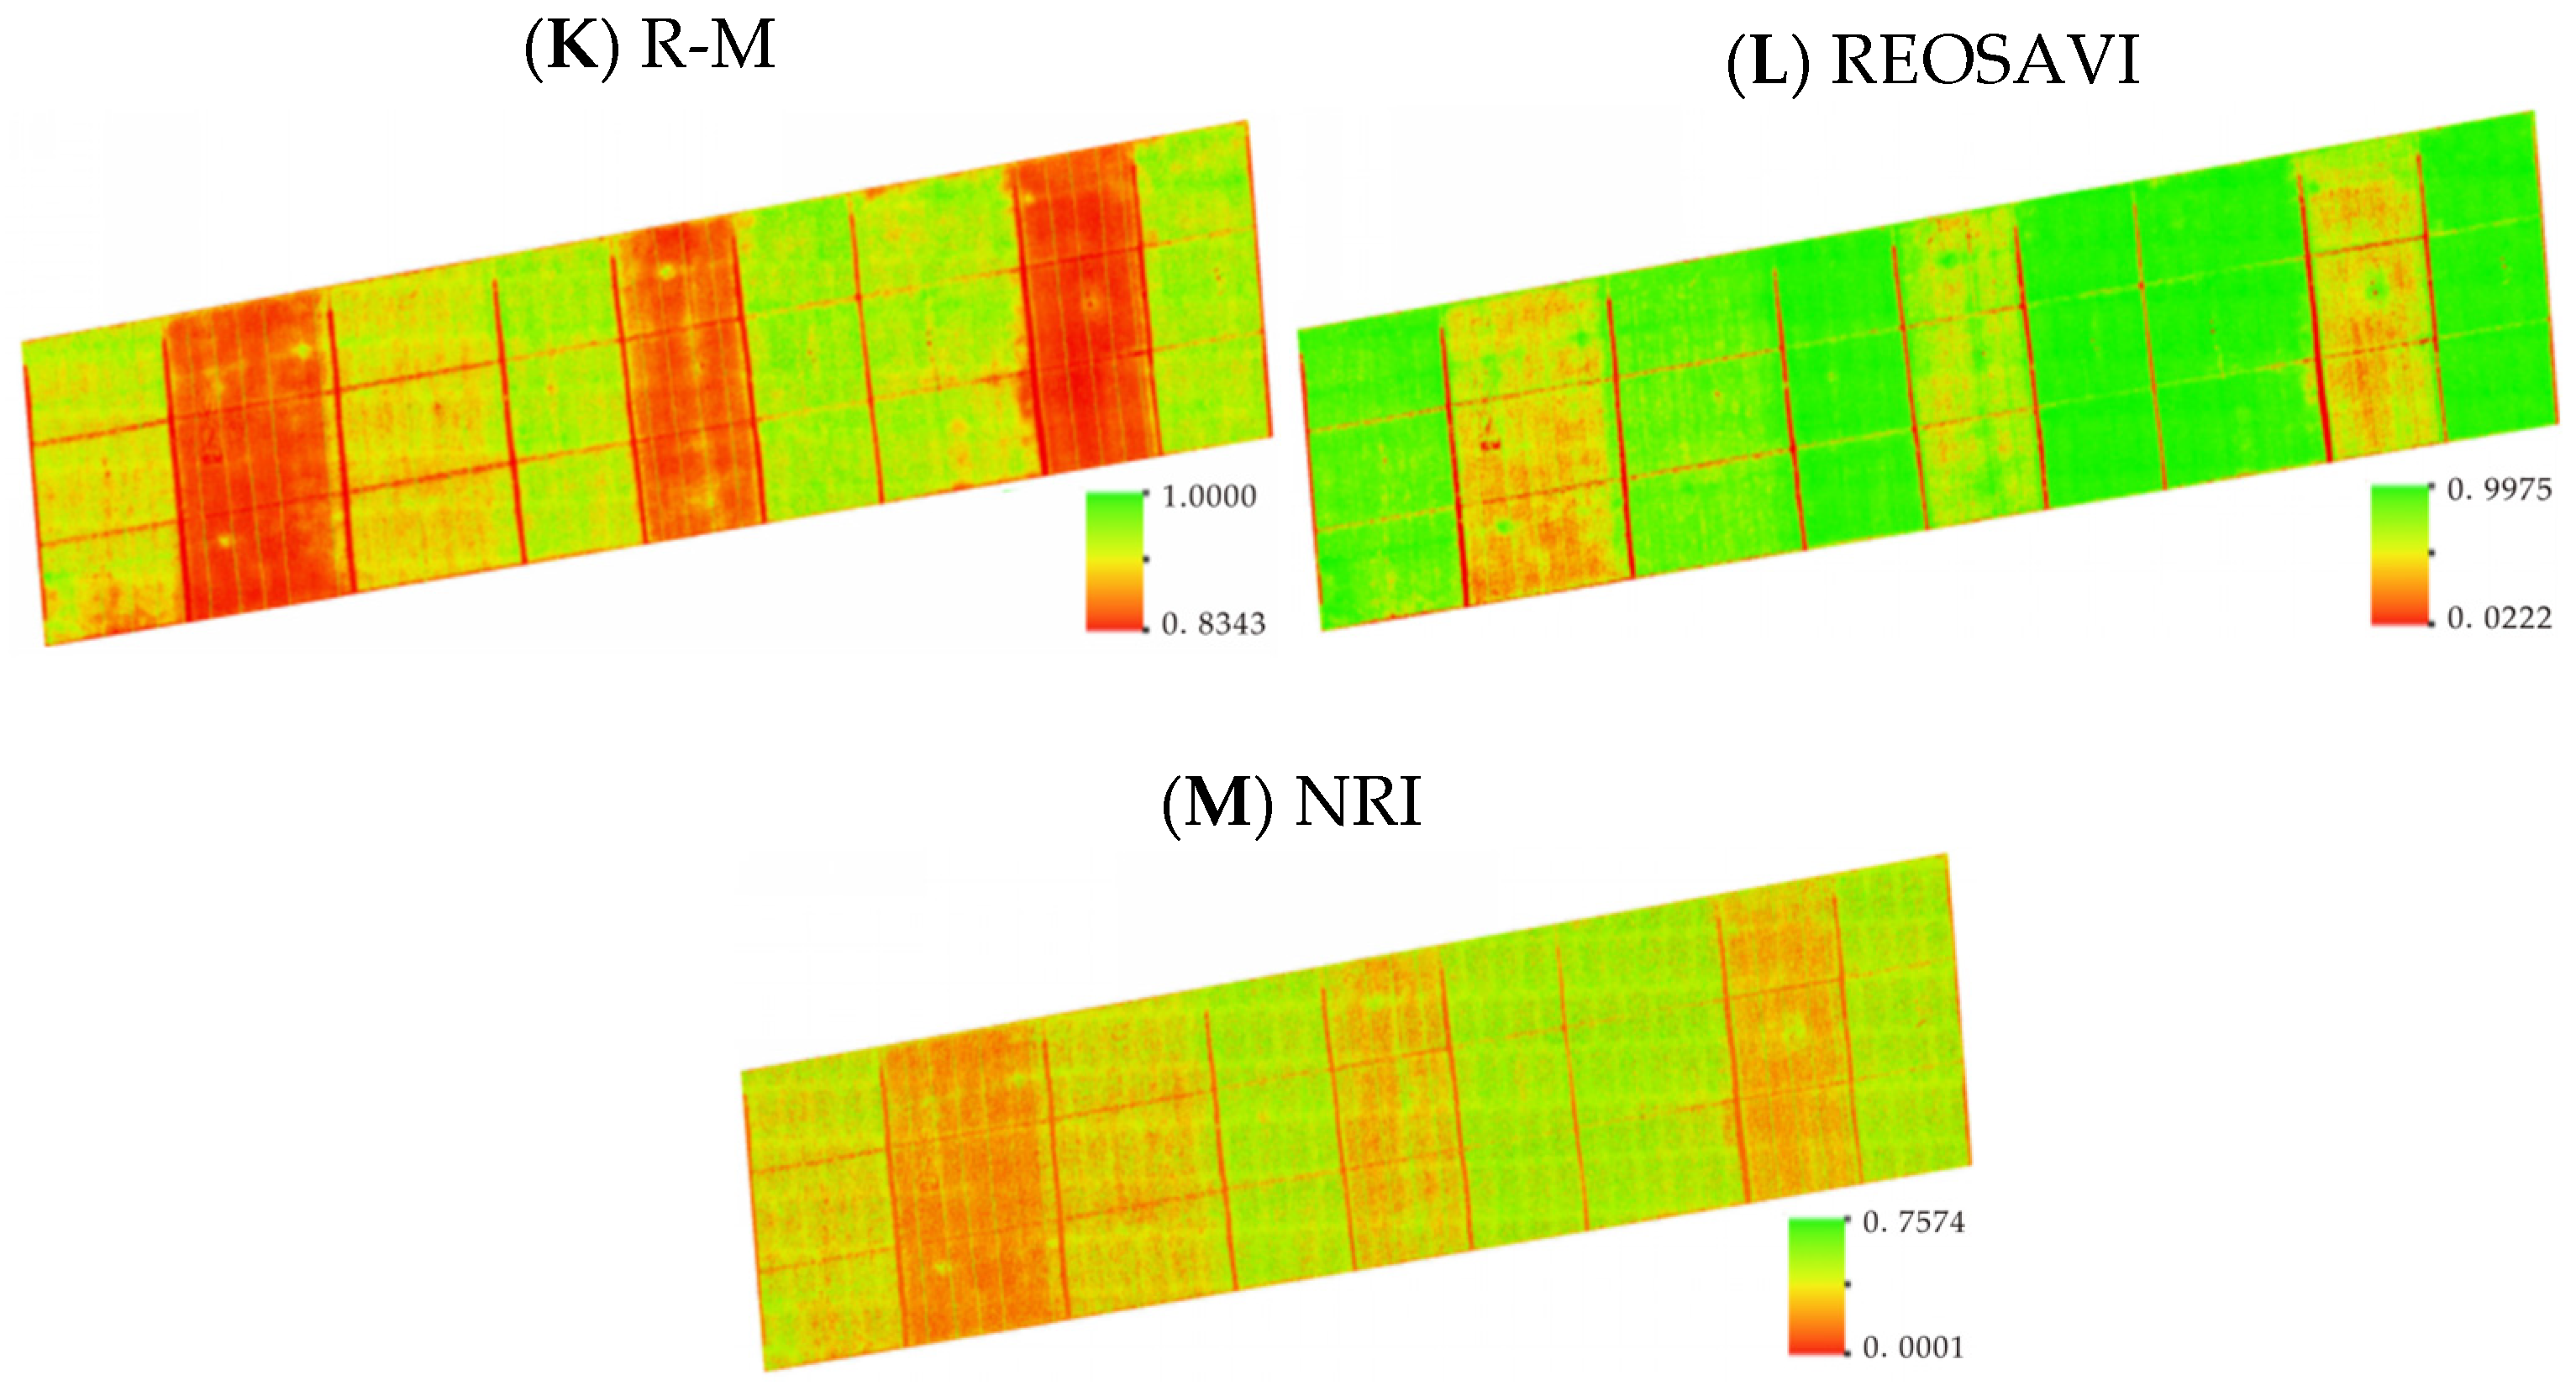
The thirteen VIs showed significant variations in wheat canopy reflectance (Figure 6). The results show that GOSAVI and GNDVI were sensitive to green vegetation, with green bands involved in the VIs. This made the VIs more sensitive to vigorous green canopies, and led to an underestimation of the real conditions of crop water stress, as the green bands were mostly reflected even when the leaves suffered drought stress. In contrast, VIs such as NDRE (−0.1199–0.6514), LCI (−0.1988–0.7578), and NRI (0.0001–0.7579) exhibited specialized responses to drought treatments. However, they did not fully display their sensitivity to drought conditions, underscoring their limitations with regard to water stress prediction. Soil-adjusted indices (OSAVI, GOSAVI, REOSAVI) minimized soil background interference by leveraging red-edge bands, while the performance of those VIs were not good for booting and flowering stages with high vegetation coverage. The R-M index (0.8343–1.0000), despite its narrow range, maintained high precision in discriminating subtle canopy structural differences, whereas RVI (0.0006–0.9142) offered robustness across both high and low crop water conditions. Research findings also indicated that RVI achieved a R2 value for leaf water content higher than that of GNDVI in the 2023–2024 growing season in the same experiment [16,50]. This confirmed RVI’s effectiveness in assessing the water status of winter wheat at a regional scale [51,52].

3.4. Model Accuracy Assessment and Validation

3.4.1. Crop Water Content (CWC)

A comparison of the evaluation metrics between the 2023–2024 and 2024–2025 seasons revealed a significant improvement in the performance of ML models for predicting winter wheat crop water content (CWC) (Table 2). The most striking difference was the reduction in error in the 2024–2025 season. The RMSE for the test set in 2024–2025 was around 0.04%, which was significantly lower than the RMSE values in 2023–2024. This massive improvement in precision was further supported by the RPD values. In 2023–2024, only the random forest (RF) model approached excellent reliability (RPD > 2.0), while in 2024–2025, both CatBoost and RF achieved high RPD scores (3.06 and 3.17, respectively), indicating very reliable and robust predictions. The 2023–2024 season benchmarked simpler models (MLR, Ridge, PLSR, ElasticNet) against the ensemble method RF. The 2024–2025 season built upon this by testing more advanced gradient boosting models (CatBoost, and LightGBM) and decision trees (DTs) against RF. While RF itself showed improved performance year-over-year (test R2 0.65 vs. 0.90), the new CatBoost model achieved best performance on the training set (R2 = 0.992) and on the test set (R2 = 0.893). In 2023–2024, models like RF showed a large gap between high training R2 (0.94) and moderate test R2 (0.65), suggesting some overfitting. In 2024–2025, this gap was considerably smaller for the optimal models (e.g., CatBoost: 0.992 vs. 0.893), indicating better model generalization and a more robust modeling framework, likely due to better data processing, feature selection, and model tuning.

3.4.2. Equivalent Water Thickness (EWT)

Similarly, it was found that the CatBoost model demonstrated superior performance across different growth stages (Table 3), achieving R2 values up to 0.962 in training datasets and maintaining good prediction capability, with R2 values of 0.9608 in testing datasets. These results indicate that CatBoost offers relatively stable and precise EWT retrieval, with similar model performance between training and testing datasets. The model further distinguished itself with consistently low error rates, showing RMSE values of only 0.1907 g cm−2 and 0.5645 g cm−2 for training and testing datasets, respectively, outperforming alternative approaches. The good performance of the CatBoost model was also validated by the model robustness, with RPD values spanning 3.1571 to 5.1321. CatBoost fusion results significantly outperformed other single machine learning methods due to its use of fully symmetric trees, superior handling of categorical data, and effective overfitting reduction [53].

3.5. The CWC and EWT Inversion Map

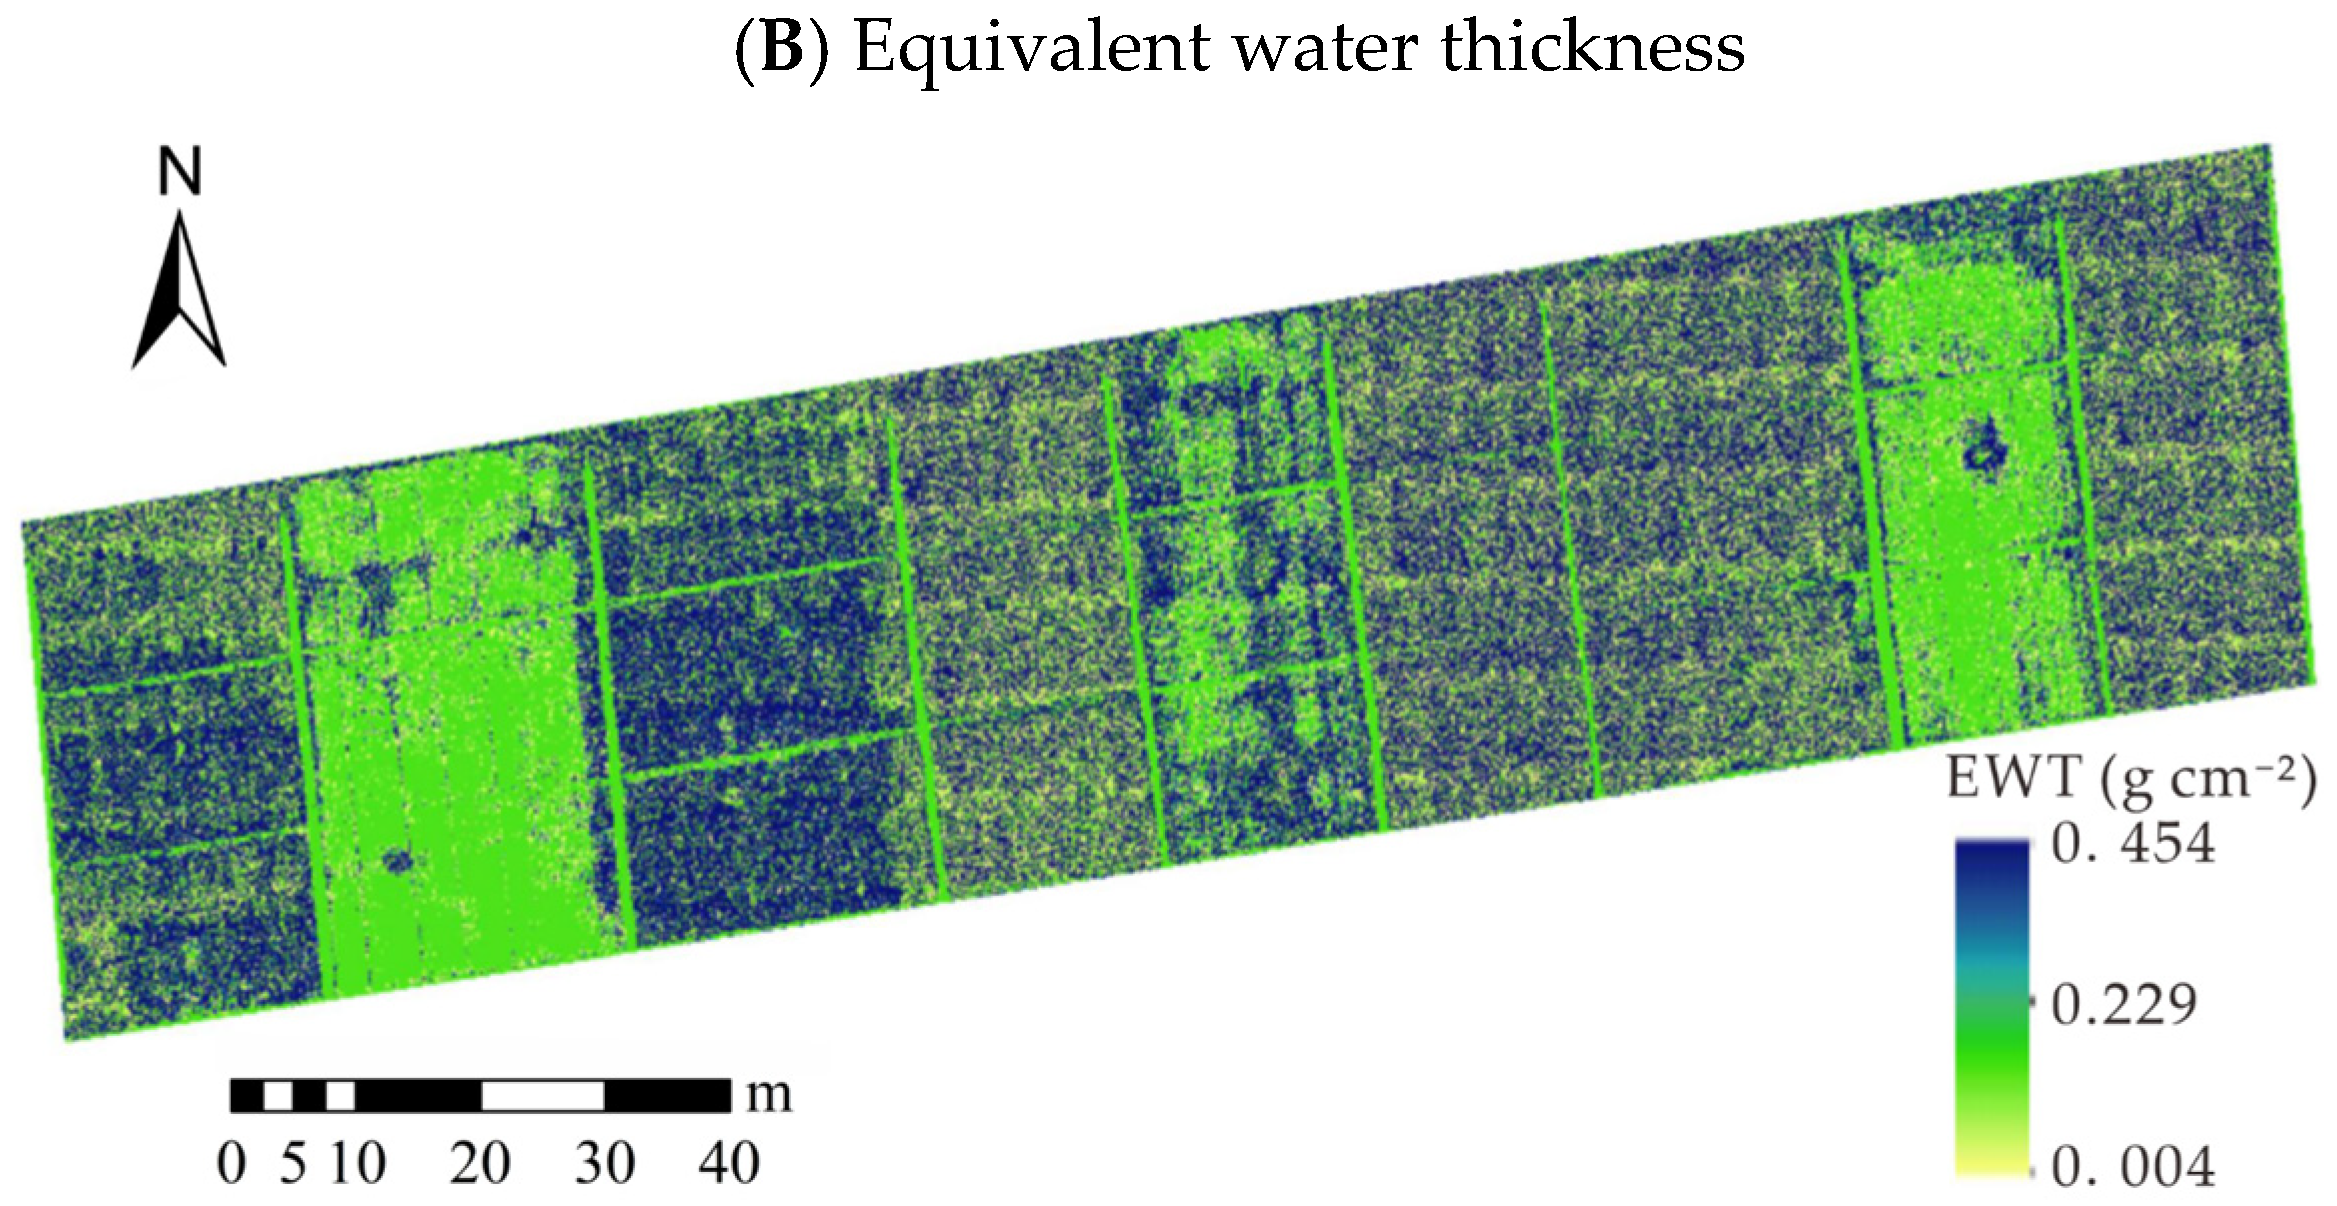
The study indicated that the ratio vegetation index (RVI) was the optimal vegetation index for predicting CWC and EWT during the flowering stage of winter wheat. The CatBoost model exhibited superior performance in CWC and EWT prediction for training and test datasets. Inversion maps were generated using the CatBoost model based on the RVI (Figure 7). The maps revealed significant spatial variability in crop water status across winter wheat fields. The predicted CWC values ranged from 62.6% to 71.9%, whereas the EWT map showed even greater variation (0.004–0.454 g cm−2), with high EWT regions (0.229–0.454 g cm−2) appearing in field segments that partially overlapped with high CWC zones, suggesting that these areas contained both water-rich plants and deep water thickness. It is concluded that the CatBoost model based on RVI can be the most effective model for CWC and EWT prediction of winter wheat.

4. Discussion

4.1. Machine Learning Algorithms in Crop Water Status Prediction

Recent developments in machine learning (ML) algorithms, combined with UAV-based multispectral data, have become a globally focused topic in precision agriculture, particularly in monitoring crop water status [25]. The present study indicated that CatBoost significantly outperformed other ML models, including random forest (RF), LightGBM, and decision trees, in predicting winter wheat water status, achieving an R2 of 0.97 when paired with the normalized ratio index (NRI). Several studies have explored ML-based water status prediction approaches [54,55,56]. However, the scholars could only make a critical advancement by directly comparing gradient-boosting methods (e.g., CatBoost, and LightGBM) against ensemble (RF) and single-tree models (decision trees) for winter wheat in the North China Plain. Earlier studies by Zhang et al. (2024) found that RF with NDRE (R2 = 0.82) was the best ML model for the accurate CWC estimation of wheat [16], while Traore et al. (2021) considered deep neural networks (DNNs, R2 = 0.934) to be the optimal models for EWT prediction [17]. In the present study, CatBoost was proven to be the best ML model for crop water status prediction. This can be attributed to its capacity for built-in categorical feature handling and its ordered boosting mechanism. These attributes minimize overfitting in noisy data [57], such as those associated with soil background noise under I0 and N0 treatments. Furthermore, compared with traditional boosting models, the adaptive learning merits of the CatBoost model can optimize model convergence, especially on small-sample training sets. For example, Zheng et al. (2024) reported that CatBoost surpassed neural networks in grain moisture prediction due to its robustness to limited datasets [58].

4.2. Vegetation Indices for Winter Wheat Water Status Retrieval

Our study evaluated thirteen VIs, confirming that wavelength selection played a pivotal role in CWC and EWT prediction. Recent UAV-based studies by Miao et al. (2025) indicated that red-edge (RE, 720 nm) band was highly sensitive to variations in plant chlorophyll content of wheat [59], while near-infrared (NIR, 840 nm) band was strongly correlated with leaf water content, as it was easily absorbed by moisture in leaves [60]. Furthermore, the research by Li et al. (2022) confirmed the high sensitivity of the near-infrared band, indicating that near-infrared-related vegetation indices (such as DVI and TVI) increased the accuracy of crop moisture content prediction in wheat [61]. Our study confirmed the findings and specially found that ratio vegetation index (RVI) calculated based on NIR/R was the best index for CWC and EWT inversion during the flowering and grain-filling stages of winter wheat, which was critical for the formation of yield components. Moreover, our results can be further confirmed by our conclusion that the 840 to 900 nm wavelength was the most sensitive absorptive band for crop water molecules [62,63]. This finding aligns with the current study’s results, demonstrating that near-infrared-based vegetation indices like RVI can be effectively combined with the CatBoost model to enhance the retrieval of CWC and EWT in winter wheat across the North China Plain.

4.3. Real-Time Water Stress Mapping for Precision Irrigation

Our study demonstrated the synergy between UAV-based multispectral data and machine learning (ML) in mapping crop water stress. The CatBoost-RVI framework achieved high inversion accuracy by leveraging the near-infrared (NIR) band’s sensitivity to leaf water absorption (840 nm) and CatBoost’s robustness against noisy field data. This aligns with the findings of Traore et al. (2021), where NIR-based indices outperformed visible spectra for EWT prediction [17]. The 5 cm resolution inversion maps revealed spatial heterogeneity in water status, enabling site-specific precision irrigation management through a smart variable-rate irrigation system, achieving the saving of irrigation water when compared with uniform application [64]. This work is critical in water-scarce regions like the North China Plain, where groundwater depletion threatens agricultural sustainability. In the future, lightweight CatBoost edge deployments will be used to enable real-time image data processing. Furthermore, the fusion of UAV and satellite data should be adopted to improve the large-scale monitoring of crop water status [65], and hybrid ML–physical models can be applied to enhance the predictive robustness of crop water stress in the North China Plain.

4.4. Comparative Analysis with the 2023–2024 Growing Season

A comparison with findings from the 2023–2024 growing season at the same experimental station indicated a critical evolution in methodology and results. While both studies conclusively demonstrated the efficacy of combining UAV-based multispectral data with ML models for inverting crop water status of winter wheat, a key divergence was the identification of the optimal vegetation index. The prior season’s research identified the green normalized difference vegetation index (GNDVI) and the normalized red-edge index (NDRE) as the best performers for estimating CWC. In contrast, during the 2024–2025 growing season, the ratio vegetation index (RVI) was determined to be the most robust, showing the highest correlation with both CWC and EWT. This discrepancy is likely attributable to the more extreme environmental conditions of the 2024–2025 season, which included a severe cold spell and a heat wave that altered canopy structure and spectral properties, potentially favoring the biomass-sensitive RVI (Figure 2). Furthermore, the progression in ML model selection marked a significant analytical advancement. Building on the previous finding that random forest (RF) outperformed traditional models, the current study benchmarked RF against advanced gradient-boosting frameworks. The results clearly indicate that CatBoost in 2024–2025 superseded RF in 2023–2024 as the optimal algorithm, achieving superior performance in the more complex EWT inversion. This inter-annual variation in the optimal VI, coupled with the consistent outperformance of advanced ML models, led to two critical conclusions: first, there is no single universal VI, as the optimal index depends on seasonal conditions and the target parameter; and second, the choice of a powerful, flexible algorithm like CatBoost is more critical than the selection of any specific index in the 2023–2024 season. Therefore, the future of precision agriculture lies in developing adaptive modeling frameworks that leverage a suite of VIs processed through powerful, robust ML algorithms to ensure resilience and accuracy across diverse conditions.

5. Conclusions

This study established a robust framework for inverting crop water status of winter wheat by integrating UAV multispectral data with machine learning models, with a comparative analysis between the 2023–2024 and 2024–2025 seasons revealing critical evolutionary insights. The foundational 2023–2024 research identified random forest (RF) with the normalized red-edge index (NDRE) as optimal (test R2 = 0.65 for CWC), while the subsequent season—characterized by extreme cold and heat waves—tested model resilience and led to an obvious advancement: the ratio vegetation index (RVI) showed superior robustness under environmental stress, achieving correlations of R = 0.88 with CWC and R = 0.84 with EWT. In the 2024–2025 growing season, the categorical boosting algorithm (CatBoost) significantly outperformed all previous models in both seasons, including RF, achieving the highest inversion accuracy (R2 = 0.893 for CWC, 0.961 for EWT). This year-over-year progression highlights the importance of selecting a powerful, adaptive algorithm like CatBoost for ensuring reliable predictions across variable seasons. The CatBoost-RVI framework successfully generated high-resolution (5 cm) inversion maps of CWC and EWT, providing a practical tool for precision irrigation in the North China Plain.

Author Contributions

Conceptualization, A.Q. and S.M.; methodology, Z.G.; software, B.D.; validation, A.Q. and S.M.; formal analysis, Z.G.; investigation, B.D.; resources, B.D.; data curation, B.D.; writing—original draft preparation, B.D.; writing—review and editing, A.Q.; visualization, B.D.; supervision, S.M.; project administration, A.Q.; funding acquisition, A.Q. All authors have read and agreed to the published version of the manuscript.

Funding

This research was funded by the China National Agricultural Key & Core Technology R&D Program (Grant no. NK202319080301), the Agricultural Science and Technology Innovation Program (ASTIP), and the Institute of Arid Meteorology, CMA/Key laboratory of Arid Climatic Change and Reducing Disaster of Gansu Province/Key Open Laboratory of Arid Climatic Change and Disaster Reduction of CMA, China (No. IAM202411).

Data Availability Statement

The data that support the findings of this study are available from the corresponding authors upon reasonable request.

Acknowledgments

The authors thank the reviewers and editors for their comments regarding improvement of the quality of the manuscript.

Conflicts of Interest

The authors declare no conflicts of interest.

References

  1. Zhao, G.C.; Chang, X.H.; Wang, D.M.; Tao, Z.Q.; Wang, Y.J.; Yang, Y.S.; Zhu, Y.J. General Situation and Development of Wheat Production. Crops 2018, 4, 1–7. [Google Scholar]
  2. Sharma, K.; Sharma, P.K. Wheat as a Nutritional Powerhouse: Shaping Global Food Security. In Triticum—The Pillar of Global Food Security; IntechOpen: London, UK, 2025; pp. 23–26. [Google Scholar]
  3. Li, H.; Zhou, Y.; Xin, W.; Wei, Y.; Zhang, J.; Guo, L. Wheat Breeding in Northern China: Achievements and Technical Advances. Crop J. 2019, 7, 718–729. [Google Scholar] [CrossRef]
  4. Wu, D.; Yu, Q.; Lu, C.; Hengsdijk, H. Quantifying Production Potentials of Winter Wheat in the North China Plain. Eur. J. Agron. 2006, 24, 226–235. [Google Scholar] [CrossRef]
  5. Sun, S.K.; Li, C.; Wu, P.T.; Zhao, X.N.; Wang, Y.B. Evaluation of Agricultural Water Demand under Future Climate Change Scenarios in the Loess Plateau of Northern Shaanxi, China. Ecol. Indic. 2018, 84, 811–819. [Google Scholar] [CrossRef]
  6. Laporte, M.F.; Duchesne, L.; Wetzel, S. Effect of Rainfall Patterns on Soil Surface CO2 Efflux, Soil Moisture, Soil Temperature and Plant Growth in a Grassland Ecosystem of Northern Ontario, Canada: Implications for Climate Change. BMC Ecol. 2002, 2, 10. [Google Scholar] [CrossRef] [PubMed]
  7. Li, Y.; Guan, K.; Schnitkey, G.D.; DeLucia, E.; Peng, B. Excessive Rainfall Leads to Maize Yield Loss of a Comparable Magnitude to Extreme Drought in the United States. Glob. Change Biol. 2019, 25, 2325–2337. [Google Scholar] [CrossRef]
  8. Knox, J.; Morris, J.; Hess, T. Identifying Future Risks to UK Agricultural Crop Production: Putting Climate Change in Context. Outlook Agric. 2010, 39, 249–256. [Google Scholar] [CrossRef]
  9. Zeng, R.; Lin, X.; Welch, S.M.; Yang, S.; Huang, N.; Sassenrath, G.F.; Yao, F. Impact of Water Deficit and Irrigation Management on Winter Wheat Yield in China. Agric. Water Manag. 2023, 287, 108431. [Google Scholar] [CrossRef]
  10. Rey, D.; Holman, I.P.; Daccache, A.; Morris, J.; Weatherhead, E.K.; Knox, J.W. Modelling and Mapping the Economic Value of Supplemental Irrigation in a Humid Climate. Agric. Water Manag. 2016, 173, 13–22. [Google Scholar] [CrossRef]
  11. Oweis, T. The Role of Water Harvesting and Supplemental Irrigation in Coping with Water Scarcity and Drought in the Dry Areas. In Drought and Water Crises: Science, Technology, and Management Issues; Wilhite, D.A., Ed.; Taylor & Francis: Boca Raton, FL, USA, 2005; pp. 191–213. [Google Scholar]
  12. Sun, Z.; Herzfeld, T.; Aarnoudse, E.; Yu, C.; Disse, M. China’s Agricultural Sector. In Water and Agriculture in China: Status, Challenges and Options for Action; OAV–German Asia-Pacific Business Association: Hamburg, Germany, 2017; pp. 4–6. [Google Scholar]
  13. Du, J.; Laghari, Y.; Wei, Y.C.; Wu, L.; He, A.L.; Liu, G.Y.; Yang, H.H.; Guo, Z.Y.; Leghari, S.J. Groundwater Depletion and Degradation in the North China Plain: Challenges and Mitigation Options. Water 2024, 16, 354. [Google Scholar] [CrossRef]
  14. Cai, X. Water Stress, Water Transfer and Social Equity in Northern China—Implications for Policy Reforms. J. Environ. Manag. 2008, 87, 14–25. [Google Scholar] [CrossRef]
  15. Bwambale, E.; Abagale, F.K.; Anornu, G.K. Smart Irrigation Monitoring and Control Strategies for Improving Water Use Efficiency in Precision Agriculture: A Review. Agric. Water Manag. 2022, 260, 107324. [Google Scholar] [CrossRef]
  16. Zhang, Z.; Dou, G.; Zhao, X.; Gao, Y.; Liu, S.; Qin, A. Inversion of Crop Water Content Using Multispectral Data and Machine Learning Algorithms in the North China Plain. Agronomy 2024, 14, 2361. [Google Scholar] [CrossRef]
  17. Traore, A.; Ata-Ul-Karim, S.T.; Duan, A.; Soothar, M.K.; Traore, S.; Zhao, B. Predicting Equivalent Water Thickness in Wheat Using UAV Mounted Multispectral Sensor through Deep Learning Techniques. Remote Sens. 2021, 13, 4476. [Google Scholar] [CrossRef]
  18. Yang, G.; Liu, J.; Zhao, C.; Li, Z.; Huang, Y.; Yu, H.; Xu, B.; Yang, X.; Zhu, D.; Zhang, X.; et al. Unmanned Aerial Vehicle Remote Sensing for Field-Based Crop Phenotyping: Current Status and Perspectives. Front. Plant Sci. 2017, 8, 1111. [Google Scholar] [CrossRef]
  19. Zhang, Z.; Zhu, L. A Review on Unmanned Aerial Vehicle Remote Sensing: Platforms, Sensors, Data Processing Methods, and Applications. Drones 2023, 7, 398. [Google Scholar] [CrossRef]
  20. Xue, J.; Su, B. Significant Remote Sensing Vegetation Indices: A Review of Developments and Applications. J. Sens. 2017, 2017, 135369. [Google Scholar] [CrossRef]
  21. Rahman, A.; Street, J.; Wooten, J.; Marufuzzaman, M.; Gude, V.G.; Buchanan, R.; Wang, H. MoistNet: Machine Vision-Based Deep Learning Models for Wood Chip Moisture Content Measurement. Expert Syst. Appl. 2025, 259, 12536. [Google Scholar] [CrossRef]
  22. Yang, M.D.; Hsu, Y.C.; Tseng, W.C.; Tseng, H.H.; Lai, M.H. Precision Assessment of Rice Grain Moisture Content Using UAV Multispectral Imagery and Machine Learning. Comput. Electron. Agric. 2025, 230, 109813. [Google Scholar] [CrossRef]
  23. Yu, J.; Lan, C.; Zhou, Y.; Wang, S. Retrieval of Water Content of Crop Based on Remote Sensing. Geomat. Info. Sci. Wuhan Univers. 2009, 34, 210–213. [Google Scholar]
  24. Li, Z.; Cheng, Q.; Chen, L.; Zhai, W.; Zhang, B.; Mao, B.; Li, Y.; Ding, F.; Zhou, X.; Chen, Z. Novel Spectral Indices and Transfer Learning Model in Estimat Moisture Status across Winter Wheat and Summer Maize. Comput. Electron. Agric. 2025, 229, 109762. [Google Scholar] [CrossRef]
  25. Barbierato, E.; Gatti, A. The Challenges of Machine Learning: A Critical Review. Electronics 2024, 13, 416. [Google Scholar] [CrossRef]
  26. Ahmad, U.; Alvino, A.; Marino, S. A Review of Crop Water Stress Assessment Using Remote Sensing. Remote Sens. 2021, 13, 4155. [Google Scholar] [CrossRef]
  27. Clevers, J.G.P.W.; Kooistra, L.; Schaepman, M.E. Using Spectral Information from the NIR Water Absorption Features for the Retrieval of Canopy Water Content. Int. J. Appl. Earth Obs. Geoinf. 2008, 10, 388–397. [Google Scholar] [CrossRef]
  28. Hunt, E.R.; Rock, B.N. Detection of Changes in Leaf Water Content Using Near- and Middle-Infrared Reflectances. Remote Sens. Environ. 1989, 30, 43–54. [Google Scholar]
  29. Clevers, J.G.P.W.; Kooistra, L.; Schaepman, M.E. Estimating Canopy Water Content Using Hyperspectral Remote Sensing Data. Int. J. Appl. Earth Obs. Geoinf. 2010, 12, 119–125. [Google Scholar] [CrossRef]
  30. Huete, A.R. A Soil-Adjusted Vegetation Index (SAVI). Remote Sens. Environ. 1988, 25, 295–309. [Google Scholar] [CrossRef]
  31. Gitelson, A.A.; Gritz, Y.; Merzlyak, M.N. Relationships between Leaf Chlorophyll Content and Spectral Reflectance and Algorithms for Non-Destructive Chlorophyll Assessment in Higher Plant Leaves. J. Plant Physiol. 2003, 160, 271–282. [Google Scholar] [CrossRef]
  32. Rondeaux, G.; Steven, M.; Baret, F. Optimization of Soil-Adjusted Vegetation Indices. Remote Sens. Environ. 1996, 55, 95–107. [Google Scholar] [CrossRef]
  33. Lu, J.; Miao, Y.; Shi, W.; Li, J.; Yuan, F. Evaluating Different Approaches to Non-Destructive Nitrogen Status Diagnosis of Rice Using Portable RapidSCAN Active Canopy Sensor. Sci. Rep. 2017, 7, 14073. [Google Scholar] [CrossRef]
  34. Kanke, Y.; Tubaña, B.; Dalen, M.; Harrell, D. Evaluation of Red and Red-Edge Reflectance-Based Vegetation Indices for Rice Biomass and Grain Yield Prediction Models in Paddy Fields. Precis. Agric. 2016, 17, 507–530. [Google Scholar]
  35. Broge, N.H.; Mortensen, J.V. Deriving Green Crop Area Index and Canopy Chlorophyll Density of Winter Wheat from Spectral Reflectance Data. Remote Sens. Environ. 2002, 81, 45–57. [Google Scholar]
  36. Broge, N.H.; Leblanc, E. Comparing Prediction Power and Stability of Broadband and Hyperspectral Vegetation Indices for Estimation of Green Leaf Area Index and Canopy Chlorophyll Density. Remote Sens. Environ. 2001, 76, 156–172. [Google Scholar]
  37. Datt, B. A New Reflectance Index for Remote Sensing of Chlorophyll Content in Higher Plants: Tests Using Eucalyptus Leaves. J. Plant Physiol. 1999, 154, 30–36. [Google Scholar] [CrossRef]
  38. Tucker, C.J. Red and Photographic Infrared Linear Combinations for Monitoring Vegetation. Remote Sens. Environ. 1979, 8, 127–150. [Google Scholar] [CrossRef]
  39. Datt, B. Remote Sensing of Water Content in Eucalyptus Leaves. Aust. J. Bot. 1999, 47, 909–923. [Google Scholar] [CrossRef]
  40. Thompson, C.N.; Guo, W.; Sharma, B.; Ritchie, G.L. Using Normalized Difference Red Edge Index to Assess Maturity in Cotton. Crop Sci. 2019, 59, 2167–2177. [Google Scholar]
  41. Tucker, C.J.; Vanpraet, C.L.; Sharman, M.J.; Ittersum, G.V. Satellite Remote Sensing of Total Herbaceous Biomass Production in the Senegalese Sahel: 1980–1984. Remote Sens. Environ. 1985, 17, 233–249. [Google Scholar] [CrossRef]
  42. Haboudane, D.; Miller, J.R.; Tremblay, N.; Zarco-Tejada, P.J.; Dextraze, L. Integrated Narrow-Band Vegetation Indices for Prediction of Crop Chlorophyll Content for Application to Precision Agriculture. Remote Sens. Environ. 2002, 81, 416–426. [Google Scholar]
  43. Elsherbiny, O.; Fan, Y.; Zhou, L.; Qiu, Z. Fusion of Feature Selection Methods and Regression Algorithms for Predicting the Canopy Water Content of Rice Based on Hyperspectral Data. Agriculture 2021, 11, 51. [Google Scholar] [CrossRef]
  44. Fawagreh, K.; Gaber, M.M.; Elyan, E. Random Forests: From Early Developments to Recent Advancements. Syst. Sci. Control. Eng. Open Access J. 2014, 2, 602–609. [Google Scholar]
  45. Kotsiantis, S.B. Decision Trees: A Recent Overview. Artif. Intell. Rev. 2013, 39, 261–283. [Google Scholar]
  46. Pan, Z.; Lu, W.; Bai, Y. Groundwater Contaminated Source Estimation Based on Adaptive Correction Iterative Ensemble Smoother with an Auto Lightgbm Surrogate. J. Hydrol. 2023, 620, 129502. [Google Scholar] [CrossRef]
  47. Ke, G.; Meng, Q.; Finley, T.; Wang, T.; Chen, W.; Ma, W.; Ye, Q.; Liu, T.Y. LightGBM: A Highly Efficient Gradient Boosting Decision Tree. In Proceedings of the 31st Conference on Neural Information Processing Systems (NIPS 2017), Long Beach, CA, USA, 4–9 December 2017. [Google Scholar]
  48. Prokhorenkova, L.; Gusev, G.; Vorobev, A.; Dorogush, A.V.; Gulin, A. CatBoost: Unbiased boosting with categorical features. In Proceedings of the 32nd International Conference on Neural Information Processing System, Montréal, QC, Canada, 3–8 December 2018. [Google Scholar]
  49. Hancock, J.T.; Khoshgoftaar, T.M. CatBoost for Big Data: An Interdisciplinary Review. J. Big Data 2020, 7, 94. [Google Scholar] [CrossRef]
  50. Rahila, A.; Umut, H.; Abdugheni, A.; Nijat, K. Hyperspectral Estimation of Spring Wheat Leaf Water Content Based on Machine Learning. J. Triticeae Crops 2022, 42, 640–648. [Google Scholar]
  51. Jin, N.; Zhang, D.; Li, Z.; He, L. Evaluation of Water Status of Winter Wheat Based on Simulated Reflectance of Multispectral Satellites. Trans. Chin. Soc. Agric. Mach. 2020, 51, 243–252. [Google Scholar]
  52. Wang, J.; Lou, Y.; Wang, W.; Liu, S.; Zhang, H.; Hui, X.; Wang, Y.; Yan, H.; Maes, W.H. A Robust Model for Diagnosing Water Stress of Winter Wheat by Combining UAV Multispectral and Thermal Remote Sensing. Agric. Water Manag. 2024, 291, 108616. [Google Scholar]
  53. Yang, S.; Li, Y.; Wang, X.; Yang, Z.; Xu, L.; Hong, Z.; Pan, H.; Chen, C. SHW-Stacking: A Weighted Stacking Method for Enhancing the Accuracy of Remote Sensing Daily Precipitation Products by Capturing Precipitation Spatial Heterogeneity. J. Geo-Inf. Sci. 2025, 27, 1179–1194. [Google Scholar]
  54. Chlingaryan, A.; Sukkarieh, S.; Whelan, B. Machine Learning Approaches for Crop Yield Prediction and Nitrogen Status Estimation in Precision Agriculture: A Review. Comput. Electron. Agric. 2018, 151, 61–69. [Google Scholar] [CrossRef]
  55. Virnodkar, S.S.; Pachghare, V.K.; Patil, V.C.; Jha, S.K. Remote Sensing and Machine Learning for Crop Water Stress Determination in Various Crops: A Critical Review. Precis. Agric. 2020, 21, 1121–1155. [Google Scholar] [CrossRef]
  56. Chandel, N.S.; Chakraborty, S.K.; Rajwade, Y.A.; Dubey, K.; Tiwari, M.K.; Jat, D. Identifying Crop Water Stress Using Deep Learning Models. Neural Comput. Appl. 2021, 33, 5353–5367. [Google Scholar] [CrossRef]
  57. Zhang, Y.; Zhao, Z.; Zheng, J. CatBoost: A New Approach for Estimating Daily Reference Crop Evapotranspiration in Arid and Semi-Arid Regions of Northern China. J. Hydrol. 2020, 588, 125087. [Google Scholar] [CrossRef]
  58. Zheng, R.; Jia, Y.; Ullagaddi, C.; Allen, C.; Rausch, K.; Singh, V.; Schnable, J.C.; Kamruzzaman, M. Optimizing Feature Selection with Gradient Boosting Machines in PLS Regression for Predicting Moisture and Protein in Multi-Country Corn Kernels via NIR Spectroscopy. Food Chem. 2024, 456, 140062. [Google Scholar] [CrossRef] [PubMed]
  59. Miao, H.; Zhang, R.; Song, Z.; Chang, Q. Estimating Winter Wheat Canopy Chlorophyll Content Through the Integration of Unmanned Aerial Vehicle Spectral and Textural Insights. Remote Sens. 2025, 17, 406. [Google Scholar] [CrossRef]
  60. Zhang, J.; Han, W.; Huang, L.; Zhang, Z.; Ma, Y.; Hu, Y. Leaf Chlorophyll Content Estimation of Winter Wheat Based on Visible and Near-Infrared Sensors. Sensors 2016, 16, 437. [Google Scholar] [CrossRef]
  61. Li, Q.; Gao, M.; Li, Z.L. Ground Hyper-Spectral Remote-Sensing Monitoring of Wheat Water Stress during Different Growing Stages. Agronomy 2022, 12, 2267. [Google Scholar] [CrossRef]
  62. Ceccato, P.; Flasse, S.; Tarantola, S.; Jacquemoud, S.; Grégoire, J.M. Detecting vegetation leaf water content using reflectance in the optical domain. Remote Sens. Environ. 2001, 77, 22–33. [Google Scholar] [CrossRef]
  63. Ceccato, P.; Gobron, N.; Flasse, S.; Pinty, B.; Tarantola, S. Designing a spectral index to estimate vegetation water content from remote sensing data: Part 2. Validation and applications. Remote Sens. Environ. 2002, 82, 198–207. [Google Scholar] [CrossRef]
  64. O’Shaughnessy, S.A.; Evett, S.R.; Andrade, A.; Workneh, F.; Price, J.A.; Rush, C.M. Site-specific variable-rate irrigation as a means to enhance water use efficiency. Am. Soc. Agric. Biol. Eng. 2016, 59, 239–249. [Google Scholar]
  65. Maimaitijiang, M.; Sagan, V.; Sidike, P.; Daloye, A.M.; Erkbol, H.; Fritschi, F.B. Crop Monitoring Using Satellite/UAV Data Fusion and Machine Learning. Remote Sens. 2020, 12, 1357. [Google Scholar] [CrossRef]
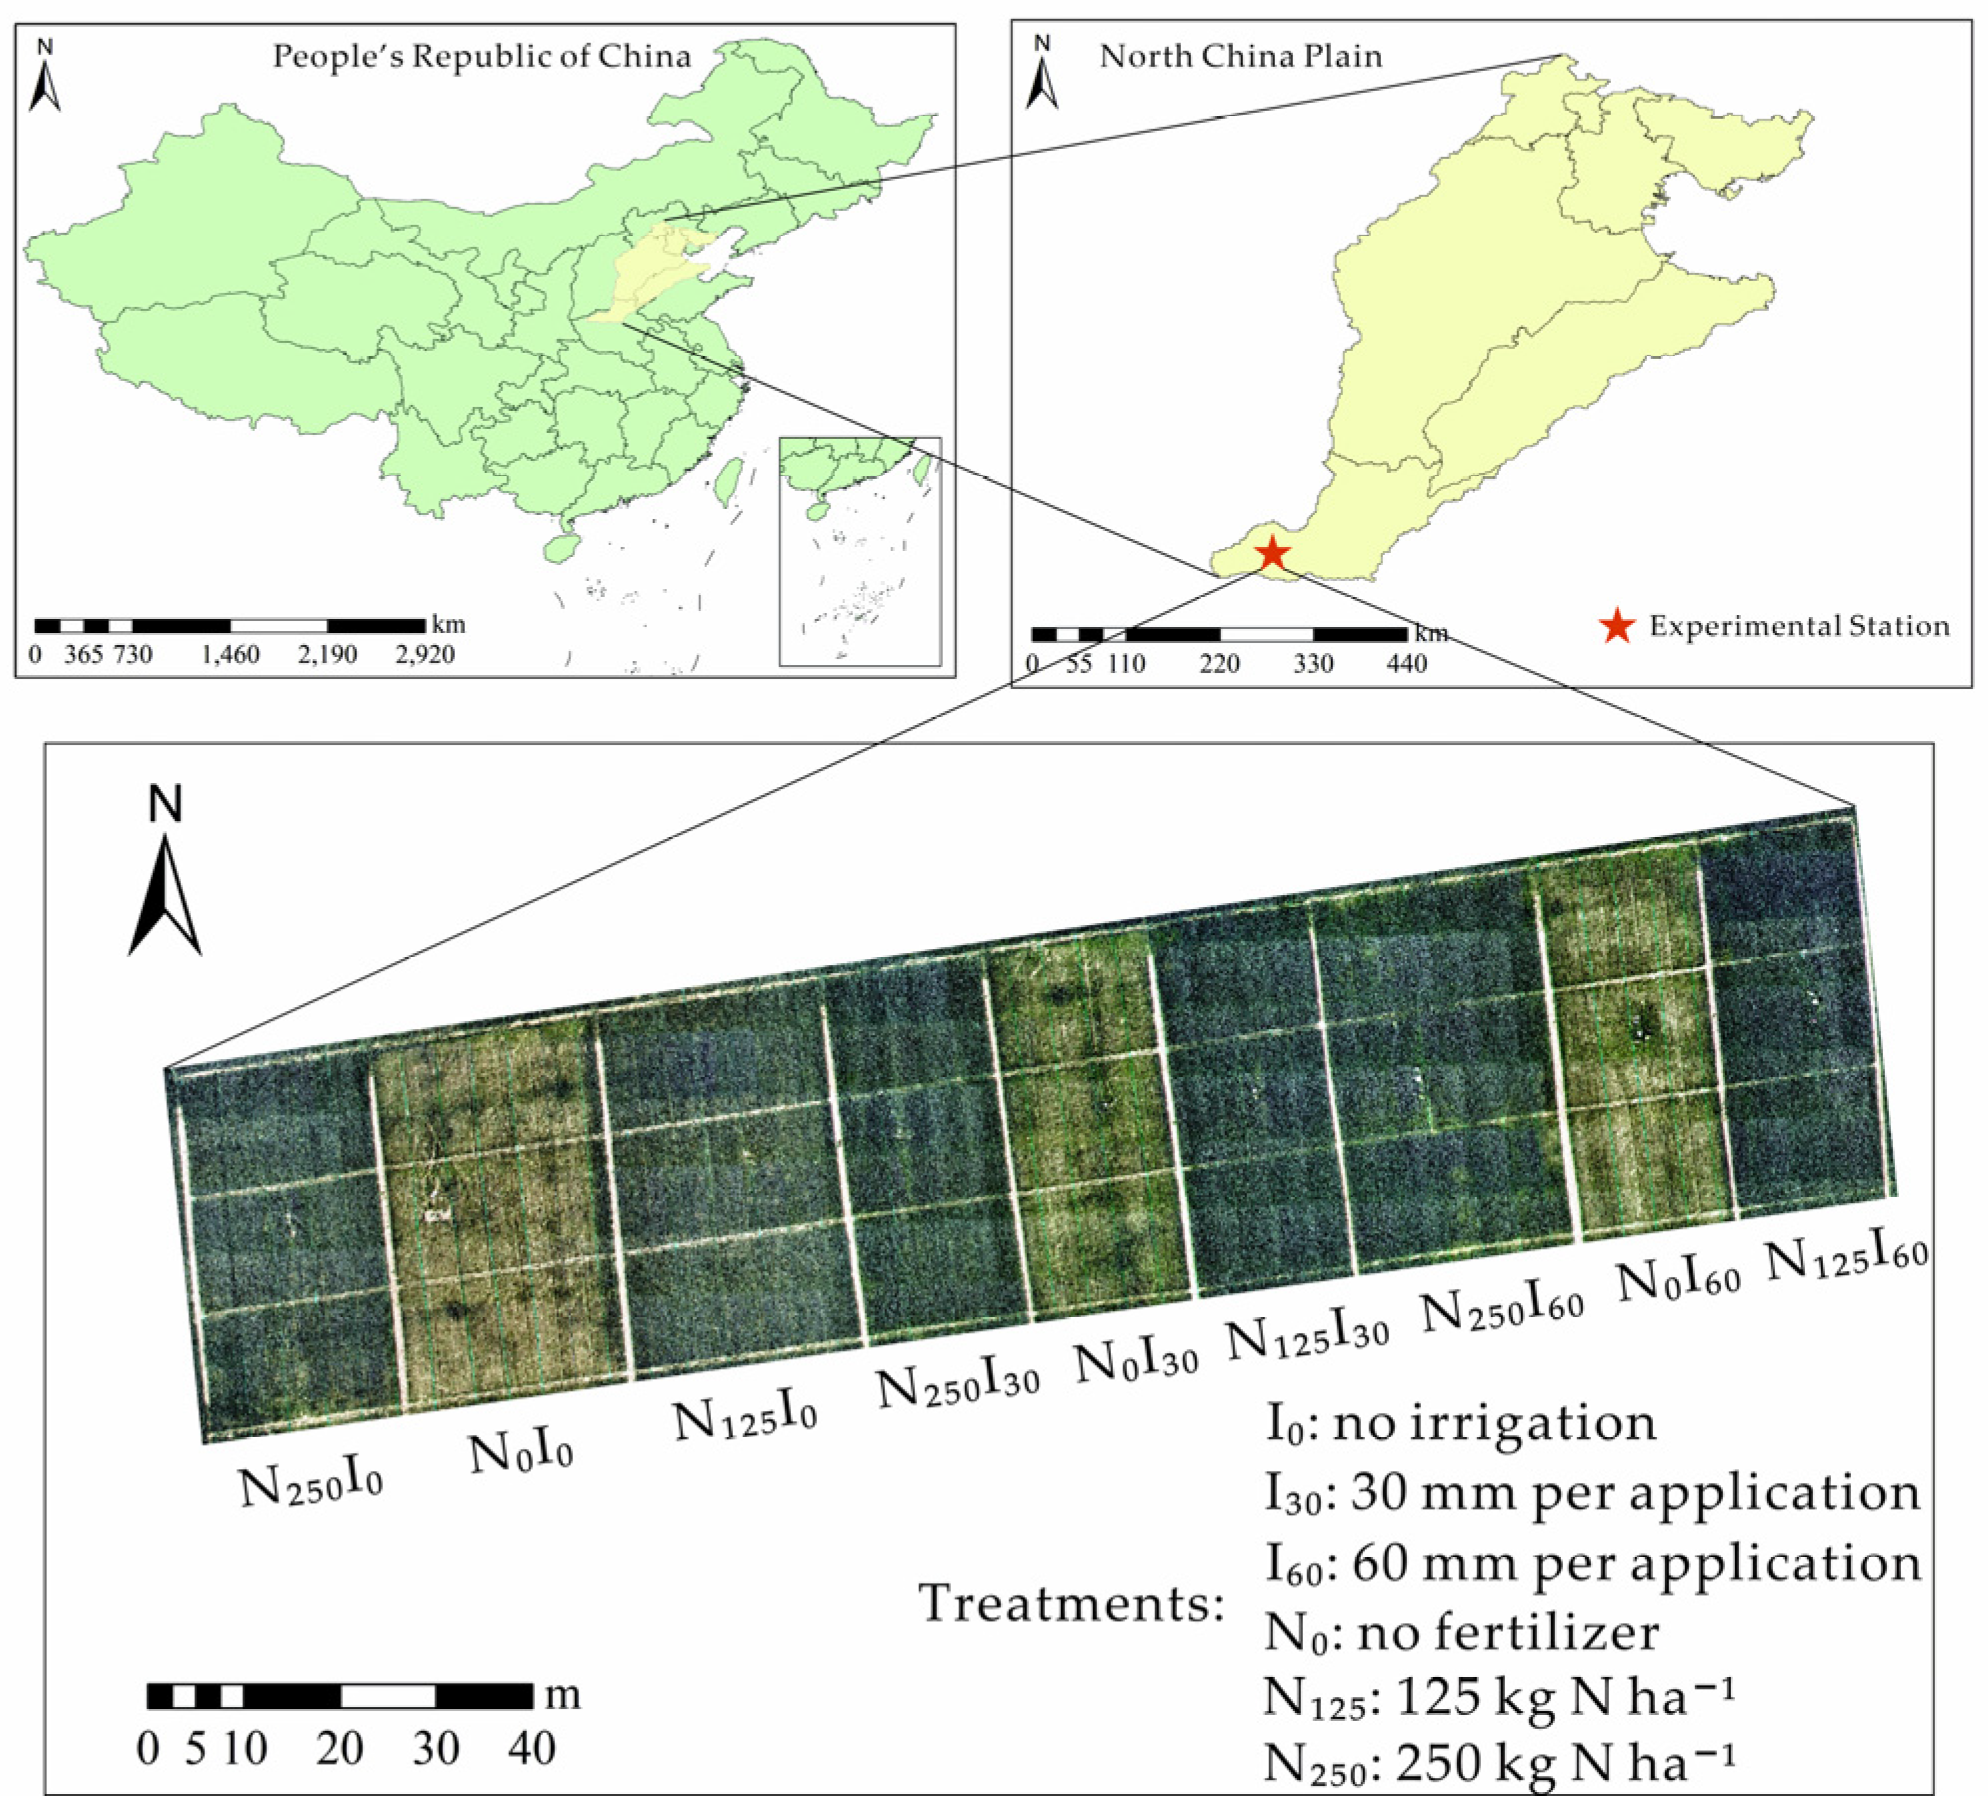
Figure 1. The location of the experimental station and the designed treatments in the 2023–2024 and 2024–2025 growing seasons of winter wheat in the North China Plain.
Applsci 15 11363 g001
Figure 2. Maximum and minimum air temperature at 2 m height and daily precipitation during the (A) 2023–2024 and (B) 2024–2025 growing seasons of winter wheat at the Xinxiang Comprehensive Experimental Station.
Applsci 15 11363 g002
Figure 3. The flowchart of data collection, image processing and inversion map generation using different vegetation indices (VIs) and machine learning algorithms.
Applsci 15 11363 g003
Figure 4. Analysis of the correlation between crop water content (CWC, %) and vegetation indices at the (A) jointing, (B) booting, (C) flowering and (D) filling stages in 2024–2025. * indicates significant correlation between different variables at p < 0.05 level.
Applsci 15 11363 g004
Figure 5. Analysis of the correlation between equivalent water thickness (EWT, g cm−2) and vegetation indices at the (A) jointing, (B) booting, (C) flowering and (D) filling stages in 2024–2025. * indicates significant correlation between different variables at p < 0.05 level.
Applsci 15 11363 g005
Figure 6. Vegetation indices maps of (AM) at the flowering stage of winter wheat in 2024–2025.
Applsci 15 11363 g006aApplsci 15 11363 g006b
Figure 7. CatBoost inversion maps of (A) crop water content (CWC, %) and (B) equivalent water thickness (EWT, g cm−2) at the flowering stage of winter wheat, based on RVI in 2024–2025.
Applsci 15 11363 g007aApplsci 15 11363 g007b
Table 1. Vegetation indices (VIs) and the corresponding calculating formulae in the experiment.
Vegetation IndicesFormulaeReferences
Soil-adjusted vegetation index (SAVI)(1 + 0.5)(NIR − R)/(NIR + R + 0.5)[30]
Red-edge model(R-M)NIR/(RE − 1)[31]
Green-band-optimized soil-adjusted vegetation index (GOSAVI)(NIR − R)/(NIR + G + 0.16)[32]
Red-edge-optimized soil-adjusted vegetation index (REOSAVI)(NIR − R)/(NIR + R + 0.16)[33]
Ratio vegetation index (RVI)NIR/R[34]
Difference vegetation index (DVI)NIR − R[35]
Triangle vegetation index (TVI)1.5(NIR − R)/(NIR + RE + 0.5)[36]
Crop nitrogen response index (NRI)(G − R)/(G + R)[37]
Green normalized vegetation difference index (GNDVI)(NIR − G)/(NIR + G)[38]
Leaf chlorophyll index (LCI)(NIR − RE)/(NIR + R)[39]
Normalized red-edge vegetation index(NDRE)(NIR − RE)/(NIR + RE)[40]
Normalized difference vegetation index (NDVI)(NIR − R)/(NIR + R)[41]
Optimized soil-adjusted vegetation index (OSAVI)(NIR − R)/(NIR + R + 0.16)[42]
Table 2. Evaluation metrics for assessing the accuracy of the machine learning models for the prediction of crop water content (%) during the 2023–2024 and 2024–2025 growing seasons of winter wheat.
YearsModelTraining SetTest Set
R2RMSE (%)RPDR2RMSE (%)RPD
2023–2024MLR0.62772.49471.65170.62302.56001.6493
RF0.94071.32373.82000.65002.10772.0450
ElasticNet0.58172.82671.36670.67602.70231.5523
Ridge0.59972.84901.60000.68302.75931.8477
PLSR0.59002.53731.58500.67602.87631.8127
2024–2025RF0.96430.02615.29520.90030.0353.1673
DT0.97430.02216.23440.85470.04232.623
LightGBM0.93490.03523.91860.78150.05192.1394
CatBoost0.99240.012111.43550.89340.03623.0625
Note: R2, coefficient of determination; RMSE, root mean square error; RPD, relative prediction deviation.
Table 3. Evaluation metrics for assessing the accuracy of machine learning models predicting equivalent water thickness (g cm−2) in winter wheat, 2024–2025.
ModelTraining SetTest Set
R2RMSE (g cm−2)RPDR2RMSE (g cm−2)RPD
RF0.84510.38522.54070.16540.80811.0946
DT0.88680.32922.97220.25311.23870.7141
LightGBM0.83760.39442.48110.41920.67421.3122
CatBoost0.96200.19075.13210.96080.56453.1571
Note: R2, coefficient of determination; RMSE, root mean square error; RPD, relative prediction deviation.
Disclaimer/Publisher’s Note: The statements, opinions and data contained in all publications are solely those of the individual author(s) and contributor(s) and not of MDPI and/or the editor(s). MDPI and/or the editor(s) disclaim responsibility for any injury to people or property resulting from any ideas, methods, instructions or products referred to in the content.