Article

Abiotic Indicators for Sustainability Assessment in a Post-Mining Coal Rehabilitated Area

Department of Chemistry, Physics and Environmental and Soil Sciences, Universitat de Lleida, Avinguda Alcalde Rovira Roure 191, E-25198 Lleida, Spain
*
Author to whom correspondence should be addressed.
Appl. Sci. 2025, 15(18), 10111; https://doi.org/10.3390/app151810111
Submission received: 29 July 2025 / Revised: 11 September 2025 / Accepted: 14 September 2025 / Published: 16 September 2025
(This article belongs to the Special Issue Advances in Green Coal Mining Technologies)

Abstract

The rehabilitation of coal mine sites in semi-arid environments is a step in combating desertification. A promising rehabilitation approach involves the development of anthropic soils that can support vegetation. However, reliable soil quality indicators are needed to evaluate long-term sustainability of rehabilitation strategies. In a coal mine area in northeastern Spain, two anthropic soils (0.5 m thick) were constructed by layering fine-textured coal residues at the bottom, topped with coarse overburden materials. Chemical fertility was enhanced using combinations of semi-liquid manure (25 or 60 mm) and straw (0 or 15 Mg ha−1), resulting in four treatments randomly distributed across both soil surfaces. Two abiotic indicators were selected for sustainability assessment: soil organic carbon (SOC) fractions and microstructure. Seven years after rehabilitation activities were completed, SOC fractions were analyzed. In addition, two years later, soil porosity and specific pore perimeter were also assessed in soil thin section images. The results indicated that the lower manure rate promoted more efficient SOC stabilization, evidenced by a 4–5-fold increase in specific pore perimeter at 0–5 cm depth, and lower fulvic acid content at 5–20 cm depth, compared with the higher manure rate. Micromorphological analysis proved to be a sensitive method for detecting early improvements in the physical quality of anthropic soils, highlighting the importance of adjusting manure rates for sustainable coal mine rehabilitation.

1. Introduction

Mine reclamation and post-mining transition have lately become issues of great interest for researchers and policymakers due to the increasing number of mines closing or expected to close in the coming decades worldwide [1]. In Europe, the ambitious goal of achieving climate neutrality by 2050 necessitates a comprehensive transition of coal sites [2]. This transition should be guided by territorial impact assessments [3], considering economic, social and environmental impacts [4]. Coal-producing regions are characterized by low population density and depopulation [2], a fact which further complicates the shift away from coal mining. In this context, the development of new anthropic soils is a matter of interest mainly if they can support vegetation, which must be adapted to the particular environments of mine sites.
The rehabilitation of degraded mine ecosystems plays a key role in any post-mining transition and in the effort to combat desertification. Rehabilitation processes should aim for solutions that are economically viable, sustainable in the long-term and sensitive to both ecological and landscape considerations. One promising approach involves the use of mine spoils and biowaste (such as manure compost) in the creation of anthropic soils. These materials represent a sustainable alternative to more aggressive or synthetic restoration methods, and their effectiveness has been demonstrated in various studies [5,6,7].
In Spain, mining companies are required to submit a Plan of Reclamation of Natural Spaces before starting mining activities, in accordance with Royal Decree 975/2009 [8]. The Plan must include a timeline for implementation, and an estimated cost of reclamation works [9]. Since mining activities occur in highly diverse regions of the Peninsula, from humid zones in the north to arid and semi-arid areas in the northeast, reclamation processes need to be thought out with consideration of the local climate. In the case of the Sant Jordi Mine, in the village of Mequinensa (NE of Spain), where this research was conducted, its restoration falls under the context of a semi-arid Mediterranean zone. This climatic context presents a significant challenge due to water stress in plants caused by high temperatures, and the erratic and scarce rainfall. This situation is further exacerbated by occasional torrential events, which lead to acute soil erosion in sloping areas.
The evaluation of rehabilitation techniques, as well as the quality of the resulting anthropic soils [10], requires the assessment of reliable indicators. Moreover, the sustainability and success of rehabilitation efforts require evaluation at different time scales, typically 8–10 years after the initial interventions [11].
In the Spanish Mediterranean area, indicators of the quality of soil rehabilitation works have mainly focused on erosion processes, nutrient availability or vegetation cover and its diversity [11]. In other Mediterranean areas, additional indicators apart from chemical ones (i.e., fauna recolonization) have been included [12]. Besides them, soil organic matter is essential in improving soil structure and infiltration, as well as water and nutrient holding capacity, thereby helping to mitigate the impacts of both droughts and floods [13], mainly in semi-arid environments. Therefore, variations in its content in a reclaimed coal mining area should be regarded as a crucial element affecting soil quality [14]. However, little is known about the medium-term dynamics of soil organic carbon fractions and their stabilization under semi-arid conditions. In fact, soil physical and chemical properties are greatly influenced by soil organic carbon (SOC) [15]. However, it is essential to differentiate SOC from other sources of carbon (C) present in soils, including coal-derived C and inorganic C found in carbonates [16]. In addition, oxidizable C, as well as humic and fulvic acids, should be considered. Therefore, the quantification of dissolved organic carbon is crucial, as it provides information on the amount of active or available soil carbon [17].
Beyond that, soil physical characteristics (such as porosity) should be studied, as they provide information on potential water infiltration rates, permeability and water holding capacity [18]. Pore size and aggregate distribution, for example, are closely related to soil organic matter content [19]. Micromorphology can provide precise information about soil porosity by image analysis. Additionally, thin section studies can reveal small changes in soil evolution before they can be detected by physical or chemical analysis [20].
The sustainability assessment of the restored Sant Jordi coal mine (NE of Spain) based on SOC and porosity was conducted in two sites. The first site was located on steeply sloping coal spoil banks where different organic materials (including sludge) were applied [7]. This article focuses on the second restored site, located on the upper flat area of a filled valley with overburden materials. Our main purpose was to determine, in the medium term, the sustainability of the new soils created with different mixtures of overburden materials from coal mine, semi-liquid manure (manure) and straw. Our hypothesis is that the effectiveness of the applied rehabilitation technique can be assessed through the analysis of SOC and its different fractions, together with micromorphological study.
Accordingly, the aim of this study was to evaluate two abiotic indicators for assessing the sustainability of anthropic soils developed through the coal mine rehabilitation process. The selected abiotic indicators were (i) the distribution of SOC fractions, including humic and fulvic acids, and (ii) soil physical properties (porosity and specific pore perimeter) analyzed through micromorphological techniques.
In the context of coal mine rehabilitation strategies in semi-arid environments, this study’s novelty lies in the integrated application of both chemical and microstructural abiotic indicators to evaluate the development and long-term sustainability of anthropic soils. The combined use of these techniques also provides new insights into the role of semi-liquid manure management in promoting soil structural stabilization.

2. Overview of the Research Area

The coalfield restored site was in a NE part of Spain (41°21′10″ N, 0°22′21″ E), in the oriental extremity of Ebro’s Cenozoic basin. Geological materials of the area are lacustrine limes, alternating with lignite and gypsum. The most common soils of the area are classified as Xeric Torriorthent [21] with a maximum rooting depth of 0.45–0.50 m. Natural soils of the site represented by two pedions (PE–01 and PE–02) have a basic pH, and a high carbonate and soluble salts content. The presence of gypsum is important. Fertility is low (Tables S1–S6).
The area is characterized by a market annual thermal oscillation. Maximum average temperature ranges from 30 to 35 °C in the hottest months of July and August but maxima can be higher than 40 °C. In winter, average minimum temperatures are around 0 °C in the coolest months of January and December, with absolute minima reaching −7 °C. Annual precipitation follows a Mediterranean pattern with drought periods. Rainfall events are mainly concentrated in autumn and spring. The annual average precipitation ranges between 330 and 400 mm. The annual average evapotranspiration, based on Thornthwaite formula [22] is 965 mm. In winter, water deficit is partially mitigated by the presence of fog. During the summer months, average monthly rainfall varies between 15 and 30 mm, which means an important water deficit. These characteristics, based on Thornthwaite climate classification [23], define the site as semi-arid.
The natural vegetation is dominated by shrub communities belonging to the Rosmarino-Ericion alliance which includes different species such as Rosmarinus officinalis, Thymus vulgaris, Eryngium campestre or Sedum sediforme [24].
The origin of coal production in the area can be associated with the European industrial revolution as in other coal areas in Europe [25]. Lignite was mined from deep chamber galleries. From the 19th century onwards, overburden residual materials (ORM), mainly limestone fragments up to 25 cm in length, shaped new bare landscapes in the area as these materials were reused for valley fillings. In addition, other residual material was available from settling ponds of water which were formerly used to separate lignite from ORM by flotation. This sedimented material from settling ponds was identified as silt-sized coal (2–50 µm size) or fine-sized residual coal (FRC).

3. Materials and Methods

3.1. Reclamation of Flat Upper Areas of Valley Filled Sites

In a flat area, at the top of a filled branch of the Cova Plana ravine (Figure 1), two experimental field strips (designated AI and AII) were defined. Each strip was 10 m wide and 140 m long. The distance between both strips was 1 m.
Over each marked strip, both residual materials (ORM and FRC) were deposited. The first strip (AI) consisted of a 0.1 m layer of FRC at the bottom, topped with 0.4 m of ORM. The second strip (AII) consisted of a 0.3 m layer of FRC at the bottom and 0.2 m of ORM on top. The FRC had a very low saturated hydraulic conductivity (2.8 × 10⁻⁷ m s−1 on average) and was placed at the bottom layer to prevent leaching and to maintain the water content in the upper soil layer. The ORM fraction due to its coarse fraction (90% in weight) functioned as a mulch in the upper layer, favoring water infiltration but preventing evaporation. Evaporation of water moving up from deeper layers was also prevented due to the breaking effect of ORM on the hydraulic conductivity.
The depth of both strips matched the maximum rooting depth of soils in the area (Tables S1 and S3), as well as their low fertility and general chemical properties (Tables S2 and S4). The ORM fraction lower than 2 mm of apparent diameter size represented 10% of the total weight of this material, and its texture was sandy loam [26]. The pH (1:2.5, soil–water) was 7.5, equivalent carbonate (Bernard calcimeter) was 520 g kg−1 and electrical conductivity (salinity) measured in the saturated extract was 6.3 dS m−1. The FRC fraction contained no coarse fragments, but it had similar chemical properties: pH (1:2.5, soil–water) was 7.6, equivalent carbonate was 521 g kg−1 and electrical conductivity (salinity measured) with a conductimeter GLP 31 (Hach Lange Spain, Barcelona, Spain) in the soil saturated extract was 6.3 dS m−1. The FRC main difference with the ORM fraction was its silt texture [26].
Each strip was divided into four plots (10 m × 35 m each). In each plot, a main treatment defined by the surface application (SI) or not (S0) of 15 Mg ha−1 of barley chopped straw was randomly assigned. Thus, each main treatment had two replicates per strip. Furthermore, a secondary treatment consisting of two surface-applied manure rates (25 mm or 60 mm) was randomized within the main treatment of each strip. Hog semi-liquid manure was applied weekly at the rate of 12–12.5 mm and immediately, after each application, it was lightly incorporated using a spring tine cultivator. This weekly application rate corresponded to the maximum volume that could be applied in a single pass with the available machinery. As a result, manure application lasted two weeks for the 25 mm treatment (25) and five weeks for the 60 mm (60) treatment. These application rates were equivalent to 27.3 and 65.5 Mg ha−1 of organic matter, respectively.

3.2. Sampling Survey

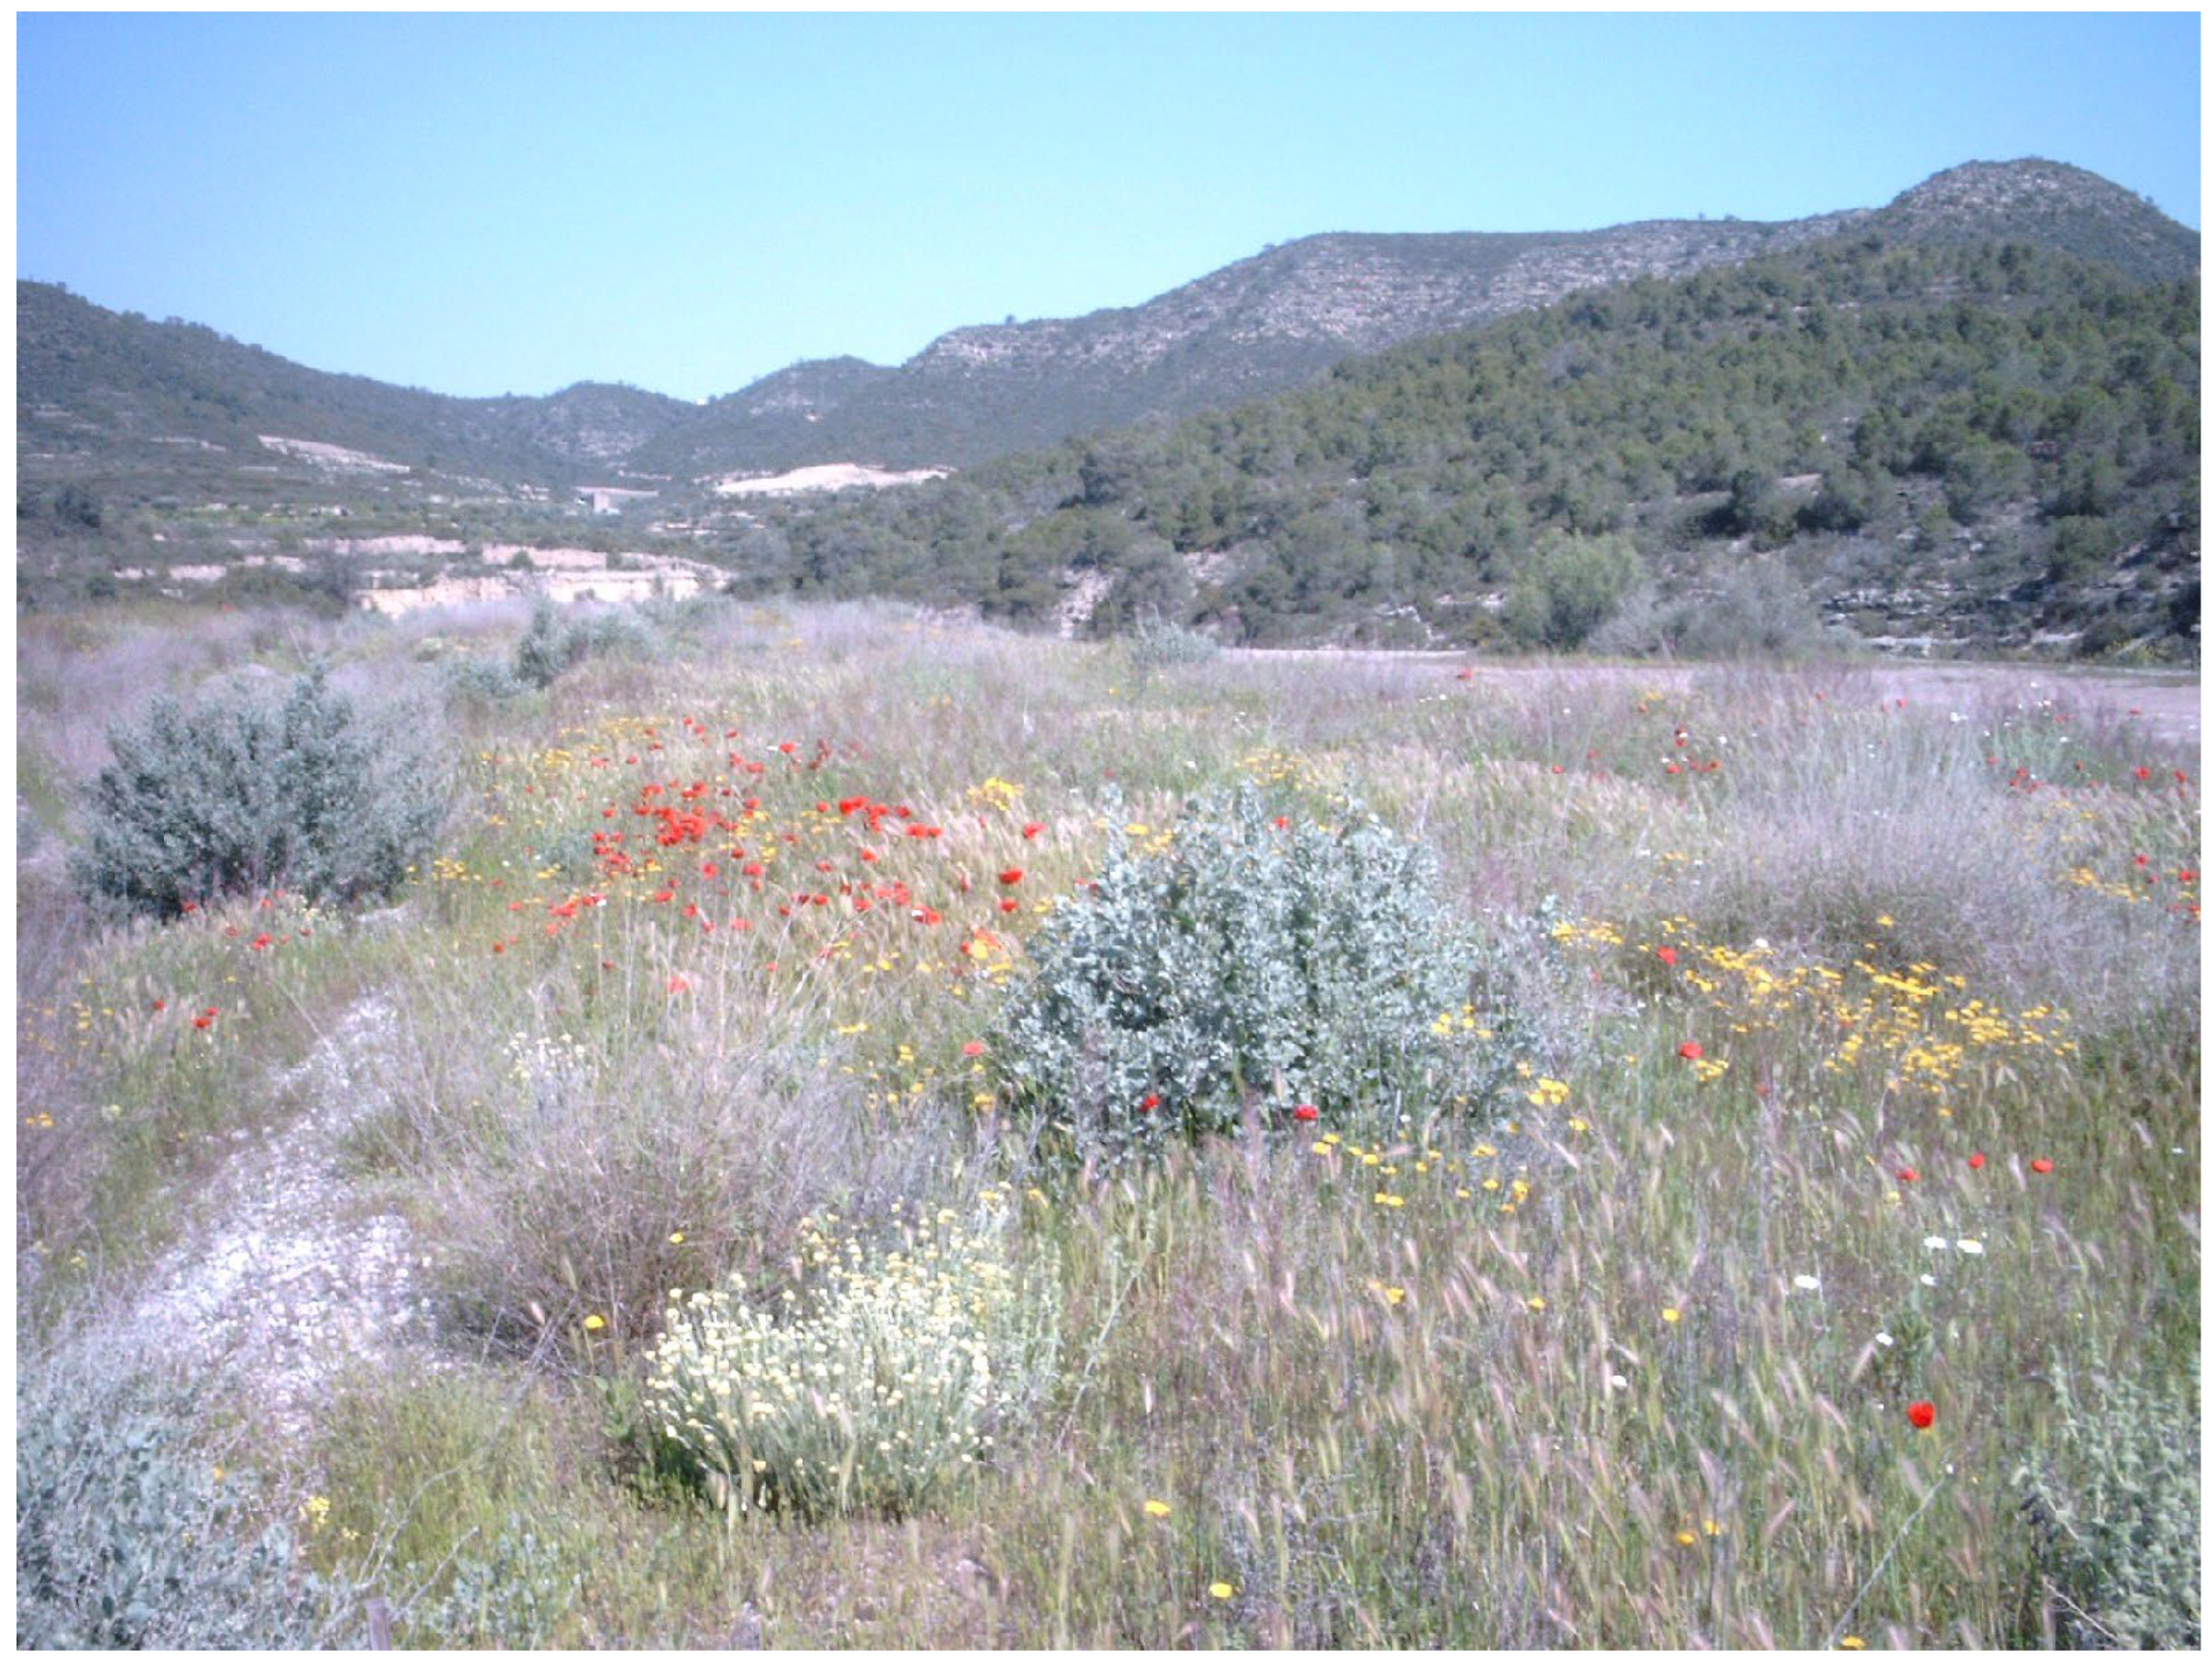
Vegetation was established on the experimental plots (Figure 2). Seven and nine years after rehabilitation works, soil samplings were conducted for soil quality assessment. After seven years, the evaluation was based on SOC fractionation, and two years later on physical properties through micromorphological techniques.
Samples obtained for SOC analysis were identified by strip area (AI or AII) and by the plot number within each strip (from 1 to 4). Treatments were identified according to the incorporation of 15 Mg ha−1 of straw (SI) or its absence (S0), followed by a number (25 or 60) corresponding to the applied manure rate of 25 mm or 60 mm (Table 1). For micromorphological analysis, samples were collected from a depth of 0 to 5 cm.

3.3. Soil Organic Carbon

Two composite samples per plot were prepared by combining material from three sampling points, located 2–3 m apart in a zigzag layout. The sampling points were randomly selected in the first third of the plot length, in the middle and in the last third of the plot. Each composite sample corresponded to two different sampling depths, the first from 0 to 5 cm and the second from 5 to 20 cm (Table 1), without reaching the FRC layer (Table 1). These sampling depths were chosen because within the first 5 cm depth a shallow soil layer (superficial horizon) was differentiated from deeper layers.
Fresh soil was stored at 4 °C and samples were processed one day after collection. Part of the fresh samples were used for the analysis of soluble C extracted with water [27] at room temperature (22 °C). The analysis of water-extractable organic carbon (OCwe) was based on the determination of the total oxidizable carbon present in the extract. This fraction includes the water-soluble organic matter formed by molecules with low molecular weight and high hydrophilic character, which are not part of the soil microbial biomass. The organic matter soluble in water is composed of easily biodegradable substances.
The rest of the samples were air-dried and sieved to 2 mm. In the dry samples, SOC was analyzed by wet oxidation at 105 °C (OCtc) [28] or at room temperature (OCto) following the Walkley-Black procedure [29,30]. The OCtc and OCto analysis involved the oxidation of organic matter with potassium dichromate (K2Cr2O7) after the addition of sulphuric acid (H2SO4). The residual dichromate was titrated with ferrous sulfate. Humic and fulvic acids were also analyzed through a series of sequential extractions, according to a standard procedure [31]. This method determines the percentage of fulvic (FA) and humic acids (HA) through successive extractions at increasing pH using an alkaline reagent. The soil was first treated with phosphorus acid, which broke the links between organic matter, cations and clay, and removed most of the light material that should not be present in order to avoid the formation of new humic compounds [32]. Subsequently, the residue was treated with sodium pyrophosphate (Na4P2O7, pH near 10) and finally with sodium hydroxide after the extractions were completed.

3.4. Micromorphology

Micromorphological techniques were used to study soil organic matter distribution and porosity. In each plot, one prism (6 cm depth × 9 cm thick × 19 cm long) from the middle of each replicate plot was sampled following [33]. One prism was also obtained from the basin where the fine-sized residual coal was stored. The prisms were air-dried and then placed in a container to be impregnated with polyester resin. The resin polymerized and produced a compact block that preserved the natural soil structure. Finally, once the sample was fully solidified, thin sections (5.5 cm high, 13 cm wide and 30 μm thick) were obtained. The sampled thin sections were described according to the terminology and concepts developed by [34]. An Olympus BX51 polarizing petrographic microscope (Evident, Tokyo, Japan) was used. Petrographic microscopes allow us to observe the samples in transmitted polarized light (PP) and under cross-polarized (XP) light by inserting a polarizer perpendicular to the one used in PP between the eye and the sample. The colors observed under XP light are referred to as interference colors, which are used for the interpretation of the anisotropic, non-opaque components.
For the porosity quantification, two images, 3.35 × 2.51 mm2 in size, were taken from each thin section with an Olympus® C-7070 wide zoom camera (Olympus, Tokyo, Japan) coupled to the microscope, with a resolution of 28.34 pixels mm−2.
The obtained PP images were binarized using the Adobe Photoshop to assess for porosity. The total area and perimeter of the different pores was calculated with UTHSCSA Image Tool Software, version 3.0. In addition, the specific pore perimeter (equivalent to the specific area in 3D) of the studied images was expressed in relative terms of total pore perimeter versus studied surface area.

3.5. Statistical Analysis

The MIXED procedure of the statistical package SAS (v9.4) [35] was used for statistical analyses. In soil organic matter studies, the analyses were performed for both sampling depths (0–5 cm and 5–20 cm). When significant differences between treatments were found, least-squares means (predicted marginal means) were computed to perform comparisons among means. Strips A-I and A-II were considered replicates (blocks) for plots receiving the same manure and straw treatment. In the sampling performed, the ORM substrate of all samples was the same because soil was sampled up to a depth of 20 cm.

4. Results

4.1. Soil Organic Carbon Content

No statistically significant differences were found between treatments in the upper layer (0–5 cm) for the different analyzed organic carbon fractions (Table A1). In this top layer (0–5 cm), the average OC content was 0.26, 104.44, 74.78, 13.91 and 75.18 (g kg−1) for OCwe, OCtc, OCto, HA and FA, respectively. For these parameters, the FRC values were 0.16, 58.58, 48.73, 5.32, 37.21 (g kg−1) respectively, and for the ORM were 0.11, 65.61, 52.24, 8.71 and 55.33 (g kg−1) respectively. Changes in the different OC fractions in the top layer, compared with the original ORM material used for restoration, were not significant. Fulvic acid content was three times to eight times higher than humic acids content in treated plots, while in ORM and FRC this ratio ranged between six and seven (Table 2).
In deeper samples (5–20 cm), significant differences in fulvic acid content were found between manure rates (Table A2 and Table 3), with the highest value (average of 54.6 g kg−1) observed at the 60 mm application rate compared with the 25 mm one (average of 40.6 g kg−1).

4.2. Micromorphology of the Upper Soil Layers

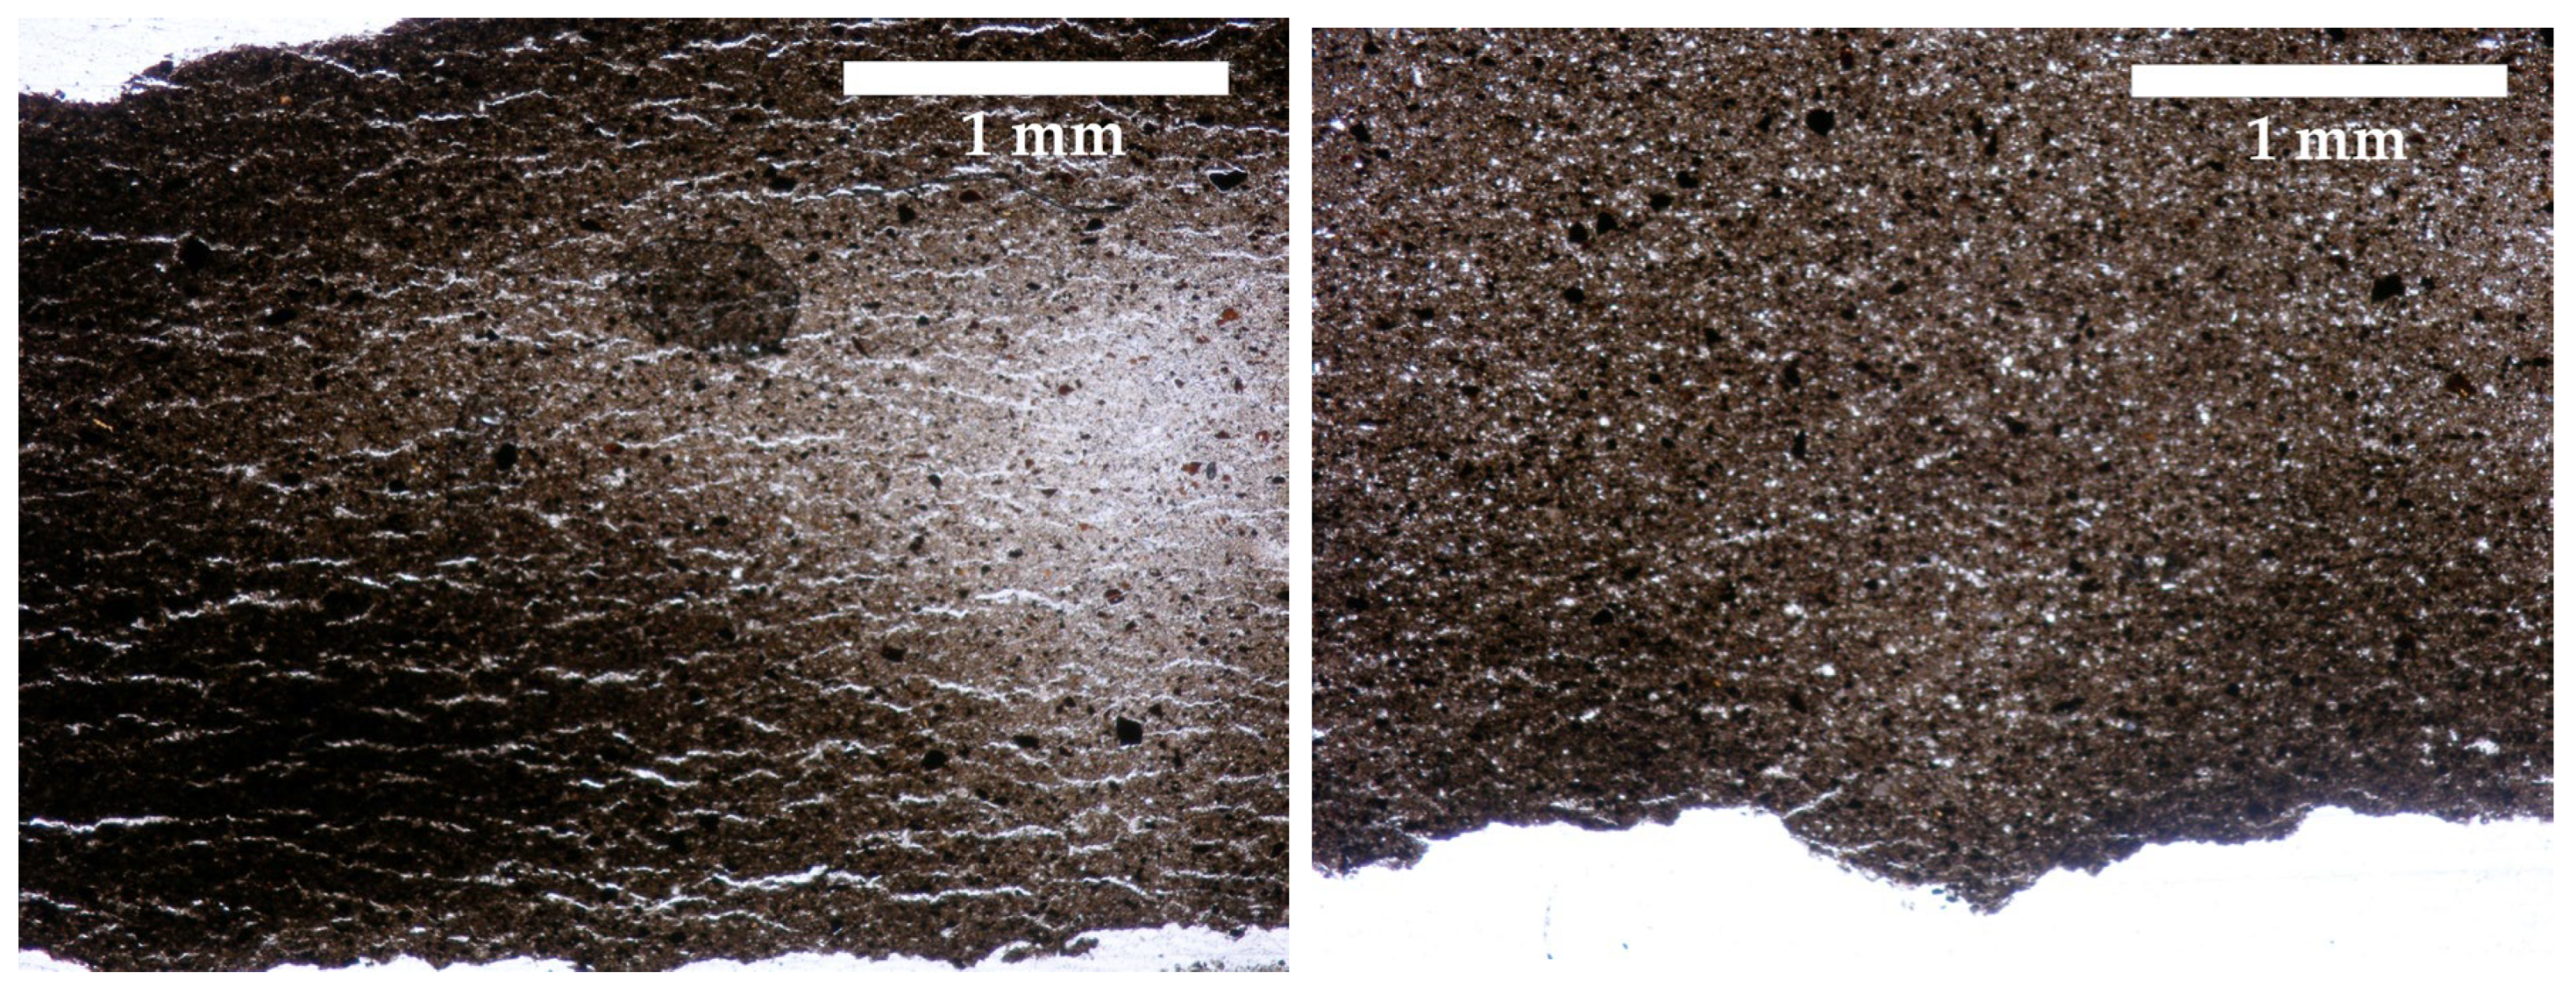
The FRC material (stored in a basin) and used for mine restoration contained no coarse elements and was compacted, as shown in thin sections by a laminar structure which was observed in approximately 76% of the thin section area. Calcite was present in particles ranging from 0.5 to 2 mm in size, occupying about 1% of the observed area. Some rounded channels and isolated vesicles were also observed (Figure 3, Table S7).
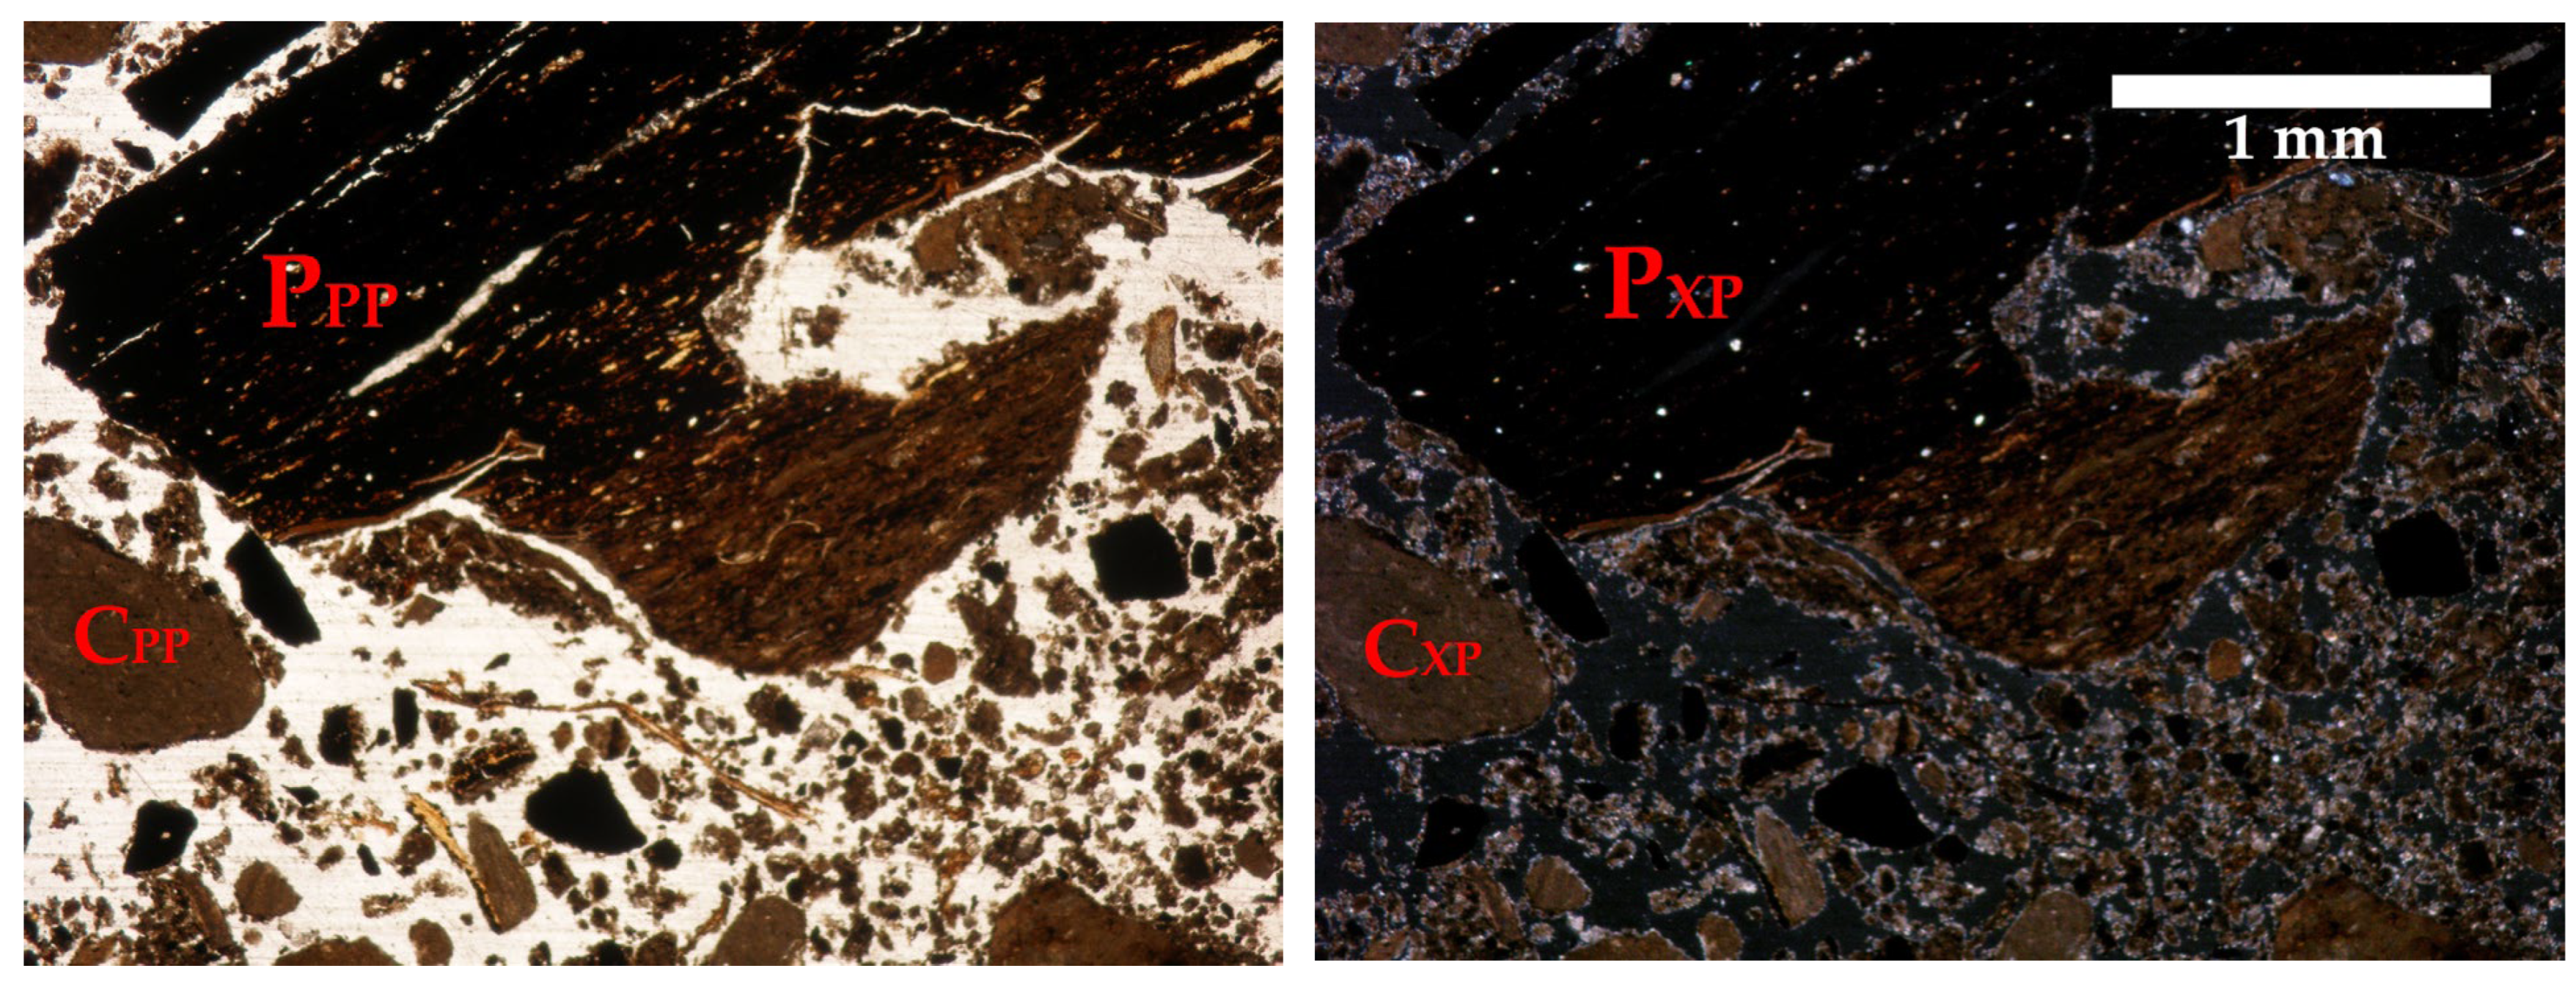
The incorporation of manure at a rate of 60 mm (S0-60), without straw, promoted the developement of a crumb structure, with crumbs ranging from 1 mm to 4 cm in size. This structure was observed in c. 75% of the thin section area (Figure 4). The distribution of coarse elements, fine materials and organic matter approached 45%, 22% and 8% of the area, respectively. The coarse material included calcilutite fragments, black carbon, manure components and mica (Table S6). Organic residues included plant tissues and fungal structures, as well as non-identifiable organic residues and fine organic material (Table S8). The incorporation of organic matter with mineral materials was mainly observed at the top of the thin section (within the first few centimeters).
At the lowest manure application rate (25 mm) without straw, the crumb structure was still present in c. 80% of the area (Figure 5), although its size was smaller (between 0.25 mm–1.5 cm). The proportion of the organic matter in the overall distribution of coarse elements, fine materials and organic matter approached 45%, 21% and 14% of the total area, respectively. The coarse materials were similar to those found in plots receiving the highest manure rate (Table S9), although in this case it was possible to observe organic elements randomly distributed or clustered among the mineral material. The composition of coarse elements was consistent with the ones presents in soils of the area (Tables S2 and S5), with the presence of fragments of calcilutites, black carbon, quartz and mica. The presence of organic materials was notable but lower than in the thin section with straw (Figure 6 and Figure 7; Tables S10 and S11) or in the section with both straw and high manure rate (Table S12).
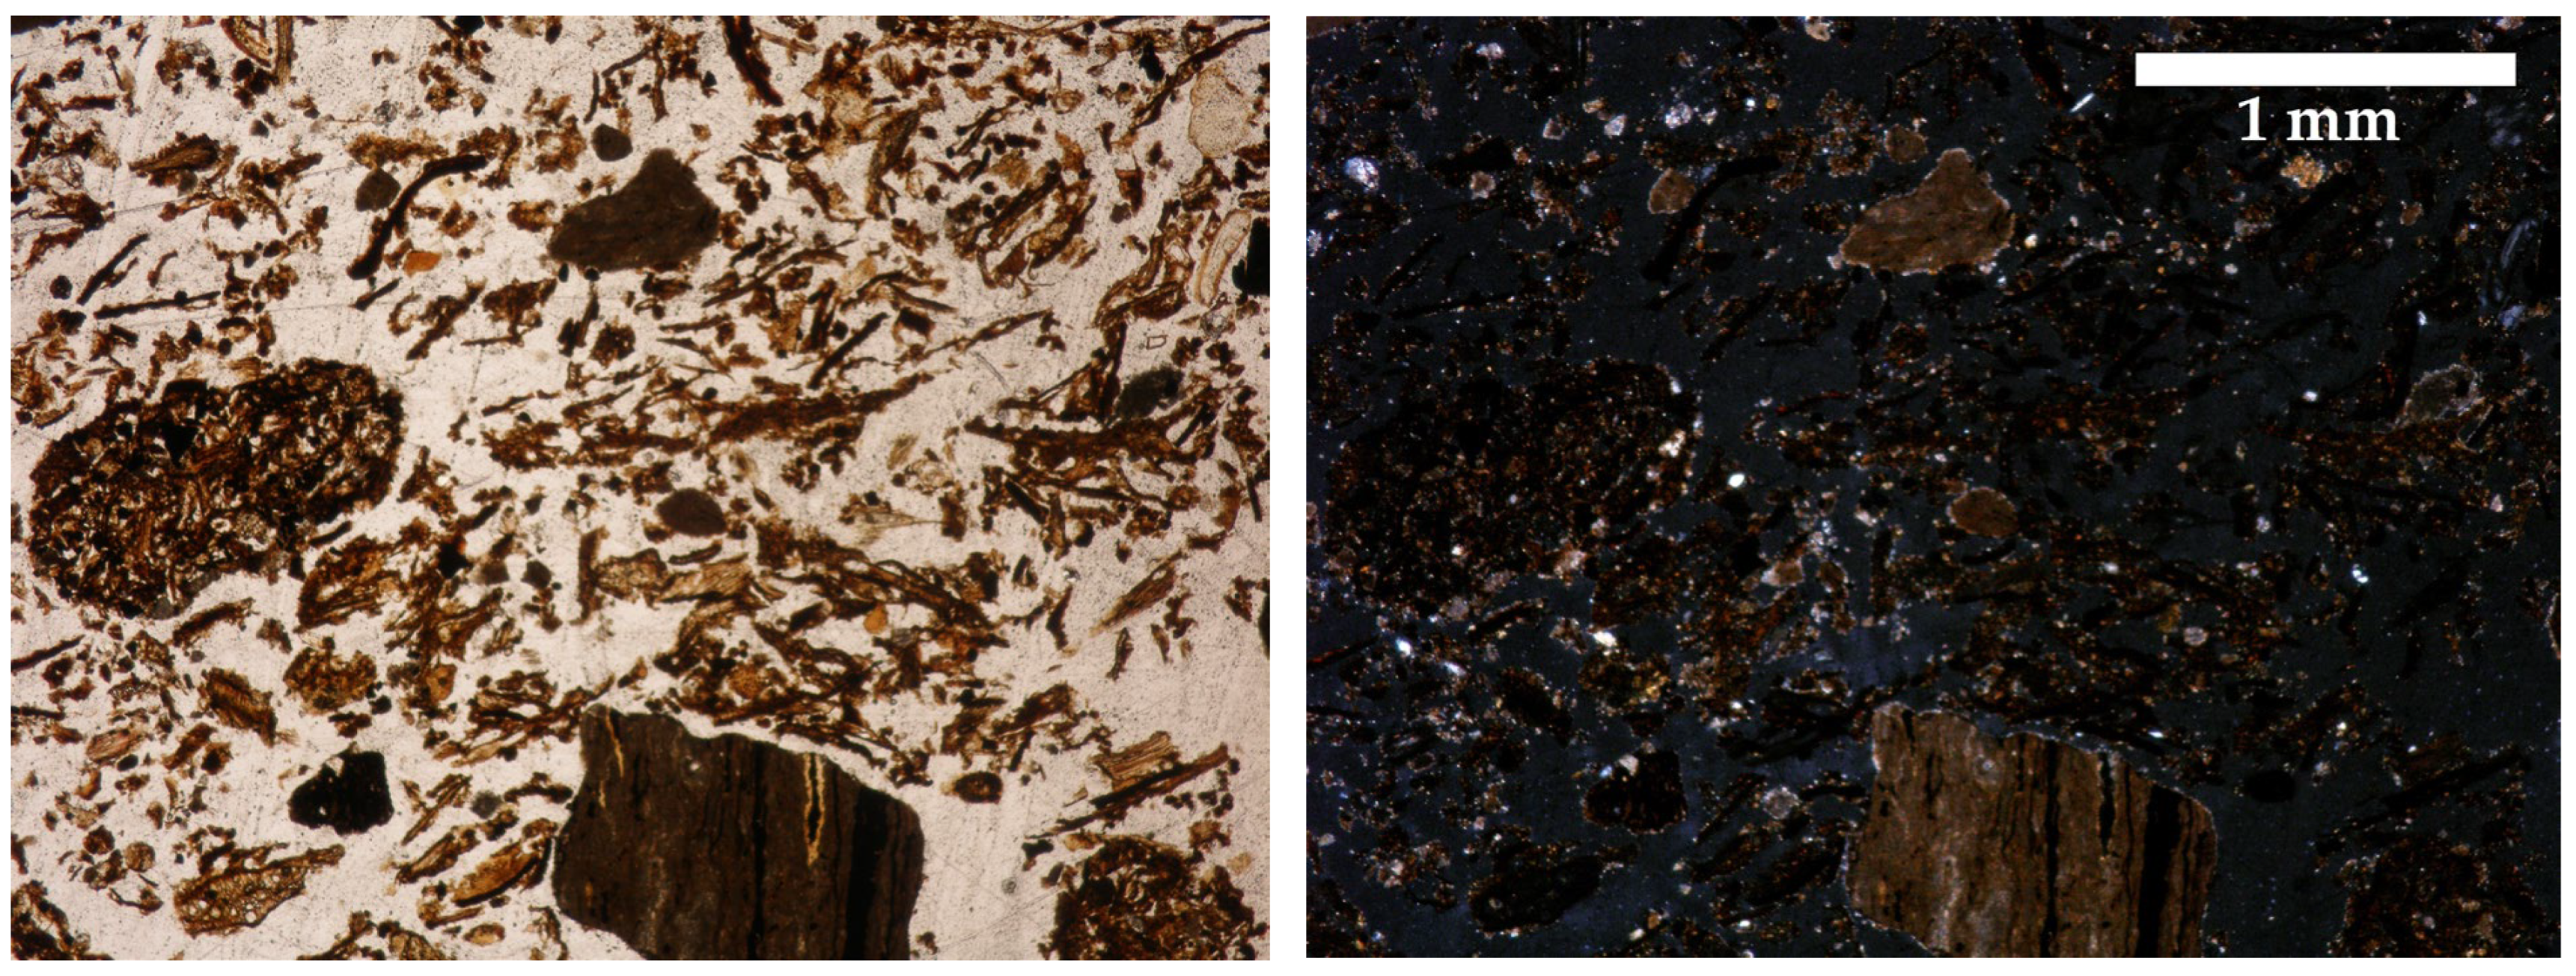
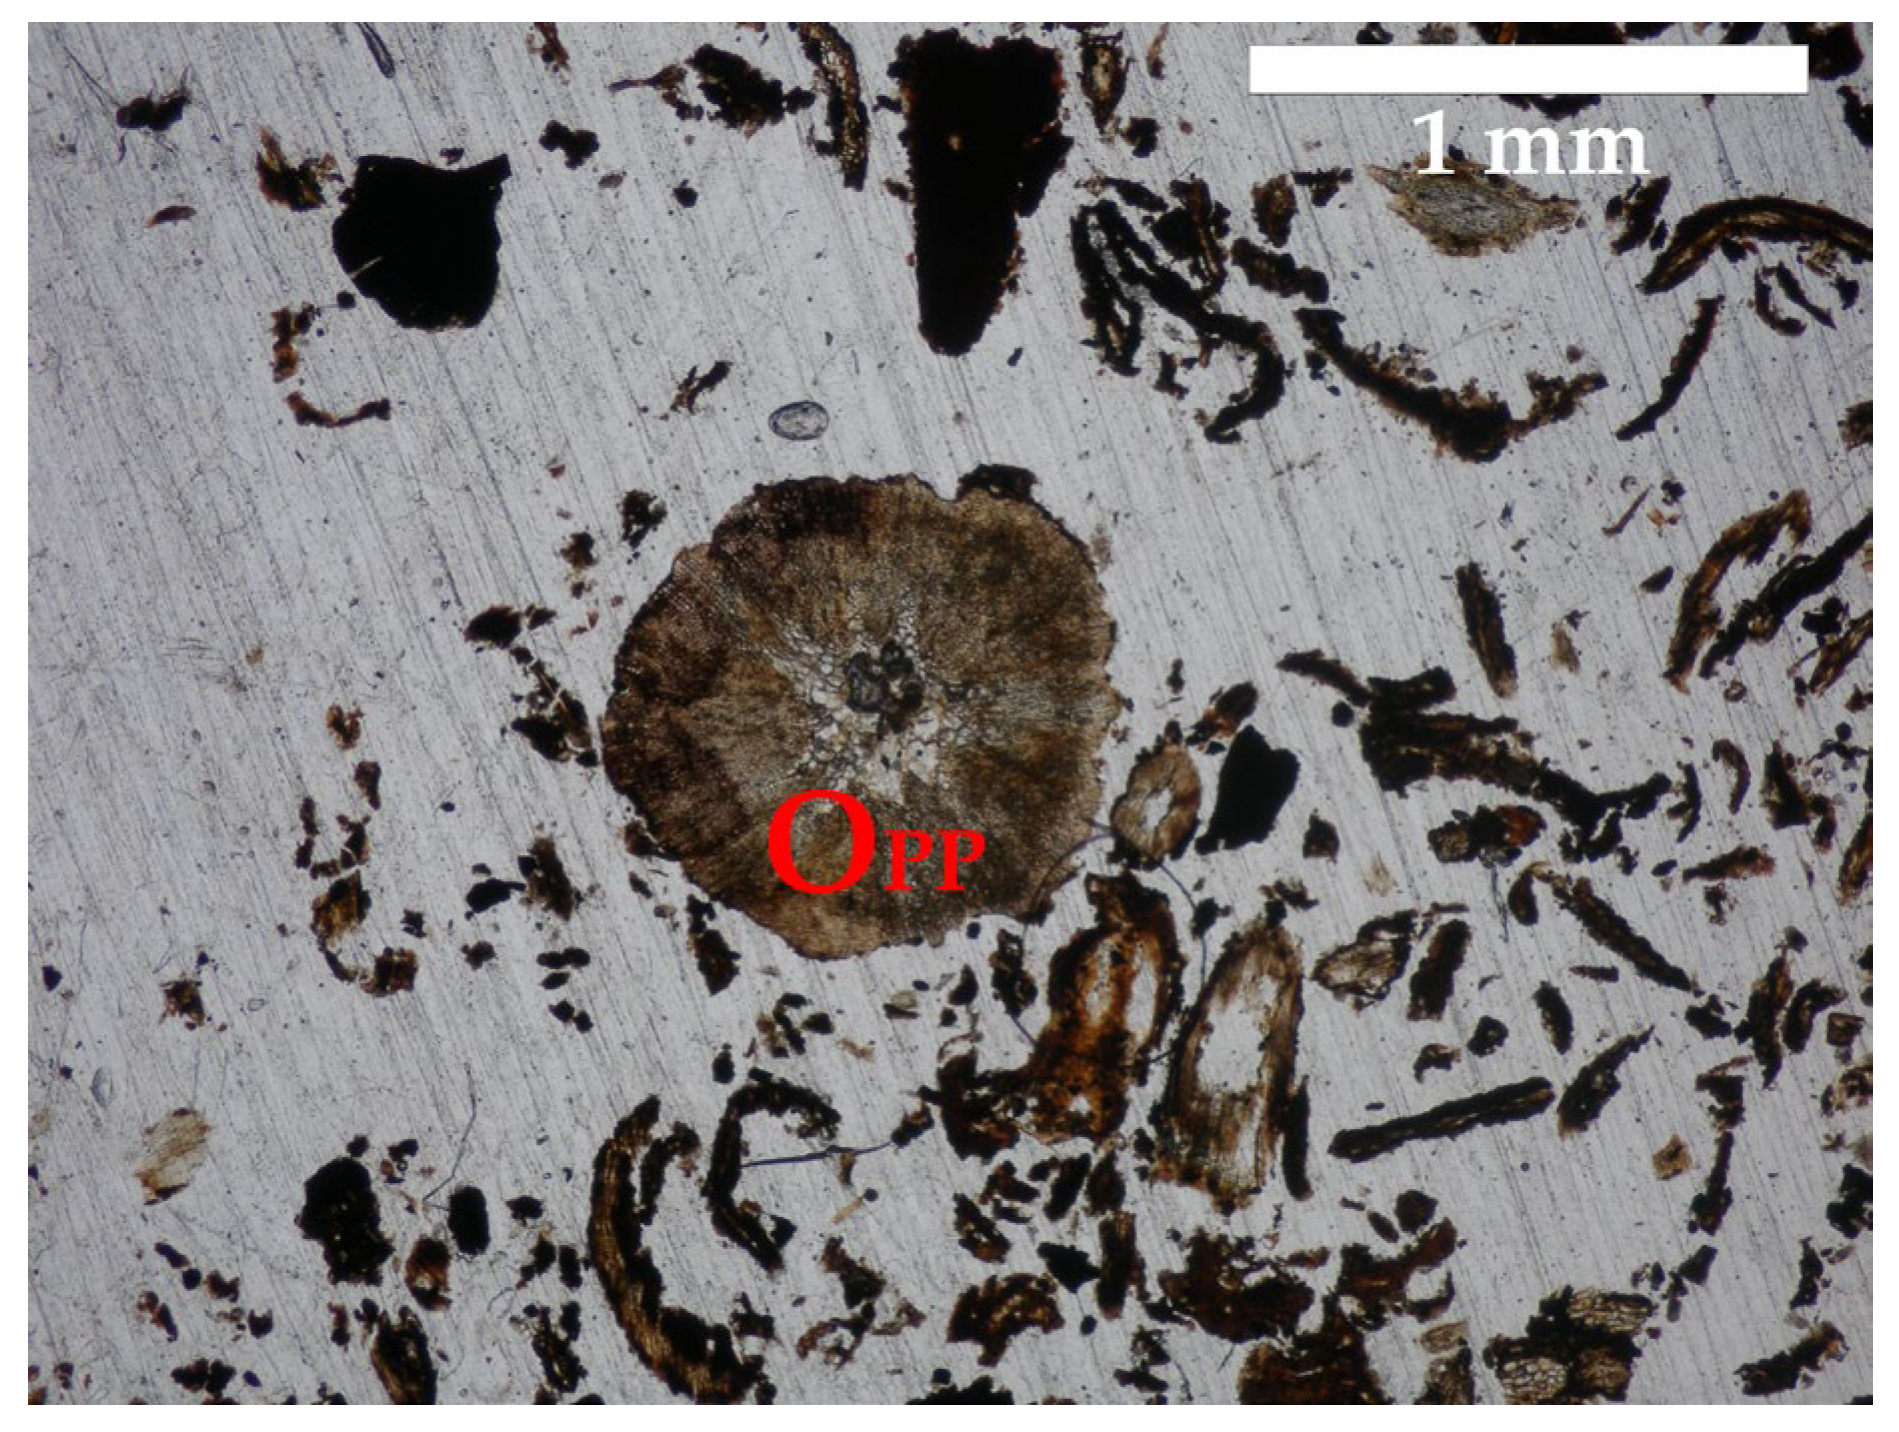
Thin sections from plots where straw was added showed a greater presence of fiber remains (Figure 6). At the lower manure application rate (25 mm) with straw, a crumb structure was present in c. 60% of the total area (Figure 6; Tables S10 and S11), with particles ranging from 0.5 mm to 3 mm in size. The overall distribution in the thin section of coarse elements, fine material and organic matter values were 30%, 11–15%, and 14–15%, respectively. The composition of the coarse elements (calcilutites, black coal, quartz) matched that of soils in the area (Tables S2 and S5). Abundant organic matter was found dispersed among the mineral material and its degree of decomposition was not uniform (Figure 7, Tables S10 and S11). Their presence was greater than in the 60 mm rate without straw (Figure 4). Some particles from the applied manure were present, ranging in size from 0.25 mm up to 5 cm, although most were within the size interval of 0.25–0.5 mm. High biological activity was also observed.
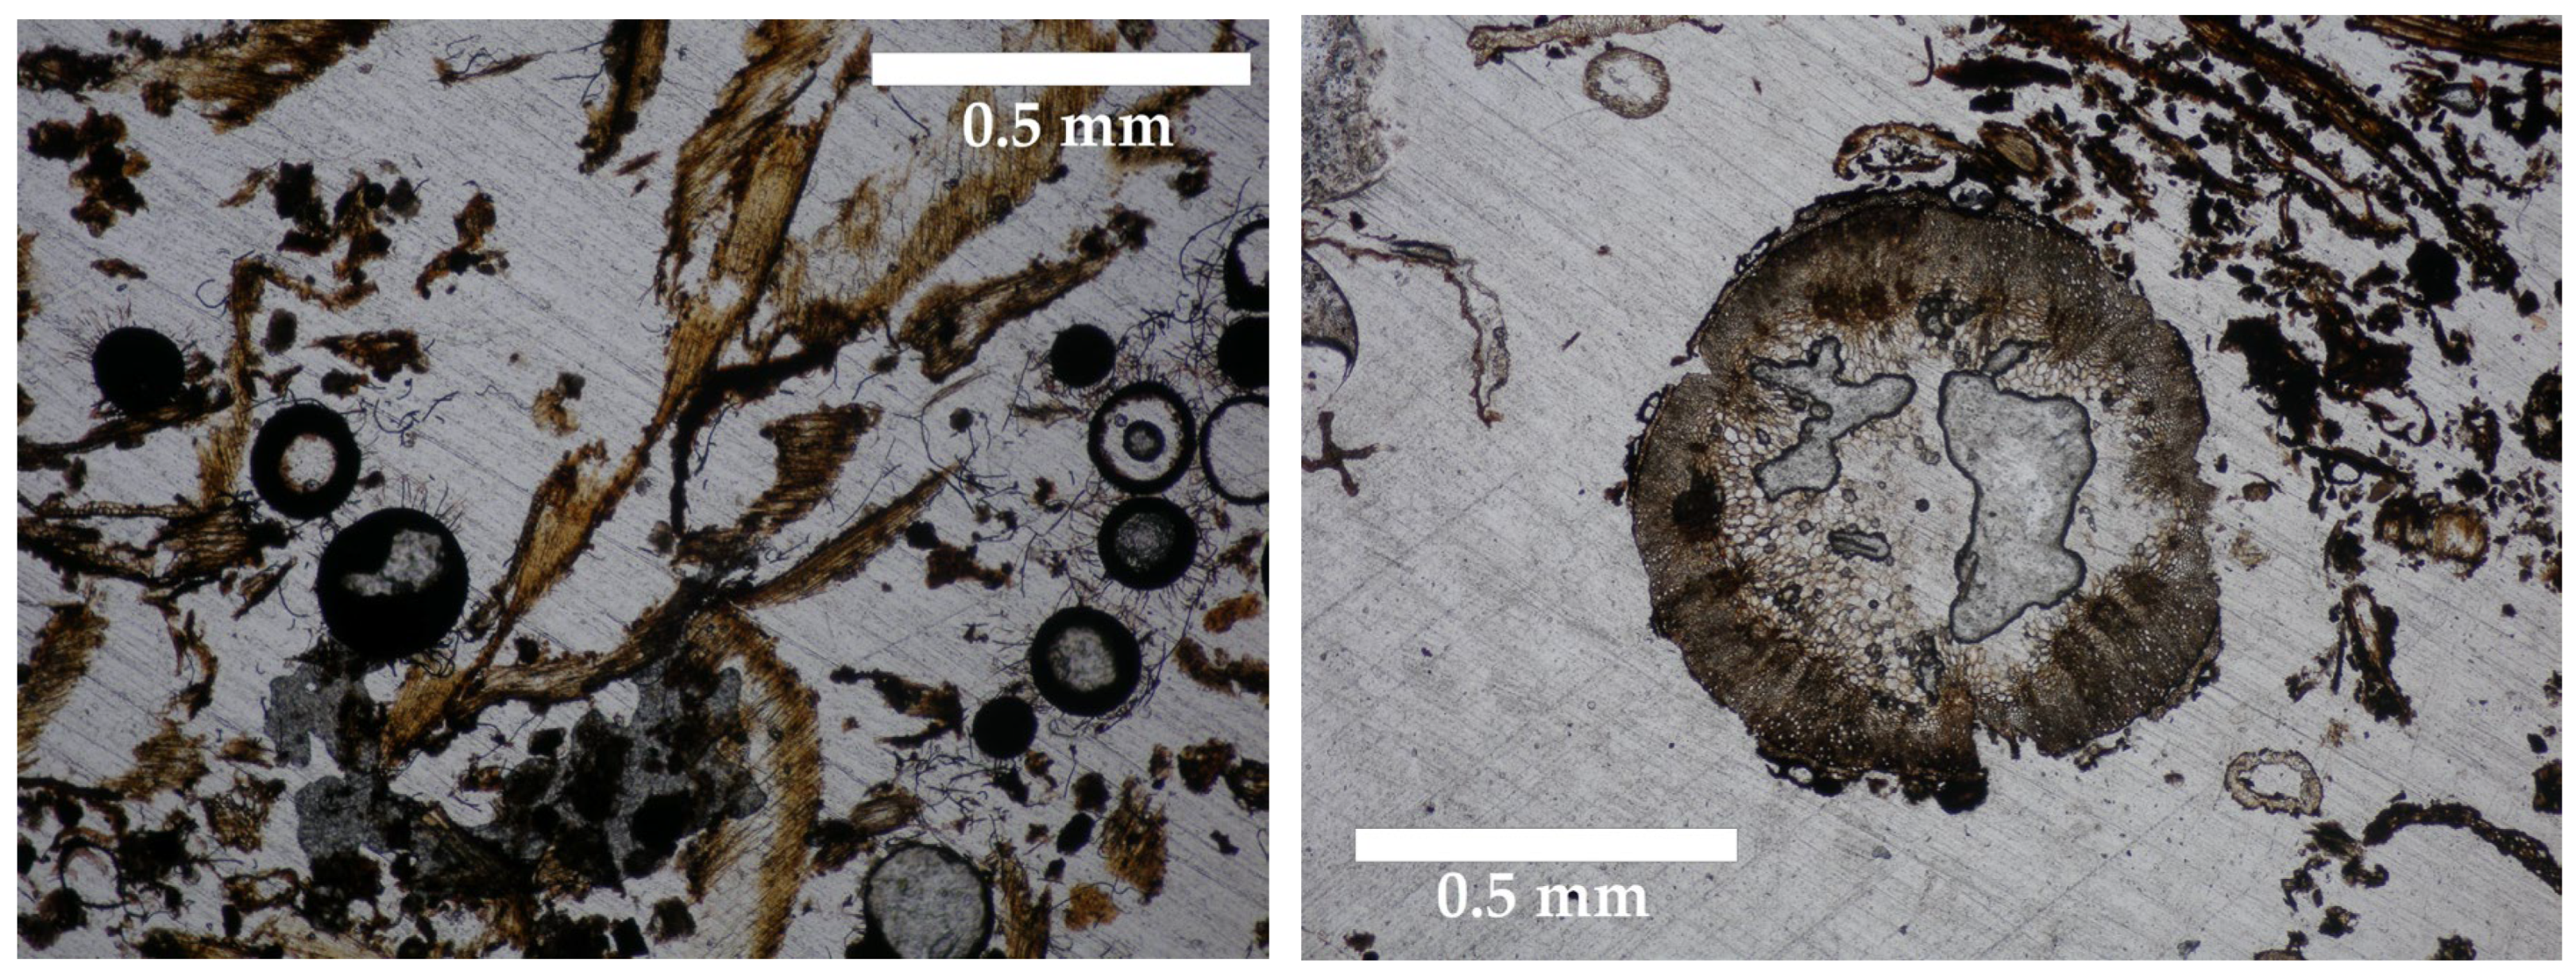
At the highest manure application rate (60 mm) combined with straw, a crumb structure was observed in 70% of the total area, ranging in size from 0.5 mm to 2 cm. The distribution of coarse elements, fine materials and organic matter in the thin section was 40%, 10%, and 20%, respectively. The organic matter included both decomposed and non-decomposed materials (Figure 8, Table S12). The most recognizable cell structures were surrounded by abundant fungal hyphae.
Regarding the study of porosity, most pores were of the compound packing type (Figure 4, Figure 5, Figure 6, Figure 7 and Figure 8; Tables S8–S12). No statistically significant differences were found in terms of porosity between the applied treatments (Table A3 and Table 4). The average porosity values (expressed as a percentatges) were 36.4% and 29.6% for manure treatments of 25 and 60 mm, respectively. In plots without straw, the average porosity was 28.7%, while in plots with straw it reached 37.2%.
Specific pore perimeter was significantly higher in plots receiving 25 mm of manure than in those receiving the higher rate of 60 mm (Table A3 and Table 4). No significant differences were associated with the incorporation of straw.

5. Discussion

The studied coal mine was devoted to the extraction of sub-bituminous coal (lignite), which is known to contain considerable amounts of aliphatic and aromatic structures and to be a source of humic and fulvic acids [36] although their quantification depends on the extraction method used [37]. In this study, the HA and FA contents measured in the ORM material and in the soil layers of the restored area (8.71 and 55.33 mg kg−1 respectively) are consistent with their lignite origin (Table 2 and Table 3). The establishment of spontaneous vegetation (Figure 2), similar to that described in the surrounding mining area [24,38], did not significantly increase HA or FA contents in the 0–5 cm layer (Table 2), indicating limited short-term humification. This is expected because organic inputs from early plant colonization (such as proteins) must undergo biodegradation before contributing to humic substances, while lignin, although a precursor, decomposes relatively quickly and through poorly understood pathways [39]. The slight, non-significant trend toward higher HA with straw incorporation (Table 2), may be related to the one-time straw application, its low humification coefficient of 0.15 [40], and limited plant turnover during the first years.
A significant result was the lower FA content at 5–20 cm depth in plots receiving 25 mm of manure compared to 60 mm (Table 3), suggesting a more advanced FA transformation at the lower application rate. Because FA molecules are smaller than HA [41], they interact more readily with plant roots and soil minerals, potentially leading to faster incorporation into stable organic matter. Although knowing the detailed molecular evolution of FA and HA requires advanced analytical techniques [42] our results indicate that HA and FA contents approached OCto values, while OCtc captured more recalcitrant oxidizable organic carbon fractions (Table 3), likely to contribute to long-term SOC sequestration [43].
The OCtc and OCto fractions themselves did not differentiate between treatments but did show enrichment in the upper soil layer compared to the original overburden material, reflecting the combined influence of lignite-derived carbon and plant litter inputs, as other authors observed in rehabilitated mine soils rich in lignite-derived carbon [44]. The OCwe values in the topsoil were similar to those found in agricultural soils [45], reinforcing the conclusion that overburden materials amended with manure support functional organic carbon pools.
Micromorphological observations provided the clearest evidence of pedogenic change. Compared with the compact laminar structure of untreated fine-sized residual coal (Figure 3), all treatments developed a crumb structure in the 0–5 cm layer (Figure 4, Figure 5, Figure 6, Figure 7 and Figure 8), indicative of soil formation processes [46]. Organic residues, both amorphous and lignified, were well incorporated with mineral particles, supporting active biological processing. Treatment differences were most evident in aggregate size and distribution: higher manure rates (60 mm) produced larger aggregates, often containing undecomposed material, while lower rates (25 mm) resulted in smaller, more uniformly mixed aggregates. The latter configuration increased specific pore perimeter by 4–5 times (Table 4), enhancing reactive surface area for water–air exchange and nutrient cycling.
The combined interpretation of micromorphological observations and SOC fractionation offers deeper insights into the pedogenic processes occurring in the newly developed anthropic soils. The finer and more uniformly distributed crumb structure observed under the lower manure rate aligns with the lower fulvic acid content at 5–20 cm depth, suggesting a faster incorporation of labile organic compounds into more stable soil aggregates. In contrast, the higher manure rate favored the formation of larger aggregates containing partially undecomposed organic residues, coinciding with higher fulvic acid concentrations, indicative of slower organic matter transformation and stabilization, likely due to organic matter occlusion limiting accessibility to decomposer biota [47]. These complementary findings underscore a synergistic relationship between chemical and physical indicators: the micromorphological evidence of increased specific pore perimeter under the lower manure rate parallels the chemical signal of reduced soluble organic fractions. Together, these results support the conclusion that reasonable organic input management can enhance both structural stabilization and organic matter humification in anthropic soils under semi-arid conditions.
These structural differences alight with known risks of excessive manure application, such as accumulation of undecomposed residues that can negatively affect soil fauna in agricultural soils, as oribatid mites, which are one of the first actors of organic matter transformation as well as good indicators of environmental disturbances [48]. Similar results, pointing to deleterious effects of excessive amendment doses, were observed by [49] in agricultural soils amended with sludges. In contrast, the finer aggregation and higher pore perimeter observed at the lowest manure rate suggest more efficient organic matter decomposition and faster structural stabilization, supporting the recommendation of moderate amendment rates for anthropic soil development in this environment.
It should be added that from the point of view of practical implementation, the experimental design with replicated treatments, the use of standardized laboratory protocols for SOC and micromorphological analyses, and the description of soil construction procedures ensure reproducibility of the methodology and results.

6. Conclusions

The rehabilitation treatments applied to the degraded coal mine area, combining overburden residual materials with fine-sized residual coal, straw and two semi-liquid manure rates, promoted the formation of anthropic soils that, after 7–9 years, showed measurable chemical and physical improvements. These outcomes demonstrate the effectiveness of combining mine spoils with organic amendments for restoration in semi-arid conditions.
From a chemical standpoint, the experimental design allowed differentiation of soil organic carbon fractions. Reducing the manure rate from 60 mm to 25 mm lowered fulvic acid content at a depth of 5–20 cm, indicating greated stabilization of labile organic compounds. Water-extractable organic carbon levels in the topsoil were comparable to those of productive agricultural soils, evidencing enrichment of the organic fraction through vegetation establishment and organic amendments.
From a physical perspective, micromorphological analysis revealed the development of a pedogenic crumb structure across all treatments, replacing the compact laminar structure characteristic of untreated fine-sized residual coal. The lower manure rate (25 mm) promoted a finer aggregate distribution and a 4–5-fold increase in specific pore perimeter, enhancing the reactive surface area, the potential for water–air exchange and organic matter decomposition. Also, it improved aggregate–organic matter mixing, supported structural stability and faster soil development. Although total porosity values (26–41%) did not differ significantly among treatments, pore geometry was more favorable under the 25 mm rate.
Overall, the abiotic indicators employed successfully identified the lower manure rate as optimal for promoting structural stabilization and organic matter transformation in anthropic soils under semi-arid Mediterranean conditions. The combined use of soil organic carbon fractionation and micromorphological analysis was effective in evaluating the sustainability of mine soil rehabilitation. These findings support the use of organic inputs as a cost-effective and environmentally sound strategy for mine restoration, while also cautioning against over-application. Future research should extend monitoring beyond the first decade, incorporate biological indicators, and evaluate the scalability of treatments across larger rehabilitated areas.

Supplementary Materials

The following supporting information can be downloaded at https://www.mdpi.com/article/10.3390/app151810111/s1, Table S1: General description of the natural soil profile (PE–01) close to the restored area; Table S2: General properties of the natural soil profile (PE–01) close to the restored area; Table S3: Chemical characteristics of the PE–01 profile; Table S4: General description of the PE–02 profile; Table S5: General properties of the PE–02 profile; Table S6: Chemical characteristics of the PE–02 profile; Table S7: General description, in thin sections, of the fine-sized residual coal (Figure 3). Table S8: Description of the thin section (0–5 cm) from the plot of the first strip (AI) where 60 mm of semi-liquid manure were applied without straw (Figure 4). Table S9: Description of the thin section (0–5 cm) from the plot of the first strip (AI) where 25 mm of semi-liquid manure were applied without straw (Figure 5). Table S10: Description of the thin section (0–5 cm) from the plot of the second strip (AII) where 25 mm of semi-liquid manure were applied with straw (Figure 6). Table S11: Description of the thin section (0–5 cm) from the plot of the first strip (AI) where 25 mm of semi-liquid manure were applied with straw (Figure 7). Table S12: Description of the thin section (0–5 cm) from the plot of the first strip (AI) where 60 mm of semi-liquid manure were applied with straw (Figure 8).

Author Contributions

Conceptualization and methodology, À.D.B.-S. and R.M.P.; samplings and formal analysis M.M. and N.L.; writing—review and editing, À.D.B.-S. and R.M.P. All authors have read and agreed to the published version of the manuscript.

Funding

This research was funded by the former Environmental Department from Generalitat de Catalunya (Spain).

Institutional Review Board Statement

Not applicable.

Informed Consent Statement

Not applicable.

Data Availability Statement

Data are available from R.M.P. (rosa.poch@udl.cat) upon request.

Acknowledgments

The authors thank Ramon Gassó and Montserrat Antúnez for field and laboratory support and to Montserrat M. Boixadera for edition support.

Conflicts of Interest

The authors declare no conflicts of interest.

Abbreviations

The following abbreviations are used in this manuscript:
FAFulvic acids
FRCFine-sized residual coal
HAHumic acids
OCtcTotal organic carbon by wet oxidation at 105 °C
OCtoTotal organic carbon by wet oxidation at room temperature
OCweWater-extractable organic carbon
ORMOverburden residual materials
SOCSoil organic carbon

Appendix A

Table A1. Test of fixed effects for the different analyzed organic carbon fractions (g kg−1): water-extractable organic carbon (OCwe), wet oxidizable organic carbon at 105 °C (OCtc) and at room temperature (Octo), humic acids (HA), and fulvic acids (FA), and according to semi-liquid manure and straw treatments, and for the depth of 0–5 cm. The MIXED procedure of SAS type III test 1 was used.
VariableOCweOCtcOCtoHAFA
Sourcedfdendfpdendfpdendfpdendfpdendfp
Manure120.5640.6940.8940.6120.16
Straw120.9540.2740.7740.7820.24
Manure × Straw120.8940.6240.8340.2920.72
1 df, degrees of freedom for the factor; Dendf, the denominator degrees of freedom.
Table A2. Test of fixed effects for the different analyzed organic carbon fractions (g kg−1): water-extractable organic carbon (OCwe), wet oxidizable organic carbon at 105 °C (OCtc) and at room temperature (Octo), humic acids (HA) and fulvic acids (FA), and according to semi-liquid manure and straw treatments and for the depth of 5–20 cm. The MIXED procedure of SAS type III test 1 was used.
VariableOCweOCtcOCtoHAFA
SourcedfDendfpDendfpDendfpDendfpDendfp
Manure140.4730.3940.2240.6430.0019
Straw140.4630.7440.4040.4230.15
Manure × Straw140.9530.8240.2840.2230.05
1 df, degrees of freedom for the factor; Dendf, the denominator degrees of freedom.
Table A3. Test of fixed effects for specific pore perimeter (mm−1) and porosity (%). The MIXED procedure of SAS type III test 1 was used.
VariablePerimeterPorosity
SourcedfDendfpDendfp
Manure130.000320.40
Straw130.0698100.14
Manure × Straw130.0810100.77
1 df, degrees of freedom for the factor; Dendf, the denominator degrees of freedom.

References

  1. Measham, T.; Walker, J.; McKenzie, F.H.; Kirby, J.; Williams, C.; D’Urso, J.; Littleboy, A.; Samper, A.; Rey, R.; Maybee, B.; et al. Beyond closure: A literature review and research agenda for post-mining transitions. Resour. Policy 2024, 90, 104859. [Google Scholar] [CrossRef]
  2. Davies, S.; den Hoed, W.; Michie, R. Energy Transition in Europe’s Coal Regions: Issues for Regional Policy; European Policies Research Centre: Glasgow, UK, 2020. [Google Scholar]
  3. Van de Loo, K.; Haske, J. Territorial impact assessment for coal sites in transition. Mining 2024, 4, 248–259. [Google Scholar] [CrossRef]
  4. Pao-Yu, O.; Brauers, H.; Herpich, P. Lessons from Germany’s hard coal mining phase-out: Policies and transition from 1950 to 2018. Clim. Policy 2020, 20, 963–979. [Google Scholar] [CrossRef]
  5. Wijesekara, H.; Bolan, N.S.; Vithanage, M.; Xu, Y.; Mandal, S.L.; Brown, S.L.; Hettiarachchi, G.M.; Pierzynski, G.M.; Huang, L.; Ok, Y.S.; et al. Utilization of biowaste for mine spoil rehabilitation. In Advances in Agronomy; Sparks, D.L., Ed.; Academic Press: Oxford, UK, 2016; Volume 138, pp. 97–173. [Google Scholar]
  6. Jambhulkar, H.P.; Kumar, M.S. Eco-restoration approach for mine spoil overburden dump through biotechnological route. Environ. Monit. Assess. 2019, 191, 772. [Google Scholar] [CrossRef]
  7. Bosch-Serra, A.D.; Cruz, J.; Poch, R.M. Soil quality in rehabilitated coal mining areas. Appl. Sci. 2023, 13, 9592. [Google Scholar] [CrossRef]
  8. Royal Decree 975/2009, of June 12, on the Management of Waste from Extractive Industries and the Protection and RehaBilitation of Areas Affected by Mining Activities. Available online: https://www.boe.es/eli/es/rd/2009/06/12/975/con (accessed on 29 July 2025).
  9. European Comission. Minlex—Spain Country Report; Publications Office of the European Union: Luxembourg, 2019; p. 98. [Google Scholar]
  10. IUSS Working Group WRB. World Reference Base for Soil Resources. In International Soil Classification System for Naming Soils and Creating Legends for Soil Maps, 4th ed.; International Union of Soil Sciences (IUSS): Vienna, Austria, 2022. [Google Scholar]
  11. Jorba, M.; Vallejo-Calzada, V.R. Manual para la Restauración de Canteras de Roca Caliza en Clima Mediterráneo; Departament de Medi Ambient i Habitatge, Generalitat de Catalunya: Barcelona, Spain, 2010; Available online: https://www.gencat.cat/mediamb/publicacions/monografies/manual_restauracion_canteras_(cast).pdf (accessed on 25 August 2025).
  12. Australian Government. Mine Rehabilitation. In Leading Practice Sustainable Development Program for the Mining Industry; Commonwealth of Australia: Canberra, Australia, 2016. Available online: https://www.industry.gov.au/sites/default/files/2019-04/lpsdp-mine-rehabilitation-handbook-english.pdf (accessed on 25 August 2025).
  13. Gobin, A.; Campling, P.; Janssen, L.; Desmet, N.; van Delden, H.; Hurkens, J.; Lavelle, P.; Berman, S. Soil Organic Matter Management Across the EU—Best Practices, Constraints and Trade-Offs; Publications Office of the European Union: Luxembourg, 2011. [Google Scholar]
  14. Liu, S.; Zheng, Y.; Lv, X.; An, B.; Huo, Z.; Guo, F.; Chao, C.; Mao, D. Evaluation of reclamation soil quality in coal mining subsidence area based on CA-CDA-PCA-MF. Sustainability 2025, 17, 2561. [Google Scholar] [CrossRef]
  15. Wang, R.; Han, Y.; Meng, Z.; Gao, Y.; Wu, Z. Soil physicochemical properties and carbon storage reserve distribution characteristics of plantation restoration in a coal mining area. Forests 2024, 15, 1876. [Google Scholar] [CrossRef]
  16. Ussiri, D.A.N.; Jacinthe, P.A.; Lal, R. Methods for determination of coal carbon in reclaimed minesoils: A review. Geoderma 2014, 214–215, 155–167. [Google Scholar] [CrossRef]
  17. Alef, K.; Nannipieri, P. Methods in Applied Soil Microbiology and Biochemistry; Academic Press: San Diego, CA, USA, 1995. [Google Scholar]
  18. Carter, M.R.; Gregorich, E.G.; Anderson, D.W.; Doran, J.W.; Janzen, H.H.; Pierce, F.J. Concepts of soil quality and their significance. In Soil Quality for Crop Production and Ecosystem Health; Gregorich, E.G., Carter, M.R., Eds.; Elsevier: Amsterdam, The Netherlands, 1997. [Google Scholar]
  19. Miralles, I.; Ortega, R.; Almendros, G.; Sánchez-Marañón, M.; Soriano, M. Soil quality and organic carbon ratios in mountain agroecosystems of South-east Spain. Geoderma 2009, 150, 120–128. [Google Scholar] [CrossRef]
  20. Stoops, G. Micromorphology as a tool in soil and regolith studies. In Interpretation of Micromorphological Features of Soil and Regoliths, 2nd ed.; Stoops, G., Marcelino, V., Mees, F., Eds.; Elsevier: Amsterdam, The Netherlands, 2018; pp. 521–541. [Google Scholar]
  21. Soil Survey Staff. Keys to Soil Taxonomy, 14th ed.; USDA-Natural Resources Conservation Service: Washington, WA, USA, 2014. [Google Scholar]
  22. Elías Castillo, F.; Castellví Sentís, F.; Bosch, A.D. Clasificaciones climáticas. In Agromoteorología; Castellví Sentís, F., Elías Castillo, F., Eds.; Ministerio de Agricultura Pesca y Alimentación: Madrid, Spain, 1996; pp. 279–315. [Google Scholar]
  23. Fernández García, F. Clasificaciones climáticas según criterios agroclimáticos y fitoclimáticos. In Manual de Climatología Aplicada; Editorial Síntesis: Madrid, Spain, 1999; pp. 185–194. [Google Scholar]
  24. Escuer Ibarz, J.L. L’aiguabarreig dels Rius Cinca i Segre; Institut d’Estudis del Baix Cinca-IEA: Huesca, Spain, 1998; pp. 25–47. Available online: https://jolube.wordpress.com/wp-content/uploads/2008/05/escuer_1998-1_texto.pdf (accessed on 13 September 2025).
  25. Harfst, J.; Wirth, P. Structural change in former mining regions: Problems, potentials and capacities in multi-level-governance systems. Procedia Soc. Behav. Sci. 2011, 14, 167–176. [Google Scholar] [CrossRef]
  26. Soil Survey Division Staff. Soil Survey Manual; USDA-Natural Resources Conservation Service: Washington, DC, USA, 1993. [Google Scholar]
  27. Hsu, J.H.; Lo, S.L. Chemical and spectroscopic analysis of organic matter transformations during composting of pig manure. Environ. Pollut. 1999, 104, 189–196. [Google Scholar] [CrossRef]
  28. Porta, J.; López-Acevedo, M.; Rodríguez, R. Técnicas y Experimentos en Edafología; Col·legi Oficial d’Enginyers Agrònoms de Catalunya: Barcelona, Spain, 1986. [Google Scholar]
  29. Walkley, A.; Black, I.A. An examination of the Degtjareff method for determining soil organic matter and a proposed modification of the chromic acid titration method. Soil Sci. 1934, 37, 29–38. [Google Scholar] [CrossRef]
  30. Yeomans, J.C.; Bremner, J.M. A rapid and precise method for routine determination of organic carbon in soil. Commun. Soil Sci. Plant Anal. 1988, 19, 1467–1476. [Google Scholar] [CrossRef]
  31. Dabin, B. Étude d’une méthode de fractionnement des matières humiques du sol. Sci. Sol 1971, 18, 47–63. [Google Scholar]
  32. Dean, J.R. Extraction Methods for Environmental Analysis; Wiley: Chichester, UK, 1998. [Google Scholar]
  33. Benyarku, C.A.; Stoops, G. Guidelines for preparation of rock and soil thin sections and polished sections. In Quaderns DMACS Núm. 33; Departament de Medi Ambient i Ciències del Sòl, Universitat de Lleida: Lleida, Spain, 2005. [Google Scholar]
  34. Stoops, G. Guidelines for Analysis and Description of Soil and Regolith Thin Sections; Soil Science Society of America: Madison, WI, USA, 2020. [Google Scholar]
  35. SAS Institute. Statistical Analysis System, SAS/TAT, version 9.4; SAS Institute: Cary, NC, USA, 2014. [Google Scholar]
  36. Jeong, H.J.; Cha, J.Y.; Choi, J.H.; Jang, K.S.; Lim, J.; Kim, W.Y.; Seo, D.C.; Jeon, J.R. One-pot transformation of technical lignins into humic-like plant stimulants through Fenton-based advanced oxidation: Accelerating natural fungus-driven humification. ACS Omega 2018, 3, 7441–7453. [Google Scholar] [CrossRef]
  37. Al-Akbari, R.; Manasrah, A.D.; Nassar, N.N. Production of humic and fulvic acid analogs through the ultrasonication of low-rank lignite coals. React. Chem. Eng. 2024, 9, 566. [Google Scholar] [CrossRef]
  38. Bosch-Serra, À.D.; Sorribas, M.; Gómez-Reig, P.; Poch, R.M. Revegetation and quality indicators of Technosols in restored mine fields with saline mine spoils. Soil Syst. 2025, 9, 7. [Google Scholar] [CrossRef]
  39. Lützow, M.V.; Kögel-Knabner, I.; Ekschmitt, K.; Matzner, E.; Guggenberger, G.; Marschner, B.; Flessa, H. Stabilization of organic matter in temperate soils: Mechanisms and their relevance under different soil conditions—A review. Eur. J. Soil Sci. 2006, 57, 426–445. [Google Scholar] [CrossRef]
  40. Marraccini, E.; Debolini, M.; Di Bene, C.; Rapey, H.; Bonari, E. Factors affecting soil organic matter conservation in Mediterranean hillside winter cereals-legumes cropping systems. Ital. J. Agron. 2012, 7, e38. [Google Scholar] [CrossRef]
  41. Mu, D.; Mu, L.; Geng, X.; Mohamed, T.A.; Wei, Z. Evolution from basic to advanced structure of fulvic acid and humic acid prepared by food waste. Int. J. Biol. Macromol. 2024, 256, 128413. [Google Scholar] [CrossRef]
  42. Kögel-Knabner, I.; Rumpel, C. Advances in molecular approaches for understanding soil organic matter composition, origin, and turnover: A historical overview. Adv. Agron. 2018, 149, 1–48. [Google Scholar] [CrossRef]
  43. Almendros, G.; González-Pérez, J.A. Soil organic carbon sequestration mechanisms and the chemical nature of soil organic matter—A review. Sustainability 2025, 17, 6689. [Google Scholar] [CrossRef]
  44. Rumpel, C.; Skjemstad, J.O.; Knicker, H.; Kögel-Knabner, I.; Hüttl, R.F. Techniques for the differentiation of carbon types present in lignite-rich mine soils. Org. Geochem. 2000, 31, 543–551. [Google Scholar] [CrossRef]
  45. Haney, R.L.; Franzluebbers, A.J.; Hons, F.M.; Zuberer, D.A. Soil C extracted with water or K2SO4: pH effect on deter-mination of microbial biomass. Can. J. Soil Sci. 1999, 79, 529–533. [Google Scholar] [CrossRef]
  46. Shi, X.S.; Herle, I. A model for natural lumpy composite soils and its verification. Int. J. Solids Struct. 2017, 121, 240–256. [Google Scholar] [CrossRef]
  47. Chi, J.; Fan, Y.; Wang, L.; Putnis, C.V.; Zhang, W. Retention of soil organic matter by occlusion within soil minerals. Rev. Environ. Sci. Biotechnol. 2022, 21, 727–746. [Google Scholar] [CrossRef]
  48. Bosch-Serra, A.D.; Padró, R.; Boixadera-Bosch, R.R.; Orobitg, J.; Yagüe, M.R. Tillage and slurry over-fertilization affect oribatid mite communities in a semiarid Mediterranean environment. Appl. Soil Ecol. 2014, 84, 124–139. [Google Scholar] [CrossRef]
  49. Simões-Mota, A.; Virto, I.; Poch, R.M. Effects of long-term sewage sludge application to a calcareous soil structure. Soil Use Manag. 2022, 38, 1693–1704. [Google Scholar] [CrossRef]
Figure 1. Valley filling using overburden materials generated from mining activities.
Applsci 15 10111 g001
Figure 2. Vegetation colonization in the rehabilitated area.
Applsci 15 10111 g002
Figure 3. Porosity image from a thin section of the fine-sized residual coal material used for rehabilitation.
Applsci 15 10111 g003
Figure 4. Observation of the composition of a layer (0–5 cm) where semi-liquid manure at a rate of 60 mm was applied (without straw) nine years ago. The image on the left corresponds to the observation under PP light, whereas the image on the right corresponds to the observation under XP light. Manure aggregates (P) and calcite aggregates (C) were observed. The great part of pores were compound packing voids although vesicles and channels were also observed. It was possible to identify highly decomposed organic elements.
Applsci 15 10111 g004
Figure 5. Observation of the composition of a layer (0–5 cm) where manure at a rate of 25 mm was applied (without straw) nine years ago. The image on the left corresponds to the observation under PP light, whereas the right image corresponds to the observation under XP light. The great part of pores were compound packing voids. Through the section, remaining organic tissues in a highly decomposed phase were observed as well as some organic non-degraded materials from slurries. Coarse elements included calcilutites, black coal, quartz and mica.
Applsci 15 10111 g005
Figure 6. Observation of the composition of a layer (0–5 cm) where 25 mm of semi-liquid manure was applied (with straw) nine years ago. The image on the left corresponds to the observation under PP light, whereas the right image corresponds to the observation under XP light. Quartz aggregates (Q) and coal aggregates (CB) were observed.
Applsci 15 10111 g006
Figure 7. Observation of lignified root section (O) and other organic elements present at the upper layer (0–5 cm) where 25 mm of manure with straw were applied. The image was under PP light.
Applsci 15 10111 g007
Figure 8. Observation of the composition of a layer (0–5 cm) where semi-liquid manure at a rate of 60 mm was applied (with straw) nine years ago, with abundant organic tissue remains. The images are in PP light.
Applsci 15 10111 g008
Table 1. Samples for chemical analysis from the four plots of both strips.
Samples (Strip–Plot Number)Treatment 1Sampling Depth Thickness (cm)
AI–2, AII–2S0–250–5 and 5–20
AI–3, AII–1SI–250–5 and 5–20
AI–1, AII–4S0–600–5 and 5–20
AI–4, AII–3SI–600–5 and 5–20
-Overburden residual material0–5
-Fine-sized residual coal0–5
1 SI: straw applied at 15 Mg ha−1; S0: no straw applied; 25: semi-liquid manure rate of 25 mm; 60: semi-liquid manure rate of 60 mm.
Table 2. Average values of organic carbon fractions at the 0–5 cm soil depth: water-extractable organic carbon (OCwe), wet oxidizable organic carbon at 105 °C (OCtc) and at room temperature (Octo), humic acids (HA) and fulvic acids (FA), and according to semi-liquid manure rates (25 or 60 mm) and straw treatments (with straw: SI; without straw: S0). Marginal means (M. Mean) and the standard errors of the mean (±) are provided.
VariableTreatmentSOSIM. Mean
OCwe250.220.230.23 ± 0.06
(g kg−1)600.300.280.29 ± 0.06
M. Mean0.26 ± 0.050.26 ± 0.05
OCtcTreatmentSOSIM. Mean
(g kg−1)2599.66105.73102.70 ± 5.79
6098.77113.60106.18 ± 5.79
M. Mean99.21 ± 5.79109.67 ± 5.79
OCtoTreatmentSOSIM. Mean
(g kg−1)2575.8575.0075.43 ± 6.47
6076.6171.6574.13 ± 6.47
M. Mean76.23 ± 6.4773.33 ± 6.47
HATreatmentSOSIM. Mean
(g kg−1)2515.4110.7513.08 ± 2.16
6013.3416.1514.75 ± 2.16
M. Mean14.38 ± 2.1613.45 ± 2.16
FATreatmentSOSIM. Mean
(g kg−1)2556.6474.2365.44 ± 6.20
6079.6190.2284.92 ± 6.20
M. Mean68.13 ± 6.0882.23 ± 6.08
Table 3. Average values of organic carbon fractions at the 5–20 cm soil depth: water-extractable organic carbon (OCwe), wet oxidizable organic carbon at 105 °C (OCtc) and at room temperature (Octo), humic acids (HA) and fulvic acids (FA), and according to semi-liquid manure application rates (25 or 60 mm) and straw treatments (with straw: SI; without straw: S0). Marginal means (M. Mean) 1 and standard errors of the mean (±) are provided.
VariableTreatmentS0SIM. Mean
OCwe250.0940.0730.084 ± 0.020
(g kg−1)600.1180.0940.109 ± 0.020
M. Mean0.106 ± 0.0200.083 ± 0.020
OCtcTreatmentS0SIM. Mean
(g kg−1)2561.2958.2559.77 ± 4.91
6064.9264.3764.64 ± 4.91
M. Mean63.10 ± 4.9161.31 ± 4.91
OCtoTreatmentS0SIM. Mean
(g kg−1)2575.8575.0059.77 ± 4.91
6076.6171.6564.64 ± 4.91
M. Mean76.23 ± 6.4773.33 ± 6.47
HATreatmentS0SIM. Mean
(g kg−1)2510.755.908.33 ± 1.47
606.717.857.28 ± 1.47
M. Mean8.73 ± 1.476.88 ± 1.47
FATreatmentS0SIM. Mean
(g kg−1)2537.2544.0340.6 ± 7.7B
6055.3853.8354.6 ± 7.7A
M. Mean46.31 ± 7.6648.93 ± 7.66
1 Marginal means with different letters are significantly different (p < 0.05).
Table 4. Average values of specific pore perimeter (mm−1) and porosity (%) according to semi-liquid manure application rates (25 or 60 mm) and straw treatments (without straw: S0; with straw: SI). Marginal means (M. Mean) and standard errors of the mean (±) are provided 1.
VariableTreatmentS0SIM. Mean
Perimeter 2520.4625.3222.89A ± 0.93
(mm−1)605.225.385.30B ± 0.93
M. Mean12.84 ± 0.9315.35 ± 0.93
Porosity TreatmentS0SIM. Mean
(%)2531.3641.3636.36 ± 4.50
6026.1333.0429.59 ± 4.50
M. Mean28.75 ± 4.1337.20 ± 4.13
1 Marginal means with different letters are significantly different (p < 0.05).
Disclaimer/Publisher’s Note: The statements, opinions and data contained in all publications are solely those of the individual author(s) and contributor(s) and not of MDPI and/or the editor(s). MDPI and/or the editor(s) disclaim responsibility for any injury to people or property resulting from any ideas, methods, instructions or products referred to in the content.